
Seasonal Scale Climatic Factors on Grassland Phenology in Arid and Semi-Arid Zones

1
Key Laboratory of Coastal Science and Integrated Management, First Institute of Oceanography, Ministry of Natural Resources, Qingdao 266061, China
2
CAS Key Laboratory of Ocean Circulation and Waves, Institute of Oceanology, Chinese Academy of Sciences and Center for Ocean Mega-Science, Chinese Academy of Sciences, Qingdao 266071, China
3
Xinjiang Key Laboratory of Soil and Plant Ecological Processes, College of Resources and Environment, Xinjiang Agricultural University, Urumqi 830052, China
4
Institute of Marine Development, Ocean University of China, Qingdao 266061, China
*
Author to whom correspondence should be addressed.
Land 2024, 13(5), 653; https://doi.org/10.3390/land13050653
Submission received: 2 April 2024
/
Revised: 29 April 2024
/
Accepted: 1 May 2024
/
Published: 10 May 2024
(This article belongs to the Special Issue Terrestrial Vegetation Dynamics and Its Response to Environmental Change)
Abstract
:Influenced by climate change, significant alterations in vegetation phenology have been observed globally. Grassland phenology is highly sensitive to climate change. However, research on the variations in grassland phenology and its responses to seasonal climatic changes in arid and semi-arid regions remains scarce. This study, utilizing Solar-Induced Chlorophyll Fluorescence (SIF) data, meteorological station data, and grassland type data, employs trend analysis and time series analysis to explore the trends of seasonal climatic variability and the sensitivity response of grassland phenology in Xinjiang to seasonal climates. The findings reveal the following: (1) The region experiences more pronounced warming in winter and spring than in summer and autumn, with ground temperature increments outpacing those of air temperatures. The summer season registers the peak in precipitation volume and rate of increase, where mountainous zones accrue more rainfall compared to basins and plains. The distribution of sunshine duration is characterized by higher values in eastern areas than in the west and more in the plains than in mountainous regions, potentially due to escalating cloudiness, which has contributed to a diminishing trend in sunshine hours across Xinjiang over the past 20 years. (2) Over the past two decades, the perennial greening phase of Xinjiang grasslands has predominantly occurred in early May, showing an overall trend of occurring earlier by approximately 5.47 days per decade, while the yellowing phase mainly occurs at the end of September and the beginning of October, demonstrating a delaying trend (6.61 days/decade). The average length of the growing season is 145 days, generally showing a slightly increasing trend (11.97 days/decade). (3) In spring, the rise in air and ground temperatures, along with increased sunshine duration, all promote grassland growth, leading to an earlier greening phase. Conversely, in autumn, increases in air temperature, ground temperature, and sunshine duration can inhibit grassland growth, resulting in an earlier yellowing phase. Increased precipitation in summer and autumn can delay the yellowing phase and extend the length of the grassland growing season. This research provides new insights into the factors influencing large-scale grassland phenology and offers references for grassland adaptation to future climate changes.
1. Introductory
Scientifically assessing the various impacts of global warming on terrestrial ecosystems is of significant importance for the formulation of national and regional development strategies and for global change governance participation [1]. Semi-arid regions, characterized by low soil nutrient content, sparse vegetation cover, and water conservation capabilities, are highly sensitive to global changes and human activities [2]. These ecosystems are fragile and extremely susceptible to climate change and land degradation [3]. Global warming exhibits uneven spatial distribution, with semi-arid areas showing a particularly pronounced warming trend over the last century, especially during the cold season [4,5]. Semi-arid areas in the mid-latitudes of the Northern Hemisphere contribute about 50% to continental warming, with the warming in Asian semi-arid regions being the most significant [6,7]. Scientific evidence indicates that changes in water vapor are a primary driver of desert expansion, and the water vapor in semi-arid regions may be influenced by marine or sea surface temperatures; hence, the intensification of aridity in China’s semi-arid areas is closely associated with the weakening of the East Asian summer monsoon [8,9]. Furthermore, scholars have studied climate change in China’s semi-arid regions [10,11,12,13], observing that the past nearly 100 years have seen a general upward trend in both temperature and precipitation in western China [13,14]. Against the backdrop of climate warming, semi-arid areas may experience accelerated warming, thereby significantly impacting society and the economy [15].
Phenology, the science of studying the cyclical occurrence of biological events in vegetation stages prompted by biotic and abiotic factors and their interactions with environmental conditions, is a crucial area of investigation [16,17,18]. Traditional phenological observations have relied on visual inspections and ground-based observations of individual plant growth rhythms. While offering detailed insights into vegetation phenology, these methods are limited to representing small, localized areas [19]. The rapid advancement of remote sensing technology has significantly broadened the scope of phenological studies, extending from local to global scales [20,21], and has enhanced our understanding of vegetation phenology. As many specific phenological events cannot be directly detected through the existing spatial resolution of remote sensing imagery, De Beurs and Henebry proposed the concept of Land Surface Phenology (LSP), which involves extracting vegetation dynamics through remote sensing images [22]. LSP is defined as the spatiotemporal evolution of vegetation at the land surface, as revealed by spectral observations from satellite sensors. LSP indicators are usually related to the interannual variability of vegetation growth that can be interpreted from remote sensing images, including the Start of Season (SOS), Peak of Growing Season (POS), End of the Season (EOS), Length of Season (LOS), and various transitional stages towards maturity [23,24,25]. Changes in vegetation phenology play a critical role in regulating the water, carbon, and energy flux cycles between the biosphere and the atmosphere [26,27]. During the phenological phases, the start and end of the growing season are pivotal turning points controlling the length of plant growth, whereas the length of the growing season reflects the duration of carbon sequestration [28,29]. Studies indicate that in most terrestrial ecosystems at mid-to-high latitudes in the Northern Hemisphere, an earlier onset of the spring growing season or a delayed end to the autumn season can increase the total primary productivity of ecosystems, thereby enhancing the ecosystems’ net carbon uptake [30,31].
Grasslands are among the most extensively distributed terrestrial biomes globally, storing one-third of the Earth’s terrestrial carbon and playing a pivotal role in ecosystem carbon cycle processes [32,33,34]. The structure and function of grassland vegetation are jointly influenced by climate change, environmental alterations, and human activities, such as land use [35]. Climate change significantly impacts terrestrial ecosystems by altering plant respiration, photosynthesis, growth cycles, and soil formation processes, which, in turn, have long-term effects on the spatial distribution patterns of vegetation [36]. For instance, changes in precipitation modify the soil environment and increase soil moisture, directly enhancing the uptake and utilization of soil nutrients by plants, boosting microbial and enzyme activity, and ultimately promoting the carbon cycle within grassland ecosystems [37]. Grassland phenology is highly sensitive to climate change and is considered an indicator for assessing terrestrial ecosystem responses to global and regional climatic shifts [38,39,40,41]. Grasslands in Xinjiang account for approximately 31.23% of its total area [37]. Located in arid and semi-arid zones, grassland ecosystems in Xinjiang are exceptionally vulnerable. Under the combined impacts of climate warming and human activities, the degradation trend of Xinjiang’s grassland growth status is expanding [42]. Hygrothermal conditions are the primary factors limiting vegetation growth, and grassland phenology may be more sensitive to climatic factors on a seasonal scale than interannual climate variations [43]. However, most previous studies on the impact of climate change on grassland phenology have analyzed annual climate scales, leaving the response mechanisms of grassland phenology to seasonal climatic factors largely unclear [44]. For Xinjiang, which possesses abundant grassland resources, the impacts of seasonal climatic factors on grassland phenology might exhibit significant variations. Therefore, a profound understanding of the influence of seasonal-scale climate change on the phenology of Xinjiang’s grasslands is crucial for constraining future terrestrial carbon uptake, formulating scientific climate policies, and monitoring the carbon balance of grassland ecosystems.
This study aims to explore the impacts of seasonal-scale climate factors on grassland phenology in arid and semi-arid zones by combining remotely sensed data and meteorological station data with the grassland in Xinjiang as the research object. Specifically, this study intends to address the following questions: (1) In the context of global climate change, how does the climate in the typical semi-arid region of Xinjiang respond to global climatic variations? (2) What were the spatiotemporal characteristics of grassland phenology in Xinjiang over the past 20 years? (3) In the context of increasing uncertainty in climate change, what kind of feedback does grassland phenology provide in response to different seasonal climatic factors? The outcomes of this research aim to fill the knowledge gap regarding the influence of different seasonal climatic factors on the phenology of grasslands in semi-arid areas. And they provide a fundamental basis for predicting the growth trends of grasslands, environmental changes, and ecosystem evolution in this region, offering essential insights for a comprehensive evaluation of Xinjiang’s ecological security.
2. Materials and Methods
2.1. Study Area
The complexity of Xinjiang’s topography results in significant variations in elevation, generally characterized as “three mountains flanking two basins”. Climatically, Xinjiang exhibits a typical temperate continental arid climate, marked by scant precipitation and high evaporation, with an annual average precipitation of only 170.6 mm. The region boasts vast natural grasslands, covering an approximate area of 519,900 km², with 480,000 km² of usable grassland, which is about ten times the size of its arable land and eighteen times that of its forested area, ranking third in China [37]. The grasslands are primarily distributed from basins to the alpine snow line, featuring diverse types and rich plant resources. Based on vegetation types, Xinjiang’s grasslands can be categorized into three groups: steppe, desert, and meadow. The steppe group includes alpine steppe, temperate meadow steppe, temperate steppe, and temperate desert steppe; the desert group encompasses alpine desert, temperate steppe desert, and temperate desert; and the meadow group consists of alpine meadow, mountain meadow, and lowland meadow [37]. Considering the richness of grassland types, their vertical and horizontal spatial distribution, the conditions and rates of grassland utilization, as well as productivity, the grassland resources of Xinjiang play a pivotal role in the context of China’s grassland resources.
2.2. Data Acquisition and Processing
2.2.1. Meteorological Data
To capture the basic climatic characteristics of Xinjiang, this study obtained meteorological station data for Xinjiang from the China Meteorological Administration Meteorological Data Center (http://data.cma.cn/site/index.html) (accessed on 1 February 2024) (Figure 1a). To ensure data validity, stations with a significant amount of missing data were excluded, and this study focused on the period from January 2000 to December 2019. Ultimately, observational data from 66 meteorological stations with complete records were selected and subjected to data cleaning, including the correction of anomalies and the imputation of missing values. Missing sequence data of five days or fewer were filled using linear interpolation, while gaps exceeding five days were completed using the long-term average values for the same date. This research categorized seasonal climate analyses according to the meteorological division method as follows: spring (March, April, May), summer (June, July, August), autumn (September, October, November), and winter (December, January, February).
2.2.2. Solar-Induced Chlorophyll Fluorescence Data
Compared to traditional vegetation indices based on “greenness”, such as NDVI and EVI, Solar-Induced Chlorophyll Fluorescence (SIF) is more sensitive to the physiological processes of plants and can reveal the actual status of plant photosynthesis [45]. It holds unique technical advantages in detecting vegetation photosynthetic physiology, especially in the early stages of vegetation stress [46,47,48,49]. Meanwhile, SIF, as a faint spontaneous emission spectrum, comprises a small fraction of the spectral signal reflected from the Earth’s surface. Consequently, it is susceptible to atmospheric conditions, sensor characteristics, and retrieval algorithms, leading to potential biases and limitations. Wen et al. provided a monthly scaled 0.05° spatial resolution SIF dataset [50] (https://daac.ornl.gov/) (accessed on 1 February 2024). This SIF dataset was derived from the SCanning Imaging Absorption spectroMeter for Atmospheric CHartographY (SCIAMACHY) and Global Ozone Monitoring Experiment 2 (GOME-2) instruments aboard the MetOp-A satellite, which was downscaled to 0.05° using a random forest algorithm and harmonized using the Cumulative Distribution Function (CDF) matching technique. The dataset maintains high spatial and temporal consistency with the original SCIAMACHY and GOME-2 SIF retrievals and correlates well with independent airborne and ground-based SIF measurements. Therefore, this study opts for the GOME-2-derived SIF dataset (hereafter referred to as GOME-2) to extract the phenological information of grasslands in Xinjiang.
2.2.3. Grassland Resource Data
Different grassland types exhibit distinct phenological characteristics due to variations in their genetic traits and growth environments. To explore the phenological traits of various grassland types in Xinjiang in-depth, we acquired Xinjiang’s 1:1 million grassland resource data (http://www.ncdc.ac.cn/)(accessed on 1 February 2024). At the end of the 20th century, Xinjiang undertook a comprehensive survey of grassland resources across the region, resulting in the creation of a grassland resource type map for Xinjiang. Although the current distribution of grassland vegetation might have undergone some changes, this dataset remains the most authoritative source for applications related to the distribution of Xinjiang’s grasslands. The grassland survey adopted a classification system and method entirely based on the “Standards for Classification and Division of Chinese Grassland Types and the Chinese Grassland Type Classification System” issued by the Ministry of Agriculture, utilizing a three-tier classification hierarchy of category, group, and type [37].
2.3. Methods
2.3.1. ANUSPLIN Spatial Interpolation
To analyze the spatiotemporal variations in climatic elements at the pixel scale in Xinjiang, this study employed ANUSPLIN software, a meteorological interpolation tool developed in Fortran by researchers at the Australian National University (Australian National University Spline, ANUSPLIN), for the spatial interpolation of climatic elements [51]. ANUSPLIN utilizes a local thin plate smoothing spline statistical model, which can incorporate linear covariates, such as elevation, thereby mitigating the influence of factors like elevation on the interpolation of climate data to a certain extent. Moreover, the ANUSPLIN method can process multiple spatial interpolations simultaneously, offering significant advantages for interpolating a long-time series of meteorological factors. In this study, a Digital Elevation Model (DEM) was selected as a covariate for interpolating Xinjiang’s climate indicators. Using ANUSPLIN 4.4, spatial interpolation was performed on monthly meteorological element data from 66 meteorological stations in Xinjiang from 2000 to 2019, creating a 1 km spatial resolution time series of Xinjiang climate element raster datasets.
2.3.2. Sen’s Trend Analysis and Mann–Kendall Test
Sen’s slope estimator was calculated as the median of all slopes between paired values, effectively reducing the impact of noise; however, it did not provide significance testing of the trend itself [52]. The Mann–Kendall non-parametric test does not require data to follow a normal distribution, making it advantageous as it does not assume any specific probability distribution for the sample and is less influenced by outliers, suitable for testing the significance of trends in a non-normally distributed data series [53,54]. This method effectively reveals the trend characteristics of time series. Therefore, this study employs the Mann–Kendall test and Sen’s trend method to analyze the trend of the climatic time series in the study area.
2.3.3. Time Series Reconstruction
Although remote sensing standard data products undergo certain types of preprocessing, the time series vegetation index is still susceptible to disturbances from various factors, such as the solar zenith angle, satellite observation angle, clouds, water vapor, aerosols, and ice/snow, retaining considerable noise and presenting jagged, irregular fluctuations. This results in the vegetation index time series exhibiting indistinct periodic trend changes, making it unsuitable for direct trend analysis and information extraction. Therefore, it is necessary to preprocess the time series vegetation index for noise reduction and smoothing to reconstruct the remote sensing data time series curve, thereby better reflecting the spatial characteristics and change trends of vegetation phenology. The Savitzky–Golay filter is a moving window weighted averaging algorithm that achieves smoothing by fitting a given high-order polynomial using the least squares method within a sliding window [55]. Compared to other methods for fitting and reconstructing time series vegetation indices, the Savitzky–Golay filtered time series vegetation index effectively removes outliers and local abrupt changes, and it is not constrained by the temporal–spatial scale of the data or the sensor. The smoothed, reconstructed curve accurately reflects the “peaks” and “valleys” characteristics of the time series vegetation index. Therefore, this study employed the Savitzky–Golay filtering transformation method for reconstructing the time series vegetation index. The computational principle of the Savitzky–Golay filter is as follows:
In the formula, Yj* represents the reconstructed data, Ci denotes the filtering coefficients obtained from the least squares fitting, j is the original coordinate in the moving window, Yi+1 is the j original value within the moving window, and 2m + 1 represents the size of the moving window.
2.3.4. Phenology Information Extraction
The dynamic threshold method, known for its small errors, flexibility, and adaptability, is widely used in extracting vegetation phenology [56]. Moreover, considering the regional limitations of hydrothermal conditions at the scale of the Northern Hemisphere, the dynamic threshold detection method is particularly suitable for areas with significant internal differences [57] and is an appropriate approach for determining vegetation phenology at large scales [58]. Therefore, this study utilizes the dynamic threshold method proposed by Jonsson and others on the TIMESAT platform to extract the start of the growing season (SOS), the end of the growing season (EOS), and the length of the growing season (LOS) of grassland phenology in Xinjiang from the time series vegetation index dataset [59]. The choice of threshold can significantly impact the extraction results of remote sensing phenology. Based on previous research and extensive experimentation [44,60,61], this study ultimately sets the threshold at 50% to obtain phenological parameters for vegetation green-up and senescence periods, and from this, the length of the vegetation growing season is determined. Specifically, the SOS for vegetation is defined as the time point on the rising phase of the SIF curve, which is 50% of the distance between the minimum and maximum values from the minimum value. Conversely, the EOS is defined as the time point on the declining phase of the SIF curve, which is 50% of the distance from the maximum value to the minimum value. The difference between EOS and SOS is defined as LOS.
2.3.5. Correlation Analysis
To investigate whether the phenological events of grasslands in Xinjiang are influenced by the region’s climatic variability, the Pearson correlation coefficient was employed to quantify the relationship between grassland phenology and climatic variability. The formula is expressed as follows:
In this formula, Rxy represents the correlation coefficient between x and y; xi is the phenology at the i-th time point; yi is the climate condition at the i-th time point; is the mean value of phenology over multiple periods; and is the mean value of the climate over the same period. The greater the absolute value of Rxy, the stronger the correlation; conversely, a smaller absolute value indicates a weaker correlation.
3. Results
3.1. Characteristics of Seasonal Climate Variation
Throughout the different seasons from 2000 to 2019, the spatial characteristics of seasonal temperature and ground temperature in Xinjiang displayed similar trends (Figure 2). The mountainous regions (northern Altai Mountains, central Tianshan Mountains, and southeastern Kunlun Mountains) exhibited lower temperatures, while the Junggar Basin, Turpan Basin, and Tarim Basin were relatively warmer. The highest summer temperatures for both the air and ground were recorded in the Turpan Basin, reaching 32.40 °C and 40.47 °C, respectively, while the average lowest winter temperatures were observed in the northeastern part of the Altai Mountains and the central section of the northern slope of the Tianshan Mountains, at −24.95 °C and −24.94 °C, respectively. The precipitation patterns showed similar spatial distribution trends across the seasons, with the highest rainfall typically occurring in the northern Altai Mountains, central Tianshan Mountains, and the southern Kunlun Mountains, whereas the Junggar Basin, Turpan Basin, and Tarim Basin received relatively less precipitation. The average highest summer rainfall reached 520.97 mm, located on both sides of the Ili River Valley, while the average lowest winter precipitation was below 15 mm, with the overall precipitation in northern Xinjiang appearing greater than in southern Xinjiang. Sunshine duration exhibited clear spatial differences across the seasons. In spring, the duration was generally longer in the northeast and shorter in the southwest. The longest sunshine duration occurred in summer, generally higher in northern Xinjiang than in the south, higher in the east than in the west, and higher in plains and basins than in mountainous areas. The Junggar and Turpan basins experienced the longest sunshine duration, generally above 900 h. In autumn, sunshine duration decreased from southeast to northwest, while in winter, it was the shortest of the year, higher in the east than in the west and higher in southern Xinjiang than in the north. During winter, the southeastern part of the Kunlun Mountains had the longest sunshine duration, at over 700 h, while the western side of the Gurbantünggüt Desert had the shortest, with less than 400 h.
Figure 3 presents the trends in temperature, ground temperature, precipitation, and sunlight duration across the four seasons in Xinjiang from 2000 to 2019. For spring and summer, the proportion of meteorological stations showing an increasing trend in temperature accounted for 98% and 89%, respectively, while all stations recorded an upward trend in temperature during autumn and winter, with autumn experiencing the most significant rise (0.05 to 0.15 °C/year). Ground temperature exhibited an increasing trend throughout the year, with over 90% of stations in all seasons showing an increase, of which more than 80% were significant increases. In terms of the warming magnitude, the ground temperature increases in spring, summer, and autumn were relatively small (all between 0 and 0.08 °C/year), whereas winter displayed a divergent trend with increases in the north and decreases in the southeast. Precipitation increased at more than 97% of the sites across all seasons, indicating a clear trend towards warmer and wetter conditions in Xinjiang over the past 20 years. The increase in precipitation was more pronounced during spring and summer, with over 70% of the sites showing significant increases. However, the increase in summer precipitation exhibited greater spatial heterogeneity, with the greatest increases concentrated in high-altitude mountain areas, reaching 0.55 to 1.30 mm/year. As for sunlight duration, only spring saw an increase, while summer, autumn, and winter experienced decreases to varying extents. The proportion of sites with increased sunlight duration in spring was 67%, whereas the proportions with decreased sunlight duration in summer, autumn, and winter were 71%, 86%, and 86%, respectively. The trend in spring sunlight duration showed a significant spatial variation, with a slight decrease in northern Xinjiang (−0.2 to 0 h/year) and a notable increase in southern Xinjiang (0.1 to 0.5 h/year). The differences in sunlight duration during summer and autumn were primarily near the Kunlun Mountains, with summer experiencing a larger reduction (−0.6 to 0.8 h/year). In winter, this trend was characterized by a slight decrease in sunlight duration in the basin (−0.4 to −0.1 h/year) and a clear increasing trend in the southern part of the Kunlun Mountains (0.2 to 1.6 h/year).
3.2. Grassland Phenology Monitoring Based on SIF
Utilizing GOME-2 data, we extracted the spatial distribution of the grassland SOS, EOS, and LOS in Xinjiang over the past 20 years (Figure 4). The multi-year average SOS for Xinjiang’s grasslands was the 129th day, concentrated in early May, covering 98.94% of the region’s grasslands. The earliest greening occurred on the flanks of the Ili River Valley, concentrated in late April. In contrast, some high-altitude areas, such as the northern Altai, the southern slopes of the Tianshan Mountains, and the southern parts of the Kunlun Mountains, exhibited the latest greening around early June. The multi-year average EOS was the 274th day, concentrated in late September to early October, covering 71.47% of the grasslands in Xinjiang. The earliest senescence occurred in the northwest of Xinjiang, in the Tacheng area, concentrated in late August, while the latest was on the northern sides of the Junggar and Tarim basins, with grassland senescence around the end of October. As for the LOS, the average across Xinjiang’s grasslands was 145 days, primarily ranging between 140 and 160 days, covering 67.99% of the grasslands. The shortest growing seasons were found in the north of the Altai Mountains and the southern slopes of the Tianshan Mountains, accounting for 28.13% of the study area, with a length of 140 days or less. The longest growing seasons were located in the Junggar Basin and the Ili River Valley, making up 3.87% of the area, exceeding 160 days. Additionally, the standard deviations for the SOS, EOS, and LOS were 9.06 days, 9.60 days, and 13.72 days, respectively. Notably, larger standard deviations near the Gurbantünggüt Desert indicated significant interannual variability in grassland phenological indicators in this area, likely due to strong influences from external factors, such as hydrothermal conditions.
We analyzed the interannual trends of phenological parameters for grasslands in Xinjiang (Figure 5) and found that over the past 20 years, the SOS of grassland vegetation has generally shifted to earlier, advancing by an average of 5.47 days per decade, affecting 82.45% of the total grassland area in Xinjiang. Significance tests indicate that in the Ili River Valley, Tacheng Basin, and the southern margin of the Altai Mountains, the trend of an earlier SOS is particularly pronounced, advancing by about 10 to 20 days per decade. In contrast, on the northern slopes of the Tianshan Mountains and the northern edge of the Tarim Basin, the greening phase has been significantly delayed, with a trend of delaying by 5 to 15 days per decade. Simultaneously, the EOS of grasslands in Xinjiang overall shows a delaying trend, with an average decadal delay of 6.61 days across the region, where the areas of grassland experiencing an earlier and delayed EOS accounted for 12.37% and 87.63%, respectively. The trend of an earlier EOS was most significant on the southern edge of the Junggar Basin, advancing by 5 to 10 days per decade, while the most pronounced delays in the EOS occurred in the Altai region, the southeastern side of the Tacheng Basin, and the northwest part of the Tarim Basin, delaying by 10 to 20 days per decade. Additionally, the LOS for Xinjiang’s grasslands overall exhibited a slightly increasing trend, extending by an average of 11.97 days per decade, covering 87.24% of the total grassland area in Xinjiang. The most significant increases in the length of the growing season were concentrated on the southeastern side of the Tacheng Basin, the flanks of the Ili River Valley, and the Altai region, with an increase of 15 to 20 days per decade. Regions experiencing a reduction in the length of the growing season were concentrated on the northern edge of the Tarim Basin and the southern edge of the Junggar Basin, with a decadal decrease of 5 to 20 days.
The phenological parameters of various grassland types in Xinjiang exhibit significant differences (Table 1, Figure 6). The SOS for different grassland types is concentrated between the 126th and 136th days, primarily in mid-to-late May. Temperate steppe deserts and temperate deserts turned green the earliest on the 126th day, followed by temperate meadow steppes and temperate desert steppes, both on the 127th day. Subsequently, temperate steppes, mountain meadows, alpine deserts, lowland meadows, and alpine meadow types turn green from the 128th to the 135th days, respectively. Alpine steppe types have the latest greening phase, with a multi-year average greening day of the 136th day. The EOS of all grassland types is concentrated from late September to October, with alpine deserts senescing first on the 284th day, followed by lowland meadows on the 282nd day. Next come temperate deserts, alpine steppes, temperate steppe deserts, temperate desert steppes, alpine meadows, and temperate steppes, with senescence phases ranging from the 277th to the 271st days. Temperate meadow steppes and mountain meadows have the latest senescence phase, both on the 268th day. Due to the complexity of topography and climate variations, the LOS for different types of grasslands in Xinjiang varies significantly, with an average length ranging from 136 to 151 days. Temperate deserts and alpine deserts have the longest growing season, both at 151 days, followed by lowland meadows, temperate steppe deserts, temperate desert steppes, temperate steppes, temperate meadow steppes, alpine steppes, and mountain meadows, with growing season lengths ranging from 148 to 138 days. Alpine meadows have the shortest growing season, with an average length of 136 days.
Additionally, there are significant differences in the rate of phenological changes across the main grassland types in Xinjiang. Among the ten primary grassland types, except for lowland meadows, all the other nine types exhibit a trend of an advancing greening phase, with temperate meadow steppes and temperate steppes showing the highest rate of advancement, each advancing by an average of 0.93 days per year. Conversely, the greening phase of lowland meadows shows a delaying trend of 0.26 days per year. Regarding the senescence phase, all grassland types in Xinjiang show a delaying trend, with the senescence phase of temperate steppe deserts delaying at the most significant rate of 0.94 days per year, while alpine deserts show the weakest delaying trend, at 0.1 days per year. The length of the growing season for all grassland types exhibits an extending trend, with temperate desert steppes and temperate steppes experiencing the fastest growth rate, increasing by 1.59 days and 1.55 days per year, respectively. In contrast, the increasing length of the growing season for lowland meadows is the smallest, at 0.24 days per year.
3.3. Seasonal Climatic Effects on Grassland Phenology
The initiation of the greening phase in grasslands requires the accumulation of sufficient warmth prior to the season. During this process, spring temperature and ground temperature exert positive feedback on the timing of grassland greening, with over 70% of the grassland greening phase positively influenced by the rise in spring air and ground temperatures. This trend is particularly significant in regions such as the northern Altai Mountains, Tacheng Basin, Ili River Valley, and the southern area of the Kunlun Mountains, where the relatively high elevation and lower temperatures mean that an increase in spring temperatures provides sufficient warmth for grass growth, leading to an earlier greening phase (Figure 7). Overall, in spring, rising air temperatures result in an earlier greening phase across a larger area of grassland, while an increase in ground temperature causes grasslands in high-altitude areas to enter their greening phase earlier. The impact of increased spring precipitation on the greening phase of grassland varies across different regions. In the transition zone from the southern slopes of the Tianshan Mountains to the northern edge of the Tarim Basin, an increase in spring precipitation leads to an earlier grassland greening phase. However, in higher-elevation areas, such as the Tianshan, Kunlun Mountains, and the northern part of the Altai Mountains, an increase in spring precipitation can delay the grassland greening phase. This phenomenon can be attributed to the likelihood that increased precipitation indirectly retards temperature elevation or even induces cooling effects in mountainous locales, thereby contributing to the delayed onset of the greening phase. Sunlight duration not only reflects the intensity of solar radiation but is also one of the vital energy sources for photosynthesis in vegetation. Therefore, this study further analyzes the feedback of grassland phenology on sunlight duration. An increase in spring sunlight duration has a negative correlation with the greening phase of grasslands in some parts of Xinjiang. Specifically, in spring, 60.60% of the grassland greening phase shows a negative correlation with sunlight duration, meaning that an increase in spring sunlight duration leads to an earlier greening phase. This effect is most pronounced in the transition zone from the southern slopes of the Tianshan Mountains to the northern edge of the Tarim Basin, the Ili River Valley, and the Kunlun Mountain region.
In autumn, high-temperature stress significantly inhibits grassland growth, leading to an earlier EOS. Except for the mountainous areas in the northern Altai Mountains, most regions within the study area (83.98%) exhibit a trend where higher autumn temperatures result in an earlier grassland senescence phase (Figure 8). The impact of ground temperature on grassland phenology is relatively minor but should not be overlooked. Increases in ground temperature during summer and autumn lead to an earlier senescence phase in 63.51% and 56.87% of the areas, respectively, indicating that the rise in summer ground temperature is a dominant factor inhibiting grassland growth. Precipitation is another important climatic factor that delays the grassland senescence phase. Increases in precipitation during summer and autumn lead to a delay in the senescence phase for 79.52% and 71.94% of Xinjiang’s grasslands, respectively, emphasizing the importance of summer and autumn rainfall for grassland growth in Xinjiang. The effect of sunlight duration on the grassland senescence phase is mainly observed in summer and autumn. In summer, 84.19% of the grassland senescence phases are negatively correlated with sunlight duration, meaning that an increase in sunlight duration leads to an earlier senescence phase, while in autumn, 56.61% of Xinjiang’s grasslands showed a negative correlation between increased sunlight duration and the senescence phase. Overall, the increase in sunlight duration and ground temperature during summer inhibits grassland growth, while the dominant factors affecting grassland growth in autumn are air temperature and precipitation.
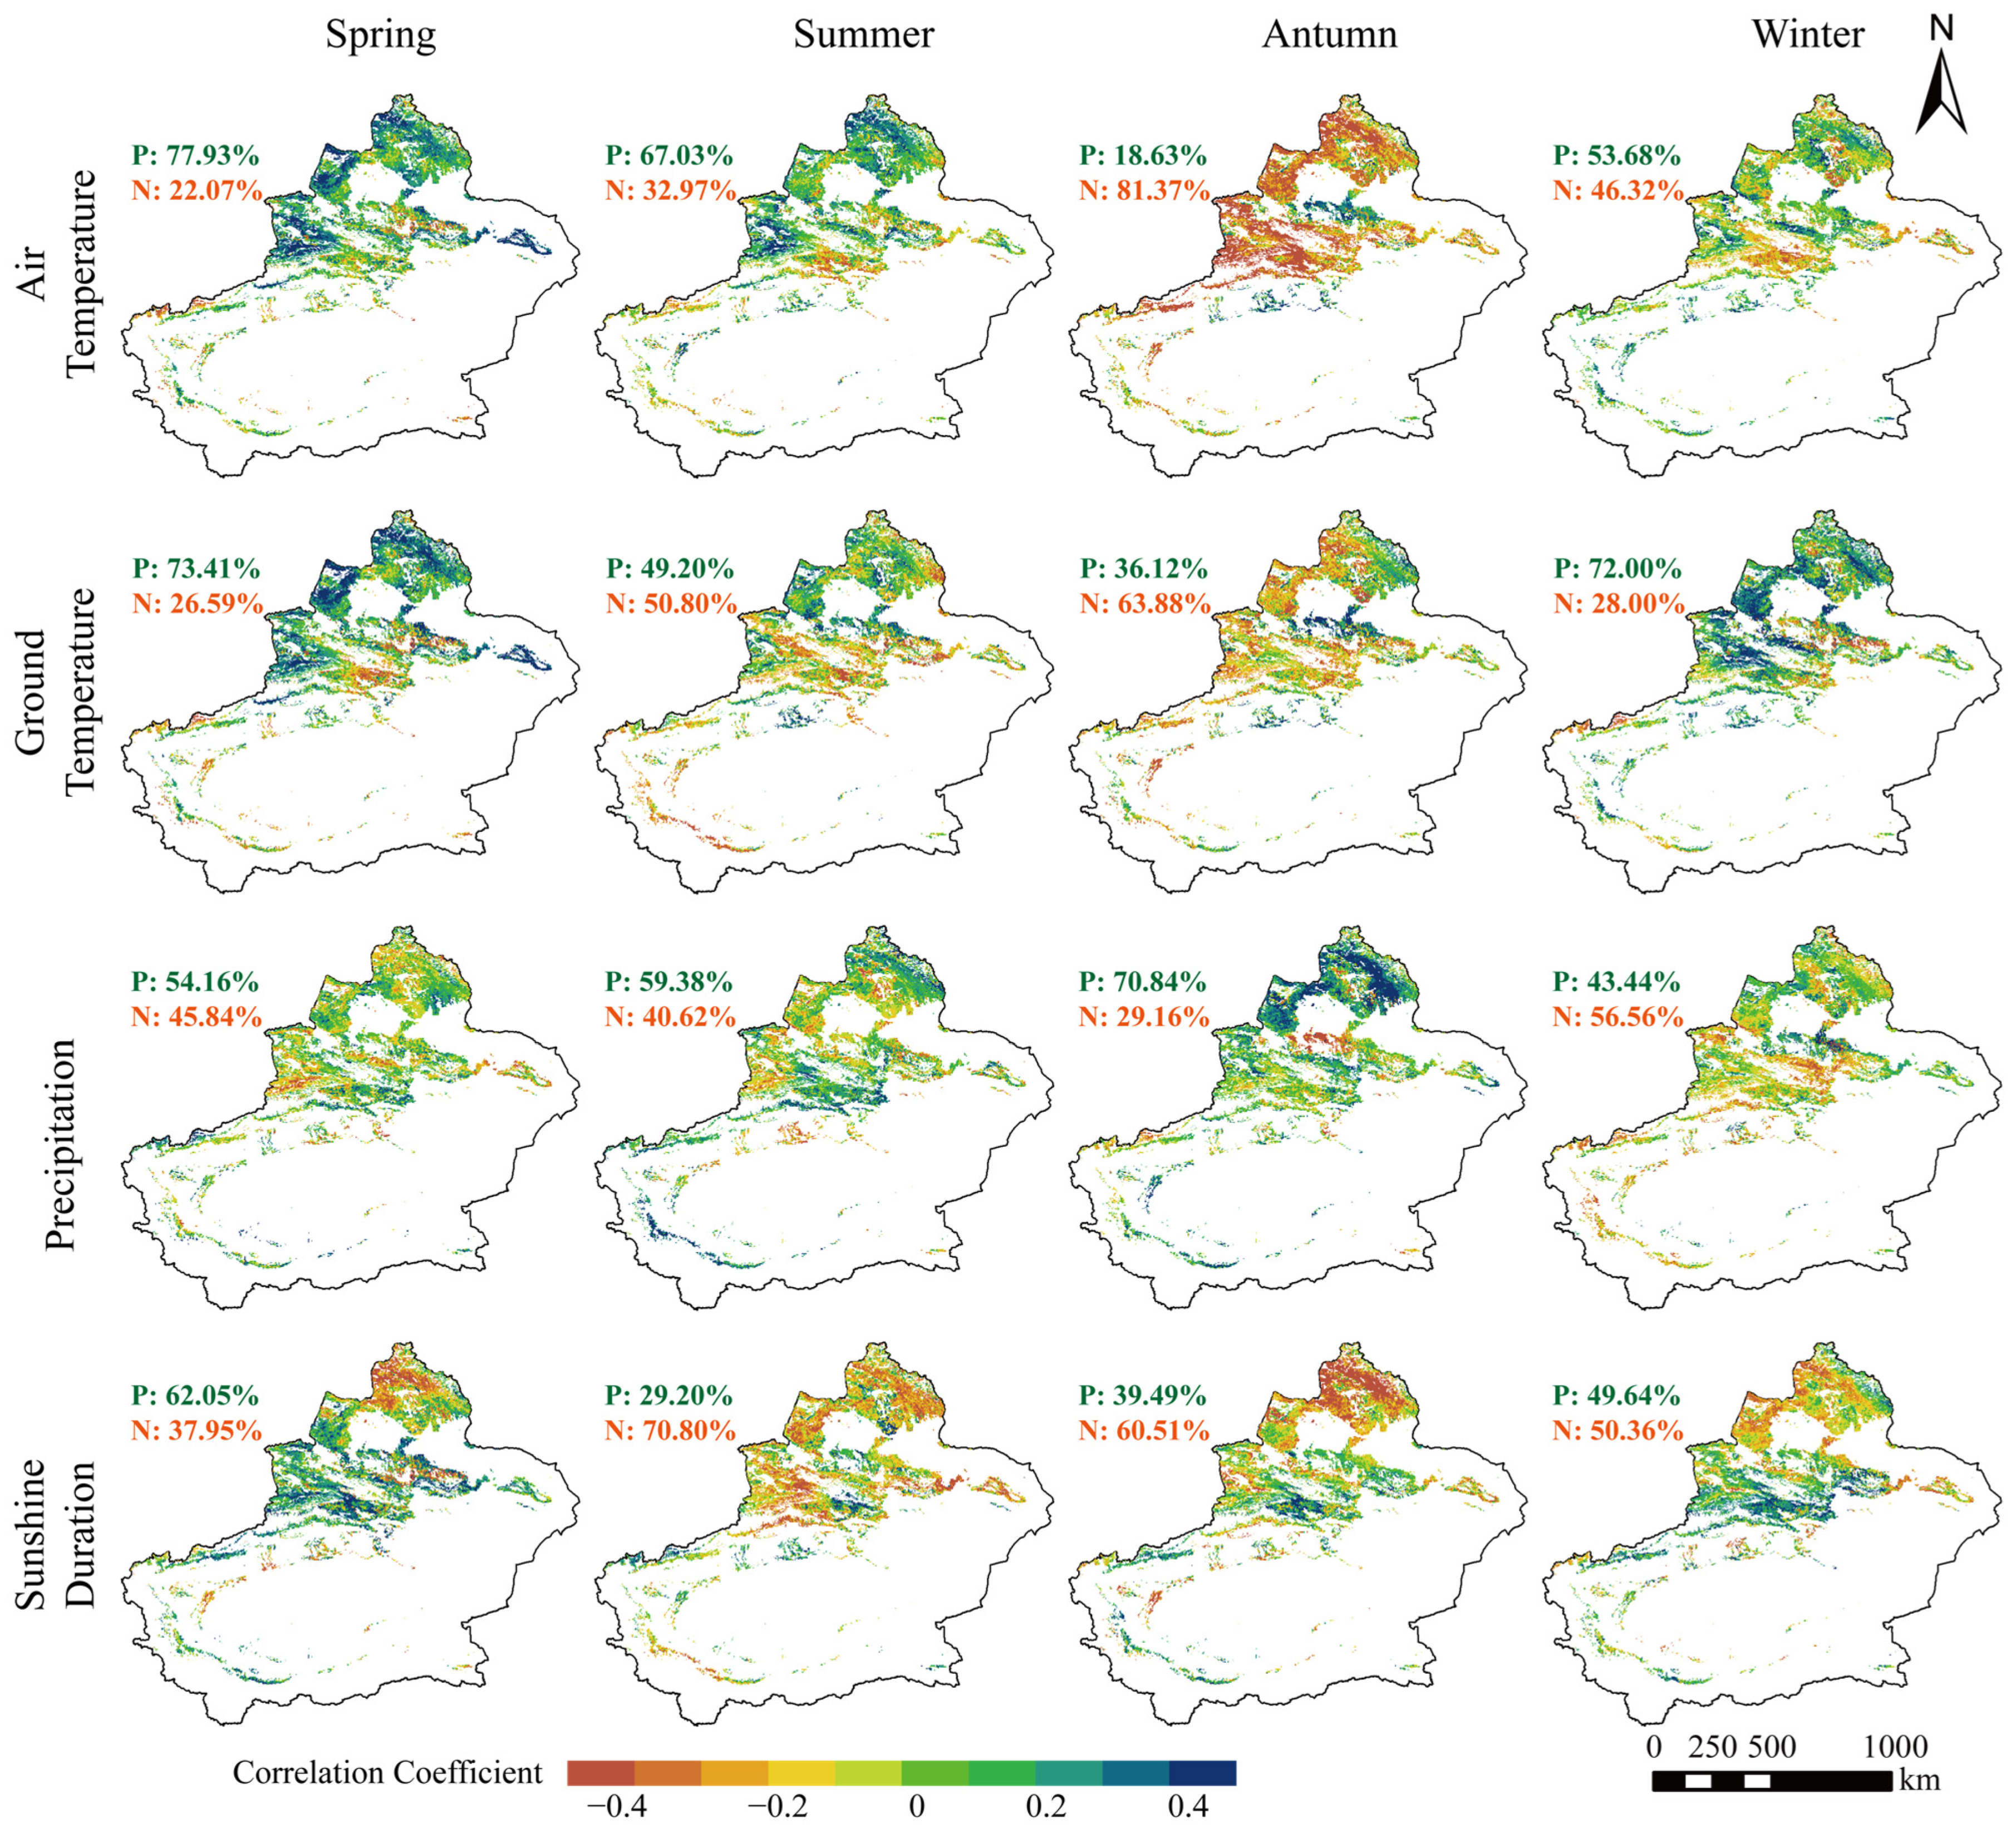
The LOS for grasslands in Xinjiang is significantly affected by seasonal climatic factors (Figure 9). Spring and summer temperatures are negatively correlated with the grassland greening phase overall, accounting for 77.93% and 67.03%, respectively. This means that as spring and summer temperatures rise, the grassland greening phase advances, thereby extending the length of the growing season. Conversely, an increase in autumn temperature significantly shortens the length of the growing season, indicating that temperature changes in spring, summer, and autumn are the primary factors driving the grassland growing season. The impact of ground temperature on the length of the growing season is similar to that of air temperature, where increases in spring and summer temperatures lead to an extension of the growing season in 73.41% and 49.20% of the regions, respectively. In autumn, an increase in ground temperature inhibits grassland growth in 63.88% of the areas. This indicates that temperature changes play a crucial role in the seasonal process of grassland growth, transitioning from “promoting” to “inhibiting” grassland growth throughout the year. In stark contrast to temperature, increases in precipitation during spring, summer, and autumn lead to an extension of the growing season across 54.16%, 59.38%, and 70.84% of grasslands, respectively. Increased precipitation promotes grassland growth near the southern slopes of the Tianshan Mountains and the Kunlun Mountains, especially in autumn, where increased precipitation significantly promotes grassland growth in the Tacheng Basin and the southern regions of the Altai Mountains. The impact of sunlight duration on grassland growth varies significantly across different seasons. Specifically, 37.95%, 70.80%, 60.51%, and 50.36% of regions show a negative correlation between sunlight duration and the length of the grassland growing season in each of the four seasons, respectively. An increase in sunlight duration during spring extends the growing season in 62.05% of regions, while increases in sunlight duration during summer and autumn lead to the shortening of the growing season in 70.80% and 60.51% of grasslands, with the most significant effects observed in the Altai Mountains region. These results indicate that the impact of sunlight duration on the length of the grassland growing season exhibits a “promoting—inhibiting—insignificant effect” trend throughout the year.
4. Discussion
4.1. Feedback of Xinjiang’s Seasonal Climate on Global Change
Over the past 20 years, the trend of temperature change in Xinjiang has been consistent with that of China and the global average. Xinjiang’s annual average temperature shows an increasing trend of 0.33 °C per decade, which is higher than the global average (0.117 °C/10a) [62] and the Chinese average (0.274 °C/10a) [63]. This trend of temperature change is likely related to human activities, leading to an increase in atmospheric greenhouse gas concentrations. Additionally, the increase in ground temperature in Xinjiang has consistently exceeded the change in air temperature over the same period [64]. The air temperature directly affects the ground temperature through the ground–air heat exchange process, and the increasing difference between air and ground temperatures suggests a decrease in near-surface air stability, enhanced vertical air convection at different altitudes, and can potentially lead to increased surface evapotranspiration [65]. Precipitation in Xinjiang is significantly influenced by topographical conditions, with generally higher amounts in mountainous areas than in plains, and is also affected by factors such as the Arctic Oscillation [66] and solar activity [67]. Over the past 50 years, Xinjiang, and even the entire northwest, has experienced the most abundant annual precipitation in over 400 years, especially during the last 40 years of rapid climate warming [68]. With relatively low cloud cover and abundant solar energy resources, Xinjiang has tremendous potential for photosynthetic production in vegetation. However, sunlight duration in Xinjiang exhibits seasonal trends, with an increase of 2.53 h per decade in spring but decreases in summer, autumn, and winter, particularly with a significant decrease of 11.33 h per decade in winter, which is consistent with previous research findings [69]. The shortening of sunlight duration in Xinjiang may be attributed to increased cloudiness. Additionally, the humidification of Xinjiang’s climate, reduced average wind speeds, and air pollution resulting from unsustainable exploitation and the use of natural resources by human activities may also contribute to the reduction in sunlight duration [70,71,72]. During the summer, autumn, and winter months, there is a noticeable decrease in sunlight duration, yet temperatures continue to exhibit an upward trend. This phenomenon is likely due to the increase in atmospheric water vapor associated with rising temperatures, which leads to an increase in cloud cover. These additional clouds can block direct sunlight from reaching the Earth’s surface, thus reducing the total amount of sunlight exposure. Simultaneously, clouds can reflect and absorb the Earth’s long-wave radiation (thermal radiation), which contributes to an increase in surface temperatures. This interaction is known as the “cloud feedback effect”. Consequently, this dynamic results in both decreasing sunlight hours and increasing temperatures in Xinjiang.
4.2. Significant Impact of Seasonal Climatic Factors on Grassland Phenology
Although grassland phenology is influenced by genetics, environmental factors play a crucial role in regulating phenological changes [73]. Different types of grasslands in Xinjiang exhibit clear climate-driven differences in the greening phase. Low-altitude areas, including temperate deserts, temperate desert steppes, lowland meadows, and desert steppes, generally show an earlier greening phase. These areas have higher annual average temperatures and relatively lower precipitation levels (approximately 80 to 220 mm). Through a comprehensive comparison of the greening phase and climatic factors of different types of grasslands in Xinjiang, we found that grasslands have an earlier greening phase under conditions of higher annual average temperatures and limited precipitation. Conversely, areas with abundant precipitation tend to have a later senescence phase for different types of grasslands.
Correlation analysis shows that temperature has greater explanatory power for the greening phase of Xinjiang’s grasslands than precipitation (Figure 7), contrary to the conclusions by Ren et al. for the grasslands of Inner Mongolia, where precipitation was identified as the main factor determining the greening phase [74]. This difference may be attributed to Xinjiang being one of the three regions in China with the highest snowfall, where heavy winter snowfall and low temperatures allow snow to accumulate until melting in the following spring, providing ample water sources for grassland growth [75]. Therefore, rising temperatures not only provide sufficient heat for grassland growth but also accelerate snowmelt, making temperature the primary driver for earlier greening dates in Xinjiang. In contrast, the grasslands of Inner Mongolia lack water sources from glaciers and snowmelt, and spring temperatures are sufficient to sustain grassland growth, making precipitation the decisive factor affecting the greening phase of the Mongolian grasslands [74]. Meanwhile, the sunlight duration in autumn does not significantly impact the yellowing phase of grasslands, while an increase in sunlight duration during summer significantly advances the onset of this phase. This suggests a potential lag effect in the response of Xinjiang’s grasslands to changes in sunlight duration. When climatic changes exceed the grasslands’ tolerance, they react through feedback mechanisms, indicating that a dynamic response to climate variability may not occur simultaneously. Consequently, the impact of summer sunlight duration on the yellowing phase of grasslands was greater than that of autumn. In investigating the phenology of temperate grasslands in China, Wei et al. observed that an increase in autumn temperatures, particularly in regions with temperatures between −10 °C and −5 °C, tends to delay the EOS [76]. On the contrary, our findings from Xinjiang suggest an opposite trend, where warmer autumn temperatures accelerate the EOS. This discrepancy may be attributed to regional climatic variations and the unique ecological characteristics of the study areas [77]. In high-altitude regions, for instance, warmer autumn temperatures could potentially reduce the risk of frost, thereby extending the EOS. Comparable trends have been observed in the Tibetan Plateau, where early studies have noted that a warmer spring leads to the earlier start of the growing season, which is a phenomenon possibly linked to similar water supply sources in both Xinjiang and the Tibetan Plateau, primarily relying on snowmelt [78]. Additionally, research on the typical grasslands and desert grasslands of Inner Mongolia indicates that a rapid decrease in water availability can delay the SOS, and seasonal droughts significantly inhibit SOS occurrences [79].
Furthermore, the study found that the standard deviation of the greening phase for lowland meadows was significantly greater than that of other grassland types, indicating the largest interannual variability in the greening phase for lowland meadows. This phenomenon is due to the abundance of seasonal meltwater with the rise in spring temperatures, which advances the greening phase in lowland meadow areas. In contrast, the standard deviation of the greening phase for other low-altitude grassland areas (such as temperate deserts, temperate desert steppes, and temperate desert steppes) is higher than that for mid-altitude mountain grassland areas (such as mountain meadows, temperate steppes, and temperate meadow steppes) and high-altitude mountain grassland areas (such as alpine deserts, alpine steppes, and alpine meadow steppes). Overall, with decreasing altitude, the standard deviation of the greening phase for different types of grasslands gradually increases, meaning that the interannual variability in the greening phase for low-altitude areas is greater than for high-altitude areas. This result is generally consistent with the findings of Ren et al. in Inner Mongolia [74], likely because climatic variability has a stronger impact on low-altitude mountain grasslands than on mid-to-high-altitude alpine grasslands [80].
4.3. Limitations and Uncertainties
In Xinjiang, grassland areas at lower elevations, constrained by limited precipitation and high evaporation rates, exhibit sparse vegetation growth. These regions have vegetation with a yellowish hue, thin leaves, and a vegetation cover of less than 20%, with some areas even below 5%. Therefore, during the extraction of phenological information, background signals (mainly bare soil) may interfere with the target information. In desert regions, due to the decreased sensitivity of satellite sensors to vegetation spectral information, absorption troughs, and reflection peaks are weak, making it difficult to accurately detect vegetation from remote sensing images. Moreover, extracting grassland phenology information in high-altitude mountain areas is also challenged by complex terrain. Additionally, the accuracy of grassland phenology is hard to verify due to difficulties in obtaining ground-truth phenological validation data and mismatches between remote sensing phenological parameters and traditional phenological parameters. Although this study attempted to use SIF data to extract grassland phenology information, the diverse and widespread types of grasslands in Xinjiang necessitate further research and validation to improve the accuracy of grassland phenology extraction. In our analysis, linear statistical models were employed to establish relationships between climatic factors and grassland phenology. Given the complex, non-linear interactions often observed in ecological data, this may have led to an underestimation of certain dynamic responses. To better capture these interactions, future studies could explore non-linear models like Generalized Additive Models (GAMs) or machine learning approaches, which can flexibly accommodate the complexity of ecological systems.
Considering the complexity of ecological responses to climatic factors and the limitations inherent in our current methodologies, we recommend the establishment of a long-term phenological monitoring network covering various grassland types in Xinjiang. This initiative could facilitate detailed observations of phenological shifts, thereby capturing the long-term effects of climate variability comprehensively. Moreover, we recommend integrating cutting-edge remote sensing technologies with traditional ground-based observational methods to enrich the dataset’s depth and accuracy. This hybrid approach promises to significantly enhance the spatial and temporal resolution of our observations. By employing remote sensing, we can achieve continuous and extensive coverage, while ground-based measurements provide critical, in-depth local insights into vegetation health, soil conditions, and microclimatic variables.
5. Conclusions
Warming in winter and spring significantly contributes to climate warming in Xinjiang, especially manifested as a warm winter phenomenon. We found that ground temperatures in Xinjiang were consistently higher than air temperatures across all seasons, with ground temperature increases exceeding those of air temperatures on a seasonal scale. In terms of precipitation, the most significant increase was observed in summer, with highly uneven spatial distribution, which was significantly higher in mountainous areas than in basins and plains, showing an overall moistening trend. The distribution of sunlight duration across the seasons shows spatial variations, with higher values in the east than in the west and in plains compared to mountainous areas. Temporally, there is a slight increase in spring, while summer, autumn, and winter exhibit decreases to varying extents.
The average greening phase of grasslands in Xinjiang mainly occurs in early May, showing an overall trend towards earlier onset, advancing by an average of 5.47 days per decade. Correspondingly, the senescence phase of Xinjiang’s grasslands mainly occurs from the end of September to early October, showing an overall delaying trend. Among them, 87.63% of the grasslands exhibited a delaying senescence phase, delayed by an average of 6.61 days per decade. Furthermore, the average length of the growing season for Xinjiang’s grassland is around 145 days, showing a slightly increasing trend, extending by an average of 11.97 days per decade, with the increased area accounting for 87.24% of Xinjiang’s total grassland area.
Spring temperature significantly influences grassland phenology, with both ground and air temperatures positively correlating with the onset of the growing season; thus, higher temperatures generally lead to an earlier start. Conversely, high-temperature stress during autumn typically inhibits grassland growth, resulting in an earlier end to the growing season and a consequent reduction in its overall length. However, increased precipitation during summer and autumn can mitigate this effect by delaying the end of the growing season and extending its duration. This complex interaction suggests that while high temperatures in autumn tend to shorten the growing season, sufficient moisture from increased rainfall can counterbalance this effect by sustaining vegetation growth longer into the season. Additionally, an increase in spring sunshine duration promotes grassland growth, leading to an earlier start of the growing season, while an increase in summer sunshine duration inhibits grassland growth, leading to an earlier end of the growing season for 84.19% of grasslands. This may be due to higher summer temperatures, where an increase in sunlight duration leads to greater evapotranspiration, resulting in water scarcity for vegetation and, thus, the earlier onset of the senescence phase.
Author Contributions
Conceptualization, T.D. and J.L.; methodology, T.D. and P.H.; software, T.D.; validation, P.L., D.L. and M.S.; formal analysis, T.D.; investigation, T.D.; resources, J.L.; data curation, D.L.; writing—original draft preparation, T.D.; writing—review and editing, T.D. and J.L.; visualization, M.S.; supervision, P.H.; project administration, D.L.; funding acquisition, D.L. All authors have read and agreed to the published version of the manuscript.
Funding
This research was funded by the National Natural Science Foundation of China (42071116), and the Basic Scientific Fund for National Public Research Institutes of China (2021S02).
Data Availability Statement
The datasets generated and/or analyzed during the current study are not publicly available but are available from the corresponding/first author on reasonable request.
Conflicts of Interest
The authors declare no conflict of interest.
References
- Ren, G.; Ding, Y.; Zhao, Z.; Zheng, J.; Wu, T.; Tang, G.; Xu, Y. Recent progress in studies of climate change in China. Adv. Atmos. Sci. 2012, 29, 958–977. [Google Scholar] [CrossRef]
- Huang, J.; Ji, M.; Xie, Y.; Wang, S.; He, Y.; Ran, J. Global semi-arid climate change over last 60 years. Clim. Dyn. 2016, 46, 1131–1150. [Google Scholar] [CrossRef]
- Reed, S.C.; Coe, K.K.; Sparks, J.P.; Housman, D.C.; Zelikova, T.J.; Belnap, J. Changes to dryland rainfall result in rapid moss mortality and altered soil fertility. Nat. Clim. Chang. 2012, 2, 752–755. [Google Scholar] [CrossRef]
- Guan, X.-D.; Huang, J.-P.; Guo, R.-X.; Yu, H.; Lin, P.; Zhang, Y. Role of radiatively forced temperature changes in enhanced semi-arid warming in the cold season over east Asia. Atmos. Chem. Phys. 2015, 15, 13777–13786. [Google Scholar] [CrossRef]
- Ma, Z.; Fu, C. Interannual characteristics of the surface hydrological variables over the arid and semi-arid areas of northern China. Glob. Planet. Chang. 2003, 37, 189–200. [Google Scholar] [CrossRef]
- Huang, J.-p.; Guan, X.-d.; Ji, F. Enhanced cold-season warming in semi-arid regions. Atmos. Chem. Phys. 2012, 12, 5391–5398. [Google Scholar] [CrossRef]
- Ji, F.; Wu, Z.; Huang, J.; Chassignet, E.P. Evolution of land surface air temperature trend. Nat. Clim. Chang. 2014, 4, 462–466. [Google Scholar] [CrossRef]
- Qian, W.; Ding, T.; Hu, H.; Lin, X.; Qin, A. An overview of dry-wet climate variability among monsoon-westerly regions and the monsoon northernmost marginal active zone in China. Adv. Atmos. Sci. 2009, 26, 630–641. [Google Scholar] [CrossRef]
- Huang, J.; Yu, H.; Guan, X.; Wang, G.; Guo, R. Accelerated dryland expansion under climate change. Nat. Clim. Chang. 2016, 6, 166–171. [Google Scholar] [CrossRef]
- Li, Y.; Huang, J.; Ji, M.; Ran, J. Dryland expansion in northern China from 1948 to 2008. Adv. Atmos. Sci. 2015, 32, 870–876. [Google Scholar] [CrossRef]
- Gong, D.-Y.; Shi, P.-J.; Wang, J.-A. Daily precipitation changes in the semi-arid region over northern China. J. Arid. Environ. 2004, 59, 771–784. [Google Scholar] [CrossRef]
- Zhai, P.; Zhang, X.; Wan, H.; Pan, X. Trends in total precipitation and frequency of daily precipitation extremes over China. J. Clim. 2005, 18, 1096–1108. [Google Scholar] [CrossRef]
- Chen, F.; Huang, W.; Jin, L.; Chen, J.; Wang, J. Spatiotemporal precipitation variations in the arid Central Asia in the context of global warming. Sci. China Earth Sci. 2011, 54, 1812–1821. [Google Scholar] [CrossRef]
- Chen, F.; Wang, J.; Jin, L.; Zhang, Q.; Li, J.; Chen, J. Rapid warming in mid-latitude central Asia for the past 100 years. Front. Earth Sci. China 2009, 3, 42–50. [Google Scholar] [CrossRef]
- Zhou, L. Desert amplification in a warming climate. Sci. Rep. 2016, 6, 31065. [Google Scholar] [CrossRef] [PubMed]
- Morisette, J.T.; Richardson, A.D.; Knapp, A.K.; Fisher, J.I.; Graham, E.A.; Abatzoglou, J.; Wilson, B.E.; Breshears, D.D.; Henebry, G.M.; Hanes, J.M. Tracking the rhythm of the seasons in the face of global change: Phenological research in the 21st century. Front. Ecol. Environ. 2009, 7, 253–260. [Google Scholar] [CrossRef]
- Chen, X. Plant phenology of natural landscape dynamics. In Spatiotemporal Processes of Plant Phenology; Springer: Berlin, Germany, 2017; pp. 1–5. [Google Scholar]
- Zhu, W.; Zheng, Z.; Jiang, N.; Zhang, D. A comparative analysis of the spatio-temporal variation in the phenologies of two herbaceous species and associated climatic driving factors on the Tibetan Plateau. Agric. For. Meteorol. 2018, 248, 177–184. [Google Scholar] [CrossRef]
- Verhegghen, A.; Bontemps, S.; Defourny, P. A global NDVI and EVI reference data set for land-surface phenology using 13 years of daily SPOT-VEGETATION observations. Int. J. Remote Sens. 2014, 35, 2440–2471. [Google Scholar] [CrossRef]
- Zhang, X.; Friedl, M.A.; Schaaf, C.B.; Strahler, A.H.; Hodges, J.C.; Gao, F.; Reed, B.C.; Huete, A. Monitoring vegetation phenology using MODIS. Remote Sens. Environ. 2003, 84, 471–475. [Google Scholar] [CrossRef]
- White, M.A.; Thornton, P.E.; Running, S.W. A continental phenology model for monitoring vegetation responses to interannual climatic variability. Glob. Biogeochem. Cycles 1997, 11, 217–234. [Google Scholar] [CrossRef]
- De Beurs, K.M.; Henebry, G.M. Land surface phenology and temperature variation in the International Geosphere–Biosphere Program high-latitude transects. Glob. Chang. Biol. 2005, 11, 779–790. [Google Scholar] [CrossRef]
- de Beurs, K.M.; Henebry, G.M. Spatio-Temporal Statistical Methods for Modelling Land Surface Phenology. In Phenological Research: Methods for Environmental and Climate Change Analysis; Hudson, I.L., Keatley, M.R., Eds.; Springer: Dordrecht, The Netherlands, 2010; pp. 177–208. [Google Scholar]
- Chmielewski, F.-M.; Heider, S.; Moryson, S.; Bruns, E. International phenological observation networks: Concept of IPG and GPM. In Phenology: An Integrative Environmental Science; Springer: Berlin, Germany, 2013; pp. 137–153. [Google Scholar]
- Templ, B.; Koch, E.; Bolmgren, K.; Ungersböck, M.; Paul, A.; Scheifinger, H.; Busto, M.; Chmielewski, F.-M.; Hájková, L.; Hodzić, S. Pan European Phenological database (PEP725): A single point of access for European data. Int. J. Biometeorol. 2018, 62, 1109–1113. [Google Scholar] [CrossRef]
- Keenan, T.; Baker, I.; Barr, A.; Ciais, P.; Davis, K.; Dietze, M.; Dragoni, D.; Gough, C.M.; Grant, R.; Hollinger, D. Terrestrial biosphere model performance for inter-annual variability of land-atmosphere CO2 exchange. Glob. Chang. Biol. 2012, 18, 1971–1987. [Google Scholar] [CrossRef]
- Richardson, A.D.; Anderson, R.S.; Arain, M.A.; Barr, A.G.; Bohrer, G.; Chen, G.; Chen, J.M.; Ciais, P.; Davis, K.J.; Desai, A.R. Terrestrial biosphere models need better representation of vegetation phenology: Results from the North American Carbon Program Site Synthesis. Glob. Chang. Biol. 2012, 18, 566–584. [Google Scholar] [CrossRef]
- Baldocchi, D.; Falge, E.; Gu, L.; Olson, R.; Hollinger, D.; Running, S.; Anthoni, P.; Bernhofer, C.; Davis, K.; Evans, R. FLUXNET: A new tool to study the temporal and spatial variability of ecosystem-scale carbon dioxide, water vapor, and energy flux densities. Bull. Am. Meteorol. Soc. 2001, 82, 2415–2434. [Google Scholar] [CrossRef]
- Richardson, A.D.; Andy Black, T.; Ciais, P.; Delbart, N.; Friedl, M.A.; Gobron, N.; Hollinger, D.Y.; Kutsch, W.L.; Longdoz, B.; Luyssaert, S. Influence of spring and autumn phenological transitions on forest ecosystem productivity. Philos. Trans. R. Soc. B Biol. Sci. 2010, 365, 3227–3246. [Google Scholar] [CrossRef]
- Bao, G.; Chen, J.; Chopping, M.; Bao, Y.; Bayarsaikhan, S.; Dorjsuren, A.; Tuya, A.; Jirigala, B.; Qin, Z. Dynamics of net primary productivity on the Mongolian Plateau: Joint regulations of phenology and drought. Int. J. Appl. Earth Obs. Geoinf. 2019, 81, 85–97. [Google Scholar] [CrossRef]
- Wang, F.; Chen, B.; Lin, X.; Zhang, H. Solar-induced chlorophyll fluorescence as an indicator for determining the end date of the vegetation growing season. Ecol. Indic. 2020, 109, 105755. [Google Scholar] [CrossRef]
- Scurlock, J.; Hall, D. The global carbon sink: A grassland perspective. Glob. Chang. Biol. 1998, 4, 229–233. [Google Scholar] [CrossRef]
- Zhou, W.; Gang, C.; Zhou, L.; Chen, Y.; Li, J.; Ju, W.; Odeh, I. Dynamic of grassland vegetation degradation and its quantitative assessment in the northwest China. Acta Oecologica 2014, 55, 86–96. [Google Scholar] [CrossRef]
- Chen, Y.; Mu, S.; Sun, Z.; Gang, C.; Li, J.; Padarian, J.; Groisman, P.; Chen, J.; Li, S. Grassland carbon sequestration ability in China: A new perspective from terrestrial aridity zones. Rangel. Ecol. Manag. 2016, 69, 84–94. [Google Scholar] [CrossRef]
- Piao, S.; Wang, X.; Park, T.; Chen, C.; Lian, X.; He, Y.; Bjerke, J.W.; Chen, A.; Ciais, P.; Tømmervik, H.; et al. Characteristics, drivers and feedbacks of global greening. Nat. Rev. Earth Environ. 2020, 1, 14–27. [Google Scholar] [CrossRef]
- Piao, S.; Liu, Q.; Chen, A.; Janssens, I.A.; Fu, Y.; Dai, J.; Liu, L.; Lian, X.; Shen, M.; Zhu, X. Plant phenology and global climate change: Current progresses and challenges. Glob. Chang. Biol. 2019, 25, 1922–1940. [Google Scholar] [CrossRef] [PubMed]
- Zhang, R.; Guo, J.; Liang, T.; Feng, Q. Grassland vegetation phenological variations and responses to climate change in the Xinjiang region, China. Quat. Int. 2019, 513, 56–65. [Google Scholar] [CrossRef]
- Cleland, E.E.; Chiariello, N.R.; Loarie, S.R.; Mooney, H.A.; Field, C.B. Diverse responses of phenology to global changes in a grassland ecosystem. Proc. Natl. Acad. Sci. USA 2006, 103, 13740–13744. [Google Scholar] [CrossRef] [PubMed]
- Cong, N.; Piao, S.; Chen, A.; Wang, X.; Lin, X.; Chen, S.; Han, S.; Zhou, G.; Zhang, X. Spring vegetation green-up date in China inferred from SPOT NDVI data: A multiple model analysis. Agric. For. Meteorol. 2012, 165, 104–113. [Google Scholar] [CrossRef]
- Richardson, A.D.; Keenan, T.F.; Migliavacca, M.; Ryu, Y.; Sonnentag, O.; Toomey, M. Climate change, phenology, and phenological control of vegetation feedbacks to the climate system. Agric. For. Meteorol. 2013, 169, 156–173. [Google Scholar] [CrossRef]
- Peng, D.; Zhang, X.; Wu, C.; Huang, W.; Gonsamo, A.; Huete, A.R.; Didan, K.; Tan, B.; Liu, X.; Zhang, B. Intercomparison and evaluation of spring phenology products using National Phenology Network and AmeriFlux observations in the contiguous United States. Agric. For. Meteorol. 2017, 242, 33–46. [Google Scholar] [CrossRef]
- Zhao, W.; Jing, C. Response of the natural grassland vegetation change to meteorological drought in Xinjiang from 1982 to 2015. Front. Environ. Sci. 2022, 10, 1047818. [Google Scholar] [CrossRef]
- Post, A.K.; Hufkens, K.; Richardson, A.D. Predicting spring green-up across diverse North American grasslands. Agric. For. Meteorol. 2022, 327, 109204. [Google Scholar] [CrossRef]
- Ren, S.; Li, Y.; Peichl, M. Diverse effects of climate at different times on grassland phenology in mid-latitude of the Northern Hemisphere. Ecol. Indic. 2020, 113, 106260. [Google Scholar] [CrossRef]
- Sun, Y.; Frankenberg, C.; Jung, M.; Joiner, J.; Guanter, L.; Köhler, P.; Magney, T. Overview of Solar-Induced chlorophyll Fluorescence (SIF) from the Orbiting Carbon Observatory-2: Retrieval, cross-mission comparison, and global monitoring for GPP. Remote Sens. Environ. 2018, 209, 808–823. [Google Scholar] [CrossRef]
- Sun, Y.; Fu, R.; Dickinson, R.; Joiner, J.; Frankenberg, C.; Gu, L.; Xia, Y.; Fernando, N. Drought onset mechanisms revealed by satellite solar-induced chlorophyll fluorescence: Insights from two contrasting extreme events. J. Geophys. Res. Biogeosci. 2015, 120, 2427–2440. [Google Scholar] [CrossRef]
- Wang, S.; Huang, C.; Zhang, L.; Lin, Y.; Cen, Y.; Wu, T. Monitoring and assessing the 2012 drought in the great plains: Analyzing satellite-retrieved solar-induced chlorophyll fluorescence, drought indices, and gross primary production. Remote Sens. 2016, 8, 61. [Google Scholar] [CrossRef]
- Yang, X.; Tang, J.; Mustard, J.F.; Lee, J.E.; Rossini, M.; Joiner, J.; Munger, J.W.; Kornfeld, A.; Richardson, A.D. Solar-induced chlorophyll fluorescence that correlates with canopy photosynthesis on diurnal and seasonal scales in a temperate deciduous forest. Geophys. Res. Lett. 2015, 42, 2977–2987. [Google Scholar] [CrossRef]
- Joiner, J.; Yoshida, Y.; Vasilkov, A.; Middleton, E. First observations of global and seasonal terrestrial chlorophyll fluorescence from space. Biogeosciences 2011, 8, 637–651. [Google Scholar] [CrossRef]
- Wen, J.; Köhler, P.; Duveiller, G.; Parazoo, N.; Magney, T.; Hooker, G.; Yu, L.; Chang, C.; Sun, Y. A framework for harmonizing multiple satellite instruments to generate a long-term global high spatial-resolution solar-induced chlorophyll fluorescence (SIF). Remote Sens. Environ. 2020, 239, 111644. [Google Scholar] [CrossRef]
- Hutchinson, M.F.; Xu, T. Anusplin version 4.2 user guide. Cent. Resour. Environ. Stud. Aust. Natl. Univ. Canberra 2004, 54, 17–41. [Google Scholar]
- Mann, H.B. Nonparametric tests against trend. Econom. J. Econom. Soc. 1945, 13, 245–259. [Google Scholar] [CrossRef]
- Sen, P.K. Estimates of the regression coefficient based on Kendall’s tau. J. Am. Stat. Assoc. 1968, 63, 1379–1389. [Google Scholar] [CrossRef]
- Gumus, V.; Simsek, O.; Avsaroglu, Y.; Agun, B. Spatio-temporal trend analysis of drought in the GAP Region, Turkey. Nat. Hazards 2021, 109, 1759–1776. [Google Scholar] [CrossRef]
- Chen, J.; Jönsson, P.; Tamura, M.; Gu, Z.; Matsushita, B.; Eklundh, L. A simple method for reconstructing a high-quality NDVI time-series data set based on the Savitzky–Golay filter. Remote Sens. Environ. 2004, 91, 332–344. [Google Scholar] [CrossRef]
- Dong, T.; Wu, H.; Jiang, P.; Cheng, J.; Erkin, N.; Gu, H.; Li, Y. Monitoring the Vegetation Phenological Characteristics in Meadow Steppe Using Solar-Induced Chlorophyll Fluorescence. Fresenius Environ. Bull. 2021, 30, 5320–5331. [Google Scholar]
- Matongera, T.N.; Mutanga, O.; Sibanda, M.; Odindi, J. Estimating and Monitoring Land Surface Phenology in Rangelands: A Review of Progress and Challenges. Remote Sens. 2021, 13, 2060. [Google Scholar] [CrossRef]
- Luo, Z.; Yu, S. Spatiotemporal Variability of Land Surface Phenology in China from 2001–2014. Remote Sens. 2017, 9, 65. [Google Scholar] [CrossRef]
- Jonsson, P.; Eklundh, L. Seasonality extraction by function fitting to time-series of satellite sensor data. IEEE Trans. Geosci. Remote Sens. 2002, 40, 1824–1832. [Google Scholar] [CrossRef]
- Tian, F.; Cai, Z.; Jin, H.; Hufkens, K.; Scheifinger, H.; Tagesson, T.; Smets, B.; Van Hoolst, R.; Bonte, K.; Ivits, E.; et al. Calibrating vegetation phenology from Sentinel-2 using eddy covariance, PhenoCam, and PEP725 networks across Europe. Remote Sens. Environ. 2021, 260, 112456. [Google Scholar] [CrossRef]
- Cui, T.; Martz, L.; Zhao, L.; Guo, X. Investigating the impact of the temporal resolution of MODIS data on measured phenology in the prairie grasslands. GIScience Remote Sens. 2020, 57, 395–410. [Google Scholar] [CrossRef]
- Stocker, T. Climate Change 2013: The Physical Science Basis: Working Group I Contribution to the Fifth Assessment Report of the Intergovernmental Panel on Climate Change; Cambridge University Press: Cambridge, UK, 2014; pp. 1–1537. [Google Scholar]
- Du, Q.; Zhang, M.; Wang, S.; Che, C.; Ma, R.; Ma, Z. Changes in air temperature over China in response to the recent global warming hiatus. J. Geogr. Sci. 2019, 29, 496–516. [Google Scholar] [CrossRef]
- Zhang, M.; Cao, Y.; Zhang, Z.; Zhang, X.; Liu, L.; Chen, H.; Gao, Y.; Yu, F.; Liu, X. Spatiotemporal variation of land surface temperature and its driving factors in Xinjiang, China. J. Arid. Land. 2024, 16, 373–395. [Google Scholar] [CrossRef]
- García-García, A.; Cuesta-Valero, F.J.; Beltrami, H.; Smerdon, J.E. Characterization of Air and Ground Temperature Relationships within the CMIP5 Historical and Future Climate Simulations. J. Geophys. Res. Atmos. 2019, 124, 3903–3929. [Google Scholar] [CrossRef]
- Yang, Y.; Lin, Z.; Luo, L.; Zhong, L.; Jiang, D. Variation of Surface Air Temperature Induced by Enhanced Land–Atmosphere Coupling During 1981–2020 in Xinjiang, Northwest China. J. Geophys. Res. Atmos. 2023, 128, e2022JD037983. [Google Scholar] [CrossRef]
- Zhang, L.; Liu, Y.; Zhan, H.; Jin, M.; Liang, X. Influence of solar activity and EI Niño-Southern Oscillation on precipitation extremes, streamflow variability and flooding events in an arid-semiarid region of China. J. Hydrol. 2021, 601, 126630. [Google Scholar] [CrossRef]
- Chi, H.; Wu, Y.; Zheng, H.; Zhang, B.; Sun, Z.; Yan, J.; Ren, Y.; Guo, L. Spatial patterns of climate change and associated climate hazards in Northwest China. Sci. Rep. 2023, 13, 10418. [Google Scholar] [CrossRef] [PubMed]
- Xiong, J.; Wang, Z.; Lai, C.; Liao, Y.; Wu, X. Spatiotemporal variability of sunshine duration and influential climatic factors in mainland China during 1959–2017. Int. J. Climatol. 2020, 40, 6282–6300. [Google Scholar] [CrossRef]
- Wu, X.; Zhang, C.; Dong, S.; Hu, J.; Tong, X.; Zheng, X. Spatiotemporal changes of the aridity index in Xinjiang over the past 60 years. Environ. Earth Sci. 2023, 82, 392. [Google Scholar] [CrossRef]
- Xu, C.; Li, J.; Zhao, J.; Gao, S.; Chen, Y. Climate variations in northern Xinjiang of China over the past 50 years under global warming. Quat. Int. 2015, 358, 83–92. [Google Scholar] [CrossRef]
- Dong, T.; Liu, J.; Liu, D.; He, P.; Li, Z.; Shi, M.; Xu, J. Spatiotemporal variability characteristics of extreme climate events in Xinjiang during 1960–2019. Environ. Sci. Pollut. Res. 2023, 30, 57316–57330. [Google Scholar] [CrossRef]
- Yu, F.; Price, K.P.; Ellis, J.; Shi, P. Response of seasonal vegetation development to climatic variations in eastern central Asia. Remote Sens. Environ. 2003, 87, 42–54. [Google Scholar] [CrossRef]
- Ren, S.; Yi, S.; Peichl, M.; Wang, X. Diverse responses of vegetation phenology to climate change in different grasslands in Inner Mongolia during 2000–2016. Remote Sens. 2017, 10, 17. [Google Scholar] [CrossRef]
- Zhang, R.; Liang, T.; Feng, Q.; Huang, X.; Wang, W.; Xie, H.; Guo, J. Evaluation and adjustment of the AMSR2 snow depth algorithm for the Northern Xinjiang Region, China. IEEE J. Sel. Top. Appl. Earth Obs. Remote Sens. 2016, 10, 3892–3903. [Google Scholar] [CrossRef]
- Wei, X.; Xu, M.; Zhao, H.; Liu, X.; Guo, Z.; Li, X.; Zha, T. Exploring Sensitivity of Phenology to Seasonal Climate Differences in Temperate Grasslands of China Based on Normalized Difference Vegetation Index. Land 2024, 13, 399. [Google Scholar] [CrossRef]
- Cong, N.; Shen, M.; Piao, S. Spatial variations in responses of vegetation autumn phenology to climate change on the Tibetan Plateau. J. Plant Ecol. 2016, 10, 744–752. [Google Scholar] [CrossRef]
- Yu, H.; Luedeling, E.; Xu, J. Winter and spring warming result in delayed spring phenology on the Tibetan Plateau. Proc. Natl. Acad. Sci. USA 2010, 107, 22151–22156. [Google Scholar] [CrossRef] [PubMed]
- Rihan, W.; Zhao, J.; Zhang, H.; Guo, X. Preseason drought controls on patterns of spring phenology in grasslands of the Mongolian Plateau. Sci. Total Environ. 2022, 838, 156018. [Google Scholar] [CrossRef]
- Piao, S.; Fang, J.; Zhou, L.; Ciais, P.; Zhu, B. Variations in satellite-derived phenology in China’s temperate vegetation. Glob. Chang. Biol. 2006, 12, 672–685. [Google Scholar] [CrossRef]
Figure 1.
Distribution of (a) meteorological stations and (b) grassland types in Xinjiang.
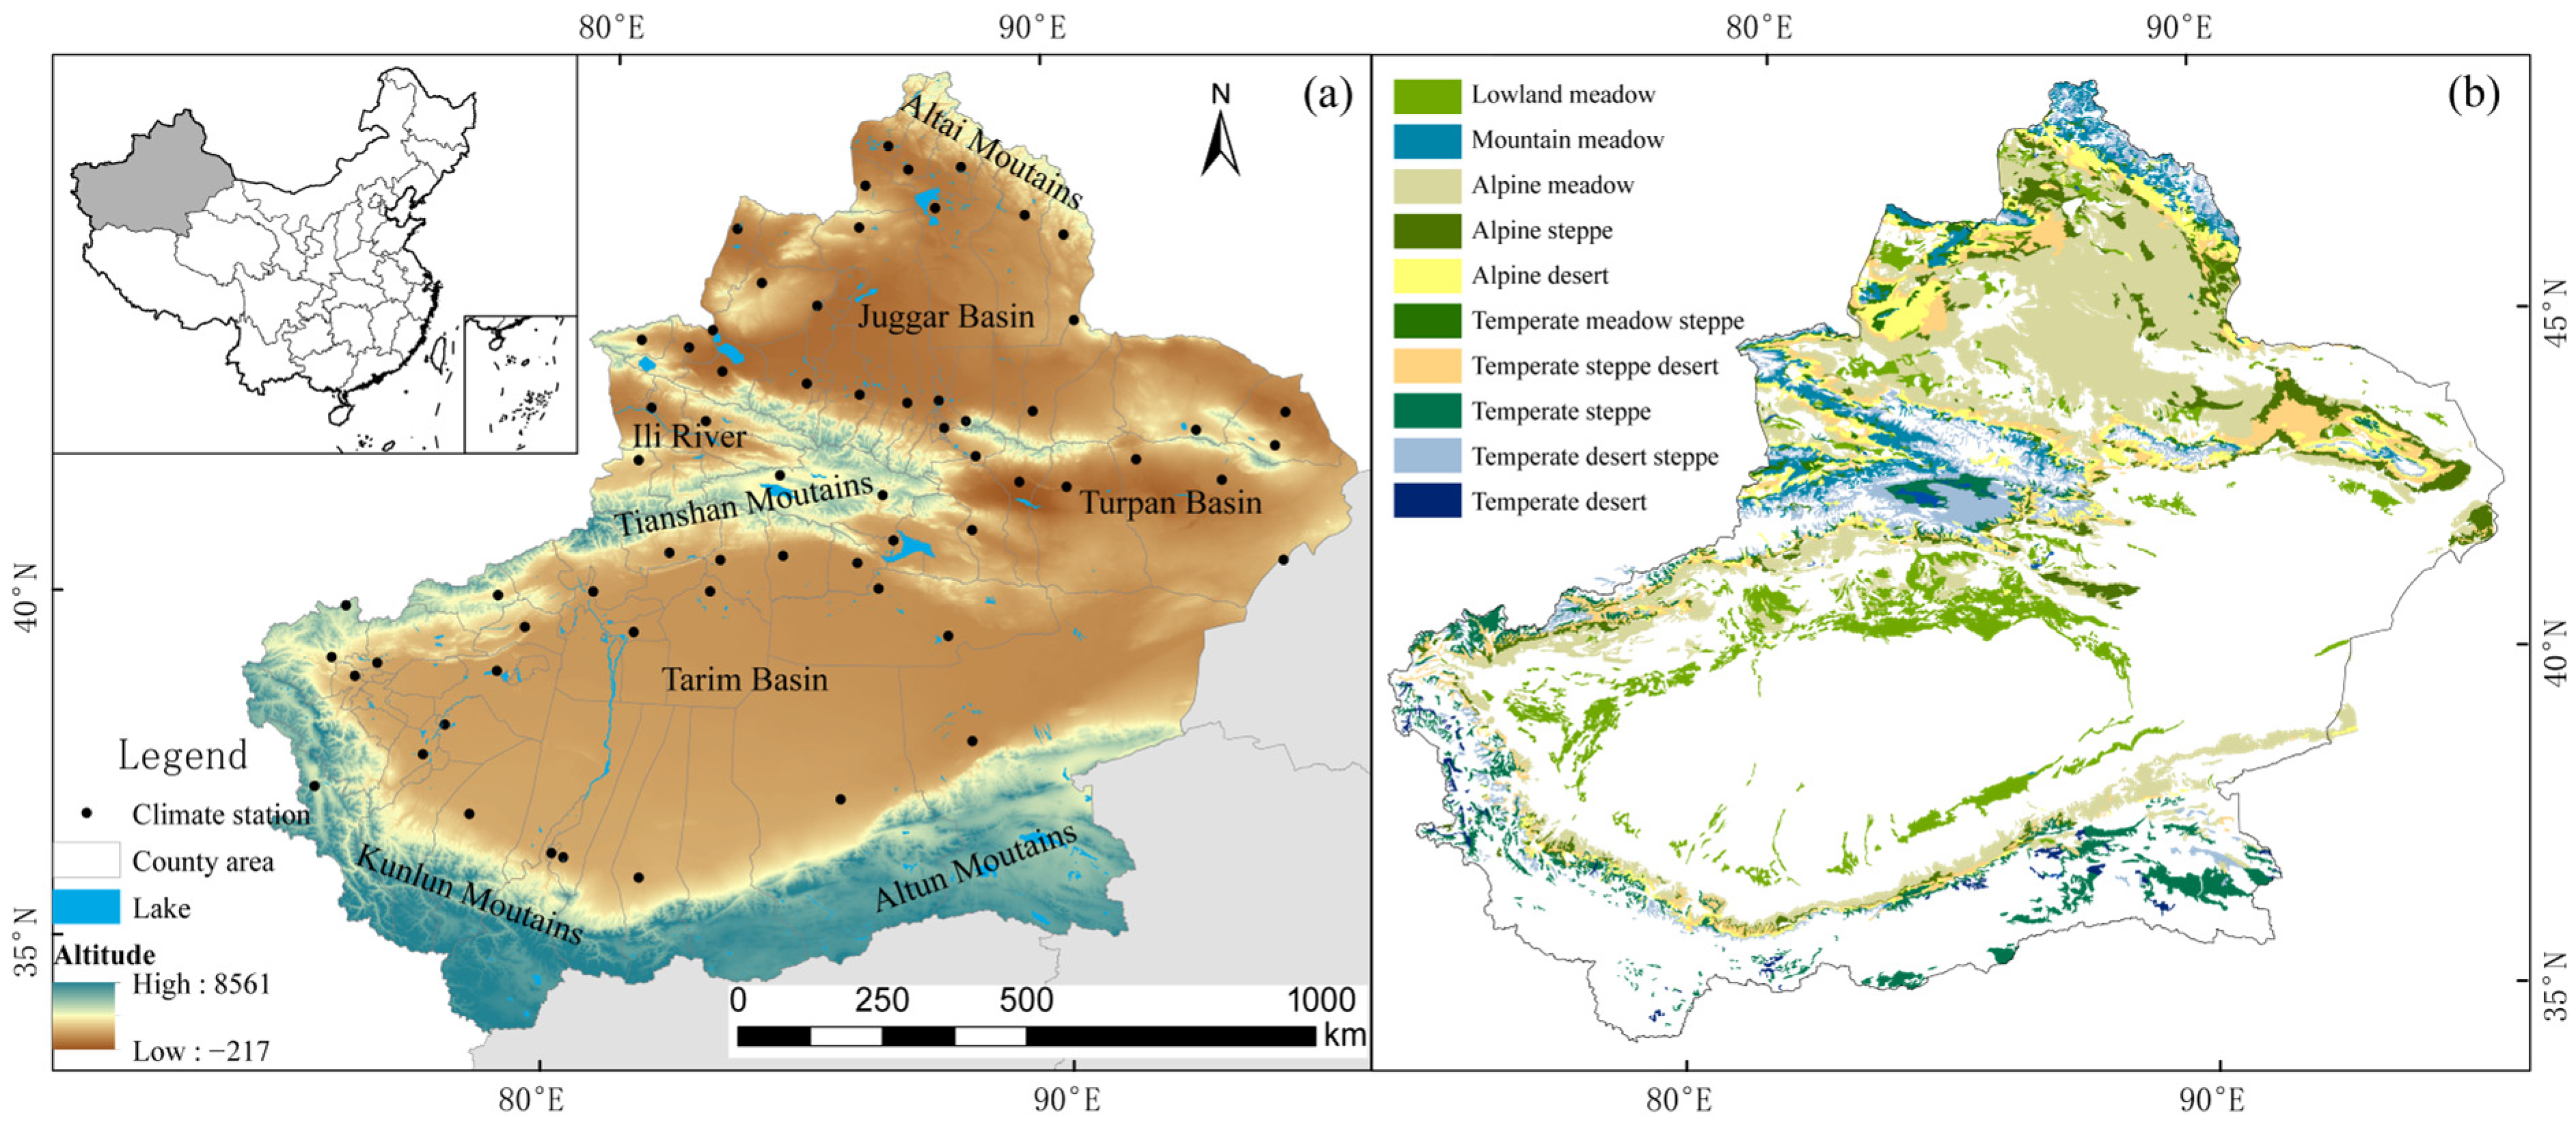
Figure 2.
Spatial variation in seasonal climate in Xinjiang during 2000–2019.

Figure 3.
Spatial trends of seasonal climate in Xinjiang during 2000–2019.
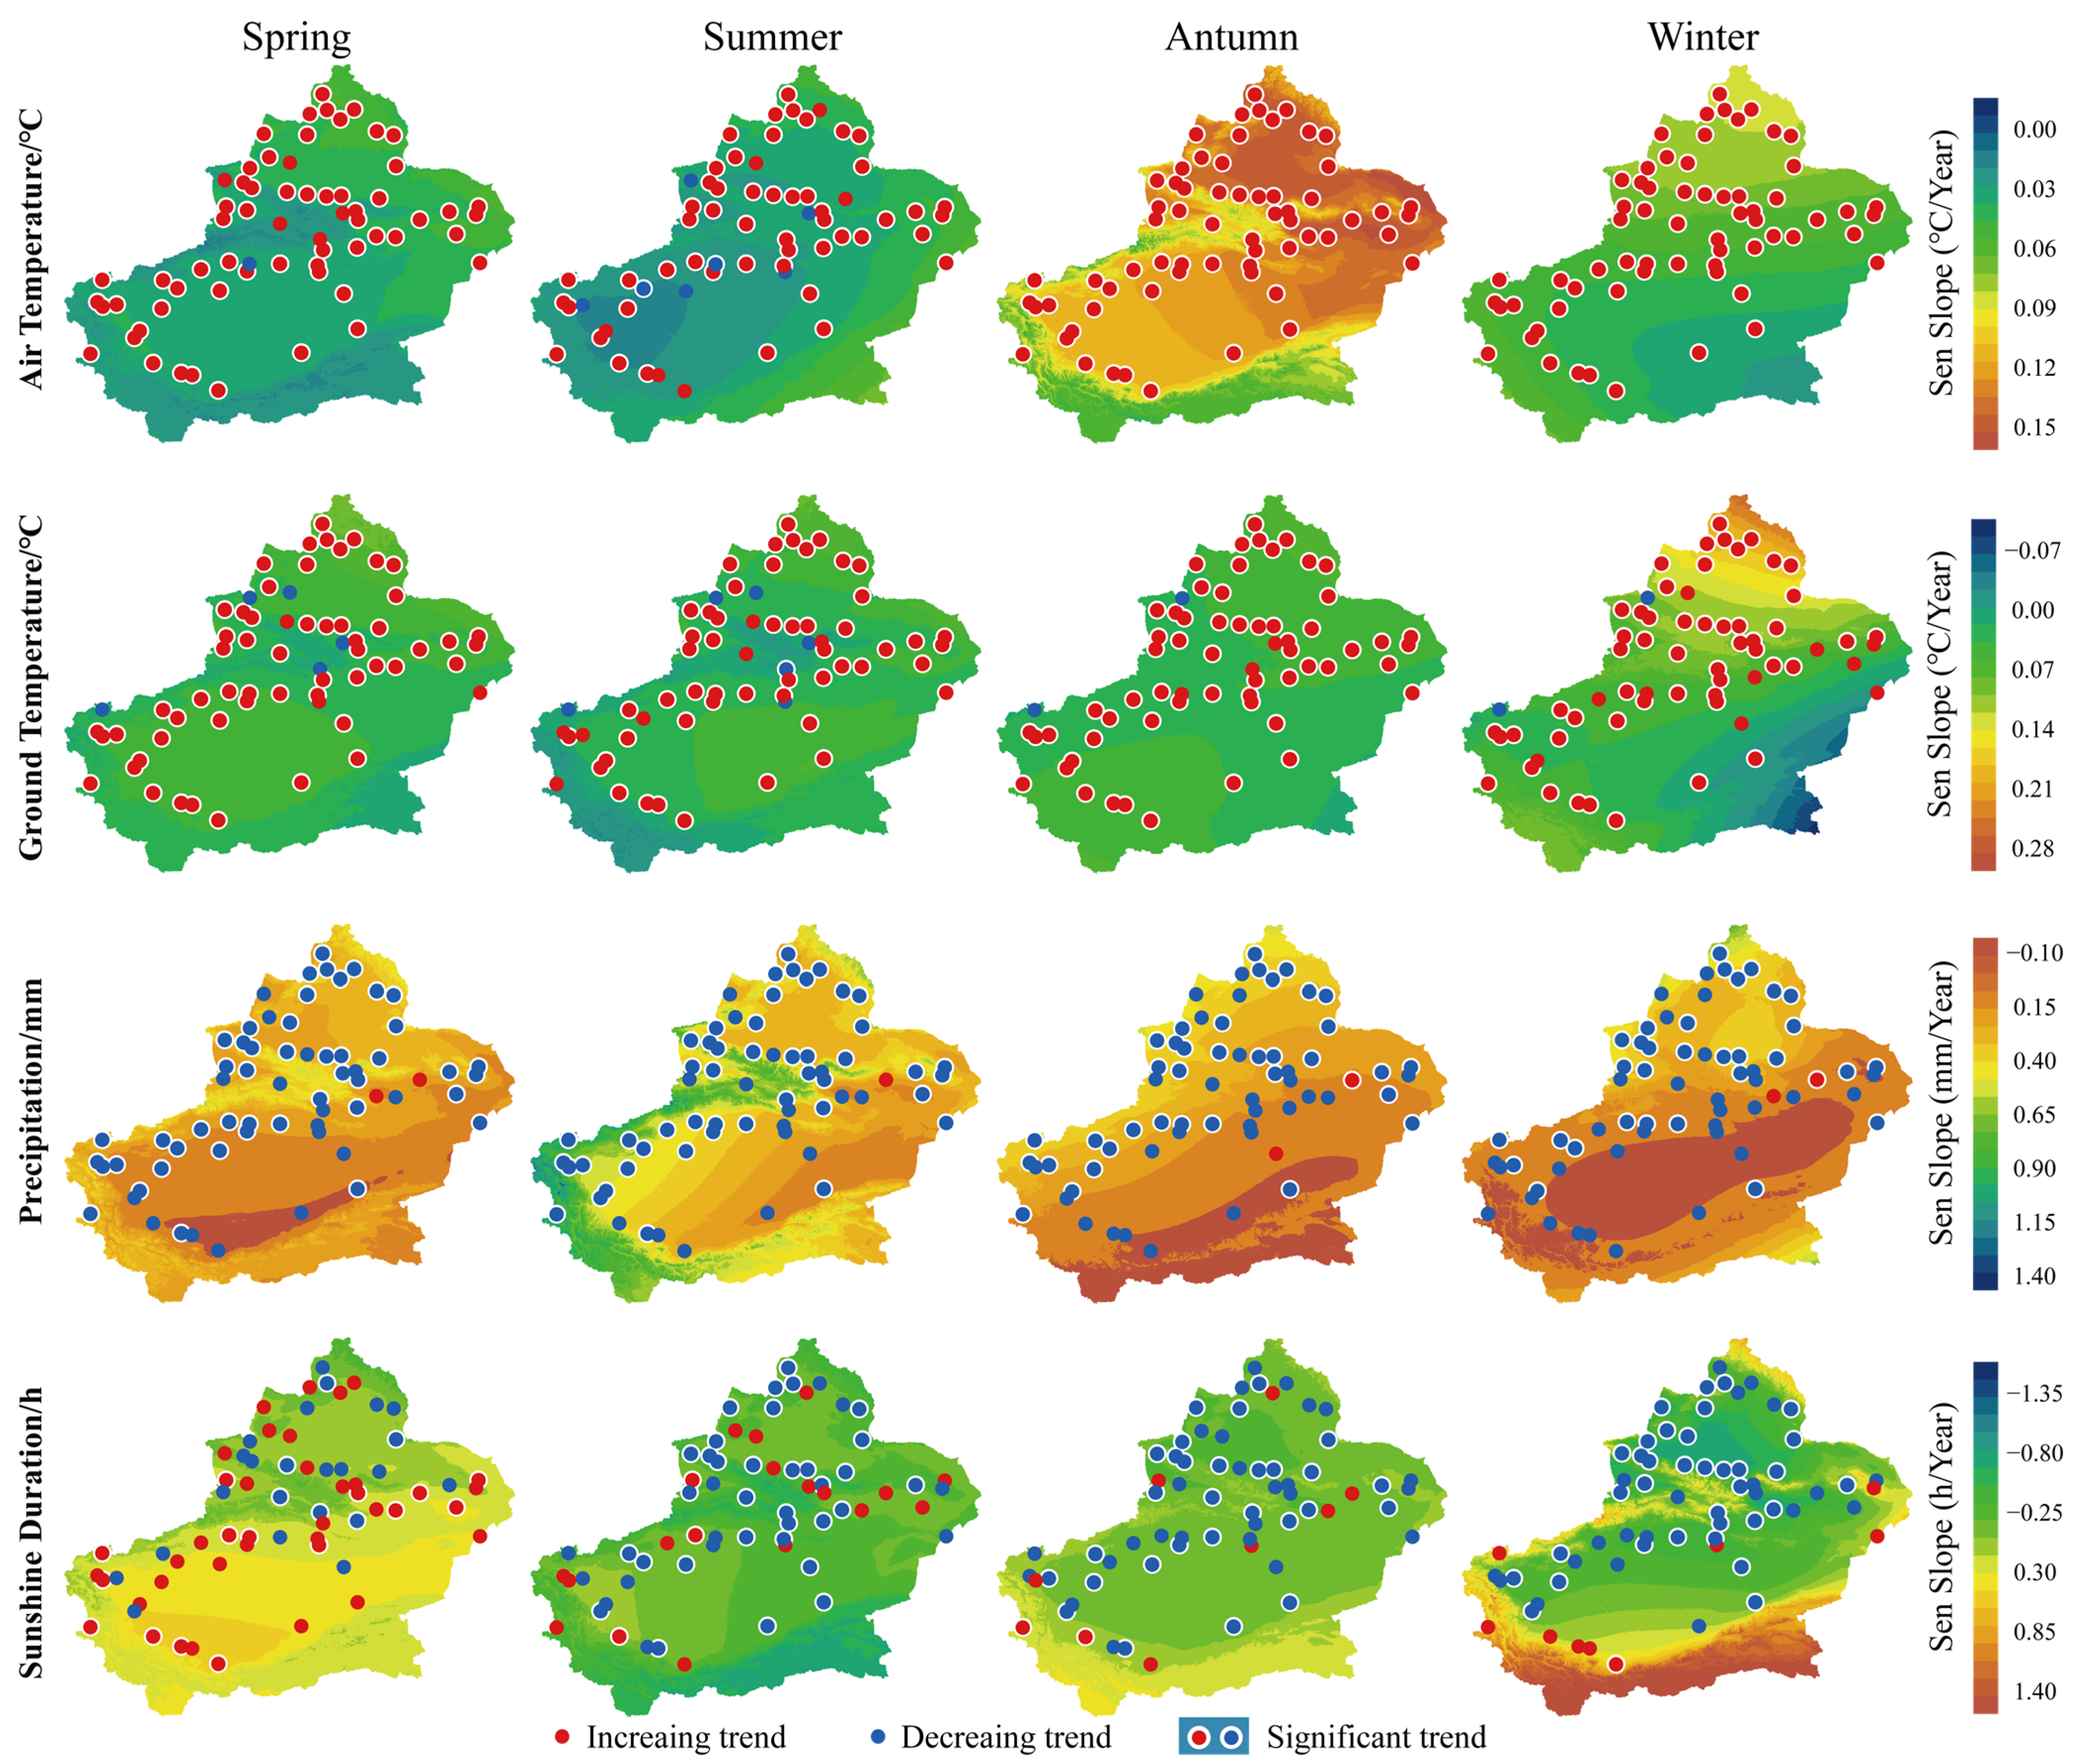
Figure 4.
Spatial distribution patterns of the average and standard deviation of grasslands SOS, EOS, and LOS in Xinjiang by GOME-2.
Figure 4.
Spatial distribution patterns of the average and standard deviation of grasslands SOS, EOS, and LOS in Xinjiang by GOME-2.

Figure 5.
Theil–Sen trend and Mann–Kendall test analyses of grassland vegetation phenology from 2000 to 2019. (a) SOS; (b) EOS; and (c) LOS. Black dots indicate p < 0.05.
Figure 5.
Theil–Sen trend and Mann–Kendall test analyses of grassland vegetation phenology from 2000 to 2019. (a) SOS; (b) EOS; and (c) LOS. Black dots indicate p < 0.05.
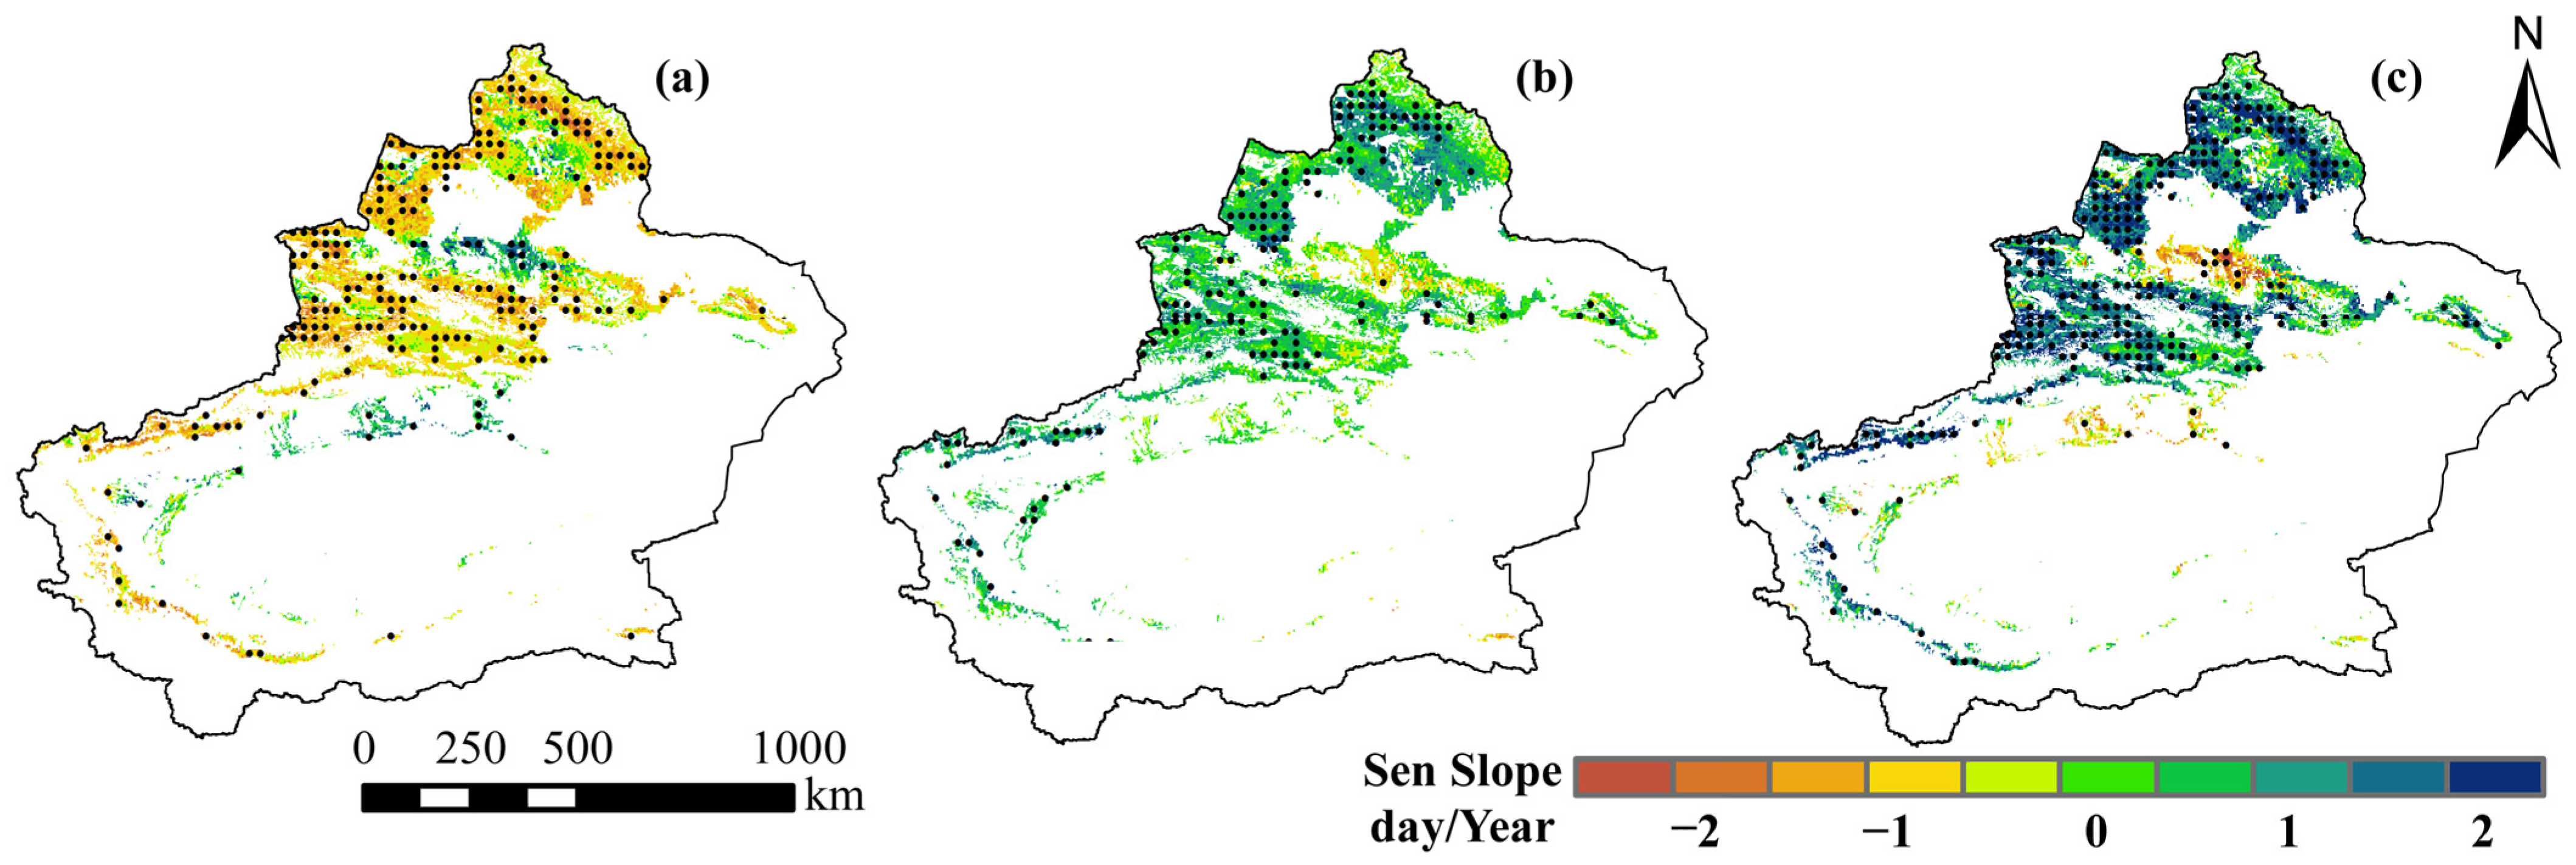
Figure 6.
Phenological metrics for different grassland types in Xinjiang: Mean values and trends of SOS (a,b), EOS (c,d), and LOS (e,f). Different colors represent various grassland types.
Figure 6.
Phenological metrics for different grassland types in Xinjiang: Mean values and trends of SOS (a,b), EOS (c,d), and LOS (e,f). Different colors represent various grassland types.
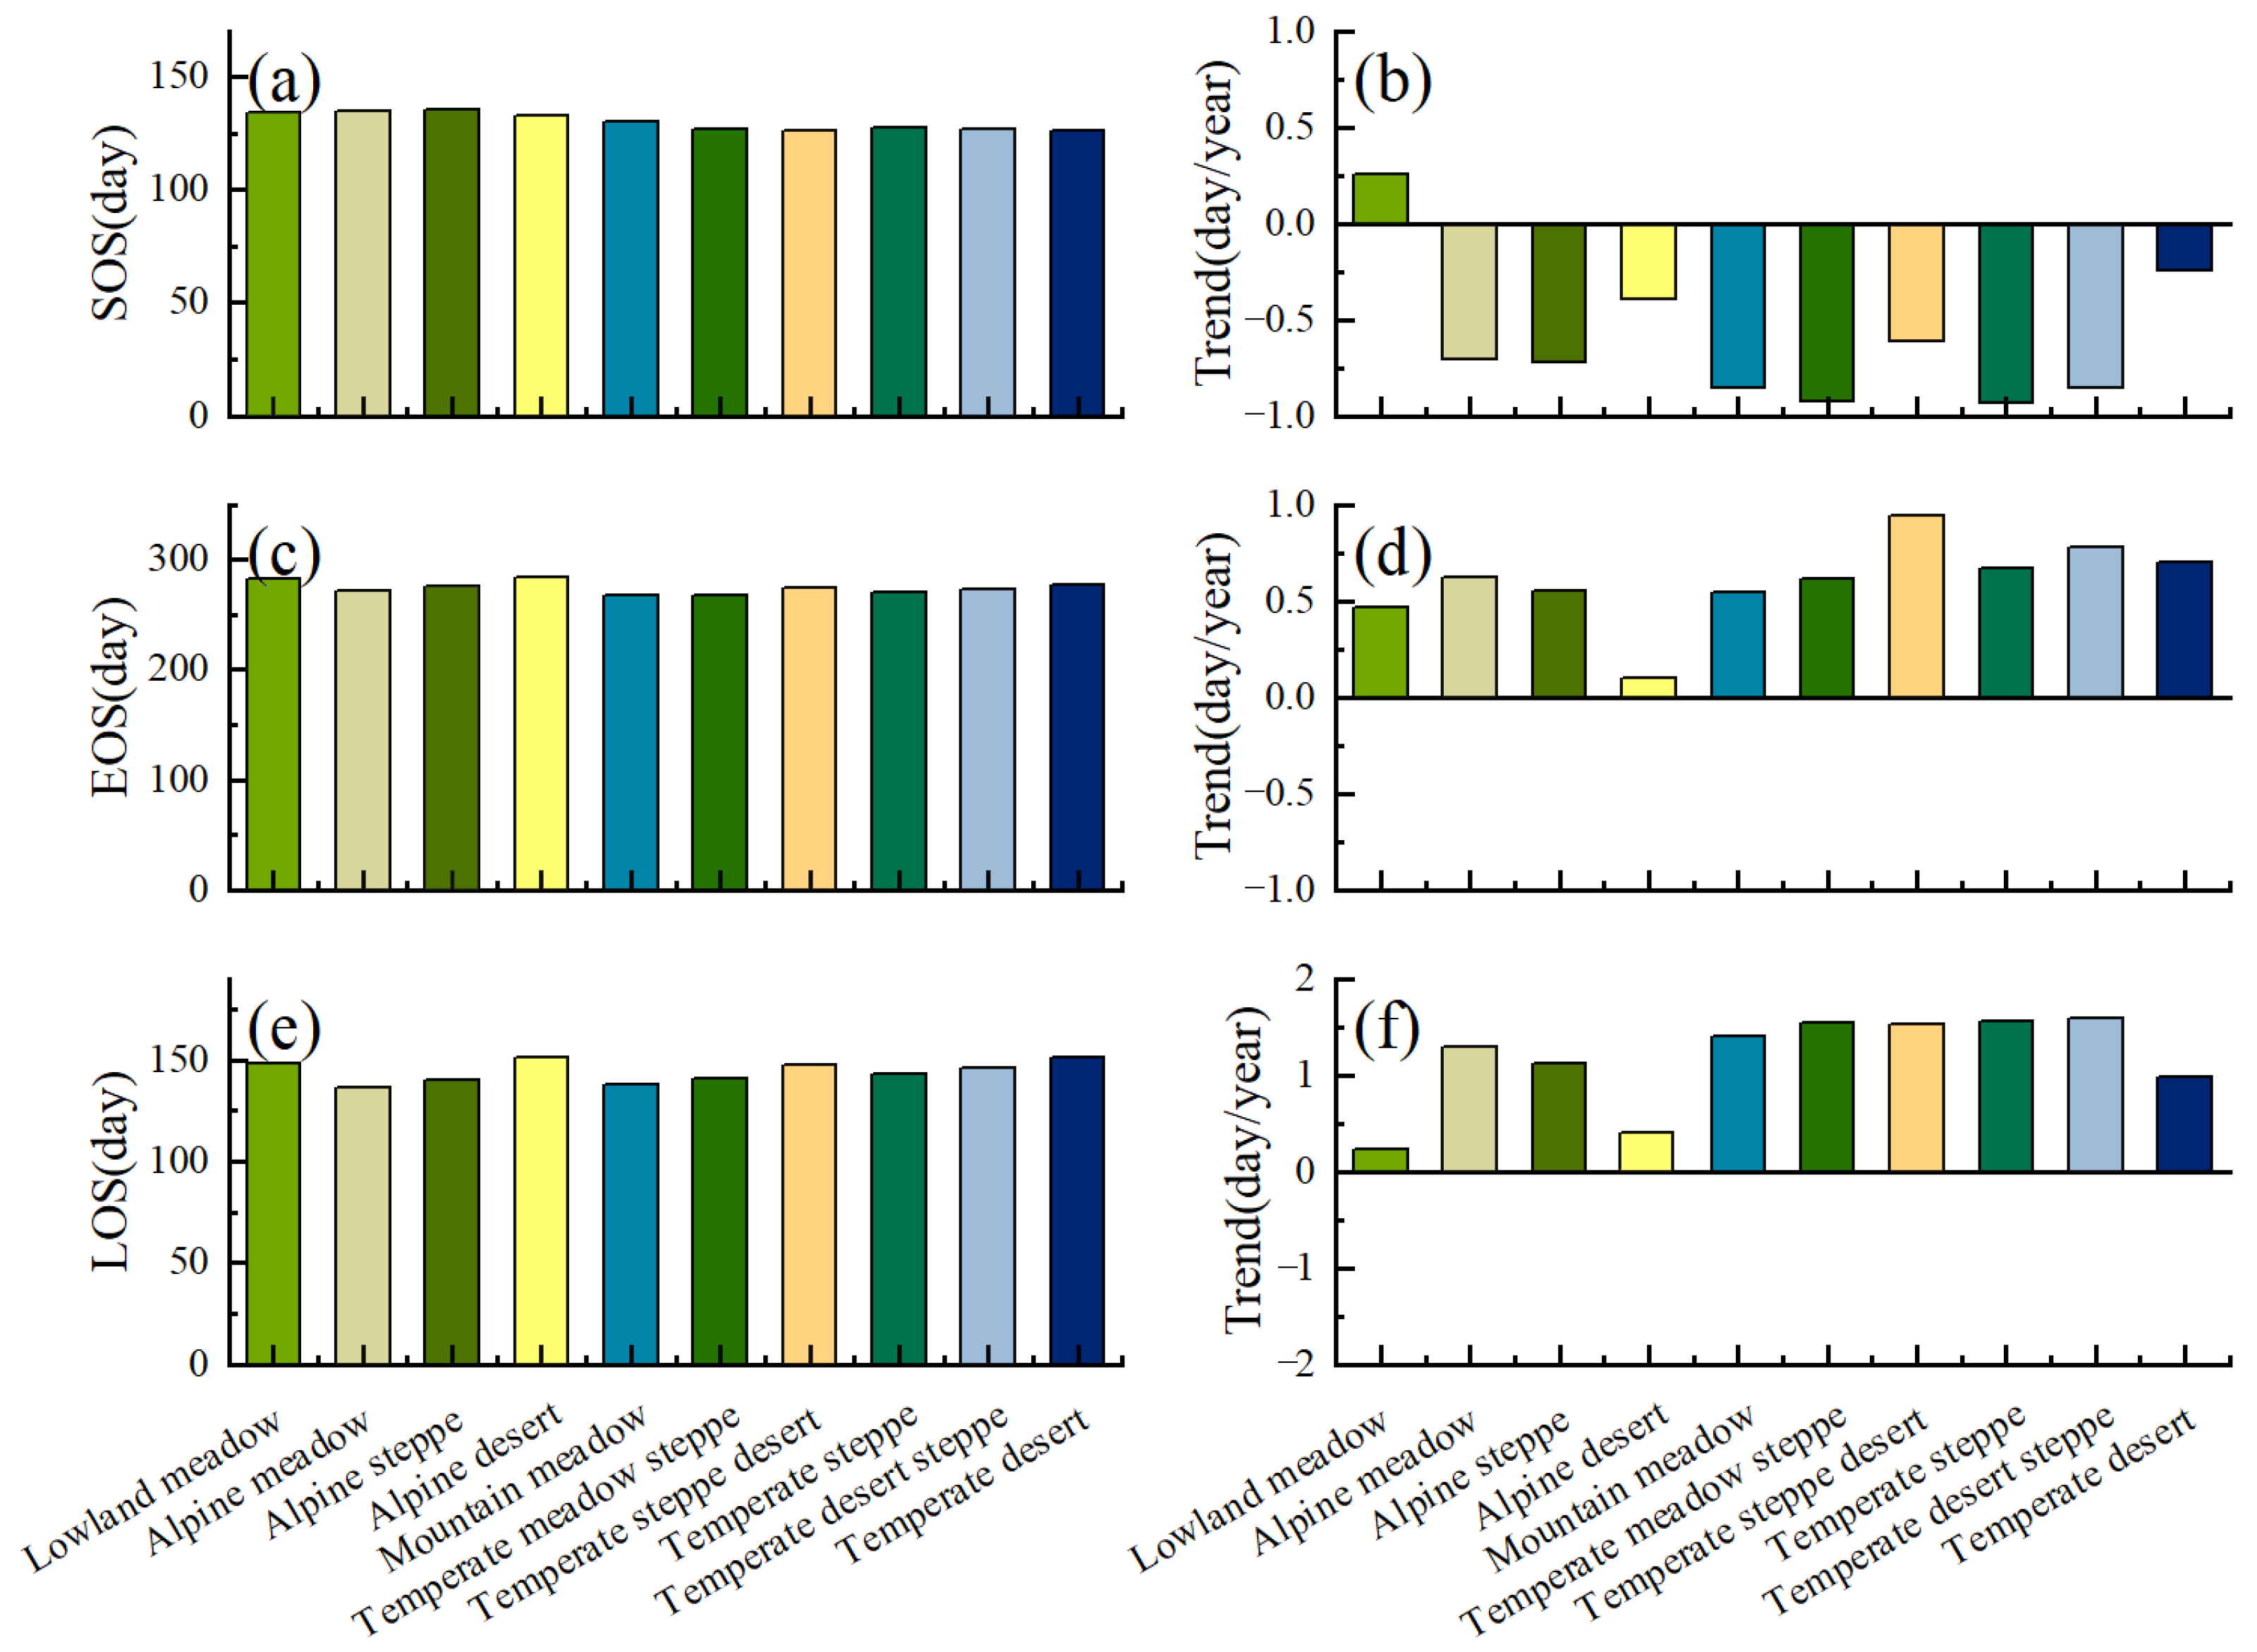
Figure 7.
Spatial distribution of correlation coefficients between seasonal climate and SOS. The percentages of positive (P) and negative (N) correlations are shown at the top of each submap.
Figure 7.
Spatial distribution of correlation coefficients between seasonal climate and SOS. The percentages of positive (P) and negative (N) correlations are shown at the top of each submap.

Figure 8.
Spatial distribution of correlation coefficients between seasonal climate and EOS. The percentages of positive (P) and negative (N) correlations are shown at the top of each submap.
Figure 8.
Spatial distribution of correlation coefficients between seasonal climate and EOS. The percentages of positive (P) and negative (N) correlations are shown at the top of each submap.
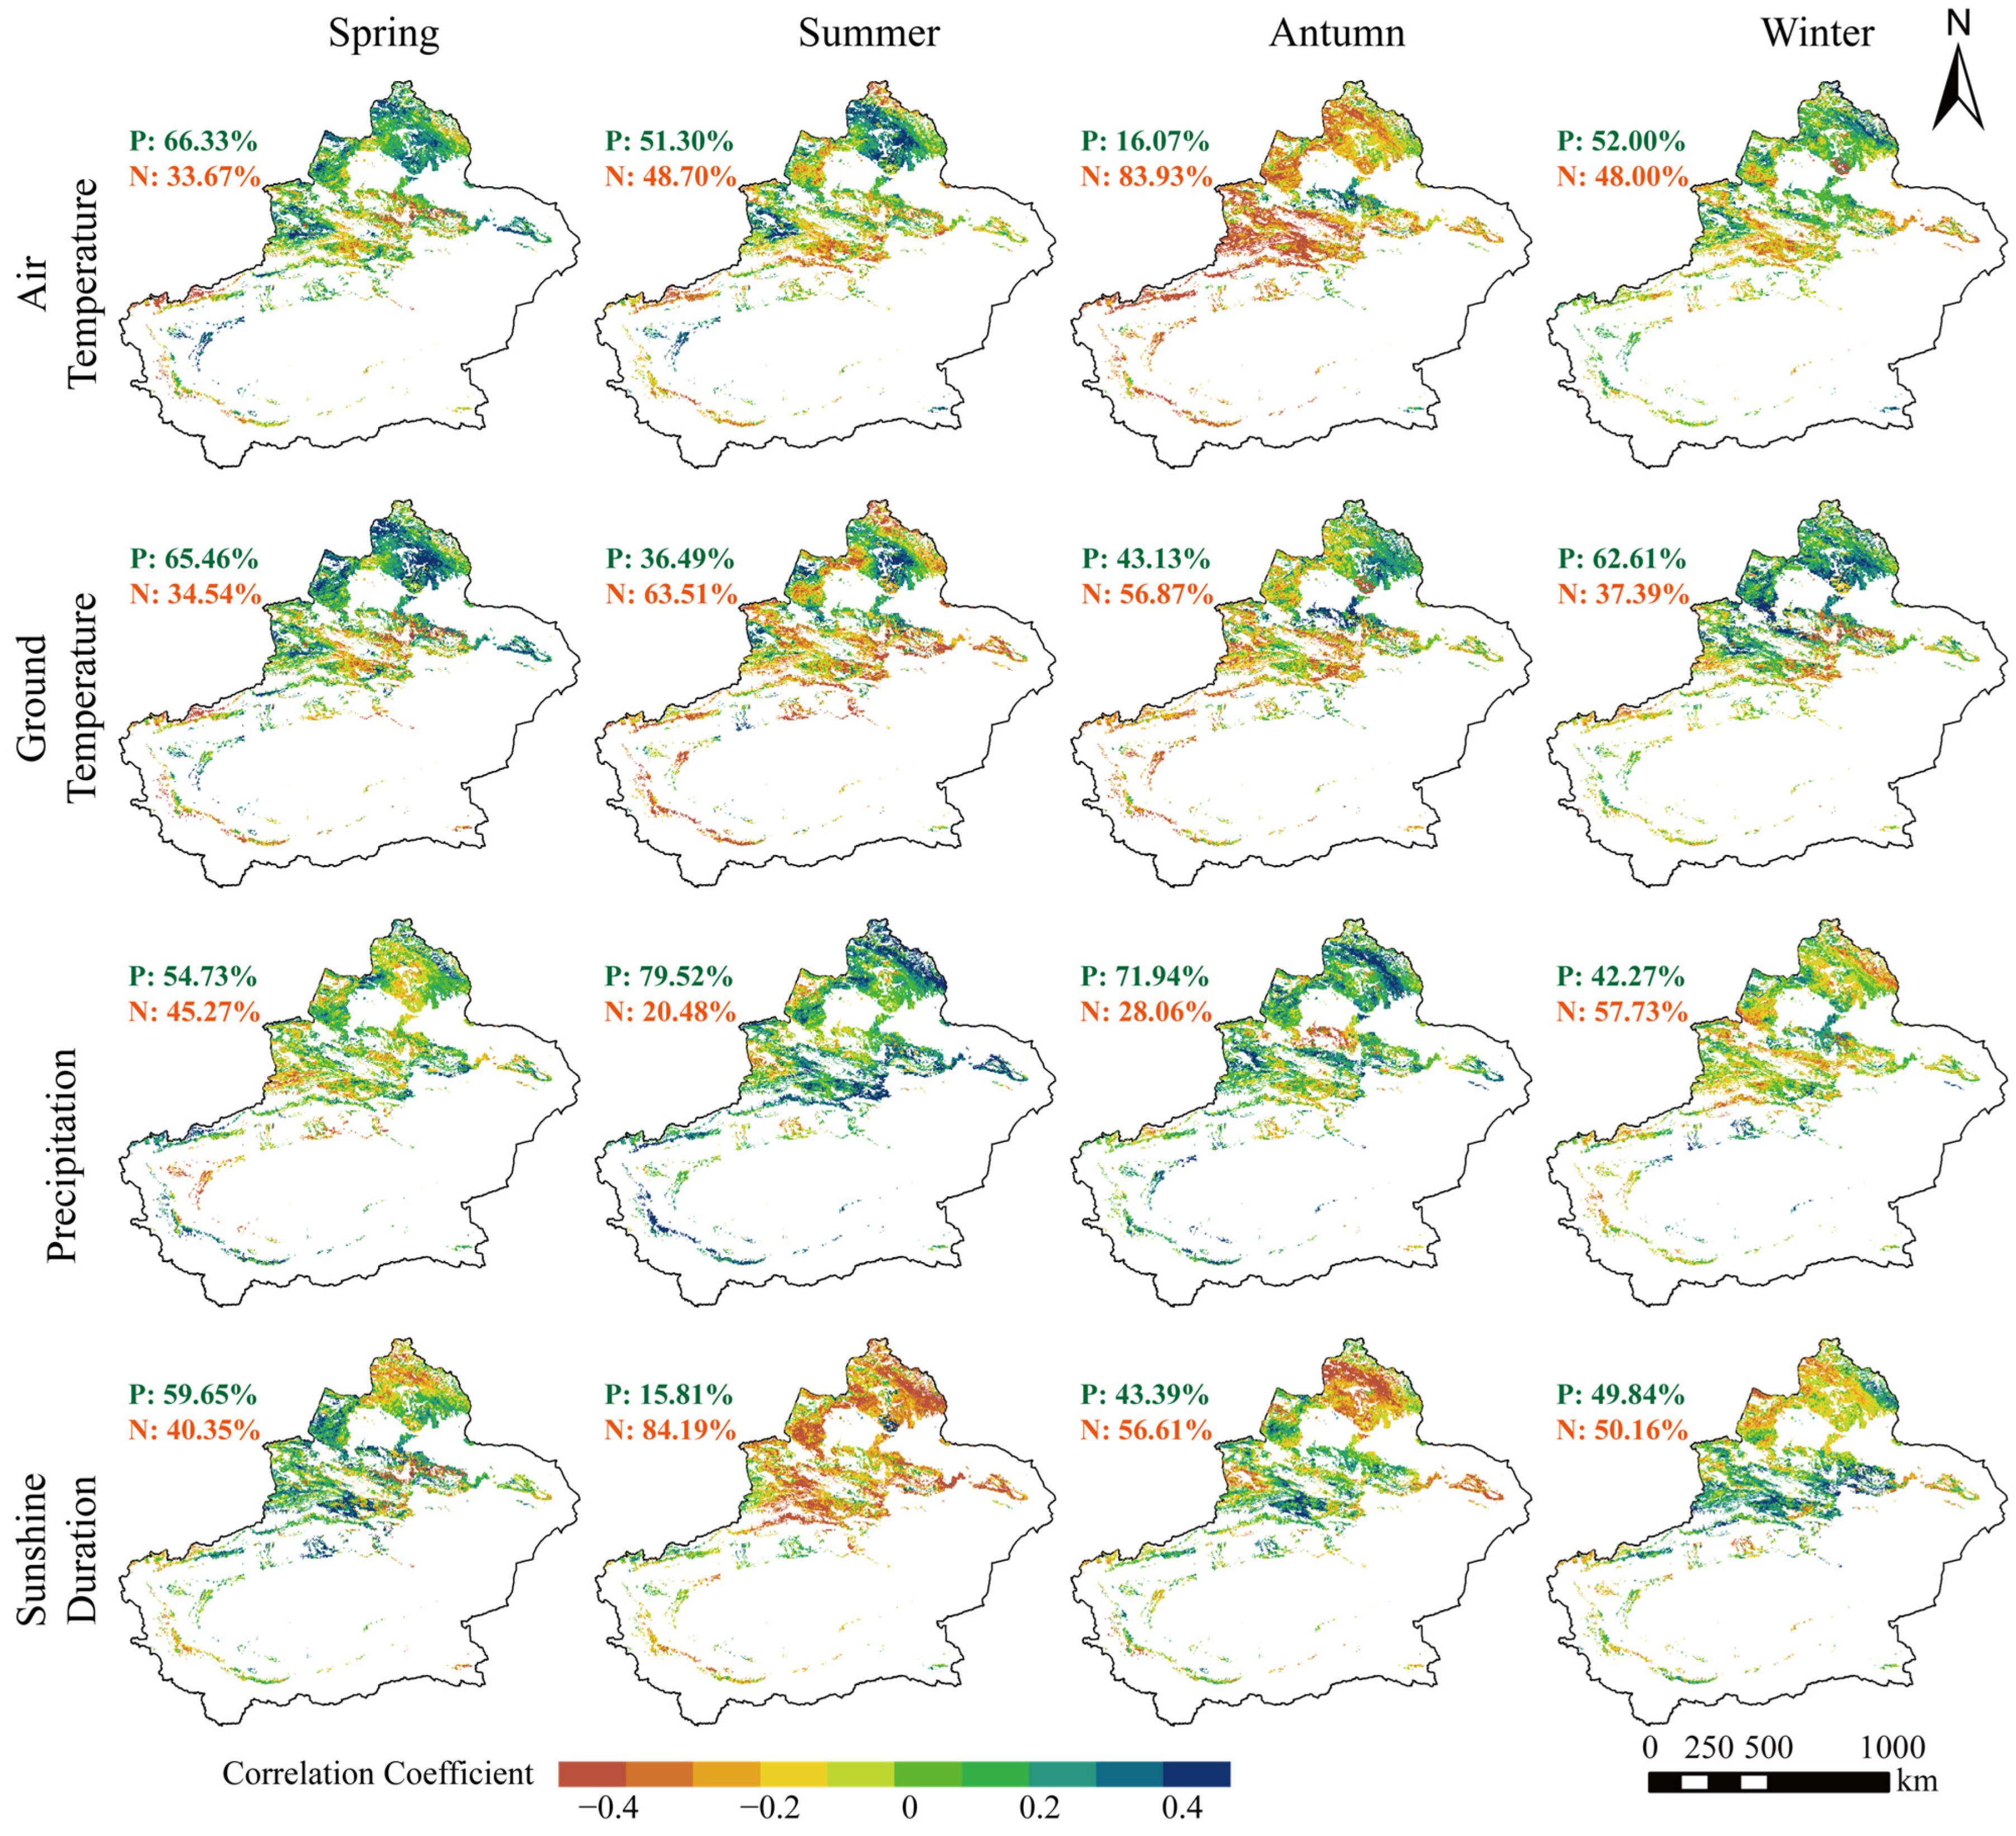
Figure 9.
Spatial distribution of correlation coefficients between seasonal climate and LOS. The percentages of positive (P) and negative (N) correlations are shown at the top of each submap.
Figure 9.
Spatial distribution of correlation coefficients between seasonal climate and LOS. The percentages of positive (P) and negative (N) correlations are shown at the top of each submap.

Table 1.
Phenological mean values and trends of different grassland types in Xinjiang.
| Grassland Types | SOS | EOS | LOS | Slope of SOS | Slope of EOS | Slope of LOS |
|---|---|---|---|---|---|---|
| Lowland meadow | 134 | 282 | 148 | 0.26 | 0.46 | 0.24 |
| Mountain meadow | 130 | 268 | 138 | −0.85 | 0.54 | 1.40 |
| Alpine meadow | 135 | 272 | 136 | −0.71 | 0.63 | 1.29 |
| Alpine steppe | 136 | 275 | 140 | −0.72 | 0.55 | 1.12 |
| Alpine desert | 133 | 284 | 151 | −0.40 | 0.10 | 0.47 |
| Temperate meadow steppe | 127 | 268 | 141 | −0.93 | 0.62 | 1.54 |
| Temperate steppe desert | 126 | 274 | 147 | −0.61 | 0.94 | 1.52 |
| Temperate steppe | 128 | 271 | 143 | −0.93 | 0.67 | 1.55 |
| Temperate desert steppe | 127 | 273 | 146 | −0.85 | 0.78 | 1.59 |
| Temperate desert | 126 | 277 | 151 | −0.24 | 0.70 | 0.98 |
Disclaimer/Publisher’s Note: The statements, opinions and data contained in all publications are solely those of the individual author(s) and contributor(s) and not of MDPI and/or the editor(s). MDPI and/or the editor(s) disclaim responsibility for any injury to people or property resulting from any ideas, methods, instructions or products referred to in the content. |
© 2024 by the authors. Licensee MDPI, Basel, Switzerland. This article is an open access article distributed under the terms and conditions of the Creative Commons Attribution (CC BY) license (https://creativecommons.org/licenses/by/4.0/).
Share and Cite
MDPI and ACS Style
Dong, T.; Liu, J.; Shi, M.; He, P.; Li, P.; Liu, D. Seasonal Scale Climatic Factors on Grassland Phenology in Arid and Semi-Arid Zones. Land 2024, 13, 653. https://doi.org/10.3390/land13050653
AMA Style
Dong T, Liu J, Shi M, He P, Li P, Liu D. Seasonal Scale Climatic Factors on Grassland Phenology in Arid and Semi-Arid Zones. Land. 2024; 13(5):653. https://doi.org/10.3390/land13050653
Chicago/Turabian StyleDong, Tong, Jing Liu, Mingjie Shi, Panxing He, Ping Li, and Dahai Liu. 2024. "Seasonal Scale Climatic Factors on Grassland Phenology in Arid and Semi-Arid Zones" Land 13, no. 5: 653. https://doi.org/10.3390/land13050653
Note that from the first issue of 2016, this journal uses article numbers instead of page numbers. See further details here.