
Green Transition Assessment, Spatial Correlation, and Obstacles Identification: Evidence from Urban Governance Data of 288 Cities in China
 ,
,
Abstract
:1. Introduction
2. Literature Review
2.1. DPSIR Framework
2.2. TOPSIS Model with Entropy Weight
2.3. Studies in China’s Industrial Transformation and Green Transition
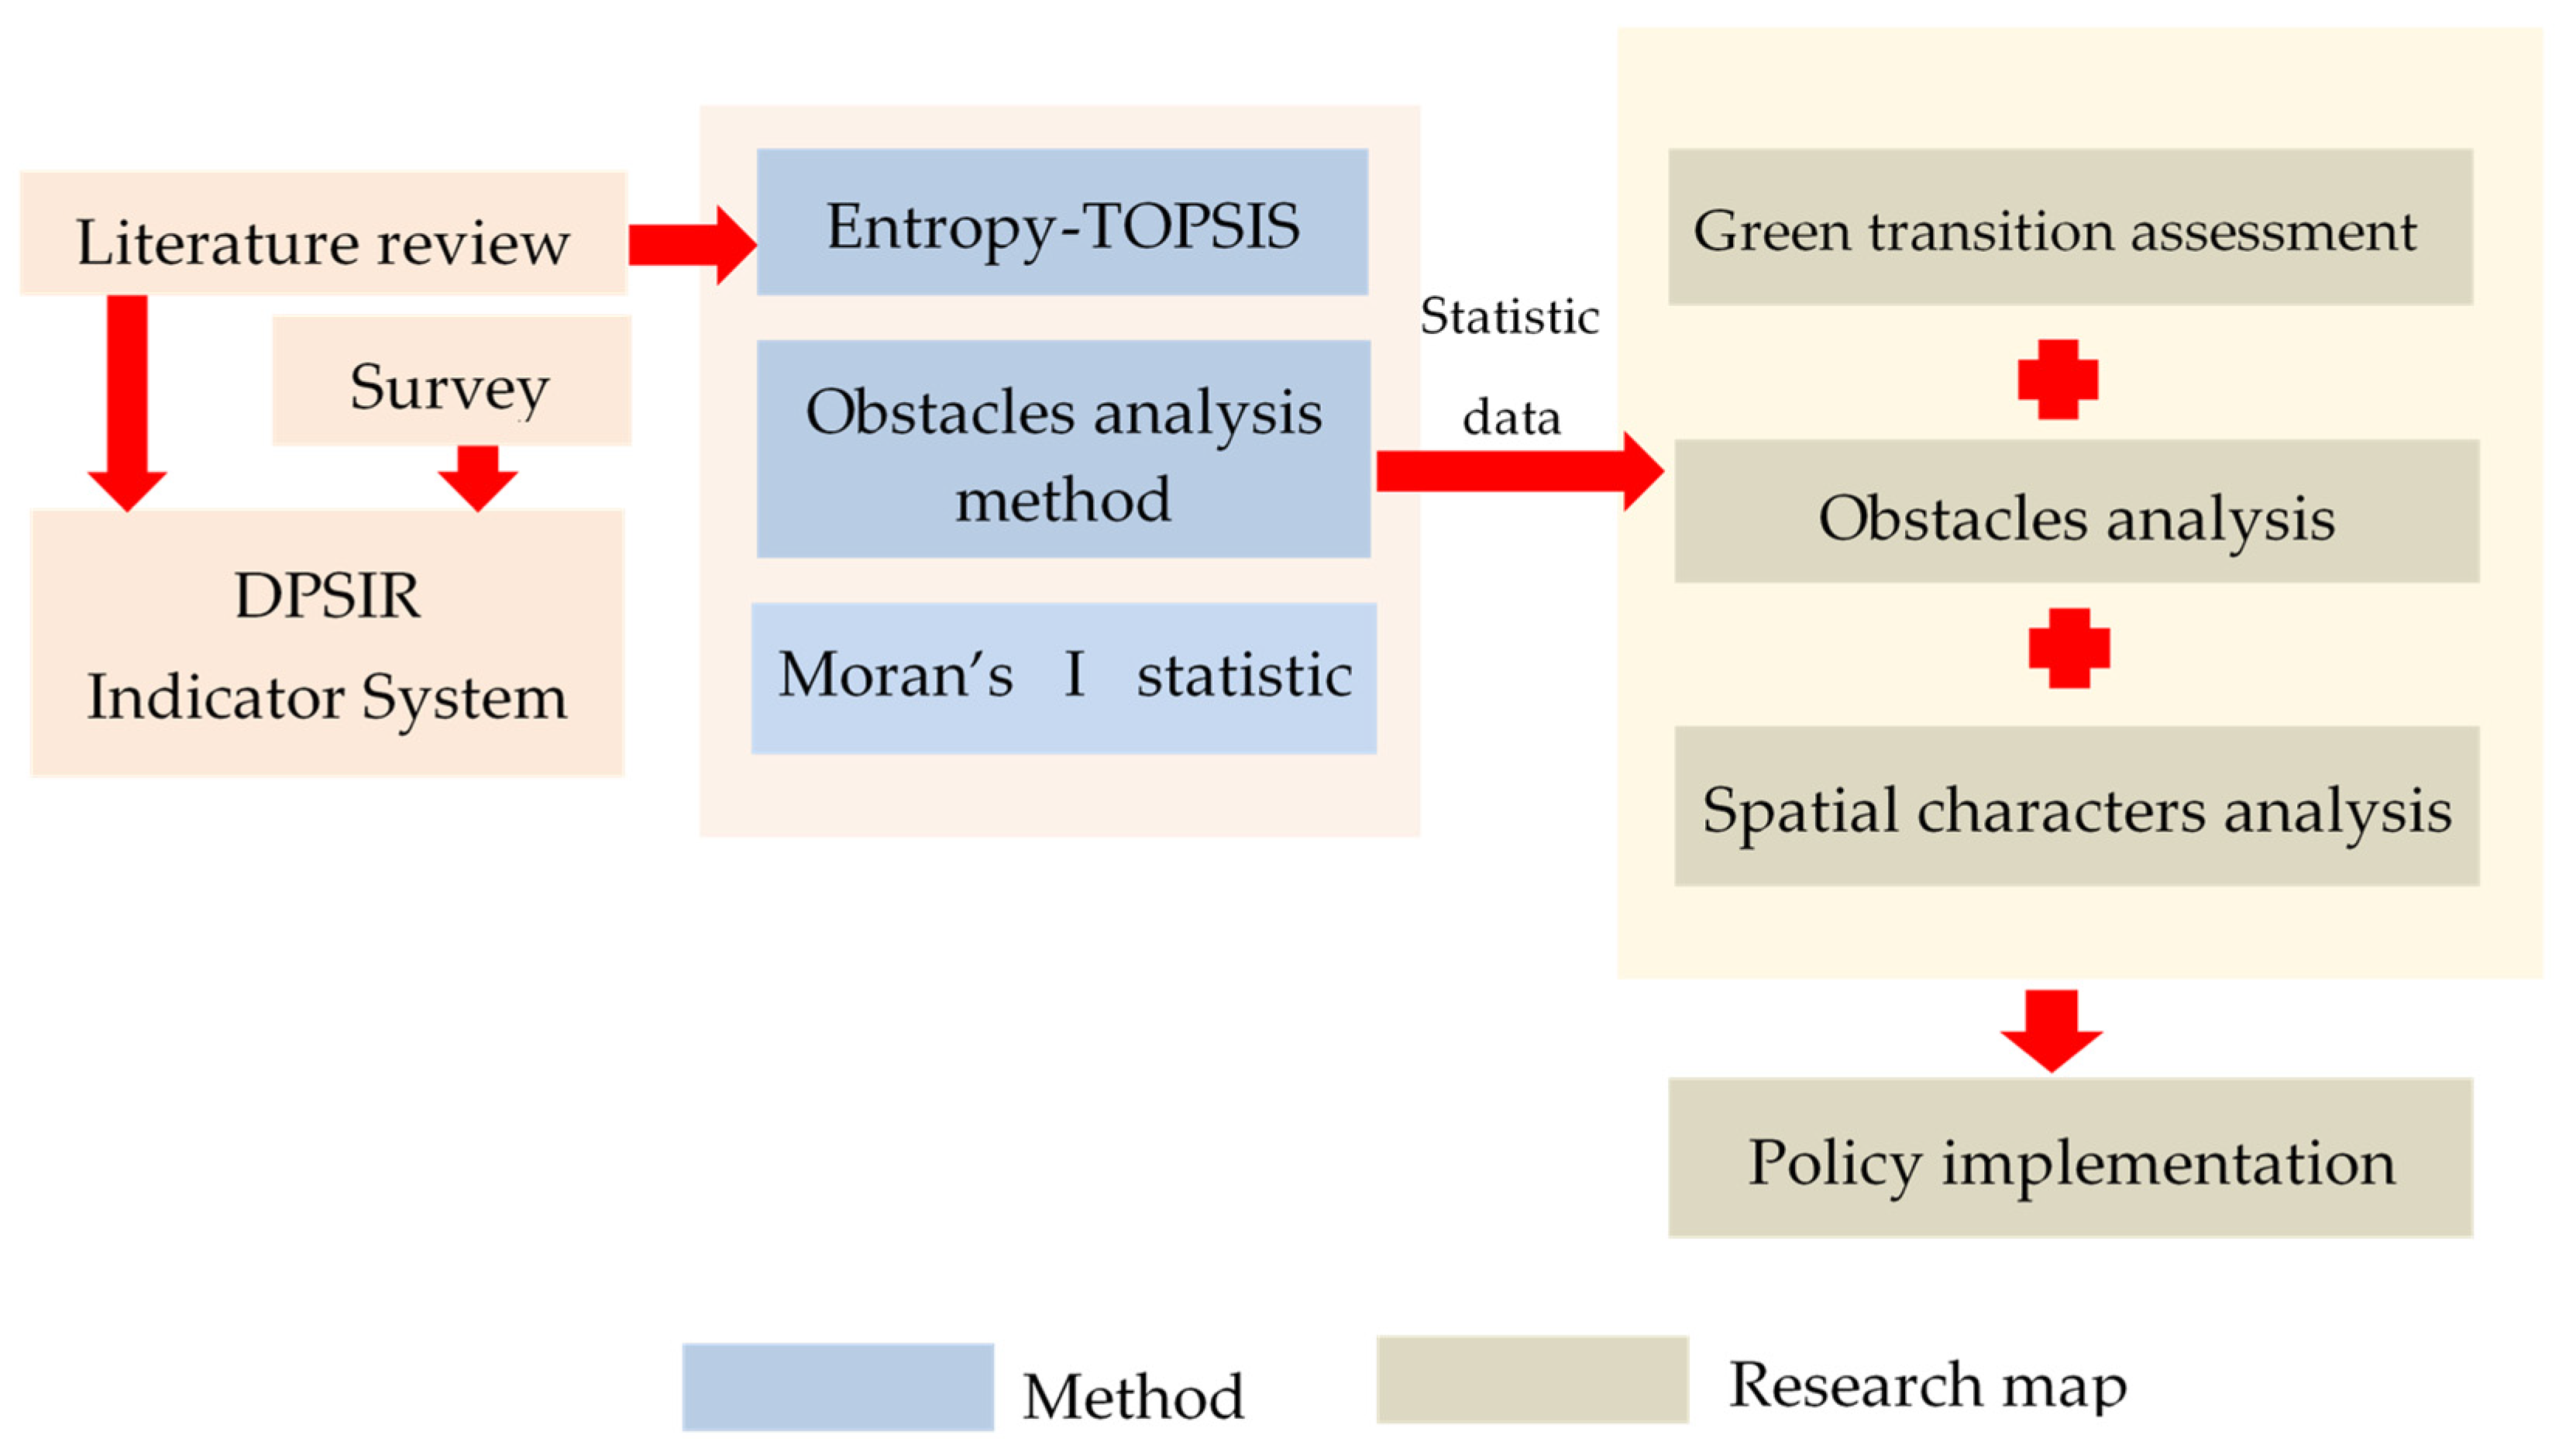
3. Method
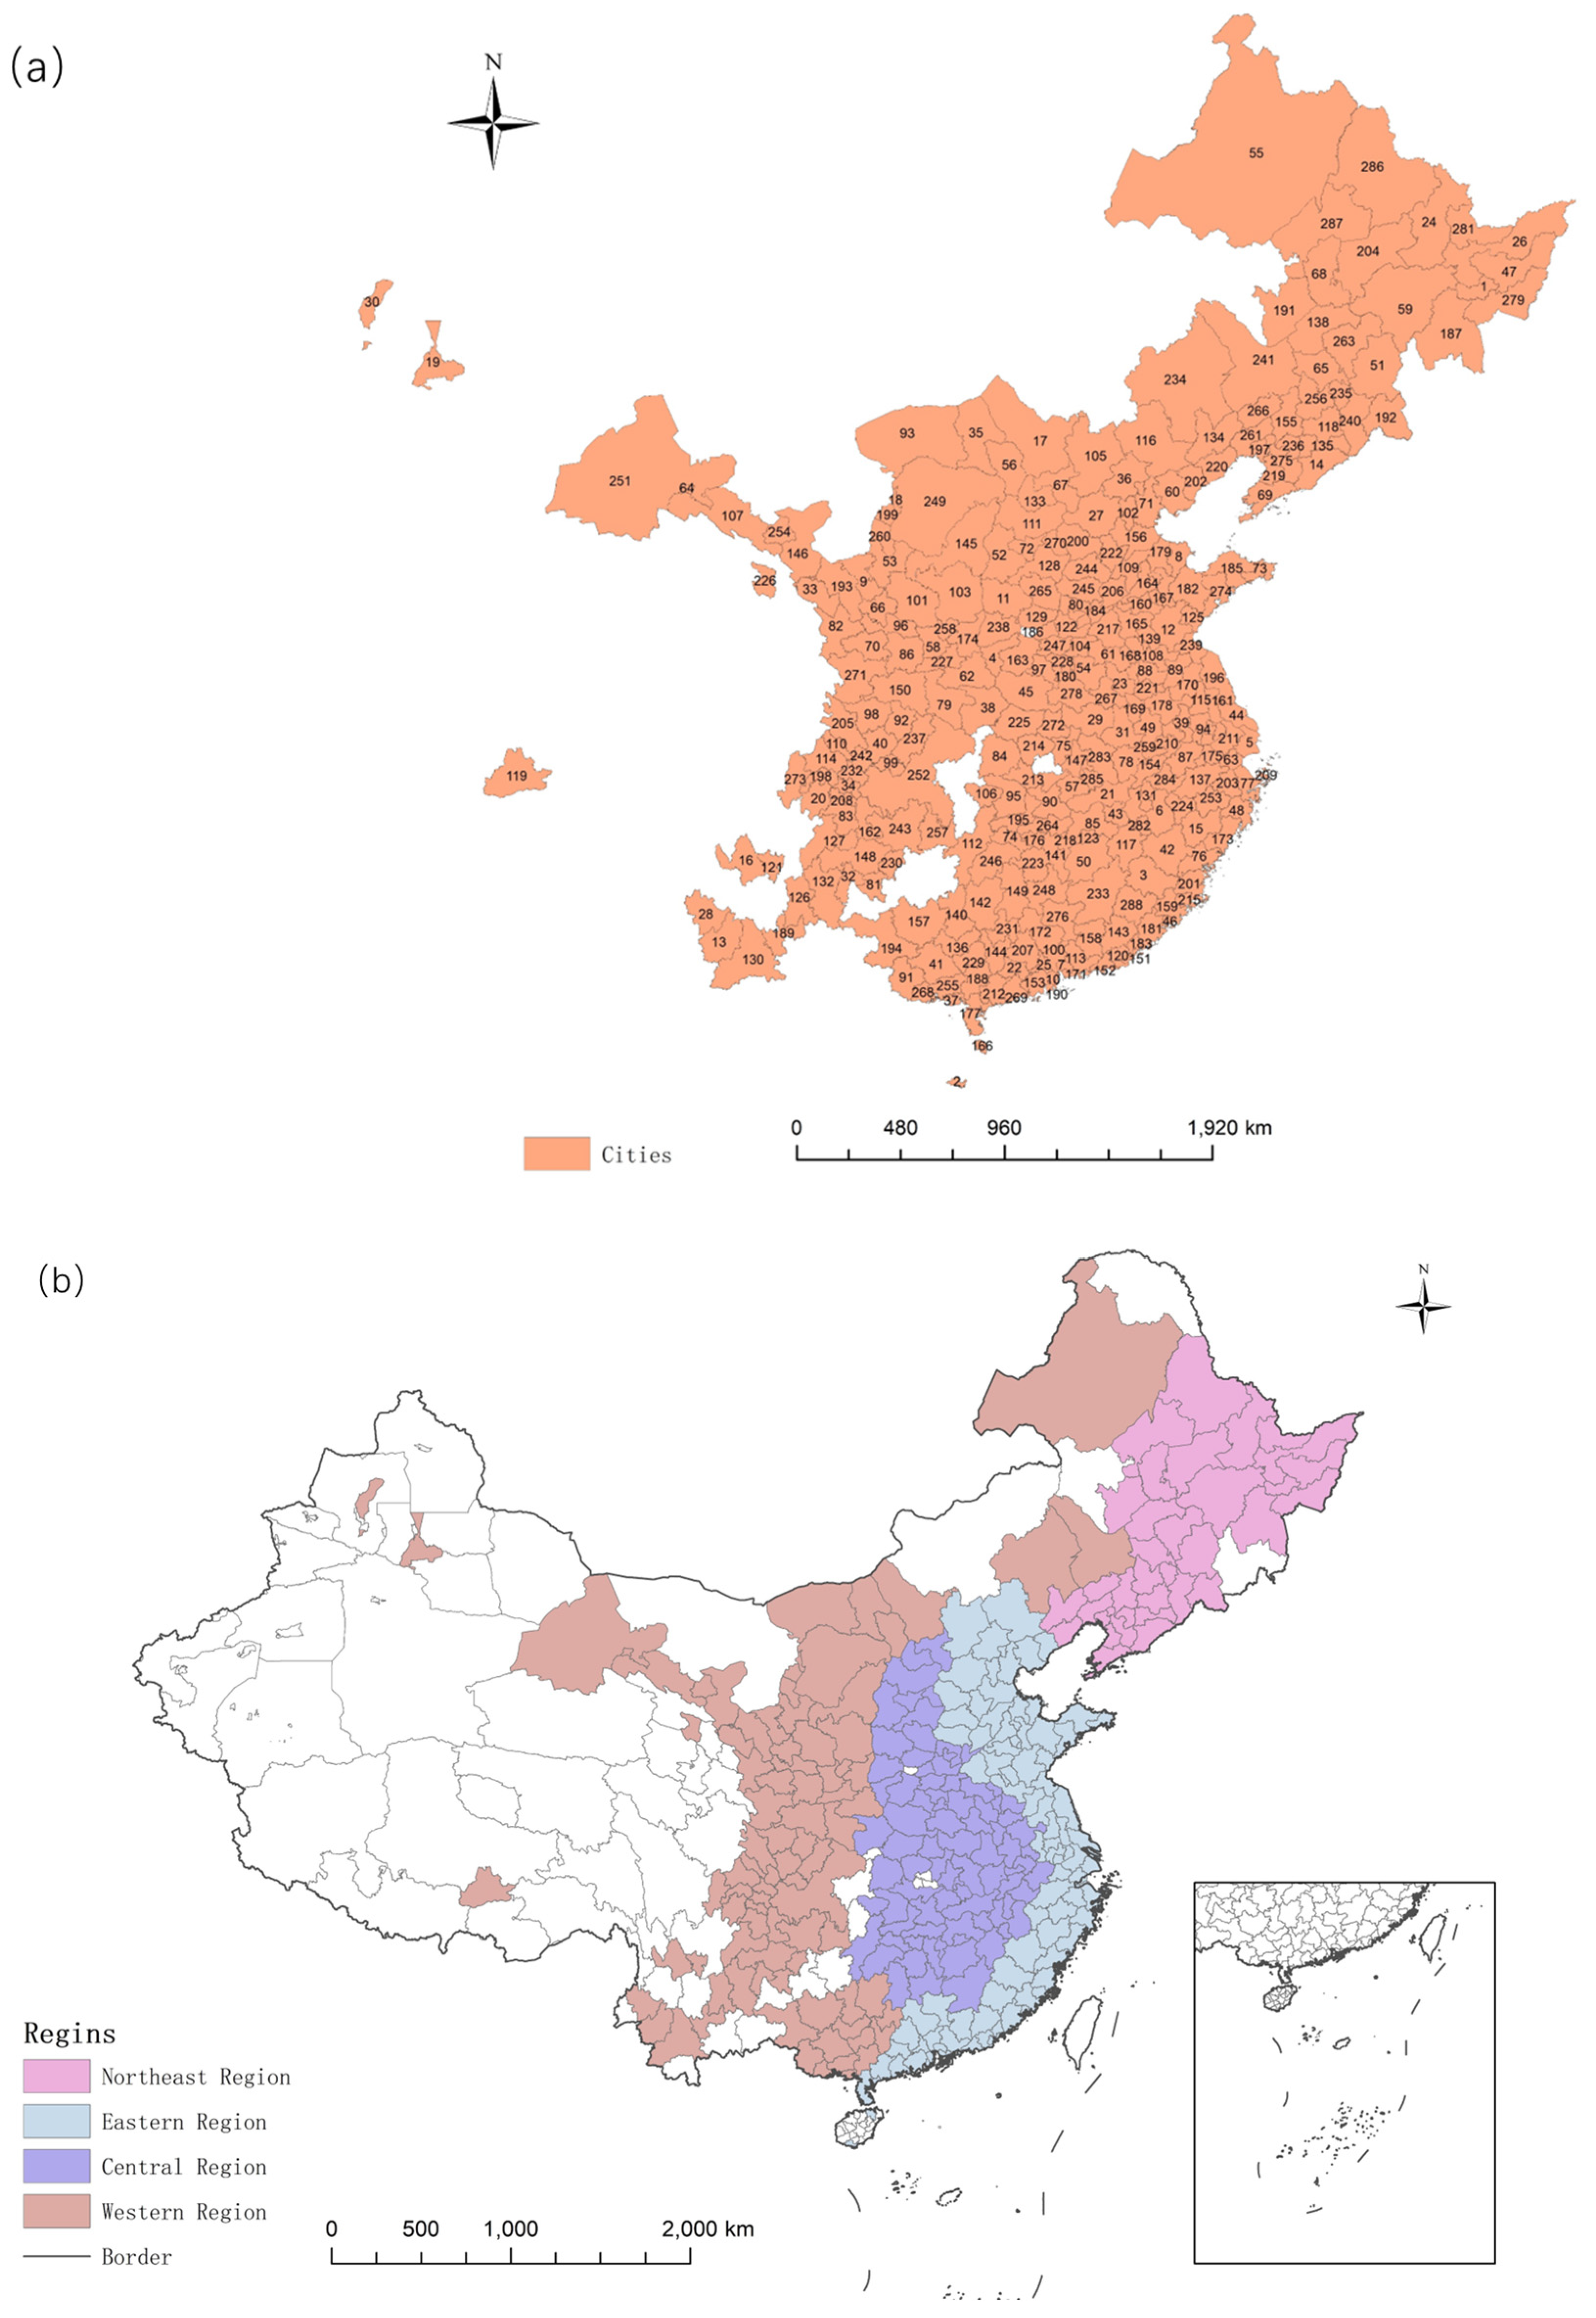
3.1. Data Sources
3.2. TOPSIS Model with Entropy Weight
- (1)
- Construction of a standardized evaluation matrix
- (2)
- Establishment of evaluation matrix based on entropy weight
- (3)
- Determination of ideal solutions
- (4)
- Distance calculation
- (5)
- Computing the closeness between the evaluation object and the ideal solution
3.3. Calculation of the Moran’s I Statistic
3.4. Degree of Obstacle
4. Results
4.1. Calculated Weights of Indicators
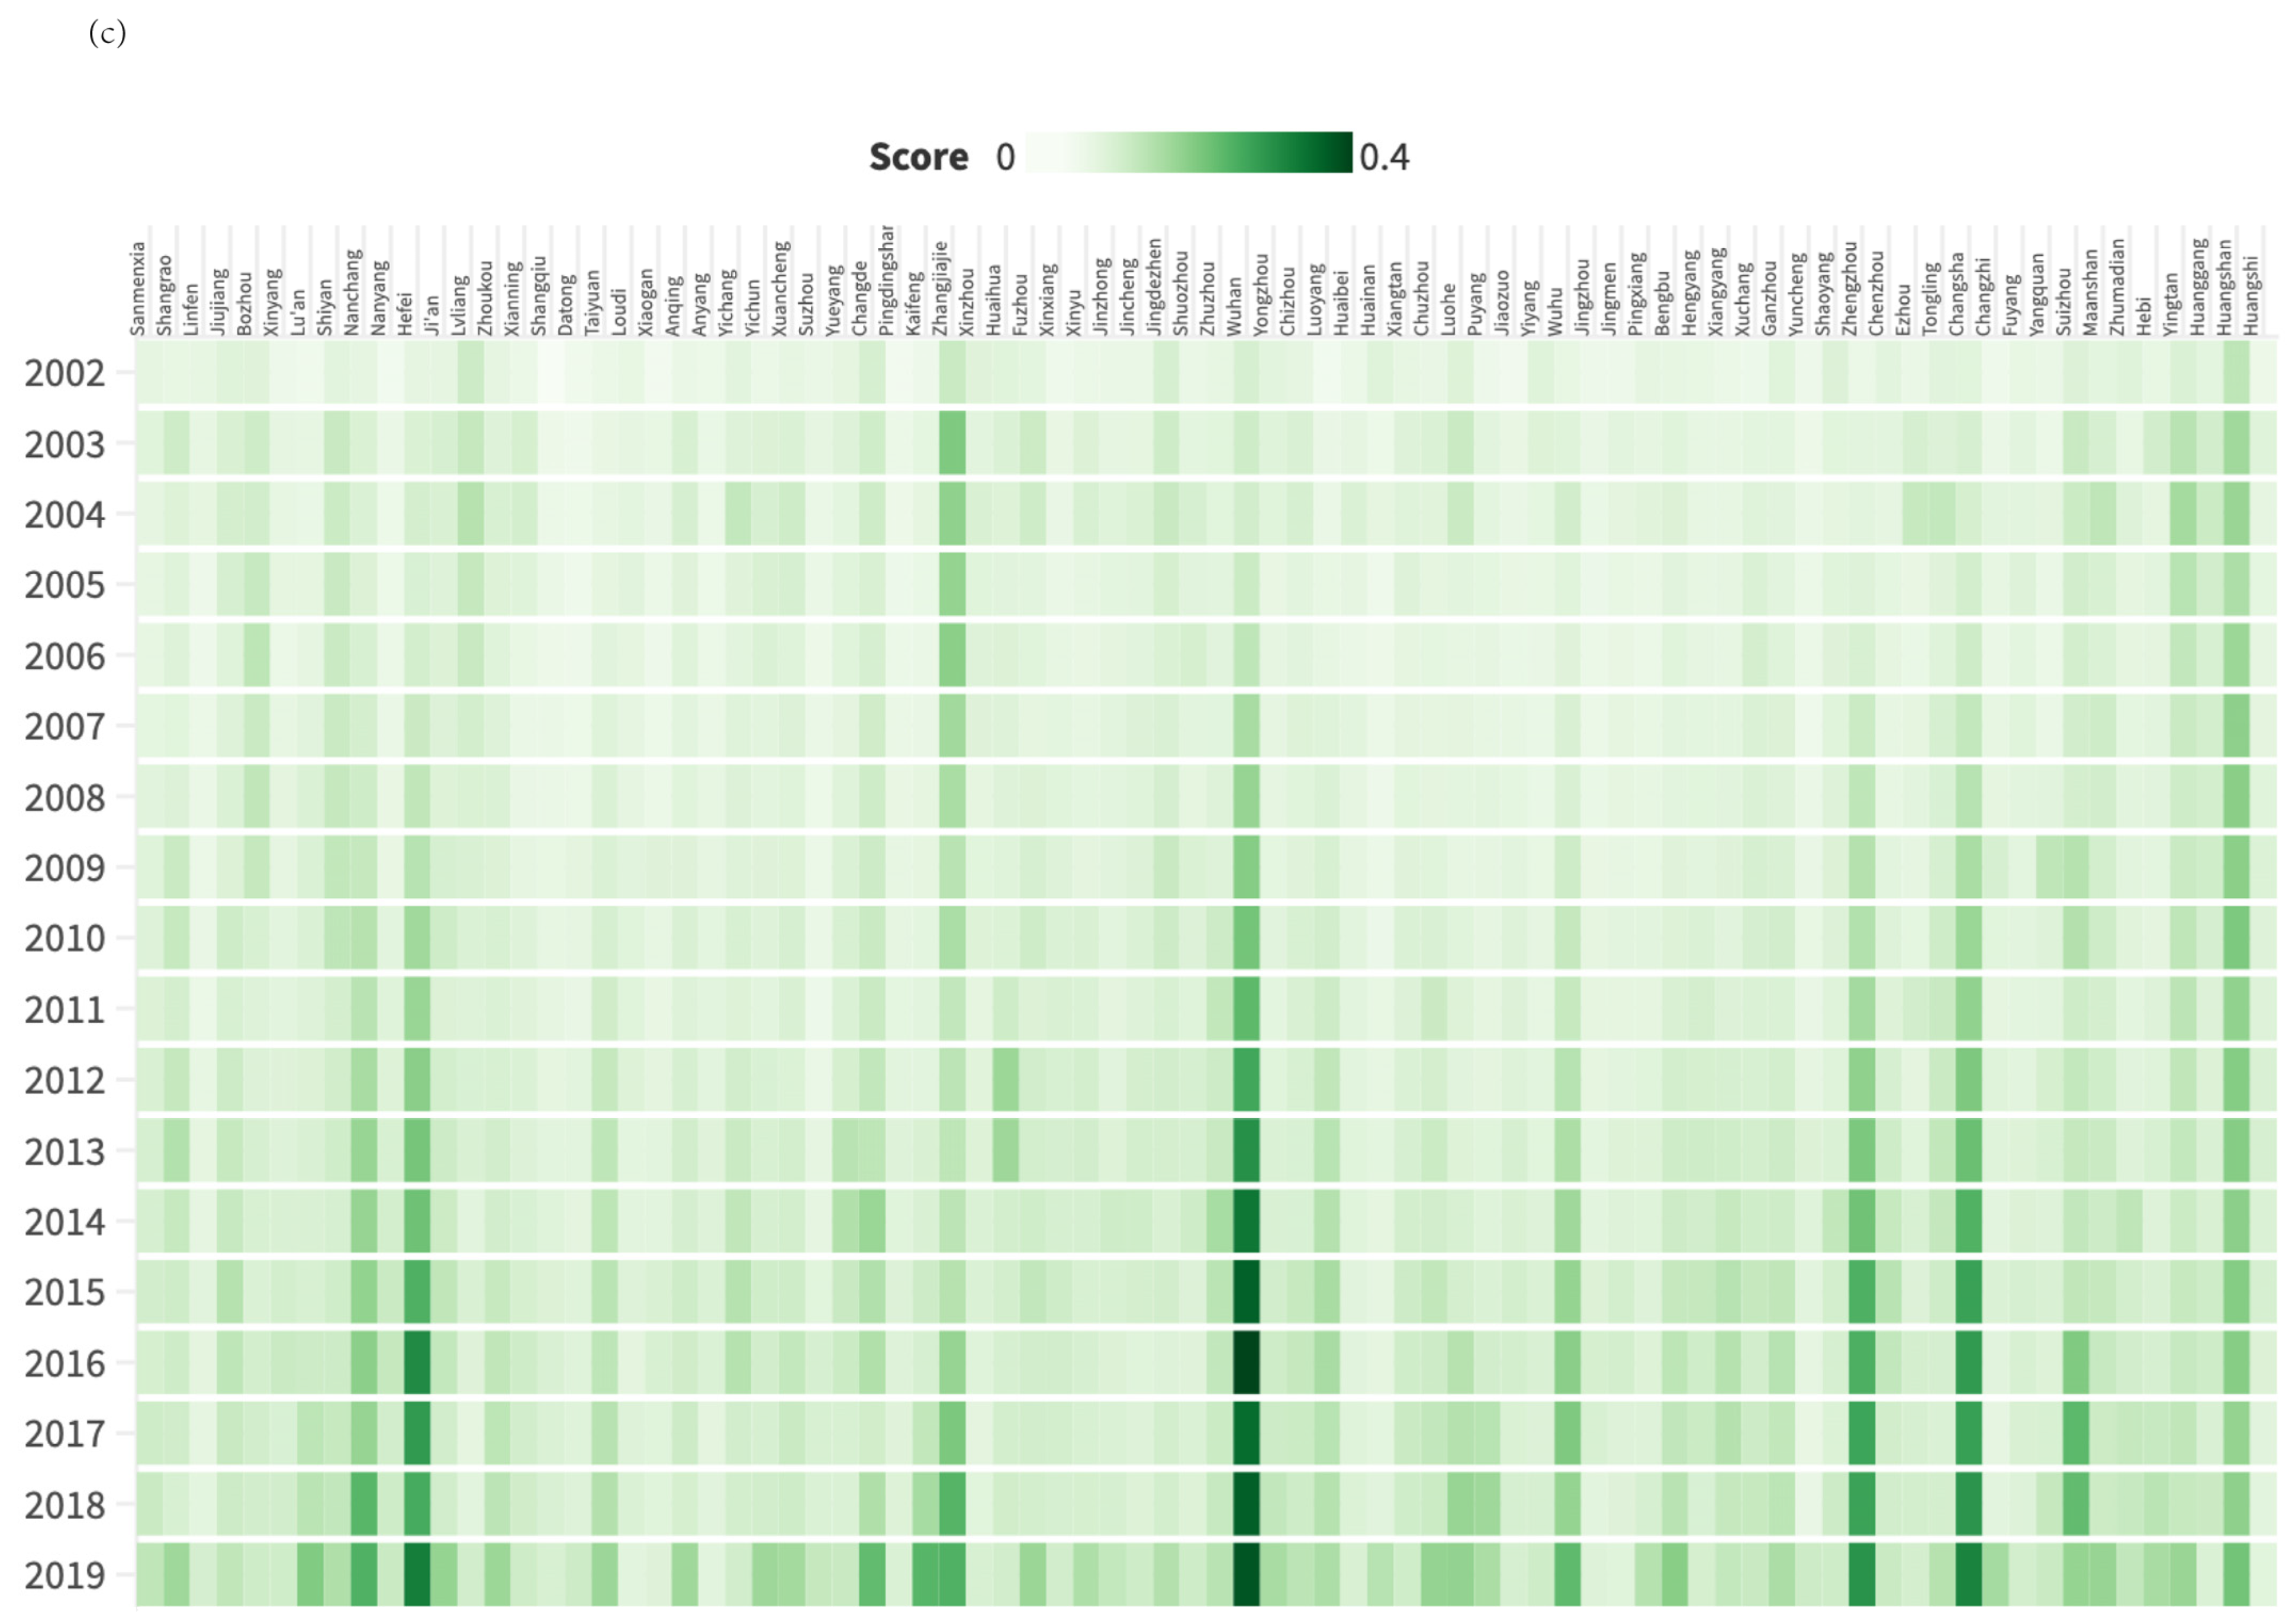
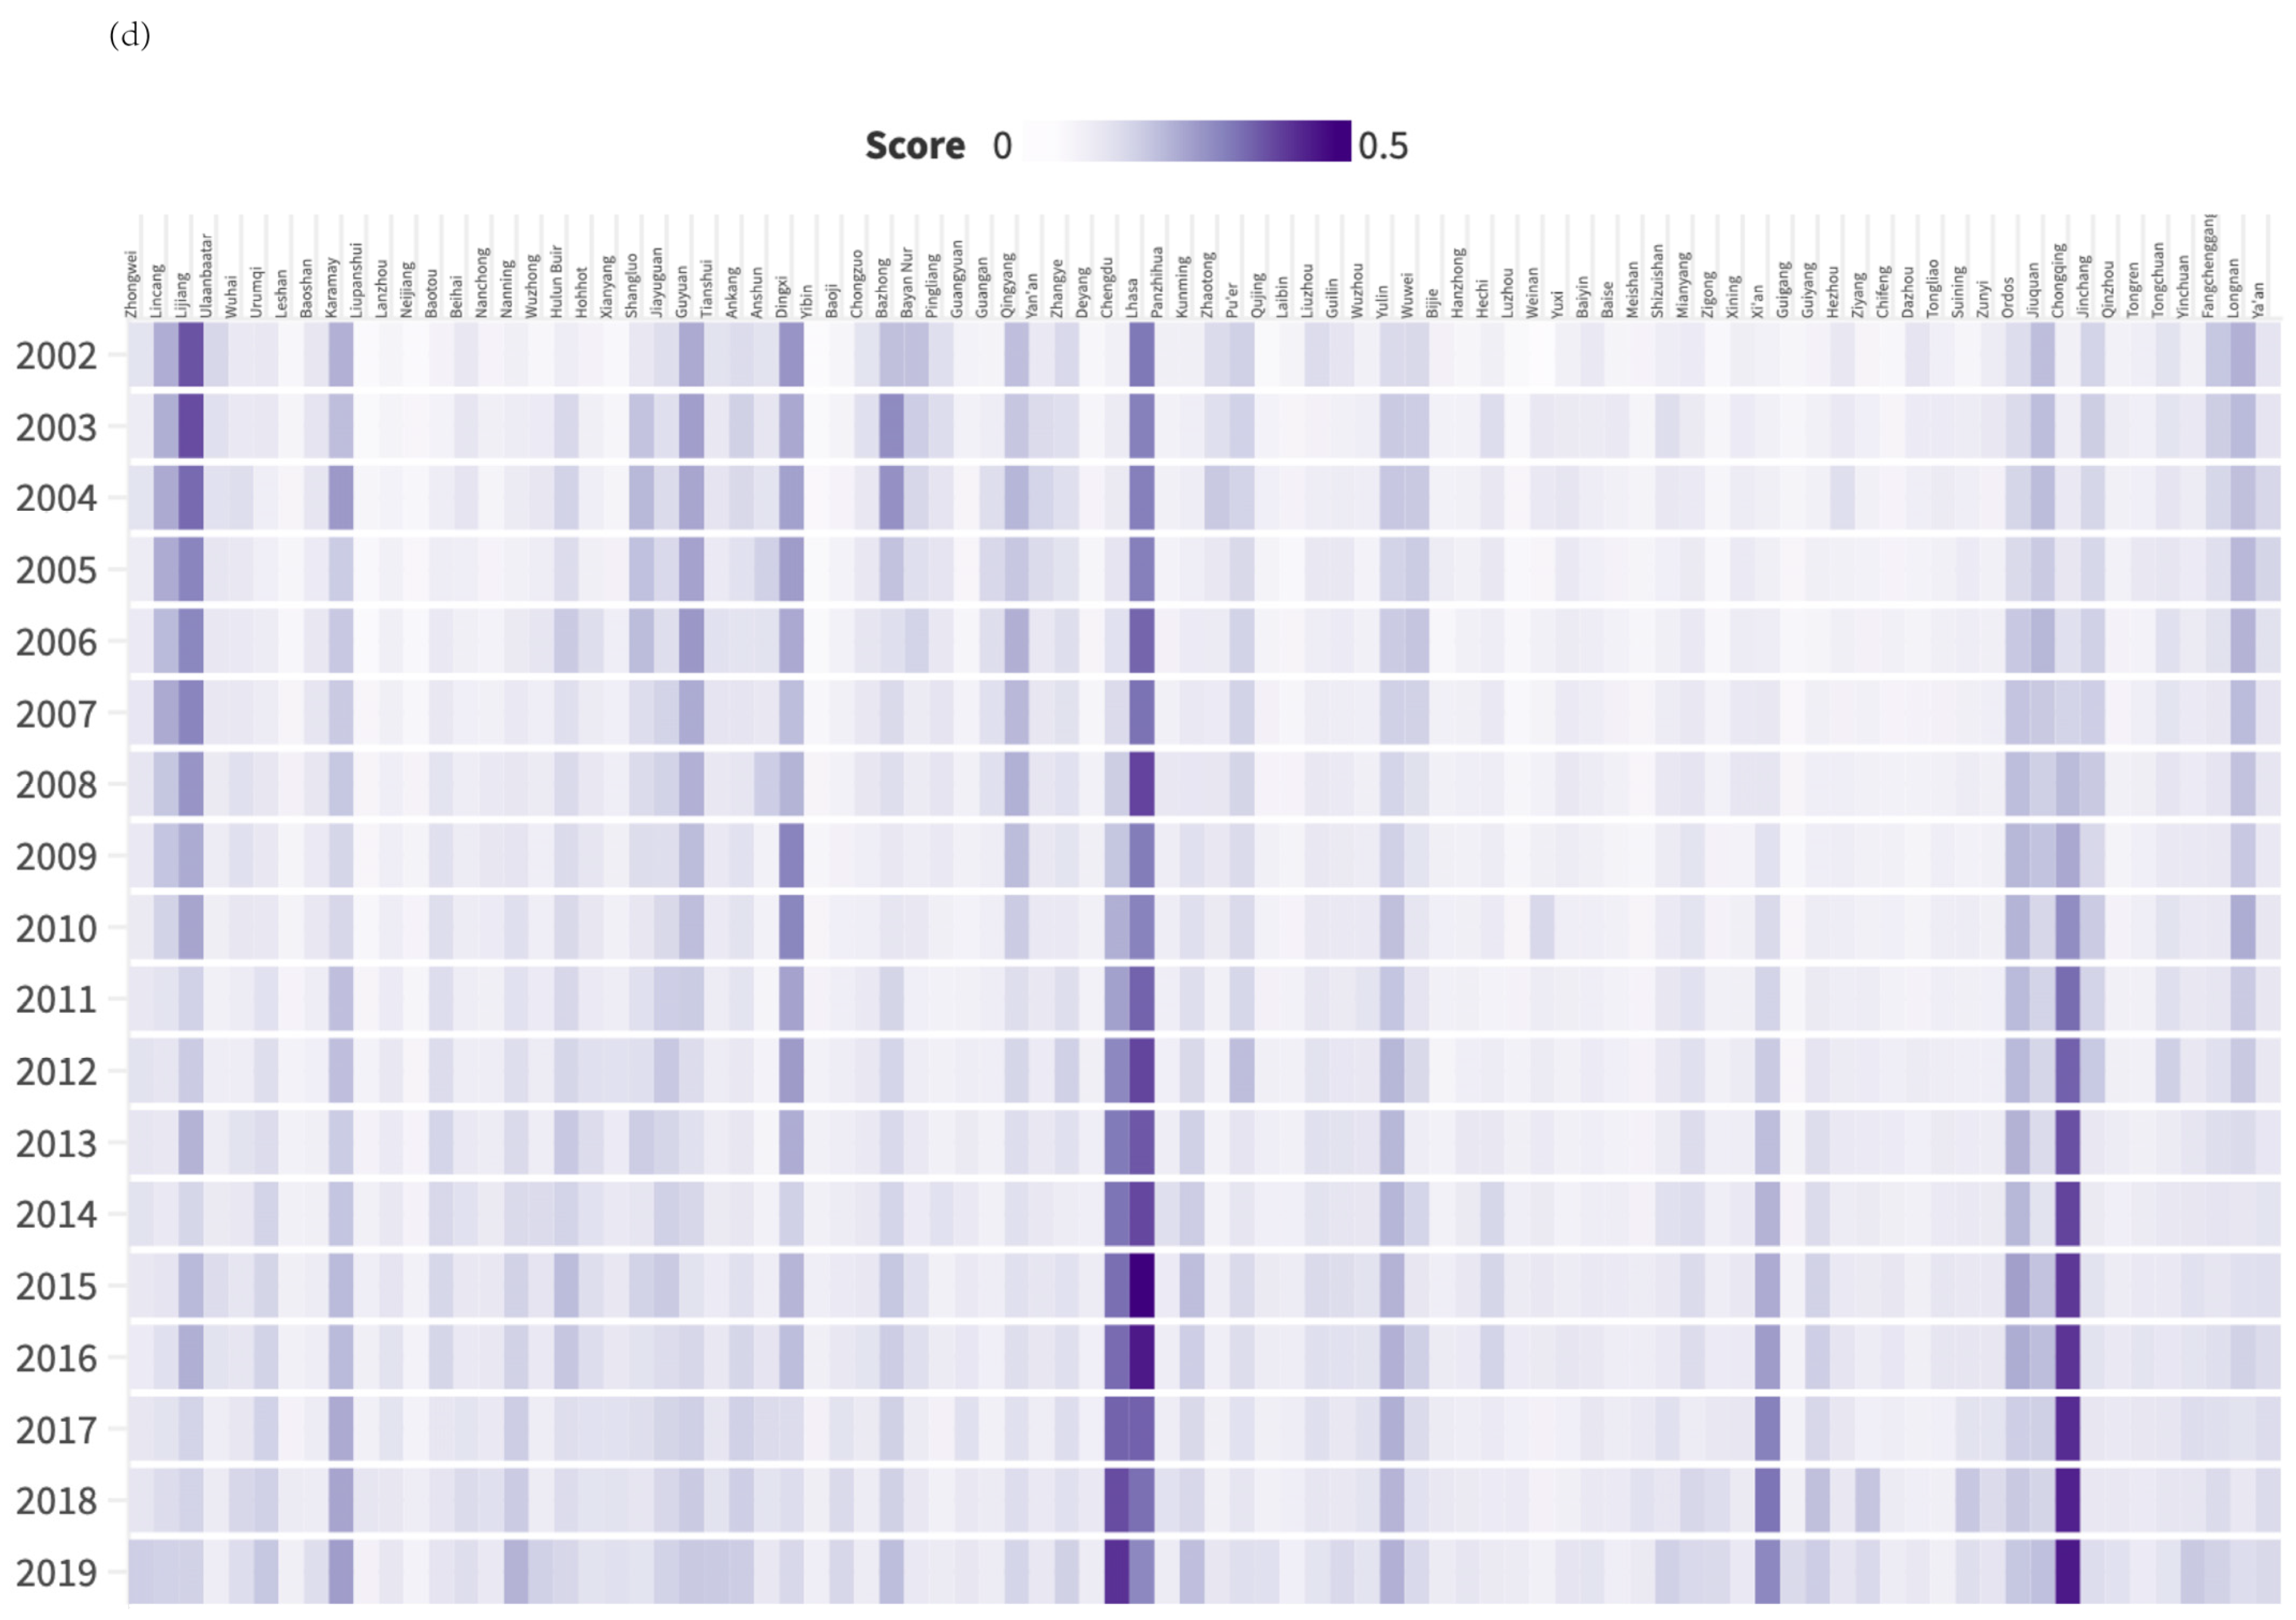
4.2. Green Transition Score of 288 Cities
- (1)
- Resource advantage: Major cities usually have more resources, including human, financial, and technical support. They can invest more money and workforce to drive the green transition and attract more professionals and innovators to participate in green development efforts. For example, as the economic capital of China, Shanghai ranks top in green transition during the 18 years.
- (2)
- Awareness and demand: Major cities usually have higher environmental awareness and demand for sustainable development. These cities face more environmental problems, such as air pollution, waste disposal, and energy consumption. Due to high population density and economic activity, these cities are more concerned with improving residents’ quality of life and environmental sustainability.
- (3)
- Policy support: Government policy support for implementing green transitions in major cities is often more active. These policies include encouraging renewable energy development, promoting energy efficiency and emission reduction, and providing financial support for green infrastructure development. Active government involvement and policy support are essential in promoting green transition. Beijing was once notorious for haze, but after the Regulations on the Prevention and Control of Air Pollution were issued, the air quality was increased obviously, which is an important aspect of green transition.
- (4)
- Opportunities for cooperation: There are more opportunities for cooperation between major cities. They can share experiences, exchange best practices, and work together to solve common problems. Such cooperation facilitates the rapid development of green technologies and innovations, accelerating the transition. In summary, significant cities can better address environmental challenges, promote sustainable development, and provide role models and lessons for other cities.
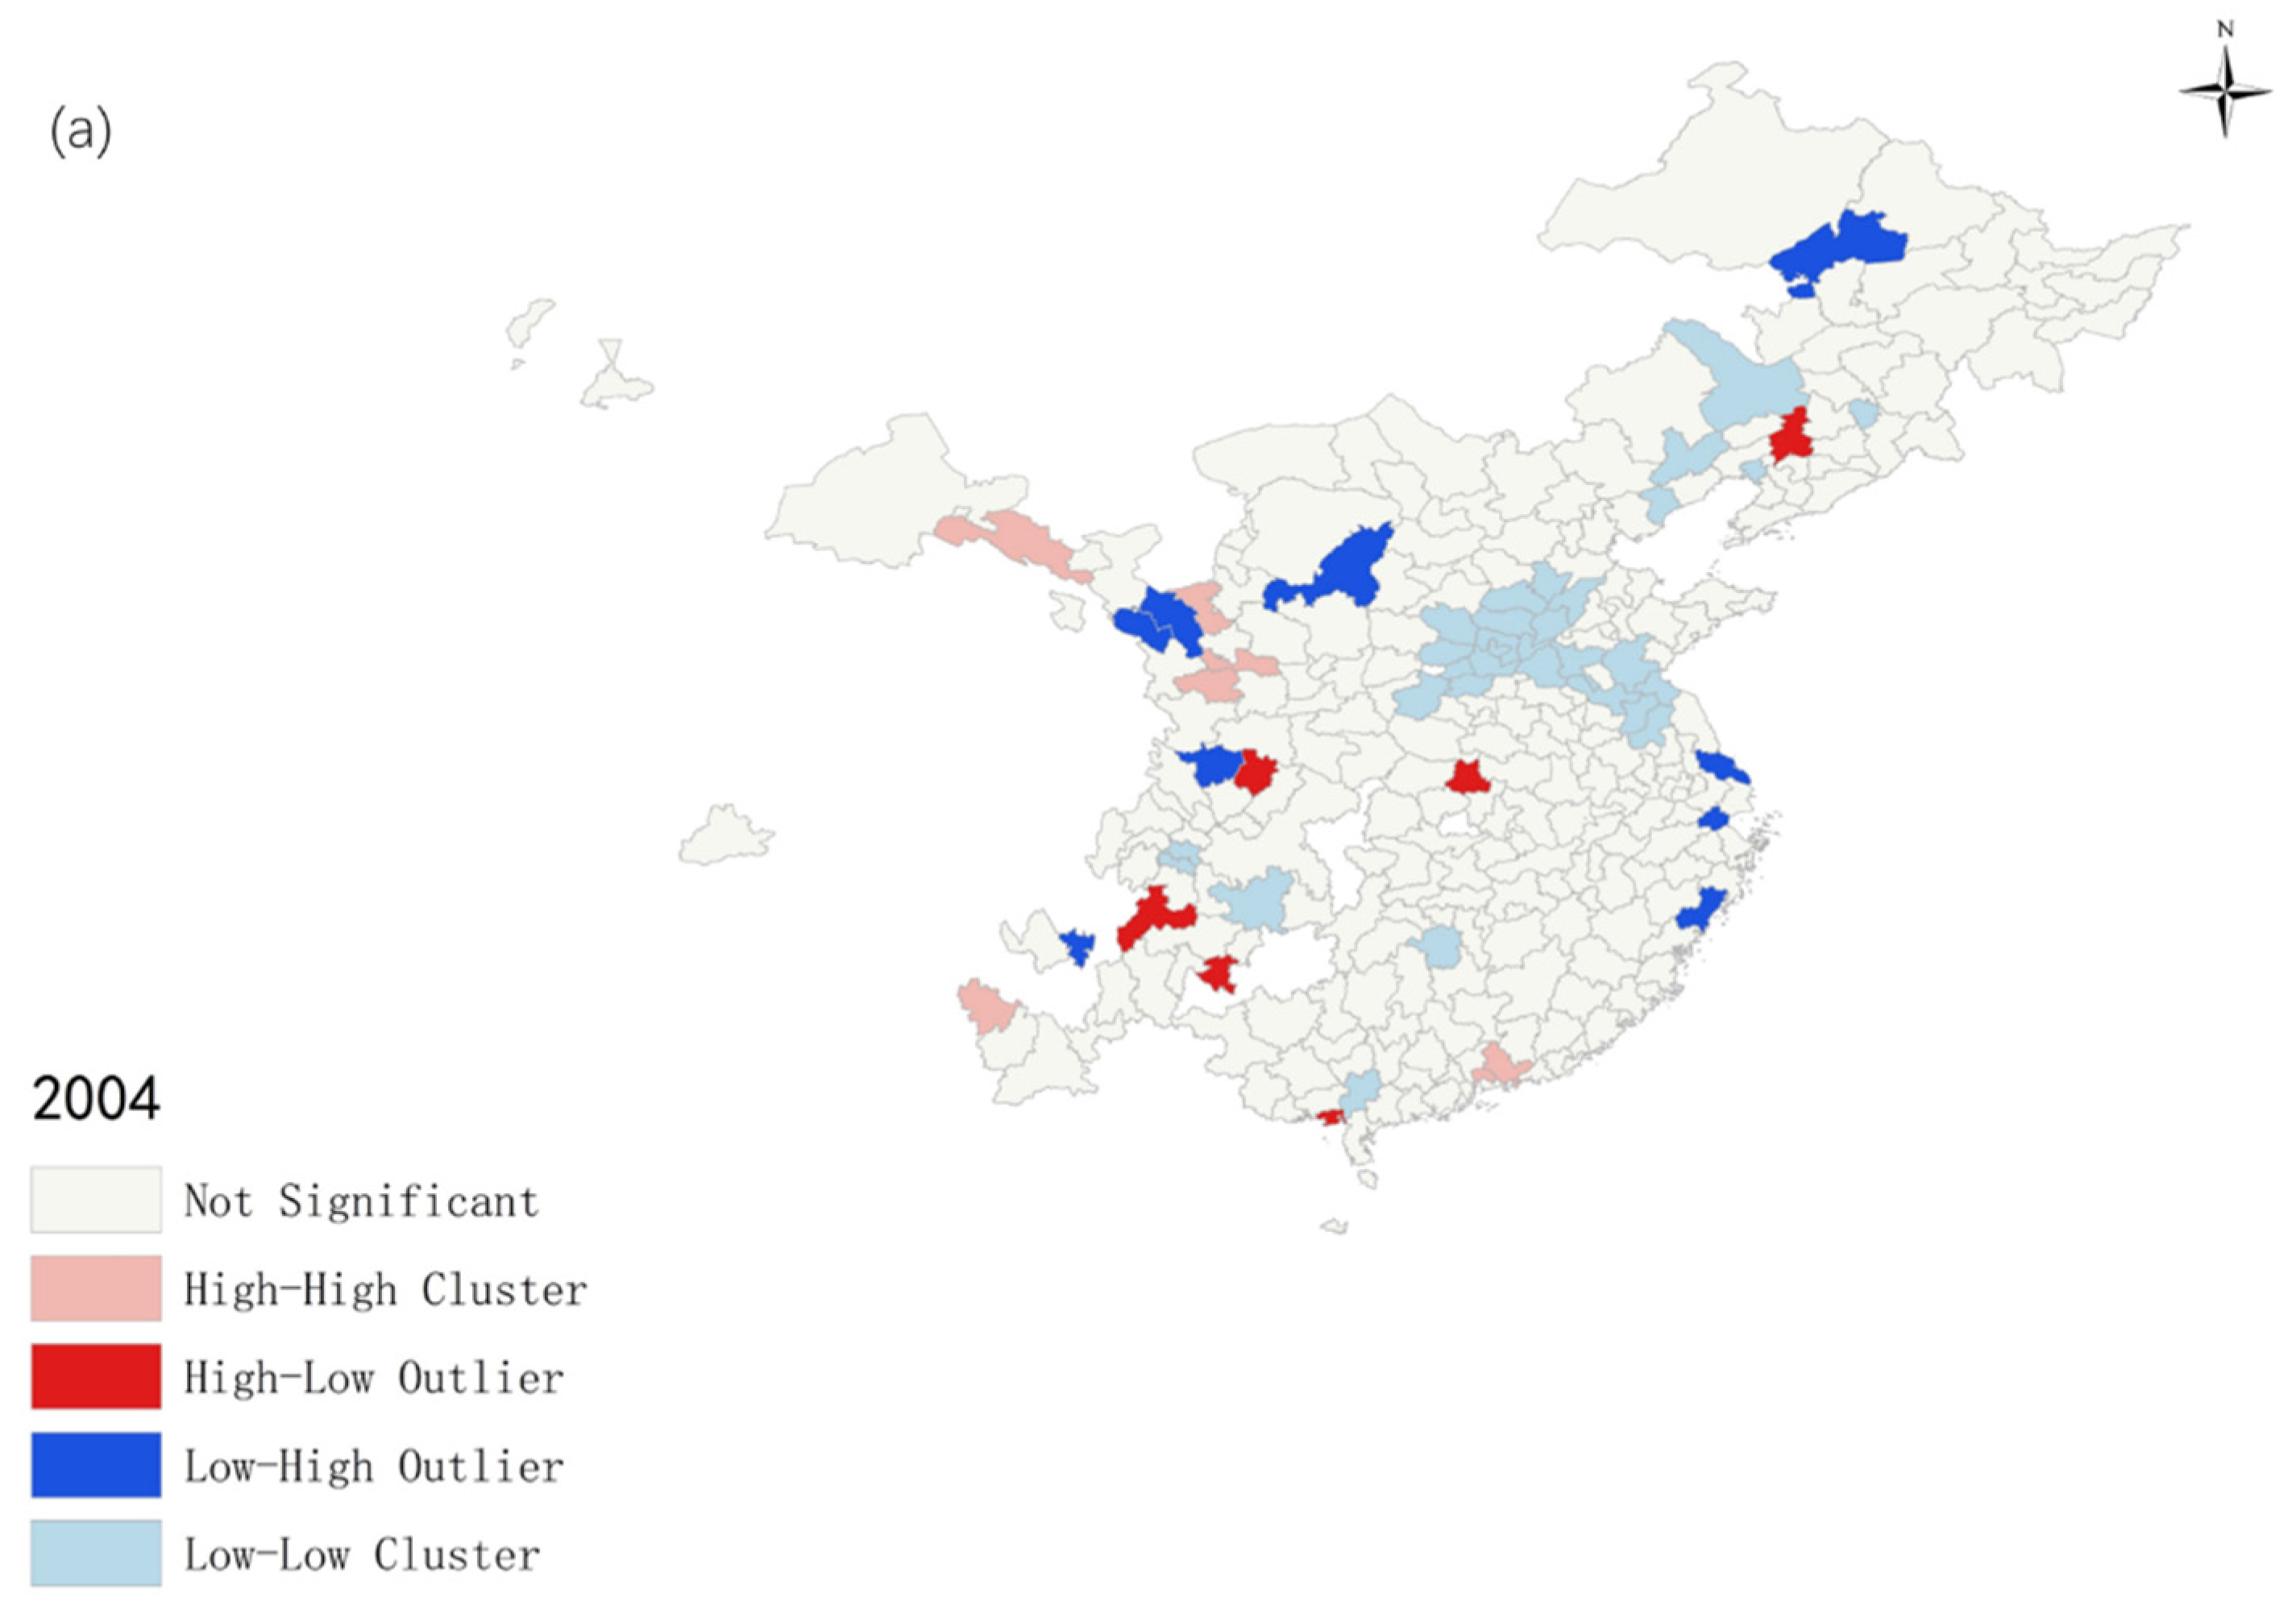
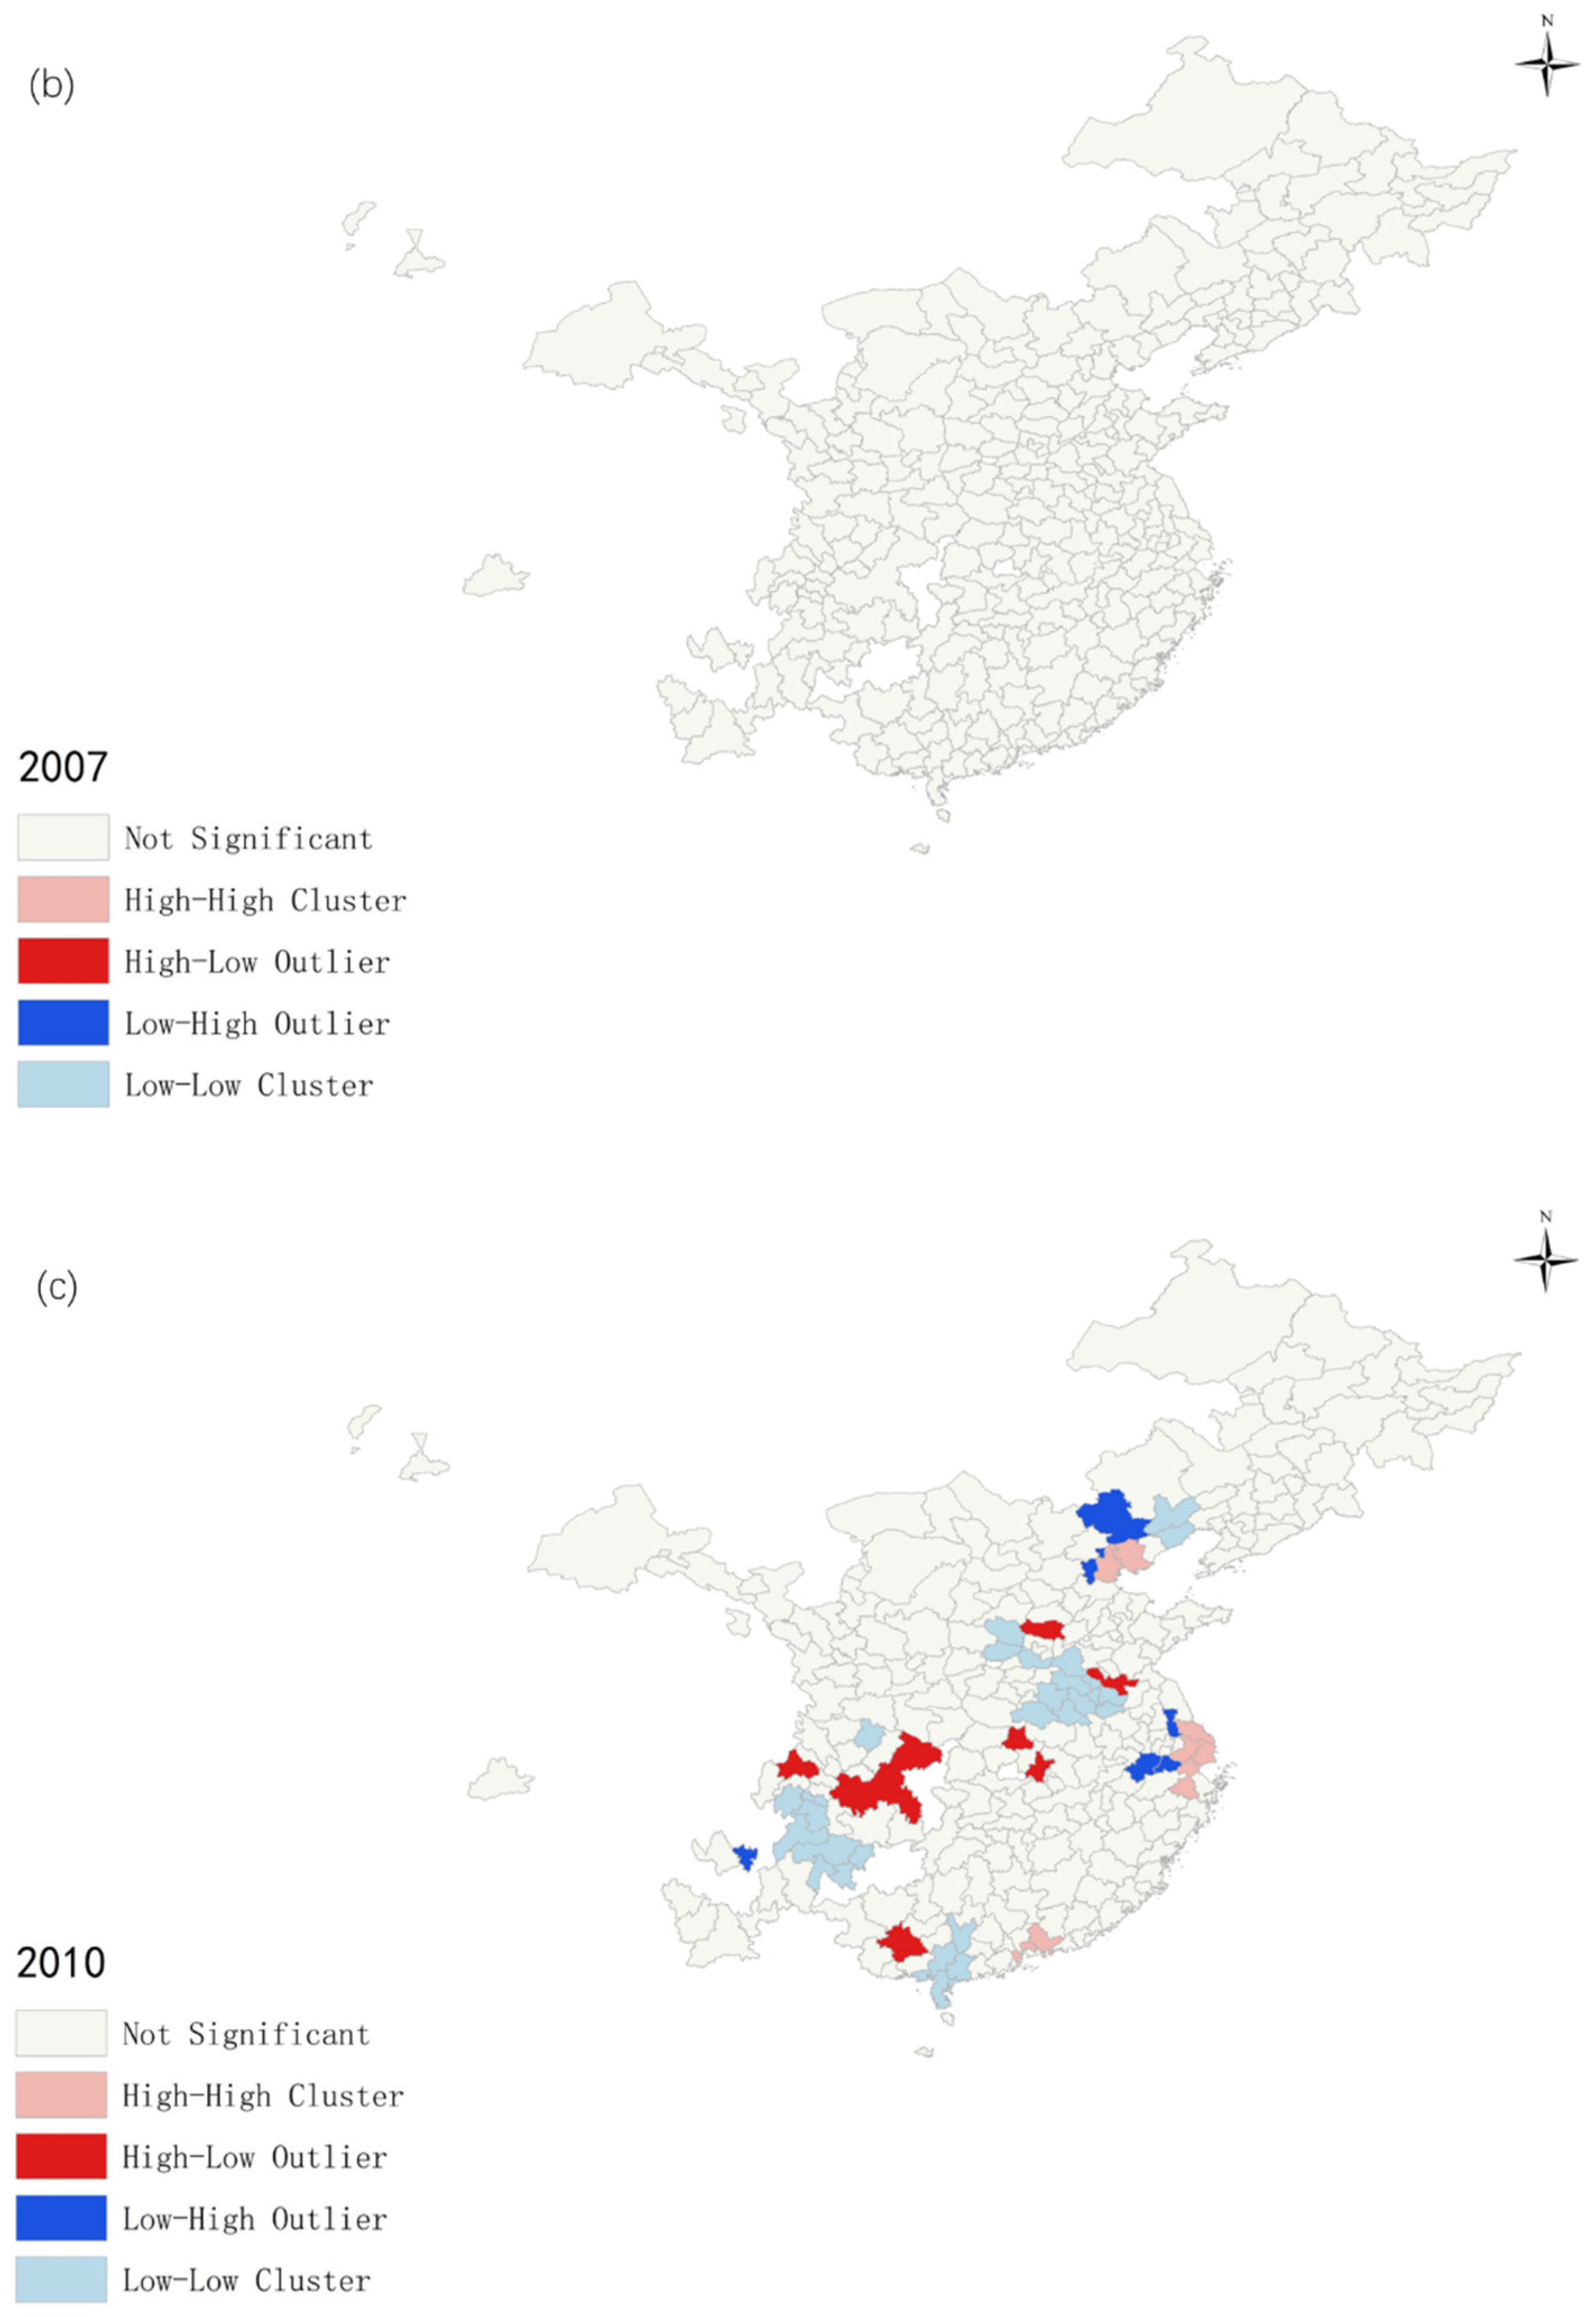
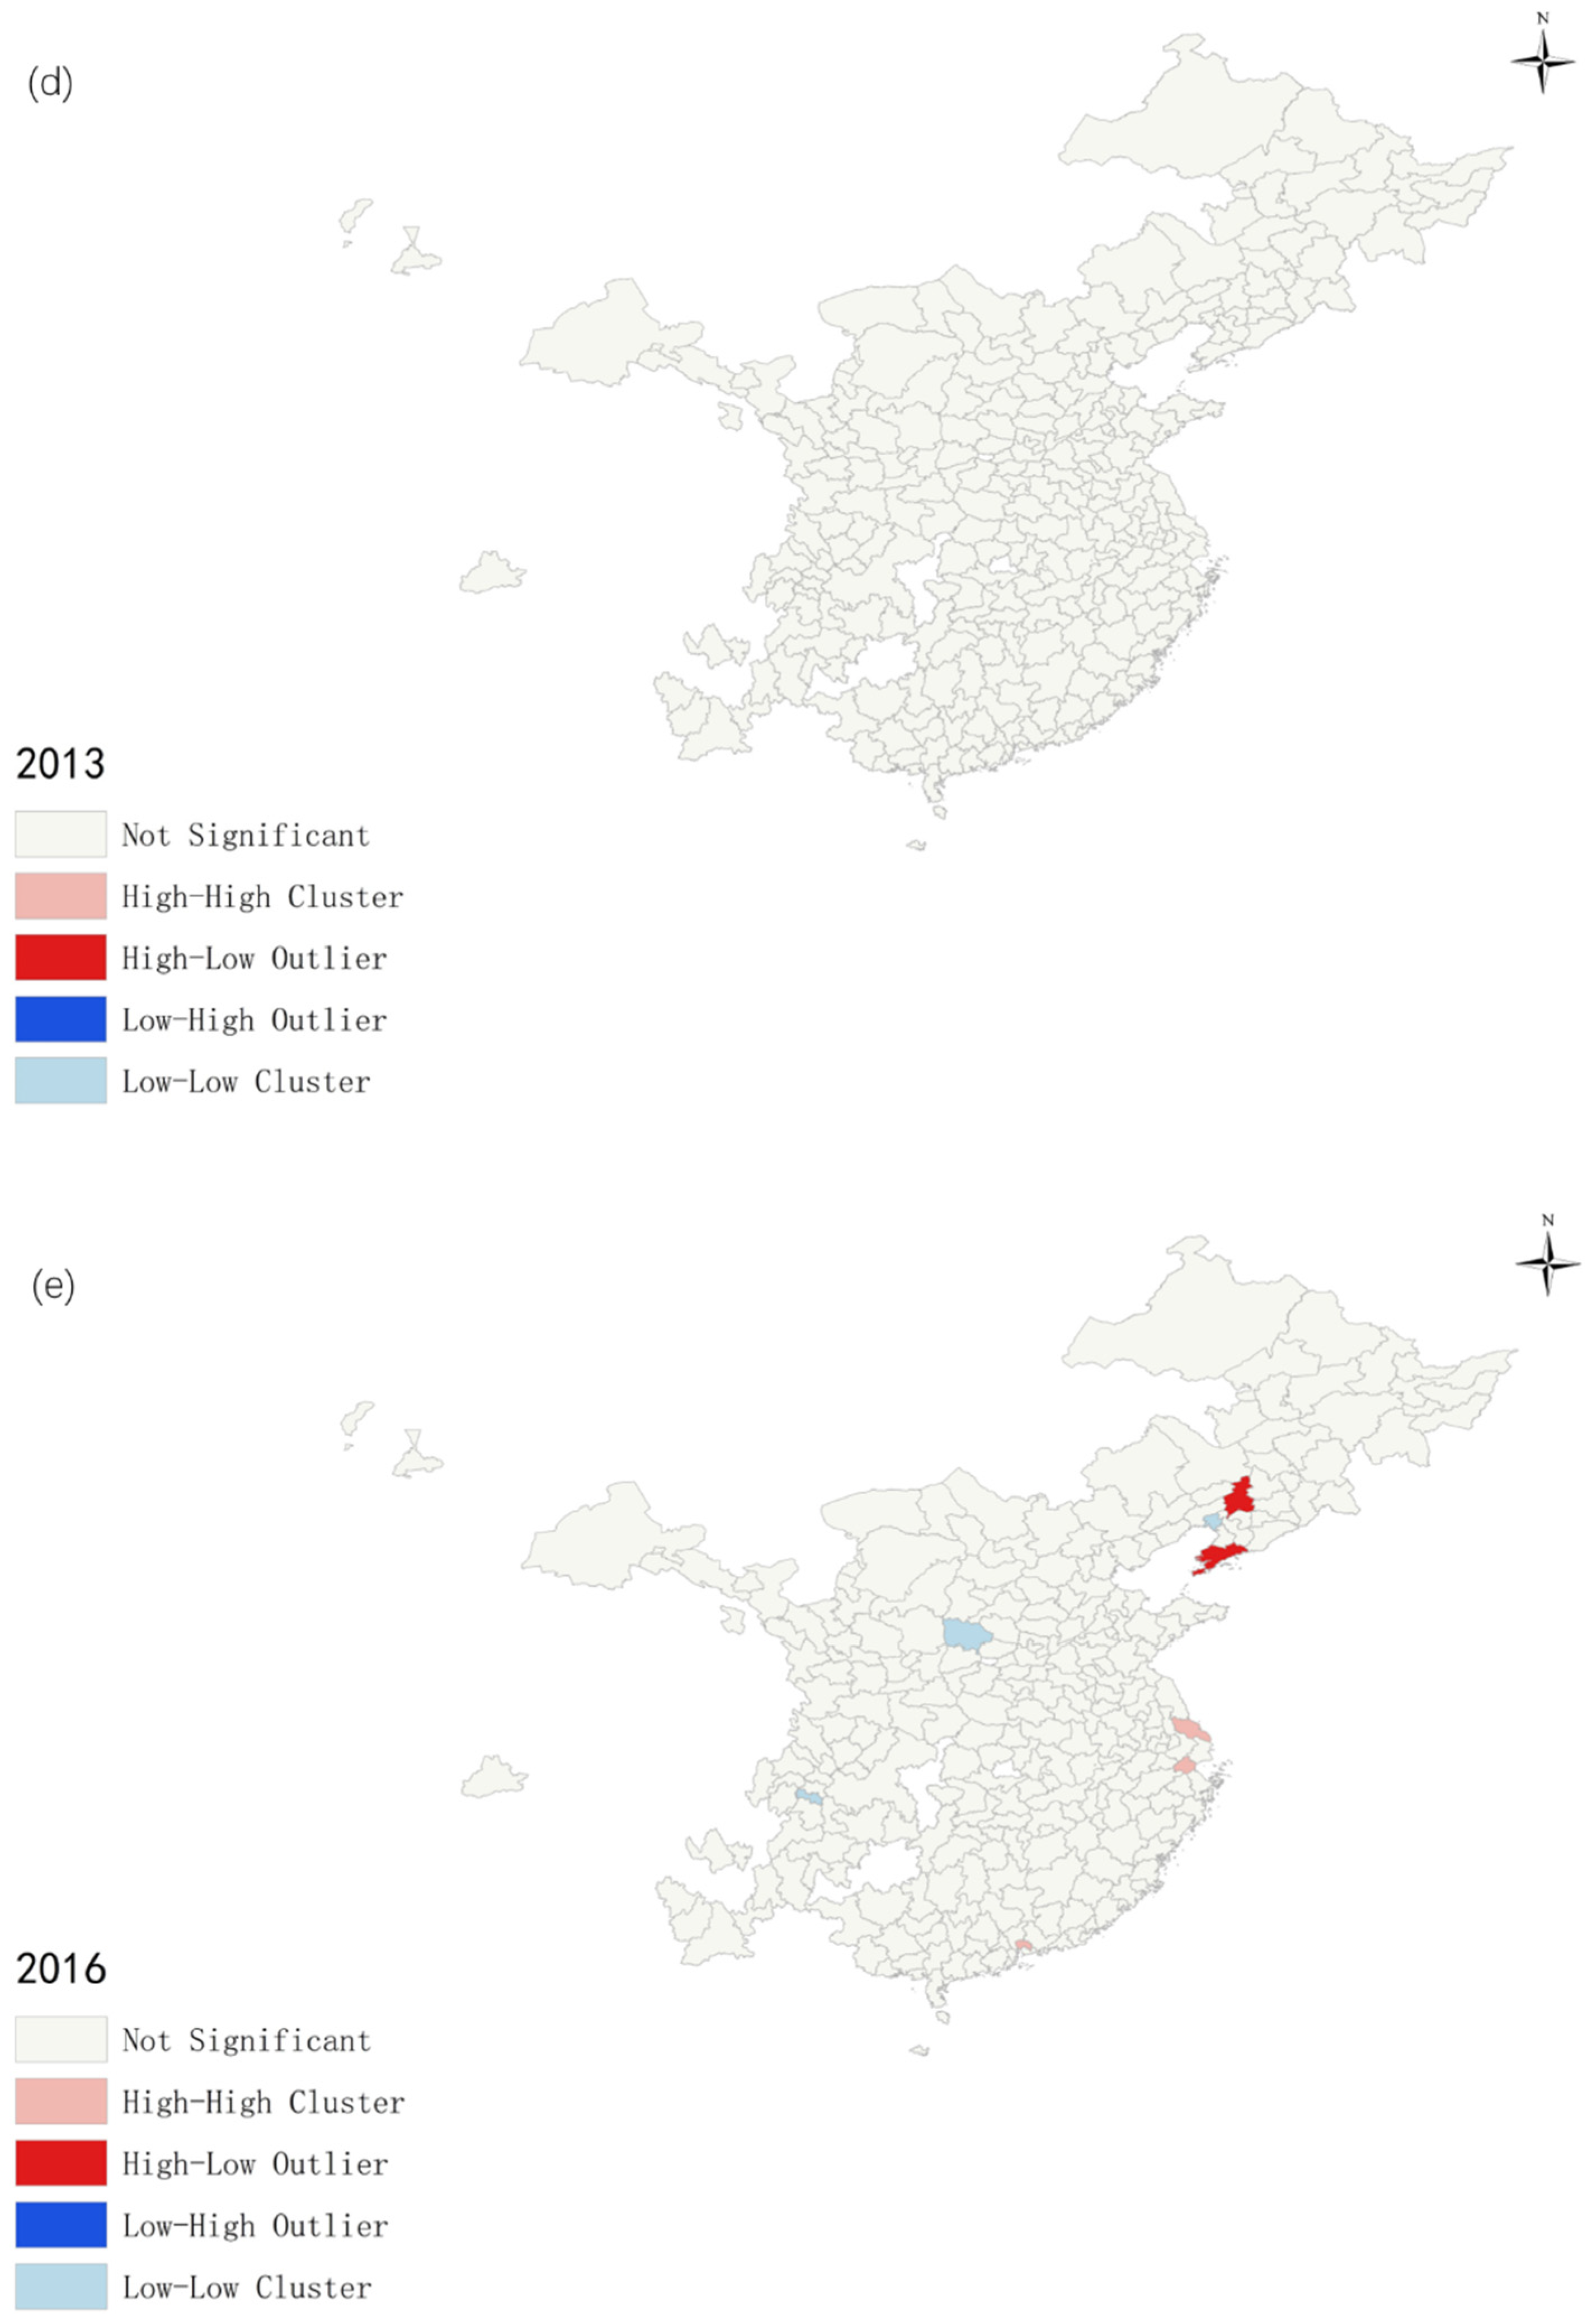
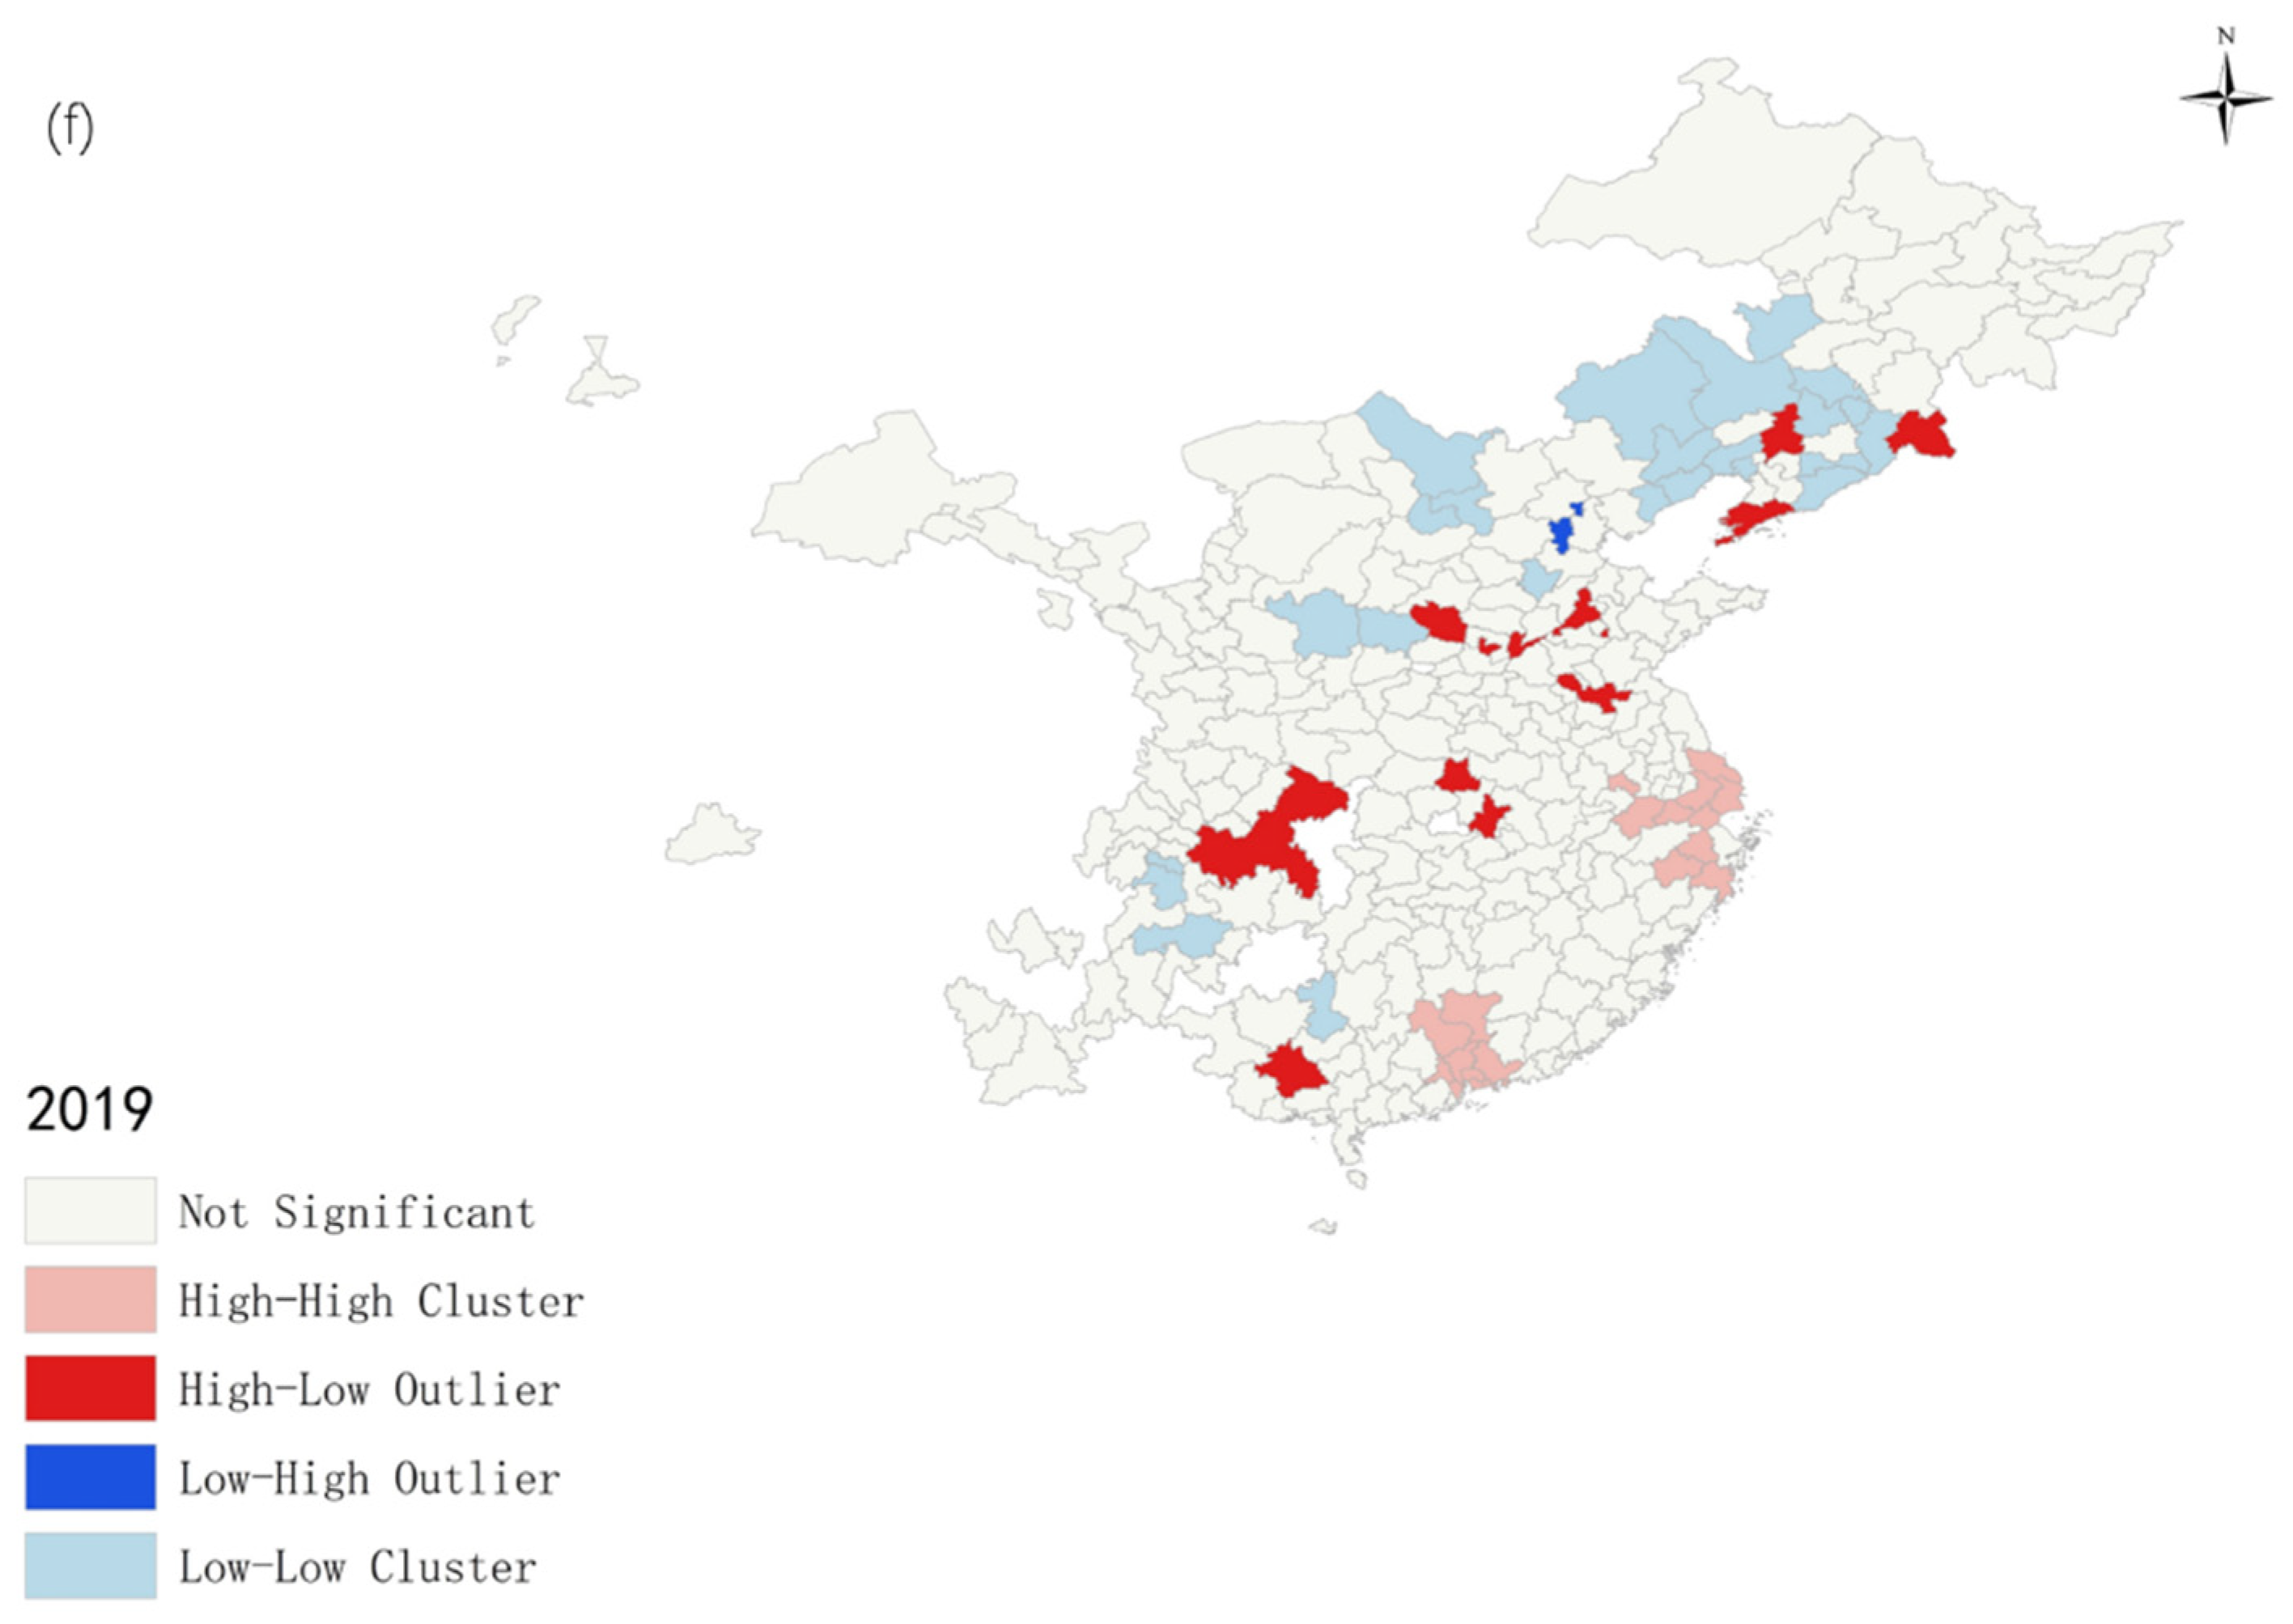
4.3. Spatial Characters Analysis
4.4. Degree of Obstacles
5. Policy Implementations
5.1. Optimize the Environmental Protection Laws and Regulations
5.2. Promote the Development of Public Transportation and Green Infrastructure
5.3. Develop Resource Conservation and Circular Economy
5.4. Establish a Green Financial System Radiating from Big Cities to Small Cities
5.5. Increase Linkage for Green Transition of Different Cities
6. Conclusions
Supplementary Materials
Author Contributions
Funding
Institutional Review Board Statement
Informed Consent Statement
Data Availability Statement
Acknowledgments
Conflicts of Interest
References
- Urban Population (% of Total Population). Available online: https://data.worldbank.org/topic/urban-development (accessed on 29 December 2023).
- Gbanie, S.; Griffin, A.; Thornton, A. Impacts on the Urban Environment: Land Cover Change Trajectories and Landscape Fragmentation in Post-War Western Area, Sierra Leone. Remote Sens. 2018, 10, 129. [Google Scholar] [CrossRef]
- Arroyo-Rodríguez, V.; Fahrig, L.; Tabarelli, M.; Watling, J.I.; Tischendorf, L.; Benchimol, M.; Cazetta, E.; Faria, D.; Leal, I.R.; Melo, F.P.L.; et al. Designing Optimal Human-modified Landscapes for Forest Biodiversity Conservation. Ecol. Lett. 2020, 23, 1404–1420. [Google Scholar] [CrossRef]
- Duan, N.; Li, D.; Wang, P.; Ma, W.; Wenga, T.; Zhong, L.; Chen, G. Comparative Study of Municipal Solid Waste Disposal in Three Chinese Representative Cities. J. Clean. Prod. 2020, 254, 120134. [Google Scholar] [CrossRef]
- Kennedy, C.A.; Ibrahim, N.; Hoornweg, D. Low-Carbon Infrastructure Strategies for Cities. Nat. Clim. Chang. 2014, 4, 343–346. [Google Scholar] [CrossRef]
- Yan, S.R.; Huang, H.L.; Li, W.H.; Wang, L.N.; Tian, M.W.; Yan, H.P. An Empirical Study on the Environmental Effects of Industrial Spatial Agglomeration Since the Reform and Opening-Up. Nat. Environ. Pollut. Technol. 2020, 19, 1335–1342. [Google Scholar] [CrossRef]
- Yu, C.; Li, H.; Jia, X.; Li, Q. Improving Resource Utilization Efficiency in China’s Mineral Resource-Based Cities: A Case Study of Chengde, Hebei Province. Resour. Conserv. Recycl. 2015, 94, 1–10. [Google Scholar] [CrossRef]
- He, S.Y.; Lee, J.; Zhou, T.; Wu, D. Shrinking Cities and Resource-Based Economy: The Economic Restructuring in China’s Mining Cities. Cities 2017, 60, 75–83. [Google Scholar] [CrossRef]
- Takatsuka, H.; Zeng, D.-Z.; Zhao, L. Resource-Based Cities and the Dutch Disease. Resour. Energy Econ. 2015, 40, 57–84. [Google Scholar] [CrossRef]
- Liu, Y.; Fu, B.; Zhao, W.; Wang, S.; Deng, Y. A Solution to the Conflicts of Multiple Planning Boundaries: Landscape Functional Zoning in a Resource-Based City in China. Habitat Int. 2018, 77, 43–55. [Google Scholar] [CrossRef]
- Outline of the 13th Five Year Plan for National Economic and Social Development of the People’s Republic of China. Available online: https://www.gov.cn/xinwen/2016-03/17/content_5054992.htm (accessed on 17 March 2016).
- Jinping, X. Decisive Victory in Building a Moderately Prosperous Society in All Respects and Great Victory in Socialism with Chinese Characteristics in the New Era—Report at the 19th National Congress of the CPC. Available online: https://www.gov.cn/zhuanti/2017-10/27/content_5234876.htm (accessed on 27 October 2017).
- Xu, X.; Zhang, Z.; Long, T.; Sun, S.; Gao, J. Mega-City Region Sustainability Assessment and Obstacles Identification with GIS–Entropy–TOPSIS Model: A Case in Yangtze River Delta Urban Agglomeration, China. J. Clean. Prod. 2021, 294, 126147. [Google Scholar] [CrossRef]
- Wu, X.; Liu, H.; Liu, W. Exploring the Spatiotemporal Evolution Dynamic and Influencing Factor of Green Ecology Transition for Megacities: A Case Study of Chengdu, China. Ecol. Indic. 2024, 158, 111285. [Google Scholar] [CrossRef]
- Metzger, J.; Olsson, A.R. Sustainable Stockholm: Exploring Urban Sustainability in Europe’s Greenest City; Routledge: New York, NY, USA, 2013. [Google Scholar]
- What Significant Changes Have Occurred in China in 2021 after 20 Years of Accession to the WTO. Available online: https://www.ndrc.gov.cn/wsdwhfz/202112/t20211231_1311197_ext.html (accessed on 31 December 2021).
- OECD. OECD Core Set of Indicators for Environmental Performance Reviews; OECD: Paris, France, 1993; Volume 83. [Google Scholar]
- Peng, T.; Deng, H. Comprehensive Evaluation on Water Resource Carrying Capacity Based on DPESBR Framework: A Case Study in Guiyang, Southwest China. J. Clean. Prod. 2020, 268, 122235. [Google Scholar] [CrossRef]
- Kohsaka, R. Developing Biodiversity Indicators for Cities: Applying the DPSIR Model to Nagoya and Integrating Social and Ecological Aspects. Ecol. Res. 2010, 25, 925–936. [Google Scholar] [CrossRef]
- Zhao, R.; Fang, C.; Liu, H.; Liu, X. Evaluating Urban Ecosystem Resilience Using the DPSIR Framework and the ENA Model: A Case Study of 35 Cities in China. Sustain. Cities Soc. 2021, 72, 102997. [Google Scholar] [CrossRef]
- Swangjang, K.; Kornpiphat, P. Does Ecotourism in a Mangrove Area at Klong Kone, Thailand, Conform to Sustainable Tourism? A Case Study Using SWOT and DPSIR. Environ. Dev. Sustain. 2021, 23, 15960–15985. [Google Scholar] [CrossRef]
- Delgado, L.E.; Zúñiga, C.C.; Asún, R.A.; Castro-Díaz, R.; Natenzon, C.E.; Paredes, L.D.; Pérez-Orellana, D.; Quiñones, D.; Sepúlveda, H.H.; Rojas, P.M.; et al. Toward Social-Ecological Coastal Zone Governance of Chiloé Island (Chile) Based on the DPSIR Framework. Sci. Total Environ. 2021, 758, 143999. [Google Scholar] [CrossRef] [PubMed]
- Liu, S.; Deichmann, M.; Moro, M.A.; Andersen, L.S.; Li, F.; Dalgaard, T.; McKnight, U.S. Targeting Sustainable Greenhouse Agriculture Policies in China and Denmark: A Comparative Study. Land Use Policy 2022, 119, 106148. [Google Scholar] [CrossRef]
- Akbari, M.; Memarian, H.; Neamatollahi, E.; Jafari Shalamzari, M.; Alizadeh Noughani, M.; Zakeri, D. Prioritizing Policies and Strategies for Desertification Risk Management Using MCDM–DPSIR Approach in Northeastern Iran. Environ. Dev. Sustain. 2021, 23, 2503–2523. [Google Scholar] [CrossRef]
- Tscherning, K.; Helming, K.; Krippner, B.; Sieber, S.; Paloma, S.G. y Does Research Applying the DPSIR Framework Support Decision Making? Land Use Policy 2012, 29, 102–110. [Google Scholar] [CrossRef]
- Svarstad, H.; Petersen, L.K.; Rothman, D.; Siepel, H.; Wätzold, F. Discursive Biases of the Environmental Research Framework DPSIR. Land Use Policy 2008, 25, 116–125. [Google Scholar] [CrossRef]
- Maxim, L.; Spangenberg, J.H.; O’Connor, M. An Analysis of Risks for Biodiversity under the DPSIR Framework. Ecol. Econ. 2009, 69, 12–23. [Google Scholar] [CrossRef]
- Ghosh, S.; Yadav, V.K.; Mukherjee, V.; Yadav, P. Evaluation of Relative Impact of Aerosols on Photovoltaic Cells through Combined Shannon’s Entropy and Data Envelopment Analysis (DEA). Renew. Energy 2017, 105, 344–353. [Google Scholar] [CrossRef]
- Chakraborty, S. TOPSIS and Modified TOPSIS: A Comparative Analysis. Decis. Anal. J. 2022, 2, 100021. [Google Scholar] [CrossRef]
- Liu, X.; Zhou, X.; Zhu, B.; He, K.; Wang, P. Measuring the Maturity of Carbon Market in China: An Entropy-Based TOPSIS Approach. J. Clean. Prod. 2019, 229, 94–103. [Google Scholar] [CrossRef]
- Islamoglu, M.; Apan, M.; Oztel, A. An Evaluation of the Financial Performance of REITs in Borsa Istanbul: A Case Study Using the Entropy-Based TOPSIS Method. Int. J. Financ. Res. 2015, 6, 124–138. [Google Scholar] [CrossRef]
- Salehi, V.; Zarei, H.; Shirali, G.A.; Hajizadeh, K. An Entropy-Based TOPSIS Approach for Analyzing and Assessing Crisis Management Systems in Petrochemical Industries. J. Loss Prev. Process Ind. 2020, 67, 104241. [Google Scholar] [CrossRef]
- Du, Y.-W.; Gao, K. Ecological Security Evaluation of Marine Ranching with AHP-Entropy-Based TOPSIS: A Case Study of Yantai, China. Mar. Policy 2020, 122, 104223. [Google Scholar] [CrossRef]
- Ge, K.; Wang, Y.; Liu, X.; Lu, X.; Ke, S. Spatio-Temporal Differences and Convergence Mechanisms of Green Transition of Urban Land Use against the Background of Industrial Integration: A Case Study of the Yangtze River Economic Belt in China. Ecol. Indic. 2024, 159, 111727. [Google Scholar] [CrossRef]
- Osório, A. Not Everything Is Green in the Green Transition: Theoretical Considerations on Market Structure, Prices and Competition. J. Clean. Prod. 2023, 427, 139300. [Google Scholar] [CrossRef]
- Zhang, S.; Dong, R.; Jiang, J.; Yang, S.; Cifuentes-Faura, J.; Peng, S.; Feng, Y. Whether the Green Credit Policy Effectively Promote Green Transition of Enterprises in China? Empirical Analysis and Mechanism Verification. Environ. Res. 2024, 244, 117910. [Google Scholar] [CrossRef]
- Li, B.; Shi, Z.; Tian, C. Spatio-Temporal Difference and Influencing Factors of Environmental Adaptability Measurement of Human-Sea Economic System in Liaoning Coastal Area. Chin. Geogr. Sci. 2018, 28, 313–324. [Google Scholar] [CrossRef]
- Wan, L.; Ye, X.; Lee, J.; Lu, X.; Zheng, L.; Wu, K. Effects of Urbanization on Ecosystem Service Values in a Mineral Resource-Based City. Habitat Int. 2015, 46, 54–63. [Google Scholar] [CrossRef]
- Wang, N.; Lee, J.C.K.; Zhang, J.; Chen, H.; Li, H. Evaluation of Urban Circular Economy Development: An Empirical Research of 40 Cities in China. J. Clean. Prod. 2018, 180, 876–887. [Google Scholar] [CrossRef]
- Tang, J.; Tong, M.; Sun, Y.; Du, J.; Liu, N. A Spatio-Temporal Perspective of China’s Industrial Circular Economy Development. Sci. Total Environ. 2020, 706, 135754. [Google Scholar] [CrossRef]
- Zhao, P.; Zeng, L.; Lu, H.; Zhou, Y.; Hu, H.; Wei, X.-Y. Green Economic Efficiency and Its Influencing Factors in China from 2008 to 2017: Based on the Super-SBM Model with Undesirable Outputs and Spatial Dubin Model. Sci. Total Environ. 2020, 741, 140026. [Google Scholar] [CrossRef]
- Li, Q.; Zeng, F.; Liu, S.; Yang, M.; Xu, F. The Effects of China’s Sustainable Development Policy for Resource-Based Cities on Local Industrial Transformation. Resour. Policy 2021, 71, 101940. [Google Scholar] [CrossRef]
- Alao, M.A.; Ayodele, T.R.; Ogunjuyigbe, A.S.O.; Popoola, O.M. Multi-Criteria Decision Based Waste to Energy Technology Selection Using Entropy-Weighted TOPSIS Technique: The Case Study of Lagos, Nigeria. Energy 2020, 201, 117675. [Google Scholar] [CrossRef]
- Wei, X.; Zhao, R.; Xu, J. Spatiotemporal Evolution, Coupling Coordination Degree and Obstacle Factors of Urban High-Quality Development: A Case Study of Anhui Province. Sustainability 2023, 15, 10852. [Google Scholar] [CrossRef]
- Qi, Y.; Wen, F.; Wang, K.; Li, L.; Singh, S. A Fuzzy Comprehensive Evaluation and Entropy Weight Decision-Making Based Method for Power Network Structure Assessment. Int. J. Eng. Sci. Technol. 2010, 2, 92–99. [Google Scholar] [CrossRef]
- Bivand, R.; Müller, W.G.; Reder, M. Power Calculations for Global and Local Moran’s. Comput. Stat. Data Anal. 2009, 53, 2859–2872. [Google Scholar] [CrossRef]
- Khan, S.U.; Cui, Y.; Khan, A.A.; Ali, M.A.S.; Khan, A.; Xia, X.; Liu, G.; Zhao, M. Tracking Sustainable Development Efficiency with Human-Environmental System Relationship: An Application of DPSIR and Super Efficiency SBM Model. Sci. Total Environ. 2021, 783, 146959. [Google Scholar] [CrossRef] [PubMed]
- Yu, J.; Zhang, Z.; Zhou, Y. The Sustainability of China’s Major Mining Cities. Resour. Policy 2008, 33, 12–22. [Google Scholar] [CrossRef]
- Fu, J.; Xiao, G.; Wu, C. Urban Green Transformation in Northeast China: A Comparative Study with Jiangsu, Zhejiang and Guangdong Provinces. J. Clean. Prod. 2020, 273, 122551. [Google Scholar] [CrossRef]
- Tan, J.; Zhang, P.; Lo, K.; Li, J.; Liu, S. The Urban Transition Performance of Resource-Based Cities in Northeast China. Sustainability 2016, 8, 1022. [Google Scholar] [CrossRef]
- Zhang, X.; Ren, Y.; Zhang, D.; Li, K. Construction of the Green Infrastructure Network for Adaption to the Sustainable Future Urban Sprawl: A Case Study of Lanzhou City, Gansu Province, China. Ecol. Indic. 2022, 145, 109715. [Google Scholar] [CrossRef]
- Song, X.; Geng, Y.; Dong, H.; Chen, W. Social Network Analysis on Industrial Symbiosis: A Case of Gujiao Eco-Industrial Park. J. Clean. Prod. 2018, 193, 414–423. [Google Scholar] [CrossRef]


| No. | Indicator Name | Code | Weight | Direction | |
|---|---|---|---|---|---|
| Driver | 1 | GDP per capita (RMB) | DX1 | 0.022 | Positive |
| 2 | Per capita water resources (cubic meters per person) | DX2 | 0.043 | Positive | |
| 3 | Urban land area per capita | DX3 | 0.038 | Positive | |
| 4 | Population density (people/sq km) | DX4 | 0.039 | Negative | |
| Pressure | 5 | Industrial electricity consumption (10,000 kWh) | PX1 | 0.082 | Negative |
| 6 | Total water supply in cities (10,000 tons) | PX2 | 0.054 | Positive | |
| 7 | Electricity consumption in urban households (10,000 kWh) | PX3 | 0.035 | Negative | |
| 8 | Number of registered unemployed persons in urban areas at year-end (person) | PX4 | 0.022 | Negative | |
| State | 9 | Gross industrial output value above designated size (current price, 10,000 yuan) | SX1 | 0.051 | Positive |
| 10 | Actual use of foreign capital in the current year (US $10,000) | SX2 | 0.076 | Positive | |
| 11 | Number of regular secondary schools | SX3 | 0.001 | Positive | |
| 12 | The proportion of added value of tertiary industry to GDP (%) | SX4 | 0.005 | Positive | |
| 13 | The built-up area of the city | SX5 | 0.039 | Positive | |
| 14 | Urbanization rate (%) | SX6 | 0.010 | Positive | |
| Impact | 15 | Industrial soot emissions (tons) | IX1 | 0.053 | Negative |
| 16 | The discharge of industrial wastewater (10,000 tons) includes untreated and treated | IX2 | 0.050 | Negative | |
| 17 | Industrial sulfur dioxide emissions (tons) | IX3 | 0.064 | Negative | |
| 18 | CO2 (million tons) | IX4 | 0.031 | Negative | |
| Response | 19 | Proportion of employees in the tertiary sector (percentage) | RX1 | 0.005 | Positive |
| 20 | Total investment in fixed assets (10,000 yuan) | RX2 | 0.047 | Positive | |
| 21 | Science expenditure (10,000 yuan) | RX3 | 0.090 | Positive | |
| 22 | Education expenditure (10,000 yuan) | RX4 | 0.036 | Positive | |
| 23 | Comprehensive utilization rate of general industrial solid waste (percentage) | RX5 | 0.0066178 | Positive | |
| 24 | Centralized treatment rate of sewage treatment plants (percentage) | RX6 | 0.0079192 | Positive | |
| 25 | Harmless treatment rate of domestic waste (percentage) | RX7 | 0.007 | Positive | |
| 26 | Green coverage of urban built-up areas | RX8 | 0.005 | Positive | |
| 27 | Urban green space per capita (sq m) | RX9 | 0.033 | Positive | |
| 28 | Buses per capita (10,000 people) | RX10 | 0.019 | Positive | |
| 29 | Road area per capita (sq m) | RX11 | 0.018 | Positive |
| Value Range | Status | Level | Feature Description |
|---|---|---|---|
| 0~0.2 | Bad | I | Low level of green transition |
| 0.2~0.4 | Normal | II | The level of green transition is normal and generally meets the needs of people |
| 0.4~0.6 | Good | III | Good green transition level |
| 0.6~1.0 | Excellent | IV | Green transition level is very good |
| Year | Moran’s I | Z | p |
|---|---|---|---|
| 2004 | 0.134 | 3.533 | <0.001 |
| 2007 | 0.140 | 3.983 | <0.001 |
| 2010 | 0.169 | 4.472 | <0.001 |
| 2013 | 0.164 | 4.340 | <0.001 |
| 2016 | 0.163 | 4.297 | <0.001 |
| 2019 | 0.209 | 5.486 | <0.001 |
| Year | Agglomeration Type | Number of Cities | Cities |
|---|---|---|---|
| 2004 (53) | LL | 31 | Shanghai; Shangrao; Dongwan; Lincang; Ulanqab; Wuhai; Xinyang; Nantong; Shamen; Jilin; Tianjin; Xiaogan; Ningde; Anshun; Laibin; Liuzhou; Zhuzhou; Guilin; Wuzhou; Yulin; Wuhan; Yongzhou; Hanzhong; Shantou; Shanwei; Jiangmen; Zhanjiang; Laiwu; Xining; Ganzhou; Handan |
| HH | 7 | Panjin; Shaoxing; Zhongqing; Suizhou; Qingdao; Anshan; Huangshi | |
| HL | 6 | Neijiang; Wenzhou; Maoming; Tongliao; Shaoyang; Jinhua | |
| LH | 9 | Xianning; Loudi; Yichang; Yichun; Xian; Hezhou; Zhangzhi; Fangchenggang; Longnan | |
| 2010 (51) | LL | 28 | Ulanqab; Wuhai; Shamen; Shuangyashan; Changde; Guangyuan; Yanan; Kaifeng; Zhangjiajie; Wuzhou; Shantou; Heyuan; Taian; Taizhou; Baise; Yiyang; Suzhou; Maoming; Laiwu; Xining; Chifeng; Dazhou; Tongliao; Zunyi; Xingtai; Shaoyang; Zhengzhou; Jinhua |
| HH | 10 | Sanya; Sanmenxia; Daqing; Weihai; Loudi; Yichun; Xuancheng; Panjin; Shaoxing; Suihua | |
| HL | 7 | Shangrao; Tianjin; Luzhou; Wenzhou; Zigong; Quzhou; Xiangyang | |
| LH | 6 | Zhongshan; Linyi; Anyang; Baoji; Xuzhou; Xian | |
| 2017 (8) | LL | 3 | Bozhou; Nantong; Xining |
| HH | 3 | Loudi; Yichun; Shaoxing | |
| HL | 2 | Neijiang; Baotou | |
| 2019 (55) | LL | 24 | Shanghai; Lincang; Lishui; Urumqi; Bozhou; Baoshan; Xinyang; Lanzhou; Shiyan; Nanjing; Nanchong; Nantong; Nanyang; Shamen; Shuangyashan; Jian; Jilin; Lüliang; Hulun buir; Zhoushan; Xining; Dazhou; Zhengzhou; Zhangchun |
| HH | 18 | Daqing; Weihai; Loudi; Yichun; Baoji; Xuancheng; Xiuzhou; Chongzuo; Pingdingshan; Xuzhou; Mudanjiang; Yulin; Yuxi; Baishan; Panjin; Qinhuangdao; Shaoxing; Suihua | |
| HL | 12 | Ulanqab; Neijiang; Baotou; Wuzhong; Tianjin; Jincheng; Hanzhong; Jiangmen; Luzhou; Wenzhou; Zigong; Quzhou | |
| LH | 1 | Linyi |
Disclaimer/Publisher’s Note: The statements, opinions and data contained in all publications are solely those of the individual author(s) and contributor(s) and not of MDPI and/or the editor(s). MDPI and/or the editor(s) disclaim responsibility for any injury to people or property resulting from any ideas, methods, instructions or products referred to in the content. |
© 2024 by the authors. Licensee MDPI, Basel, Switzerland. This article is an open access article distributed under the terms and conditions of the Creative Commons Attribution (CC BY) license (https://creativecommons.org/licenses/by/4.0/).
Share and Cite
Yu, Z.; Guo, T.; Song, X.; Zhang, L.; Cai, L.; Zhang, X.; Zhao, A. Green Transition Assessment, Spatial Correlation, and Obstacles Identification: Evidence from Urban Governance Data of 288 Cities in China. Land 2024, 13, 341. https://doi.org/10.3390/land13030341
Yu Z, Guo T, Song X, Zhang L, Cai L, Zhang X, Zhao A. Green Transition Assessment, Spatial Correlation, and Obstacles Identification: Evidence from Urban Governance Data of 288 Cities in China. Land. 2024; 13(3):341. https://doi.org/10.3390/land13030341
Chicago/Turabian StyleYu, Ziao, Tianjiao Guo, Xiaoqian Song, Lifan Zhang, Linmei Cai, Xi Zhang, and Aiwen Zhao. 2024. "Green Transition Assessment, Spatial Correlation, and Obstacles Identification: Evidence from Urban Governance Data of 288 Cities in China" Land 13, no. 3: 341. https://doi.org/10.3390/land13030341