
Spatiotemporal Variation in Wind Erosion in Tarim River Basin from 2010 to 2018
by
 ,
,
Qinqin Zhang
1,2,
Fang Gu
2,
Sicong Zhang
2,
Xuehua Chen
2,
Xue Ding
1,3,4 and
Zhonglin Xu
1,3,4,* 1
College of Ecology and Environment, Xinjiang University, Urumqi 830017, China
2
Xinjiang Academy of Surveying and Mapping, Urumqi 830002, China
3
Technology Innovation Center for Ecological Monitoring and Restoration of Desert-Oasis, Ministry of Natural Resources, Urumqi 830002, China
4
Key Laboratory of Oasis Ecology, Ministry of Education, Xinjiang University, Urumqi 830017, China
*
Author to whom correspondence should be addressed.
Land 2024, 13(3), 330; https://doi.org/10.3390/land13030330
Submission received: 21 January 2024
/
Revised: 28 February 2024
/
Accepted: 1 March 2024
/
Published: 5 March 2024
(This article belongs to the Special Issue Land Degradation in Environmentally Sensitive Areas (ESA) : Assessment and Conservation)
Abstract
:The Tarim River Basin, China’s largest inland river basin, is renowned for its ecological fragility characterized by concurrent greening and desertification processes. Soil wind erosion emerges as a critical factor impacting the natural ecosystem of this region. This study employs a soil wind erosion model tailored to cultivated land, grassland, and desert terrains to analyze the multitemporal characteristics of and spatial variations in soil wind erosion across nine subbasins within the Tarim River Basin, utilizing observed data from 2010, 2015, and 2018. Additionally, this study investigates the influence of various factors, particularly wind speed, on the soil wind erosion dynamics. Following established standards of soil erosion classification, the intensity levels of soil erosion are assessed for each calculation grid within the study area alongside an analysis of the environmental factors influencing soil erosion. Findings indicate that approximately 38.79% of the total study area experiences soil wind erosion, with the Qarqan River Basin exhibiting the highest erosion modulus and the Aksu River Basin registering the lowest. Light and moderate erosion predominates in the Tarim River Basin, with an overall decreasing trend observed over the study period. Notably, the Qiemo River Basin, Dina River Basin, and Kaidu Kongque River Basin display relatively higher proportions of eroded area compared to their total subbasin area. Furthermore, this study underscores the substantial influence of the annual average wind speed on soil erosion within the study area, advocating for prioritizing soil and water conservation programs, particularly in the downstream regions of the Tarim River Basin, to mitigate future environmental degradation.
1. Introduction
Soil wind erosion is a natural process of soil transportation and deposition by the wind. This is a common phenomenon, mainly occurring in dry sandy soil or any loose, dry, and fine-grained soil. Wind erosion causes a wide range of ecological and environmental problems, such as land desertification [1], crop yield reduction [2], sandstorms [3], and the deterioration of human settlements [4] by removing and depositing soil from one place to another. Given its detrimental impacts and extensive repercussions, soil wind erosion represents a critical scientific issue within arid and semi-arid regions. Beginning in the 1920s, researchers from the United States and the former Soviet Union embarked on comprehensive studies aimed at unraveling the processes, mechanisms, and principal factors influencing soil wind erosion, particularly focusing on the Great Plains of the Midwest United States and the expansive steppes of central Asia. This body of research has laid a foundational understanding, guiding subsequent investigations into the complexities of soil wind erosion and its significant environmental implications. In 1965, the United States Department of Agriculture (USDA) established the wind erosion equation (WEQ) for the first time to estimate the amount of soil wind erosion of cultivated land in the Great Plains [5]. The wind erosion prediction system (WEPS), developed from the wind erosion equation (WEQ), is a process-based high-resolution model designed to simulate weather, field conditions, and erosion dynamics [6]. The Bocharov soil wind erosion model [7], established by former Soviet Union soil scientists in 1984, takes human activity factors into account and provides an innovative idea for erosion prediction. Corresponding works in China began in the 1970s, which were accompanied by continuous and in-depth research on desertification [8]. Representative research focused on the impact of soil mechanical composition [9], water content [10,11], ploughing [12], livestock trampling [13], and other factors on soil wind erosion and the characteristics of erosion related to specific surfaces [14,15,16]. Based on these basic studies, Chinese scientists have developed mechanistic [17,18,19] and empirical models for different underlying surfaces (farmland, grassland, shrubbery, and sandy land) [20,21,22].
With the development of remote sensing technology, it is possible to monitor soil wind erosion in a large scale [23,24]. On this basis, a quantitative method has been carried out [25]. Such a method can be summarized into three categories. The first one is based on field surveys and a soil wind erosion model [26]. The second one uses remote sensing to retrieve soil wind erosion characteristics across a wide geographic range [27,28,29]. The third one estimates the spatial and temporal distribution of soil wind erosion by combining field surveys, remote sensing, erosion simulation, and land use reclassification [30,31,32].
Currently, the soil wind erosion models established by scientists have become instrumental in simulating, monitoring, and mitigating soil erosion in arid areas [33]. However, it is worth noting that these models have constraints that limit their application. For example, WEPS requires detailed input data about soil properties, crop systems, climate, and management practices. In areas where these data are not readily available or are of poor quality, the predictions made by WEPS may be less accurate [33]. In addition, WEPS is designed for field-scale predictions and might not be as effective for larger or smaller scales. It is also more suited for short to medium-term predictions and may not be as reliable for long-term forecasting [34]. A comparative study of the WEPP and SWAT models found that using soil wind erosion climate factors to represent soil moisture factors is not theoretically applicable to arid, semi-arid, and semi humid regions [35]. Hence, investigating soil wind erosion models tailored for typical arid and semi-arid regions holds significant importance for the sustainable development of these areas.
The Tarim River stands as the largest inland river within China. The arid climate prevailing across the Tarim River Basin renders it one of the nation’s most susceptible regions [36]. Various natural adversities, notably spring droughts, soil desiccation, wind erosion, and sandstorms, significantly impede the socio-economic advancement of this locale. Among these challenges, the deterioration of soil and air quality, exacerbated by wind-driven erosion, poses severe threats to both socio-economic prosperity and natural ecosystems, rendering them particularly vulnerable. Hence, attaining a comprehensive, systematic, and precise comprehension of soil wind erosion within the Tarim River Basin is imperative for elucidating the dynamics of water and soil loss in this region. Furthermore, such an understanding forms a critical foundation for devising overarching strategies for ecological restoration within the Tarim River Basin.
Against this backdrop, the present study endeavors to achieve the following objectives: (1) systematically investigate the spatiotemporal dynamics of soil wind erosion within the Tarim River Basin based on observed data from 2010, 2015, and 2018; (2) analyze the evolving multitemporal variations in soil wind erosion within the mainstem region of the Tarim River and its nine subbasins; and (3) delve into the driving forces and underlying mechanisms governing soil wind erosion in the Tarim River Basin. In summary, our aim is to delineate priority areas necessitating the implementation of soil and water conservation initiatives within the Tarim River Basin. This research endeavor not only enriches our understanding of soil wind erosion characteristics in quintessential inland river basins situated within the arid domains of central Asia but also furnishes crucial insights indispensable for formulating macro-policies aimed at mitigating soil and water losses.
2. Materials and Methods
2.1. Study Area
The Tarim River Basin is located in the south of southern Xinjiang (northwest part of China), with the Tianshan Mountains in the north, the Pamir Mountains Plateau in the west, the Kunlun Mountains and Arguin Mountains in the south, the Kuruktag Mountains in the east, and the Taklamakan Desert in the middle of Tarim River Basin. The study area includes nine subbasins (Aksu River Basin, Kashgar River Basin, Yarkand River Basin, Hotan River Basin, Kaidu Kongque River Basin, Dina River Basin, Weigan Kuqa River Basin, Keriya River Basin, and Qiemo River Basin) with an area of about 550,000 km2 (Figure 1).
The Tarim River Basin features a unique climate, positioning it among the most arid regions globally. Annually, it receives scant precipitation, frequently less than 50 mm, primarily because it lies in the rain shadow of adjacent mountain ranges, including the Tianshan Mountains to the north and the Kunlun Mountains to the south. The region experiences extreme temperatures due to its continental climate [36]. Summers can be very hot, with temperatures often exceeding 40 °C, while winters can be extremely cold, with temperatures dropping well below freezing. Humidity levels in the Tarim River Basin are generally low throughout the year, contributing to the overall arid conditions. The basin is known for its strong winds and frequent dust storms, particularly in the spring [37]. These can be attributed to the dry, barren landscape and the temperature gradients between the hot desert and the cooler mountains. While generally dry, the basin does receive some precipitation, which is highly variable and largely dependent on the season and specific location within the basin. The mountainous regions, in particular, receive more precipitation, often as snow, significantly contributing to the river’s flow [38].
The vegetation of the Tarim River Basin consists of mountain vegetation and plain vegetation. In the mainstream region of the Tarim River, the tree species are mainly Populus euphratica, the shrub species include Tamarix chinensis Lour and Halostachys caspica (M. Bieb.) C. A. Mey., and there are also Haloxylon ammodendron (C. A. Mey.) Bunge, Halimodendron halodendron (Pall.) Voss, etc. The herbs mainly include Phragmites australis, Apocynum venetum L., Glycyrrhiza uralensis Fisch, Karelinia caspia (Pall.) Less., Alhagi sparsifolia, etc.
2.2. Data Sources
Some of the data that are important in calculating soil wind erosion are shown in Table 1. Specifically, the fractional vegetation cover (FVC; the resolution is 30 m) was obtained by using the conversion model from the normalized difference vegetation index (NDVI, extracted via the Google Earth Engine platform) to the FVC. The land cover (at 0.5 m resolution) was based on a national basic survey program, which was based on the Land Use Status Classification Standard (GB/T 21010-2007) [39].
We also integrated a suite of environmental datasets to investigate the interplay between vegetation health, soil properties, human impact, and climatic variables on soil wind erosion. The NDVI data, serving as a proxy for vegetation health and productivity, were sourced from NASA’s EarthData Search (https://www.earthdata.nasa.gov/, accessed on 8 May 2023), which provides access to MODIS and Landsat satellite imagery. The soil water content and sand content were obtained from ISRIC’s SoilGrids (https://soilgrids.org/, accessed on 12 June 2023), offering high-resolution global soil information. The human footprint index, reflecting the cumulative impact of human activities on terrestrial systems, was derived from datasets available through the Socioeconomic Data and Applications Center (SEDAC, https://sedac.ciesin.columbia.edu/, accessed on 16 July 2023). Climate variables, including the mean annual temperature and mean annual precipitation, were sourced from WorldClim (https://worldclim.org/, accessed on 16 July 2023), which offers global climate data suitable for ecological and environmental modeling. The integration of these datasets allowed for a comprehensive analysis of the environmental factors influencing soil wind erosion, highlighting the significance of multidimensional environmental data in understanding and managing ecosystems.
2.3. Soil Wind Erosion Model
In this study, we used models for different land use types (cultivated land, grass land, and sand model) adopted in the first national water conservancy survey adopted by the Chinese State Council. On this basis, according to the standards of Soil Erosion Classification (SL 190-2007) [40], the area, spatial distribution, and soil wind erosion area of different erosion intensities were determined.
The cultivated land model is:
where is the soil wind erosion modulus of cultivated land t/(hm2·a), W is the topsoil moisture factor, is the cumulative time of each wind speed grade during the occurrence of soil wind erosion in a year, min, is the surface roughness, is the wind speed revision factor related to tillage practices, is the wind factor, and , , and are constants related to soil type, and their values are shown in the Technical Regulations for Dynamic Monitoring of Regional Soil and Water Loss trial.
The grass (shrub) model is:
where is the soil wind erosion modulus of grassland, is the vegetation coverage, and , , and are constants related to soil type. The other parameters have the same meaning as Equation (1).
The desert model is delineated by:
where is the soil wind erosion modulus of sandy land, and , , and are constants related to soil type. The other parameters have the same meanings as Equations (1) and (2).
In refining the calculation of the erosion modulus for the Tarim River Basin, the categorization of soil types linked to erosion was enhanced. For example, on the basis of the existing land use classification, four typical land types, including saline–alkali land, sand barrier, industrial facilities, and impervious surfaces, were extracted. These categories were incorporated to refine the calculation of the soil wind erosion in typical areas of the Tarim River Basin. Furthermore, for gravel-covered surfaces, the modeled result was adjusted according to the proportion of gravel. The soil wind erosion of undeveloped saline–alkali land was not included in the calculation. However, for those that have been developed, their erosion was calculated in accordance with desert conditions. For surfaces covered by sand barriers, the field observation was used to adjust the corresponding results.
2.4. Classification of Soil Wind Erosion Intensity
After obtaining the biweekly soil wind erosion modulus of cultivated land, grassland, and desert, we firstly added up these biweekly data during the monitoring period in order to gain the total erosion modulus. Then, according to the standards of Soil Erosion Classification (SL 190-2007) [40], the soil erosion intensity level of each calculating grid and the entire study area was determined.
2.5. Statistical Analysis
We employed correlation analysis to examine the strength and direction of the association between soil wind erosion and environmental variables. The Pearson correlation coefficient (r) was calculated to quantify the linear relationship between the variables. A correlation coefficient close to 1 indicates a strong positive relationship, while a coefficient close to -1 indicates a strong negative relationship. A coefficient around 0 suggests no linear correlation. Regression analysis was conducted to model the relationship between the dependent variable, soil wind erosion, and six independent variables, namely, the NDVI, soil water content, sand content, human footprint index, mean annual temperature, and mean annual precipitation. We utilized a linear regression model to predict the soil wind erosion based on the independent variables. The model’s coefficients were estimated using the ordinary least-squares method, providing insights into the impact of each independent variable on the dependent variable. The goodness-of-fit of the model was evaluated through the R-squared method.
3. Results
3.1. Spatial Variation in Soil Wind Erosion
In general, the soil wind erosion exhibited an increasing trend from the west (upper reach of the Tarim River Basin) to the east (middle and lower reach of the Tarim River Basin) part of the study area. In the west part, the erosion modulus was relatively lower; in comparison, the erosion modulus was relatively higher. The status of the soil wind erosion of each subbasin of the Tarim River Basin was different (Figure 2). The area of the soil wind erosion of the subbasins was sorted as follows: Kaidu Kongque River Basin > Qarqan River Basin > Hotan River Basin > Mainstream of Tarim River > Yarkand River Basin > Keriya River Basin > Kashgar River Basin > Aksu River Basin > Dina River Basin > Weigan Kuqa River Basin. The areas with severe soil wind erosion were mainly distributed in Kaidu Kongque River Basin, Qarqan River Basin, Hotan River Basin, and the mainstream of the Tarim River. The Kaidu Kongque River Basin, Qarqan River Basin, Hotan River Basin, and the mainstream of Tarim River are also the four regions with the largest desert area in the study area. At the same time, the Qarqan River Basin, Hotan River Basin, and the mainstream of Tarim River are the regions with the smallest grassland (or shrub) vegetation coverage in the study area. The proportion of erosion area (to the total area of basin) was higher in the Kaidu Kongque River Basin, Dina River Basin, and Qarqan River Basin compared with the other river basins (Figure 2).
In 2018, the average soil wind erosion modulus in the Tarim River Basin was 1539.33 t·km−2·a−1, with a soil wind erosion area of 214,441.39 km2. This accounted for approximately 38.79% of the Tarim River Basin’s total area. Mild erosion accounted for 67.84% of the total erosion area, followed by moderate erosion (accounting for 13.16%), and strong and above erosion was less than 10.00%. There were significant differences in the soil wind erosion modulus among the subbasins of the Tarim River Basin, with an average soil wind erosion modulus ranging from 274.83 to 4537.20 t·km−2·a−1 (Figure 3). The average value of the soil wind erosion modulus, from large to small, was in the following order: Qarqan River Basin, Kaidu Kongque River Basin, mainstream of Tarim River, Dina River Basin, Kashgar River Basin, Kriya River Basin, Hotan River Basin, Weigan Kuche River Basin, Yarkand River Basin, and Aksu River Basin (Figure 4).
Significant variations were observed in the intensity of soil wind erosion across the different subbasins. In 2018, the proportion of the light erosion area to the total erosion area in the mainstream region of the Tarim River and the Qarqan River basin was 34.64% and 38.53%, respectively, while in the other basins, it ranged from 70.70% to 91.78%, with an average of 81.31% (Figure 4). The proportions of the medium erosion area in the mainstream region of the Tarim River, Keriya River, Weigan Kuche River, Qarqan River, and Hotan River basins to the total erosion area (from 10.88% to 36.45%) were relatively higher compare with the other river basins (with an average of 6.15%). The proportions of the strong erosion area in the Qarqan River and Dina River basins to the total erosion area ranged from 12.34% to 20.28%, with an average of 3.49% in the other basins. The proportions of the extremely strong and severe erosion areas in the Qarqan River Basin, the mainstream region of the Tarim River, and the Kaidu Kongque River Basin were relatively higher than the other regions (Figure 4).
3.2. Multitemporal Variation of Soil Wind Erosion
The average soil wind erosion area (average value of 2010, 2015 and 2018) of the study area was 217,355.14 km2, which accounted for about 38.79% of the area in the monitoring area of the Tarim River Basin. Compared to 2010, the total area of soil wind erosion decreased by 9581.78 km2 in 2018, which accounted for 4.28% of the total erosion area in 2010 (Table 2). Among these different kinds of erosion intensities (light, medium, strong, extremely strong, and severe), the light-intensity erosion decreased from 2010 to 2015 and then increased slightly to 2018, exhibiting a decreasing trend in the study area from 2010 to 2018. The medium-intensity erosion was exactly the opposite of the light-intensity erosion, and it obtained an increasing–decreasing trend during the study period. The strong-intensity erosion continuously increased from 2010 to 2018 (Table 2), whereas the extremely strong-intensity erosion continuously decreased. The severe erosion demonstrated a trend in line with that of the light-intensity erosion (Table 2).
We calculated the average area of wind erosion for the nine subbasins and the mainstream region of the Tarim River. We found that the Kaidu Kongque River Basin obtained the highest average area of wind erosion (46,752.03 km2) among the nine subbasins and the mainstream region of Tarim River, although the area decreased from 50,372.96 km2 in 2010 to 45,562.77 km2 in 2015 and to 44,320.37 km2 in 2018 (Figure 2). The Qarqan River Basin also had a relatively higher area of erosion, with an average area of 35,110.10 km2 during the study period. In comparison, the erosion area of the Weigan Kuqa River Basin and the Dina River Basin were relatively lower among the nine subbasins and the mainstream region of Tarim River, with an average area of 9857.71 km2 and 10,654.27 km2, respectively, from 2010 to 2018 (Figure 2). Among these nine subbasins and the mainstream region of the Tarim River, the erosion area of the Yarkand River Basin, Hotan River Basin, Kaidu Kongque River Basin, Keriya River Basin, and Qarqan River Basin showed a decreasing trend from 2010 to 2018. In comparison, the mainstream region of the Tarim River, the Aksu River Basin, the Kashgar River Basin, and the Dina River Basin displayed a decreasing–increasing trend during the study period. In addition, the Weigan Kuqa River Basin showed an increasing trend from 2010 to 2018. The average proportion of the erosion area to the total area in these nine subbasins and the mainstream region of Tarim River was also worth investigating. We found that the Qarqan River Basin obtained the highest average proportion, with a value of 83.54%, which indicates that the soil wind erosion was widespread in the basin (Figure 2). Additionally, the Kaidu Kongque River Basin and Dina River Basin possessed a relatively higher proportion of erosion area to the total basin’s area, with values of 63.46% and 58.71%, respectively. In comparison, the proportion was relatively lower in the mainstream region of the Tarim River, the Aksu River Basin, the Kashgar River Basin, the Yarkand River Basin, the Hotan River Basin, the Weigan Kuqa River Basin, and the Keriya River Basin, especially the Aksu River Basin, where the average proportion during the study period was only 18.80%, indicating a relatively scarce level of soil wind erosion in the basin (Figure 2).
3.3. The Impact of Environmental Variables on Wind Erosion
In our detailed investigation into the various factors affecting soil wind erosion, we meticulously evaluated the roles of the NDVI, soil water content, sand content, human footprint index, mean annual temperature, and mean annual precipitation. Through rigorous statistical methodologies, our research unveiled nuanced insights into their interactions with soil wind erosion. Notably, the analysis identified the NDVI and human footprint index as significant negative influencers on soil wind erosion, with correlation coefficients (r2) of 0.12 and 0.18, respectively, and with statistical significance (p < 0.05, Figure 5). The mean annual precipitation was negatively correlated with soil wind erosion, presenting a correlation coefficient (r2) of 0.31 with statistical significance (p < 0.05). This suggests that increased precipitation levels are associated with reduced soil wind erosion, possibly due to enhanced vegetation growth and soil cohesion from moisture, which in turn protect the soil surface from wind detachment and transportation. Interestingly, this study did not find significant correlations between soil wind erosion and the other factors examined, namely, the soil water content, sand content, and mean annual temperature.
4. Discussions
4.1. The Reliability of Our Method
In this study, we employed models that were previously utilized in the inaugural national water conservancy survey, endorsed by the Chinese State Council, to simulate the spatiotemporal variations in the soil wind erosion within our designated study area. The models were specified to different land use types (cultivated land, grass land, and sand model). Our findings indicate that the soil wind erosion intensity was generally higher in the eastern part of the study area, situated in the middle and lower reaches of the Tarim River Basin. It was reported that the WEPS-model-simulated wind erosion is relatively higher in Wuqia County, at the Tieganlike station, in Ruoqiang County, in Wensu County, in Tacheng County, in Kelamayi City, in Mulei county, in Akedala County, at the Shisanjianfang station, at the Hongliuhe station, and at the Kumishi station among the 64 stations in Xinjiang Province [41]. It should be noted that Wuqia County, the Tieganlike station, and Wensu County were within our study area and are located in the middle reach of the Tarim River Rasin, and Ruoqiang County is located in the lower reach of the basin, indicating the reasonability of our method. In addition, another study on soil erosion observation and simulation in the Taklimakan Desert revealed that the soil wind erosion intensity is 10 ug·m−2·s−1 at the upper reach of the Keriya River Basin, which is equivalent to 315.36 t·km−2·a−1 [42]. In the present study, we also found that the soil wind erosion at the upper reach of the Keriya River Basin belongs to the light-intensity type, which corresponds to from 200 to 2500 t·km−2·a−1 in terms of the erosion modulus according to the national standards of Soil Erosion Classification (SL 190-2007) [40]. The similarity of the corresponding research further proved the reliability of our method.
4.2. The Drivers of Soil Wind Erosion in the Tarim River Basin
Compared with 2010, the area of soil wind erosion in the Tarim River Basin in 2015 decreased by 10,422.29 km2; among the different erosion types, the areas of light, extremely strong, and severe erosion decreased by 9237.25 km2, 875.97 km2, and 1207.22 km2, respectively. However, medium and strong erosion increased by 357.05 km2 and 541.11 km2, respectively. At the same time, the increase in the area of erosion does not mean that strong erosion was transformed into light or medium erosion but that the original moderate and strong erosion was transformed into the erosion type with a lower intensity, and the original extremely strong and severe erosion was transformed into moderate and strong erosion, which has been reported elsewhere [43] and is the result of the joint action of human activities and natural factors [44].
The impact of human activities is mainly reflected in the following two aspects: Firstly, some projects implemented in the research area (such as sand barriers, soil stubble, farmland film covering, and the construction of photovoltaic facilities) have increased the surface roughness, increased the critical starting wind speed for soil wind erosion, changed the structure of the near-surface airflow, avoided direct wind action on surface soil particles, and reduced the force of airflow on surface soil particles, which in turn has led to a decrease in the modulus of surface soil wind erosion [45]. Secondly, changes in the surface vegetation cover have led to changes in the soil wind erosion. Compared to 2010, in 2015, there was a total increase of 766.79 km2 in arable land, forest land, and grassland, and the sand and gravel surface decreased by 2588.03 km2; therefore, the changes in the area of these land use/cover types have led to corresponding changes in the erosion area involved in the calculation.
As presented previously, the vegetation delineated by the NDVI is an important variable that influences soil wind erosion. Plants and their roots stabilize the soil, making it harder for the wind to pick up and transport soil particles. When vegetation is sparse or absent, such as in deserts or areas affected by deforestation, soil becomes more vulnerable to wind erosion. In our study area, the vegetation coverage underwent profound changes; in 2015, the vegetation coverage increased by 47.52% compared to 2010, thus effectively reducing the soil wind erosion on exposed surfaces, as mentioned in a previous study [46]. In areas with higher precipitation, we also observed a negative correlation between precipitation and wind erosion. The observation that areas with higher precipitation levels exhibit more robust vegetation cover led to the identification of a negative correlation between precipitation and wind erosion. This relationship can be understood through several key mechanisms that underscore the protective role of vegetation against soil degradation processes. Firstly, vegetation anchors soil through complex root systems, which consolidate soil particles and enhance soil stability. This root-induced cohesion significantly diminishes the susceptibility of soil to wind erosion by preventing the dislodgment of soil particles. Secondly, the physical presence of vegetation above ground acts as a barrier to wind, effectively reducing the wind velocity at the soil surface. This reduction in wind speed directly influences the wind’s capacity to mobilize and transport soil particles, thus mitigating wind erosion. In addition, increased precipitation contributes to higher soil moisture levels, which, in turn, make soil particles heavier and more resistant to aeolian transport. But, interestingly, we did not find any significant relationship between the soil water content and erosion modulus, which demonstrates that the complex interplay between the soil water content and erosion processes is influenced by multiple soil properties, environmental conditions, and external factors. A comprehensive analysis considering these multifaceted interactions is essential to elucidate the nuanced effects of soil moisture on erosion dynamics.
Beyond factors like the NDVI, human activity, and precipitation, wind emerges as a pivotal natural force in soil wind erosion, which is especially pronounced in arid and semi-arid regions. The phenomenon occurs as strong winds lift and transport loose soil particles, significantly eroding topsoil and degrading land. Among the influences, the wind speed is paramount; stronger winds have the energy to mobilize larger soil particles over greater distances, exacerbating erosion [47]. We investigated the linear relationship between the annual average wind speed and erosion intensity at 46 points selected randomly within the study area and found that there exists a significant linear relationship between them (Figure 6). In addition, this process underscores the necessity of integrating wind speed with other variables in erosion studies to accurately assess and mitigate the impact [48].
5. Conclusions
In summary, our study delved into the spatiotemporal dynamics of soil wind erosion within the Tarim River Basin, employing a specialized soil wind erosion model. Several key conclusions emerge from our analysis: Firstly, the soil wind erosion area encompassed approximately 40% of the basin’s total area, primarily characterized by mild erosion. Although the proportion of the soil wind erosion area in the Tarim River Basin fell below the average for the Xinjiang Uygur Autonomous Region, it surpassed the average for northern China. Secondly, our findings reveal that, as of 2018, soil wind erosion hotspots are concentrated in the Kaidu Kongque River Basin, Qarqan River Basin, Hotan River Basin, and the mainstream region of the Tarim River. Thirdly, a positive trend was observed, as the total area affected by soil wind erosion has decreased since 2010, indicating a gradual improvement in the natural environment of the Tarim River Basin. Lastly, our study underscores the imperative for prioritizing soil and water conservation efforts, particularly in the downstream regions of the Tarim River Basin, to safeguard against further environmental degradation. These findings collectively provide valuable insights for informing targeted conservation strategies aimed at preserving the ecological integrity of this vital basin.
Author Contributions
Conceptualization, Q.Z. and Z.X.; methodology, Q.Z. and F.G.; software, Q.Z. and F.G.; validation, Q.Z. and S.Z.; formal analysis, Q.Z. and S.Z.; investigation, Q.Z., F.G., S.Z. and X.C.; resources, Q.Z.; data curation, Q.Z.; writing—original draft preparation, Q.Z., X.D. and Z.X.; writing—review and editing, Q.Z. and Z.X.; visualization, Q.Z., F.G., S.Z. and X.C.; supervision, Z.X.; project administration, Z.X.; funding acquisition, Z.X. All authors have read and agreed to the published version of the manuscript.
Funding
This research was funded by the Natural Science Foundation of Xinjiang Uygur Autonomous Region (No. 2022D01C399 and No. 2022E01052).
Data Availability Statement
The original contributions presented in the study are included in the article, further inquiries can be directed to the corresponding author.
Acknowledgments
The authors would like to thank the associate editor and the anonymous reviewers for their valuable comments and constructive suggestions. We also acknowledge the support of Xu Ma.
Conflicts of Interest
The authors declare no conflicts of interest.
References
- Chepil, W. Dynamics of wind erosion: I. Nature of movement of soil by wind. Soil Sci. 1945, 60, 305–320. [Google Scholar] [CrossRef]
- Lyles, L. Possible effects of wind erosion on soil productivity. J. Soil Water Conserv. 1975, 30, 279–283. [Google Scholar]
- Wu, Z.; Wang, M.; Zhang, H.; Du, Z. Vegetation and soil wind erosion dynamics of sandstorm control programs in the agro-pastoral transitional zone of northern China. Front. Earth Sci. 2019, 13, 430–443. [Google Scholar] [CrossRef]
- Bartkowski, B.; Schepanski, K.; Bredenbeck, S.; Müller, B. Wind erosion in european agricultural landscapes: More than physics. People Nat. 2023, 5, 34–44. [Google Scholar] [CrossRef]
- Woodruff, N.P.; Siddoway, F. A wind erosion equation. Soil Sci. Soc. Am. J. 1965, 29, 602–608. [Google Scholar] [CrossRef]
- Wagner, L.E. A history of wind erosion prediction models in the united states department of agriculture: The wind erosion prediction system (weps). Aeolian Res. 2013, 10, 9–24. [Google Scholar] [CrossRef]
- Bocharov, A. A Description of Devices Used in the Study of Wind Erosion of Soils; AA Balkema: Rotterdam, The Netherlands, 1984. [Google Scholar]
- Wang, F.; Pan, X.; Wang, D.; Shen, C.; Lu, Q. Combating desertification in China: Past, present and future. Land Use Policy 2013, 31, 311–313. [Google Scholar] [CrossRef]
- Yang, X.; Zhu, Z.; Jaekel, D.; Owen, L.; Han, J. Late quaternary palaeoenvironment change and landscape evolution along the keriya river, xinjiang, China: The relationship between high mountain glaciation and landscape evolution in foreland desert regions. Quat. Int. 2002, 97, 155–166. [Google Scholar] [CrossRef]
- Dong, Z.; Li, S.; Zhao, Y.; Lei, J.; Wang, Y.; Li, C. Stable oxygen-hydrogen isotopes reveal water use strategies of tamarix taklamakanensis in the Taklimakan desert, China. J. Arid Land 2020, 12, 115–129. [Google Scholar] [CrossRef]
- Hao, X.-M.; Li, C.; Guo, B.; Ma, J.-X.; Ayup, M.; Chen, Z.-S. Dew formation and its long-term trend in a desert riparian forest ecosystem on the eastern edge of the taklimakan desert in China. J. Hydrol. 2012, 472, 90–98. [Google Scholar] [CrossRef]
- Chen, Z.; Cui, H.; Wu, P.; Zhao, Y.; Sun, Y. Study on the optimal intercropping width to control wind erosion in north China. Soil Tillage Res. 2010, 110, 230–235. [Google Scholar] [CrossRef]
- Du, H.; Zuo, X.; Li, S.; Wang, T.; Xue, X. Wind erosion changes induced by different grazing intensities in the desert steppe, northern China. Agric. Ecosyst. Environ. 2019, 274, 1–13. [Google Scholar] [CrossRef]
- Li, D.; Xu, E.; Zhang, H. Influence of ecological land change on wind erosion prevention service in arid area of northwest China from 1990 to 2015. Ecol. Indic. 2020, 117, 106686. [Google Scholar] [CrossRef]
- Chi, W.; Zhao, Y.; Kuang, W.; He, H. Impacts of anthropogenic land use/cover changes on soil wind erosion in China. Sci. Total Environ. 2019, 668, 204–215. [Google Scholar] [CrossRef] [PubMed]
- Du, H.; Wang, T.; Xue, X. Potential wind erosion rate response to climate and land-use changes in the watershed of the ningxia–inner mongolia reach of the yellow river, China, 1986–2013. Earth Surf. Process. Landf. 2017, 42, 1923–1937. [Google Scholar] [CrossRef]
- Chen, C.; Zhao, G.; Zhang, Y.; Bai, Y.; Tian, P.; Mu, X.; Tian, X. Linkages between soil erosion and long-term changes of landscape pattern in a small watershed on the chinese loess plateau. CATENA 2023, 220, 106659. [Google Scholar] [CrossRef]
- Dai, T.; Wang, L.; Li, T.; Qiu, P.; Wang, J. Study on the characteristics of soil erosion in the black soil area of northeast China under natural rainfall conditions: The case of sunjiagou small watershed. Sustainability 2022, 14, 8284. [Google Scholar] [CrossRef]
- Shi, Z.; Cai, C.; Ding, S.; Wang, T.; Chow, T. Soil conservation planning at the small watershed level using rusle with gis: A case study in the three gorge area of China. CATENA 2004, 55, 33–48. [Google Scholar] [CrossRef]
- Chen, J.; Xiao, H.; Li, Z.; Liu, C.; Wang, D.; Wang, L.; Tang, C. Threshold effects of vegetation coverage on soil erosion control in small watersheds of the red soil hilly region in China. Ecol. Eng. 2019, 132, 109–114. [Google Scholar] [CrossRef]
- Zhang, Z.; Sheng, L.; Yang, J.; Chen, X.-A.; Kong, L.; Wagan, B. Effects of land use and slope gradient on soil erosion in a red soil hilly watershed of southern China. Sustainability 2015, 7, 14309–14325. [Google Scholar] [CrossRef]
- Wei, J.-B.; Xiao, D.-N.; Zeng, H.; Fu, Y.-K. Spatial variability of soil properties in relation to land use and topography in a typical small watershed of the black soil region, northeastern China. Environ. Geol. 2008, 53, 1663–1672. [Google Scholar] [CrossRef]
- Sepuru, T.K.; Dube, T. An appraisal on the progress of remote sensing applications in soil erosion mapping and monitoring. Remote Sens. Appl. Soc. Environ. 2018, 9, 1–9. [Google Scholar] [CrossRef]
- King, C.; Baghdadi, N.; Lecomte, V.; Cerdan, O. The application of remote-sensing data to monitoring and modelling of soil erosion. CATENA 2005, 62, 79–93. [Google Scholar] [CrossRef]
- García-Ruiz, J.M.; Beguería, S.; Nadal-Romero, E.; González-Hidalgo, J.C.; Lana-Renault, N.; Sanjuán, Y. A meta-analysis of soil erosion rates across the world. Geomorphology 2015, 239, 160–173. [Google Scholar] [CrossRef]
- Lal, R. Soil Erosion Research Methods; St. Lucie Press: Delray Beach, FL, USA, 1994. [Google Scholar]
- Krishna Bahadur, K. Mapping soil erosion susceptibility using remote sensing and gis: A case of the upper nam wa watershed, nan province, thailand. Environ. Geol. 2009, 57, 695–705. [Google Scholar] [CrossRef]
- Chen, T.; Niu, R.-q.; Li, P.-x.; Zhang, L.-p.; Du, B. Regional soil erosion risk mapping using rusle, gis, and remote sensing: A case study in miyun watershed, north China. Environ. Earth Sci. 2011, 63, 533–541. [Google Scholar] [CrossRef]
- Weifeng, Z.; Bingfang, W. Assessment of soil erosion and sediment delivery ratio using remote sensing and gis: A case study of upstream chaobaihe river catchment, north China. Int. J. Sediment Res. 2008, 23, 167–173. [Google Scholar]
- Teng, H.-F.; Jie, H.; Yue, Z.; Zhou, L.-Q.; Zhou, S. Modelling and mapping soil erosion potential in China. J. Integr. Agric. 2019, 18, 251–264. [Google Scholar] [CrossRef]
- Wang, X.; Zhao, X.; Zhang, Z.; Yi, L.; Zuo, L.; Wen, Q.; Liu, F.; Xu, J.; Hu, S.; Liu, B. Assessment of soil erosion change and its relationships with land use/cover change in China from the end of the 1980s to 2010. CATENA 2016, 137, 256–268. [Google Scholar] [CrossRef]
- Yang, X.; Zhang, K.; Jia, B.; Ci, L. Desertification assessment in China: An overview. J. Arid Environ. 2005, 63, 517–531. [Google Scholar] [CrossRef]
- Batista, P.V.; Davies, J.; Silva, M.L.; Quinton, J.N. On the evaluation of soil erosion models: Are we doing enough? Earth-Sci. Rev. 2019, 197, 102898. [Google Scholar] [CrossRef]
- Funk, R.; Skidmore, E.L.; Hagen, L.J. Comparison of wind erosion measurements in germany with simulated soil losses by weps. Environ. Model. Softw. 2004, 19, 177–183. [Google Scholar] [CrossRef]
- Shen, Z.; Gong, Y.; Li, Y.; Hong, Q.; Xu, L.; Liu, R. A comparison of wepp and swat for modeling soil erosion of the zhangjiachong watershed in the three gorges reservoir area. Agric. Water Manag. 2009, 96, 1435–1442. [Google Scholar] [CrossRef]
- Tao, H.; Gemmer, M.; Bai, Y.; Su, B.; Mao, W. Trends of streamflow in the tarim river basin during the past 50 years: Human impact or climate change? J. Hydrol. 2011, 400, 1–9. [Google Scholar] [CrossRef]
- Xu, Z.; Chen, Y.; Li, J. Impact of climate change on water resources in the tarim river basin. Water Resour. Manage. 2004, 18, 439–458. [Google Scholar] [CrossRef]
- Xu, Z.; Liu, Z.; Fu, G.; Chen, Y. Trends of major hydroclimatic variables in the tarim river basin during the past 50 years. J. Arid Environ. 2010, 74, 256–267. [Google Scholar] [CrossRef]
- GB/T 21010-2007; Current Land Use Classification. China Standard Press: Beijing, China, 2007.
- SL190-2007; Standards for Classification and Gradation of SOIL Erosion. Ministry of Water Resources of the People’s Republic of China: Beijing, China, 2008.
- Pi, H.; Sharratt, B.; Lei, J. Wind erosion and dust emissions in central asia: Spatiotemporal simulations in a typical dust year. Earth Surf. Process. Landf. 2019, 44, 521–534. [Google Scholar] [CrossRef]
- Kang, Y. Study on Soil Erosion Observation and Simulation in Taklimakan Desert. Master’s Thesis, Xinjiang Normal University, Urumqi, China, 2018. [Google Scholar]
- Chi, W.; Wang, Y.; Lou, Y.; Na, Y.; Luo, Q. Effect of land use/cover change on soil wind erosion in the yellow river basin since the 1990s. Sustainability 2022, 14, 12930. [Google Scholar] [CrossRef]
- Ali, K.F.; De Boer, D.H. Spatially distributed erosion and sediment yield modeling in the upper indus river basin. Water Resour. Res. 2010, 46, W08504. [Google Scholar] [CrossRef]
- Uddin, K.; Murthy, M.; Wahid, S.M.; Matin, M.A. Estimation of soil erosion dynamics in the koshi basin using gis and remote sensing to assess priority areas for conservation. PLoS ONE 2016, 11, e0150494. [Google Scholar] [CrossRef] [PubMed]
- Biswas, S.S.; Pani, P. Estimation of soil erosion using rusle and gis techniques: A case study of barakar river basin, jharkhand, india. Model. Earth Syst. Environ. 2015, 1, 1–13. [Google Scholar] [CrossRef]
- Wu, G.L.; Liu, Y.F.; Cui, Z.; Liu, Y.; Shi, Z.H.; Yin, R.; Kardol, P. Trade-off between vegetation type, soil erosion control and surface water in global semi-arid regions: A meta-analysis. J. Appl. Ecol. 2020, 57, 875–885. [Google Scholar] [CrossRef]
- Abdullah, M.; Feagin, R.; Musawi, L. The use of spatial empirical models to estimate soil erosion in arid ecosystems. Environ. Monit. Assess. 2017, 189, 1–17. [Google Scholar] [CrossRef] [PubMed]
Figure 1.
Study area.
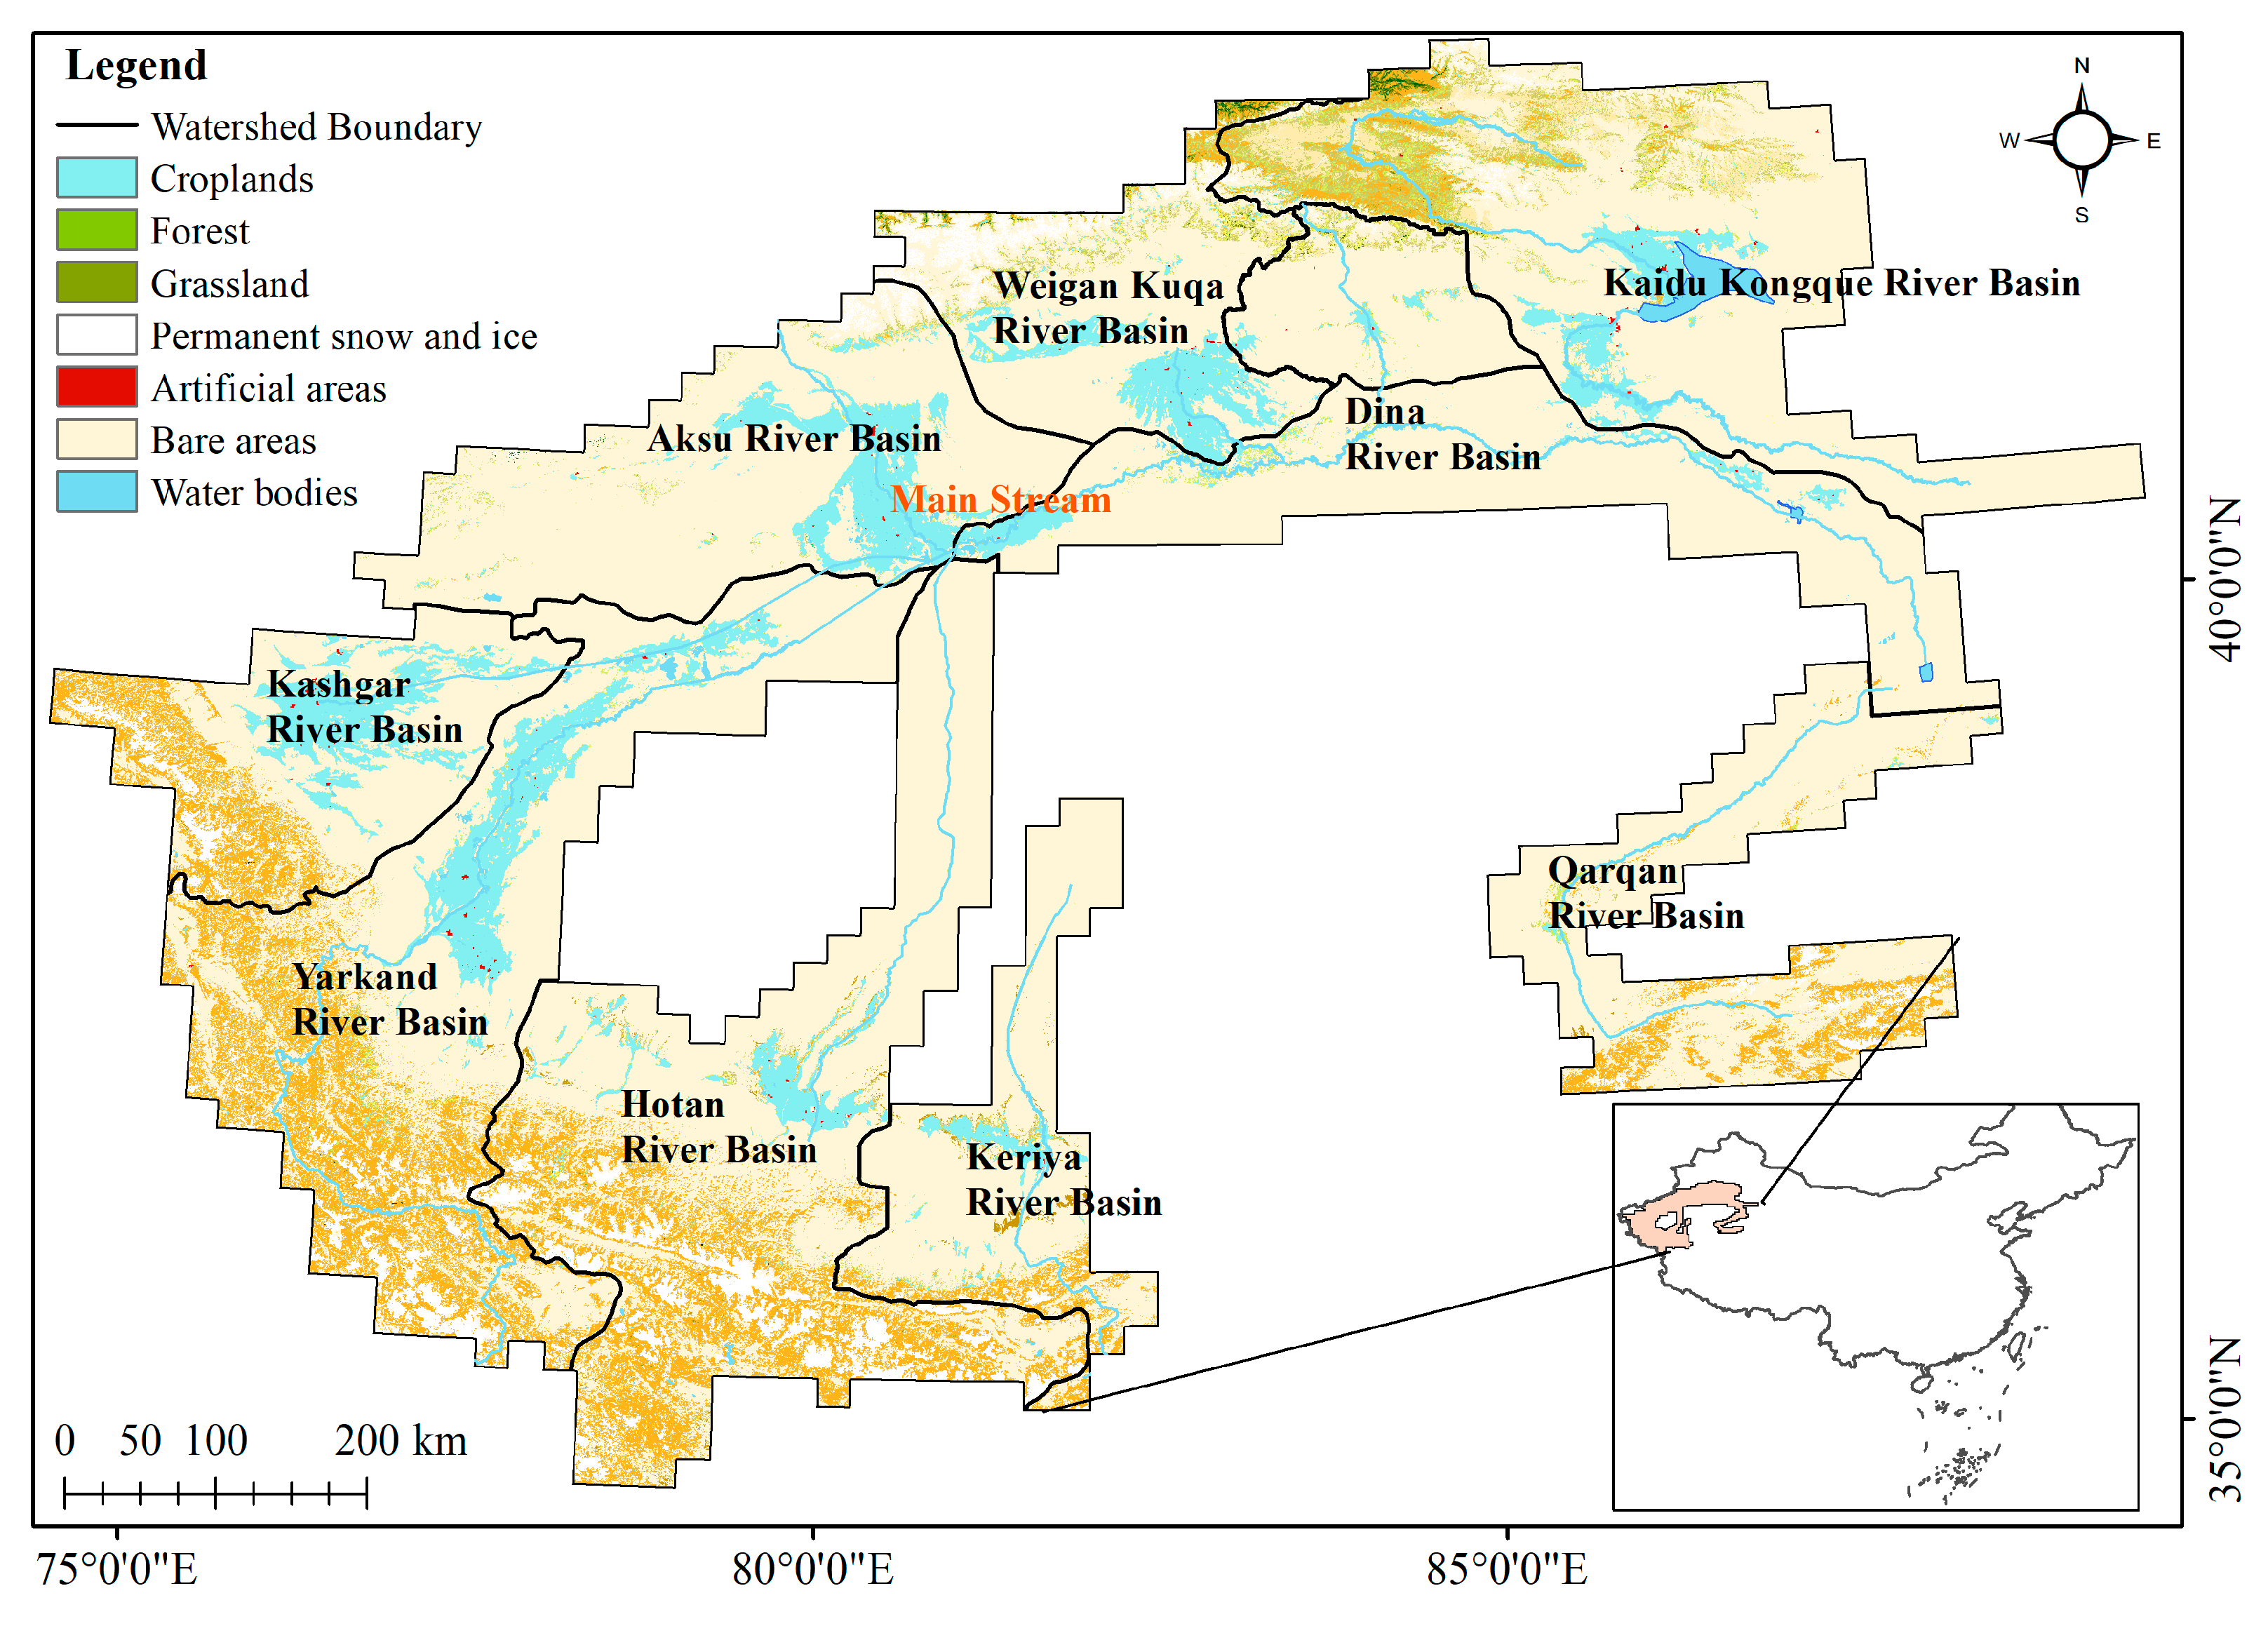
Figure 2.
Erosion area and its proportion to total area in each subbasin of Tarim River Basin ((a), Erosion area, (b), the proportion of erosion area to total area). MSTR, ARB, KRB, YRB, HRB, KKRB, DRB, WKRB, KRRB, and QRB indicate mainstream of Tarim River Basin, Aksu River Basin, Kashgar River Basin, Yarkand River Basin, Hotan River Basin, Kaidu Kongque River Basin, Dina River Basin, Weigan Kuqa River Basin, Keriya River Basin, and Qiemo River Basin, respectively.
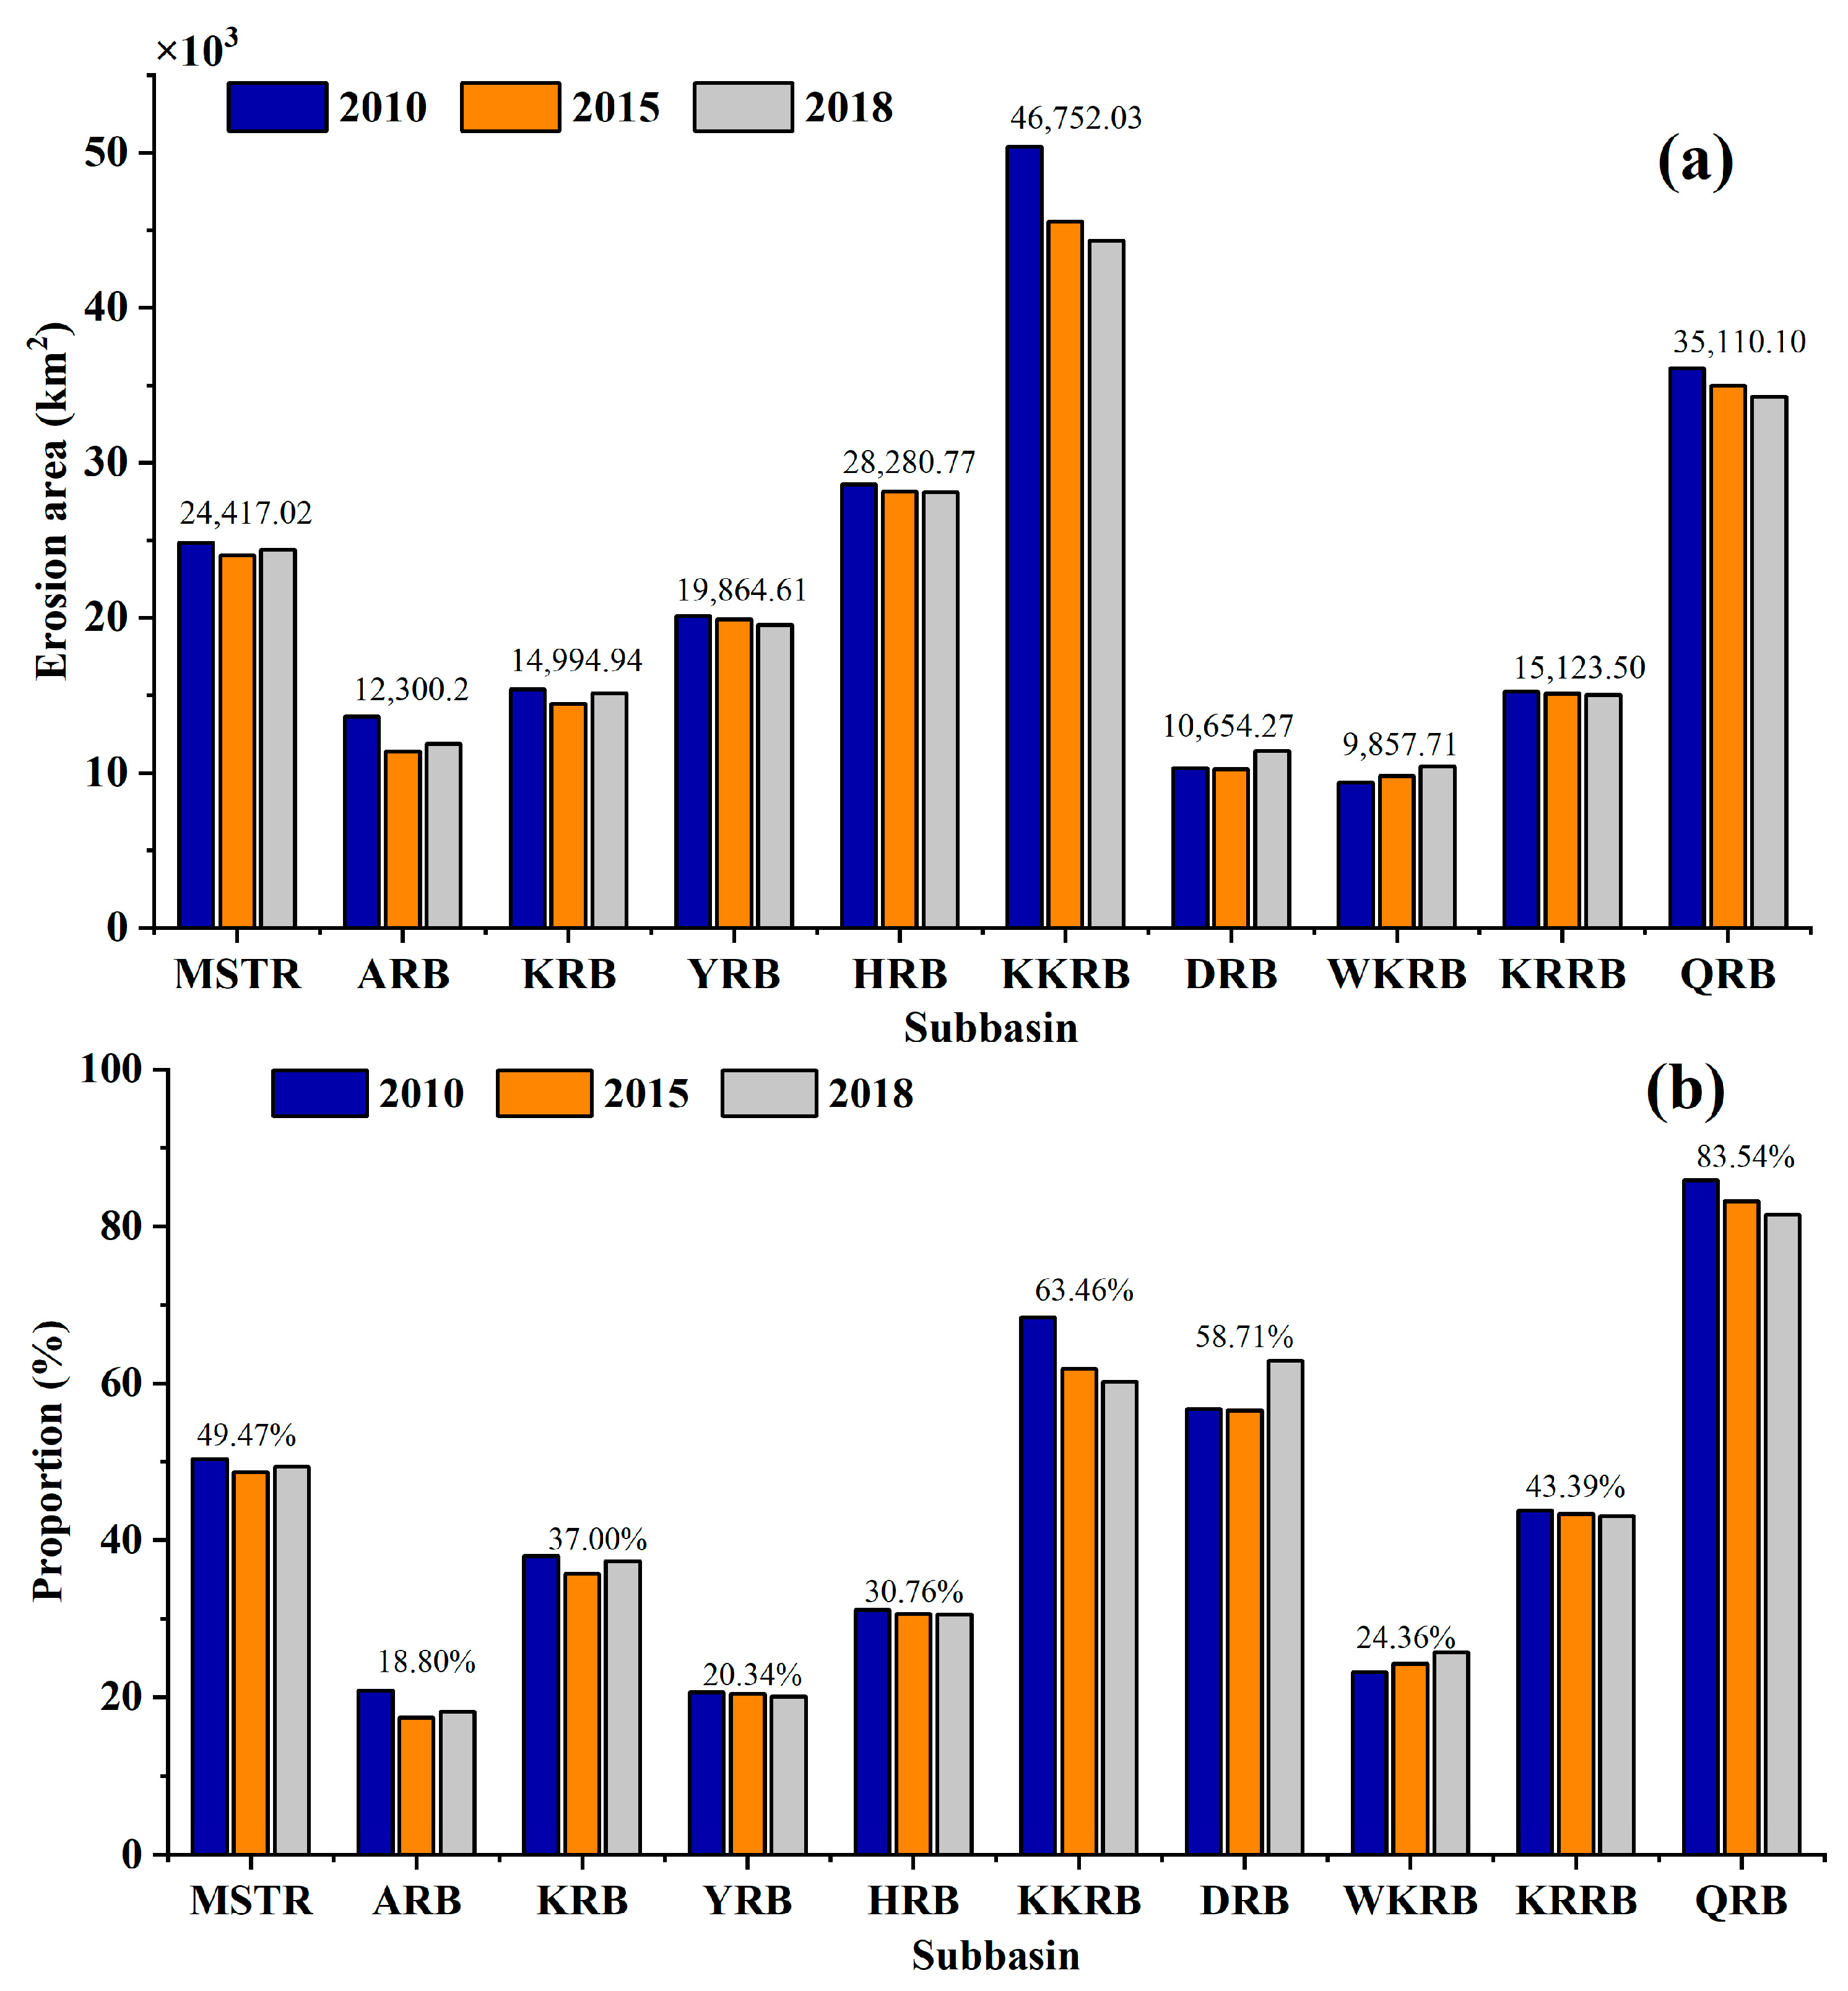
Figure 3.
Soil wind erosion intensity statistics for various subbasins in the Tarim River Basin in 2018. MSTR, ARB, KRB, YRB, HRB, KKRB, DRB, WKRB, KRRB, and QRB indicate mainstream of Tarim River Basin, Aksu River Basin, Kashgar River Basin, Yarkand River Basin, Hotan River Basin, Kaidu Kongque River Basin, Dina River Basin, Weigan Kuqa River Basin, Keriya River Basin and Qiemo River Basin, respectively.
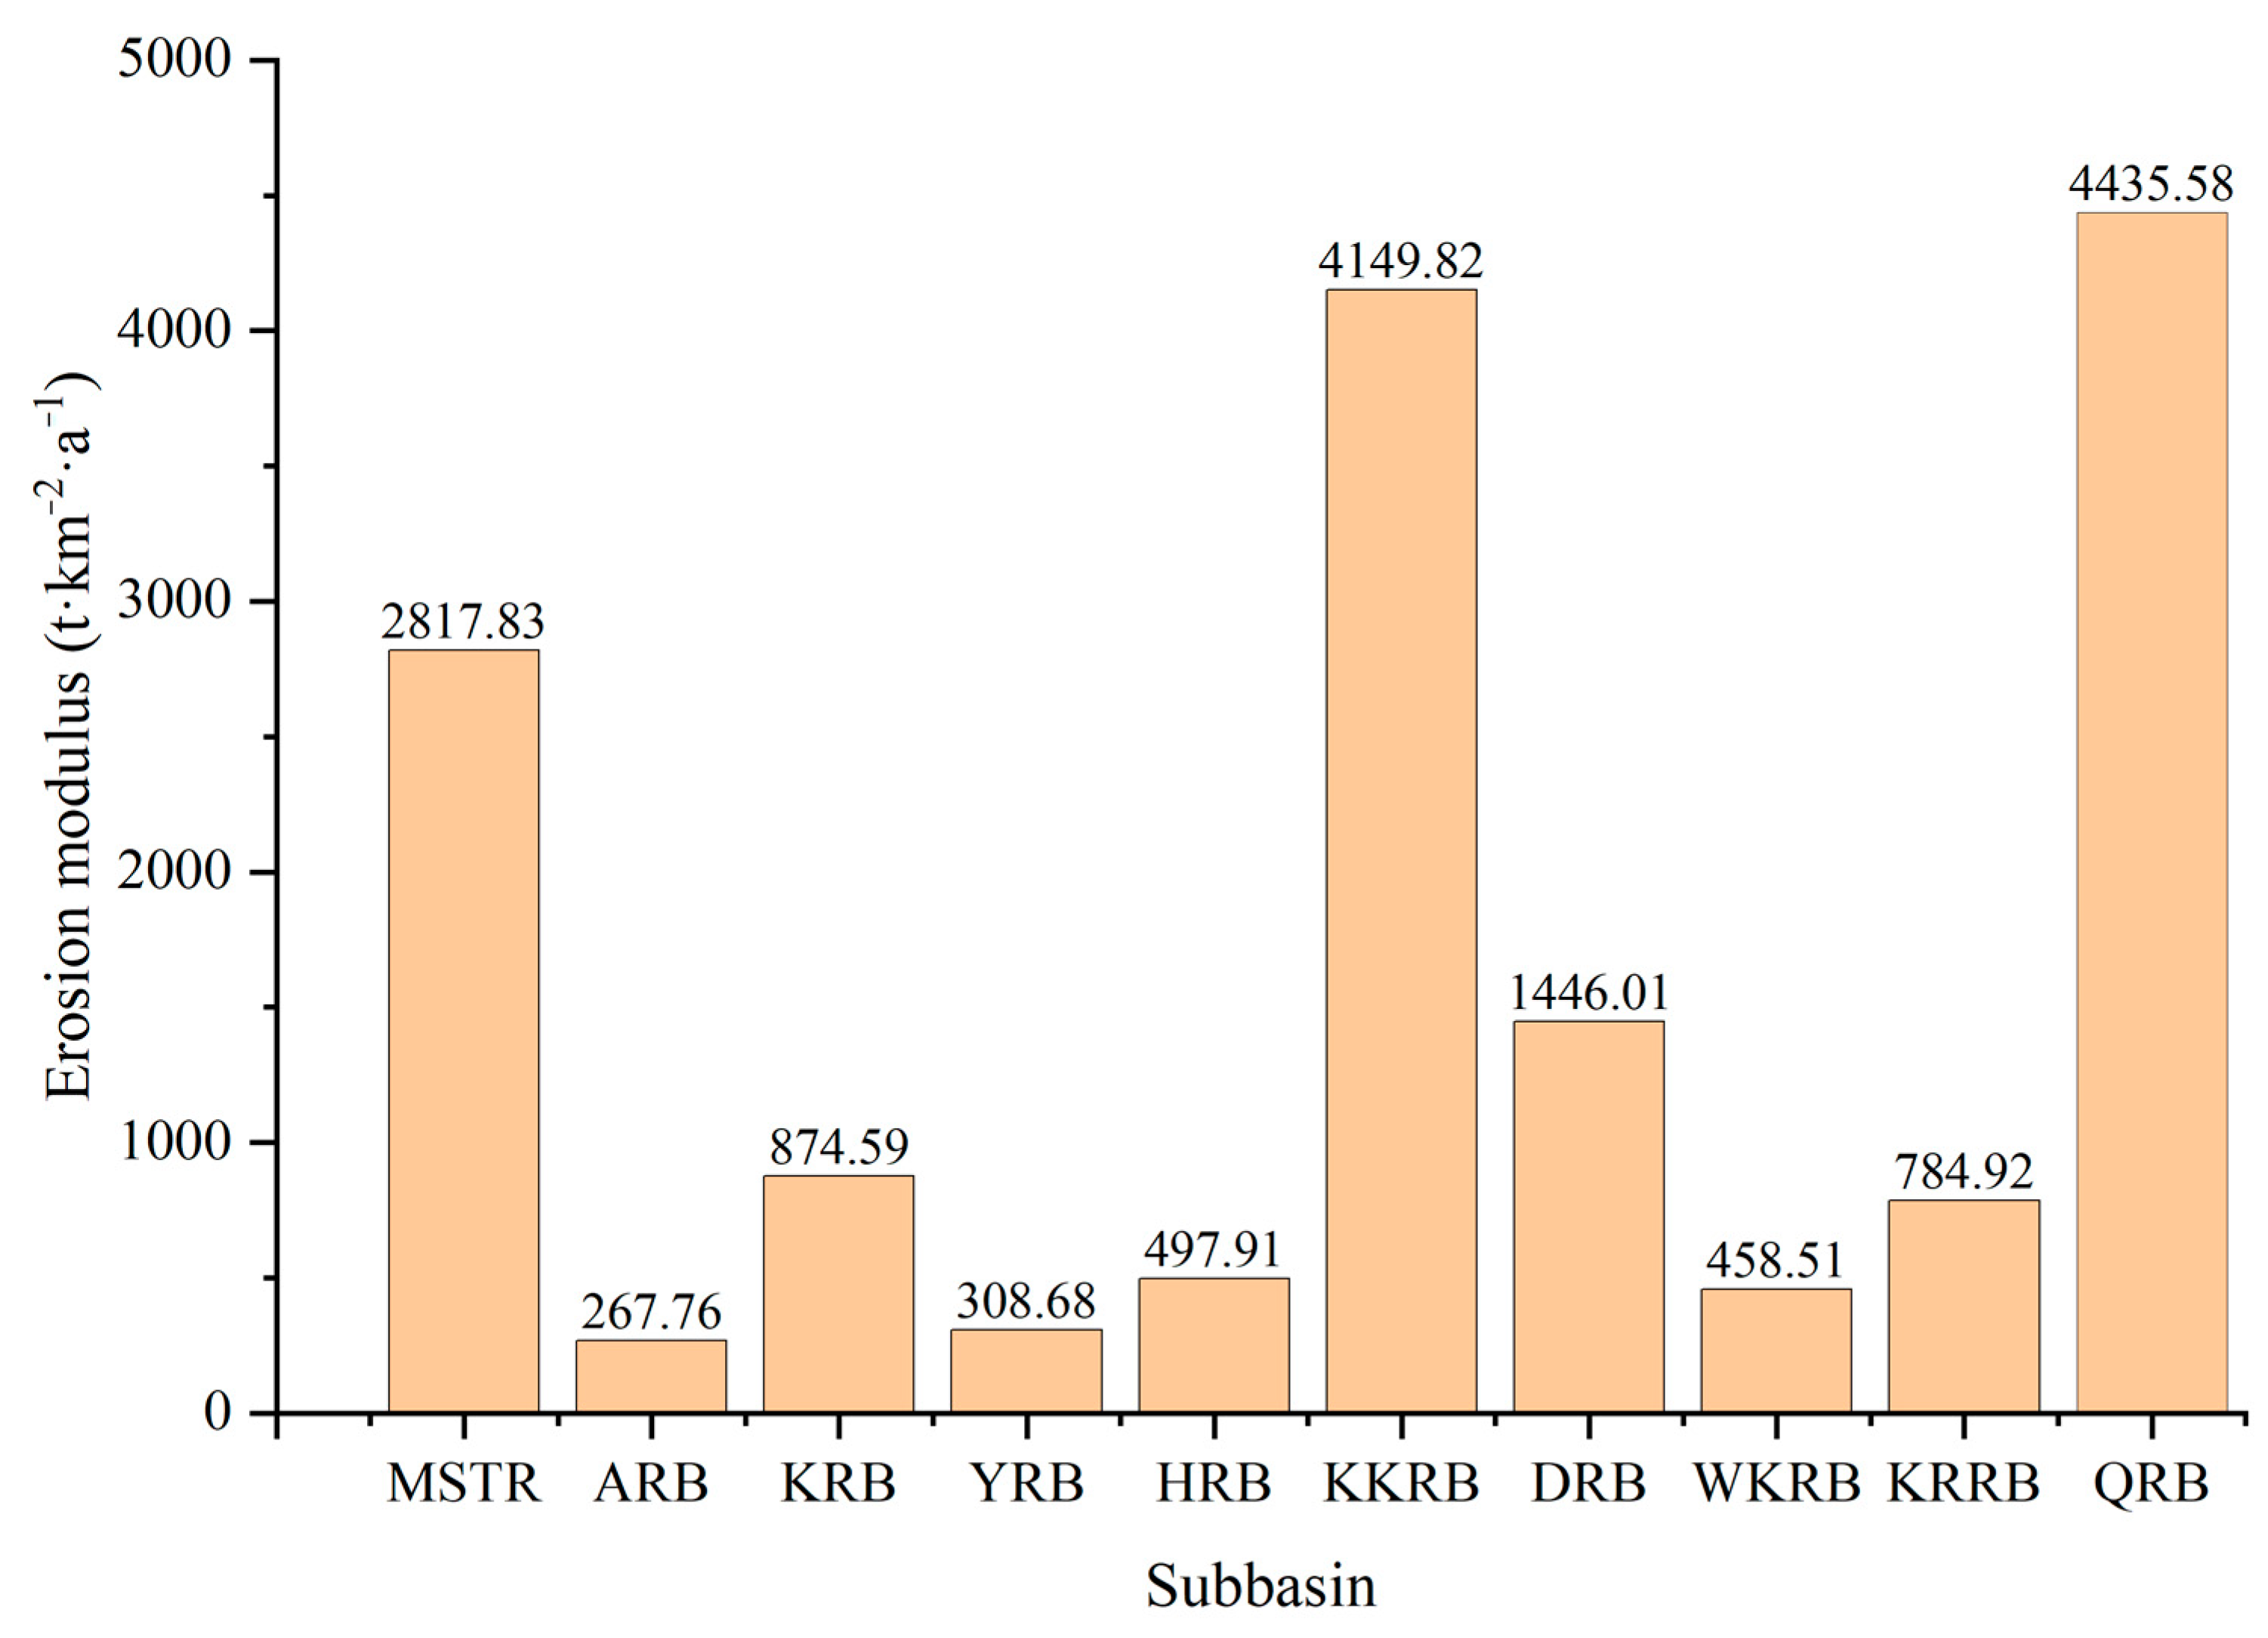
Figure 4.
Soil wind erosion intensity in Tarim River Basin in 2010, 2015, and 2018.

Figure 5.
Impacts of environmental and anthropogenic factors on soil wind erosion (Each dot represents an observation point, with the x-axis displaying the factor being analyzed and the y-axis showing the corresponding wind erosion modulus).
Figure 5.
Impacts of environmental and anthropogenic factors on soil wind erosion (Each dot represents an observation point, with the x-axis displaying the factor being analyzed and the y-axis showing the corresponding wind erosion modulus).
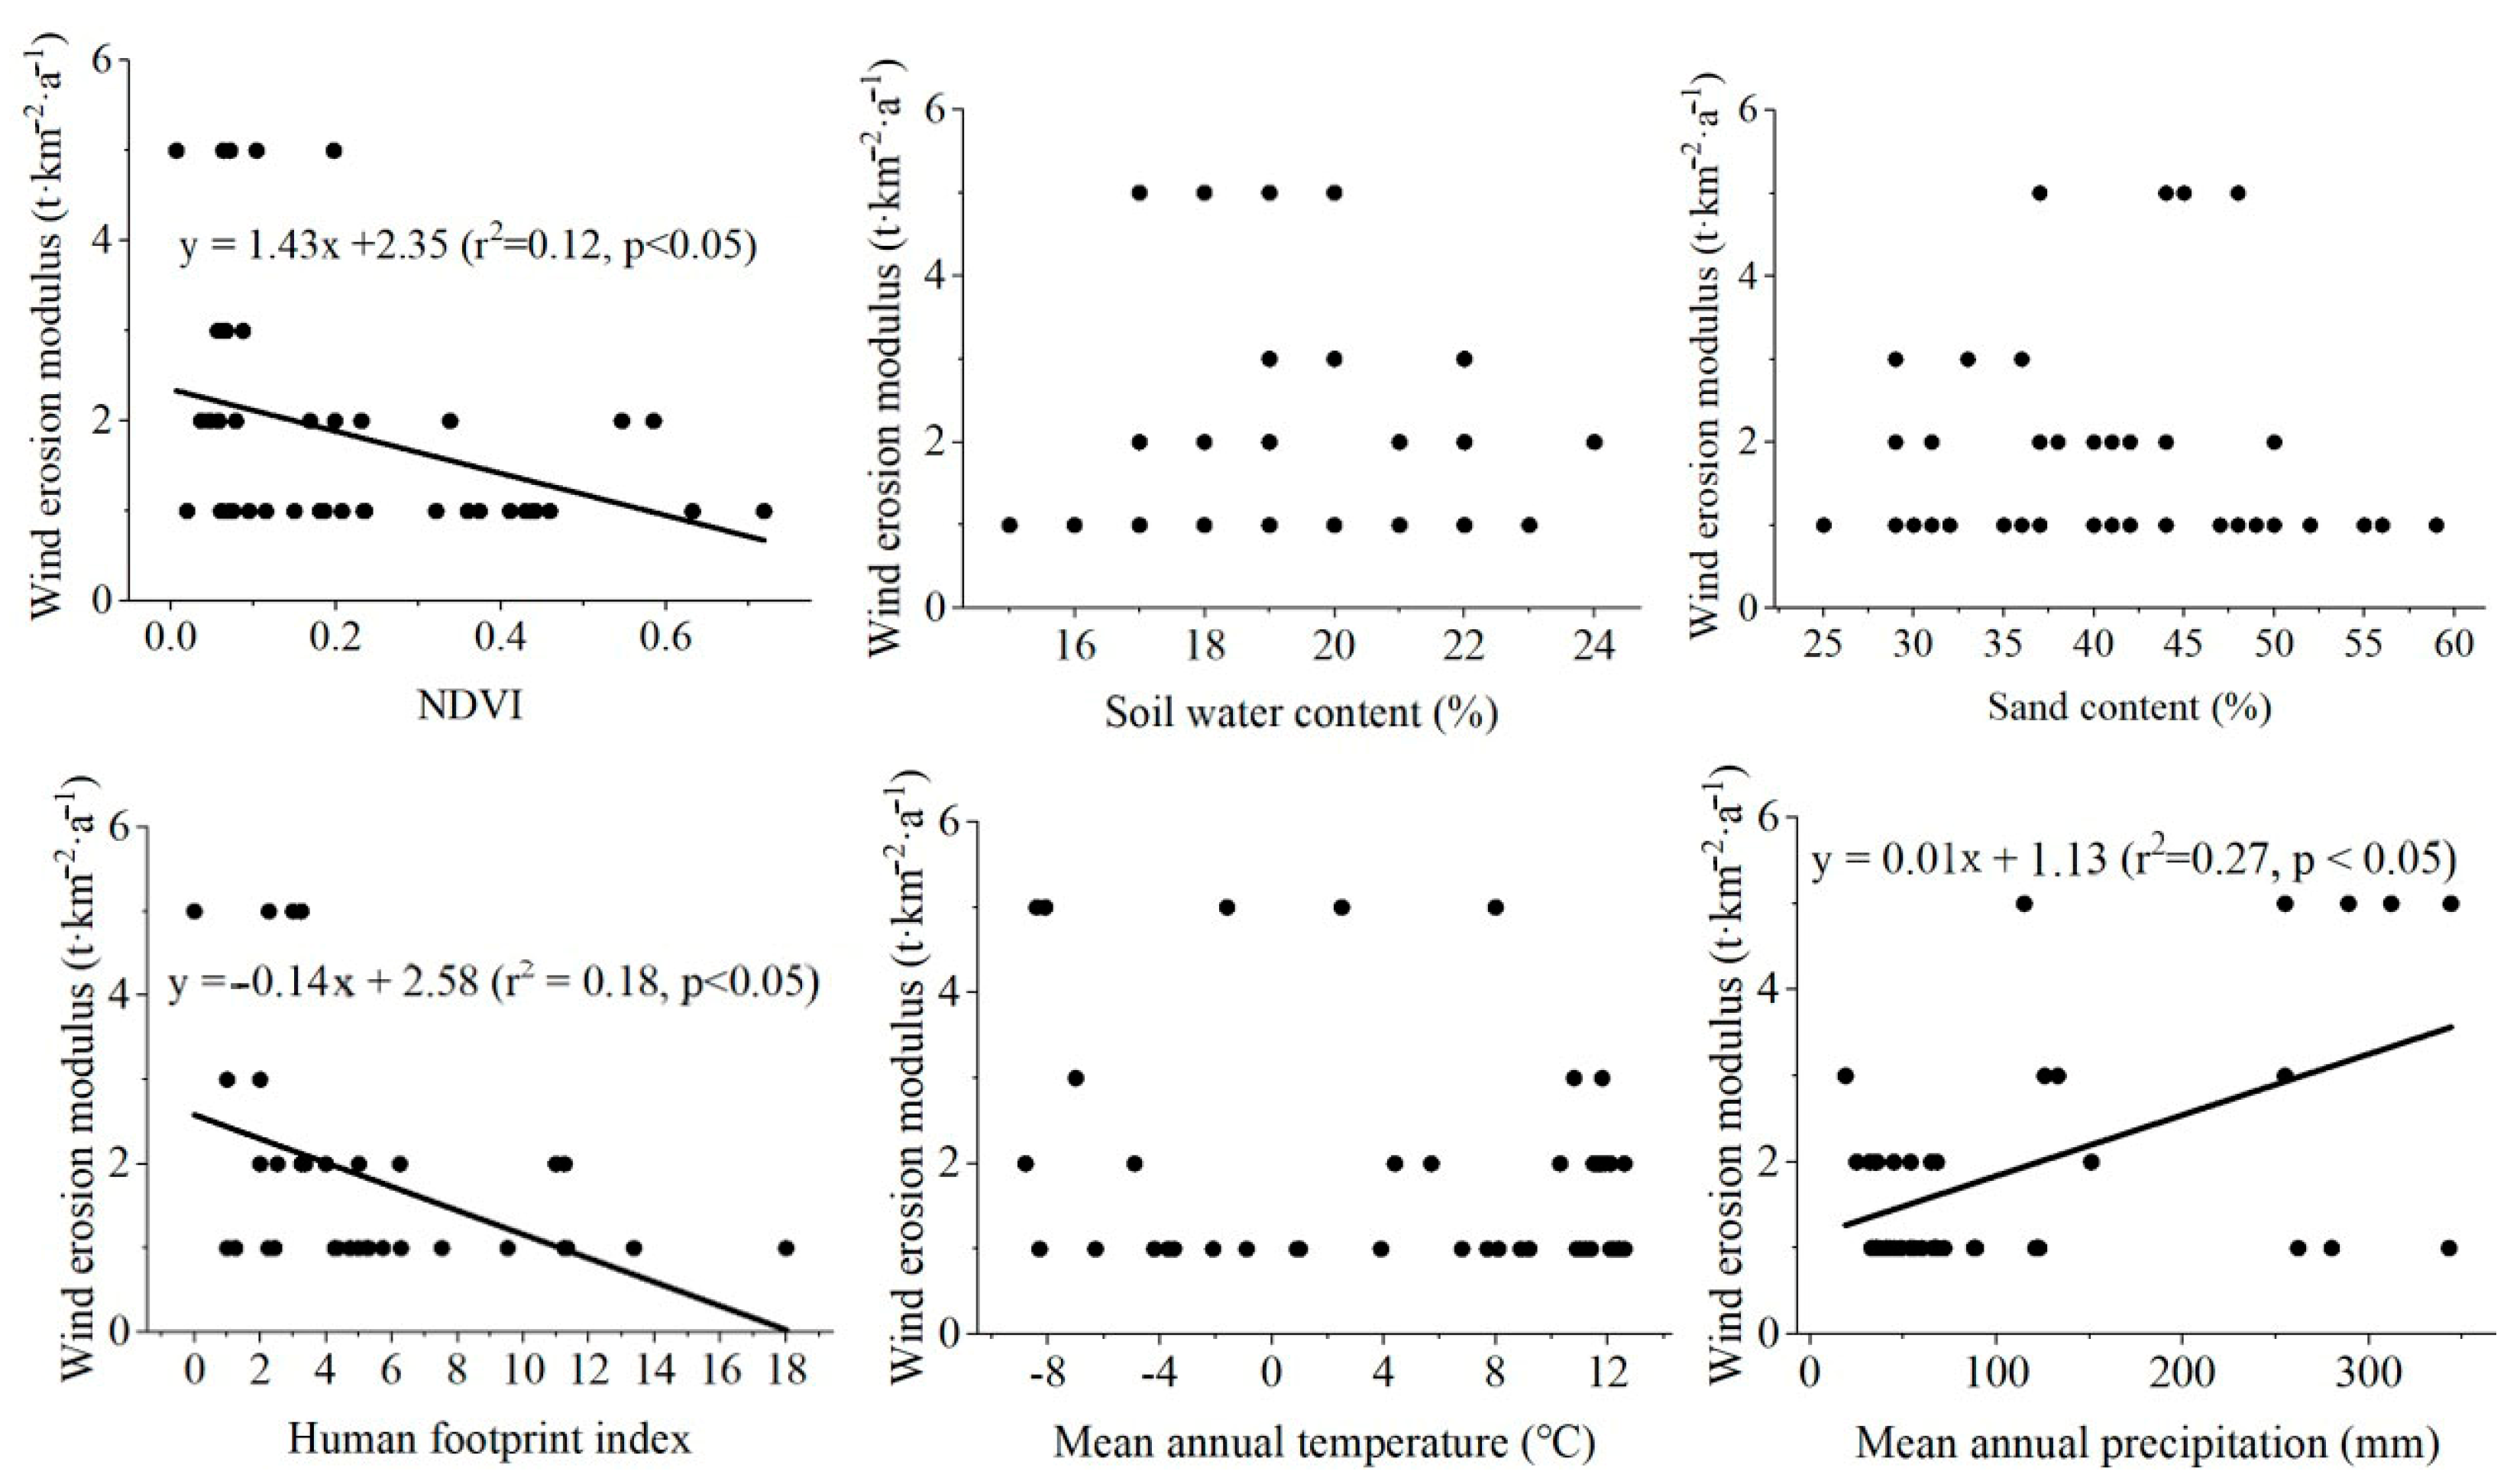
Figure 6.
The linear relationship between annual average wind speed and erosion intensity (Each dot represents an observation point).
Figure 6.
The linear relationship between annual average wind speed and erosion intensity (Each dot represents an observation point).


Table 1.
Data sources.
| Type | The Data Sources |
|---|---|
| Wind force factor | Based on the observation data in the monitoring area from 1991 to 2018 |
| Topsoil moisture factor | Based on AMSR-E Level2A brightness temperature data inversion in 2010, 2015, and 2018 |
| Roughness factor | Field survey data in 2018 and 2019 as well as existing data and the literature in the previous period (from 2006 to 2016) |
| Vegetation coverage | Remote-sensing-derived monthly mean FVC data from 2008–2010, 2013–2015, and 2016–2018 |
| Land cover | National basic survey program |
| Topography | The Shuttle Radar Topography Mission |
Table 2.
Area and percentage of different intensities of soil wind erosion in Tarim River Basin.
| Erosion Intensity | Erosion Area (km2) | Percentage of Total Erosion Area (%) | ||||
|---|---|---|---|---|---|---|
| 2010 | 2015 | 2018 | 2010 | 2015 | 2018 | |
| Light (and micro) | 154,015.92 | 144,778.67 | 144,962.37 | 68.75 | 67.78 | 67.60 |
| Medium | 28,137.31 | 28,494.36 | 28,477.82 | 12.56 | 13.34 | 13.28 |
| Strong | 15,457.60 | 15,998.71 | 16,983.76 | 6.90 | 7.49 | 7.92 |
| Extremely strong | 16,532.91 | 15,656.94 | 15,161.01 | 7.38 | 7.33 | 7.07 |
| Severe | 9879.42 | 8672.20 | 8856.43 | 4.41 | 4.06 | 4.13 |
| Total erosion area | 224,023.16 | 213,600.87 | 214,441.38 | 100 | 100 | 100 |
Disclaimer/Publisher’s Note: The statements, opinions and data contained in all publications are solely those of the individual author(s) and contributor(s) and not of MDPI and/or the editor(s). MDPI and/or the editor(s) disclaim responsibility for any injury to people or property resulting from any ideas, methods, instructions or products referred to in the content. |
© 2024 by the authors. Licensee MDPI, Basel, Switzerland. This article is an open access article distributed under the terms and conditions of the Creative Commons Attribution (CC BY) license (https://creativecommons.org/licenses/by/4.0/).
Share and Cite
MDPI and ACS Style
Zhang, Q.; Gu, F.; Zhang, S.; Chen, X.; Ding, X.; Xu, Z. Spatiotemporal Variation in Wind Erosion in Tarim River Basin from 2010 to 2018. Land 2024, 13, 330. https://doi.org/10.3390/land13030330
AMA Style
Zhang Q, Gu F, Zhang S, Chen X, Ding X, Xu Z. Spatiotemporal Variation in Wind Erosion in Tarim River Basin from 2010 to 2018. Land. 2024; 13(3):330. https://doi.org/10.3390/land13030330
Chicago/Turabian StyleZhang, Qinqin, Fang Gu, Sicong Zhang, Xuehua Chen, Xue Ding, and Zhonglin Xu. 2024. "Spatiotemporal Variation in Wind Erosion in Tarim River Basin from 2010 to 2018" Land 13, no. 3: 330. https://doi.org/10.3390/land13030330
Note that from the first issue of 2016, this journal uses article numbers instead of page numbers. See further details here.