Abstract
Efficient urban land use plays a crucial role in promoting regional development and ensuring economic growth. Analyzing the spatio–temporal pattern of urban land high-quality use (ULHU) and identifying its key influencing factors and pathways can contribute to enhancing land use efficiency and achieving high-quality development. This study established a comprehensive measurement indicator system for evaluating ULHU using the entropy method and investigated the spatio–temporal evolution pattern of ULHU in the Greater Pearl River Delta (PRD) urban agglomeration in the years 2005, 2010, 2015 and 2020. Furthermore, a multi-period fuzzy-set qualitative comparative analysis method was adopted to explore the concurrent driving mechanisms that impact ULHU from the configuration perspective. The findings reveal that the level of ULHU has exhibited a significant improvement, increasing from 0.1150 in 2005 to 0.2758 in 2020, with an annual growth rate of 8.739%. The spatial pattern in the PRD region exhibits an incremental distribution, characterized by higher values in the central region and lower values in the peripheral area, as this pattern reveals significant heterogeneity across the region. The configurations for ULHU in the PRD were identified, such as Population-industry-talent driven, Openness-fiscal-talent driven, Population-led, and Population-industry driven. Among these configurations, population density and industrial structure were identified as the core driving factors, while the role of talent resources is gradually diminishing. This study provides practical guidance for promoting the ULHU and optimizing national spatial planning.
1. Introduction
Since the 1900s, the growing demand for natural resources, production, and living space has profoundly transformed the patterns of land use [1]. Rapid global urbanization and industrialization have resulted in an uncontrolled expansion of urban economic and social activities [2,3]. Consequently, a prominent contradiction between economic development and land use has emerged, accompanied by a continuous decline in land resource availability. Regional land use conflicts have become increasingly common and severe [4]. According to the projections of the United Nations, the global urban population will increase by 1.35 billion by 2030 [5], with urban land expanding to 1.2 million km2, particularly notable in Asia [6]. From 1978 to 2021, the urbanization rate witnessed a significant increase, soaring from 17.92% to 64.72%. This remarkable growth translates to an average annual rise of 1.09 percentage points [7]. The expansion of urban construction land has raised concerns within governmental and academic spheres, primarily due to the loss of habitat [8], the threat to biodiversity [9], and the unsustainability of regional integration [10]. Specifically, the expansion of urban construction land has become a primary concern in global urban development [11], as its detrimental impacts on natural resources and the socio-economic environment are irreversible. Therefore, to address the contradiction between rapid urban development and limited land use within a confined geographic space, achieving urban land high-quality use (ULHU) is imperative for balancing the economic, social, and environmental objectives to realize sustainable development [12].
The ULHU has long been a prominent topic of academic interest. In parallel, numerous countries and regions have made significant attempts to achieve the ULHU in practice. Globally, the classical political scientist David Ricardo addressed the issue of limited land resources in the theory of agricultural land rent [13]. The Leipzig Charter on Sustainable European Cities, proposed by the European Union (EU) in 2007, emphasizes the control of land use through the regulation of built-up areas. The Roadmap to a Resource Efficient Europe, introduced by the EU in 2011, serves as an exemplar for the optimal use of limited land resources. In China, land use has garnered significant attention from the central government since the 21st century. The revised Land Management Law of 1998 sets the annual quotas for the conversion from agricultural and unused land to construction land [14]. Meanwhile, this legislation also emphasizes the rational use of land resources, the strengthening of land management, the enhancement of land use efficiency, and the protection of farmland resources. Subsequently, the Ministry of Natural Resources in China issued several vital documents to elevate the standards of land utilization with stricter requirements, which emphasize the importance of controlling the urban construction land and adhering to the requirements of farmland. These laws, regulations, and policy documents serve as dependable legal references, elucidating the direction of reforms and facilitating improved land use efficiency through scientific planning and management. Consequently, these measures play a significant role in the realization of ULHU in practice; however, the spatio-temporal patterns and driving configurations of ULHU remain unclear.
The significant emphasis from the government on urban land use has prompted research within the academic community. Scholars have conducted extensive studies on the disparities in ULHU across different regions. For instance, Li et al. [15] employed remote sensing to assess spatial and temporal changes in land use, revealing that urban expansion primarily occurred along the Belize River, while other regions experienced slower development. Similarly, Song et al. [16] utilized the Super-SBM model to calculate urban land use efficiency in the Yangtze River Delta region and analyzed influencing factors using the fixed effects model. They found distinct variations in influencing factors and degrees across different watersheds. In addition, this research employed a geographical detector approach to examine the influence of both physical and socioeconomic factors on land expansion of urban agglomeration within the Greater Pearl River Delta (PRD). By utilizing this analytical method, it aimed to uncover the intricate relationships and interactions between various geographical factors and the process of urban agglomeration in the study area [17]. Consequently, due to disparities in urban land resources and the efficiency of production factors allocation during economic development, significant variations exist in the level of ULHU among different regions. It is worth noting that existing research often tends to focus on either a temporal or spatial perspective, failing to provide a comprehensive analysis that integrates both time and space dimensions. Furthermore, research on the driving mechanisms behind ULHU has become increasingly diverse. It has been observed that the level of urban land use is not solely influenced by socio-economic factors, such as economic development [18], industrial structure [19], and road transportation systems [20], but also by political and natural factors, such as policy instruments [14], regional integration [21] and the quality of the ecological environment [22]. However, existing studies often fail to recognize the complexity and interconnectedness of these driving factors. Traditional econometrics methods are commonly employed to explore the isolated linear effects of individual variables, neglecting the intricacies and interactions among these influencing factors. Therefore, further research should be conducted from a configuration perspective to investigate the influencing mechanisms of ULHU.
This paper aims to expand the existing research boundaries from two perspectives. Firstly, this paper seeks to summarize the common characteristics of ULHU by mapping its spatial and temporal evolution. In addition, this paper aims to construct a comprehensive indicator system for ULHU, considering the inputs and outputs of the land, as well as its economic, social, and environmental benefits. Secondly, from a configuration perspective, this study adopts the multi-temporal fuzzy-set qualitative Comparative Analysis (fsQCA) to explore the influencing configurations that contribute to ULHU in the PRD urban agglomeration. By analyzing the multiple pathways of ULHU, the research provides practical insights for the governance of national land space and the high-quality development of cities. Moreover, it analyzes various approaches to realizing ULHU, offering practical perspectives on land use for urban spatial governance and urban high-quality development.
2. Theoretical Framework of ULHU
The traditional economic patterns, which excessively prioritize speed over quality, have resulted in a range of issues, including climate warming, inadequate public service facilities, biodiversity loss, and heightened urban–rural conflicts [15]. In this context, China has proposed high-quality development strategies, that aim to ensure economic development at a sustainable scale while considering its quality [23], and adhering to the advanced development concepts, providing a new guiding direction for promoting sustainable urban development. This strategy also presents new challenges and opportunities for ULHU. At this stage, ULHU extends beyond intensive land use and green utilization, which requires the consideration of people’s aspirations for an improved quality of life, encompassing enhanced infrastructure, convenient living, and ecological livability [24,25,26].
Based on this information, achieving ULHU can be accomplished by considering the strategy, resource, process, and output levels, and by promoting innovation and reform to fully mobilize land factors and other resources, thereby maximizing factor output efficiency [27]. Firstly, the attention and investment allocation towards ULHU can be assessed through the work reports of local governments. The effectiveness of strategic inputs can be evaluated by examining the implementation of relevant policies and social reactions. Secondly, the successful implementation of policies relies on sufficient resource supply [28,29]. Given the natural variations in resource availability across different regions, the level of ULHU can be measured by indicators such as urban construction land area and industrial output value, providing a tangible reflection of ULHU. Subsequently, the level of land use can be assessed through the results of energy conservation, emission reduction, and sustainable development during the operational process. Finally, ULHU is ultimately calculated based on its output results and combined with other comprehensive calculations, with the core objective being the optimization of comprehensive economic and ecological benefits. This requires a comprehensive assessment of the social, economic, and ecological dimensions [30]. In summary, achieving ULHU in urban areas necessitates government policy guidance, and the support of traditional and new input factors. Concurrently, the implementation of ULHU aims to achieve and maximize desired social, economic, and ecological outcomes, while concurrently addressing the heightened societal aspirations for an enhanced quality of life.
Studies have indicated that several factors can influence the level of ULHU. Firstly, as urban populations continue to grow, enterprises in cities can quickly get abundant human resources to finish tasks, leading to reduced labor costs and triggering economies of scale in industries, thereby creating more profits, and enhancing land use efficiency. Simultaneously, the concentration of population in urban areas generates a greater demand for urban infrastructure and ecological environments, prompting increased government and market investments. This can promote efficient urban construction and optimize the construction mode of the city, which in turn achieves ULHU [31]. Furthermore, as industries agglomerate and develop, market forces facilitate the specialization of labor, fostering coordination and interaction between different sectors, optimizing the overall industrial structure, and promoting further economies of scale, thereby enhancing ULHU [32]. Additionally, as the reform and opening continues to advance, international investments are experiencing continuous growth. This influx of investments brings additional production factors into cities, such as capital. It creates opportunities for the exchange of production factors and fosters deep cooperation among cities. Leveraging these advantages, cities can continuously enhance their levels of ULHU. Coupled with the adoption of advanced information technology, this promotes the realization of ULHU, increasing land output and improving economic efficiency [33]. Moreover, financial support plays a crucial role in facilitating continuous improvement in cities. This creates favorable conditions for the sustainable development of urban economies and societies, ultimately augmenting the economic and social benefits derived from land use. Finally, talent is considered a primary resource, and the foundation of national scientific and technological innovation lies in human capital. The positive development of cities relies on innovation and talent. The presence of a skilled workforce not only boosts consumption capacity but also stimulates high-quality economic growth in urban areas, bolstering the economic resilience of cities. Furthermore, talent often possesses the willingness to realize ecological and environmental protection, which aids in promoting the deployment and implementation of national strategies [34]. The integrated framework diagram of this paper is shown in Figure 1.

Figure 1.
An integrated framework of ULHU.
3. Data and Methods
3.1. Study Area
The PRD region, as the pioneering area of China’s reform and opening-up, has garnered significant attention from both the political and academic spheres due to its rapid urbanization [35]. According to the Development Plan, this paper focuses on the crucial area of the PRD composed of Guangzhou, Shenzhen, Zhuhai, Foshan, Jiangmen, Dongguan, Zhongshan, Huizhou and Zhaoqing, radiating across their neighboring cities (Shanwei, Qingyuan, Yunfu, Heyuan and Shaoguan) in PRD, as shown in Figure 2. As one of China’s three major urban agglomerations, the PRD boasts a GDP of CNY 10.78 trillion as of 2021, making it one of the most dynamic and promising regions in China’s economic development. The PRD has made remarkable contributions to China’s economic and social progress. With the implementation of the Greater Bay Area Plan and the transformation of traditional industries alongside the development of high-tech industries, the pattern and efficiency of land use in the PRD have undergone significant changes [36,37]. However, challenges such as population agglomeration, extensive land expansion, and rapid industrialization have posed difficulties in achieving ULHU in the PRD, thereby impeding the region’s high-quality economic and social development [37,38,39]. Consequently, it is crucial to explore strategies for the rational use of urban land, achieve optimal resource allocation, and realize ULHU in the PRD. Analyzing the spatial and temporal patterns of ULHU in the PRD and investigating the driving mechanisms behind ULHU will not only contribute to the sustainable development of cities in the PRD but also enhance the regulatory policies for national land governance.
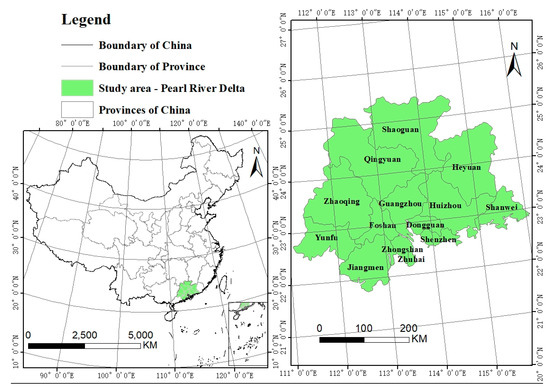
Figure 2.
Location of the study area.
3.2. Variable Selection and Indicator Identification
3.2.1. Outcome Variable
High-quality development emphasizes the principles of efficiency, sustainability, innovation, and inclusiveness. When considering land use guided by the principles of urban high-quality development, it is essential to focus not only on the inputs and outputs of the land but also on the social contributions, green development, and land-saving [34,40]. This study adopts a comprehensive approach to measure the comprehensive index of ULHU. Drawing on existing research findings and considering the indicators’ feasibility, facticity, scientific nature, and representativeness, an indicator system is constructed encompassing four aspects: high-quality strategic layout, high-quality resource allocation, high-quality process regulation, and high-quality output synergy. A total of 12 indicators are selected for evaluation, as presented in Table 1. Specifically, in relation to the indicator of government attention, this research initially formulated criteria for the identification of environmental keywords. Subsequently, the keywords were filtered using the definition of “Environment Attention” provided on the website (http://www.wingodata.com, accessed on 20 November 2023). This website is extensively utilized by numerous researchers to access highly representative annual report data. Finally, the identified keyword vocabulary was employed in quantifying the level of “Environment Attention” by calculating the frequency of keyword occurrences within local government reports. To ensure the objectivity of the evaluation results, the Entropy Method is employed to calculate the weights based on the information provided by each indicator. Subsequently, the comprehensive index of ULHU is computed, effectively minimizing the influence of subjective factors. The specific indicators and methodologies are outlined as follows.

Table 1.
Construction of an indicator system for ULHU.
- (1)
- Data collection: The data were systematically chosen from all cities in the PRD urban agglomeration, which is one of the most important regions in China. The raw data is .
- (2)
- Data Standardization: The process of polar deviation standardization was employed to mitigate variations in the scale, order of magnitude relationships, and positive and negative orientations of the indicators.
Positive indicator:
Negative indicator:
Among these included, the value of the indicator for the sample, after undergoing standardization, is denoted as , = 1, 2,…, m, = 1, 2,…, n.
- (3)
- Calculate the indicator weights: Calculate the weight of the sample under the indicator for that indicator.
Among these were included which is the weight of the i sample in indicator j.
- (4)
- Define the entropy value of the metric:
Among these were included > 0, > 0. The value of k in the above equation is related to the sample m, , 0 ≤ ≤ 1.
- (5)
- Calculate the information entropy redundancy:
- (6)
- Calculate the weights of the indicators:
Among these were included 0 ≤ ≤ 1, .
- (7)
- Calculate the composite score for each sample:
3.2.2. Condition Variables
Based on the above theoretical analysis framework, this paper incorporates the subsequent condition variables.
- (1)
- Population: This variable is commonly quantified as the ratio between the total urban population and the area of the city’s administrative district. The urban population exerts influence on the economic activities within the city, primarily through production and consumption. Moreover, it ensures a continuous influx of human capital, thereby contributing to the city’s development. Furthermore, the concentration of the population, optimization of the population structure, and enhancement of the population quality can exert positive effects on ULHU [45,51].
- (2)
- Industrial: This variable is assessed by the number of large-scale industrial enterprises that play a crucial role in sustainable urban development. When selecting their locations, enterprises typically take into account the trade-off between transportation convenience, land costs, and even environmental costs. This trade-off prompts the distribution of enterprises within the city to achieve a certain equilibrium, which, in turn, influences the city’s productivity. Consequently, it indirectly impacts the size of the city [52,53].
- (3)
- Openness: This variable is quantified by the proportion of utilized foreign capital in the national GDP and plays a significant role in urban dynamics. Globalization fosters the expansion of foreign trade, particularly in coastal cities and major urban agglomerations. The influx of foreign capital signifies the infusion of advanced technological capabilities and superior management skills into the region, thereby contributing to regional development and ULHU [54].
- (4)
- Fiscal: This variable is assessed by the disparity between budgeted expenditure and budgeted revenue, as well as the ratio of budgeted revenue, which is a significant determinant. While the impact of land finance varies across regions, it plays a crucial role in facilitating urbanization, enhancing infrastructure development, and promoting the development of ULHU [55,56].
- (5)
- Talent: This variable is quantified by the number of college students and plays a crucial role in urban dynamics. College students are a high-quality talent pool and make significant contributions to the process of city construction. This can serve as an indicator of the city’s development potential, which, in turn, brings about increased consumption capacity, stimulates high-quality urban economic development, and enhances its economic resilience [57].
3.3. Data Sources
This paper selected four years of data, namely 2005, 2010, 2015, and 2020, for measurement and analysis. Using the level of ULHU in 2005 as the baseline, this study compared the results at a critical time to examine the influence of various factors, such as labor force and economic changes, as well as international communication, on ULHU. Additionally, after identifying the configurations affecting the ULHU in the four years, this paper compared the configurations in different years and explored the changes and differences among different configurations. The data utilized in this study were sourced from the China City Statistical Yearbook, China Urban Land Yearbook, China Urban Construction Yearbook, and Guangdong Statistical Yearbook. Any discrepancies or missing data were cross-checked on the official websites of local statistical bureaus. In cases where data was missing, the linear trend method was employed to calculate the values. The administrative division boundaries at all levels were obtained from the 1:4 million national primary geographic information database (https://www.resdc.cn, accessed on 20 November 2023), and the latitude and longitude data for each city were extracted using ArcGIS 10.2 software. Table 2 presents the descriptive analysis of the data used in this paper.
Table 2.
Descriptive statistics for variables.
3.4. Variables Calibration
In this study, the analysis was conducted using fsQCA 3.0 software, and the variables were calibrated using the direct calibration method. The selection of anchors for the categories of “full membership” and “full non-membership” was based on the approach proposed by Andrews et al. [58]. Specifically, the qualitative anchors for fully affiliated, intersection, and fully unaffiliated were determined by selecting the 95%, 50%, and 5% quantile values, respectively, following the method suggested by Andrews et al. [58].
3.5. Fuzzy-Set Qualitative Comparative Analysis
Due to the multi-causal and multi-variable nature of ULHU, the combination of different factors can give rise to multiple concurrent causal relationships. The conventional regression model primarily focuses on the isolated effects of individual variables, which proves inadequate in comprehending the intricate and interconnected associations. Consequently, accurately depicting the pathway toward achieving ULHU becomes challenging. Therefore, this study employed the fuzzy-set qualitative comparative analysis method to systematically explore the pathways that influence the ULHU in the PRD urban agglomeration. This choice is primarily motivated by the following reasons: firstly, Qualitative Comparative Analysis (QCA) is a method of multi-case comparative analysis that combines qualitative and quantitative approaches [59]. It adopts a complete view angle to compare different cities and addresses the intricate causal relationship between configurations and outcomes [60,61]. Unlike traditional analytical methods that adopt an atomic perspective, QCA takes into consideration the interactions between variables [62]. Secondly, necessary condition analysis plays a crucial role in systematically understanding the occurrence of a specific outcome and serves as a prerequisite for its existence [63]. QCA distinguishes between sufficient and necessary conditions that lead to the outcome [64]. Lastly, QCA encompasses various types, such as Crisp-set Qualitative Comparative Analysis (csQCA) and fsQCA. csQCA is employed to analyze cases conditioned on dichotomous variables, making it challenging to address research questions involving continuous variables [65]. As the condition variables in this paper are continuous, fsQCA was selected as the research method to uncover the intricate causal mechanisms of ULHU.
In previous studies, the validity of fsQCA analysis results has often been assessed based on consistency and coverage [66]. The consistency index is utilized to evaluate the degree to which the condition variable can serve as a sufficient condition for the outcome variable. The formula for calculating consistency is as follows:
Coverage, another important criterion for evaluating fsQCA analysis results, assesses the extent to which a solution that meets the consistency test adequately explains the observed outcomes. The coverage formula is as follows:
3.6. Research Steps
The research steps, as shown in Figure 3, consist of five essential parts: data source, study area, variables, indicator system, and results. The following subsections provide detailed explanations of each step.

Figure 3.
Research design of this study.
This research initially establishes the research scope and objective of investigation. Subsequently, a comprehensive set of indicators is formulated to assess the ULHU. Specifically, the explanatory variables considered in this study encompass Population, Industrial, Openness, Fiscal and Talent. Through the determination of initial indicators and meticulous data collection, calculations are conducted. Ultimately, the research reveals the spatio–temporal evolution pattern of ULHU and configurations for ULHU in the PRD region.
4. Results
4.1. Characteristics of the Spatial and Temporal Evolution of ULHU
4.1.1. Temporal Characteristics of ULHU
The Entropy Method was employed to calculate the weights for the ULHU indicator system, which was then used to compute the comprehensive index of ULHU (as presented in Table 3). Overall, the average value of the comprehensive index for ULHU has increased from 0.1150 in 2005 to 0.2758 in 2020, exhibiting an annual growth rate of 8.739%. This upward trend can be attributed to several factors. Firstly, local governments have implemented a series of legislative measures, regulations, and policy documents, which have provided clear guidance for reforms such as construction land consolidation and the establishment of ecological requirements. These measures have facilitated the improvement of land use through scientific planning and management. Secondly, the composite index’s average value demonstrates a consistent upward trajectory from 2005 to 2015, followed by a significant surge in 2020. This abrupt increase can be attributed to the shift in China’s economic development and reform goals towards pursuing high-quality, high-efficiency, and sustainable development modes, driven by the previous period’s factor dividend-induced rapid economic and societal growth [67]. Therefore, the objective of land use, especially ULHU, has also shifted accordingly. Additionally, continuous advancements and innovations in science and technology have provided a new impetus for enhancing ULHU.
Table 3.
A comprehensive index of ULHU in PRD cities from 2005 to 2020.
From 2005 to 2020, the comprehensive index of ULHU revealed an increasing disparity in ULHU among cities. Only Guangzhou and Shenzhen exhibited an index of 0.5 or higher. This can be attributed primarily to their advantageous geographical locations, superior accessibility, high concentration of industrial clusters, and high economic development levels. The efficient use of production factors directly influences the level of ULHU in these cities. Other cities in the PRD, such as Foshan, Dongguan, Huizhou, Zhongshan, and Zhuhai, have witnessed a rise in their comprehensive index of ULHU from approximately 0.1 to over 0.2. Although the ULHU values have not surpassed 0.2 in some cities (e.g., Jiangmen, Zhaoqing, Shanwei, Qingyuan, Yunfu, Heyuan, and Shaoguan), they have demonstrated an overall upward trend, which can be attributed to the tailored policy guidance and timely adjustments in industrial structure.
4.1.2. Spatial Characteristics of ULHU
To directly describe the spatial characteristics of ULHU in the PRD, spatial distribution maps were generated for the years 2005, 2010, 2015, and 2020 using ArcGIS 10.2 software. The maps are created utilizing the natural-interruption-point method and are presented in Figure 4.
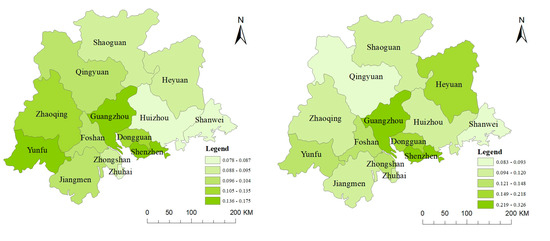

Figure 4.
Distribution and evolution of ULHU in PRD.
In general, the high and medium-value areas of ULHU in the PRD region were predominantly concentrated in the central region. In contrast, the low-value areas were primarily found in the northern region. The spatial pattern in the PRD region demonstrated a distribution characterized by “high in the central region and low in the peripheral area.” This distribution was particularly evident in 2015 and 2020. Although the distribution was not as pronounced in 2005 and 2010, it can still be observed that the ULHU level was relatively high in the central city. The level of ULHU in most cities has been on the rise, except in Heyuan city in 2010. In 2005, the overall level of ULHU was low, but the variation among cities was small, demonstrating a continuous distribution. Guangzhou, Shenzhen, and Yunfu were the main areas with high levels of ULHU. In 2005, there was not much disparity in the economic development of cities in the PRD region. In the past three decades, most cities still possessed a considerable amount of available land resources. By 2010, there was a shift in the patterns of land use in PRD cities, with the central region steadily improving and gradually widening the gap with the surrounding regions. This indicates that peripheral cities relied more on labor and capital inputs. At the same time, hotspots for foreign direct investment (FDI) were concentrated in the central region, resulting in a slowdown in the growth rate of surrounding cities. In 2015, the overall level of ULHU further improved, but the disparity among cities widened, and the distribution of low-value areas expanded. The expansion of city boundaries, driven by urbanization and industrialization, often came at the expense of lowering the level of ULHU. Low-end enterprises still concentrated in certain areas, and the land factor remained crucial for the economic development of cities. By 2020, the issue of land scarcity in cities had reached a critical level, with a growing concentration of high-value areas exhibiting ULHU, particularly in the central region. However, the overall growth rate increased, indicating a shift in urban development patterns, with greater emphasis on achieving a balanced integration of social, economic, and environmental benefits in urban development.
In general, the level of ULHU in the PRD region exhibits significant variation among different cities, characterized by spatial clustering and distinct “core-periphery” characteristics. Notably, Guangzhou and Shenzhen had the highest value of ULHU. In contrast, peripheral cities in the PRD region, such as Qingyuan, Shanwei, and Jiangmen, still require significant improvement in ULHU.
4.2. Configuration Analysis of ULHU
4.2.1. Necessary Condition Analysis
Before analyzing the configuration of condition variables, it is essential to conduct individual tests to assess the “necessity” of each condition. This step can be employed to test whether a specific condition is necessary for the presence of the outcome [68]. Considering that the data in 2020 can better represent the current status of ULHU in the PRD region, this study utilized the data in 2020 as an example to identify the necessary conditions associated with ULHU or urban land low-quality use. The results are presented in Table 4, with the “~” symbol indicating the absence of a condition variable. If the consistency of a condition variable exceeds the critical value of 0.9, the condition is considered necessary [69].
Table 4.
Necessary condition analysis for ULHU.
The analysis results presented in Table 4 indicate that except for high population density, the consistency of all other conditions falls below 0.9. This suggests that high population density may be a necessary condition for explaining the level of ULHU. At the same time, the remaining indicators do not individually constitute necessary conditions for explaining the levels of both ULHU and urban land low-quality use. Consequently, it becomes imperative to investigate the combined influence of multiple factors (configurations) on the ULHU, including population density, industrial structure, openness to the outside world, fiscal capacity, and talent resources.
4.2.2. Sufficient Condition Analysis
To delve into the mechanism underlying the multiple concurrent relationships among condition variables affecting the level of ULHU, the fsQCA method was employed for further analysis. This method allowed for the examination of different configurations of conditions that led to ULHU. In the specific procedure, the initial consistency threshold was set at 0.8 to ensure the strength of the final combination path explanation. In contrast, the PRI (Proportional Reduction in Inconsistency) threshold was set at 0.75 [70] to obtain the results of the configuration analysis for different time points. The outcomes of the analysis are presented in Table 5, Table 6 and Table 7. The specific analysis is outlined as follows:
Table 5.
Configurations for ULHU (2005).
Table 6.
Configurations for ULHU (2010 and 2015).
Table 7.
Configurations for ULHU (2020).
- (1)
- Period 1 (2005):
Table 5 presents the results for two configurations that drove the level of ULHU in 2005. The consistency of these configurations exceeds 0.80, indicating that the selected condition variables can serve as equivalent and sufficient conditions for enhancing the level of ULHU. The Overall Solution Coverage of these configurations is 0.5543, suggesting that these two configurations can effectively explain 55.43% of real-world cases. To compare the differences between these configurations, they were further classified into Population-industry-talent driven and Openness-fiscal-talent driven pathways.
- (1)
- Population-industry-talent driven (H1a): H1a is a configuration that highlights the central role played by population density, industrial structure, and talent resources. For these cities, they can attract a significant number of people as the labor force. Simultaneously, this population growth, when coupled with industrial development, can provide sufficient resources to strengthen the construction of urban infrastructure, which can facilitate the transfer of talent resources and improve the level of ULHU. Guangzhou, Shenzhen, Foshan, and Dongguan serve as cases in this configuration. Among them, Guangzhou and Shenzhen, being top-tier cities in China, possess exceptional populations and reserve a substantial pool of talent resources, thereby demonstrating their leading and exemplary roles. Hence, this configuration is particularly suitable for cities with high economic levels. Such cities have the ability to attract and gather production factors, leading to the formation of agglomerative economies.
- (2)
- Openness-fiscal-talent driven (H1b): H1b is a configuration that emphasizes the central role played by openness to the outside world, fiscal capacity, and talent resources. Foreign investment catalyzes by providing additional capital and production factors. When combined with the government’s fiscal investment to promote economic flows and optimize resource allocation, it leads to enhanced regional economic growth and enhanced ULHU. The external benefits brought by talents can further accelerate the process. Zhaoqing stands out as a typical example among the cases within this configuration, which showcases the proactive efforts of governments in developing local openness levels and enhancing talent attraction capabilities. Therefore, this configuration is well-suited for those who can effectively utilize fiscal revenue and external resources to facilitate the development of local cities. By leveraging these resources, the ULHU can be improved, leading to enhanced urban development and overall well-being.
- (2)
- Periods 2–3 (2010 and 2015):
Table 6 presents the configurations of ULHU in 2010 and 2015. The configuration in 2010, identified as Population-industry-talent driven (H2a), highlights the central role played by population density, industrial structure, and talent resources. Similarly, the configuration in 2015 (H2b) is the same as that in 2010 (H2a). However, the consistency and coverage of the configuration in 2015 surpasses that of 2010. This suggests that the pathway for achieving ULHU can be effectively realized. It not only validates the robustness of the findings but also underscores the systematic and continuous economic development in the PRD. In the results, it is evident that the configuration identified in both 2010 and 2015 includes population, industrial development, and openness as core conditions. This finding suggests that cities in the PRD region leveraged their industrial advantages to promote economic growth during these years. The high level of economic development in the PRD attracted a significant influx of people, ensuring the continued development of these cities and contributing to the overall progress of the PRD region. Furthermore, it can be inferred that the openness level of most cities in the PRD has improved over time. This enhanced openness likely played a role in facilitating economic development and further promoting ULHU in the PRD region. Based on these results, it is evident that these configurations can explain the pathways for ULHU in Guangzhou, Shenzhen, Foshan, Dongguan, and Zhongshan.
- (3)
- Period 4 (2020):
Table 7 presents the results of configurations for the ULHU in 2020. The consistency between these configurations exceeds 0.80, indicating that the selected condition variables can serve as an equivalent and sufficient condition for enhancing the ULHU. The Overall Solution Coverage of these configurations is 0.7351, suggesting that these configurations can explain 73.51% of real-world cases. To further compare the differences between the two configurations, they were categorized into population-dominated and population-industry driven pathways.
- (1)
- Population-led (H3a): H3a reflects a configuration where population density serves as the core condition, while the industrial structure and openness to the outside world play a supportive role. This configuration highlights that as population density increases, both the government and enterprises are compelled to adopt efficient policies and strategies to enhance the efficiency of resource utilization and allocation. This, in turn, facilitates the realization of economies of scale, and improves the use and transfer of production factors. Moreover, foreign investment will be utilized to bridge the capital gap, as well as foster the development of advanced technologies. Consequently, productivity can be boosted in these cities, and the ULHU and economic levels can be promoted accordingly. This configuration can effectively explain the dynamics of three cities: Guangzhou, Shenzhen, and Zhongshan. It indicates that these cities are inclined to attract more production factors, such as talents and innovative resources, as well as build an enhanced level of economic openness, which will result in a higher level of ULHU.
- (2)
- Population-industry driven (H3b): The H3b highlights the significance of population density and industrial structure as core conditions, emphasizing the complementary role of talents. The concentration of the population and the growing number of industrial enterprises in the PRD region imply an increase in manufacturing activities. This, in turn, generates substantial capital that can be utilized for local development and further promotes the ULHU. While talent does play a role in this context, it appears to have a relatively minor impact compared to population and industrial resources. This suggests that while talents contribute to improving the efficiency of production factor utilization, their influence is not as significant as the availability of a large population and abundant industrial resources. Cities such as Guangzhou, Shenzhen, Foshan, and Dongguan exemplify cases that can be interpreted within this configuration. These cities have significant advantages in terms of population size, economic development capacity, and talent attraction capacity. In the context of rapid urbanization in China, the collective development of these conditions becomes a pathway to promote ULHU.
4.3. Comparison of Configurations of ULHU
The analysis primarily focuses on the individual conditions present in the configurations over time. Firstly, population density and industrial base consistently emerge as crucial factors in the process of ULHU, appearing in all four time points. They serve as core conditions, indicating their significant role in facilitating the effective use of urban land. Secondly, the aspect of openness to the outside world appears as a core condition only once, suggesting that local governments play a supplementary role in promoting ULHU by attracting foreign investment and fostering economic diversification. Thirdly, the importance of talent resources gradually diminishes in subsequent developments. While talent resources are core conditions in periods 1 and 2, as well as period 3, they only appear as peripheral conditions in period 4. This analysis reveals that the continuous development of the PRD region has resulted in abundant resources and a number of talents. Therefore, the key to achieving ULHU currently lies in accelerating the transformation of the city’s industrial structure, reducing the significance of talent resources.
Next, the combination of condition variables is examined. The combination of population density and industrial structure remains stable throughout the evolution, indicating their complementary and mutually reinforcing relationship. An increase in population size indicates the availability of an ample labor force for industrial development, while industrial growth attracts a significant influx of the population, contributing to the regional economy. On the other hand, population density and fiscal capacity exhibit a mutual weakening effect across all periods. This analysis suggests that an increase in fiscal capacity leads to higher taxes, which subsequently impact corporate profits and influence population mobility. In addition, talent resources emerge as a core condition in period 1, which continues to be significant in periods 2 and 3. However, in period 4, talent resources no longer hold the status of a core condition. In summary, the evolutionary patterns influencing the configuration reveal a close relationship between population density, industrial structure, and talent resources.
Lastly, the mechanism is analyzed by integrating the configurations with corresponding typical cases. In the cases of Guangzhou, Shenzhen, and Foshan, population density and industrial structure exhibit a stable co-evolutionary trend, while the significance of openness to the outside world and fiscal capacity is relatively diminished. Although the role of talent resources has undergone a shift, it still plays a supportive role. Considering the overall development level of these cities, a substantial population base and robust industrial development remain crucial conditions for achieving ULHU.
5. Discussions
5.1. Characteristics of Pathways towards ULHU
This paper examines the spatio–temporal patterns of ULHU in the PRD region and investigates strategies for its improvement. In 2005, the ULHU patterns were driven by Population-industry-talent (H1a) and Openness-fiscal-talent (H1b) configurations. However, by 2010 and 2015, these patterns had transformed into Population-industry-talent (H2a and H2b) and ultimately evolved into Population-led (H3a) and Population-industry-driven (H3b) configurations by 2020. The analysis has yielded several interesting findings.
Firstly, significant variations in configurations were observed when comparing H1a and H1b. Different cities can focus on attracting a growing number of people and industrial enterprises to achieve ULHU. They can also leverage fiscal revenue and international resources to facilitate ULHU. Thus, the concentration of production factors is deemed important, and the actual pathway should be chosen based on city-specific characteristics. Secondly, a comparison between H2a, H2b, and H1a reveals that the role of openness as a peripheral condition was absent, indicating that openness did not play a critical role in improving ULHU. Thirdly, in 2020, the population assumes a crucial role in both configurations, underscoring its significance in enhancing ULHU. This finding aligns with the agglomeration economics theories, which emphasize the efficiency and development benefits of population concentration in cities. Moreover, fiscal revenue does not appear to be essential in each configuration, suggesting that ULHU is not heavily reliant on it. Local governments should instead leverage local advantages to improve ULHU accordingly.
5.2. Policy Implications
The conclusions of this paper can not only guide the development of the PRD region, but also provide references for other cities in other countries facing similar challenges. Drawing upon these conclusions, the following policy implications can be proposed:
Firstly, it is crucial to leverage the synergistic effects by harnessing the radiation impact of central cities to drive the development of surrounding areas. This approach can facilitate the flow of production factors and leverage the advantages of neighboring cities, which will unlock the potential for improving the level of ULHU. Additionally, expediting the process of regional integration is essential. This entails dismantling barriers between cities, facilitating the efficient circulation of production factors, fostering cross-regional cooperation, and maximizing the spatial spillover effect of these production factors. In this context, the enhancement of ULHU can be effectively promoted. Moreover, it is essential to note that these strategies should be tailored to the specific context, considering its unique development goals and objectives. Cities in the initial development stage can adopt Population-industry-talent driven and Openness-fiscal-talent driven pathways based on their local unique conditions. However, for cities in the later stages of development, the primary focus shifts towards attracting a larger population. Additionally, these cities need to open up to the outside world and enhance their industrial conditions.
Secondly, the level of labor and economic development exerts a significant influence on ULHU. It is imperative to further advance the process of new-type urbanization, with a particular focus on fostering synergistic development among urban economy, population, and ecology, among other factors. This entails gradually expanding the effects of population and capital agglomeration, while continuously optimizing scientific and technological means. Therefore, it is recommended to establish a Central Business District (CBD) to attract enterprises, financial institutions, and talent resource institutions. This will enable the full utilization of social capital and human resources available in the city. Additionally, concerted efforts should be made to attract foreign investment and promote industrial specialization and diversification.
5.3. Theoretical Contributions and Research Limitations
This paper makes several theoretical contributions. Firstly, it constructs a comprehensive indicator system for the ULHU from an input–output perspective. This is the first study to propose such a comprehensive indicator system from this particular viewpoint. On the one hand, this paper enriches our understanding of ULHU and clarifies its dimensions. On the other hand, it provides an unprecedented paradigm for other researchers to explore this concept. Secondly, this paper applies the fsQCA method to investigate the influencing configurations of ULHU. By doing so, it not only expands the existing research boundaries on the influencing mechanism of ULHU but also introduces the application of fsQCA to a new and unexplored research field. Moreover, this paper can resolve controversies in the current literature regarding the pathways for improving ULHU. By presenting a comprehensive indicator system and utilizing the fsQCA method, this study offers a balanced perspective that can bridge the gaps between different research paradigms and methodologies.
While this paper addresses some research gaps that have not been previously explored, it is important to acknowledge and discuss the existing limitations. Throughout the entire content, this paper examines the strategies for attaining ULHU and enhancing urban development by elucidating the spatio–temporal dynamics of ULHU in the PRD region. While this indicator system proposed in this paper provides a comprehensive depiction of the entire process, encompassing input to output, it is important to acknowledge that it possesses certain inherent limitations. Firstly, the indicator selection of ULHU in this study primarily emphasizes the input–output perspective, with a specific focus on assessing the influence of human activities on land use, predominantly within the socio-economic domain. However, it is crucial to acknowledge the necessity of incorporating additional dimensions, particularly pertaining to the natural characteristics of the land. Therefore, further research should consider the inclusion of diverse perspectives to enhance the comprehensiveness of the investigation. Furthermore, it is important to note that this research focuses solely on the urban land change dynamics within the PRD region, indicating a relatively narrow research scope and objectives. It is crucial to acknowledge that variations in geographical location, natural factors, governmental policies, and socio-economic conditions across different regions can potentially yield diverse impacts on regional land use patterns.
Therefore, it is recommended to measure the level of land use by considering both the input–output perspective and the current status of land. This can be achieved by integrating data from various sources and constructing a comprehensive indicator system that accounts for multiple functions of land use. Additionally, to broaden the research objectives, it is recommended to incorporate regions exhibiting substantial dissimilarities. This would enable a comparative analysis of urban land use changes across diverse areas, facilitating the identification of common impact patterns.
6. Conclusions
This study utilized data from 2005, 2010, 2015, and 2020, focusing on cities within the PRD urban agglomeration. This paper established a comprehensive indicator system for assessing the level of ULHU, encompassing high-quality strategic layout, high-quality resource allocation, high-quality process regulation, and high-quality output synergy. By employing GIS spatial analysis and fsQCA, the research investigated the spatial and temporal patterns of ULHU levels and their underlying driving mechanisms. The following conclusions can be obtained based on this research:
- (1)
- The spatial and temporal patterns revealed a widening gap in the level of ULHU among cities within the PRD region. The ULHU levels exhibited heterogeneity, characterized by distinct spatial clustering and a notable “core-periphery” dynamic. Over time, there has been a gradual transition from a fragmented distribution pattern to a more centralized one. Notably, Guangzhou and Shenzhen have emerged as frontrunners in ULHU, reaping the benefits of their rapid economic development.
- (2)
- There are a total of four configurations identified in the study, including Population-industry-talent driven, Openness-fiscal-talent driven, Population-led, and Population-industry driven. The analysis of the driving mechanism has revealed that population density and industrial structure play a central and consistent role in the evolution of ULHU. These two factors exhibited a complementary relationship and served as crucial conditions for achieving ULHU. Conversely, the factors of openness to the outside world and fiscal capacity play a less central role. Consequently, cities enhance their ULHU levels by leveraging the support provided by the core conditions.
Author Contributions
Conceptualization, Y.L., D.C. and Z.Z.; methodology, Y.L. and D.C.; software, Y.L.; validation, Y.L. and D.C.; formal analysis, Y.L. and D.C.; investigation, Y.L. and X.L.; resources, X.P. and Z.Z.; data curation, Y.L. and X.T.; writing—original draft preparation, Y.L.; writing—review and editing, Y.L., D.C. and Z.Z.; visualization, Y.L.; supervision, D.C. and X.L.; project administration, X.P. and D.C.; funding acquisition, D.C. and Z.Z. All authors have read and agreed to the published version of the manuscript.
Funding
This study was funded by the Key Laboratory of Natural Resources Monitoring in Tropical and Subtropical Area of South China, Ministry of Natural Resources (No. 2023NRMK03); the Humanity and Social Science Research Funds of Ministry of Education of China (No. 21YJC790006).
Data Availability Statement
The original contributions presented in the study are included in the article, further inquiries can be directed to the corresponding author.
Conflicts of Interest
The authors declare no conflicts of interest.
References
- Bayer, A.D.; Lautenbach, S.; Arneth, A. Benefits and Trade-Offs of Optimizing Global Land Use for Food, Water, and Carbon. Proc. Natl. Acad. Sci. USA 2023, 120, e2220371120. [Google Scholar] [CrossRef] [PubMed]
- Lu, S.; Zhou, Y.; Song, W. Uncoordinated Urbanization and Economic Growth—The Moderating Role of Natural Resources. Growth Chang. 2021, 52, 2071–2098. [Google Scholar] [CrossRef]
- Nautiyal, S.; Goswami, M.; Shivakumar, P. Urbanization and Peri-Urbanization in Bengaluru. In Field Margin Vegetation and Socio-Ecological Environment; Environmental Science and Engineering; Springer International Publishing: Cham, Switzerland, 2021; pp. 17–40. ISBN 978-3-030-69200-1. [Google Scholar]
- Steinhäußer, R.; Siebert, R.; Steinführer, A.; Hellmich, M. National and Regional Land-Use Conflicts in Germany from the Perspective of Stakeholders. Land Use Policy 2015, 49, 183–194. [Google Scholar] [CrossRef]
- United Nations. World Urbanization Prospects, the 2011 Revision; United Nations: New York, NY, USA, 2012.
- Seto, K.C.; Güneralp, B.; Hutyra, L.R. Global Forecasts of Urban Expansion to 2030 and Direct Impacts on Biodiversity and Carbon Pools. Proc. Natl. Acad. Sci. USA 2012, 109, 16083–16088. [Google Scholar] [CrossRef] [PubMed]
- Cheng, Z.; Li, X.; Zhang, Q. Can New-Type Urbanization Promote the Green Intensive Use of Land? J. Environ. Manag. 2023, 342, 118150. [Google Scholar] [CrossRef] [PubMed]
- Mcdonald, R.I.; Kareiva, P.; Forman, R.T.T. The Implications of Current and Future Urbanization for Global Protected Areas and Biodiversity Conservation. Biol. Conserv. 2008, 141, 1695–1703. [Google Scholar] [CrossRef]
- Mckinney, M.L. Urbanization, Biodiversity, and Conservation. BioScience 2002, 52, 883. [Google Scholar] [CrossRef]
- Chen, D.; Hu, W.; Li, Y.; Zhang, C.; Lu, X.; Cheng, H. Exploring the Temporal and Spatial Effects of City Size on Regional Economic Integration: Evidence from the Yangtze River Economic Belt in China. Land Use Policy 2023, 132, 106770. [Google Scholar] [CrossRef]
- Menzori, I.D.; Sousa, I.C.N.D.; Gonçalves, L.M. Urban Growth Management and Territorial Governance Approaches: A Master Plans Conformance Analysis. Land Use Policy 2021, 105, 105436. [Google Scholar] [CrossRef]
- Zhao, J.; Zhu, D.; Cheng, J.; Jiang, X.; Lun, F.; Zhang, Q. Does Regional Economic Integration Promote Urban Land Use Efficiency? Evidence from the Yangtze River Delta, China. Habitat Int. 2021, 116, 102404. [Google Scholar] [CrossRef]
- Qu, Y.; Zhang, Q.; Zhan, L.; Jiang, G.; Si, H. Understanding the Nonpoint Source Pollution Loads’ Spatiotemporal Dynamic Response to Intensive Land Use in Rural China. J. Environ. Manag. 2022, 315, 115066. [Google Scholar] [CrossRef] [PubMed]
- Liu, Y.; Fang, F.; Li, Y. Key Issues of Land Use in China and Implications for Policy Making. Land Use Policy 2014, 40, 6–12. [Google Scholar] [CrossRef]
- Li, X.; Li, S.; Li, C.; Shi, J.; Wang, N. The Impact of High-Quality Development on Ecological Footprint: An Empirical Research Based on STIRPAT Model. Ecol. Indic. 2023, 154, 110881. [Google Scholar] [CrossRef]
- Song, C.; Liu, Q.; Song, J.; Jiang, Z.; Lu, Z.; Chen, Y. Land Use Efficiency in the Yellow River Basin in the Background of China’s Economic Transformation: Spatial-Temporal Characteristics and Influencing Factors. Land 2022, 11, 2306. [Google Scholar] [CrossRef]
- Yan, Y.; Ju, H.; Zhang, S.; Jiang, W. Spatiotemporal Patterns and Driving Forces of Urban Expansion in Coastal Areas: A Study on Urban Agglomeration in the Pearl River Delta, China. Sustainability 2019, 12, 191. [Google Scholar] [CrossRef]
- Peng, C.; Song, M.; Han, F. Urban Economic Structure, Technological Externalities, and Intensive Land Use in China. J. Clean. Prod. 2017, 152, 47–62. [Google Scholar] [CrossRef]
- Pratama, A.P.; Yudhistira, M.H.; Koomen, E. Highway Expansion and Urban Sprawl in the Jakarta Metropolitan Area. Land Use Policy 2022, 112, 105856. [Google Scholar] [CrossRef]
- Zhang, P.; Yang, D.; Qin, M.; Jing, W. Spatial Heterogeneity Analysis and Driving Forces Exploring of Built-up Land Development Intensity in Chinese Prefecture-Level Cities and Implications for Future Urban Land Intensive Use. Land Use Policy 2020, 99, 104958. [Google Scholar] [CrossRef]
- Gao, X.; Zhang, A.; Sun, Z. How Regional Economic Integration Influence on Urban Land Use Efficiency? A Case Study of Wuhan Metropolitan Area, China. Land Use Policy 2020, 90, 104329. [Google Scholar] [CrossRef]
- Wu, J.; Wu, C.; Zhang, Q.; Zhuang, M.; Xiao, H.; Wu, H.; Ouyang, L.; Liu, Y.; Meng, C.; Song, C.; et al. Spatiotemporal Evolution of Urban Agglomeration and Its Impact on Landscape Patterns in the Pearl River Delta, China. Remote Sens. 2023, 15, 2520. [Google Scholar] [CrossRef]
- Zhang, Z.; Zuo, Q.; Li, D.; Wu, Q.; Ma, J. The Relationship between Resource Utilization and High-Quality Development in the Context of Carbon Neutrality: Measurement, Assessment and Identification. Sustain. Cities Soc. 2023, 94, 104551. [Google Scholar] [CrossRef]
- Kretzer, G.; Kanashiro, M.; Tibiriçá de Saboya, R. Complementarity between urban land uses: A temporal analysis. J. Urban Des. 2023, 1–18. [Google Scholar] [CrossRef]
- Deprêtre, A.; Jacquinod, F.; Barroca, B.; Becue, V. Development of an Intensity of Uses Index to Support Design Decision-Making and Improve Urban Development Quality. Cities 2024, 147, 104779. [Google Scholar] [CrossRef]
- Hsu, K.-C. Effect of Distinct Land Use Patterns on Quality of Life in Urban Settings. J. Urban Plann. Dev. 2019, 145, 05019016. [Google Scholar] [CrossRef]
- Butsic, V.; Radeloff, V.C.; Kuemmerle, T.; Pidgeon, A.M. Analytical Solutions to Trade-Offs between Size of Protected Areas and Land-Use Intensity. Conserv. Biol. 2012, 26, 883–893. [Google Scholar] [CrossRef] [PubMed]
- Brenton, S.; Baekkeskov, E.; Hannah, A. Policy Capacity: Evolving Theory and Missing Links. Policy Stud. 2023, 44, 297–315. [Google Scholar] [CrossRef]
- Chakrabarty, A. Power in Policymaking: Origin and Influence. Int. J. Sustain. Policy Pract. 2023, 19, 29–44. [Google Scholar] [CrossRef]
- Yin, Z.; Liu, Y.; Tang, L.; Zhou, W.; Pan, Y. Spatial-Temporal Evolution of Agricultural Land Utilization Benefits and Tradeoffs/Synergies in the Beijing-Tianjin-Hebei Region. Ecol. Indic. 2023, 156, 111110. [Google Scholar] [CrossRef]
- Xu, F.; Wang, Z.; Chi, G.; Zhang, Z. The Impacts of Population and Agglomeration Development on Land Use Intensity: New Evidence behind Urbanization in China. Land Use Policy 2020, 95, 104639. [Google Scholar] [CrossRef]
- Wang, Z.; Fu, H.; Liu, H.; Liao, C. Urban development sustainability, industrial structure adjustment, and land use efficiency in China. Sustain. Cities Soc. 2023, 89, 104338. [Google Scholar] [CrossRef]
- Simmie, J. Innovation and Clustering in the Globalised International Economy. Urban Stud. 2004, 41, 1095–1112. [Google Scholar] [CrossRef]
- Hu, W.; Li, Z.; Chen, D.; Zhu, Z.; Peng, X.; Liu, Y.; Liao, D.; Zhao, K. Unlocking the Potential of Collaborative Innovation to Narrow the Inter-City Urban Land Green Use Efficiency Gap: Empirical Study on 19 Urban Agglomerations in China. Environ. Impact Assess. Rev. 2024, 104, 107341. [Google Scholar] [CrossRef]
- Sun, C.; Zhang, S.; Song, C.; Xu, J.; Fan, F. Investigation of Dynamic Coupling Coordination between Urbanization and the Eco-Environment—A Case Study in the Pearl River Delta Area. Land 2021, 10, 190. [Google Scholar] [CrossRef]
- Cannatella, D. Industrial Transformation and Sustainable Urban Planning in the Pearl River Delta: A Landscape-Based Approach. In Adaptive Urban Transformation; Nijhuis, S., Sun, Y., Lange, E., Eds.; The Urban Book Series; Springer International Publishing: Cham, Switzerland, 2023; pp. 209–232. ISBN 978-3-030-89827-4. [Google Scholar]
- Lv, C.; Lian, A.; Wang, Z.; Jia, T.; Sun, X.; Dong, R. A Spatiotemporal Pattern Analysis of High-Frequency Land-Use Changes in the Guangdong–Hong Kong–Macao Greater Bay Area, from 1990 to 2018. Land 2022, 12, 102. [Google Scholar] [CrossRef]
- Yang, R.; Qin, B.; Lin, Y. Assessment of the Impact of Land Use Change on Spatial Differentiation of Landscape and Ecosystem Service Values in the Case of Study the Pearl River Delta in China. Land 2021, 10, 1219. [Google Scholar] [CrossRef]
- Patchell, J. China’s Greater Bay Area: Agglomeration, External Economies, Governance and Urbanization, 1st ed.; Routledge: London, UK, 2023; ISBN 978-1-00-302794-2. [Google Scholar]
- Wang, F.; Wang, R.; He, Z. The Impact of Environmental Pollution and Green Finance on the High-Quality Development of Energy Based on Spatial Dubin Model. Resour. Policy 2021, 74, 102451. [Google Scholar] [CrossRef]
- Lu, X.; Tao, X.; Kuang, B.; Tang, Y.; Wang, M. Environmental Assessment, Environmental Attention of Government and Green Utilization Efficiency of Urban Land. China Land Sci. 2023, 37, 104–112. [Google Scholar]
- Kuang, B.; Liu, J.; Fan, X. Has China’s Low-Carbon City Construction Enhanced the Green Utilization Efficiency of Urban Land? IJERPH 2022, 19, 9844. [Google Scholar] [CrossRef]
- Wu, F.; Yang, X.; Chen, Y. Financial Agglomeration and Urban Economic Quality—A Three-Dimensional Perspective of Efficiency, Resilience and Vitality. J. Cap. Univ. Econ. Bus. 2022, 24, 73–87. [Google Scholar]
- Yu, J.; Zhou, K.; Yang, S. Land Use Efficiency and Influencing Factors of Urban Agglomerations in China. Land Use Policy 2019, 88, 104143. [Google Scholar] [CrossRef]
- Lu, X.; Chen, D.; Kuang, B.; Zhang, C.; Cheng, C. Is High-Tech Zone a Policy Trap or a Growth Drive? Insights from the Perspective of Urban Land Use Efficiency. Land Use Policy 2020, 95, 104583. [Google Scholar] [CrossRef]
- Li, J.; Wang, M. The Dual Regulatory Paths of Collaborative Innovation between Local Governments and Enterprises from the Perspective of R&D Subsidy. Sci. Sci. Manag. S. T. 2023, 1–18. [Google Scholar]
- Xu, W.; Xu, Z.; Liu, C. Coupling Analysis of Land Intensive Use Efficiency and Ecological Well-Being Performance of Cities in the Yellow River Basin. J. Nat. Resour. 2021, 36, 114–130. [Google Scholar] [CrossRef]
- Ke, N.; Lu, X.; Zhang, X.; Kuang, B.; Zhang, Y. Urban Land Use Carbon Emission Intensity in China under the “Double Carbon” Targets: Spatiotemporal Patterns and Evolution Trend. Env. Sci. Pollut. Res. 2022, 30, 18213–18226. [Google Scholar] [CrossRef] [PubMed]
- Pan, Y.; Chen, H.; Zhang, Z. Urban Interaction: Spatial Interaction Effects and Driving Factors of High-Quality Use of Urban Land in the Yangtze River Delta. Resour. Environ. Yangtze Basin 2023, 32, 1885–1897. [Google Scholar]
- Fu, Y.; Zhou, T.; Yao, Y.; Qiu, A.; Wei, F.; Liu, J.; Liu, T. Evaluating Efficiency and Order of Urban Land Use Structure: An Empirical Study of Cities in Jiangsu, China. J. Clean. Prod. 2021, 283, 124638. [Google Scholar] [CrossRef]
- Chen, D.; Lu, X.; Hu, W.; Zhang, C.; Lin, Y. How Urban Sprawl Influences Eco-Environmental Quality: Empirical Research in China by Using the Spatial Durbin Model. Ecol. Indic. 2021, 131, 108113. [Google Scholar] [CrossRef]
- He, C.; He, S.; Mu, E.; Peng, J. Environmental Economic Geography: Recent Advances and Innovative Development. Geogr. Sustain. 2022, 3, 152–163. [Google Scholar] [CrossRef]
- Zhang, J.; Zhang, D.; Huang, L.; Wen, H.; Zhao, G.; Zhan, D. Spatial Distribution and Influential Factors of Industrial Land Productivity in China’s Rapid Urbanization. J. Clean. Prod. 2019, 234, 1287–1295. [Google Scholar] [CrossRef]
- He, S.; Yu, S.; Li, G.; Zhang, J. Exploring the Influence of Urban Form on Land-Use Efficiency from a Spatiotemporal Heterogeneity Perspective: Evidence from 336 Chinese Cities. Land Use Policy 2020, 95, 104576. [Google Scholar] [CrossRef]
- Wu, F. Land Financialisation and the Financing of Urban Development in China. Land Use Policy 2022, 112, 104412. [Google Scholar] [CrossRef]
- Zhao, K.; Chen, D.; Zhang, X.; Zhang, X. How Do Urban Land Expansion, Land Finance, and Economic Growth Interact? IJERPH 2022, 19, 5039. [Google Scholar] [CrossRef]
- Gu, H.; Meng, X.; Shen, T.; Wen, L. China’s Highly Educated Talents in 2015: Patterns, Determinants and Spatial Spillover Effects. Appl. Spat. Anal. 2020, 13, 631–648. [Google Scholar] [CrossRef]
- Andrews, R.; Beynon, M.J.; McDermott, A.M. Organizational Capability in the Public Sector: A Configurational Approach. J. Public Adm. Res. Theory 2016, 26, 239–258. [Google Scholar] [CrossRef]
- Invernizzi, D.C.; Locatelli, G.; Brookes, N.; Davis, A. Qualitative Comparative Analysis as a Method for Project Studies: The Case of Energy Infrastructure. Renew. Sustain. Energy Rev. 2020, 133, 110314. [Google Scholar] [CrossRef]
- Verweij, S.; Trell, E.-M. Qualitative Comparative Analysis (QCA) in Spatial Planning Research and Related Disciplines: A Systematic Literature Review of Applications. J. Plan. Lit. 2019, 34, 300–317. [Google Scholar] [CrossRef]
- Damonte, A. Modeling Configurational Explanations. Riv. Ital. Sci. Polit. 2021, 51, 182–197. [Google Scholar] [CrossRef]
- Qin, M.; Tao, Q.; Du, Y. Policy Implementation and Project Performance: A Qualitative Comparative Analysis Based on 29 National Marine Ranchings in China. Mar. Policy 2021, 129, 104527. [Google Scholar] [CrossRef]
- Dul, J.; Van Der Laan, E.; Kuik, R. A Statistical Significance Test for Necessary Condition Analysis. Organ. Res. Methods 2020, 23, 385–395. [Google Scholar] [CrossRef]
- Van Der Zon, M.; De Jong, W.; Arts, B. Community Enforcement and Tenure Security: A Fuzzy-Set Qualitative Comparative Analysis of Twelve Community Forest Management Initiatives in the Peruvian Amazon. World Dev. 2023, 161, 106071. [Google Scholar] [CrossRef]
- Wang, W.; Lan, Y.; Wang, X. Impact of Livelihood Capital Endowment on Poverty Alleviation of Households under Rural Land Consolidation. Land Use Policy 2021, 109, 105608. [Google Scholar] [CrossRef]
- Greckhamer, T.; Furnari, S.; Fiss, P.C.; Aguilera, R.V. Studying Configurations with Qualitative Comparative Analysis: Best Practices in Strategy and Organization Research. Strateg. Organ. 2018, 16, 482–495. [Google Scholar] [CrossRef]
- Wang, S.; Liu, J.; Qin, X. Financing Constraints, Carbon Emissions and High-Quality Urban Development—Empirical Evidence from 290 Cities in China. IJERPH 2022, 19, 2386. [Google Scholar] [CrossRef]
- Schneider, C.Q.; Wagemann, C. Set-Theoretic Methods for the Social Sciences: A Guide to Qualitative Comparative Analysis, 1st ed.; Cambridge University Press: Cambridge, UK, 2012; ISBN 978-1-107-01352-0. [Google Scholar]
- Schneider, C.Q.; Wagemann, C. Standards of Good Practice in Qualitative Comparative Analysis (QCA) and Fuzzy-Sets. Comp. Sociol. 2010, 9, 397–418. [Google Scholar] [CrossRef]
- Pappas, I.O.; Woodside, A.G. Fuzzy-Set Qualitative Comparative Analysis (fsQCA): Guidelines for Research Practice in Information Systems and Marketing. Int. J. Inf. Manag. 2021, 58, 102310. [Google Scholar] [CrossRef]

Disclaimer/Publisher’s Note: The statements, opinions and data contained in all publications are solely those of the individual author(s) and contributor(s) and not of MDPI and/or the editor(s). MDPI and/or the editor(s) disclaim responsibility for any injury to people or property resulting from any ideas, methods, instructions or products referred to in the content. |
© 2024 by the authors. Licensee MDPI, Basel, Switzerland. This article is an open access article distributed under the terms and conditions of the Creative Commons Attribution (CC BY) license (https://creativecommons.org/licenses/by/4.0/).