

Lessons from the Archives: Understanding Historical Agricultural Change in the Southern Great Plains


1
Department of Geography and Environmental Sustainability, University of Oklahoma, Norman, OK 73019, USA
2
Institute for Resilient Environmental and Energy Systems, University of Oklahoma, Norman, OK 73019, USA
3
Center for Spatial Analysis, University of Oklahoma, Norman, OK 73019, USA
*
Author to whom correspondence should be addressed.
Land 2024, 13(2), 196; https://doi.org/10.3390/land13020196
Submission received: 22 December 2023
/
Revised: 21 January 2024
/
Accepted: 31 January 2024
/
Published: 6 February 2024
(This article belongs to the Special Issue Water in Land System Science)
Abstract
:In the US, agriculture rapidly expanded beginning in the 1850s, influenced by homesteader policies and new technologies. With increased production also came widespread land-use/land-cover change. We analyze historical agricultural policies and associated land and water use trajectories with a focus on the Southern Great Plains (SGPs). Rapid changes in agriculture and reoccurring drought led to the infamous Dust Bowl, triggering new agricultural and land management policies, with lasting impacts on the landscape. To understand historical agricultural change, we use mixed methods, including archival literature and historical agricultural census data (1910 to 2017) from three counties in a tri-state (Oklahoma, New Mexico, Colorado) area of the SGPs. Our archival policy and agricultural census analysis illustrates 110 years of agricultural change, showing that agricultural policies and technological advances play an integral role in the development of agroecological systems, especially the Conservation Reserve Program (CRP), the Environmental Quality Incentives Program (EQIP), and the Livestock Forage Disaster Program (LFP). Further, while communities began with distinct agricultural practices, agricultural policy development resulted in increasing uniformity in crop and livestock practices. The results suggest that there are sustainability lessons to be learned by looking to the land and water trajectories and accompanying unintended consequences of the past.
1. Introduction
The U.S. Great Plains are the largest grassland ecosystem in North America. Worldwide, grasslands are crucial for providing diverse ecosystem services and are prime agricultural areas due to relatively homogeneous topography, fertile soils, and a temperate climate [1]. Grasslands occupy 40% of the land surface area, but almost half are degraded [2,3]. Agriculture is a primary driver of land-use/land-cover change (LULCC) [4]. In the U.S., agriculture rapidly expanded beginning in the 1850s, with new homesteaders moving to the Great Plains [5] (p. 13). Agricultural expansion continued through the 20th century due to both extensification and intensification, bringing more land into production, often with the help of new technologies. While this resulted in the production of more food, fiber, and energy to support rapidly growing populations, it also resulted in widespread land-cover change, often with unintended consequences, such as soil erosion, water quality degradation, and an increase in invasive and nuisance species [6,7,8,9].
In this study, we analyze historical agricultural policies and associated land-use/land-cover trajectories with a focus on the United States Southern Great Plains (SGPs). In the SGPs, rapid changes in agriculture combined with recurring cyclic droughts led to one of the greatest socioecological disasters of the 20th century, the Dust Bowl. In the 1930s, this extreme soil erosion event manifested from the combined effects of severe drought and poor land management. The Dust Bowl is one of “the darkest moment[s] in the twentieth-century life of the southern plains” and “an event of national, even planetary, significance” [10] (p. 4). At the same time, this singular event triggered new agricultural and land management policies, which would forever change the agricultural landscape in the United States. Here, we use the Dust Bowl as a flashpoint to separate distinct agricultural policies and land and water use trajectories. While agriculture is a proximate driving force of LULCC, governmental agricultural policy is often an underlying and historical force of such change [11]. Policies constantly evolve, addressing contemporary challenges, influenced by available knowledge, resources, and political and societal pressures. In this way, LULCC has a historical component, with change being incremental. Further, in Land System Science (LSS), often, our historical analysis is linked to the parameters and data availability related to our remote sensing analysis. Here, we argue that there are important lessons to be learned from looking to the past, as the past and current LULCC dynamics are inevitably linked. We also argue that the impacts of policy development are often seen years later. For instance, several policies were introduced during the Dust Bowl as emergency measures, but these led to more lasting policies. Past agricultural studies help advance current Land System Science (LSS) research, which focuses on “past, current and projected state and dynamics of land use” [12] (p. 31). Exploration into LULCC dynamics can further our understanding of current and future land-use practices and associated land-cover changes [13,14]. Historical datasets, such as agricultural censuses, provide a window to the past, especially prior to the widespread availability of modern analytical technologies, such as remote sensing [5,15].
To uncover changing agricultural policies and accompanying land- and water-use trajectories, we use historical agricultural census data (1910 to 2017) from three counties in a tri-state area of the SGPs, Cimarron County (CC), Oklahoma; Union County (UC), New Mexico; and Las Animas County (LAC), Colorado (Figure 1). These counties share similar biophysical, agricultural, and demographic characteristics, as well as Santa Fe Trail/Western white settler histories. While these shared landscapes have historically distinct land and water use and livelihood pathways with differential access to local resources (e.g., land; water, e.g., the High Plains Aquifer (aka Ogallala Aquifer)) and cultural differences/preferences, changing agricultural subsidies have promoted increasingly similar agricultural land-use trajectories. We argue that uncovering past agricultural land and water use is essential to understanding current conditions and future land- and water-use trajectories, with implications for agroecological resilience. Specifically, we address the following questions:
- Which policies and technologies have driven agricultural change over time (1910–2017)?
- What are agriculturalists’ primary land- and water-use trajectories before, during, and after the Dust Bowl (1910–2017)? How have they changed over time and space?
- What lessons can we learn using historical agricultural data for fostering resilience?
To answer these questions, we first explore the policies, technologies, and events that pushed SGP regional development. Following the account of pioneer expansion to unfamiliar territories, we document the agricultural practices that led to land transformation and associated massive and devastating soil erosion in the 1930s. Second, we address additional milestones in agricultural transformation, which culminated in three crucial subsidies for SGP agriculture: (1) the Conservation Reserve Program (CRP) (1985), which supports keeping or replanting native grasses to reduce erosion while improving water and wildlife quality [16]; (2) the Environmental Quality Incentives Program (EQIP) (1996), which is central to improving agricultural practices, like subsidizing the cost of water-efficient technologies in the region such as center pivot irrigation (CPI) [17]; and (3) the Livestock Forage Disaster Program (LFP) (2008), which shields ranchers against economic losses due to disasters and is crucial during periods of drought [18].
The collection of agricultural changes and policies explored here is not comprehensive of the transformation bridging two centuries; however, it provides a backdrop to understand current agricultural developments. Lastly, we examine the historical agricultural data and events that help shift land use regionally, with implications for current and future agroecological resilience.
2. Methods
We use a mixed methods approach to analyze historic agricultural change, exploring the highly dynamic and shifting land and water (irrigation) use in the tri-county/tri-state area (Cimarron County (CC), Oklahoma; Union County (UC), New Mexico; and Las Animas County (LAC), Colorado), with the Dust Bowl as the primary flashpoint. The counties are part of a 5-year USDA-funded project looking at participatory approaches to socio-ecological resilience and are connected by their frontier histories as well as their various degrees of reliance on the High Plains Aquifer. First, to provide a timeline of the historical trajectories of agricultural growth, technology, and policy development in this region, we accessed extensive academic historical accounts and archival literature, such as governmental reports and policies, regarding their historical evolution. Starting with the western expansion of the 19th century, we present the historical trajectories of U.S. policy and technological and agricultural development in three distinct time periods, pre-Dust Bowl, Dust Bowl, and post-Dust Bowl (see below).
Second, to analyze agricultural change over these periods, we present descriptive statistics using the USDA’s Census of Agriculture Historical Archive (1910 to 2017) from the decennial censuses and the U.S. Census Bureau [19,20]. While the U.S. census of agriculture dates back to 1820, the three counties analyzed in this study have different establishment dates: LAC was founded in 1866, UC in 1893, and CC in 1907. As a result, we discuss policy development during the period of western expansion in the 19th century but only present agriculture census results, starting with the earliest survey that captures all three counties, the 1910 survey. With the Dust Bowl as our flashpoint, we framed our results into three periods: “Pre-Dust Bowl” uses the 1910 and 1920 censuses, “The Dust Bowl” considers the 1930 and 1940 censuses, and “Post-Dust Bowl” draws on census data from 1950 to 2017. Additionally, we use the U.S. Census Bureau website to complete demographic data. Changes are then viewed in the context of the historical developments and agricultural policies discussed in the previous section.
Lastly, additional social and cultural context is provided from over 15 years of ethnographic field work in the region, which helped to direct us to focus on the specific historical land use and irrigation trajectories discussed here. This includes interviews with modern producers, as well as oral histories and key informant interviews with Dust Bowl survivors. This previous work provides us with a better long-term understanding of the types of experiences and adaptations regarding farming and ranching in the area, as well as how policies impact their management decisions, thus inspiring us to take the long view, here [13,21,22,23,24,25]. Overall, taken together, this mixed methods approach presents a regional picture of agricultural changes in the counties and region over time.
3. Results
3.1. Historical Trajectories of Policy, Technology Development, and Agricultural Growth
3.1.1. Pre-Dust Bowl, from 19th C. Westward Expansion to 1930
Major settler occupation and land transformation in the SGPs began during the late 19th century (see Figure 2). A relentless and aggressive westward expansion, fostered by U.S. governmental policy promoting settlement, stimulated land conversion for agriculture [26]. Consequently, settlers progressively transformed the Western grasslands into farmland and pasture, helping to fulfill the imperial call of “Manifest Destiny” [27]. Bills such as the Homestead Act of 1862 attracted settlers by offering ~160 acres (65 ha) of “unoccupied” property to those committed to farming it for at least five years [28], promoting the agrarian ideal of an independent farm system [8]. Pioneers settled the region via the challenging Santa Fe Trail or, increasingly, by rail. The Pacific Railway Act of 1862 further fostered westward expansion through facilitation of the transcontinental railroad construction. Township settlements followed the newly built railroads rather than streams and other water bodies, as was previously common, railroads provided transportation for people and goods and sold the land along its route [29]. Settlers and governments steadily organized into new territories, states, and counties energized by vast agricultural settlements that started around the 1870s [5].
Early settlers relied on rain-fed irrigation and open-range cattle. However, bills, like the Desert Land Act of 1877, encouraged irrigation improvements. Other innovations, such as natural and synthetic fertilizers, became widely used. The first shipment of guano from Peru, for instance, arrived in the U.S. in 1843, and by 1849, commercially manufactured fertilizer was circulating [30] (pp. 579–581). Furthermore, the first American agricultural revolution replaced much of the human workforce with animal power and technological inventions. For example, the self-scouring plow and mechanical reapers, invented around 1833, advanced agricultural outputs on prairie soils. Moreover, in 1873, the development of modern barbed wire facilitated the increasing enclosure of farming and grazing areas [31] (p. 40). In the West, where timber was scarce and fencing expensive, containing livestock was a problem. An open public debate on how to resolve the issue ensued. Several impractical efforts were attempted, but barbed wire ultimately proved its utility [29]. Corn planters, invented around the 1860s, and, later, gasoline tractors (1903), made the cheap land in the SGPs increasingly attractive for agriculture [30] (p. 587).
Simultaneously, poor knowledge of regional climate conditions beyond the 100th meridian, the promises of technologies, and pseudoscientific hypotheses like “rain follows the plow” [32] (p. 88) contributed to the idea that western lands were highly productive. Such beliefs led to indiscriminate plowing and conversion of vast areas of grassland into agricultural production [33]. However, when farmers began to experience cyclical droughts common to the SGPs, irrigation technologies helped secure production. The Reclamation Act of 1902, for instance, funded early irrigation projects in western states, which aided settlers in incorporating more land into production than rain-fed agriculture, alone, could support.
The SGPs have a long history of open-range cattle ranching on public lands and historic cattle trails [34]. In the early days of settlement, most of the area was unfenced, a conjoint territory facilitating the cattle industry’s historic growth. In the 1860s, “the capacity of the range then seemed unlimited, and the Great Plains were regarded as a cattleman’s paradise” [31] (p. 40). However, by the 1880s, driven primarily by European capital, large companies and cattle barons overstocked and overgrazed these seemingly inexhaustible lands, almost reaching the ecosystem’s carrying capacity. Additionally, harsh winters often decimated cattle stock. The winter of 1886–1887 was particularly extreme, leading to a shift in the industry. By 1895, cattle operators were working on a smaller scale, and individual ownership was increasingly more common than large operations [31]. However, grass degradation was evident as early as 1889, with experts cautioning about the exhaustion of the pasture in Texas. Solutions for restoration included limiting the number of cattle to the number the land could sustain in the poorest season [35].
Additionally, the 19th century saw crucial legislation to aid the development of agriculture. For instance, the Morrill Act, signed into law by President Lincoln on 15 May 1862, established the Department of Agriculture. This act also provided means for western states and territories to establish public colleges for the “benefit of agriculture and mechanic arts” and made education accessible to every citizen [36]. Likewise, other bills fueled education, research, and development to assist settlers, some new to agriculture. The Hatch Act of 1887 recognized the need to improve agriculturalists’ productivity by funding related research. Almost three decades later, the Smith–Lever Act of 1914 created the structure to take research to the farms. The Smith–Lever Act enabled agents from the Cooperative Extension Service to reach farmers in their counties and provide region-specific knowledge, linking the science and programs developed in colleges with the farmers’ and communities’ needs [30,37].
Agriculture was vital for national growth, employing ~41% of the total workforce by 1900 [38] (p 2). The 20th century marked the inclusion of the U.S. agriculture sector into the global economy. Consequently, the period from ~1898 to 1914 is often called the ‘Golden Age of American Agriculture’, a prolific period marked by abnormal high rain, high wheat prices, access to capital, and technological innovation, promoting agriculture intensification [5] (p. 16).
3.1.2. The Dust Bowl, 1930–1940
The policies seeking westward expansion ignored the long-term sustainability of the Great Plains [31]. While the intensification of agriculture propelled the U.S. to become a major contributor to the global agriculture market, it also came at a high cost. New machines, such as the one-way disk plow, were blamed for increasing soil pulverization, with repeated use contributing to the dust storms characteristic of the 1930s [10] (p. 91). Indeed, beginning in 1930, abnormally dry conditions began to plague the region, and coupled with poor tilling practices, severe soil erosion and dust storms occurred [39]. Massive dust storms were reported as early as 1931, and, by 1934, an estimated 91 million ha of cultivated land was experiencing some degree of soil erosion [40] (p. 78). As drought conditions intensified, the area required intensive intervention to safeguard productivity. Severe dust storms during the 1930s alarmed locals and the national public, raising awareness and supporting the need to incorporate conservation practices [41].
The Dust Bowl marked a turning point in agriculture. The relationship between humans and nature had soured, according to the Great Plains Committee, a special task force appointed by the President to counteract the devastation. In their report [31] (p. 6), the committee argued, “[humans] must realize that [they] cannot ‘conquer Nature’—[they] must live with [nature] on [its] own terms, making use of and conserving resources which can no longer be considered inexhaustible”.
The Dust Bowl originated from a combination of factors, among them drought, wheat price fluctuations, over plowing, economic downturn, and utilization of submarginal lands, severe land-cover changes encouraged by misguided policies disrupting seemingly sustainable agricultural production practices previously adapted to the region [10,23,31,42,43,44,45]. The “Dirty Thirties”, as the decade became known, marked a shift in the development of U.S. agricultural policies [46]. Coming on the heels of the Great Depression, the Dust Bowl led to waves of climatic and economic refugees in search of better livelihoods migrating to western states, such as California.
The policies implemented to support agricultural producers after the 1930s included the Agricultural Adjustment Act of 1933 (Triple-A), a ‘New Deal’ pillar, designed to fight the adverse effects of the Great Depression and the Dust Bowl. Some of the policies implemented continued protecting agriculturalists from cyclical droughts, market swings, and other external factors compromising their livelihood years ahead [8,47]. However, the success and/or impact of these agricultural policies are a point of ongoing debate [46,48,49].
3.1.3. Post-Dust Bowl, 1940 to Present
Post-Dust Bowl, the SGPs experienced another prolonged, intense drought, often called the “Little Dust Bowl”, during the 1950s. Adaptations to cyclical droughts, scientific improvements from the ’Green Revolution’, consisting of modern seed varieties and chemicals increasing yields significantly, and further technological innovations such as CPI propelled additional LULCC. The expansion of agricultural policies accompanied this agricultural intensification to help agriculturalists adapt to their “new” reality [50,51] (p. 39).
By 1980, less than 30% of nonurban counties in the U.S. depended heavily on agriculture as part of their economic development. The agricultural population was in decline. Only 9% of rural employment was to be found on farms, and 90% of the rural population lived outside of farms [52] (p. 96). Consequently, starting in the mid-1980s, agricultural policies evolved once again to better support more commercialized agriculture. Skogstad [53] (p. 463) notes, “the state assistance paradigm was under stress, and subject to a number of anomalies”, which shifted to a “market liberal model in the U.S. grain sector in the 1990s”. The reasoning behind this transition relies on new ways to look at rural development, directed at the local level by states, local governments, and the private sector. Additionally, the transition included environmental concerns raised during the 1970s and addressed by cross-compliance among agencies; governmental funding should only support agriculturalists that used less environmentally harmful agricultural practices [54,55].
Gradually, through key agricultural policy development, from the Dirty Thirties to the present, agricultural practices in the U.S. became increasingly uniform. However, as we illustrate next, many of the policies we have today are rooted in the Dust Bowl. In the SGPs, specifically, the post-Dust Bowl Conservation Reserve Program (CRP), Environmental Quality Incentives Program (EQIP), and the Livestock Forage Program (LFP) are of particular importance in shaping agricultural land-use change over time.
3.2. The Ongoing Legacy: Critical Agricultural Policy Development, 1930s to Present
3.2.1. The Conservation Reserve Program (CRP)
New Deal programs introduced during the Dust Bowl attempted to address the socioecological consequences of the Dust Bowl, including farm incentives to stop tilling submarginal lands. These programs consisted of conservation efforts on private lands paying farmers to keep grass covers on their land instead of growing crops, similar to today’s CRP. According to Gray [56] (p. 125), with “the so-called ‘restoration land’ program of the Triple-A, […] 50 cents an acre is paid each year for three years for allowing cropped land to revert permanently to natural cover when such change in use is desirable for purposes of conservation”. The government “spent more than two billion dollars to keep the independent plain farmers on their land”, plus the resources to guide reluctant agriculturalists to improve their agricultural practices [57] (p. 93). Such policies marked the beginning of the agricultural welfare state [58]. Similar programs where the government pays farmers to set aside land have been implemented in several other countries (e.g., EU’s Land Set-Aside program used as a supply control mechanism) [59].
Soil conservation programs were part of the national strategy to overturn the desolating effects. In 1936, though, the U.S. Supreme Court ruled the Triple-A unconstitutional. Subsequent Farm Bills adopted program variations, like the Adjustment Act of 1938. Another precursor of the CRP, the Great Plains Conservation Program (GPCP) in 1950, aimed to regrow grasses on 4.85 million ha of wheat land. However, the assessment of the GPCP showed that the program from 1956 to 1970 did not attain substantial progress in promoting soil conservation practices [60,61].
CRP remains the most important remnant of Dust Bowl-related era policies. Under CRP, agriculturalists deemed to be on environmentally sensitive agricultural land voluntarily commit their farm or ranch for conservation purposes [16]. The program provides a yearly rental payment for planting grass species that will provide ecosystem services to improve water quality, reduce soil erosion, and provide habitat for endangered or threatened species. Under the program, farmers and ranchers retire land from agricultural production for a period of 10 to 15 years and select from the eligible practices fitting their land characteristics. The program also offers incentives for climate-smart practices: conservation practices, increasing carbon sequestration, reducing greenhouse gas emissions, or improving water quality with techniques that will diminish sediment, nutrient loading, or reduce algae blooms [16] (p. 2).
Today’s agriculturalists seek economic benefits and consider the direct and opportunity costs when enrolling in CRP, ultimately deciding on the option with superior benefits [62]. CRP is often a key source of additional income for retired small farmers or small farmers whose primary occupation may no longer be farming. Such agriculturalists represented half of the land in the CRP in 1997 [63] and more than one-third in 2001 [64].
Unfortunately, from the 1930s to the 1990s, land retirement programs often inversely correlated with real net farm income; years with lower farm income often had higher idled land enrolled in CRP [65]. Additionally, until 2007, the rental rate paid through CRP was similar to commodity prices, making the program competitive; but, as crop prices increased, farmers registered fewer hectares into CRP [51,66]. Furthermore, from 2013 to 2016, 64% of the land with expiring contracts did not enroll back, and 79% of the land leaving CRP went into cropping, mainly to grow well-paid crops, such as soybeans, corn, and wheat [67] (p. 26). Dodson and colleagues [68], however, found that farms with more than 60% of their land in CRP are less likely to put it back into production. This may be due to the associated perceived work vs. return on investment.
Using economic incentives to promote conservation is controversial. Some consider CRP a tax burden, paying farmers to do the “right thing” ecologically and morally, keeping out-of-date family farmers in business, while others define the program as the “most effective environmental improvement program in American history” [10] (p. 248). Adding to the controversy are claims of slippage effects, stating that due to land introduced to CRP, new cropland goes into production. Therefore, the environmental benefits may be smaller than previously calculated [69,70,71], though others disagree with these claims [72].
CRP continues evolving and offering additional income to agriculturalists while providing much-needed environmental services. It has undergone several changes, restarts, and expansions over time. The modern version of CRP started with the Food Security Act of 1985 and has been revised numerous times in subsequent farm bills [73,74]. The signup system has shifted from near-open registration seeking minimum annual mandatory enrollment levels to competitive enrollment seeking greater environmental benefits and a combination of competitive and targeted enrollment. From 1986 to 1989, the signup method did not consider the land that would bring the most significant environmental impact in the rental calculation. In 1990, the program improved the rent and enrollment model to consider crucial factors to decide the suitability of the land in the program and to ensure better environmental benefits, considering more precise goals, length, and sanctioned management practices [65,66].
CRP is also part of a mitigation effort to help curb the effects of climate change with significant government investment. Rental payments from fiscal years 2015 to 2017 averaged USD 1.7 billion, and land-cover change cost-sharing amounts range from USD 69 to USD 112 million per year [75] (p. 1); [76] (p. 20). Expanding on the original CRP vision to retire land from crop production, the Grassland CRP, started in 2015, is a working land program dedicated to conserving rangeland, pastureland, and other grasslands. This program aims to find the balance between conservation efforts and helping ranchers navigate cyclical and acute droughts. Grasslands, once a vast area in the U.S., are reduced to ~2% of what they were before European settlement [77] (p. 5). Currently, grasslands are mostly under soil conservation programs [5] (p. 24).
The CRP continues evolving and adapting to local needs, altering the incentive scheme to become more competitive and attractive to agriculturalists. Recent research shows promising uses of precision agriculture and precision conservation to find the optimal land fit for the highest environmental benefits and the lowest yield production losses [62]. Precision conservation allows for conservation strips interwoven in the crop fields, such as perennial prairie strips within crop fields, providing environmental services and improving crop yields through beneficial biotic connections or enhancing nutrient management [63] (p. 2). Furthermore, this approach aligns with the new global environmental goals and the U.S. climate change initiatives, including climate-smart agriculture. The future of CRP could benefit from increasing the land cap, improving the rental payments, and broadening the management practices within this conservation program.
3.2.2. Environmental Quality Incentives Program (EQIP)
The 1930s also brought the precursor of EQIP. In 1936, the Agricultural Conservation Program (ACP) introduced a federal cost-sharing program to implement soil conservation structures such as terraces to prevent soil erosion and improve agricultural practices. The ACP evolved to include a broader range of activities, targeting additional agri-environmental goals beyond soil erosion [78].
Relevant technologies followed, such as introducing new crop hybrid varieties that improved yields, inventing synthetic fibers, and constructing reclamation projects for irrigation. The ‘Green Revolution’, beginning in the early 1950s, led to a massive transformation to industrialized agriculture. During this period, pesticides and other agricultural chemical use increased ten-times, while the use of farm machinery rose by over half [58] (p. 17). This agricultural intensification increased yields but also caused environmental degradation, which, in part, led to several broad laws during the 1970s, including the Clean Air Act, the Clean Water Act, and the creation of the Environmental Protection Agency. This new agency established standards and mandated specific technology to address environmental problems [79].
In the 1980s, the rules to access agricultural subsidies shifted to include conservation compliance. This guaranteed the observance of environmental requirements, preventing the transfer of government funds to agriculturalists and landowners until they comply with the established practices to protect the environment [54,55]. As a result, agriculturalists had to adapt their practices for cross-compliance among federal agencies, integrating regulations and parameters established by farm legislation with other agencies. EQIP was created, as a crucial instrument, to offset the adoption costs of cleaner technologies and practices [78].
The current program is part of the Farm Bill’s Conservation Programs, allowing agriculturalists to implement conservation practices while their farms and ranches remain in production [55]. The program’s design tries to achieve environmental services and give agriculturalists financial and technical assistance locally through the USDA’s Natural Resources Conservation Service offices. It is a voluntary program with conservation practices according to the geographical location of the land.
EQIP was established with the 1996 Farm Bill, which fused the Water Quality Incentives Program, the GPCP, and the Colorado River Basin Salinity Program with the ACP [80]. In the early days, EQIP monies were used to fund CPI and, later, drop down nozzles. While more efficient than piped irrigation, these monies paradoxically also led to increased use in groundwater from the Ogallala. Although the first round of EQIP funding did not entirely meet environmental efficacy [81] (p. 40), the program evolved to enhance performance, maximizing environmental benefits per government dollar spent and expanding the reach according to agriculturalists’ changing needs.
Subsequent farm bills enacted provisions to try to meet the rising demand for EQIP monies. Although the funding increased with demand, quadrupling from 2002 to 2004, the backlog also continued to rise [82]. In 1998, 36% of the applications resulted in a contract, compared to only 14.8% by 2003 and 27% by 2020 [83] (p. 5); [55] (p. 2). Currently, the program designates ~50% of its funding to target sustainable practices for livestock [17,84]. These studies show unintended consequences diverging from EQIP conservation goals. A significant issue for voluntary programs like EQIP is aligning participants’ self-interest with communal environmental needs [85]. Understanding agriculturalists’ behaviors and decision-making processes is critical to creating sustainable dynamics between humans and the environment [50]. Additionally, recognizing and including local culture(s) in the policy-making processes increases the stakeholder involvement and sustainable land management practices [86].
3.2.3. Federal Crop Insurance, Disaster Relief, and the Livestock Forage Disaster Programs (LFP)
The idea of paying for private losses with public money was generally considered unacceptable by much of the public in the 19th century, a charitable activity unfitting for the government. Funds released to assist the population struck by a natural disaster were scarce and case-specific. The first allocation of federal disaster relief funds came in 1915 as grants or loans for individuals [87,88]. With the Great Depression, relief was seen as part of the government’s growing services for its citizens. During the Dust Bowl, disaster relief for ranchers increased as the situation became catastrophic. The government released drought relief funds in 1934 to provide loans for emergency feed and directly buy the starving cattle, which was used to feed distressed families [10]. By 1950, 128 U.S. Congressional authorizations were enacted, mainly with in-kind assistance, providing medical personnel, supplies, and transportation [87] (p. 141).
Natural disasters, especially drought and flood, are devastating for farmers. The inherently risky nature of agriculture and the aftermath of natural disasters, including food scarcity and price surges, led to the realization that government intervention was in the nation’s best interest [87,89]. The 1930s legislation, the Federal Crop Insurance Corporation of the Triple-A, “represent[ed] a decision by Congress to treat loss from natural disasters as a problem requiring governmental action, entailing the provision of some level of aid” [90] (p. 25). Such legislation was a type of social contract with agriculturalists [91]—an implicit agreement where politicians “have praised farmers for their willingness to produce bountifully and promised them, in return, that their prices and incomes would be protected” [52] (p. 5).
The Disaster Relief Act of 1950, and revised versions in 1970 and 1974, created the structure for what would become the USDA’s Farm Service Agency (FSA) Emergency Disaster Loan Program, mainly offering low-interest loans and grants to agriculturalists afflicted by natural disasters. Federal participation in disaster funds increased from 1% in 1953 to 70% by the mid-1970s [90] (p. 24). Agriculturalists welcomed this resource, and by the 1987–1994 period, 60% of U.S. farms received disaster payments, some more than once [87] (p. 143). Partial compensations for natural disasters continued from 1997 to 2008 with ad hoc programs, e.g., offsetting lost animals and feed, often called forage [92].
The 1997 Emergency Supplemental Appropriations Act created the ad hoc Livestock Indemnity Program, a precursor of LFP, to compensate producers for losses exceeding ‘normal’ loss in the face of a natural disaster [92]. The 2008 Farm Act instituted the modern LFP program, and the 2014 Farm Act replaced the Feed Indemnity Program, moving from an ad hoc to a permanent program [92]. Nevertheless, agriculture’s risky nature makes having an effective risk management strategy more challenging. Further, such disasters and risks are responsible for a significant proportion of farm households’ income variability [93].
The LFP is an emergency relief payment administered by the USDA’s FSA. The program protects livestock owners or growers against financial losses due to wildfire or drought. Ranchers can apply to this program if their grazed forage crops are in rangeland managed by a federal agency that endured a qualifying fire forcing the agency to prohibit grazing [18]. Ranchers, either owners or contract growers of eligible livestock, can also apply if their land of grazed forage crops is in counties registered under drought and during the grazing period [18].
The LFP uses information from the U.S. Drought Monitor to determine the location and duration of drought and calculate the payments tied to these droughts’ intensity and duration [18,94]. The agency publishes the map of eligible counties and the severity of the drought. The severity of drought includes five categories ranging from D0-Abnormally Dry to D4-Exceptional Drought, which determines the payment factor. For example, a county with four weeks of D4 drought is eligible for five monthly payments. Therefore, in rough terms, the total amount per animal will be the product of the monthly payment of the kind, type, and size of livestock times the payment factor based on the drought intensity. There is, however, a cap on the amount of assistance per applicant [18,92]. The LFP is a safety net that reduces ranchers’ inherent risks of natural disasters in agriculture [95] since it provides direct payments to cover a portion of the feed depending on the livestock’s kind, type, and weight range. The payment equals ~60% of the monthly feed cost per animal during drought.
The 2008 Farm Bill only covered losses through 30 September 2011 and the 2014 Farm Act authorized retroactive payments to help ranchers cover losses from 2011 to 2013; the FDA Economic Research Service agency estimated a 700% surge in funding compared to 2008–2011 altogether [96]. Based on these past needs, the recurrence of cyclical droughts, and predictions of increased drought frequency, severity, and duration due to climate change [97], these safety-net programs are crucial for the livelihoods of ranchers and farmers and the communities’ overall health. However, they have also indelibly impacted agricultural trajectories, as illustrated in our analysis of agricultural change in our tri-county/tri-state region of the SGPs (below).
3.3. Agricultural Policy and Technological Development Histories in the Tri-County/Tri-State Region
3.3.1. Agriculture (General)
Pre-Dust Bowl Period (1910–1920)
The agricultural policies discussed above significantly impacted our study area’s growth and LULCC trajectories. Before the Dust Bowl, the Homestead and Railway Acts, generally favorable rainy conditions, and promising results from the ‘Golden Age of American Agriculture’ motivated people to move to the tri-county/tri-state study area, one of the last (so-called) frontiers in the U.S. From 1910 to 1920, both UC and LAC’s population grew, as did the number of farms (see Figure 3A,B, Table 1). However, CC experienced a reduction both in population and number of farms during this period, consistent with what Worster [10] (p. 105) called “the great scramble out of privation and hardship, remoteness and invisibility” that sometimes followed the acquisition of land under misleading promotion.
The average size of farms expanded in all three counties, as the homestead amendments in 1909 allowed increases in the acreage allotted to 320 acres (~130 ha) with the Enlarged Homestead Act and again to 640 acres (~260 ha) in 1916 with the Stock-Raising Homestead Act (Figure 3C, Table 1). Further, it became evident that capitalized endeavors required larger farms to be profitable. At the time, tenancy was often believed to be the first step to ownership. This mobilization of Anglo merchants promoted the production of cattle and crops under this type of arrangement [98].
Food demands during World War I (1914–1918) created conditions to increase crop and cattle production in the area (see Figure 4, Figure 5 and Figure 6 and Table 2, Table 3 and Table 4). In particular, major commodity crops, such as wheat, sorghum, and corn, saw rises in hectares during this time. Wheat prices spiked due to increased demands in Europe and domestic urban growth [99]. With “wheat will win the war” [10] (p. 89) as a rallying cry, the pressure to produce more wheat and the staggering profits of the abnormal demand created a state of frenzy, not only among farmers but also non-farmers looking to cash into this lucrative market. The latter, known as ‘suitcase farmers’, consisted of a variety of people and corporations with little background in agriculture, such as preachers, college students, lawyers, speculators, or wheat-raising companies, often practicing absentee farming, locating themselves in a different county or state than their crops [100]. During this time, the Great Plains first earned the label “grain basket” or “breadbasket” of the U.S., providing food and fiber for a growing population [101,102,103]. The demand resulted in more land being introduced into farming in the SGPs, greatly facilitated by mechanization [10] (p. 89). This mechanization also reduced the agricultural labor required, leading some rural populations to drop [23].
The main commodity crops in our study area from 1910 to 1920 were corn, sorghum, hay, and wheat (Figure 4 and Figure 5 and Table 2). Additionally, all three counties reported smaller amounts of oats, rye, and barley (Table 3). In the 1910 census, hay accounted for the majority of the hectares dedicated to cropland in the study area, demonstrating the regional importance of livestock feed. By 1920, though, the main crop in CC was sorghum, while in both UC and LAC, corn and sorghum dominated. Overall, the hectares of main commodity crops increased in in all three counties from 1910 to 1920 as part of agricultural extensification (see Figure 5, Table 2). Both wheat and corn, in particular, saw substantial increases in each of the three counties during this period.
Nonetheless, the three counties exhibited diverse and distinct agricultural trajectories during this time. The majority of farmers were small landowners and family farmers, producing crops for both market and subsistence agriculture, largely influenced by regional preferences. Significant additional market crops in CC included sorghum for syrup, broom corn (Sorghum bicolor, also called milo, mostly grown to craft brooms), and cotton (Table 3). On the other hand, UC reported the highest hectares of “wild hay” (~1225 ha) and cropland dedicated to broom corn (~3020 ha) also surged. LAC agriculture was even more distinct; sugar beet production started in this county with ~49 ha in 1910, contributing to the sugar beet industry developing in Colorado. LAC was also the largest producer of Irish potatoes (~73 ha) and alfalfa (~4000 ha) in the study area, producing the lion’s share of these crops during this period.
The record-high crop prices ended after WWI. As a result, numerous farmers found themselves in debt, paying off the costs associated with the adoption of new agricultural technologies. Farmers, realizing the price drops, especially wheat prices, called for government assistance to improve the farming economy, which eventually came in the form of promoting cooperative marketing associations; price interventions and supply controls; and implementation of protective tariffs [104,105].
Acts like the Capper–Volstead Act in 1922, the Cooperative Marketing Act of 1926, and the Agricultural Marketing Act of 1929 sanctioned and promoted cooperative marketing associations. The latter established the Federal Farm Board, which offered cooperative (co-op) loans to control surpluses [104,106]. These acts were instituted to promote voluntary co-op marketing associations to sustain and stabilize the prices of agricultural goods [38].
Agricultural co-ops worked well for some products. However, they did not improve the grain commodity price swings, threatening the sector’s livelihood [104]. Pressures for price regulations came from organizations such as The U.S. Wheat Growers Association and the Oklahoma Wheat Growers Association [104,107]. Multiple efforts were made to pass legislation addressing price and supply controls during the 1920s, like the McNary–Haugen Bill, which sought to control domestic prices and implement a federal organization to buy the excess production for foreign trade. The bill aimed to control prices, maintain production, and help export surpluses. President Coolidge ultimately vetoed the bill on two different occasions, but it served as a base for President Roosevelt’s New Deal policies during the Great Depression [104,108]. Other measures emerged at this time. The Emergency Tariff of 1921, the Fordney–McCumber Tariff of 1922, and the Smoot–Hawley Tariff of 1929–1930 granted protection from foreign markets [107].
The agricultural sector was under strain; farm foreclosures were common in the 1920s [109,110], consistent with reduced ownership in CC and UC (Figure 3D, Table 1). In LAC, which had greater access to surface irrigation, fewer major commodity crops grew (Figure 4 and Figure 5, Table 2), and the county was, therefore, less dependent on national market fluxes; farm ownership increased during this period. Additionally, LAC had a productive coal mining industry and railroad access. LAC was also part of a sugar beet industry that used a byproduct of the sugar-refining process to feed cattle and lambs [98].
The Dust Bowl Period (1930–1940)
By 1930, CC’s population had increased to 5408 but fell again to near pre-Dust Bowl values (3654) over the decade (Figure 3A, Table 1). The initial increase in CC was likely influenced by the growth of towns centered around the Santa Fe railroad, a bumper wheat crop in 1931, and rampant oil speculation in the region [13]. Conversely, both UC and LAC witnessed population losses from 1920 to 1930. This trajectory continued from 1930 to 1940 (see Figure 3A, Table 1).
Policymakers grappled with plummeting crop prices in the 1930s, sparked, in part, by the Great Depression. Further, drought, over-plowing, and the Dust Bowl raised concerns about widespread soil erosion and efforts to reduce the degradation of the grasslands. The Dust Bowl ultimately led to actions to retire unproductive land from farming, culminating in the creation of The National Land Use Planning Committee in 1932 and the National Resource Board in 1934. These agencies categorized ~30 million ha of land as unproductive or submarginal. Subsequently, the government acquired some of this ‘unproductive’ land and partially used it to establish the National Grasslands [1,73,111,112].
During this tumultuous time, both total number of farms and farm ownership declined (Figure 3B,D, Table 1). Further, tenant farming fluctuated dramatically, influenced by the government land buyouts and farmers fleeing this devastated area and facing foreclosures [22,24] (Figure 3E, Table 1). However, average farm size increased, especially among so-called risk takers [23], who used the tragedy as an opportunity to acquire more land (Figure 3C, Table 1).
The 1930 Census showed that the land devoted to commodity crops dramatically increased in CC but decreased in UC and only slightly increased in LAC (Figure 5, Table 2). Corn, sorghum, hay, and wheat remained important commodity crops in the tri-county area. While CC witnessed a stunning spike in wheat, UC and LAC saw decreases. By the 1940 Census, though, decreases in wheat were reported in all three counties: CC by 66%, UC by 91%, and LAC by 61%. During this period, CC’s main crop was wheat, while UC continued to lead corn production in the study area and LAC focused on hay production (see Figure 5, Table 2). The SGP saw a crisis exacerbated by drought, soil erosion, and economic adversity; crop land plummeted by almost half (from ~172,000 to 84,000 ha) by the 1940 Census. When we compare the number of crops in metric tons, discernible losses during the Dust Bowl are also evident (Figure 4, Table 2), making the Dust Bowl a period of steep fluctuations.
Minor crops, such as oats, rye, and barely, followed different trajectories in the three counties. While CC saw an increase in rye production during the Dust Bowl period, it saw a decline in barley production. Conversely, LAC saw a rise in barley production but a decrease in rye and oats. Meanwhile, there was no production of oats, rye, and barely reported in UC (Table 3). By 1940, no sorghum or cotton production was reported in CC. Broom corn increased in 1930 by ~30%, but by 1940, it dropped 62%. In UC, wild hay continued to account for more than half (~57%) of production in the tri-county area, even though it dropped by ~20%. Yields of broom corn in UC decreased from 1930 to 1940. In LAC, the production of Irish potatoes virtually disappeared after 1930. On the other hand, hectares for sugar beets increased dramatically in 1930 and by a lesser extent in 1940 as the sugar beet industry consolidated in Colorado, providing beet pulp for feedlots [113] (Table 3). Protectionist measures and production controls also ensured price stability [114].
Post-Dust Bowl Period (1950–2017)
These three counties lost almost half their populations in the post-Dust Bowl decades (Figure 3A, Table 1). However, immediately following the Dust Bowl, the population in CC increased before experiencing a steady decline in the following decades. The increase was probably linked to attractive cheap land prices after the devastation [23]. Additionally, CC saw a boom in the oil and gas industry, adding to its land’s appeal [115]. However, the populations in both UC and LAC continued to decrease following the Dust Bowl era trend (Figure 3A, Table 1). In the subsequent decades, each county saw population losses until the late 1980s, when both UC and LC experienced small population gains (Figure 3A, Table 1). The change could be associated with the modernization that followed WWII, allowing less workforce per unit of agricultural output, migration from rural areas, and, in some cases, the halt of farming altogether [116]. CC continued its relentless population loss, particularly a 21% reduction in the 2007 Census compared to the previous one, in the middle of an intense drought, at some points, dryer than the Dust Bowl [117]. In contrast, a slight rebound in population happened in 1997 and 2007 in UC and LAC, but losses were reported again in all three counties by 2007.
These county trajectories follow the larger national trend seen with farm corporatization, with farm numbers declining while farm size increased [23], see also Figure 3B,C and Table 1. This corporatization is also a pull force for immigrants, igniting social transformation. Ownership in CC almost doubled from 1950 to 2017; in recent decades, there has been increased interest in the land for retirees, hunting, and agri- and eco-tourism [22,116] (Figure 3D, Table 1). Conversely, ownership dropped in UC (~30%) and in LAC (~21%), as well as the number of tenants in all counties of the study area (Figure 3D,E, Table 1).
The decades following the Dust Bowl showed signs of cropland recovery, but this was punctuated by another severe drought in the late 1950s [25]. For instance, according to the 1950 Census, sorghum and wheat were at historic highs in the tri-county area (Figure 5, Table 2). Additionally, the introduction of new crop varieties spurred by the Green Revolution, as well as the adoption of new irrigation technologies [57], resulted in increases in corn production, particularly in CC and UC. LAC, though, which relies primarily on surface- rather than groundwater irrigation, showed a less fruitful corn production trajectory during this time (Figure 4, Table 3).
Nonetheless, other externalities punctuated these increases. For instance, during the 1960s and early 1970s, low fuel prices increased reliance on fossil fuels in agriculture. However, the 1970s oil embargo caused higher fuel, fertilizer, and herbicide prices, resulting in a decrease in crop production by 1978 (e.g., crop metric tons decreased by 8% in CC, 11% in UC, and 43% in LAC in 1978 compared to 1969 (Figure 4, Table 2)) [118]. The oil embargoes also started the conversation about energy security in the U.S., which, along with environmental concerns over fossil fuel, prioritized policies for bioenergy crops as a fuel alternative [119]. By 2017, CC, with more access to groundwater, surpassed UC in corn production, though wheat remained the main commodity crop grown in the area.
Hay also saw an overall increasing trend in the period following the Dust Bowl (Figure 4, Table 2). However, some of the minor crops, such as oats, rye, and barley, reduced their area until they disappeared from the crops reported in this tri-county area; none of the counties reported production of these minor crops by the years 2017, 1978, and 1997, respectively. Broom corn, cotton, and wild hay also disappeared from production in the tri-county/tri-state area (Table 3).
3.3.2. Irrigation
Pre-Dust Bowl Period (1910–1920)
The irrigation projects in these three counties also followed different trajectories (Figure 5, Table 2). CC relied primarily on pumps and ditches. In 1910, CC had ~287 irrigated ha of farmland, which dropped to ~127 ha in 1920. In 1910, irrigated fields were supplied by 32 pumps (from streams and wells, usually the distinctive windmills, slender, wood, or metallic towers, rotating with the relentless CC’s wind supply); by 1920, only one well pump was reported. The number of ditches decreased, falling from 37 km in 1910 to 24 by 1920. Some wet seasons in the Panhandle resulted in good yields, and irrigation may not have been greatly needed [120].
UC, on the other hand, increased the amount of irrigated land from 1910 to 1920 (Figure 5, Table 2). These irrigated fields relied mainly on reservoirs and ditches, the majority of which were gravity-fed. In 1910, this irrigated land included ~200 km of ditches and 25 reservoirs. By 1920, the county ditches increased to ~300 km, while the number of reservoirs decreased to 11. Two irrigation pumps were registered in 1910, increasing to five by 1920.
LAC, benefiting from snow-capped mountain-fed surface water, also saw a rise in irrigated land by 55% from 1910 to 1920 (Figure 5, Table 2). In 1910, most of the irrigated land (99.6%) was gravity-fed by streams, with 270 km of ditches. Additionally, seven reservoirs provided irrigation for ~170 ha. By 1920, ditches increased to ~650 km. Likewise, the number of reservoirs rose to 21, irrigating ~173,650 ha.
The Dust Bowl Period (1930–1940)
Irrigated land fluctuated during the Dust Bowl in the tri-county area; by 1930 the amount of irrigated land reported from the previous census decreased by 27%. However, the trend was not uniform across the three counties. Irrigated land increased in CC by 960% in 1940 and in UC by 129%. Even with these increases, the counties did not regain the extents reported before this period (Figure 5, Table 2). LAC decreased its irrigated land by 1%, resulting in levels below those seen in the previous period. In the late 1930s, irrigation technology (such as using internal combustion engines) became more affordable, though still expensive enough to necessitate securing loans to adopt the technology. Also, a tipping point happened in farmers’ mentality who moved from using irrigation only as a last resort in abnormally dry years to using it day and night, even on Sundays, a traditional ‘day of rest’, to secure yields; it was “rain when you want it” [57] (p. 131). CC incorporated new irrigation sources, reporting four reservoirs in 1930 built with private capital (and from cooperatives and partnerships not with Reclamation Act money since Oklahoma did not accept their conditions at this point) and seven dams by 1940 (five storage and two diversion dams) to its four pumping plants and 18 km of main ditches. After experiencing the drought during the 1930s, Oklahoma and the Bureau of Reclamation started to work together toward potential projects.
UC relied heavily on reservoirs, going from three in 1930 to six by 1940 (which decreased from 11 reported in the previous period (in 1920)); however, these more modern reservoirs had greater capacity. By 1940, the county had 40 dams (34 diversion and 6 storage), three pumping plants, and two wells. Federal institutions investing in irrigation in the state included the Reclamation Bureau, the Corps of Engineers, and the Bureau of Indian Affairs.
LAC continued its dependency on ditches and reservoirs. Nevertheless, LAC also increased the number of pumping plants (9) and wells (8) used for irrigation and added 186 dams. As with UC, Colorado also received capital from the Reclamation Bureau, the Corps of Engineers, and the Bureau of Indian Affairs.
Post-Dust Bowl Period (1950–2017)
A noteworthy increase in irrigated land in CC (a staggering 593%) and UC (increasing by 266%) from 1959 to the 1969 censuses coincides with the last major Reclamation authorization during the 1960s (Figure 5, Table 2). From that point, the primary driver of irrigation was the introduction of CPI technologies, which later would often be financed through EQIP, which “turned the desert into a garden” [51,57] (p. 143). Post-WWII technology (including electrification of rural areas) made underground water available, and although this abundance of water reduced drought impacts, it also allowed farmers to turn to water-intensive crops (like corn), increasing their drought sensitivity [57,121]. The introduction of CPI coincides with the increase in corn production in the late 1960s in CC (Figure 5, Table 2). Corn production also benefited from policies like EQIP, which supported CPI growth, corn subsidies, and GMOs. To demonstrate the dramatic change this new technology brought, in 1950, CC accounted for the smallest share of irrigated land, accounting for 3% of the study area irrigation (UC 20% and LAC 77%). By 2017, CC held the majority, with 56% of the study area’s irrigated land within its borders (UC 21% and LAC 23%) (Figure 5, Table 2).
In contrast, irrigated land in LAC with less access to the Ogallala remained somewhat stable, decreasing by 3% from 1959 to 1969. Over the years, LAC has specialized in growing less water-intensive crops, such as wheat and hay, and increasing drought-resistant practices, limited chiefly to surface water availability [121]. In 1950, LAC reported ~11,690 ha of irrigated land; by 2017, this amounted to ~7010 ha (Figure 5, Table 2).
3.3.3. Animal Husbandry
Pre-Dust Bowl Period (1910–1920)
Sheep, cattle, and poultry dominated the livestock reported in our tri-county area; goats, swine, and horses (including donkeys in this last category) were also noticeable in smaller numbers (Figure 6, Table 4). Of the three counties, CC had the least livestock in the pre-Dust Bowl period. In 1910, CC’s livestock consisted of 77,887 head (11% of total production in our study area); 1920 saw an increase to 98,227 head (16% of total production), particularly in cattle, swine, and poultry (Figure 6, Table 4). Historically, CC was generally seen as a place to pass through with cattle herds as part of an open-grazing trail that not many ventured to settle [22], so CC was just starting to develop as a more permanent base for ranching.
While UC and LAC shared a Hispanic cultural tradition of sheep and goat raising, UC had a more mature stock-raising industry, with several success stories, e.g., Christian Otto, ‘the Sheep King’, a German shoemaker immigrant who became a prominent and progressive resident and businessperson in UC [122]. UC produced large numbers of sheep (a total of ~306,000 head reported in 1910 and 1920), swine (~14,100 head), and poultry (~141,900 birds) in 1910 and 1920 in the tri-state area. Additionally, UC accounted for roughly half (~46% or 30,393 head) of the horses in the area and led wool production with 52% (~186,500 kg) of the total volume by weight. Nevertheless, sheep production decreased dramatically in UC from 1910 to 1920 (Figure 6, Table 4), signaling a shift from sheep to cattle. Economic reasons explain how the change in earnings from crops and cattle surpassed those of sheep by 1905 [98] (p. 113). However, the mobilization of people also altered the demographics, and the industries shifted to serve new markets. The barbed wire and reduced common lands also made it harder to continue the traditional Spanish open-range grazing practices used by Hispanic sheep herders [98]. In UC, cattle numbers grew from ~59,000 in 1910 to ~123,400 in 1920 (Figure 6, Table 4).
The stock-raising industry was also important in LAC during this period. LAC’s mix of farm animals consisted of goats, sheep, horses, poultry, cattle, and swine production during the 1910–1920 period (Figure 6, Table 4). LAC raised a sizable amount of all farm animals, showing diversification in a wide variety of domesticated animals. Just as in CC, LAC also experienced a contraction in sheep production from 1910 to 1920 in the county (by 78%), while cattle doubled, and poultry almost tripled. Likewise, LAC produced 44% of the wool sheared during 1910–1920 in the study area.
The Dust Bowl Period (1930–1940)
Pastureland was not reported until the decennial agricultural census of 1930, when it was included as a separate classification of farmland. Dramatic fluctuations in the land devoted to pastureland occurred during the Dust Bowl; grasses were affected by drought and wind erosion, and programs from the Triple-A aimed to take land out of production (Figure 6, Table 4). On average, the area lost ~80% of pastureland from 1930 to 1940 (from ~1,703,900 to ~318,100 ha). However, the Dust Bowl period saw an upsurge in total sheep in all counties (CC 28%, UC 76%, and LAC 30% from 1930 to 1940). Conversely, there was a dwindling number of horses (CC 73%, UC 46%, and LAC, 45% from 1930 to 1940) because they consumed scarce grasses or feed that could have been used for cattle and, more importantly, due to the introduction of tractors and mechanical equipment replacing them from farm work [120] (Figure 6, Table 4). Also, swine production declined from 1930 to 1940 (CC 45%, UC 73%, and LAC 36%) as it had a close dependency on corn production. Other livestock displayed different county-specific trends.
From an individual county perspective, CC showed a distinct trajectory, with a rise then fall in livestock head, increasing from the previous period (1920) to 1930, except for swine and horses. After that, by 1940, all livestock decreased except for sheep, a sign of the Dust Bowl’s strong effects in this county. By the end of this period, CC reduced the share of cattle produced to 15% of the total cattle production in the study area with a concurrent reduction in total animal husbandry from 1930 to 1940 (Figure 6, Table 4).
Conversely, from 1920 to 1930, all livestock production declined in UC, except for sheep and poultry. UC lost ~20% of its livestock from 1920 to 1930, reducing the percentage of output to 44% of the total animal production in 1930 in the area. By 1940, the number of sheep, goats, and cattle had increased though (Figure 6, Table 4). UC had ~146,900 head of sheep by 1930 (the second-highest number reported, after ~290,840 head in 1910). Likewise, cattle increased from ~87,400 head in 1930 to ~105,500 by 1940. However, the county saw decreases in its overall share of livestock production in the tri-county area (Figure 6, Table 4).
During this same period, sheep production increased in LAC, a trend that continued through 1940. Conversely, goat head count fluctuated, showing a loss between 1920 and 1930 but an increase from 1930 to 1940. Cattle production also benefited from Colorado’s feed industry and the county’s hay and sorghum crops, increasing the headcount from 1920 to 1930 and again from 1930 to 1940 (in 1940, LAC counted 91,400 head, the peak of cattle production for the county in the censuses analyzed here) (Figure 6, Table 4).
Post-Dust Bowl Period (1950–2017)
Pastureland recovered and expanded in all three counties in 1950. The common trends in the area include a growing specialization in cattle production. In 1950, cattle in CC represented 44% (35,077 head) of its farm animals, 43% (104,554 head) in UC, and 55% (77,193 head) in LAC; by 2017, these numbers increased to 99.5% (121,216 head) in CC, 98.8% (78,954 head) in UC, and 69% (41,650 head) in LAC. This shift to cattle represents an overall move away from sheep and goats (Figure 6, Table 4), with sheep production virtually disappearing from the tri-county region by 2017. In 1950, for instance, sheep accounted for 0.2% (133 head) of CC farm animals, 7% (17,227 head) in UC, and 11% (15,699 head) in LAC. By 2017, no sheep were reported in CC, in UC represented 0.03% of total livestock (25 head), and in LAC only represented 0.2% (96 head) (Figure 6, Table 4). A similar trend occurred for swine (in 2017, CC reported 12, UC did not show production, and LAC 48 head), virtually disappearing multi-species livestock farming operations.
CC went from being the county with the least production of livestock, 17% (79,004 head) of the total livestock in 1950 in the tri-county area, to leading animal production, reporting 46% (121,808 head) of the farm animals raised by 2017. Indeed, from 1950 to 1997, CC’s cattle production increased (from ~35,000 head in 1950 to ~135,600 head in 1997); however, since 1997, cattle production in CC has, nonetheless, decreased, possibly due to high crop prices, especially for corn [123,124,125] (see Figure 6, Table 4). Additionally, drought has exacerbated this reduction since scarce grasses and water forced ranchers to downsize to avoid feed and water purchases and hauling costs. Declining cattle production from the 1990s follows trends observed by Sawalhah et al. [126], who suggested an inverse correlation between the number of calves and the increase in temperature due to climate change, which affects forage production.
UC showed a similar trend in cattle production from 1950 to 1997, followed by a drop through 2017. Most notably, there was a 42% drop from 2007 to 2017, as persistent drought (“the worst drought on record” [25] (p. 958)) forced herd downsizing. Nonetheless, cattle remained the dominant form of livestock production in UC (Figure 6, Table 4). In UC, in 2017, only a small number of sheep (25 head, far from the ~290,840 head raised in 1910 when the sheep industry was booming in UC), poultry (200), and horses (730), and no head counts on goats or swine were reported.
On the other hand, in 2017, LAC maintained a more diversified farm animal economy, reporting ~16,700 head of poultry, 1200 horses, 900 goats, 48 swine, and 41,600 head of cattle (Table 3). Today, LAC’s diverse farm landscape includes a small dairy industry focused on goat milk production and other niche markets, such as free-range eggs and sheep farming. Nonetheless, the total number of animals reported in the censuses has dwindled since the 1950s (~139,780 head) to less than half by 2017 (~60,600), concurrent with overall shifts in the farm-based economy.
4. Discussion and Conclusions
In the period reviewed here, agriculturalists shifted from county-specific and water-use trajectories, more diverse, even poly-cultural practices to more unified monoculture and cash crop operations. Governmental policies initially promoted the expansion of the agricultural frontier. Soil erosion, a harbinger of the ecological disaster to come during the Dust Bowl, led to calls for strong federal intervention to promote better practices in agriculture and conservation. The environmental disruptions during the Dust Bowl led to changes in how people looked at nature, and several behavioral changes were reflected, not only in farming practices but also in governmental policies. These changes included the widespread acceptance of using federal resources to protect food supplies and agriculturalists’ livelihoods. Dust Bowl-era policies transformed into a network of programs focused on agriculturalists’ risk reduction and trying to promote better practices, which also, somewhat contradictorily, included the promotion of groundwater irrigation. Likewise, farms transitioned from small family farms practicing subsistence and relying on dryland agriculture (using irrigation only as a complementary practice) to larger specialized farms, mining water for irrigation as a permanent source for crop production. Also, open-range practices began to subside due to fenced areas, limiting access to pasture and water sources, along with a slow replacement from sheep production to cattle.
Data from the agricultural census can be hard to compare due to this historically rapidly shifting frontier area (e.g., different entry points into statehood) and the historical evolution of the Agriculture Census protocols themselves. For instance, there are many changes in critical terms, the most notable example being the diverse definitions of “farm”, which includes nine changes throughout time, affecting the number of farms surveyed. Likewise, some items included in the censuses vary significantly. Hay, for example, was historically treated as a single commodity rather than separated by crop type, e.g., alfalfa, wild hay, and small grain. For this research, we collapsed specific crop classes into broader categories, wheat, corn, hay, cattle, etc., for ease of comparison.
Agricultural censuses are generally conducted every five years in different seasons, which may affect the number of animals, crops, and other agricultural outputs due to seasonality. Therefore, we used ag. census data every ~10 years from the same season. When the censuses reported crop amounts in units other than metric tons, we performed conversions using standard crop weights, for instance, with corn, wheat, or sorghum.
The area of the counties also fluctuated somewhat over time, as well. For example, UC was ~1.4 million ha in 1910 and decreased to ~1 million ha from 1930 and the following censuses, given some county-level political boundary reorganization in the region. However, these census data are the only source of agricultural data in the U.S. that provide comparable and consistent historical data [127]. The dataset was complemented with basic demographic information from the U.S. Census Bureau website and, overall, presents a regional picture of agricultural changes in the counties and region over time.
Our archival policy and agricultural census analysis illustrates 110 years of agricultural change in the Southern Great Plains. It shows that while communities in our tri-state/tri-county study area began with an impressive diversity of agricultural practices, key agricultural policy development, from the Dust Bowl to the present, has led to increasing uniformity in crop and livestock practices. Beginning with governmental policies, such as the Homestead Act, the legal framework to settle into frontier territories led to rapid population growth. Coupled with subsidies and technological developments, such as the plow, windmills, and irrigation, the study area increasingly supported conditions for agriculturalists to expand production. However, ecological disaster wrought by over-plowing and extreme drought showed the limitations of this unfettered growth and ushered in a lasting era of the farm welfare state.
Agricultural policies and related technological advances play an integral role in the development of agroecological systems. Such policies affect rural communities and livelihoods and their capacity for resilience and adaptation [50,128]. These policies shape land uses and can have unintended consequences, such as biodiversity loss, land-cover changes, and soil degradation [129].
The ecological disaster of the 1930s catalyzed the development of conservation efforts and the search for better agricultural practices, while ushering in a lasting era of farm welfare. The Dust Bowl is an unmistakable turning point in the history and evolution of this region’s agriculture. Of all the policies, CRP, EQIP, and LFP have had the largest impact in the standardization of agricultural practices in our study area. CRP and its precursors enabled many farmers to survive the Dust Bowl and to maintain long-term operations in the region. More recently, CRP operates as a “soft” retirement plan for many aging agriculturalists in the region [130]. It also often serves as a foil, having an inverse relationship with many high-dollar crops. In drought years, high-water-use crops like corn might come out of production in favor of CRP. The opposite is true in wetter years or when the price of corn rises above USD 2.50 a bushel—a price that many farmers cannot resist [51,130].
EQIP drove the rapid and significant growth of irrigation and, by default, corn production and broader LULCC in the region. While EQIP was intended as a conservation program, impacts can be contradictory. For instance, data from irrigators participating in EQIP in 1998, 2003, and 2008 on groundwater-irrigated corn farms on the High Plains show an overall increase in water use [131]. Small-scale studies show similar results: high-efficiency center pivot irrigation supported by EQIP designed to conserve water instead increased groundwater extraction [132]. What started out as a means to decrease a farmer’s agricultural vulnerability to drought has led to their increased dependence on a dwindling, unsustainable resource. Indeed, in the SGPs, many family farmers expressed deep concerns about groundwater depletion associated with increases in irrigation [51].
Precursors and policies related to LFP, combined with land economics and the proliferation of barbed wire fencing, encouraged cattle over other types of animal production in the region. However, as this analysis shows, the drought starting in the 2000s led to a marked decrease in stocking rates. Since LFP will pay for supplemental forage during extreme drought, ranchers appear to be less vulnerable than farmers to drought. However, the economics of corn and cattle means even when ranchers are reimbursed for supplemental hay, they often cannot find it. During dry years, such changes leave ranchers scrambling for hay. As corn entered the area through CPI installation via EQIP, cattle operations also started to change, shifting from a predominantly cow-calf operation to an increase in feedlot (yearling) operations, especially in UC.
New technologies have changed what was more of a locally sustainable system where farmers grew hay for local ranchers. Instead, such technologies and policies have led to the growth of the farmer/rancher who uses EQIP funds to pay for CPI to grow their own hay for their own cattle, thus disrupting traditional supply chains in the region. Further, smart phones and farming apps have expanded beyond regional geographies, allowing farmers to sell their crops live to the highest bidder.
Overall, we argue that there are lessons to be learned by looking to the land and water trajectories of the past. LULCC processes do not work in a vacuum, yet we often take a contained temporal snapshot of complex dynamics. Past policies can impact landscapes generations later. To understand the seeming irrationality of CPI, for instance, we need to understand the historical context in which policies emerge and develop. We argue that Land System Science studies can benefit from taking the long view. This work also suggests that taking the historical approach to land and water use can be a good exercise to revisit why policies were created, as well as their unintended consequences and potential areas for change. In the Southern Great Plains, specifically, understanding these trajectories is important, especially important in the face of climate change, as the Ogallala Aquifer levels continue to decrease. Past experiences can be valuable for informing present decisions in the face of climate change uncertainties [133]. For instance, the past shows an extremely diverse agricultural repertoire. What secrets might the past hold for thinking about future sustainable agriculture? For instance, research is just starting to illustrate what re-introducing sheep and goats to grasslands can do for practicing regenerative agriculture [134,135,136]. Further, rethinking agricultural diversity along with the promises of new technologies, like precision agriculture, bioengineering, and clean energies, can lead to more sustainable agricultural practices. Additionally, agritourism, as well as “green” subsidies and programs encouraging environmental protection and aimed at family farmers and ‘heritage’ agriculturalists, can work in tandem to create agroecological resilience.
Author Contributions
Conceptualization, J.M.V. and T.D.F.; methodology G.B.C.G. and J.M.V., analysis, G.B.C.G., J.M.V. and T.D.F.; writing—original draft preparation, G.B.C.G., J.M.V. and T.D.F.; visualization, G.B.C.G. and T.D.F.; supervision/project administration, J.M.V.; funding acquisition, J.M.V. and T.D.F. All authors have read and agreed to the published version of the manuscript.
Funding
This work was supported by the USDA National Institute of Food and Agriculture, Agricultural and Food Research Initiative Competitive Program, Climate and Land Use, grant #2018-68002-28109, building on previous work by the National Science Foundation (NSF) research grant (#CMMI-1266381: Vadjunec, Phillips, & Fagin). Any opinions, findings, conclusions, or recommendations expressed here are those of the authors and do not necessarily reflect the views of our funders.
Data Availability Statement
All data used in this paper were based on already available data. Current and historical US agricultural census data can be found here https://www.census.gov/data.html (accessed on 18 October 2023) and here https://www.census.gov/library.html (accessed on 18 October 2023). US Census data can be found here https://www.census.gov/data.html (accessed on 12 January 2022).
Acknowledgments
We are grateful to the study area residents for their time and willingness to share their experiences, opinions, and knowledge with us during fieldwork. We also thank the editor and three anonymous reviewers for their insightful comments.
Conflicts of Interest
The authors declare no conflicts of interest. The sponsors had no role in the design, execution, interpretation, or writing of the study.
References
- Fagin, T.D.; Wikle, T.A. Lands of meat and oil: Conservation, resource management, and America’s National Grasslands. FOCUS Geogr. 2012, 55, 41–47. [Google Scholar] [CrossRef]
- Tiscornia, G.; Jaurena, M.; Baethgen, W. Drivers, Process, and Consequences of Native Grassland Degradation: Insights from a Literature Review and a Survey in Río de la Plata Grasslands. Agronomy 2019, 9, 239. [Google Scholar] [CrossRef]
- Liu, K.; Shao, X. Grassland Ecological Management and Utilization for Sustainability. Agronomy 2024, 14, 149. [Google Scholar] [CrossRef]
- Lambin, E.F.; Meyfroidt, P. Global land use change, economic globalization, and the looming land scarcity. Proc. Natl. Acad. Sci. USA 2011, 108, 3465–3472. [Google Scholar] [CrossRef] [PubMed]
- Ramankutty, N.; Graumlich, L.; Achard, F.; Alves, D.; Chhabra, A.; DeFries, R.S.; Foley, J.A.; Geist, H.; Houghton, R.A.; Goldewijk, K.K.; et al. Global Land-Cover Change: Recent Progress, Remaining Challenges. In Land-Use and Land-Cover Change: Local Processes and Global Impacts; Lambin, E.F., Geist, H., Eds.; Springer: Berlin/Heidelberg, Germany, 2006; pp. 9–39. [Google Scholar]
- Houghton, R.A. The Worldwide Extent of Land-Use Change. BioScience 1994, 44, 305–313. [Google Scholar] [CrossRef]
- Turner, B. Local faces, global flows: The role of land use and land cover in global environmental change. Land Degrad. Dev. 1994, 5, 71–78. [Google Scholar] [CrossRef]
- Riebsame, W.E. Sustainability of the Great Plains in an uncertain climate. Great Plains Res. 1991, 1, 133–151. [Google Scholar]
- Vanwalleghem, T.; Gómez, J.A.; Infante Amate, J.; González de Molina, M.; Vanderlinden, K.; Guzmán, G.; Laguna, A.; Giráldez, J.V. Impact of historical land use and soil management change on soil erosion and agricultural sustainability during the Anthropocene. Anthropocene 2017, 17, 13–29. [Google Scholar] [CrossRef]
- Worster, D. Dust Bowl: The Southern Plains in the 1930s/Donald Worster, 25th ed.; Oxford University Press: New York, NY, USA, 2004. [Google Scholar]
- Kasperson, J.X.; Kasperson, R.E.; Turner II, B.L. Regions at Risk: Exploring Environmental Criticality. Environ. Sci. Policy Sustain. Dev. 1996, 38, 4–29. [Google Scholar] [CrossRef]
- Verburg, P.H.; Crossman, N.; Ellis, E.C.; Heinimann, A.; Hostert, P.; Mertz, O.; Nagendra, H.; Sikor, T.; Erb, K.-H.; Golubiewski, N. Land system science and sustainable development of the earth system: A global land project perspective. Anthropocene 2015, 12, 29–41. [Google Scholar] [CrossRef]
- Vadjunec, J.M.; Colston, N.M.; Fagin, T.D.; Boardman, A.L.; Birchler, B. Fostering resilience and adaptation to drought in the Southern High Plains: Using participatory methods for more robust citizen science. Sustainability 2022, 14, 1813. [Google Scholar] [CrossRef]
- Ellis, E.C.; Kaplan, J.O.; Fuller, D.Q.; Vavrus, S.; Klein Goldewijk, K.; Verburg, P.H. Used planet: A global history. Proc. Natl. Acad. Sci. USA 2013, 110, 7978–7985. [Google Scholar] [CrossRef] [PubMed]
- Goldewijk, K.K. Estimating global land use change over the past 300 years: The HYDE Database. Glob. Biogeochem. Cycles 2001, 15, 417–433. [Google Scholar] [CrossRef]
- Farm Service Agency. Conservation Reserve Program—Continuous Enrollment Period. Fact Sheet May 2022. Available online: https://www.fsa.usda.gov/Assets/USDA-FSA-Public/usdafiles/FactSheets/crp-continuous-enrollment-period-factsheet.pdf (accessed on 10 March 2023).
- Natural Resources Conservation Services. Environmental Quality Incentives Program. Available online: https://www.nrcs.usda.gov/wps/portal/nrcs/detail/national/programs/financial/eqip/?cid=stelprdb1044009 (accessed on 22 March 2023).
- Farm Service Agency. Livestock Forage Disaster Program, Fact Sheet April 2022. Available online: https://www.fsa.usda.gov/programs-and-services/disaster-assistance-program/livestock-forage/index (accessed on 10 August 2022).
- U.S. Census Bureau. Library: Publications. Available online: https://www2.census.gov/library/publications/ (accessed on 2 November 2021).
- U.S. Department of Agriculture. Census of Agriculture Historical Archive; U.S. Department of Agriculture: Washington, DC, USA, 2019. [Google Scholar]
- Vadjunec, J.M.; Frazier, A.E.; Kedron, P.; Fagin, T.; Zhao, Y. A Land Systems Science Framework for Bridging Land System Architecture and Landscape Ecology: A Case Study from the Southern High Plains. Land 2018, 7, 27. [Google Scholar] [CrossRef]
- Vadjunec, J.; Sheehan, R. Ranching and state school land in Cimarron County, Oklahoma. Great Plains Res. 2010, 20, 163–177. [Google Scholar]
- Vadjunec, J.M.; Boardman, A.L.; Fagin, T.D.; Larson, M.P.; Kedron, P.; Birchler, B. Footprints from the Dust Bowl: Using Historical Geographic Information Systems to Explore Land and Resource Access, Use, and Survivability in “No Man’s Land,” Cimarron County, Oklahoma. Ann. Am. Assoc. Geogr. 2021, 111, 1906–1930. [Google Scholar] [CrossRef]
- Fagin, T.D.; Vadjunec, J.M.; Colston, N.M.; Wenger, K.; Graham, A. Land tenure and landscape change: A comparison of public-private lands in the southern High Plains. Ecol. Process. 2016, 5, 12. [Google Scholar] [CrossRef]
- Colston, N.M.; Vadjunec, J.M.; Fagin, T. It is Always Dry Here: Examining Perceptions about Drought and Climate Change in the Southern High Plains. Environ. Commun. 2019, 13, 958–974. [Google Scholar] [CrossRef]
- Riebsame, W.E. The United States Great Plains. In The Earth as Transformed by Human Action: Global and Regional Changes in the Biosphere over the Past 300 Years; Cambridge University Press: Cambridge, UK, 1990; pp. 561–575. [Google Scholar]
- Brulle, R.J. Agency, Democracy, and Nature: The US Environmental Movement from a Critical Theory Perspective; MIT Press: Cambridge, MA, USA, 2000. [Google Scholar]
- Homestead Act of 1862. 1862. Available online: https://www.britannica.com/topic/Homestead-Act (accessed on 12 February 2022).
- Webb, W.P. The Great Plains; University of Nebraska Press: Lincoln, NE, USA, 2022; ISBN 9781496232601. [Google Scholar]
- Rasmussen, W.D. The Impact of Technological Change on American Agriculture, 1862–1962. J. Econ. Hist. 1962, 22, 578–591. [Google Scholar] [CrossRef]
- The Great Plains Committee. The Future of the Great Plains; US Government Printing Office: Washington, DC, USA, 1936. [Google Scholar]
- Libecap, G.D.; Hansen, Z.K. “Rain follows the plow” and dryfarming doctrine: The climate information problem and homestead failure in the Upper Great Plains, 1890–1925. J. Econ. Hist. 2002, 62, 86–120. [Google Scholar] [CrossRef]
- Opie, J. 100 Years of Climate Risk Assessment on the High Plains: Which Farm Paradigm Does Irrigation Serve? Agric. Hist. 1989, 63, 243–269. [Google Scholar]
- Gard, W. The Impact of the Cattle Trails. Southwest. Hist. Q. 1967, 71, 1–6. [Google Scholar]
- Bentley, H.L. Cattle Ranges of the Southwest: A History of the Exhaustion of the Pasturage and Suggestions for Its Restoration; US Government Printing Office: Washington, DC, USA, 1898; Volume 8. [Google Scholar]
- Act of July 2, 1862 (Morrill Act), Public Law 37-108, which established land grant colleges, 07/02/1862; Enrolled Acts and Resolutions of Congress, 1789-1996; Record Group 11; General Records of the United States Government; National. Available online: https://www.archives.gov/milestone-documents/morrill-act (accessed on 20 May 2022).
- Oklahoma State University. One Hundred Years of Oklahoma Extension. 2014. Available online: https://extension100.okstate.edu/ (accessed on 12 March 2023).
- Dimitri, C.; Effland, A.; Conklin, N.C. The 20th Century Transformation of US Agriculture and Farm Policy; U.S. Department of Agriculture: Washington, DC, USA, 2005. [Google Scholar]
- Cunfer, G. Scaling the Dust Bowl. In Placing History: How Maps, Spatial Data, and GIS Are Changing Historical Scholarship; Esri Press: Gaithersburg, MD, USA, 2008; pp. 95–121. [Google Scholar]
- U.S. Department of Agriculture. Yearbook of the United States Department of Agriculture 1934; U.S. Government Publishing Office: Washington, DC, USA, 1934; Volume 1934. [Google Scholar]
- Cochrane, W.W. The Development of American Agriculture: A Historical Analysis, 2nd ed.; University of Minnesota Press: Minneapolis, MN, USA, 1993. [Google Scholar]
- Hu, Q.; Torres-Alavez, J.A.; Van Den Broeke, M.S. Land-Cover Change and the “Dust Bowl” Drought in the U.S. Great Plains. J. Clim. 2018, 31, 4657–4667. [Google Scholar] [CrossRef]
- Opie, J. The Law of the Land: Two Hundred Years of American Farmland Policy/John Opie; University of Nebraska Press: Lincoln, NE, USA, 1987. [Google Scholar]
- Lee, J.A.; Gill, T.E. Multiple causes of wind erosion in the Dust Bowl. Aeolian Res. 2015, 19, 15–36. [Google Scholar] [CrossRef]
- Lockeretz, W. The Lessons of the Dust Bowl: Several decades before the current concern with environmental problems, dust storms ravaged the Great Plains, and the threat of more dust storms still hangs over us. Am. Sci. 1978, 66, 560–569. [Google Scholar]
- McLeman, R.A.; Dupre, J.; Berrang Ford, L.; Ford, J.; Gajewski, K.; Marchildon, G. What we learned from the Dust Bowl: Lessons in science, policy, and adaptation. Popul. Environ. 2014, 35, 417–440. [Google Scholar] [CrossRef] [PubMed]
- Saloutos, T. New Deal Agricultural Policy: An Evaluation. J. Am. Hist. 1974, 61, 394–416. [Google Scholar] [CrossRef]
- McLeman, R.; Mayo, D.; Strebeck, E.; Smit, B. Drought adaptation in rural eastern Oklahoma in the 1930s: Lessons for climate change adaptation research. Lessons for Climate Change Adaptation Research. Mitigation and Adaptation Strategies for Global Change 13; Springer: Berlin/Heidelberg, Germany, 2008; pp. 379–400. [Google Scholar] [CrossRef]
- Schechinger, A.W.; Cox, C. Is Federal Crop Insurance Policy Leading to Another Dust Bowl? Environmental Working Group: Washington, DC, USA, 2017. [Google Scholar]
- Lambin, E.F.; Geist, H.J. Land-Use and Land-Cover Change: Local Processes and Global Impacts; Springer Science & Business Media: Berlin/Heidelberg, Germany, 2008. [Google Scholar]
- Wenger, K.; Vadjunec, J.M.; Fagin, T. Groundwater Governance and the Growth of Center Pivot Irrigation in Cimarron County, OK and Union County, NM: Implications for Community Vulnerability to Drought. Water 2017, 9, 39. [Google Scholar] [CrossRef]
- Cochrane, W.W. Reforming Farm Policy: Toward a National Agenda, 1st ed.; Cochrane, W.W., Runge, C.F., Eds.; Iowa State University Press: Ames, IA, USA, 1992. [Google Scholar]
- Skogstad, G. Ideas, Paradigms and Institutions: Agricultural Exceptionalism in the European Union and the United States. Governance 1998, 11, 463–490. [Google Scholar] [CrossRef]
- Doering, O. Farming’s future. Forum Appl. Res. Public Policy 1999, 14, 42. [Google Scholar]
- Stubbs, M. Farm Bill Primer: Conservation Title; Congressional Research Service: Washington, DC, USA, 2022. [Google Scholar]
- Gray, L.C. Federal Purchase and Administration of Submarginal Land in the Great Plains. J. Farm Econ. 1939, 21, 123–131. [Google Scholar] [CrossRef]
- Opie, J.; Miller, C.; Lang Archer, K. Ogallala: Water for a Dry Land, 3rd ed.; Nebraska: Lincoln, NE, USA, 2018. [Google Scholar]
- Sheingate, A.D. The Rise of the Agricultural Welfare State Institutions and Interest Group Power in the United States, France, and Japan; Princeton University Press: Princeton, NJ, USA, 2001; Volume 82. [Google Scholar]
- Normile, M.A.; Effland, A.B.; Young, C.E. US and EU Farm Policy—How Similar? USDA, Economic Research Service: Washington, DC, USA, 2004; p. 14. [Google Scholar]
- Wilcox, W.W.; Cochrane, W.W.; Herdt, R.W. Economics of American Agriculture, 3rd ed.; Prentice-Hall: Englewood Cliffs, NJ, USA, 1974. [Google Scholar]
- Comptroller General of the United States. Progress in Meeting Important Objectives of the Great Plains Conservation Program; District of Columbia: Washington, DC, USA, 1973. [Google Scholar]
- Swinton, S.M. Precision conservation: Linking set-aside and working lands policy. Appl. Econ. Perspect. Policy 2022, 44, 1158–1167. [Google Scholar] [CrossRef]
- Hoppe, R.A.; Perry, J.E.; Banker, D.E. ERS Farm Typology for a Diverse Agricultural Sector; United States Department of Agriculture: Washington, DC, USA, 2000. [Google Scholar]
- Lambert, D.M.; Sullivan, P. Land retirement and working-land conservation structures: A look at farmers’ choices. Amber Waves Econ. Food Farming Nat. Resour. Rural. Am. 2006, 4, 22–27. [Google Scholar]
- Heimlich, R. Agricultural Resources and Environmental Indicators, 2003; United States Department of Agriculture: Washington, DC, USA, 2003. [Google Scholar]
- Hellerstein, D.M. The US Conservation Reserve Program: The evolution of an enrollment mechanism. Land Use Policy 2017, 63, 601–610. [Google Scholar] [CrossRef]
- Bigelow, D.; Claassen, R.; Hellerstein, D.; Breneman, V.; Williams, R.; You, C. The Fate of Land in Expiring Conservation Reserve Program Contracts, 2013–2016; United States Department of Agriculture: Washington, DC, USA, 2020. [Google Scholar]
- Dodson, C. Gauging Economic Impacts as CRP Contracts Expire. Agric. Outlook 1994, 211, 20–24. [Google Scholar]
- Wu, J. Slippage Effects of the Conservation Reserve Program. Am. J. Agric. Econ. 2000, 82, 979–992. [Google Scholar] [CrossRef]
- Fleming, D.A. Slippage effects of land-based policies: Evaluating the Conservation Reserve Program using satellite imagery. Pap. Reg. Sci. 2014, 93, S167–S178. [Google Scholar] [CrossRef]
- Leathers, N.; Harrington, L.M.B. Effectiveness of Conservation Reserve Programs and Land ‘Slippage’ in Southwestern Kansas. Prof. Geogr. 2000, 52, 83–93. [Google Scholar] [CrossRef]
- Roberts, M.J.; Bucholz, S. Slippage in the Conservation Reserve Program or Spurious Correlation? A Rejoinder. Am. J. Agric. Econ. 2006, 88, 512–514. [Google Scholar] [CrossRef]
- Ferris, J.; Siikamaki, J. Conservation Reserve Program and Wetland Reserve Program: Primary Land Retirement Programs for Promoting Farmland Conservation; Resources for the Future: Washington, DC, USA, 2009. [Google Scholar]
- Farm Service Agency. Conservation Reserve Program—Continuous Enrollment Period. Fact Sheet December 2019. Available online: https://www.fsa.usda.gov/Assets/USDA-FSA-Public/usdafiles/FactSheets/2019/crp_safe_initiative-fact_sheet.pdf (accessed on 18 January 2022).
- Pratt, B.; Wallander, S. Cover Practice Definitions and Incentives in the Conservation Reserve Program; U.S. Department of Agriculture: Washington, DC, USA, 2022. [Google Scholar]
- U.S. Department of Agriculture. The Conservation Reserve Program: A 35-Year History; U.S. Department of Agriculture: Washington, DC, USA, 2021. [Google Scholar]
- Noss, R.F.; Scott, J.M. Endangered Ecosystems of the United States: A Preliminary Assessment of Loss and Degradation; US Department of the Interior, National Biological Service: Washington, DC, USA, 1995; Volume 28. [Google Scholar]
- Claassen, R.; Cattaneo, A.; Johansson, R. Cost-effective design of agri-environmental payment programs: U.S. experience in theory and practice. Ecol. Econ. 2008, 65, 737–752. [Google Scholar] [CrossRef]
- Environmental Protection Agency. The Origins of EPA. Available online: https://www.epa.gov/history/origins-epa (accessed on 3 August 2022).
- U.S. Department of Agriculture. Economic Research Service. In Agricultural Resources and Environmental Indicators, 1996–1997; Agricultural Handbook No. 712; U.S. Department of Agriculture: Washington, DC, USA, 1998. [Google Scholar]
- Cain, Z.; Lovejoy, S. History and outlook for Farm Bill conservation programs. Choices 2004, 19, 37–42. [Google Scholar]
- Stubbs, M. Agricultural Conservation: A Guide to Programs; Congressional Research Service: Washington, DC, USA, 2020. [Google Scholar]
- Canada, C.; Zinn, J. Resources, Science, and Industry Division. In Environmental Quality Incentives Program (EQIP): Status and Issues; Congressional Research Service: Washington, DC, USA, 2005. [Google Scholar]
- U.S. Department of Agriculture, F.G. NRCS Financial Assistance Program Data. Available online: https://www.farmers.gov/data/financial-assistance-overview (accessed on 5 January 2022).
- Shortle, J.S.; Ribaudo, M.; Horan, R.D.; Blandford, D. Reforming Agricultural Nonpoint Pollution Policy in an Increasingly Budget-Constrained Environment. Environ. Sci. Technol. 2012, 46, 1316–1325. [Google Scholar] [CrossRef] [PubMed]
- Caldas, M.M.; Sanderson, M.R.; Mather, M.; Daniels, M.D.; Bergtold, J.S.; Aistrup, J.; Heier Stamm, J.L.; Haukos, D.; Douglas-Mankin, K.; Sheshukov, A.Y.; et al. Endogenizing culture in sustainability science research and policy. Proc. Natl. Acad. Sci. USA 2015, 112, 8157–8159. [Google Scholar] [CrossRef] [PubMed]
- Barnett, B.J. US Government Natural Disaster Assistance: Historical Analysis and a Proposal for the Future. Disasters 1999, 23, 139–155. [Google Scholar] [CrossRef] [PubMed]
- Barry, J.M. Rising Tide: The Great Mississippi Flood of 1927 and How It Changed America; Simon and Schuster: New York, NY, USA, 2007. [Google Scholar]
- Marlow, S. Disaster Programs: And the Changing Face of Agriculture in North Carolina; Rural Advancement Foundation International: Pittsboro, NC, USA, 2007. [Google Scholar]
- Clary, B.B. The Evolution and Structure of Natural Hazard Policies. Public Adm. Rev. 1985, 45, 20–28. [Google Scholar] [CrossRef]
- Paarlberg, R.L. The social contract between society and agriculture: The changing rules by which the contract is determined. In Proceedings of the Annual Meetings of the American Society of Agricultural Engineers, Chicago, IL, USA, 19 December 1990. [Google Scholar]
- MacLachlan, M.; Ramos, S.; Hungerford, A.; Edwards, S. Federal Natural Disaster Assistance Programs for Livestock Producers, 2008–2016; U.S. Department of Agriculture: Washington, DC, USA, 2018. [Google Scholar]
- Dismukes, R.; Durst, R. Whole-Farm Approaches to a Safety Net; U.S. Department of Agriculture: Washington, DC, USA, 2006. [Google Scholar]
- Stubbs, M. Agricultural Disaster Assistance; Congressional Research Service: Washington, DC, USA, 2022. [Google Scholar]
- Shields, D.A. Farm Safety Net Programs: Background and Issues; Congressional Research Service: Washington, DC, USA, 2015. [Google Scholar]
- Covey, T.; Kuhns, R. Livestock forage disaster program payments increase in 2014. In Amber Waves: The Economics of Food, Farming, Natural Resources, and Rural America; U.S. Department of Agriculture: Washington, DC, USA, 2015. [Google Scholar]
- Mirzabaev, A.; Stringer, L.; Benjaminsen, T.; Gonzalez, P.; Harris, R.; Jafari, M.; Stevens, N.; Tirado, C.; Zakieldeen, S. Cross-chapter paper 3: Deserts, semi-arid areas and desertification. Clim. Chang. 2022, 2195–2231. [Google Scholar] [CrossRef]
- Wallace, J.M. Livestock, Land, and Dollars: The Sheep Industry of Territorial New Mexico; University of New Mexico: Albuquerque, NM, USA, 2014. [Google Scholar]
- Effland, A.B. US farm policy: The first 200 years. Agric. Outlook 2000, 21–25. Available online: https://www.ers.usda.gov/media/fregl5ap/us-farm-policy_the-first-200-years.pdf?locale=en (accessed on 23 March 2022).
- Hewes, L. Early Suitcase Farming in the Central Great Plains. Agric. Hist. 1977, 51, 23–37. [Google Scholar]
- Napier, T.L. Soil conservation in era of change. Forum Appl. Res. Public Policy 1997, 12, 91–97. [Google Scholar]
- Sanderson, M.R.; Frey, R.S. From desert to breadbasket… to desert again? A metabolic rift in the High Plains Aquifer. J. Political Ecol. 2014, 21, 516–532. [Google Scholar] [CrossRef]
- Scanlon, B.R.; Faunt, C.C.; Longuevergne, L.; Reedy, R.C.; Alley, W.M.; McGuire, V.L.; McMahon, P.B. Groundwater depletion and sustainability of irrigation in the US High Plains and Central Valley. Proc. Natl. Acad. Sci. USA 2012, 109, 9320–9325. [Google Scholar] [CrossRef]
- Hoffman, E.; Libecap, G.D. Institutional Choice and the Development of US Agricultural Policies in the 1920s. J. Econ. Hist. 1991, 51, 397–411. [Google Scholar] [CrossRef]
- Rasmussen, W.D. Farmers, Cooperatives, and USDA: A History of Agricultural Cooperative Service; U.S. Department of Agriculture: Washington, DC, USA, 1991. [Google Scholar]
- Bowers, D.E.; Rasmussen, W.D.; Baker, G.L. History of Agricultural Price-Support and Adjustment Programs, 1933–1984; U.S. Department of Agriculture: Washington, DC, USA, 1984. [Google Scholar]
- Hayford, M.; Pasurka, C.A. The political economy of the Fordney-McCumber and Smoot-Hawley Tariff Acts. Explor. Econ. Hist. 1992, 29, 30–50. [Google Scholar] [CrossRef]
- McDonald, R.; Dunbar, R.G. The Initiation of the McNary-Haugen Movement in Montana and the Pacific Northwest. Pac. Northwest Q. 1980, 71, 63–71. [Google Scholar]
- Alston, L.J. Farm Foreclosure Moratorium Legislation: A Lesson from the Past. Am. Econ. Rev. 1984, 74, 445–457. [Google Scholar]
- Federico, G. Not Guilty? Agriculture in the 1920s and the Great Depression. J. Econ. Hist. 2005, 65, 949–976. [Google Scholar] [CrossRef]
- Lewis, M.E. The National Grasslands in the old Dust Bowl: A Long Term Evaluation of Agricultural Adjustment through Land Use Change. Ph.D. Thesis, The University of Oklahoma, Norman, OK, USA, 1988. [Google Scholar]
- U.S. Department of Agriculture, F.S. The National Grasslands Story. Available online: https://www.fs.usda.gov/grasslands/aboutus/index.shtml (accessed on 4 January 2023).
- Wagner, J.J.; Archibeque, S.L.; Feuz, D.M. The Modern Feedlot for Finishing Cattle. Annu. Rev. Anim. Biosci. 2014, 2, 535–554. [Google Scholar] [CrossRef] [PubMed]
- Warnken, P.F. The Location of Sugarbeet Production in the US; University of Missouri Columbia: Columbia, MO, USA, 1976. [Google Scholar]
- Totten, R.B. Developments in Texas and Oklahoma Panhandles in 19531. AAPG Bull. 1954, 38, 1132–1138. [Google Scholar] [CrossRef]
- Kandel, W.A.; Brown, D.L. Population Change and Rural Society, 1st ed.; Springer: Dordrecht, The Netherlands, 2006; Volume 16, pp. xix–467. [Google Scholar] [CrossRef]
- Freedman, A. 2012 Drought Worse Than Dust Bowl Era & Unpredictable. Clim. Cent. 2013. Available online: https://www.climatecentral.org/news/noaa-report-largely-exonerates-global-warming-as-cause-of-plains-drought-15868 (accessed on 27 August 2023).
- Miranowski, J. Energy consumption in US agriculture. Agric. A Prod. Consum. Energy 2005, 1, 68–111. [Google Scholar]
- La Torre Ugarte, D.D. The Economic Impacts of Bioenergy Crop Production on U.S. Agriculture; United States Department of Agriculture: Washington, DC, USA, 2000. [Google Scholar]
- Lowitt, R. The Oklahoma Panhandle 1907 to 1930: An American Outback. Agric. Hist. 2000, 74, 648–666. [Google Scholar] [CrossRef]
- Hornbeck, R.; Keskin, P. The Historically Evolving Impact of the Ogallala Aquifer: Agricultural Adaptation to Groundwater and Drought. Am. Econ. J. Appl. Econ. 2014, 6, 190–219. [Google Scholar] [CrossRef]
- Herzstein Memorial Museum. The Sheep King. 2023; Permanent Exhibition.
- Kenkel, P.L.; Bunt, H.R. The Impact of Biofuel Production on Crop Production in the Southern Plains. In Proceedings of the Biofuels, Food & Feed Tradeoffs, St. Louis, MO, USA, 12–13 April 2007. [Google Scholar]
- Miljkovic, D.; Shaik, S.; Braun, D. Impact of biofuel policies on livestock production in the United States. Journal of Policy Modeling 2012, 34, 817–831. [Google Scholar] [CrossRef]
- Sawalhah, M.N.; Holechek, J.L.; Cibils, A.F.; Geli, H.M.E.; Zaied, A. Rangeland Livestock Production in Relation to Climate and Vegetation Trends in New Mexico. Rangel. Ecol. Manag. 2019, 72, 832–845. [Google Scholar] [CrossRef]
- U.S. Department of Agriculture, N.A.S.S. About NASS: Agency Overview. Available online: https://www.nass.usda.gov/About_NASS/index.php#:~:text=To%20uphold%20our%20continuing%20commitment%2C%20NASS%20will%3A%201,data%20for%20every%20county%20in%20America.%20More%20items (accessed on 30 March 2023).
- Turner, B.; Clark, W.; Kates, R.; Richards, J.; Mathews, J.; Meyer, W. The Earth as Transformed by Human Action: Global Change and Regional Changes in the Biosphere over the Past 300 Years; Cambridge University Press: Cambridge, UK; Clark University: Worcester, MA, USA, 1990. [Google Scholar]
- Liu, J.; Dietz, T.; Carpenter, S.R.; Alberti, M.; Folke, C.; Moran, E.; Pell, A.N.; Deadman, P.; Kratz, T.; Lubchenco, J.; et al. Complexity of Coupled Human and Natural Systems. Science 2007, 317, 1513–1516. [Google Scholar] [CrossRef] [PubMed]
- Sheehan, R.; Vadjunec, J.M. Placing community through actor-network theory in Oklahoma’s ‘No Man’s Land’. Soc. Cult. Geogr. 2012, 13, 915–936. [Google Scholar] [CrossRef]
- Vadjunec, J.M. Unpublished Personal Fieldnotes. 2019. [Google Scholar]
- Wallander, S.; Hand, M.S. Measuring the impact of the environmental quality incentives program (EQIP) on irrigation efficiency and water conservation. In Proceedings of the Agricultural and Applied Economics Association’s 2011 AAEA & NAREA Joint Annual Meeting, Pittsburg, PA, USA, 24–26 July 2011. [Google Scholar]
- Pfeiffer, L.; Lin, C.Y.C. Does efficient irrigation technology lead to reduced groundwater extraction? Empirical evidence. J. Environ. Econ. Manag. 2014, 67, 189–208. [Google Scholar] [CrossRef]
- Porter, J.C. What was the Dust Bowl? Assessing contemporary popular knowledge. Popul. Environ. 2014, 35, 391–416. [Google Scholar] [CrossRef]
- Benthien, O.; Braun, M.; Riemann, J.C.; Stolter, C. Long-term effect of sheep and goat grazing on plant diversity in a semi-natural dry grassland habitat. Heliyon 2018, 4, e00556. [Google Scholar] [CrossRef]
- Weis, T.; Ellis, R.A. Animal Functionality and Interspecies Relations in Regenerative Agriculture. In Routledge Handbook of Sustainable and Regenerative Food Systems; Taylor & France Group: Abingdon, UK, 2020. [Google Scholar]
- Grandin, T. Grazing Cattle, Sheep, and Goats Are Important Parts of a Sustainable Agricultural Future. Animals 2022, 12, 2092. [Google Scholar] [CrossRef]
Figure 1.
The tri-county, tri-state study area in relation to the High Plains (Ogallala) Aquifer in the United States of America. Source: the authors.
Figure 1.
The tri-county, tri-state study area in relation to the High Plains (Ogallala) Aquifer in the United States of America. Source: the authors.

Figure 2.
Timeline showing national (policy and technology development) and local (study area) events impacting agriculture and milestones related to land and water use. Section (A) from 1776 to 1929 and (B) from 1930 to 2017. Emphasized here are Pre-Dust Bowl, Dust Bowl, and Post-Dust Bowl time periods, with the addition of settler history events and policies. Note: Arrows indicate general trend direction (increase/decrease).

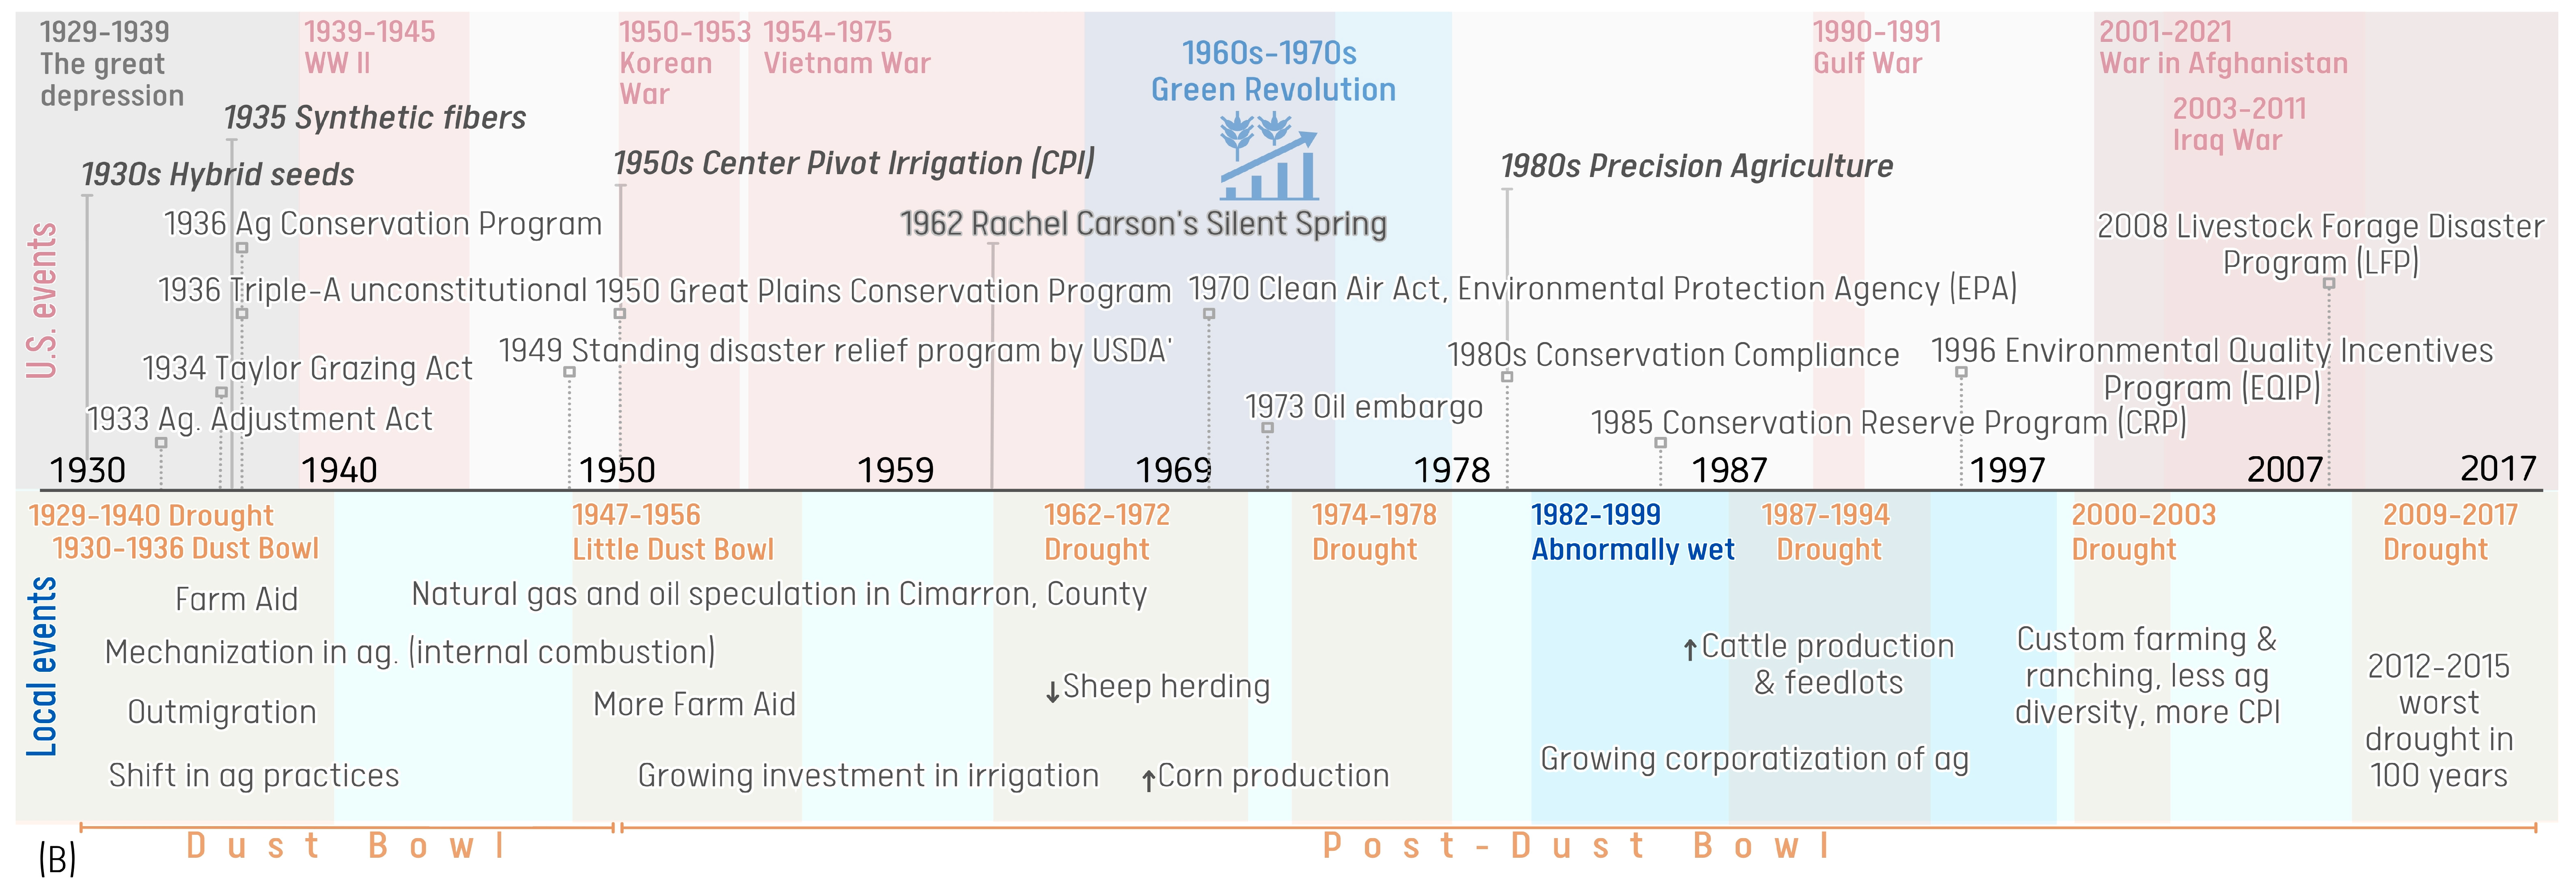
Figure 3.
Change in percentage of population and farm characteristics in the study area’s counties from 1910 to 2017.
Figure 3.
Change in percentage of population and farm characteristics in the study area’s counties from 1910 to 2017.

Figure 4.
Major crops in metric tons and the number of cattle by county before, during, and after the Dust Bowl. Note: The Dust Bowl period is shaded in light gray. Decimals were added in those cases where the amount reported is under one thousand.
Figure 4.
Major crops in metric tons and the number of cattle by county before, during, and after the Dust Bowl. Note: The Dust Bowl period is shaded in light gray. Decimals were added in those cases where the amount reported is under one thousand.

Figure 5.
Major crops, irrigated land, and pastureland in thousands of hectares by county before, during, and after the Dust Bowl. Note: The Dust Bowl period is shaded in light gray. Pastureland is shaded in light green with the scale on the right. Decimals were added in those cases where the amount reported is under one thousand.

Figure 6.
Farm animals in thousands head by county, before, during, and after the Dust Bowl. Note: The Dust Bowl period is shaded in light gray. Decimals were added in those cases where the amount reported is under one thousand.
Figure 6.
Farm animals in thousands head by county, before, during, and after the Dust Bowl. Note: The Dust Bowl period is shaded in light gray. Decimals were added in those cases where the amount reported is under one thousand.


Table 1.
Population and farm characteristics of Cimarron County, OK (CC); Union County, NM (UC); and Las Animas County, CO (LAC) from 1910 to 2017. Note: The Dust Bowl period is shaded in light gray.
Table 1.
Population and farm characteristics of Cimarron County, OK (CC); Union County, NM (UC); and Las Animas County, CO (LAC) from 1910 to 2017. Note: The Dust Bowl period is shaded in light gray.
| Year | Population | Number of Farms | Average Farm Size (Ha) | Number of Owners | Number of Tenants | ||||||||||
|---|---|---|---|---|---|---|---|---|---|---|---|---|---|---|---|
| CC | UC | LAC | CC | UC | LAC | CC | UC | LAC | CC | UC | LAC | CC | UC | LAC | |
| 1910 | 4553 | 11,404 | 33,643 | 1307 | 1923 | 954 | 91 | 171 | 189 | 1268 | 1891 | 741 | 33 | 22 | 202 |
| 1920 | 3436 | 16,680 | 38,975 | 767 | 2652 | 2286 | 427 | 384 | 231 | 653 | 1670 | 1568 | 109 | 344 | 358 |
| 1930 | 5408 | 11,036 | 36,008 | 887 | 1454 | 1758 | 487 | 542 | 444 | 219 | 522 | 862 | 308 | 512 | 494 |
| 1940 | 3054 | 9095 | 32,369 | 605 | 1035 | 1281 | 622 | 967 | 626 | 110 | 281 | 614 | 258 | 359 | 376 |
| 1950 | 4589 | 7372 | 25,902 | 616 | 730 | 926 | 724 | 1376 | 1145 | 121 | 249 | 467 | 158 | 139 | 131 |
| 1959 | 4496 | 6068 | 19,983 | 505 | 574 | 638 | 810 | 1708 | 1508 | 81 | 185 | 306 | 124 | 98 | 51 |
| 1969 | 4145 | 4925 | 15,744 | 600 | 463 | 489 | 733 | 1852 | 1910 | 182 | 149 | 221 | 129 | 88 | 57 |
| 1978 | 3648 | 4725 | 14,897 | 490 | 441 | 471 | 884 | 2092 | 1853 | 120 | 141 | 214 | 93 | 90 | 52 |
| 1987 | 3301 | 4124 | 13,765 | 458 | 438 | 481 | 889 | 2406 | 1809 | 137 | 176 | 250 | 95 | 83 | 56 |
| 1997 | 3148 | 4174 | 15,207 | 481 | 448 | 485 | 906 | 2012 | 1848 | 183 | 169 | 243 | 74 | 86 | 63 |
| 2007 | 2475 | 4549 | 15,507 | 557 | 380 | 585 | 759 | 2335 | 1507 | 336 | 170 | 372 | 58 | 67 | 29 |
| 2017 | 2296 | 4083 | 14,555 | 447 | 369 | 549 | 994 | 2070 | 1324 | 231 | 173 | 368 | 74 | 37 | 29 |
Table 2.
Main crops, cropland, and irrigation in Cimarron County, OK (CC); Union County, NM (UC); and Las Animas County, CO (LAC). Note: The Dust Bowl period is shaded in light gray.
Table 2.
Main crops, cropland, and irrigation in Cimarron County, OK (CC); Union County, NM (UC); and Las Animas County, CO (LAC). Note: The Dust Bowl period is shaded in light gray.
| Item | Co | Pre-Dust Bowl | Dust Bowl | Post-Dust Bowl | |||||||||
|---|---|---|---|---|---|---|---|---|---|---|---|---|---|
| 1910 | 1920 | 1930 | 1940 | 1950 | 1959 | 1969 | 1978 | 1987 | 1997 | 2007 | 2017 | ||
| Corn (Ha) | CC | 897 | 3021 | 9791 | 1919 | 1036 | 388 | 4411 | 3193 | 2574 | 9687 | 6550 | 9160 |
| UC | 1303 | 23,009 | 18,308 | 3819 | 2447 | 209 | 1689 | 2363 | 2356 | 7250 | 12,037 | 3760 | |
| LAC | 753 | 9351 | 9218 | 2529 | 1788 | 492 | 370 | 206 | 716 | 160 | 109 | 0 | |
| (ton) | CC | 354 | 4619 | 10,247 | 611 | 1116 | 2292 | 57,476 | 53,849 | 49,544 | 193,046 | 125,467 | 165,409 |
| UC | 728 | 35,126 | 21,089 | 1119 | 2626 | 2315 | 22,494 | 31,801 | 38,320 | 126,966 | 178,966 | 70,573 | |
| LAC | 675 | 9107 | 7501 | 1330 | 3072 | 6179 | 11,204 | 4438 | 8224 | 1319 | 785 | 0 | |
| Sorghum (Ha) | CC | 8411 | 27,335 | 16,325 | 23,848 | 40,265 | 33,296 | 49,442 | 52,786 | 32,418 | 33,366 | 14,569 | 29,657 |
| UC | 2778 | 17,701 | 19,153 | 14,408 | 20,385 | 12,805 | 11,589 | 7811 | 3396 | 1418 | 178 | 0 | |
| LAC | 63 | 9878 | 4470 | 2121 | 4794 | 2668 | 2202 | 701 | 240 | 0 | 567 | 0 | |
| (ton) | CC | 2454 | 67,664 | 25,728 | 21,604 | 59,662 | 51,424 | 127,497 | 107,360 | 78,083 | 72,634 | 43,848 | 129,072 |
| UC | 2067 | 49,265 | 44,935 | 23,233 | 39,687 | 27,545 | 32,070 | 16,739 | 14,018 | 4055 | 244 | 0 | |
| LAC | 72 | 23,430 | 10,676 | 2208 | 8611 | 4587 | 4707 | 2874 | 1802 | 0 | 160 | 0 | |
| Hay (Ha) | CC | 11,605 | 1359 | 1205 | 767 | 784 | 835 | 3766 | 3336 | 7993 | 5718 | 5267 | 5777 |
| UC | 7528 | 6155 | 4934 | 3589 | 3822 | 2550 | 3240 | 3566 | 8878 | 8762 | 2427 | 2660 | |
| LAC | 6757 | 4272 | 10,835 | 5503 | 9050 | 7985 | 8967 | 5940 | 7010 | 18,765 | 8806 | 6906 | |
| (ton) | CC | 14,601 | 4935 | 2746 | 1640 | 2421 | 4096 | 19,093 | 15,842 | 38,676 | 28,668 | 45,127 | 53,202 |
| UC | 17,096 | 24,031 | 12,961 | 7929 | 10,723 | 7162 | 17,777 | 13,999 | 56,667 | 52,722 | 9949 | 11,958 | |
| LAC | 31,918 | 46,446 | 36,519 | 17,150 | 29,662 | 29,557 | 37,937 | 22,248 | 41,613 | 100,658 | 43,284 | 29,394 | |
| Wheat (Ha) | CC | 1010 | 6092 | 71,185 | 24,470 | 98,481 | 56,659 | 29,868 | 43,998 | 39,908 | 47,574 | 54,272 | 39,315 |
| UC | 153 | 5704 | 4103 | 375 | 6323 | 985 | 2230 | 2799 | 5326 | 4626 | 5541 | 2307 | |
| LAC | 85 | 2991 | 2322 | 915 | 10,506 | 4375 | 2885 | 3418 | 4776 | 2043 | 2746 | 2749 | |
| (ton) | CC | 318 | 6603 | 61,211 | 12,057 | 86,703 | 72,216 | 39,863 | 46,802 | 75,331 | 105,502 | 143,641 | 81,308 |
| UC | 89 | 7504 | 2483 | 149 | 4394 | 1310 | 4020 | 5043 | 15,949 | 18,237 | 21,809 | 4307 | |
| LAC | 90 | 3110 | 1377 | 719 | 8665 | 4087 | 4237 | 3450 | 11,569 | 2494 | 5228 | 2765 | |
| Cropland (Ha) | CC | N/A | N/A | 127,684 | 142,355 | 179,432 | 171,050 | 183,071 | 179,398 | 146,495 | 183,839 | 167,305 | 162,954 |
| UC | N/A | N/A | 83,390 | 62,556 | 51,916 | 31,415 | 42,518 | 20,632 | 39,454 | 36,306 | 49,596 | 19,769 | |
| LAC | N/A | N/A | 52,512 | 44,745 | 80,454 | 29,541 | 33,728 | 24,365 | 33,067 | 31,120 | 44,317 | 30,585 | |
| Irrigated Land (Ha) | CC | 287 | 127 | 59 | 626 | 530 | 4903 | 33,988 | 38,600 | 18,955 | 27,899 | 18,418 | 16,980 |
| UC | 2556 | 2741 | 1022 | 2339 | 3018 | 3054 | 11,174 | 13,563 | 12,652 | 18,850 | 19,031 | 6234 | |
| LAC | 10,559 | 16,349 | 12,987 | 12,849 | 11,689 | 7821 | 7561 | 7122 | 13,122 | 9721 | 14,191 | 7012 | |
Table 3.
Acreage of other crops in Cimarron County, OK (CC); Union County, NM (UC); and Las Animas County, CO (LAC). Note: The Dust Bowl period is shaded in light gray.
Table 3.
Acreage of other crops in Cimarron County, OK (CC); Union County, NM (UC); and Las Animas County, CO (LAC). Note: The Dust Bowl period is shaded in light gray.
| Item | Co | Pre-Dust Bowl | Dust Bowl | Post-Dust Bowl | |||||||||
|---|---|---|---|---|---|---|---|---|---|---|---|---|---|
| 1910 | 1920 | 1930 | 1940 | 1950 | 1959 | 1969 | 1978 | 1987 | 1997 | 2007 | 2017 | ||
| Oats (Ha) | CC | 356 | 329 | 152 | 116 | 150 | 16 | 40 | 0 | 107 | 598 | 0 | 0 |
| UC | 174 | 1141 | 412 | 0 | 166 | 8 | 0 | 0 | 0 | 0 | 0 | 0 | |
| LAC | 868 | 1630 | 956 | 564 | 608 | 186 | 138 | 141 | 159 | 0 | 7 | 0 | |
| Rye (Ha) | CC | 38 | 59 | 73 | 132 | 372 | 622 | 0 | 0 | 0 | 0 | 0 | 0 |
| UC | 4 | 250 | 61 | 0 | 740 | 0 | 175 | 0 | 0 | 0 | 0 | 0 | |
| LAC | 4 | 178 | 123 | 59 | 217 | 399 | 89 | 0 | 0 | 0 | 0 | 0 | |
| Barley (Ha) | CC | 8 | 301 | 3681 | 1564 | 625 | 773 | 134 | 125 | 0 | 0 | 0 | 0 |
| UC | 1 | 223 | 367 | 0 | 443 | 42 | 0 | 0 | 0 | 0 | 0 | 0 | |
| LAC | 65 | 295 | 1216 | 771 | 3150 | 875 | 70 | 153 | 103 | 0 | 0 | 0 | |
| Sorghum Syrup (gal) | CC | 520 | 458 | 0 | 0 | 0 | 0 | 0 | 0 | 0 | 0 | 0 | 0 |
| UC | 0 | 3215 | 0 | 0 | 0 | 0 | 0 | 0 | 0 | 0 | 0 | 0 | |
| LAC | 0 | 0 | 225 | 0 | 0 | 0 | 0 | 0 | 0 | 0 | 0 | 0 | |
| Broom Corn (Ha) | CC | 3021 | 705 | 1104 | 585 | 2931 | 5424 | 0 | 0 | 0 | 0 | 0 | 0 |
| UC | 350 | 2161 | 2629 | 352 | 1802 | 1504 | 0 | 0 | 0 | 0 | 0 | 0 | |
| LAC | 0 | 119 | 431 | 93 | 448 | 281 | 0 | 0 | 0 | 0 | 0 | 0 | |
| Wild Hay (Ha) | CC | 1225 | 779 | 644 | 298 | 134 | 30 | 0 | 0 | 0 | 0 | 0 | 0 |
| UC | 1519 | 1867 | 1545 | 1564 | 1214 | 1019 | 0 | 0 | 1737 | 1307 | 655 | 0 | |
| LAC | 457 | 1172 | 685 | 720 | 2395 | 1434 | 2058 | 0 | 791 | 762 | 1595 | 0 | |
| Cotton (Ha) | CC | 3 | 79 | 0 | 0 | 0 | 0 | 94 | 0 | 0 | 0 | 0 | 570 |
| UC | 0 | 0 | 1 | 0 | 0 | 49 | 70 | 0 | 0 | 0 | 0 | 0 | |
| LAC | 0 | 0 | 0 | 0 | 0 | 0 | 0 | 0 | 0 | 0 | 0 | 0 | |
| Sugar Beets (Ha) | CC | 0 | 0 | 0 | 0 | 0 | 0 | 0 | 0 | 0 | 0 | 0 | 0 |
| UC | 0 | 0 | 0 | 0 | 0 | 0 | 0 | 0 | 0 | 0 | 0 | 0 | |
| LAC | 49 | 0 | 387 | 421 | 512 | 194 | 0 | 0 | 0 | 0 | 0 | 0 | |
| Irish Potatoes (Ha) | CC | 26 | 1 | 1 | 0 | 0 | 16 | 0 | 0 | 0 | 0 | 0 | 0 |
| UC | 64 | 251 | 15 | 0 | 0 | 0 | 0 | 0 | 0 | 0 | 0 | 0 | |
| LAC | 73 | 127 | 57 | 0 | 1 | 0 | 0 | 0 | 0 | 0 | 0 | 0 | |
Table 4.
Pastureland and farm animals in Cimarron County, OK (CC); Union County, NM (UC); and Las Animas County, CO (LAC). Note: The Dust Bowl period is shaded in light gray.
Table 4.
Pastureland and farm animals in Cimarron County, OK (CC); Union County, NM (UC); and Las Animas County, CO (LAC). Note: The Dust Bowl period is shaded in light gray.
| Item | Co | Pre-Dust Bowl | Dust Bowl | Post-Dust Bowl | |||||||||
|---|---|---|---|---|---|---|---|---|---|---|---|---|---|
| 1910 | 1920 | 1930 | 1940 | 1950 | 1959 | 1969 | 1978 | 1987 | 1997 | 2007 | 2017 | ||
| Pasture Land (Ha) | CC | N/A | N/A | 292,971 | 71,092 | 259,817 | 235,018 | 250,508 | 262,225 | 242,778 | 262,175 | 264,570 | 292,641 |
| UC | N/A | N/A | 692,575 | 144,672 | 939,338 | 937,977 | 757,766 | 896,679 | 1,021,969 | 866,348 | 850,228 | 746,058 | |
| LAC | N/A | N/A | 718,385 | 102,402 | 976,417 | 907,296 | 829,939 | 839,089 | 832,117 | 819,045 | 830,622 | 678,454 | |
| Sheep (head) | CC | 18,343 | 2298 | 4701 | 4256 | 89 | 299 | 4967 | 388 | 1518 | 192 | 78 | 0 |
| UC | 272,889 | 33,159 | 70,803 | 96,156 | 12,589 | 8746 | 1037 | 3495 | 3443 | 1004 | 170 | 25 | |
| LAC | 144,618 | 30,874 | 91,904 | 80,092 | 15,665 | 5489 | 1948 | 497 | 695 | 113 | 356 | 96 | |
| Goats (head) | CC | 124 | 19 | 96 | 60 | 0 | 6 | 4 | 22 | 3179 | 54 | 367 | 60 |
| UC | 6494 | 3739 | 1810 | 1972 | 50 | 76 | 8 | 0 | 329 | 175 | 141 | 0 | |
| LAC | 11,953 | 11,147 | 7265 | 8855 | 0 | 0 | 725 | 114 | 485 | 909 | 698 | 900 | |
| Cattle (head) | CC | 24,374 | 38,797 | 45,086 | 16,617 | 35,077 | 37,299 | 66,074 | 82,965 | 90,756 | 135,636 | 126,552 | 121,216 |
| UC | 59,354 | 123,446 | 87,400 | 105,559 | 104,554 | 93,745 | 125,344 | 143,599 | 163,173 | 170,998 | 135,884 | 78,954 | |
| LAC | 30,805 | 65,030 | 74,663 | 91,422 | 77,193 | 72,425 | 67,578 | 44,666 | 65,380 | 68,983 | 49,257 | 41,650 | |
| Swine (head) | CC | 2543 | 4080 | 3651 | 1990 | 1855 | 2288 | 1522 | 1418 | 3166 | 247 | 0 | 12 |
| UC | 1683 | 12,448 | 9655 | 2595 | 3328 | 1567 | 2403 | 2250 | 1265 | 1580 | 24 | 0 | |
| LAC | 1548 | 6125 | 4501 | 2876 | 3013 | 1705 | 950 | 528 | 282 | 39 | 77 | 48 | |
| Poultry (head) | CC | 27,676 | 44,714 | 104,561 | 37,151 | 41,037 | 11,407 | 4161 | 1768 | 638 | 0 | 151 | 191 |
| UC | 30,247 | 111,635 | 135,867 | 114,825 | 114,517 | 21,791 | 3368 | 1586 | 659 | 0 | 527 | 200 | |
| LAC | 25,044 | 68,734 | 129,378 | 44,264 | 39,924 | 15,780 | 3841 | 2784 | 1996 | 565 | 521 | 16,711 | |
| Equine (head) | CC | 4796 | 7478 | 4742 | 1263 | 902 | 578 | 702 | 690 | 646 | 622 | 543 | 329 |
| UC | 9286 | 21,107 | 11,944 | 6402 | 3273 | 2139 | 954 | 167 | 1219 | 1297 | 1117 | 730 | |
| LAC | 7346 | 15,569 | 13,063 | 7165 | 3949 | 2048 | 1505 | 1242 | 1352 | 1387 | 1868 | 1203 | |
| Wool (kg) | CC | 7807 | 5597 | 26,685 | 7078 | 351 | 1789 | 0 | 1574 | 2657 | 347 | 0 | 0 |
| UC | 102,008 | 84,457 | 224,191 | 169,693 | 52,456 | 26,213 | 0 | 5 | 9300 | 3083 | 374 | 0 | |
| LAC | 51,765 | 104,351 | 293,703 | 160,832 | 52,597 | 27,817 | 0 | 1258 | 2432 | 163 | 771 | 195 | |
Disclaimer/Publisher’s Note: The statements, opinions and data contained in all publications are solely those of the individual author(s) and contributor(s) and not of MDPI and/or the editor(s). MDPI and/or the editor(s) disclaim responsibility for any injury to people or property resulting from any ideas, methods, instructions or products referred to in the content. |
© 2024 by the authors. Licensee MDPI, Basel, Switzerland. This article is an open access article distributed under the terms and conditions of the Creative Commons Attribution (CC BY) license (https://creativecommons.org/licenses/by/4.0/).
Share and Cite
MDPI and ACS Style
Carrasco Galvan, G.B.; Vadjunec, J.M.; Fagin, T.D. Lessons from the Archives: Understanding Historical Agricultural Change in the Southern Great Plains. Land 2024, 13, 196. https://doi.org/10.3390/land13020196
AMA Style
Carrasco Galvan GB, Vadjunec JM, Fagin TD. Lessons from the Archives: Understanding Historical Agricultural Change in the Southern Great Plains. Land. 2024; 13(2):196. https://doi.org/10.3390/land13020196
Chicago/Turabian StyleCarrasco Galvan, Georgina Belem, Jacqueline M. Vadjunec, and Todd D. Fagin. 2024. "Lessons from the Archives: Understanding Historical Agricultural Change in the Southern Great Plains" Land 13, no. 2: 196. https://doi.org/10.3390/land13020196
Note that from the first issue of 2016, this journal uses article numbers instead of page numbers. See further details here.