Abstract
The maritime pine (Pinus pinaster Ait.) forest is an essential element of the Portuguese forest landscape due to its social, economic, and environmental importance. The sustainability of these forests in the Mediterranean region faces challenges due to recurrent forest fires and the absence of or delayed management. The species has a high capacity for regeneration, but the perpetuation of pine forests in sustainable conditions depends on adequate management to achieve high biomass production and assure fire resilience. This study aimed to analyse four management scenarios (C1 to C4) for the natural regeneration of maritime pine in six areas with stand ages ranging from 6 to 16 years and densities varying from 15,000 to circa 93,000 trees per ha. The same four scenarios were implemented in each of the six areas. The scenarios considered the evolution of forest growth according to different management prescriptions and were simulated using Modispinaster and PiroPinus models. Scenario C1 considered no intervention, with only the final cut. Scenario C2 considered a thinning schedule to maintain the stand within the 50–60% range of the Stand Density Index (SDI). Scenario C3 followed the area’s Forest Management Plan (PGF), which typically includes two or three thinning operations throughout the cycle. Scenario C4 was adapted from the MS1 silvicultural model of the National Institute for Nature Conservation and Forests—ICNF, which involves opening strips at earlier ages (3 and 6 years), with the selection of trees to remain in the wooded area carried out between 4 and 10 years of age and performing thinning whenever the Wilson Spacing Factor (FW) reaches 0.21. The final cutting age was assumed to be 45 years but could be lowered to 35 years in Scenario 3 if defined in the plan. Based on the indicators generated by the simulators, the results showed variations in the total volume of timber produced at the time of harvest depending on the silvicultural guidelines. Scenario C4 was the most effective in generating the highest individual tree volume at the end of the cycle and the total volume of timber collected throughout the cycle. The ability of the forest to resist fire was evaluated before and after the first treatment for density reduction. The treatments performed did not decrease the resistance to fire control.
1. Introduction
The Portuguese forest has always been an important element of the landscape and played a relevant role in the country’s social and economic development, supplying goods and services throughout its history. Particularly during the 15th-century maritime expansion and shipbuilding, there was a high demand for wood, leading to the implementation of protective measures. The Law of Trees of 1565 was one such measure, aiming to reforest communal and privately owned lands with pine, oak, and chestnut trees. Over time, activities like cooperage for the storage of port wine and fish, the reconstruction of Lisbon after the 1755 earthquake, and the production of railroad ties has contributed to the pressure on wood resources and the subsequent deforestation of the territory [1].
The maritime pine (Pinus pinaster Aiton) has held a prominent position for mast construction on two-masted ships since maritime expansion. Its resin was also used to cover the upper works (structures above the waterline and on the deck) [2].
The forest expansion between 1875 and 1938 was essentially driven by small private landowners motivated by the external demand for wood and resin. After this period, from 1938 onwards, the Forest Settlement Plan and other actions of the Portuguese state fostered the expansion of the forest (especially in the northern and central common lands), causing the pine forest area to increase from 210,000 ha in 1875 to 1054 million ha in 1995 [3].
Mainland Portugal has approximately 3.22 million ha of forest area, covering roughly 36% of the national territory. Maritime pine accounts for about 22% of the forest area, equivalent to around 713,000 ha. This represents a decrease of 85,000 ha compared to the data reported in 2005, when the species occupied 798,000 ha, primarily in mainland Portugal’s northern and central regions [4,5]. Maritime pine has typically been found in areas influenced by the Atlantic for at least 33,000 years, but it can be found throughout mainland regions to varying extents [6]. It is a heliophilous species, intolerant to shade, a pioneer, and quite hardy. Mature trees can reach heights of up to 25 m and have a diameter of 60 cm at 60–70 years of age [7,8]. Regarding the ideal edaphoclimatic conditions for its development, the species performs best at altitudes up to 400 m [9]. Maritime pine responds well to water and soil conditions, especially in humid and sub-humid areas [10], but is also highly drought-tolerant and adaptable to climate changes [11].
Maritime pine, being a pioneer species, has the characteristic of a remarkable natural regeneration ability through seeds. The natural regeneration of maritime pine can also occur after environmental disturbances, notably following forest fires, provided that a viable seed bank exists. In Portugal, frequent forest fires often result in vast areas of natural regeneration, which can eventually become advantageous compared to establishing plantations using seedlings. This is due to the reduced implementation costs, the greater adaptation of the plants to the site, and the possibility of the early commercial use of the wood [7]. As the natural regeneration of maritime pine offers advantages over plantation, the management of these areas should guide the stand towards forming a more sustainable forest. This would aim to achieve higher yields and lower resistance to wildfire control [12]. An increase in the yield of naturally regenerated forests cannot be attributed solely to their potential final volume since plantations can achieve higher values due to the use of genetically selected material, resulting in greater yields. Instead, the increase in yield is due to interventions that generate revenue through the removal of wood from the forest system during each thinning period. Additionally, the cost of implementation is much higher in plantations, making it necessary to generate more income to achieve viable profitability, which is not always guaranteed. Furthermore, the risk of failure in the development of the stand is lower in naturally regenerated forests as it occurs over a time interval (seed production), whereas planting occurs in a single moment [13]. The trend in the evolution of pure stands originating from natural regeneration is that, at some point, self-regulation through competition leads to mortality. Understanding the mechanisms of self-regulation and the evolution of dendrological parameters is essential in implementing the best management practices to reduce the fire intensity and achieve the maximum wood volumes [14]. Knowledge of the factors that influence the behaviour of the natural regeneration of maritime pine, especially in the context of climate change, is an asset to ensure the adoption of best practices and promote the sustainable development of the forest [15].
The relationships between variables determining the behaviour of a forest stand and its improvement should primarily occur through long-term studies, where climate and location data can substantially contribute to the development of predictive models for forest growth, consequently enhancing the prediction accuracy. This collaboration plays a crucial role in more effectively managing the forest and striving for sustainability. It allows for a more profound understanding of forest development and facilitates well-informed and responsible management strategies [16].
Silvicultural guidelines for this particular species have been mostly based on planted or seed-regenerated stands, which have lower densities than those found in areas regenerated after a fire. There is a lack of knowledge regarding the appropriate silvicultural options in these situations. The rePlant Project—Implementation of Collaborative Strategies for Integrated Forest and Fire Management—aimed to assess the forest management methods followed or recommended to determine the most suitable options for the management of the species under similar conditions. The project encompasses the evaluation of factors that can affect the three pillars of sustainability. The pursuit of forests with a higher wood yield, along with minimising the cost/benefit ratio and vulnerability to wildfires, are key elements in promoting the forest as a profitable business that can create employment opportunities and income in sparsely populated regions, thereby encouraging people to settle and work in rural areas. The effects of wildfires go beyond financial losses and can have environmental consequences such as soil degradation, carbon emissions, and a reduction in biodiversity, as well as social impacts on rural populations. This article provides details on the study and its findings. Forest management costs and economic viability are being investigated and will be presented in a sequential manuscript.
The specific objectives of this study are (a) to characterise real cases of study involving the management of post-fire regenerated stands; (b) to simulate stand evolution from the current age till harvest with four different management scenarios; and (c) to evaluate the results of management, in terms of the volume produced and the average size of the trees. As fire is a regular disturbance, the project also aims to assess whether the forest becomes less resistant to wildfire control after the first density regulation practice. The research hypotheses examined in this article are as follows: (H0) forest production in maritime pine stands originating from natural regeneration remains unaffected by varying management models, and (Ha) differences in production occur depending on the forest management model adopted, thereby suggesting that the choice between traditional and recommended approaches plays an important role in influencing the outcomes.
2. Materials and Methods
A preliminary assessment was performed to identify areas in the country with young maritime pine stands resulting from natural post-fire regeneration. Interventions had to be planned to be implemented shortly. The assessment helped to select seven areas of natural regeneration of maritime pine in the municipalities of Boticas and Vila Pouca de Aguiar in the northern region of Portugal. One of these areas, area 3, could not be included in the study as it was affected by a fire, which prevented data collection after the thinning operations. The locations of the remaining six areas are displayed in Figure 1. The data were collected between February 2022 and March 2023. The stands were between 6 and 16 years old and had not been previously treated. The areas were located in the upper Tâmega river valley, which had a temperate climate of Type Csb according to Köppen, with rainy winters and mild summers [17].
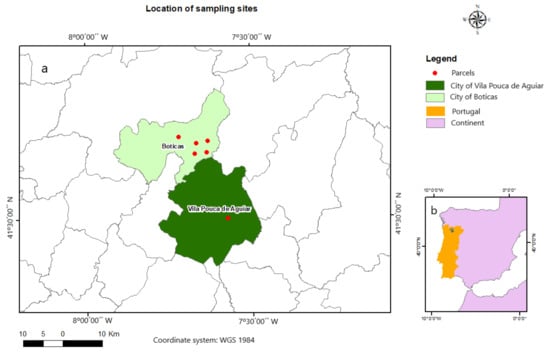
Figure 1.
Location details of the plots in the municipalities of Vila Pouca de Aguiar and Boticas (a). Geographical location of the study area in relation to mainland Portugal (b).
After selecting the areas, fieldwork was planned to allow characterisation before and after the intervention (Section 2.1) and the activities carried out in the field (Section 2.2). The pre-thinning characterisation aimed to assess dendrometric variables, the fuel load, and the fuel dispersion of the area before the intervention team performed forest thinning (opening of intermediate strips and thinning of vegetation strips). Similarly, a new characterisation was conducted using the same variables after the thinning operation. The information collected after data treatment was used as input data in the ModisPinaster simulator and as indicators of resistance to fire control (Section 2.3 and Section 2.4). It was assumed that the simulations for each site would consider the average values evaluated on the sample plots. Table 1 shows some edaphoclimatic characteristics of the study areas.

Table 1.
Characteristics of location, temperature, rainfall, humidity, and soil of each area.
2.1. Pre- and Post-Thinning Characterisation
The selected areas were characterised by installing four square plots at each site and collecting data inside the plots. The plot size was 4 m × 4 m for stands older than eight years and 2 m × 2 m for stands eight years or younger. The plots were delimited in areas that were most representative of the plot’s characteristics.
The data collected in each plot comprised the count of live and dead trees. In four representative trees, the following variables were measured: diameter at the base, diameter at breast height (DBH), total height, and height of the crown base. Additionally, the average height of the understory vegetation, the average occupancy of the understory as a percentage, the crown cover as a percentage through visual examination, and the thickness of the organic layer were recorded.
Information regarding specific forest characteristics was collected through measurements and observations and recorded in field reports. The information regarding the width of the strips (vegetation/forest lines) and intermediate strips (cleared lines with suppressed vegetation) to determine their dimensions was collected in the field and recorded in a specific report. Width measurements were taken at five different points using a measuring tape in at least six strips and six intermediate strips. This information allowed for the assessment of the average tree density per ha in the area after intervention.
2.2. Treatments Carried out in the Field
The interventions (forest treatments) made in the selected sites were agreed upon in advance with the management bodies and forestry contractors and aimed to reduce the tree density per ha and the fuel loading. The interventions were performed by mechanised or motor–manual operations. The mechanised operations were carried out to open intermediate strips in the studied areas, primarily using tracked machines with a shredder head, purpose-built forestry machines, or a tractor with a crushing implement, as illustrated (Figure 2).
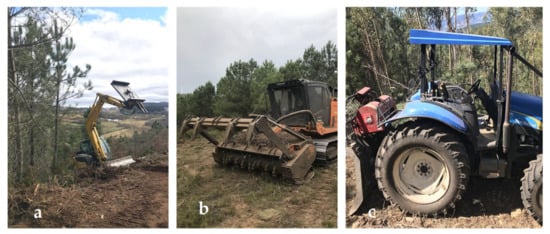
Figure 2.
Excavator with a shredder head (a), forest shredder (b), tractor with a crushing implement (c).
Among the motor–manual operations were the thinning/pruning operations with chainsaws and the thinning/reduction of vegetation with shrub cutters (Figure 3a,b). Figure 3c,d show the overall appearance of a forest before and after the intervention, respectively, in one of the studied sites. Table 2 summarises the forest management operations carried out in each studied area during the first thinning.
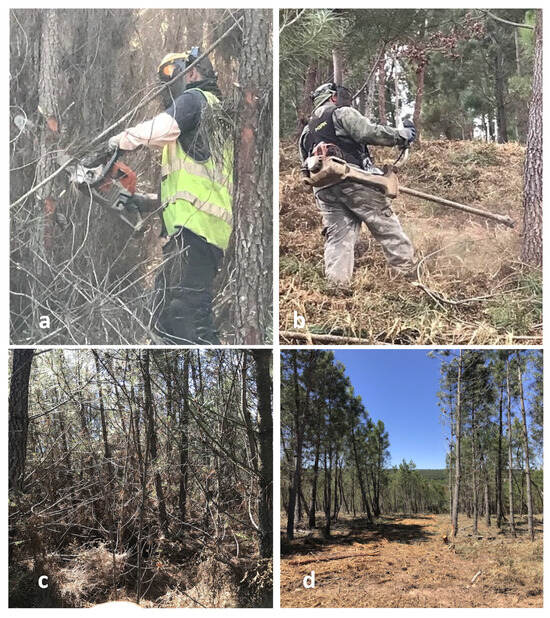
Figure 3.
Thinning/pruning with a chainsaw (a), thinning/reduction of vegetation with shrub cutter (b). Maritime pine stand before (c) and after treatment (d).
Table 2.
Maritime pine natural regeneration treatments and equipment applied at each stage. All interventions were performed in the same year.
2.3. Determination of Indicators of Wood Volume Productivity
The data collected in the field were used for growth projections and the assessment of wood volumes using the ModisPinaster simulator [14], as well as resistance to fire control (wildfires). The productivity factor was considered an important indicator as it forms forest sustainability’s economic and ecological basis. The input variables of ModisPinaster are the stand age (t, years), dominant height (hdom, m), number of trees per ha (N, trees/ha), basal area (G, m2/ha), dominant diameter (ddom, cm), and terrain aspect (°) and slope (°). The dominant height variable accounts for site-specific differences that may affect growth patterns. For simulation purposes, the data used are presented in Table 3.
Table 3.
Initial data entered into the Modispinaster simulator.
After data entry, forest growth was simulated for up to 45 years, defined as the final harvest age. The thinning prescriptions and final cut were based on Silviculture Model MS 1 indicated by the Forest Management Plan (PGF) of the study areas, corresponding to Model Pp2 of the Forest Planning Program (PROF) for Entre Douro and Minho [18]. For each area, four simulation scenarios were established. Scenarios 1 and 2 regulated the density based on the Stand Density Index (SDI), while Scenarios 3 and 4 regulated the density using the Spacing Factor of Wilson (FW), as recommended in the PROF. The scenarios are described in Table 4.
Table 4.
Scenarios for management of the natural regeneration of maritime pine.
Some areas showed characteristics that deviated from the standard of the Modispinaster simulator, particularly in the stands with ages below 12 years (areas 4, 6, and 7), dominant height values below 6 m, or dominant diameters below 8 cm. Therefore, the input data were adjusted to these minimums to enable the simulator to run, allowing the comparison between scenarios. In area 4, there was an unusually high density of trees. A volume equation for small-sized trees provided by the National Forest Inventory [19] was used to generate the initial volume estimates. Modispinaster estimated volumes from the age of 15. In Area 1, the equation provided by [5] was used to determine the characteristics before and after thinning.
The parameters generated in the simulations selected for presentation were the number of trees per ha, volume per ha (m3/ha), individual tree volume (m3), volume removed by thinning (m3/ha), and total volume (thinning + final harvest) (m3/ha).
2.4. Determination of Indicators of Resistance to Fire Control
The fireline intensity [20,21] was defined as the main indicator to determine the resistance to fire control in the areas. Additionally, for descriptive purposes, indicators such as the fire spread rate (m/min), flame length (m), and percentage of crown scorch were also determined for the stand before and after treatment. These descriptors were obtained by entering dendrometric and fuel data collected in the field into a modified version of PiroPinus, an Excel-based application [22]. For an area to be considered as having “low resistance to fire control”, the fireline intensity should be lower than 4000 kW/m, which is the threshold beyond which control becomes very difficult, if not impossible [21]. For simulation purposes, a fixed average wind speed of 20 km/h at 10 m in the open and fuel moisture content of 5.7% was considered.
3. Results
3.1. Stand Characteristics before and after Thinning
Figure 4, Figure 5, Figure 6 and Figure 7 present the characterisation of the stands before and after treatment in terms of the number of trees per ha (N, trees/ha), average total height (h, m), average diameter at breast height (DBH, cm), basal area (G, m2/ha), percentage of forest cover, and total and merchantable volumes (V, m3/ha).
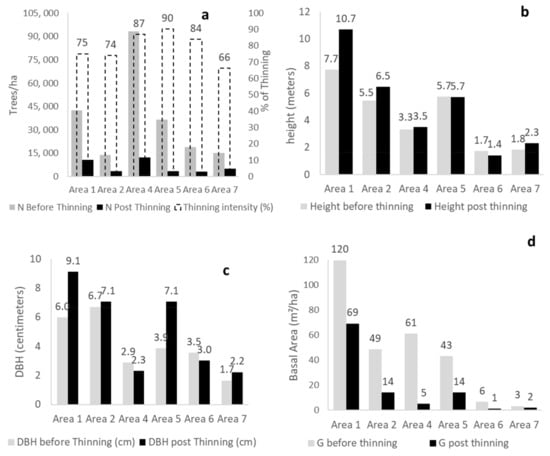
Figure 4.
Number of trees per ha in the sites before and after thinning and intensity of thinning (a); stand characteristics before and after thinning: average total height of trees (b); average diameter at breast height (DBH) (c); basal area (G) (d).
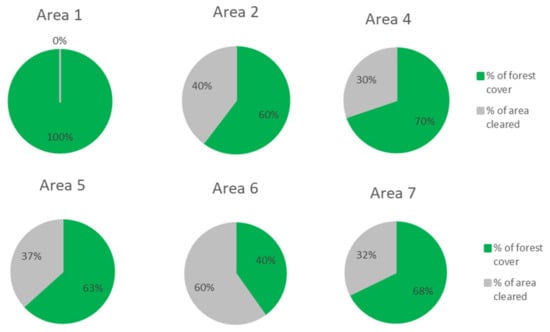
Figure 5.
Percentage of forest cover after the initial density reduction treatment.
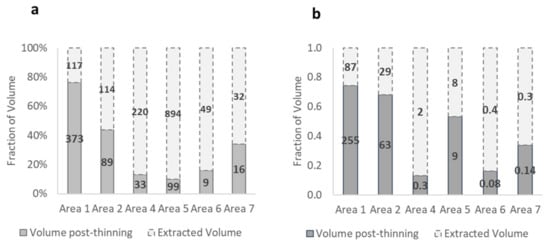
Figure 6.
Wood volume in m3/ha before and after intervention: total (a), merchantable (b).
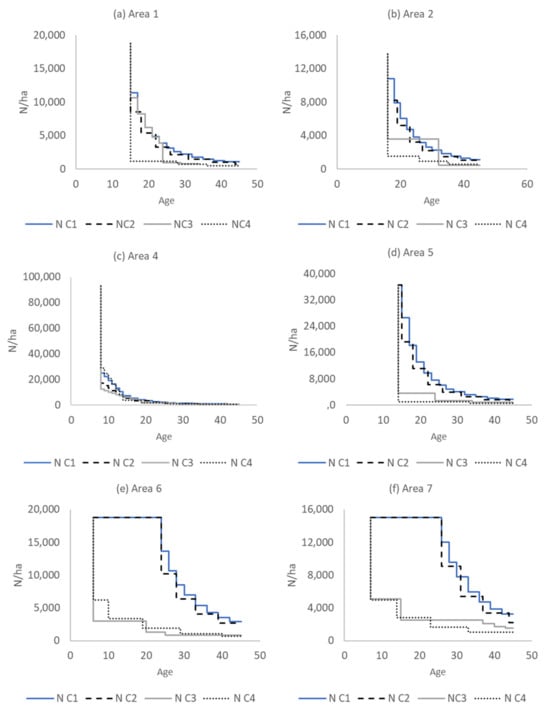
Figure 7.
Evolution of the number of trees per ha in areas 1, 2, 4, 5, 6, and 7 in four management scenarios.
The thinning intensity was always above 65%, reaching 90%. The interventions substantially reduced the basal area in each scenario, with area 4 showing the highest reduction. The selection for thinning of the remaining trees in the area was visually carried out by a worker who needed to ensure minimum hourly production. It was possible to observe an increase in total height after thinning, except for area 5, where similar values were obtained before and after thinning, and area 6, where there was a slight reduction in the average total height. The average diameters consistently increased in the areas after the intervention, indicating the effectiveness of the intervention in this indicator.
Initially, all the areas had forest cover throughout their extent, even though the tree density per ha varied. After the intervention, with the opening of vegetation-free intermediate strips, some internal parts were left without any forest cover, as depicted in Figure 3d. Figure 5 contains information regarding the fraction of the area that no longer had forest cover. Area 1 had full forest coverage as no fuel reduction strips were opened, but the tree density decreased. Area 6 had the highest percentage of tree-free space.
Figure 6a shows the total wood volume per ha found in each area before any intervention (sum of overlapping columns; for example, area 4 had a total volume of 253 cubic meters, of which 220 cubic meters were extracted through thinning, leaving 33 cubic meters remaining). The remaining volume after forest management and the harvested volume in Figure 6b provide a similar analysis but specifically for merchantable volumes per ha. Merchantable volume refers to the volume derived from trees with a diameter at breast height (DBH) greater than 7 cm.
Areas 4, 5, and 6 had proportionally greater volume removal, while areas 1 and 2 had the highest absolute extraction. The extracted volumes were consistently higher than the remaining volume (Figure 6a), except in area 1. Areas 2 and 5 had high extracted merchantable volumes due to their higher ages. In contrast, areas 4, 6, and 7 had low merchantable volumes because of the lower age of the regeneration, as shown in Figure 6b.
3.2. Evolution of Wood Volume Indicators According to the Applied Management Model
In Figure 7a, for area 1, scenario 4 shows a considerable decrease in trees per ha due to intense initial thinning. In contrast, the other scenarios show a more gradual reduction. For area 2, as shown in Figure 7b, scenario 4 has the most severe thinning, followed by scenario 3. On the other hand, scenario 2 has more uniform and frequent thinning throughout the cycle. Figure 7c indicates that area 4 had a high tree density per ha at the beginning of the study, and all scenarios in this area show a significant reduction in density. Figure 7d shows that in area 5, scenario 1 has a decrease in density due to mortality, and the wood is not utilised, remaining in the field. However, in scenarios 2, 3, and 4, effective thinning operations were performed. By examining Figure 7e, it is noticeable that intense thinning operations occurred in all scenarios in area 6. The trend in the evolution of the number of trees per ha throughout the cycle, as shown in Figure 7f for area 7, coincides with the pattern observed in area 6.
Figure 8a shows the change in forest volume over time in area 1. According to this area’s Forest Management Plan (PGF), scenario 3 concludes at 35 years. Scenario 1 had the highest volume in this area but did not involve thinning practices. In area 2 (Figure 8b), scenario 3 had the lowest final volume, while scenario 4 had the highest, but with values and behaviour similar to scenarios 1 and 2. Area 4 (Figure 8c) experienced a significant decrease in volume at the beginning of the cycle due to the high tree density and competition. In area 5 (Figure 8d), scenario 2 had the lowest volume per ha at the end of the cycle. The volume evolution patterns during the cycle in area 6 (Figure 8e) showed distinct behaviours. Scenario 3, despite starting with a relatively lower volume than other scenarios, surpassed the other scenarios. In area 7 (Figure 8f), a similar pattern of volume evolution to that in area 6 was observed. Scenarios 3 and 4 had similar volumes at the end of the cycle, although scenario 3 had higher volumes for most of the curve.
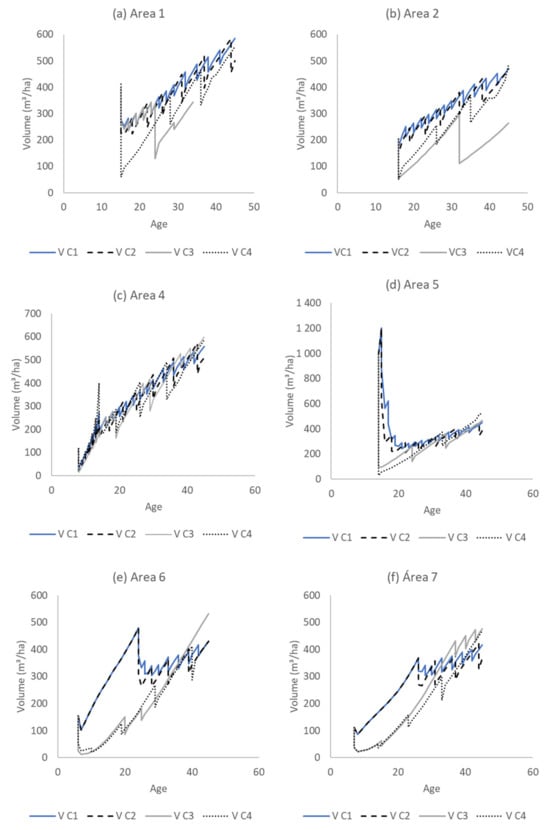
Figure 8.
Evolution of volume per ha in areas 1, 2, 4, 5, 6, and 7 in four management scenarios.
Figure 9a shows that scenario 4 has the highest individual volume in area 1 throughout the cycle. This suggests that, in this scenario, the trees have the highest commercial value. Similarly, scenario 4 exhibits the highest final individual volumes in area 2 (as shown in Figure 9b). In area 4 (as depicted in Figure 9c), scenario 4 again has the highest final individual volume. By contrast, scenario 1 has the lowest individual volume, which is expected in a scenario with higher competition between trees. In Figure 9d, for area 5, scenario 4 has the highest individual tree volume. Conversely, scenario 1, due to increased competition and the absence of thinning, has the lowest individual tree volume during the cycle and at the end (as shown in Figure 9e). Finally, in Figure 9f, for area 7, scenario 4 displays the highest individual volumes at the end of the cycle, followed by scenario 3.
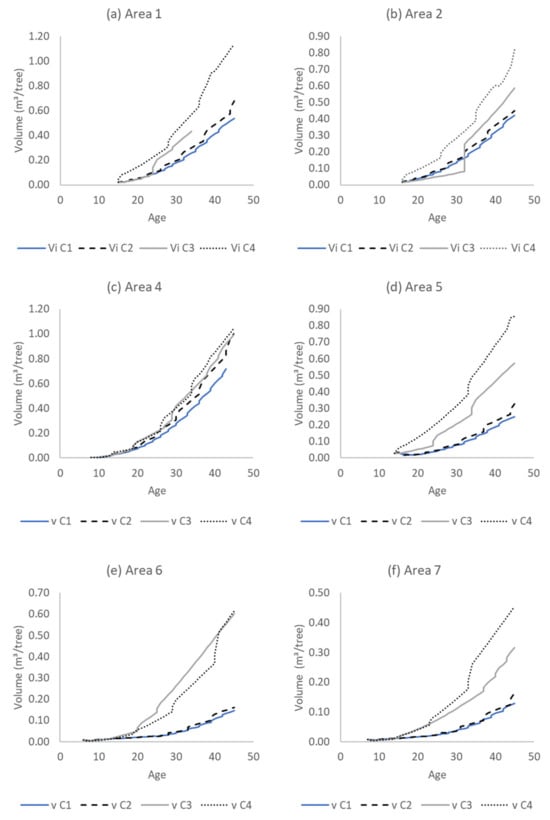
Figure 9.
Evolution of individual tree volume in areas 1, 2, 4, 5, 6, and 7 in four management scenarios.
Figure 10 represents the volumes generated at each thinning. In area 1 (Figure 10a), scenario 3 shows two thinning operations with high volumes generated, whereas scenario 2 shows a more evenly distributed distribution. In area 2 (Figure 10b), scenarios 3 and 4 have fewer thinning operations but with larger volumes. Scenario 3 exhibits more evenly distributed thinning throughout the cycle. In Figure 10c, for area 4, the high volume during the first thinning at eight years is due to the reduction of a large number of existing trees (about 93,000 trees/ha before thinning, Table 2).
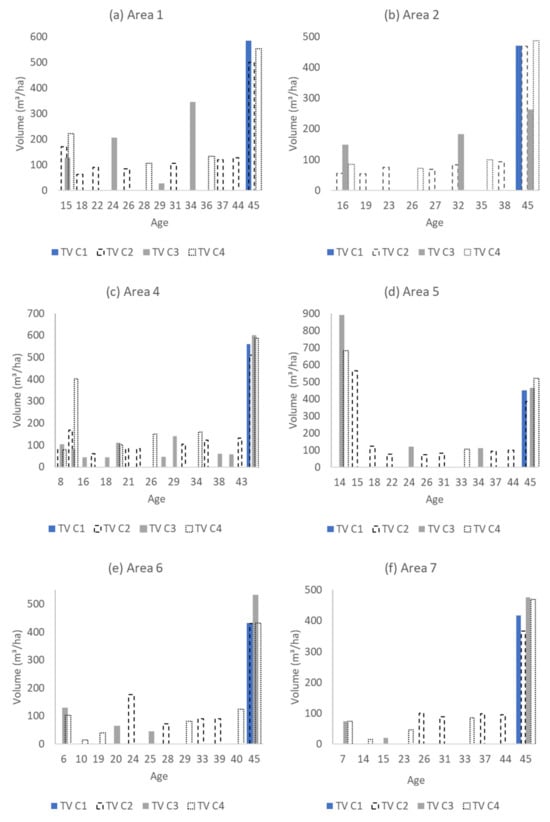
Figure 10.
Thinning volume (TV) removed (wood production) in areas 1, 2, 4, 5, 6, and 7 in four management scenarios.
Figure 10d indicates a considerable volume removed by thinning in area 5 at the beginning of the cycle, with scenario 3 standing out. Periodic thinning can also be observed in scenarios 2 and 3, with less frequency in scenario 4. The volume extracted from area 6 at the final harvest is considerably higher than any periodic thinning during the cycle, with scenario 3 again standing out with the highest wood volume at the final harvest (Figure 10e). In Figure 10f, area 7 has a consistent pattern of lower thinned volumes throughout the cycle during periodic interventions. This is because the stand is of a low age, and the previous thinning operations have ensured more even forest growth.
In Figure 11a, area 1 shows that scenario 2 has the highest wood volume throughout the cycle. However, it is worth noting that scenario 3 had its final content anticipated by approximately ten years, according to the Forest Management Plan (PGF).
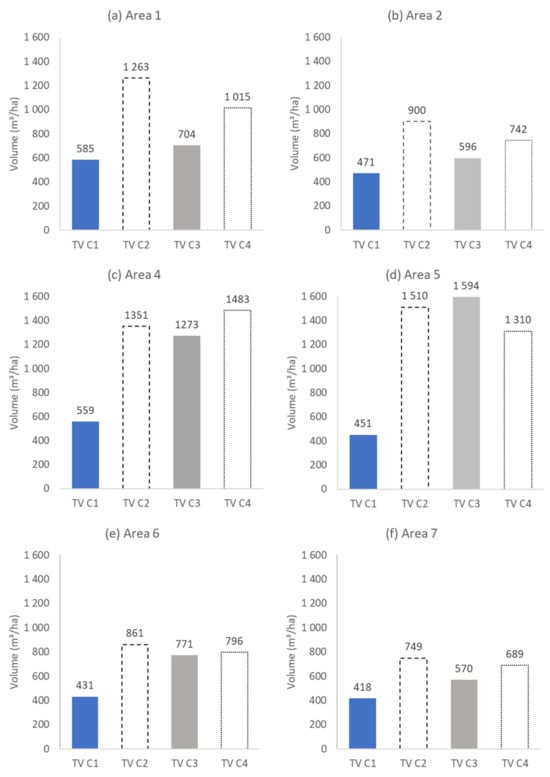
Figure 11.
Total volume per ha produced in the cycle in areas 1, 2, 4, 5, 6, and 7 in four management scenarios by thinning and final cutting volume (TV).
In area 2, scenario 2 also has the highest volume of wood extracted during the cycle, as seen in Figure 11b. On the other hand, scenario 3 has the lowest wood volume extraction. In area 4, scenario 4 stands out as having the highest volume of wood extracted throughout the cycle, while scenarios 2 and 3 have similar volumes. However, scenario 1 is represented solely by the final harvest volume regarding wood extraction, as illustrated in Figure 11c. In area 5, contrary to what has been observed so far, scenario 4 did not have the highest volume in the forest cycle and presented the lowest volume among the scenarios that included thinning operations. The positive highlight was scenario 3, which was the one presented in the Forest Management Plan (PGF) for area 5, according to Figure 11d. In area 6, despite scenario 3 having the highest final volume, scenario 2 stands out as the one with the highest volume throughout the cycle. This is because the sum of the volumes generated in the thinning and the volume generated in the final harvest placed scenario 2 in this position, as seen in Figure 11e. Finally, in area 7, the highest combined volume from thinning and final harvest occurs in scenario 2, as illustrated in Figure 11f.
3.3. Indicators of Fire Control Resistance in Natural Regeneration after Fire
Figure 12 shows the fire control resistance indicators before and after the intervention in six areas with natural regeneration. There was a tendency for a reduction in fireline intensity after treatment (Figure 12a), an expectation that follows from fuel removal. However, in area 4, there was an increase in the predicted fireline intensity. A decrease in the fire spread rate was observed after treatment in all scenarios (Figure 12b). The largest reductions for lower rates occurred in areas 6 and 7, while the smallest reduction was observed in area 1, where the stand structure underwent fewer modifications (without opening intermediate strips).
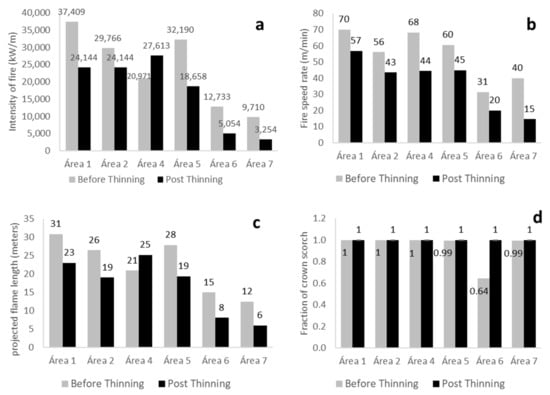
Figure 12.
Fireline intensity in kW/m, before and after treatment (a). Fire spread rate before and after treatment (b). Flame length before and after treatment (c). Fraction of crown scorch before and after intervention (d).
The flame length followed the pattern observed for the fireline intensity (Figure 12c), with a general reduction in the projected variable and a particularly noticeable decrease in flame length in areas 6 and 7. However, area 4 had an increase in the projected flame length. The fraction of crown scorch did not undergo notable changes with thinning in most areas, except for area 6, where the projected percentage of crown scorch increased from 64% to 100% (Figure 12d).
4. Discussion
The study areas are mountainous terrain with moderate to steep slopes, consisting of natural regeneration forests of maritime pine. In these areas, mechanisation is sometimes possible but with certain restrictions, which prevent the full utilisation of heavier machinery. In addition to slope conditions, thinning activities in vegetation lines require manual or motorised methods, given the high density of regenerating vegetation.
The first stand parameter considered in the interventions was the number of trees per ha (N), with the interventions always resulting in a substantial reduction in tree density per ha. The lowest thinning percentage was 66% in area 7, and the highest was 90% in area 5. This implies that most of the regeneration is harvested, while a smaller portion remains in the forest. This highlights the need to create space in the forest and reduce competition between trees for the development of trees with higher individual volumes and commercial value [12,23].
After being felled, the trees in the vegetation strip followed two procedures. In the first procedure, the trees were manually felled and dragged to the intermediate strip manually, and then they were shredded with a processor head. This method was applied in areas 2, 5, and 7. In the second procedure, in areas 1, 4, and 6, the felled trees remained in the area without processing, except for area 1, where rudimentary processing was conducted with a shrub cutter to reduce the dimensions of the fuel material. This reduction can favour rapid decomposition and seed dispersal, distribution, and viability in the area [24]. However, this fuel material also becomes more susceptible to rapid moisture loss, making the fine fuel bed more prone to ignition and fast fire propagation [25]. To mitigate the impact of the surface fuel layer, whether shrubs or thinning residues, one of the most commonly cited practices in the literature is the use of controlled fires, which, if correctly applied following the recommended techniques, significantly reduces the risk of high-intensity fires in the forest [26,27,28,29].
The simple felling of trees to reduce the density of natural regeneration stands does not necessarily imply a reduction in fire intensity, as residual biomass converts into fuel and tends to become drier, creating conditions for increased fire intensity. However, the practice of reducing the size of the remaining material initially increases the ignition capacity of a forest fire but promotes the decomposition of the material over a shorter period. Such a negative impact on fire intensity appears to have occurred in area 4 [29]. Area 1 and area 6 also had trees retained in the field, but, in the former case, there was some reduction in tree dimensions with a shrub cutter, and, in the latter case, the reduced density and dimensions of the trees minimised any effects on the fire intensity.
As expected, the interventions resulted in forests with larger tree dimensions [30]. The average tree height increased in the post-intervention scenario in all areas except for area 6. This can be interpreted by the fact that the area contained very young and homogeneous trees, making selection difficult due to their similarity. The diameter at breast height followed the same trend, with an overall increase in the mean DBH across the areas, except for areas 4 and 6, where it decreased. In area 6, the reduction in mean height can be attributed to the same reasons discussed earlier. Area 4 consisted of highly homogeneous, young tree regeneration at eight years old, with a high tree density and low ground-level insulation, indicated by only 10% sunlight penetration (dense canopy), making the selection of future trees for this regeneration challenging.
Another parameter analysed was the basal area of the stand. In the younger stands, the relationship between the thinning intensity and basal area reduction generally had the closest values (approximately 80% of trees removed resulted in a 72% reduction in basal area) compared to older ones (removing approximately 80% of trees resulted in a 60% reduction in basal area).
When analysing the volumes of wood extracted from forest operations, it is noteworthy that even in areas where the forest cover was greater than 50%, the extracted volume was always higher than the remaining volume. This can be explained by the fact that, in addition to opening intermediate strips, trees are also removed from the vegetation strips, which adds to the extracted volume in the “cleared” areas. Areas 4, 6, and 7 would not be potential areas for commercial exploitation because of their low volumes, small diameters, and the high moisture content of the residues found there, which would likely prevent economically sustainable exploitation due to the costs involved. The characteristics of the extracted material imply higher costs per energy unit (€/kWh) since they have low calorific value and negatively impact transportation (low density) and drying processes (high moisture) [31].
The analysis of wood volume production indicators reveals that, for area 1, scenario 2 shows the highest production. This scenario aims to extract from the forest the volume of wood that would otherwise be lost due to competition or mortality. Additionally, this scenario involves more thinning operations, which, depending on the exploited area, can provide advantages by ensuring a more homogeneous and constant wood supply. However, it is necessary to consider the costs of each thinning/harvest operation to assess the economic viability of such actions. On the other hand, scenario 4, indicated by the silvicultural model (Pp2), also guarantees a high volume and a higher final individual volume, which delivers higher-value wood. Therefore, scenarios 2 and 4 are the most suitable for this area in these conditions. For area 2, the same pattern observed in area 1 appears, and all the considerations already related to this area are relevant for area 2 as well. Despite the high volume indicated in scenario 4 of area 4, it cannot be claimed as the best scenario, as a significant portion of the extracted volume occurs at the beginning of the cycle, and much of this volume might lack commercial value due to its reduced dimensions. Scenario 1 performed the worst, supporting the argument that high competition for solar radiation, water, and mineral nutrients delays forest development and emphasises the importance of early interventions in areas of high density [32]. This thesis is corroborated by a study conducted in Lithuania with young stands of Pinus sylvestris, where the comparison of control areas without intervention with areas subjected to different thinning intensities showed higher volume increments in the thinned areas, especially in the more severe thinning operations, during the young stand phase. This effect reduces as the stands become older [33]. Another noteworthy fact is that, although the practice of thinning extracts biomass from the forest through tree extraction (above-ground biomass), thereby reducing the total carbon stock, there are indications that the carbon stock in the soil remains unchanged with this practice [34].
The analysis of the results in area 5 indicated a more positive response from natural regeneration regarding the final volume for scenario 3. However, scenario 4 still generates a forest with trees of higher individual volume at the end of the cycle. Area 6 and area 7 presented quite similar patterns, which can be attributed to their similar dendrometric characteristics. In both cases, scenarios 2 and 4 stand out. Scenario 2 shows the highest wood volume extracted in these areas, while scenario 4 represents the forest with the highest individual volume. However, caution is necessary, as these are young areas where initial thinning may result in a low-value wood volume that may not justify their exploitation, meaning that scenario 2, despite generating the highest wood volume, may not be the most economically viable option. It is worth noting that the Pp2 model is built upon the recommended silvicultural guidelines proposed by [27]. These guidelines ensure the preservation of minimal understory vegetation cover in maritime pine forests as a proactive management approach will mitigate forest fire hazards.
It is important that, following this study, the cost of subsequent thinning after the initial thinning and the commercial value of the wood generated in each thinning be assessed. With these data, it will be possible to evaluate the economic viability of each scenario and, with an integrated analysis of the fire control resistance indicators of the forest, add precision to the recommendation of management models for regeneration areas [35]. While it is not the focus of this article, it is important to consider the decision around resin exploitation. This practice entails slowing down tree growth and losing wood volume over time [36], but it can bring gains through resin revenue, which can outweigh this loss and improve the economic indicators of the forest [37,38].
Regarding the interaction of the scenarios with the indicators of fire control resistance in the forest, the initial interventions did not significantly affect the areas in reducing fire control resistance. However, it is important to develop the current study further and indicate the fire control resistance profiles of the areas studied at predefined intervals before and after each thinning to observe the trend of improvement or worsening in these indicators.
In addition to the dendrometric variables, some parameters that determine the fire behaviour and severity in the event of a forest fire were also analysed. In general, the intervention allowed for a projected reduction in fire severity since the removal of combustible material reduces the energy stored in biomass and consequently also decreases the intensity and severity of fires [26], and this is important because there are indications that severe fires significantly reduce the soil nitrogen content and dramatically decrease the natural regeneration density [39].
A similar study was conducted in Galicia (Lugo), Spain, but with older stands. It suggested that implementing thinning in Pinus sylvestris forests reduced the risk of crown fires. However, it did not find a correlation between thinning and individual volume gains, contrasting this article’s findings. This discrepancy may be attributed to the Spanish study starting with older ages, lower stand densities, and a shorter evaluation period. This underscores the importance of replicating the study under various tree density and forest age conditions [40].
Despite the significant reduction in fireline intensity in the early treatment areas, fires with an intensity above 4000 kW/m are very difficult, if not impossible, to control. Therefore, it can be concluded that the treatment was effective in reducing the resistance to fire control in area 7 [21]. All areas had values exceeding 4000 kW/m before the first thinning. It is worth noting that area 4 experienced an increase in fireline intensity, possibly due to the presence of untreated thinning slash.
The fire spread rate decreased in all scenarios, indicating that the area burned in a thinned stand would be lower for the same fire duration. However, it is important to note that in stands with late treatments (areas 1, 2, and 5), the average spread rate decreased only slightly, although to still high values (from 62.2 to 48.3 m/min on average), indicating an extremely fast-spreading fire. In stands with early interventions (areas 4, 6, and 7), the average spread rate decreased more significantly (from 46.4 to 23.6 m/min on average).
The flame length decreased in the post-treatment scenario, particularly in early intervention areas. However, area 4 showed an increase in flame intensity and length compared to the other areas, possibly due to the presence of residual woody material from thinning that was not shredded or removed from the area.
Regarding the fraction of crown scorch indicator, all areas would be completely scorched by a fire before the first thinning, except for area 6, which had a crown scorch value of 64%. After the first thinning, a scorch fraction of 100% was predicted for all areas. The decrease in tree density seems to have favoured an increase in flame size, especially in area 6. With the projected scorch fraction indicators, the survival possibility of trees would be practically null [41].
The shortage of studies conducted in naturally regenerated forests similar to the ones analysed necessitates caution regarding the application of the results to new areas. Additionally, as the evaluation incorporates simulations, unanticipated events like extreme weather conditions, drought, or pest attacks may yield outcomes divergent from those projected. Despite these constraints, it is anticipated that this study, based on real data, will contribute to filling a considerable knowledge gap and could serve as a reference in situations where there is a need to manage high densities of naturally regenerated forests.
5. Conclusions
This study focused on managing naturally regenerated Pinus pinaster forests in real situations. Despite the complexity of managing these forests, the insights provided can be applied to help manage maritime pine’s natural regeneration. It can be concluded that the selection of trees for early intervention in young regenerating maritime pine stands is hindered by the high tree densities and homogeneity of the stand, which can result in post-intervention conditions with smaller diameter and height parameters. Despite the interventions showing an improvement in fire behaviour indicators, especially in areas with younger thinning ages, and potentially allowing actions that reduce the burned area, it was not possible to effectively verify the interventions’ effectiveness in reducing fire control resistance in the forest.
Areas 4, 6, and 7, with younger stands (between 6 and 8 years old), showed better results for the final volume of forest wood at 45 years in scenario C3, i.e., the one proposed by the Forest Management Plans with a lower number of thinning operations than scenario C2. Areas 1, 2, and 5, of higher ages, also displayed better results for the final stand volume in a scenario with fewer thinning operations, especially under the conditions of scenario C4. Regarding the individual final volume, all areas showed better responses when subjected to scenario C4, which was the scenario where a greater number of thinning operations were applied. Concerning the total volume extracted from the forest, which includes the volumes of wood extracted in thinning added to the volume extracted in the final harvest, a greater number of thinning operations seems to perform better with in scenario C2. The exception was in areas 4 and 5, which had a very high tree density at the beginning of the cycle. In these cases, due to the initial extraction of a large volume of wood, scenarios with less thinning are more suitable (scenarios C4 and C3).
In general, the Pp2 model presented in the Forest Management Program (PROF) is well adjusted and allows for the best simulations regarding the management of forests for high-value commercial logs.
Author Contributions
Conceptualization, A.S., M.E.S., P.F. and T.F.; methodology, A.S., M.E.S., P.F. and T.F.; software, P.F. and T.F.; validation, P.F. and T.F.; formal analysis, A.S., M.E.S., P.F. and T.F.; investigation, A.S.; resources, M.E.S. and T.F.; data curation, A.S., P.F. and T.F.; writing—original draft preparation, A.S.; writing—review and editing, A.S. and T.F.; visualisation, A.S., M.E.S., P.F. and T.F.; supervision, M.E.S., P.F. and T.F.; project administration, M.E.S.; funding acquisition, M.E.S. and T.F. All authors have read and agreed to the published version of the manuscript.
Funding
This work was supported by the Project rePlant—Implementation of Collaborative Strategies for Integrated Forest and Fire Management—co-funded by the Competitiveness and Internationalisation Operational Programme and the Lisbon Regional Operational Programme of Portugal 2020 and by the European Union through the European Regional Development Fund and by National Funds from FCT—Portuguese Foundation for Science and Technology, under the project UIDB/04033/2020 (https://doi.org/10.54499/UIDB/04033/2020).
Data Availability Statement
Data is contained within the article.
Acknowledgments
We thank Carlos Fernandes, Paulo Ventura, Jani Pires, Dalila Araújo and Cooperativa Agro-Rural de Boticas (CAPOLIB), especially Ângelo Teixeira, Margarida Cabral and Miguel Alves.
Conflicts of Interest
The authors declare no conflicts of interest. The funders had no role in the design of the study; in the collection, analyses, or interpretation of data; in the writing of the manuscript, or in the decision to publish the results.
References
- Reboredo, F.; Pais, J. A construção naval e a destruição do coberto florestal—Do século XII ao século XX (En: Shipbuilding and the Destruction of Forest Cover—From the Twelfth to the Twentieth Century). Ecologia 2012, 4, 31–42. [Google Scholar]
- Martins, A.A.S. A Arqueologia Naval Portuguesa: (Séculos XIII a XVI): Uma Aproximação ao seu Estudo Ibérico (En: Portuguese Naval Archaeology: (Thirteenth to Sixteenth Centuries): An Approach to Its Iberian Study); Universidade Autónoma de Lisboa: Lisboa, Portugal, 2001. [Google Scholar]
- Radich, M.C. Floresta e Sociedade: Um Percurso (1875–2005) (En: Forest and Society: A Journey (1875–2005); Silva Lusitana: Lisboa, Portugal, 2005; pp. 143–147. [Google Scholar]
- Instituto da Conservação da Natureza e das Florestas. Portugal-Perfil Florestal (En: Portugal-Forest Profile), ICNF, Resumo. January 2021. Available online: https://www.icnf.pt/api/file/doc/1f924a3c0e4f7372 (accessed on 14 September 2023).
- ICNF. 6° Inventário Florestal Nacional’, Relatório Final (En: 6th National Forest Inventory, Final Report); Instituto da Conservação da Natureza e das Florestas: Lisboa, Portugal, 2015. [Google Scholar]
- Figueiral, I. Charcoal analysis and the history of Pinus pinaster (cluster pine) in Portugal. Rev. Palaeobot. Palynol. 1995, 89, 441–454. [Google Scholar] [CrossRef]
- UTAD. ‘Ficha da Espécie Pinus pinaster’, (En: Pinus pinaster Species Sheet) Universidade de Trás-os-Montes e Alto Douro. Available online: https://jb.utad.pt/especie/Pinus_pinaster (accessed on 29 November 2023).
- Soares, P.; Calado, N.; Carneiro, S. Manual de Boas Práticas Para o Pinheiro-Bravo (En: Manual of Good Practices for Maritime Pine); Centro PINUS Associação para a Valorização da Floresta de Pinho: Viana do Castelo, Portugal, 2019. [Google Scholar]
- Oliveira, A.; Moura, P.; Providência, F.M. Boas Práticas Florestais para o Pinheiro-Bravo-Manual; Centro Pinus: Viana do Castelo, Portugal, 1999. [Google Scholar]
- Viñas, R.A.; Caudullo, G.; Oliveira, S.; de Rigo, D. Pinus pinaster in Europe: Distribution, Habitat, Usage and Threats. In European Atlas of Forest Tree Species; Publications Office of the EU: Luxembourg, 2016; pp. 128–129. [Google Scholar]
- Alía, R. Adaptive potential of maritime pine under contrasting environments. BMC Plant Biol. 2024, 24, 37. [Google Scholar] [CrossRef] [PubMed]
- Fonseca, T.; Lousada, J. Management of Maritime Pine: Energetic Potential with Alternative Silvicultural Guidelines. In Forest Biomass—From Trees to Energy; Gonçalves, A.C., Sousa, A., Malico, I., Eds.; Intech Open: London, UK, 2021. [Google Scholar] [CrossRef]
- Ackzell, L. A comparison of planting, sowing and natural regeneration for Pinus sylvestris (L.) in boreal Sweden. For. Ecol. Manag. 1993, 61, 229–245. [Google Scholar] [CrossRef]
- Fonseca, T.; Parresol, B.; Marques, C.; de Coligny, F. Models to Implement a Sustainable Forest Management—An Overview of the ModisPinaster Model. In Sustainable Forest Management—Current Research; Diez, J.J., Ed.; InTech: London, UK, 2012. [Google Scholar] [CrossRef]
- Ribeiro, S.; Cerveira, A.; Soares, P.; Fonseca, T. Natural Regeneration of Maritime Pine: A Review of the Influencing Factors and Proposals for Management. Forests 2022, 13, 386. [Google Scholar] [CrossRef]
- Gonçalves, A.C. Stand Structure Impacts on Forest Modelling. Appl. Sci. 2022, 12, 6963. [Google Scholar] [CrossRef]
- Instituto Português do Mar e da Atmosfera. Instituto Português do Mar e da Atmosfera. Available online: www.ipma.pt (accessed on 24 October 2023).
- Aranha, J. Prof de Entre Douro E Minho | Documento Estratégico Elaborado por Floradata–Biodiversidade, Ambiente e Recursos Naturais, Lda para Instituto da Conservação da Natureza e das Florestas. 2018. Available online: https://www.icnf.pt/api/file/doc/aaee556151a1aeae (accessed on 28 January 2024).
- Fonte, C.M.M. Estimação do Volume Total em Mercantil em Pinus pinaster Ait. no Vale do Tâmega (En: Estimation of the Total Volume in Mercantile in Pinus pinaster Ait. in the Tâmega Valley); Relatório de Estágio; Universidade de Trás os Montes e Alto Douro: Vila Real, Portugal, 2000. [Google Scholar]
- Alexander, M.E.; Cruz, M.G. Fireline Intensity. In Encyclopedia of Wildfires and Wildland-Urban Interface (WUI) Fires; Manzello, S.L., Ed.; Springer International Publishing: Cham, Switzerland, 2019; pp. 1–8. [Google Scholar] [CrossRef]
- Gabriel, A.O.; Kreutzwiser, R.D. Drought Hazard in Ontario: A Review of Impacts, 1960–1989, and Management Implications. Can. Water Resour. J. 1993, 18, 117–132. [Google Scholar] [CrossRef]
- Fernandes, P.M.; Loureiro, C.; Botelho, H. PiroPinus: A spreadsheet application to guide prescribed burning operations in maritime pine forest. Comput. Electron. Agric. 2012, 81, 58–61. [Google Scholar] [CrossRef]
- Alexander, M.E. Fire Behaviour as a Factor in Forest and Rural Fire Suppression; Forest Research Buletin 197; Forest Research: Rotorua, New Zeland, 2000. [Google Scholar]
- da Costa, M.S. Pinheiro-Bravo e Pinheiro-Manso—Cultura, Exploração e Tratamento (En: Maritime Pine and Stone Pine—Culture, Exploration and Treatment), 1st ed.; Árvores Florestais Resinosas, no. 19; LIvraria Popular de Francisco Franco: Lisboa, Portugal, 1984; Volume 1. [Google Scholar]
- Líbano, E.C. Estudio de la Regeneración Natural de Pinus pinaster ait. ssp. Atlántica en el Noroeste de España. Cuad. Soc. Esp. Cien. For. 2003, 15, 101–106. [Google Scholar]
- Keane, R.E. Wildland Fuel Fundamentals and Applications; Springer International Publishing: Cham, Switzerland, 2015. [Google Scholar] [CrossRef]
- Dodge, M. Forest Fuel Accumulation—A Growing Problem. Science 1972, 177, 139–142. [Google Scholar] [CrossRef]
- Noonan-Wright, E.; Seielstad, C.A. Patterns of wildfire risk in the United States from systematic operational risk assessments: How risk is characterised by land managers. Int. J. Wildland Fire 2021, 30, 569–584. [Google Scholar] [CrossRef]
- Fernandes, P.; Botelho, H. A Piroecologia do Pinheiro Bravo. Available online: https://www.researchgate.net/publication/215705631_A_Piroecologia_do_Pinheiro_Bravo (accessed on 28 January 2024).
- Fernandes, P.M. A Silvicultura Preventiva do Pinhal Bravo. (En: Preventive Silviculture of the Maritime Pine Forest), Jornadas Técnicas “Investigação Aplicada na Gestão do Pinhal” Projecto 372—Experimentação e Demonstração de Técnicas Silvícolas e de Gestão Sustentável em Pinhal Bravo. 2009. Available online: https://www.researchgate.net/publication/235877076_A_silvicultura_preventiva_do_pinhal_bravo (accessed on 28 January 2024).
- Calama, R.; Manso, R.; Lucas-Borja, M.E.; Espelta, J.M.; Pique, M.; Bravo, F.; del peso Taranco, C.; Pardos, M. Natural regeneration in Iberian pines: A review of dynamic processes and proposals for management. For. Syst. 2017, 26, eR02S. [Google Scholar] [CrossRef]
- da Cruz barbosa, M.T. Análise da Utilização de Biomassa e Resíduos Florestais para a Produção de Pellets (En: Analysis of the Use of Biomass and Forest Residues for Pellet Production). Master´s Thesis, Universidade de Aveiro, Aveiro, Portugal, 2008. [Google Scholar]
- Kozlowski, T.T. Physiological ecology of natural regeneration of harvested and disturbed forest stands: Implications for forest management. For. Ecol. Manag. 2002, 158, 195–221. [Google Scholar] [CrossRef]
- Linkevičius, E.; Šilinskas, B.; Beniušienė, L.; Aleinikovas, M.; Kliučius, A. The Growing Dynamic of Pure Scots Pine Stands Using Different Thinning Regimes in Lithuania. Forests 2023, 14, 1610. [Google Scholar] [CrossRef]
- Ruiz-Peinado, R.; Bravo-Oviedo, A.; López-Senespleda, E.; Montero, G.; Río, M. Do thinnings influence biomass and soil carbon stocks in Mediterranean maritime pinewoods? Eur. J. For. Res. 2013, 132, 253–262. [Google Scholar] [CrossRef]
- Rosa, R.; Soares, P.; Tomé, M. Evaluating the Economic Potential of Uneven-aged Maritime Pine Forests. Ecol. Econ. 2018, 143, 210–217. [Google Scholar] [CrossRef]
- Moura, M. Resin tapping influence on maritime pine growth depends on tree age and stand characteristics. Eur. J. For. Res. 2023, 142, 965–980. [Google Scholar] [CrossRef]
- Lima, B.D.A.; Nicoletti, M.F.; Stepka, T.F.; Da Silva, M.T.S.; Soares, P.R.C. Impactos dendrométricos e econômicos de um povoamento de Pinus elliottii submetidos a produção de resina. (En: Dendrometric and economic impacts of a Pinus elliottii stand submitted to resin production). Adv. For. Sci. 2021, 8, 1475–1487. [Google Scholar] [CrossRef]
- Mantero, G.; Morresi, D.; Negri, S.; Anselmetto, N.; Lingua, E.; Bonifacio, E.; Garbarino, M.; Marzano, R. Short-term drivers of post-fire forest regeneration in the Western Alps. Fire Ecol. 2023, 19, 23. [Google Scholar] [CrossRef]
- Crecente-Campo, F.; Pommerening, A.; Rodríguez-Soalleiro, R. Impacts of thinning on structure, growth and risk of crown fire in a Pinus sylvestris L. plantation in northern Spain. For. Ecol. Manag. 2009, 257, 1945–1954. [Google Scholar] [CrossRef]
- Vega, J.; Jimenez, E.; Vega, D.; Ortiz, L.; Pérez, J.R. Pinus pinaster Ait. tree mortality following wildfire in Spain. For. Ecol. Manag. 2011, 261, 2232–2242. [Google Scholar] [CrossRef]
Disclaimer/Publisher’s Note: The statements, opinions and data contained in all publications are solely those of the individual author(s) and contributor(s) and not of MDPI and/or the editor(s). MDPI and/or the editor(s) disclaim responsibility for any injury to people or property resulting from any ideas, methods, instructions or products referred to in the content. |
© 2024 by the authors. Licensee MDPI, Basel, Switzerland. This article is an open access article distributed under the terms and conditions of the Creative Commons Attribution (CC BY) license (https://creativecommons.org/licenses/by/4.0/).