
Deciphering Urban Land Use Patterns in the Shenzhen–Dongguan Cross-Boundary Region Based on Multisource Data


1
School of Geography and Planning, Sun Yat-sen University, Guangzhou 510006, China
2
China Regional Coordinated Development and Rural Construction Institute, Sun Yat-sen University, Guangzhou 510275, China
*
Author to whom correspondence should be addressed.
Land 2024, 13(2), 161; https://doi.org/10.3390/land13020161
Submission received: 14 December 2023
/
Revised: 26 January 2024
/
Accepted: 27 January 2024
/
Published: 30 January 2024
Abstract
:Against the backdrop of coordinated development and regional integration in the Guangdong–Hong Kong–Macao Greater Bay Area, China, the integration of Shenzhen and Dongguan has received increasing attention from both academia and the government. The cross-boundary area of the two cities has also shifted from being categorized as the development edge to becoming a key area, presenting more complex spatial and functional characteristics. This paper applies multi-source data to analyze the spatial characteristics and factors of influence in the Shenzhen–Dongguan cross-boundary region from the perspective of urban land use pattern evolution. The results showed that from 2008 to 2022, (1) the spatial structure presented a development trend from multi-core to axial, then to network, gradually breaking down the development barriers in the central region; (2) the function of regional land was transformed from a single type to a composite and mixed type, and the layout of commercial, public, green, and transportation land became more dispersed and balanced; (3) the cross-administrative boundaries of commercial land were exaggerated, and industrial land was widely transformed into composite industrial and commercial land, forming an integrated industrial belt; and (4) the overall increase in the mixing degree of land use functions indicated that the two regions were interconnected and integrated with each other, and the functional structure of the cross-boundary region was relatively more complete.
1. Introduction
With the advancement of urbanization, the functions of the core cities in the Guangdong–Hong Kong–Macao Greater Bay Area, China, continue to strengthen, and the transition of urban construction from the core of the cities to the peripheral areas has led to closer functional links between cities. Among them, Shenzhen and Dongguan play an important role within the Guangdong–Hong Kong–Macao Greater Bay Area, as well as being one of the most representative integrated regions. The two cities, with their naturally connected landscape, complementary industrial structures, connected transportation roads, and interconnected human civilization, have traditionally been closely linked and have a strong foundation for further integration, mutual benefits, and win-win situations. With the continuous promotion of both market-oriented forces and policies related to the coordinated development of Shenzhen and Dongguan, the integration of the two regions has made significant progress, and regional development has been rapid. The Shenzhen metropolitan area has become the basic unit for the Pearl River Delta region to connect with globalization. “Opinions on Further Improving the Regional Coordinated Development Pattern and Promoting the Accelerated High-Quality Development of Southern Towns” [1] sets out clear proposals that the nine towns facing the northern part of Shenzhen—Humen, Chang’an, Dalingshan, Dalang, Huangjiang, Zhangmutou, Fenggang, Tangxia, and Qingxi—will be connected and integrated into Shenzhen at a high level and will jointly explore the construction of the “Shenzhen Dongguan Deep Integration Development Demonstration Zone” with Shenzhen.
In the context of coordinated and high-quality regional development in China, urban functional zones have expanded beyond their original administrative boundaries, and the cross-boundary region has become a new spatial pattern. Under the influence of market factors, there are economic, transportation, social, cultural, policy, and other connections between the different administrative entities. Cross-boundary regions have more complex spatial characteristics, and the evolution of their spatial patterns is a comprehensive reflection of the flow of elements between different administrative entities and the evolution of a system structure, which is a concrete manifestation of the complex interactive process of the human–land system [2]. The identification of factors that influence the evolution and dynamics of regional spatial structure has become an effective means of understanding the laws of regional development. Studies have been conducted to measure the spatial structure of the region through commuting flows, employment density, population density, and land use function [3]. In particular, classifications of the urban land use function are of great importance for the spatial structure [4]. The patterns formed by the proportion of land use function types in terms of quantity and their mutual positional relationship in space are an important manifestation of spatial structure. The existing literature focuses mainly on cross-border space on national and subnational scales, with little attention paid to land use and spatial change on regional and subregional scales. Most of the studies are centered on changes in built-up and non-built-up land, focusing more on the ecological functions of the land and less on the changes in the functions of urban built-up land. In addition, the existing research on functional zoning recognition is limited to a single time node and lacks analysis of the influencing factors. Based on this, it is necessary to overcome the statistical barriers to investigate cross-boundary areas’ spatial and temporal features on subregional scales and explore the influencing factors through practical situations such as marketization background, relevant policies, and planning texts.
Based on land use data, POI data, and road network data, this paper aims to explore the evolution and causes of urban land use in the cross-boundary region of Shenzhen–Dongguan and to provide certain theoretical support and practical suggestions for further development of the cross-boundary region of Shenzhen–Dongguan. The contributions of this study are reflected in the following: (1) The integration of traditional data with big data. POI data can better reflect the types of urban land use, but for areas with a larger scope, especially in urban fringe areas, non-construction land accounts for a large proportion, so it is necessary to screen out areas with urban land use. (2) The evolutionary characteristics and influencing factors of the long-term spatial pattern of land use. A standardized and systematic analysis provides a reference for global comparison of land use patterns, which can also bridge the gap between the development of land use and urban planning, allowing for the implementation of new-type urbanization and high-quality development strategies.
2. Literature Review
Cross-border regions (CBRs) are new spaces created through close cross-border linkage between nations that further strengthen commonalities in economic, social, and cultural aspects. As cooperation between cross-border regions continues to extend from the supra-national to the sub-national and regional levels, the discussion is not limited to regions that transcend national borders but also focuses on cross-boundary regions between different administrative regions within a country. In the context of coordinated regional development, the cross-boundary region has gradually become a paradigm for metropolitan spatial reconfiguration, transcending its inherent categorization as “edge” in the traditional “core-edge” structure [5].
In 1950, Francois Perroux proposed the theory of growth poles, indicating the geographical polarization of economic space [6]. In 1966, John Friedman put forward the theory of “core-periphery” [7], arguing that in the process of regional economic growth, there exists an unequal development relationship between the central and peripheral areas. From an economic and social point of view, most border areas have long been considered marginal, and according to the classical theories of localization, they are marginalized. At the same time, the obstruction of administrative borders leads to “border effects” [8] and “border friction” [9], restricting the free flow of capital, talent, information, technology, and other factors, increasing the spatial and temporal distance of interaction between the two systems, and resulting in practical problems such as administrative self-defense, economic and trade barriers, market segregation, poor circulation, information blockages, and cultural segmentation, which in turn affect the spatial connection and interaction between two sides of the border and impose rigid constraints on the development of the entire region [10].
The core-periphery theory demonstrates the evolution of regional development from isolation to close contact and from disequilibrium to equilibrium. Finally, the whole region becomes a complete organism. With the widespread penetration of urbanization, urban functions are overflowing from the core to the periphery. Scholars in China and around the world have begun to pay attention to the edges of cities, proposing that the rise of “edge cities” [11] has marked a new era in urban settlement, with economic activity dispersed on the fringes of metropolitan areas. Regional competition and cooperation are intertwined, and the flow of cross-border elements is accelerating, laying the foundation for the formation of cross-border regions. The integration processes and the subsequent relative opening up of borders have had a profound impact on border regions, resulting in new patterns of urban development [12]. Spatially adjacent cities have assimilated each other in terms of their economies, societies, space, and governance, gradually realizing the unified allocation of production factors, living factors, resource factors, and management factors within the area. As a result, the segmentation function of traditional administrative boundaries has been weakening, and identity barriers have gradually disappeared [13]. Cross-border regions are “crossroads” between heterogeneous spaces and societies where various socio-economic characteristics interact and influence each other [14]. The related research mainly focuses on topics such as urban landscapes of cross-border regions [15], cross-border cooperation [16], economic interaction [17], cultural integration [18], functional complementarity [19], and cross-border spatial planning [20]. Most of the studies have mainly focused on cross-border regions in supranational paradigms, such as the European Union (EU) [21] and the US–Mexico border region [22]. In the later stages of China’s urbanization, the barriers imposed by administrative boundaries have weakened, so scholars have embarked on studies of cross-boundary regions at the regional scale. In recent years, the cross-boundary area has become a research hotspot in the Guangdong–Hong Kong–Macao Greater Bay Area, China [23,24], after the handover of Hong Kong in 1997. Since then, the focus of research has shifted from the cross-boundary region between Hong Kong, Macao, and the mainland to the interior of the Pearl River Delta.
Regional cities are complex entities composed of various functional elements such as industrial, residential, services, and transportation. The evolution of a city’s spatial pattern of urban land use is the result of the combined effects of market factor flow, social integration, natural obstacles, and administrative regulation, making their spatial characteristics more complex. The spatial distribution, proportion, and mutual influence and interaction of various functions at different scales constitute the characteristics of urban spatial structure, which affect the final form and operational efficiency of the spatial structure. Accordingly, the accurate delineation of urban land use is an important tool for understanding urban spatial structure and deciphering planning problems. With the emergence of mega-city regions, the urban functional elements have flourished and spread beyond their original administrative boundaries [25]. In cross-boundary areas, the distribution and proportion of urban residential land, public green spaces, commercial land, industrial land, and other land uses show different characteristics from the urban center, reflecting the separation, transition, and intersection of social, economic, cultural, and governance elements on both sides of the administrative boundary.
For the exploration of land use functions, scholars in China and abroad have contributed a number of fruitful investigations based on different theoretical perspectives such as Western political economy, urban economics, and sociology, including the recognition of production–living–ecological functions at different spatial scales [26], the spatiotemporal pattern evolution of urban land use structure [27], spatial differentiation in the efficiency of urban land use structures [28], the trends in and regulation of urban construction land [29], and how human-related drivers such as policy and planning contribute to land use evolution in cross-boundary areas [30]. Traditional methods mostly rely on remote sensing images, land use data, and expert surveys or evaluations [31]. However, due to the characteristics of mixed and overlapping functional areas, diverse attributes, and dynamic changes in urban land use, such classification methods have the following shortcomings: ① The methods mainly focus on the natural attributes of land features and cannot fully connect with urban land use types with obvious socio-economic attributes; ② the division scale is relatively imprecise and cannot be refined to accurately identify the function of lands; ③ the acquisition of land use planning data are difficult and ineffective, so it cannot accurately reflect real-time land use functions.
With the rapid development of the Internet, a large quantity of location-based big data have provided rich data sources for urban land use classification and urban spatial structure analysis research. At present, domestic and foreign scholars mainly use human mobility data [32], latent activity trajectory data [33], social media data [34], and POI data [35] to study the structure of urban functional zones. POIs can describe various commercial and social service facilities in the geographic space, containing rich cultural and economic characteristics. Through methods such as the quantitative density and spatial heterogeneity of POIs [36], spatial semantic analysis [37], and clustering [38], it is possible to identify the functional zoning of urban land use on a more detailed scale. Analyses of functional zoning results at different scales may yield different results due to zoning effects. Existing studies are mostly based on grid or administrative boundaries [39]. The former scale is acceptable, but the city is typically divided into homogeneous spaces, which do not provide strong guidance for urban planning and governance, while the latter takes into account the existing criteria for spatial partitioning, but the scale is relatively unrefined and the significance of functional division is weak.
However, partitioning cities based on road networks or base stations can avoid, as much as possible, the problems set out above. In terms of zoning standards, existing research mostly considers single-functional zones and mixed zones, which makes it difficult to reflect the current trend of land-use functional composites [40]. Therefore, this paper considers multi-functional composite types on the basis of single-functional zones, which helps to analyze the transformation of land use type requirements. Although some progress has been made in POI-based functional identification research, many scholars have only focused on land use functional zoning at a single time node, and there are few studies using this method to explore the long-term evolution pattern. Most studies focus on urban built-up areas or central urban areas, with less consideration given to special areas such as urban edges and the boundaries between two cities.
On the basis of urban land use, the degree of functional mixing has also received increasing attention. The Charter of Machu Picchu states that in order to adapt to the rapid development of cities, efforts should be made to create a comprehensive and multifunctional living environment rather than mechanically separating various functional areas [41]. At present, researchers and planners are increasingly focusing on the comprehensiveness of regional functions, proposing the concept of “land use multifunction” [42]. The higher the degree of mixing in urban functional areas, the more conducive it is to urban development [43]. The excessive concentration of single-functional areas will significantly increase time costs, reduce regional vitality, and affect urban development. Scholars have summarized the entropy law of urban structure based on empirical research [44]. The urban land use system is an ordered, dissipative structural system characterized by entropy to indicate the degree of disorder, if any. The higher the entropy value, the lower the orderliness of the system, and vice versa.
At present, domestic and foreign scholars have a wide range of research ideas and methods relating to regional land use functions. Based on the gaps in the existing research, the following prospects are proposed: Firstly, focus on areas with special characteristics, for example, exploring spatial units of different scales and characteristics such as urban fringe areas, cross-boundary areas, and satellite cities. Secondly, on the basis of the recognition of land use function, further explore the characteristics and driving factors of long-term spatial evolution. With the continuous optimization of and adjustments to regional economic structure and the deepening of regional integration, cross-boundary regions are influenced by multiple factors such as nature, markets, transportation, society, and administration, and their evolutionary influencing factors are complex and intricate. The existing research on functional zoning is often limited to a specific time, lacking analysis of the long-term evolutionary process, and there is little further exploration of the influencing factors. Thirdly, approach the functional characteristics of border areas from multiple macro- and micro-perspectives. The existing research focuses more on the spatial characteristics of large-scale boundary areas, neglecting small-scale spatial issues that would be guided by a people-oriented approach. There is a lack of in-depth analysis of the profound reasons behind surface problems at the microscale. Therefore, future related research can be approached from a micro perspective, combined with a specific background and practical analysis of the actual needs and development patterns of border areas, to provide more practical suggestions for the research area and enhance the practical significance of this research.
3. Study Area, Data, and Methods
3.1. Study Area
In the context of the regional integration and coordinated development of the Guangdong–Hong Kong–Macao Greater Bay Area, China, cross-boundary regions such as Guangzhou–Foshan and Shenzhen–Dongguan have rapidly developed, with relatively little attention having been paid to the latter region. Shenzhen is located at 114.07° E, 22.62° N, and Dongguan is located at 113.75° E and 23.04° N. The total area of Shenzhen is 1997.47 square kilometers, with a permanent population of 177,761,800 in 2022, while the total area is 2542.67 square kilometers in Dongguan. By the end of 2022, Dongguan had a permanent population of 10.437 million. Shenzhen and Dongguan have strong complementarity and obvious integration characteristics, and they are representative of integrated regions. With the acceleration in the construction of the Shenzhen metropolitan area, Dongguan and Shenzhen will usher in a new era of deep integration, and the two cities will realize all-round integration and development; they will join together to build a pole in the global Bay Area economy, which will also become the focus of academic attention. Therefore, this study delineates the research scope based on townships near the administrative boundary of Shenzhen and Dongguan, including 25 towns with an area of approximately 1547.56 square kilometers. Shenzhen includes 17 subdistricts with an area of 577.56 square kilometers, accounting for 37.32%; Dongguan includes 8 towns with an area of 969.99 square kilometers, accounting for 62.68% (see Figure 1).
3.2. Analytical Framework and Research Data
This study can be divided into four steps (see Figure 2): (1) identification of the overall structural evolution of a region through night-time light data; (2) kernel density analysis based on OSM road network and multi-year POI data (2008, 2014, 2022) to identify the distribution and quantity changes in land use function types at different time nodes through weighting and proportion analysis, and to explore the evolution of urban land use function structure; (3) analysis of the distribution patterns and long-term changes of land use type mixing degree through functional mixing degree analysis; (4) finally, through a combination of relevant policies and market development, analysis of the driving factors of the evolution of spatial characteristics in cross-boundary areas. This research data include land use data, POI data, OSM road network data, etc. (see Table 1).
This paper divides the original POI data into six categories based on the “Code for classification of urban land use and planning standards of development land” [46], involving residential land, public service and management land, commercial and financial land, industrial and mining storage land, transportation land, and green square land (see Table 2).
Topological processing was performed on the OSM road network data, isolating and identifying each road to mark it as closed and ultimately generating 5636 road network units for functional zoning. As the “natural boundary” of a city, the irregular grid units formed by closed road networks are the basic units for dividing urban socio-economic functional zones, formulating urban planning, and undertaking urban operations and management. Therefore, using the road network to divide research units has practical significance.
3.3. Research Methods
3.3.1. Identification and Conversion of Land Use Functions
- (1)
- Kernel
The traditional partition, based on statistics of quantity proportion, is only determined by its internal POI distribution, ignoring the influence of surrounding POIs on its recognition. To reflect the diffusion effect of POIs, it is necessary to conduct nuclear density analysis on various types of POIs and obtain their radiation results. Kernel analysis is a non-parametric estimation and spatial analysis method for calculating the density of features in their surrounding neighborhoods, commonly used in the study of the spatial distribution patterns of geographic data. This method is based on the first law of geography—the closer the relationship between items; the greater the density expansion value obtained from the closer positions to the core elements [47]; reflecting the differences in spatial positions and the attenuation in center strength with distance. It is suitable for the density estimation of continuous geographical phenomena such as urban facility service impacts. Therefore, this study utilizes kernel density analysis to achieve the spatial extension of POI category attribute information from point to surface and to achieve the diffusion of POI facility service impact. It uses the distance from a point within the search radius to the center point to characterize the attenuation of the density value of that point with distance, effectively describing the distribution density of POI data and the degree of impact of different urban land use functions on surrounding areas. The calculation formula is as follows:
In the formula, f(x) is the kernel density calculation function; h is the search radius (bandwidth); x − xi is the relative distance between POI point elements x and xi; n is the number of feature points contained within the search radius for point x; K is a kernel function. The POI reclassification results in Table 2 are analyzed to obtain the kernel density values for six types of POIs.
- (2)
- Chordal graph
A chordal graph is a special type of undirected graph that can be used to display the transitional relationships between multiple objects. Among them, the line segment connecting any two points on a circle is called a chord, representing the mutual correlation between the two. Chordal diagrams can reflect the quantity and flow relationship of conversions between different types of land during the evolution of land use functions and visually express them. The width of the chord can reflect the quantity and degree of conversions between different land use types, and the wider the chord, the higher the degree of conversion. This paper visualizes the evolution process of urban land use spatial patterns in different periods using chordal diagrams. In order to eliminate the impact of differences in a road network zoning area on the number of land uses, this paper divides the functional areas based on a 1 km fishing net and uses it for the statistics of various functional land use quantities.
- (3)
- Analytic Hierarchy Process (AHP)
Due to significant differences in the number of various POIs, varying land use areas, and the importance of buildings, it is necessary to empower them. Therefore, this paper adopts a subjective weighting method and an analytic hierarchy process. In terms of the number of POIs, commercial and industrial land account for a relatively large proportion, while residential land, industrial and mining storage land, transportation land, and green square land account for a relatively small proportion. It is assumed that POIs represent a larger area of residential land and green squares, while commercial land is smaller and has a vertical distribution. In addition, from the perspective of the importance of urban structures, residential land and public service land are relatively large areas.
Taking into account the above factors and referring to the public awareness ranking of W. F. Zhao, various types of POIs are divided and assigned different weights based on quantity and land area [48]. POIs with lower quantities, sparse distributions, larger land areas, and larger service radii have relatively higher weights, while POIs with greater quantities, dense distributions, and smaller land areas have lower weights. After multiple revisions and debugging, various POIs were finally assigned corresponding weights: 20 for commercial and financial land, 120 for residential land, 50 for public services and management land, 20 for industrial and mining warehousing land, 200 for green squares, and 100 for transportation land. Finally, weighted POI data were generated. When the category with the highest POI frequency density within a functional area unit is greater than or equal to 40%, it is determined that the unit is a single functional area; when the two types of POI with the highest frequency density are between 20% and −40%, it is determined that the unit is a composite functional area; the remaining units are comprehensive functional areas.
3.3.2. The Mixing Degree of Land Use Functions
Due to the fact that land classification can only classify single land types, composite land types, and mixed land types, it is not possible to visually determine the degree of land mixing for various functional land types. Therefore, this paper uses the information entropy index to represent the degree of functional mixing, where f(X) represents the entropy of the random variable X and Pi is the probability of X taking Xi. B represents the proportion of construction land area within the plot to the total area, used to eliminate errors caused by a small number of POIs in some areas where ecological land is mainly used. The greater the entropy value, the greater the uncertainty. The higher the information entropy of urban land use structure, the higher the degree of mixing between different land types.
4. Results
4.1. Patterns of Spatial Growth in the Cross-Boundary Area
Based on night-time light data to identify the spatial growth patterns of the region, the Shenzhen–Dongguan cross-boundary area has undergone a trend of multi-core, strip-like, and networked spatial structure evolution. Based on the point-axis theory, transportation routes play a role in this change in spatial organization. This area is affected by natural factors like obstruction by mountains, resulting in the slow process of cross-boundary development.
- (1)
- Dual-core-driven and peripheral synergy
In 2008, the core areas of Chang’an–Songgang–Shajing in the western part of the region between Shenzhen and Dongguan, as well as Fenggang–Pinghu in the eastern part, drove the development of the surrounding areas and formed a secondary core. The overall performance is “dual core drive and peripheral coordination”.
- (2)
- Integration of two belts, spreading towards the center
In 2012, the western and eastern regions of the region formed a cross-boundary axis development model, driven by the “two cores” and transformed into the “two belts” integration. The western part of Dongguan showed a diffusion-style development from the center to the periphery, which can be summarized as “the integration of the two belts, spreading towards the center” as a whole. Driven by policy forces, Shenzhen and Dongguan ushered in the “double zone” era. The sense of boundary fragmentation has weakened, gradually forming a north-south cross-boundary expansion axis in Shenzhen and Dongguan.
- (3)
- Songshan Lake leads the rise in the central area
In 2016, the Shenzhen side showed a trend of horizontal expansion, while the east and west sides drove the development of the central region, forming a balanced growth trend. At the same time, Dalang Town on the Dongguan side formed a secondary focus for development under the impetus of the Songshan Lake Science and Technology Industrial Park, and the economic activities in the surrounding areas further increased, which can be summarized as “Songshan Lake Leading, Central China Rises”. The Songshan Lake Science and Technology Industrial Park was completed in 2001 and is located at the junction of Dalang Town and Dalingshan in Dongguan City. It is a new engine for Dongguan’s industrial transformation and upgrading. In order to promote the high-quality development of the Songshan Lake industries, relevant departments have subsequently introduced a series of industrial support policies, which have played a crucial role in the balanced expansion and expansion of Dongguan’s economic activities and are also the main reason for the formation of the third core economic development in the region. To the present time, Songshan Lake has gathered numerous leading enterprises. As Songshan Lake extends southward, the channel between Songshan Lake Science City and Shenzhen Guangming Science City has opened, and a new round of integrated cross-boundary development is underway in the central region, becoming a new industrial platform carrier for the integrated development of Dongguan and Shenzhen.
- (4)
- Network structure and region-wide balance
By 2020, Shenzhen had formed a balanced and high-speed development, while Humen Chang’an, Dalang Dalingshan, and Tangxia Fenggang on Dongguan had become three development clusters in the east, middle, and west, further achieving balanced growth, which is in line with the balanced evolutionary characteristics of the regional spatial structure of “point-axis-network” (see Figure 3) [49].
4.2. Spatial and Temporal Dimensions of Land Use Change in the Cross-Boundary Area
4.2.1. The Proportion and Transfer of Various Types of Land Use Functions
From the overall evolution of the proportion of types of land use function, the following significant characteristics exist (see Table 3 and Figure 4):
(1) There is a trend toward diversification and mixing of land use functions. The quantity of mixed functional land is constantly increasing, and multiple types of single functional land are transitioning to composite functional land and mixed functional land. The urban functional structure is becoming increasingly complex.
(2) The trend of industrial integration is led by the service industry. The proportion of industrial land has significant changing characteristics, specifically manifested as a significant increase in commercial land and a trend towards stability; industrial land has been significantly reduced, with a significant shift towards industrial and commercial compound land, showing a trend of industrial integration. At the same time, it reflects the transformation of the industrial form from the industrialization stage dominated by manufacturing to the post-industrialization stage dominated by service industries.
(3) The trend of decentralization and the balance of service facilities. The quantity of public service land has significantly decreased in both stages, and some has transformed into composite land for public services and other functions. In the second stage (2014–2022), a portion of commercial land was also transformed into composite and mixed land for commercial and other functions, such as the TOD business model formed by commercial transportation integration. The gradual mixing and diversification of urban land use functions has a broad and universal demand for commercial and public service facilities, making the layout of service facilities more dispersed and balanced.
4.2.2. Evolution of Spatial Distribution Patterns of Various Types of Land Use Functions
- (1)
- Evolution of the overall distribution pattern
(1) The distribution of different land use types is characterized by small agglomerations and wide dispersion. That is to say, specific types of land will cluster into specific functional areas within a small area, but for the overall space, the distribution of various functional types is relatively scattered. The dispersion of layout tends to strengthen over time. (2) The area of space used for mixed functions has significantly increased, and the layout tends to be balanced. (3) In terms of daily life, there are fewer zoning units with residential functions as the sole function, and the residential functions are often integrated with other functional layouts. (4) From 2008 to 2022, the number of green spaces has been continuously increasing, and the number of green POIs in non-construction areas has increased (see Figure 5).
- (2)
- Evolution of industrial distribution patterns
Due to the importance of industrial land use in the interaction and integration of land use functions in Shenzhen and Dongguan, the spatial pattern of industrial land use will be analyzed separately, as follows:
(1) Commercial land is laid out in areas with dense road networks, showing a trend from small-scale clustering to continuous spreading across boundaries. In 2008, commercial land was concentrated in towns or subdistricts within the cities of Shenzhen and Dongguan, with a scattered overall pattern. The year 2014 saw an outward expansion of the centralized layout, and a trend of cross-administrative distribution within the city limits began to emerge, such as in Shajing, Xinqiao, and Fuhai in Shenzhen. By 2022, the continuity of commercial functions had increased, and commercial land had expanded across administrative boundaries within the municipal area. Additionally, there is an increase in commercial land at the boundary between the two cities, which indicates, to some extent, the integration of the two cities. In the west, there is no significant change in commercial land, showing a localized expansion or contraction, while the expansion in the eastern region is more significant.
(2) The contraction of industrial land shows a trend from contiguous layout to sporadic distribution. In 2008, a large area was concentrated at the junction of two cities and Qingxi Town. In 2014, it was sporadically laid out, and then, in 2022, it was concentrated on a small scale. There is basically no single type of industrial land.
(3) Correspondingly, there is the layout of industrial and commercial composite land. In 2014, industrial and commercial composite land was widely distributed at the junction of Shenzhen and Dongguan, including Dalingshan, Yanluo, Dalang, Xinhu, Huangjiang, etc. By 2022, the industrial and commercial composite land will be further expanded, mainly along the Dalingshan–Yanluo–Dalang–Xinhu–Huangjiang area, and the layout at the boundaries will be more intensive and continuous, forming an industrial integration belt. From the perspective of the development of industrial land on the boundary, under the influence of market-oriented factors and government guidance, the two cities have gradually broken the mindset of existing administrative region development, become more open, inclusive, and mutually beneficial, strengthened the flow of regional resource elements and industrial transfer, reshuffled, and promoted the development of cross-boundary regions. The Shajing and Songgang Subdistricts in Bao’an District, the Guanlan, Guanhu, and Pinghu Subdistricts in Longhua District on the Shenzhen side, as well as Chang’an Town, Tangxia Town, and Fenggang Town on the Dongguan side, have formed a continuous cross-boundary enterprise cluster. The Songshan Lake area in Dongguan has formed an enterprise cluster located on one side of the boundary (see Figure 6).
To summarize, around 2008, due to the influence of land rent levels, commercial land in the cross-boundary area was distributed in dots and clustered in the center of subdistrict units, while industrial land was clustered in patches. With the expansion in population activities from the city center to the periphery, the saturation of land use, and the increase in land prices, commercial land began to appear in a new pattern of linear and patchy distribution, and it began to cross the administrative boundaries among cities. The industrial land was transformed into scattered industrial-commercial composite land. By 2022, a relatively balanced distribution pattern had formed, and the boundary effect tended to be less obvious. Regardless of topographical factors in the central region, both commercial and mixed-use land show linear or contiguous spatial patterns (see Figure 7).
4.2.3. Mixing Degrees of Land Use Functions
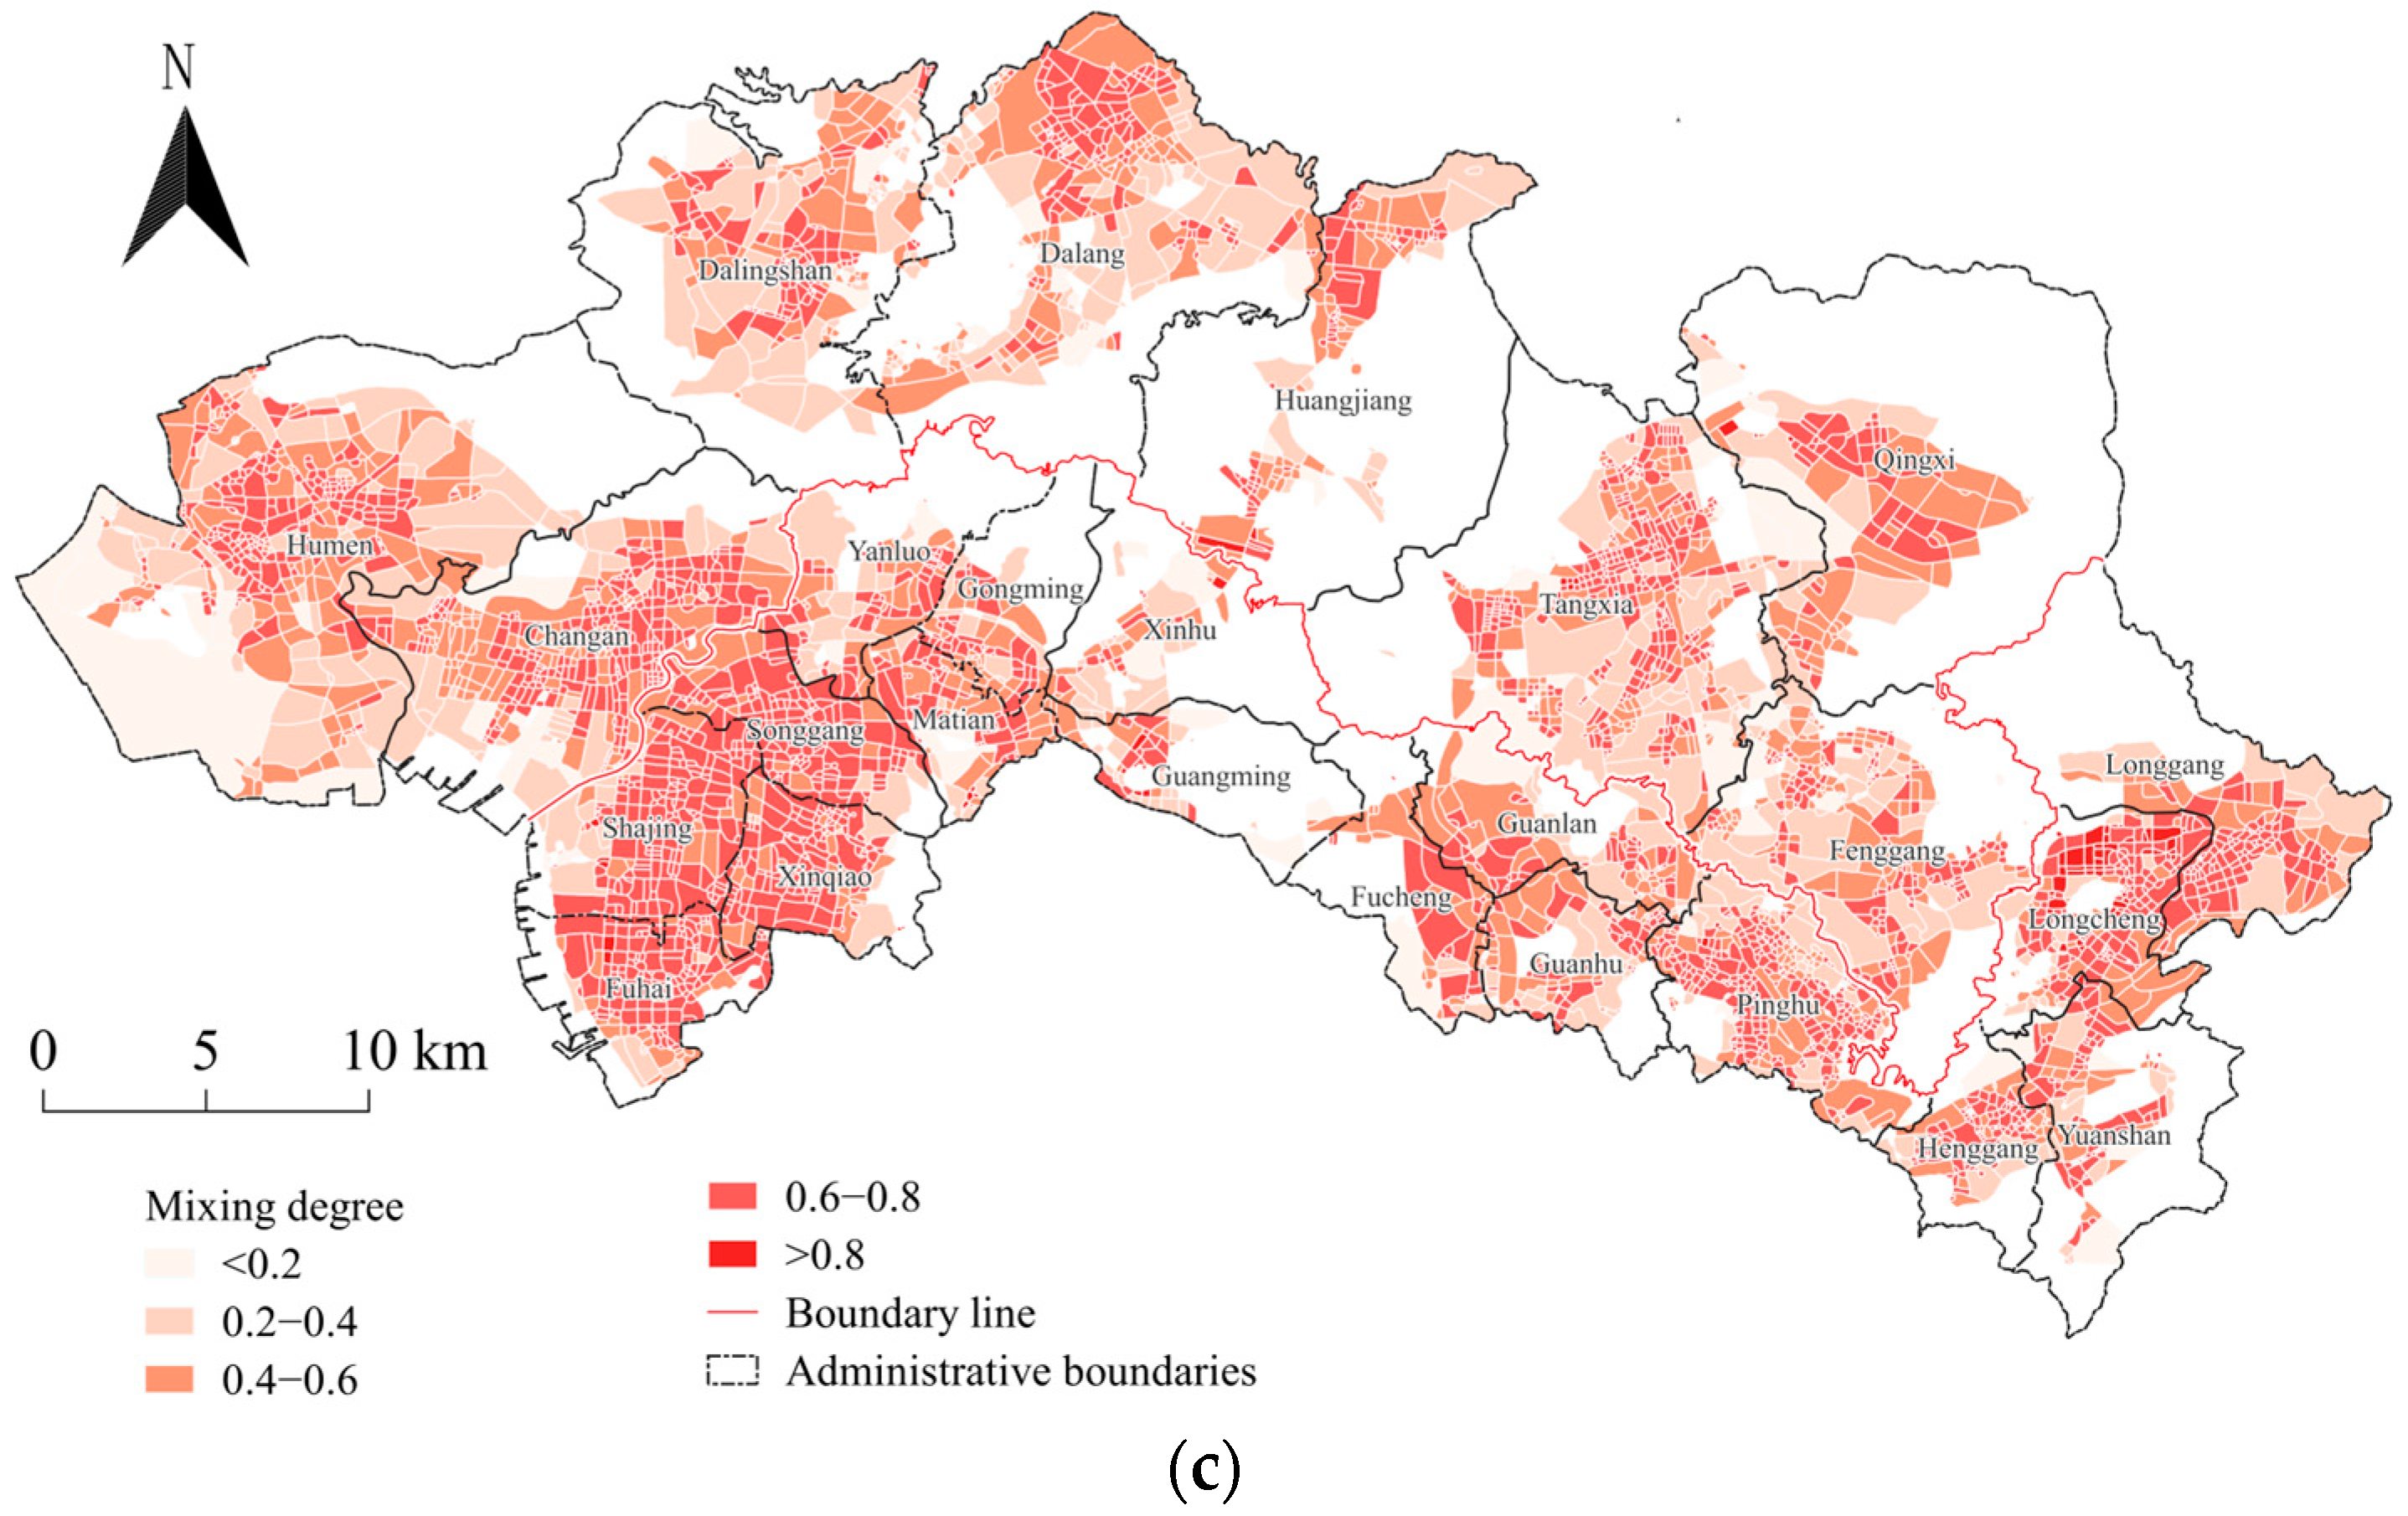
The mixing of land use functions is an important way of promoting the intensive and efficient use of land resources, strengthening spatial sharing and vitality, and optimizing spatial functional structure. The mixed functional use of land in cross-boundary areas indicates the interconnection and integration of spatial and functional structures between the two regions. Through the analysis of the mixing degree of land use functions, it was found that the mixing degree is relatively high at the boundary of the Chang’an–Shajing–Songgang area, and the functional structure is relatively complete, which is conducive to attracting an employable population; the mixed land use in the Tangxia–Fenggang–Guanlan–Pinghu area is relatively low, indicating an almost singular type of function. From the long-term evolution, it can be seen that the overall land use mixing degree has significantly improved from 2008 to 2014; meanwhile, from 2014 to 2022, the mixing degree on the Shenzhen side has mainly increased, and there has been a certain degree of weakening on the Dongguan side (see Figure 8).
The degree of functional mix of land use is closely related to the density of population and economic activities, the connectivity of transportation networks, as well as forming the basis of regional development and policy guidance. To a certain extent, the higher the mixing degree of land use types, the stronger the concentration of population and economic factors, and the closer the interaction between the two cities.
4.3. An Analysis of Factors Influencing the Functional Pattern of Land Use
The characteristics of urban land use in cross-boundary regions are complex and in a state of dynamic change. This complexity and dynamism are the result of the interaction and joint influence of various human and land factors. This paper analyzes the factors influencing the formation and evolution of land use patterns through relevant policies, economic and industrial factors, transport and population factors, and ecological factors.
4.3.1. Policy Guidance
- (1)
- Multi-functional mixing of various types of land use
Under the requirements of relevant policies, the functions of regional land use are showing a diversified trend (see Table 4). Under the background of the Guangdong–Hong Kong–Macao Greater Bay Area actively exploring the integration of production, urbanization, and industries, the mixed model of land function is gradually replacing the single model. In addition to the requirement of mixed land use types, the Guangdong–Hong Kong–Macao Greater Bay Area and municipalities have actively explored the construction of livable, business-friendly, and tourism-friendly living circles in recent years. The practice of concepts such as N-minute living circles and community quality living circles has deepened the degree of mixing of land use types, and the mixed layout of residential land, commercial service land, public service land, etc. has provided residents with more balanced and convenient services. Therefore, the proportions and areas of comprehensive functional types of land in the region are increasing year by year, and the layout of commercial services, public services, green squares, transportation facilities, and other land is more dispersed and balanced, in line with the urban development policy requirements of land use composite utilization, industrial city integration, and the construction requirements of community living circles under the people-oriented orientation.
- (2)
- Integration of industrial land use
Against the backdrop of the transformation and upgrading of traditional industries and the innovative development of emerging industries, the demand for land use has changed, showing a shift from the horizontal industrial flat layout to the vertical industrial three-dimensional layout, as well as a shift from a single independent functional structure to a mixed interactive functional space. Among these changes, relevant policies propose requirements for the integration of industries, especially secondary and tertiary industries. To be more specific, it is recommended to increase the supply of mixed industry land and further strengthen the layout of industrial land, guiding the aggregation and layout of high-quality resources and major projects [55]. For example, the relevant policy positioning of Humen Town is as a convergence center of both modern services and advanced manufacturing. Promoted by the policy, Humen Town is actively exploring the integration of the second and third industries, specifically including the construction of industrial R&D, exhibition, and marketing centers, as well as creating a modern industry cluster involving headquarters’ economy, R&D, design, and business exhibitions.
4.3.2. Economic Factors
Economic factors are the main factors influencing the differentiation of urban functional areas. Market-oriented forces promote the reorganization of the layout of industrial land in the two cities. Since 1980, Shenzhen has entered a period of industrial transformation and upgrading, and some production capacity has begun to shift to Dongguan. During this period, the level of land rent influenced the pattern of land use in the fringe areas of the two cities. The main factors affecting the level of land rent are proximity to the city center and accessibility; therefore, the level of land rents at the edge of Dongguan city are suitable for the layout of industrial land in a large area. The two cities were initially linked thanks to spatial proximity and low-cost, unsaturated land in the fringe areas of Dongguan, which can be called “hinterlandization”. After the 2008 financial crisis, the general commercial service industry gathered on the outskirts of Shenzhen, and the manufacturing space showed a trend of overflowing to Dongguan. Therefore, since 2008, most of the land with industrial attributes has been located in Dongguan or at the boundary between Shenzhen and Dongguan. According to the relevant data from the enterprise database, the spatial agglomeration degree of wholesale and retail industries and manufacturing industries at the Shenzhen–Dongguan boundary is relatively high, reflecting the overall industrial attributes of the Shenzhen–Dongguan cross-boundary region as a manufacturing base. The clustering level of general service industry enterprises on the Dongguan side is still lower than that on the Shenzhen side, while the clustering level of manufacturing industry on the Dongguan side of the boundary area is higher than that on the Shenzhen side.
Since 2014, Dongguan has accelerated its efforts to absorb the spillover of Shenzhen’s industries. Due to the larger scale of forward and backward production cooperation among enterprises in Shenzhen and Dongguan, they have chosen similar locations, leading to the phenomenon of spatial agglomeration of enterprises, especially among manufacturing, wholesale and retail, information transmission, scientific research, technical services, real estate, and other enterprises. As a result, an increasing number of mixed business models have emerged. Additionally, the working population tends to prefer more diverse, flexible, and free functional spaces, such as production and life. Leading companies such as Huawei, OPPO, VIVO, and BYD will stimulate cross-boundary areas as important employment opportunities that provide a large number of high-quality jobs and attract talent resources, as well as economically fertile soil for cultivating upstream- and downstream-related industries. The cross-boundary employment residential clusters and industrial ecological communities formed around these leading enterprises, such as large real estate companies like Country Garden, China Resources, Vanke, Poly, Jindi, and Rongchuang, will be constructed in Songshan Lake or surrounding towns, thereby transforming industrial land into composite land that integrates industrial, commercial, residential, and public service functions, forming a new regional spatial landscape. Driven by market forces, it shows that (1) there is a shift from industrial to service industries; (2) there is a gradual boundary-breaking expansion of commercial land; and (3) mixed industrial-commercial land replaces industrial land, mostly distributed on the Dongguan side.
4.3.3. Transportation and Population Factors
The optimization of the transportation infrastructure promotes the compact development of various types of functional land in the region. The opening of intercity railroads, highways, bridges, subways, and other transportation routes has strengthened inter-city links, reinforced the degree of integration of the fringe districts of the two regions, and laid the foundation for the cross-boundary development of various types of functional land. The construction of large-scale transportation facilities improves the accessibility of the areas along the routes, thus driving the development of these areas and influencing the functional organization of land use in the region. After the opening of major transportation arteries on both the east and west sides of the region, Chang’an, Tangxia, Huangjiang, and Qingxi in Dongguan City have become places for Shenzhen staff to live. The “tidal wave” of migration between Shenzhen and Dongguan has resulted in greater land space and demand for commercial and public services.
As population growth and mobility drive the demand for a range of socio-economic activities such as employment, consumption, housing, travel, and so on, population density influences the number, size, and layout of employment- and service-related land. With the demarginalization of the region, the population and economic activities are gradually spreading from the city center to the cross-boundary regions and are mainly distributed in the cross-boundary clusters on the east and west sides. This has led to the transformation of large areas of industrial land into scattered industrial-commercial land, and the original small clusters of commercial land have begun to spread.
4.3.4. Ecological Factors
Dongguan is characterized by high terrain in the southeast and low terrain in the northwest, with many mountains in the south, especially in the southeast, including Huangqi Mountain, Daling Mountain, Daping Roach, and Yinbashan Mountain. The mountains are huge, deeply divided, and concentrated into pieces, with large undulations and elevations of 200 to 600 m, which to a large extent block the functional connection between the east and west sides of the region’s land use. The higher elevations throughout the central part of the region act as a barrier to development between east and west. That is why the central part of the region has little and fragmented built-up land and has a low functional mix.
5. Discussion
5.1. Exploration of Research Findings and Contributions
The integration and functional agglomeration of cross-boundary urban spaces has long been a concern of geography [56]. The concepts of Satellite City, Twin City [57], Sister City [58], Cross-border Regional Production System [59], Binational City [60], etc. are all manifested as special cross-border regions. The topic of land use functions in cross-border areas can be divided into multiple scales, including the national scale and the regional scale. Among them, there has been more discussion on the former. Many studies focus on the natural cover of such areas, for example, exploring land cover or ecological land use transitions in shared regions along the borders of the United States and Canada [61,62]. Land use in cross-border regions depends on the overall geopolitical situation and political relationships between countries, which is the most striking difference from cross-boundary regions on the regional scale [21]. On a regional scale, scholars have studied urban land use and functional division in different cross-boundary regions. In the cross-boundary region of Hong Kong and the hinterland, Guangdong Province, the importance of cooperation on land use is emphasized. As the economy in Hong Kong transforms into high-value-added manufacturing and advanced productive services, its labor-intensive and space-intensive industries are moving to its adjacent hinterland [63]. This situation is similar to the early allocation of industrial land in Shenzhen and Dongguan. The Tongzhou–Wuqing–Langfang (TWL) region, located at the intersection of Beijing, Tianjin, and Hebei in China, is a complex system. The dynamic of land use changes in this region is influenced by factors involving the market economy, national policies, population migration, and infrastructure development, and on top of that, administrative boundaries also have an impact on regional land use [64]. Compared with Beijing–Tianjin–Hebei, the cross-boundary regions in the Pearl River Delta region experience less influence from administrative boundaries; thus, the development is more likely to be driven by market factors. In the Pearl River Delta region, the spatial evolution of the cross-boundary areas between Guangzhou and Foshan has received extensive attention from scholars [65,66], and the content of this research has become relatively mature compared to Shenzhen and Dongguan. Due to the relatively flat topography of the Guangzhou–Foshan boundary, more commercial areas and ancillary facilities were built on both sides of the Guangzhou–Foshan city boundary [67], while there is a stronger limitation imposed by natural factors in the Shenzhen–Dongguan region.
According to the theory of spatial interaction, the complementarity of two cities is one of the basic conditions for the formation of spatial interactions and interdependences [68]. There are strong functional complementarities between Shenzhen and Dongguan, especially in industrial development, thus forming a natural cross-boundary space of interdependence between the two. Unlike a single administrative region, the evolution of space and function in cross-boundary areas is the result of a combination of market factor flows, social integration, natural obstacles, and administrative control, making their spatial characteristics more complex. The cross-boundary area of Shenzhen and Dongguan is subject to the double barriers of natural and administrative boundaries. On the one hand, the boundary between the two cities is located in a mountainous area with a large proportion of ecological land, which creates a certain barrier to cross-boundary development; on the other hand, there are differences in the administrative systems and policy mechanisms of the two cities, which also create barriers.
In this study, we synthesized multiple sources of data and analysis methods to comprehensively and objectively present the spatial structure and characteristics of urban land use functions in the cross-boundary area of Shenzhen and Dongguan. On the one hand, this study conforms to the research trend of scholars on cross-boundary regions, provides certain supplements for the relevant research fields of the Shenzhen metropolitan area, and enriches the existing regional spatial research of the Guangdong–Hong Kong–Macao Greater Bay Area. On the other hand, it provides a relatively complete research approach for exploring regional spatial characteristics, integrating and enriching the current research models for spatial characteristics. The selection of research units is in line with the current trend of domestic scholars shifting from large-scale to refined-scale exploration. Through a series of explorations and analyses, the evolution of the spatial pattern of land use and its influencing factors in the current cross-boundary areas of Shenzhen and Dongguan can be identified, which is helpful for proposing development suggestions and improving relevant policies in the future.
5.2. Future Development Orientation of the Region
In terms of planning and management, scholars have suggested that there are “transborder spillovers” in the transboundary areas of the United States and Mexico and that land use decisions are therefore important. It is argued that strengthening cross-border planning and coordination requires decentralization, for example, through encouraging the emergence of more transboundary planning bodies [22].
In 2019, the “Development Plan for the Guangdong–Hong Kong–Macao Greater Bay Area” was promulgated, which called for Shenzhen and Dongguan to create a new pattern of deep integration [69]. With the acceleration of the construction of the Shenzhen metropolitan area, Dongguan and Shenzhen will usher in a new era of significant integration, and the two places will join hands to become a pole in the global bay area economy, so the discussion of their cross-boundary regions has become important. In the future, the cross-boundary areas of Shenzhen and Dongguan should follow the following development trends: (1) Adapt to the compact development of urban land, enhance the integration of land functions on both sides, deepen integration, and form an interlocking pattern. In addition, appropriately intervene in government efforts to strengthen the hard and soft connectivity between the two regions. (2) Mixed land is gradually replacing various types of single functional land, and the structure of urban land is becoming more complex and diverse. With the mutual growth in employment and residential land in the region, the consumer service needs of residents are gradually diversified. To meet the growing demand for daily life, land for commercial services, public services, transportation facilities, and other purposes will be further homogenized and decentralized. On the other hand, improving the functional complexity and three-dimensional layout of land use greatly enhances land use efficiency. (3) With the mixing of industrial land and the increasing demand for new industrial land, relevant industrial enterprises should focus on upgrading their internal industrial structure, reducing environmental pollution such as air and noise, and transforming and upgrading towards high-tech and innovative industries. (4) Some scholars have cited borders as an advantage for cross-border regional development. Borders offer great opportunities for resource development and urban growth. Both sides of the border share a common hinterland, and their inhabitants have a common sense of belonging [70]. The cross-boundary region of Shenzhen and Dongguan can be managed as a unified unit for land management, with the establishment of a separate cross-boundary agency and the decentralization of some powers. On the one hand, it should take into account the development strategies of the two cities, and on the other hand, it should be adapted to the future development direction of the cross-boundary region. (5) From the point of view of the development differences between Dongguan and Shenzhen, the current spatial structure on the Dongguan side is still driven by the support from the core cluster, relying on the integration of material space and industrial and economic space with the Shenzhen side, and has not yet formed its own networked structure. In terms of industrial structure, it is relatively loose and unsystematic, and its own industrial development relies more on the Songshan Lake Industrial Park. The Outline of the Medium and Long Term Development Plan for Dongguan’s Modern Industrial System (2020–2035) states that Dongguan lacks high-quality industrial clusters, and currently only the Songshan Lake high-tech Zone has formed an initial scale of innovative industrial clusters. The reason for this is the homogenization and dispersion of urban space layout and the difficulty of integrating land resources. Therefore, in the future, cross-boundary regions should mobilize more initiatives from Dongguan, integrate high-quality resources, and establish connections with Shenzhen.
5.3. Limitation
There are still deficiencies in this study; for example, the determination of the weights of various POIs is somewhat subjective. In the future, POI data can be combined with the remote sensing identification of building units to assign area attributes to POIs and quantitatively assign weights to areas. In addition, the exploration of influencing factors can be further combined with suitable quantitative methods in the future to consider more comprehensive influencing mechanisms.
6. Conclusions
Based on multi-source data and from the perspective of evolution, the spatial and functional characteristics of the cross-boundary area in Shenzhen and Dongguan were analyzed and concluded as follows:
(1) The intensity of economic activities in the cross-boundary region spreads from Shenzhen to Dongguan and gradually transitions from the west to the east, with a spatial structure gradually presenting multi-core, axial, and networked development. As the central region is subject to natural conditions, integrative development is slow. The connection between Songshan Lake Science City and Guangming Science City in Shenzhen will drive a new round of cross-boundary integration development in the central region.
(2) The land use functions are gradually showing a trend of diversification, mixing, and dispersion, with a significant increase in mixed-function land. The layout of commercial services, public services, green squares, transportation facilities, and other land uses is more dispersed and balanced, in line with urban development policies such as composite utilization of land uses, integration of industrial and residential land, and the construction of community living circles under the people-centered orientation.
(3) The layout of industrial land is characterized by the cross-boundary expansion of commercial land and the transformation from large-scale industrial land into industrial–commercial composite land, whose concentration is at the edge of two cities. This evolutionary trend is a reflection of the integration of the secondary and tertiary industries, in line with the needs of new industrial land use (M0) and industrial integration.
(4) The mixing degree of land use functions in cross-boundary areas has improved as a whole, with a higher mixing degree and a more complete functional structure in the Chang’an–Shajing–Songgang area, while the mixed land use in the Tangxia–Fenggang–Guanlan–Pinghu area is relatively low, indicating an almost singular type of land use.
(5) The Shenzhen–Dongguan cross-boundary region is a complex system influenced by factors involving the market economy, policy guidance, population migration, infrastructure development, and ecology.
Author Contributions
Conceptualization, T.C. and W.L.; writing—original draft preparation, L.W.; visualization, L.W.; revising, L.W. and T.C.; supervision, T.C. and W.L. All authors have read and agreed to the published version of the manuscript.
Funding
This research was funded by the National Natural Science Foundation of China (42371206, 418001161, 418001163).
Data Availability Statement
The original contributions presented in the study are included in the article, further inquiries can be directed to the corresponding author.
Acknowledgments
The authors appreciate the editors’ and anonymous reviewers’ comments and suggestions.
Conflicts of Interest
The authors declare no conflicts of interest. The funders had no role in the design of the study, in the collection, analysis, or interpretation of data, in the writing of the manuscript, or in the decision to publish the results.
References
- Opinions on Further Improving the Regional Coordinated Development Pattern and Promoting the Accelerated High-Quality Development of Southern Towns; Dongguan Municipal Committee: Dongguan, China, 2020.
- Chen, T.; Li, X. Cross-Boundary Cooperation and Changes in the Roles of Governments at Different Levels in China: A Case Study of the Guangzhou-Foshan Metropolitan Area. China City Plan. Rev. 2023, 4, 73–83. [Google Scholar] [CrossRef]
- Dadashpoor, H.; Malekzadeh, N. Evolving Spatial Structure of Metropolitan Areas at a Global Scale: A Context-Sensitive Review. GeoJournal 2022, 87, 4335–4362. [Google Scholar] [CrossRef]
- Ding, C.; Zhao, X. Land Market, Land Development and Urban Spatial Structure in Beijing. Land Use Policy 2014, 40, 83–90. [Google Scholar] [CrossRef]
- Johnson, C.M. Cross-Border Regions and Territorial Restructuring in Central Europe: Room for More Transboundary Space. Eur. Urban Reg. Stud. 2009, 16, 177–191. [Google Scholar] [CrossRef]
- Darwent, D.F. Growth Poles and Growth Centers in Regional Planning—A Review. Environ. Plan. A Econ. Space 1969, 1, 5–31. [Google Scholar] [CrossRef]
- Friedmann, J. Regional Development Policy: A Case Study of Venezuela; M.I.T. Press: Cambridge, MA, USA, 1966. [Google Scholar]
- Wang, C.; Liu, H.; Zhang, M.; Wei, Z. The Border Effect on Urban Land Expansion in China: The Case of Beijing-Tianjin-Hebei Region. Land Use Policy 2018, 78, 287–294. [Google Scholar] [CrossRef]
- Landry, A. Borders and Big Macs. Econ. Lett. 2013, 120, 318–322. [Google Scholar] [CrossRef]
- Quazi Mahtab Zaman, G.G.H. Border Urbanism: Transdisciplinary Perspectives; Springer: Cham, Switzerland, 2023. [Google Scholar] [CrossRef]
- Lee, B. “Edge” Or “Edgeless” Cities? Urban Spatial Structure in U.S. Metropolitan Areas, 1980 to 2000*. J. Reg. Sci. 2007, 47, 479–515. [Google Scholar] [CrossRef]
- Sohn, C.; Stambolic, N. The Urban Development of European Border Regions: A Spatial Typology. Soc. Sci. Open Access Repos. 2015, 4, 177–189. [Google Scholar]
- Chen, T.; Hui, C.; Tu, Y.; Land, W. Growth or Shrinkage: Discovering Development Patterns and Planning Strategies for Cross-Border Areas in China. J. Urban Plann. Deve. 2019, 147, 05021046. [Google Scholar] [CrossRef]
- Basse, R.M.; Charif, O.; Bódis, K. Spatial and Temporal Dimensions of Land Use Change in Cross Border Region of Luxembourg. Development of a Hybrid Approach Integrating GIS, Cellular Automata and Decision Learning Tree Models. Appl. Geogr. 2016, 67, 94–108. [Google Scholar] [CrossRef]
- Hartshorne, R. The Twin City District: A Unique Form of Urban Landscape. Geogr. Rev. 1932, 22, 431. [Google Scholar] [CrossRef]
- Medeiros, E. Territorial Impact Assessment and Cross-Border Cooperation. Reg. Stud. Reg. Sci. 2015, 2, 97–115. [Google Scholar] [CrossRef]
- Awad, S.Q.; Ghadban, S.S.; Wannan, S.R. The Emergence of Al-Manarah Square as a New Centre for the Twin Cities of Ramallah and Al-Bireh. Urban Des. Int. 2018, 23, 200–214. [Google Scholar] [CrossRef]
- Donahue, M.L.; Keeler, B.L.; Wood, S.A.; Fisher, D.M.; Hamstead, Z.A.; McPhearson, T. Using Social Media to Understand Drivers of Urban Park Visitation in the Twin Cities, Mn. Landsc. Urban Plan. 2018, 175, 1–10. [Google Scholar] [CrossRef]
- Ortega, E.; Lopez, E.; Monzon, A. Territorial Cohesion Impacts of High-Speed Rail Under Different Zoning Systems. J. Transp. Geogr. 2014, 34, 16–24. [Google Scholar] [CrossRef]
- Durand, F. Challenges of Cross-Border Spatial Planning in the Metropolitan Regions of Luxembourg and Lille. Plan. Pract. Res. 2014, 2, 113–132. [Google Scholar] [CrossRef]
- Bičík, I.; Kabrda, J. Land Use Changes in Czech Border Regions (1845–2000). Acta Univ. Carol. Geogr. 2007, 42, 23–52. [Google Scholar]
- Peña, S. Land Use Planning on the U.S.-Mexico Border: A Comparison of the Legal Framework. J. Borderl. Stud. 2002, 17, 1–19. [Google Scholar] [CrossRef]
- Hui, E.C.M.; Li, X.; Chen, T.; Lang, W. Deciphering the spatial structure of China’s megacity region: A new bay area—The Guangdong-Hong Kong-Macao Greater Bay Area in the making. Cities 2020, 105, 102168. [Google Scholar] [CrossRef]
- Luo, X.; Shen, J. The Making of New Regionalism in the Cross-Boundary Metropolis of Hong Kong-Shenzhen, China. Habitat Int. 2012, 36, 126–135. [Google Scholar] [CrossRef]
- Zhou, X.; Lang, W.; Yeh, A.G.; Niu, X. Understanding the compactness of employment activities in high-density cities through cellphone location data. Environ. Plan. B Urban Anal. City Sci. 2021, 48, 1398–1413. [Google Scholar] [CrossRef]
- Tao, Y.; Wang, Q. Quantitative Recognition and Characteristic Analysis of Production-Living-Ecological Space Evolution for Five Resource-Based Cities: Zululand, Xuzhou, Lota, Surf Coast and Ruhr. Remote Sens. 2021, 13, 1563. [Google Scholar] [CrossRef]
- Deng, J.S.; Wang, K.; Hong, Y.; Qi, J.G. Spatio-Temporal Dynamics and Evolution of Land Use Change and Landscape Pattern in Response to Rapid Urbanization. Landsc. Urban Plan. 2009, 92, 187–198. [Google Scholar] [CrossRef]
- Liu, J.; Jin, X.; Xu, W.; Fan, Y.; Ren, J.; Zhang, X.; Zhou, Y. Spatial Coupling Differentiation and Development Zoning Trade-Off of Land Space Utilization Efficiency in Eastern China. Land Use Policy 2019, 85, 310–327. [Google Scholar] [CrossRef]
- Liu, Y.; Luo, T.; Liu, Z.; Kong, X.; Li, J.; Tan, R. A Comparative Analysis of Urban and Rural Construction Land Use Change and Driving Forces: Implications for Urban–Rural Coordination Development in Wuhan, Central China. Habitat Int. 2015, 47, 113–125. [Google Scholar] [CrossRef]
- Röder, A.; Pröpper, M.; Stellmes, M.; Schneibel, A.; Hill, J. Assessing Urban Growth and Rural Land Use Transformations in a Cross-Border Situation in Northern Namibia and Southern Angola. Land Use Policy 2015, 42, 340–354. [Google Scholar] [CrossRef]
- Lang, W.; Lang, H.; Hui, E.C.; Chen, T.; Wu, J.; Jahre, M. Measuring urban vibrancy of neighborhood performance using social media data in Oslo, Norway. Cities 2022, 131, 103908. [Google Scholar] [CrossRef]
- Du, Z.; Zhang, X.; Li, W.; Zhang, F.; Liu, R. A Multi-Modal Transportation Data-Driven Approach to Identify Urban Functional Zones: An Exploration Based on Hangzhou City, China. Trans. GIS 2020, 24, 123–141. [Google Scholar] [CrossRef]
- Yuan, N.J.; Zheng, Y.; Xie, X.; Wang, Y.; Zheng, K.; Xiong, H. Discovering Urban Functional Zones Using Latent Activity Trajectories. IEEE Trans. Knowl. Data Eng. 2015, 27, 712–725. [Google Scholar] [CrossRef]
- Lang, W.; Hui, E.C.; Chen, T.; Li, X. Understanding livable dense urban form for social activities in transit-oriented development through human-scale measurements. Habitat Int. 2020, 104, 102238. [Google Scholar] [CrossRef]
- Gao, S.; Janowicz, K.; Couclelis, H. Extracting Urban Functional Regions from Points of Interest and Human Activities on Location-Based Social Networks. Trans. GIS 2017, 21, 446–467. [Google Scholar] [CrossRef]
- Huang, C.; Xiao, C.; Rong, L. Integrating Point-of-Interest Density and Spatial Heterogeneity to Identify Urban Functional Areas. Remote Sens. 2022, 14, 4201. [Google Scholar] [CrossRef]
- Lang, W.; Pan, M.; Wu, J.; Chen, T.; Li, X. The patterns and driving forces of uneven regional growth in ASEAN countries: A tale of two Thailands’ path toward regional coordinated development. Growth Change A J. Urban Reg. Policy 2021, 52, 130–149. [Google Scholar] [CrossRef]
- Niu, H.; Silva, E.A. Delineating Urban Functional Use from Points of Interest Data with Neural Network Embedding: A Case Study in Greater London. Comput. Environ. Urban Syst. 2021, 88, 101651. [Google Scholar] [CrossRef]
- Zhou, W.; Ming, D.; Lv, X.; Zhou, K.; Bao, H.; Hong, Z. So–Cnn Based Urban Functional Zone Fine Division with Vhr Remote Sensing Image. Remote Sens. Environ. 2020, 236, 111458. [Google Scholar] [CrossRef]
- Kang, Y.H.; Wang, Y.Y.; Xia, Z.J.; Chi, J.; Jiao, L.M.; Wei, Z.W. Identification and Classification of Wuhan Urban Districts Based on POI. J. Geomat. 2018, 43, 81–85. [Google Scholar]
- The International Congresses of Modern Architecture (CIAM). The Charter of Machu Picchu. J. Archit. Res. 1979, 7, 5–9. [Google Scholar]
- Pérez-Soba, M.; Petit, S.; Jones, L.; Bertrand, N.; Briquel, V.; Omodei-Zorini, L.; Contini, C.; Helming, K.; Farrington, J.H.; Mossello, M.T.; et al. Land Use Functions—a Multifunctionality Approach to Assess the Impact of Land Use Changes on Land Use Sustainability. Sustain. Impact Assess. Land Use Changes 2008, 375–404. [Google Scholar] [CrossRef]
- Dovey, K.; Pafka, E. What is Functional Mix? An Assemblage Approach. Plan. Theory Pract. 2017, 18, 249–267. [Google Scholar] [CrossRef]
- Purvis, B.; Mao, Y.; Robinson, D. Entropy and its Application to Urban Systems. Entropy 2019, 21, 56. [Google Scholar] [CrossRef]
- Yang, J.; Huang, X. The 30 M Annual Land Cover Dataset and its Dynamics in China From 1990 to 2019. Earth Syst. Sci. Data 2021, 13, 3907–3925. [Google Scholar] [CrossRef]
- GB 50137-2011; Code for Classification of Urban Land Use and Planning Standards of Development Land. Ministry of Housing and Urban-Rural Development: Beijing, China, 2010. Available online: https://www.planning.org.cn/law/uploads/2013/1383993139.pdf (accessed on 3 April 2023).
- Borruso, G. Network Density Estimation: A Gis Approach for Analysing Point Patterns in a Network Space. Trans. GIS 2008, 12, 377–402. [Google Scholar] [CrossRef]
- Zhao, W.F.; Li, Q.Q.; Li, B.J. Extracting hierarchical landmarks from urban POI data. Natl. Remote Sens. Bull. 2011, 15, 973–988. [Google Scholar]
- Huang, Y.H.; Liu, H.Y.; Deng, S.H.; Chen, H.S. Cross Boundary Programming of Shenzhen-Dongguan-Huizhou Metropolitan Area from the Perspective of Balanced Development. Planners 2022, 38, 52–60. [Google Scholar]
- National Plan on New Urbanization; The Central Committee of the Communist Party of China (CPC) and the State Council: Beijing, China, 2014.
- Several Opinions on Further Strengthening the Management of Urban Planning and Construction; The Central Committee of the Communist Party of China (CPC) and the State Council: Beijing, China, 2016.
- Several Opinions on Expanding and Optimizing Urban Development Space and Accelerating the Promotion of High-Quality Development; The People’s Government of Dongguan Municipality: Dongguan, China, 2019.
- Shenzhen Territorial Spatial Masterplan (2020–2035); Shenzhen Planning and Natural Resources Bureau: Shenzhen, China, 2021.
- The 14th Five-Year Plan for the Protection and Development of Territorial Spatial Planning in Shenzhen Municipality; The People’s Government of Shenzhen Municipality: Shenzhen, China, 2022.
- Opinions on Supporting Guangdong, Hong Kong and Macao Bay Area and Shenzhen Municipality to Deepen Reform and Exploration in the Field of Natural Resources; Ministry of Natural Resources, People’s Republic of China: Beijing, China, 2020.
- Reitel, B. Les Agglomérations Transfrontalières: Des Systèmes Urbains En Voie D’intégration?: Les Espaces Urbains De La “Frontière” Du Territoire Français. Geogr. Helv. 2007, 62, 5–15. [Google Scholar] [CrossRef]
- Anishenko, A.G.; Sergunin, A.A. Twin Cities: A New Form of Cross-Border Cooperation in the Baltic Sea Region? Baltic Region. 2012, 4, 19–27. [Google Scholar] [CrossRef]
- Ersavaş Kavanoz, S.; Erdem, N. The Sister City in the Context of City Entrepreneurship in the Glocal Process: The Sample of Trabzon-Zigetvar. Int. J. Political Sci. Urban Stud. 2019, 7, 191–208. [Google Scholar] [CrossRef]
- Tsui Auch, L.S. Regional Production Relationships and Developmental Impacts: A Comparative Study of Three Production Networks. Int. J. Urban Reg. Res. 2002, 23, 329–344. [Google Scholar] [CrossRef]
- Buursink, J. The Binational Reality of Border-Crossing Cities. GeoJournal 2001, 54, 7–19. [Google Scholar] [CrossRef]
- Eaton-Gonzalez, R.; Mellink, E. One Shared Region and Two Different Change Patterns: Land Use Change in the Binational Californian Mediterranean Region. Land 2015, 4, 1138–1154. [Google Scholar] [CrossRef]
- Ojeda-Revah, L.; Bocco, G.; Ezcurra, E.; Espejel, I. Land-Cover/Use Transitions in the Binational Tijuana River Watershed during a Period of Rapid Industrialization. Appl. Veg. Sci. 2008, 11, 107–116. [Google Scholar] [CrossRef]
- Jessop, B.; Sum, N. An Entrepreneurial City in Action: Hong Kong’s Emerging Strategies in and for (Inter)Urban Competition. Urban Stud. 2000, 37, 2287–2313. [Google Scholar] [CrossRef]
- Dai, L.; Zhan, Z.; Shu, Y.; Rong, X. Land Use Change in the Cross-Boundary Regions of a Metropolitan Area: A Case Study of Tongzhou-Wuqing-Langfang. Land 2022, 11, 153. [Google Scholar] [CrossRef]
- Lin, J.; Wu, W. Investigating the Land Use Characteristics of Urban Integration Based on Remote Sensing Data: Experience from Guangzhou and Foshan. Geocarto Int. 2019, 34, 1608–1620. [Google Scholar] [CrossRef]
- Huang, Y.; Lang, W.; Chen, T.; Wu, J. Regional Coordinated Development in the Megacity Regions: Spatial Pattern and Driving Forces of the Guangzhou-Foshan Cross-Border Area in China. Land 2023, 12, 753. [Google Scholar] [CrossRef]
- Lang, W.; Long, Y.; Chen, T. Rediscovering Chinese cities through the lens of land-use patterns. Land Use Policy 2018, 79, 362–374. [Google Scholar] [CrossRef]
- Ullman, E.L. American Commodity Flow; University of Washington Press: Seattle, WA, USA, 1957. [Google Scholar]
- Outline Development Plan for the Guangdong-Hong Kong-Macao Greater Bay Area; The Central Committee of the Communist Party of China (CPC) and the State Council: Beijing, China, 2019.
- Sohn, C. The Border as a Resource in the Global Urban Space: A Contribution to the Cross-Border Metropolis Hypothesis. Int. J. Urban Reg. Res. 2014, 38, 1697–1711. [Google Scholar] [CrossRef]
Figure 1.
The location of this study area.

Figure 2.
The analytical framework of this study.
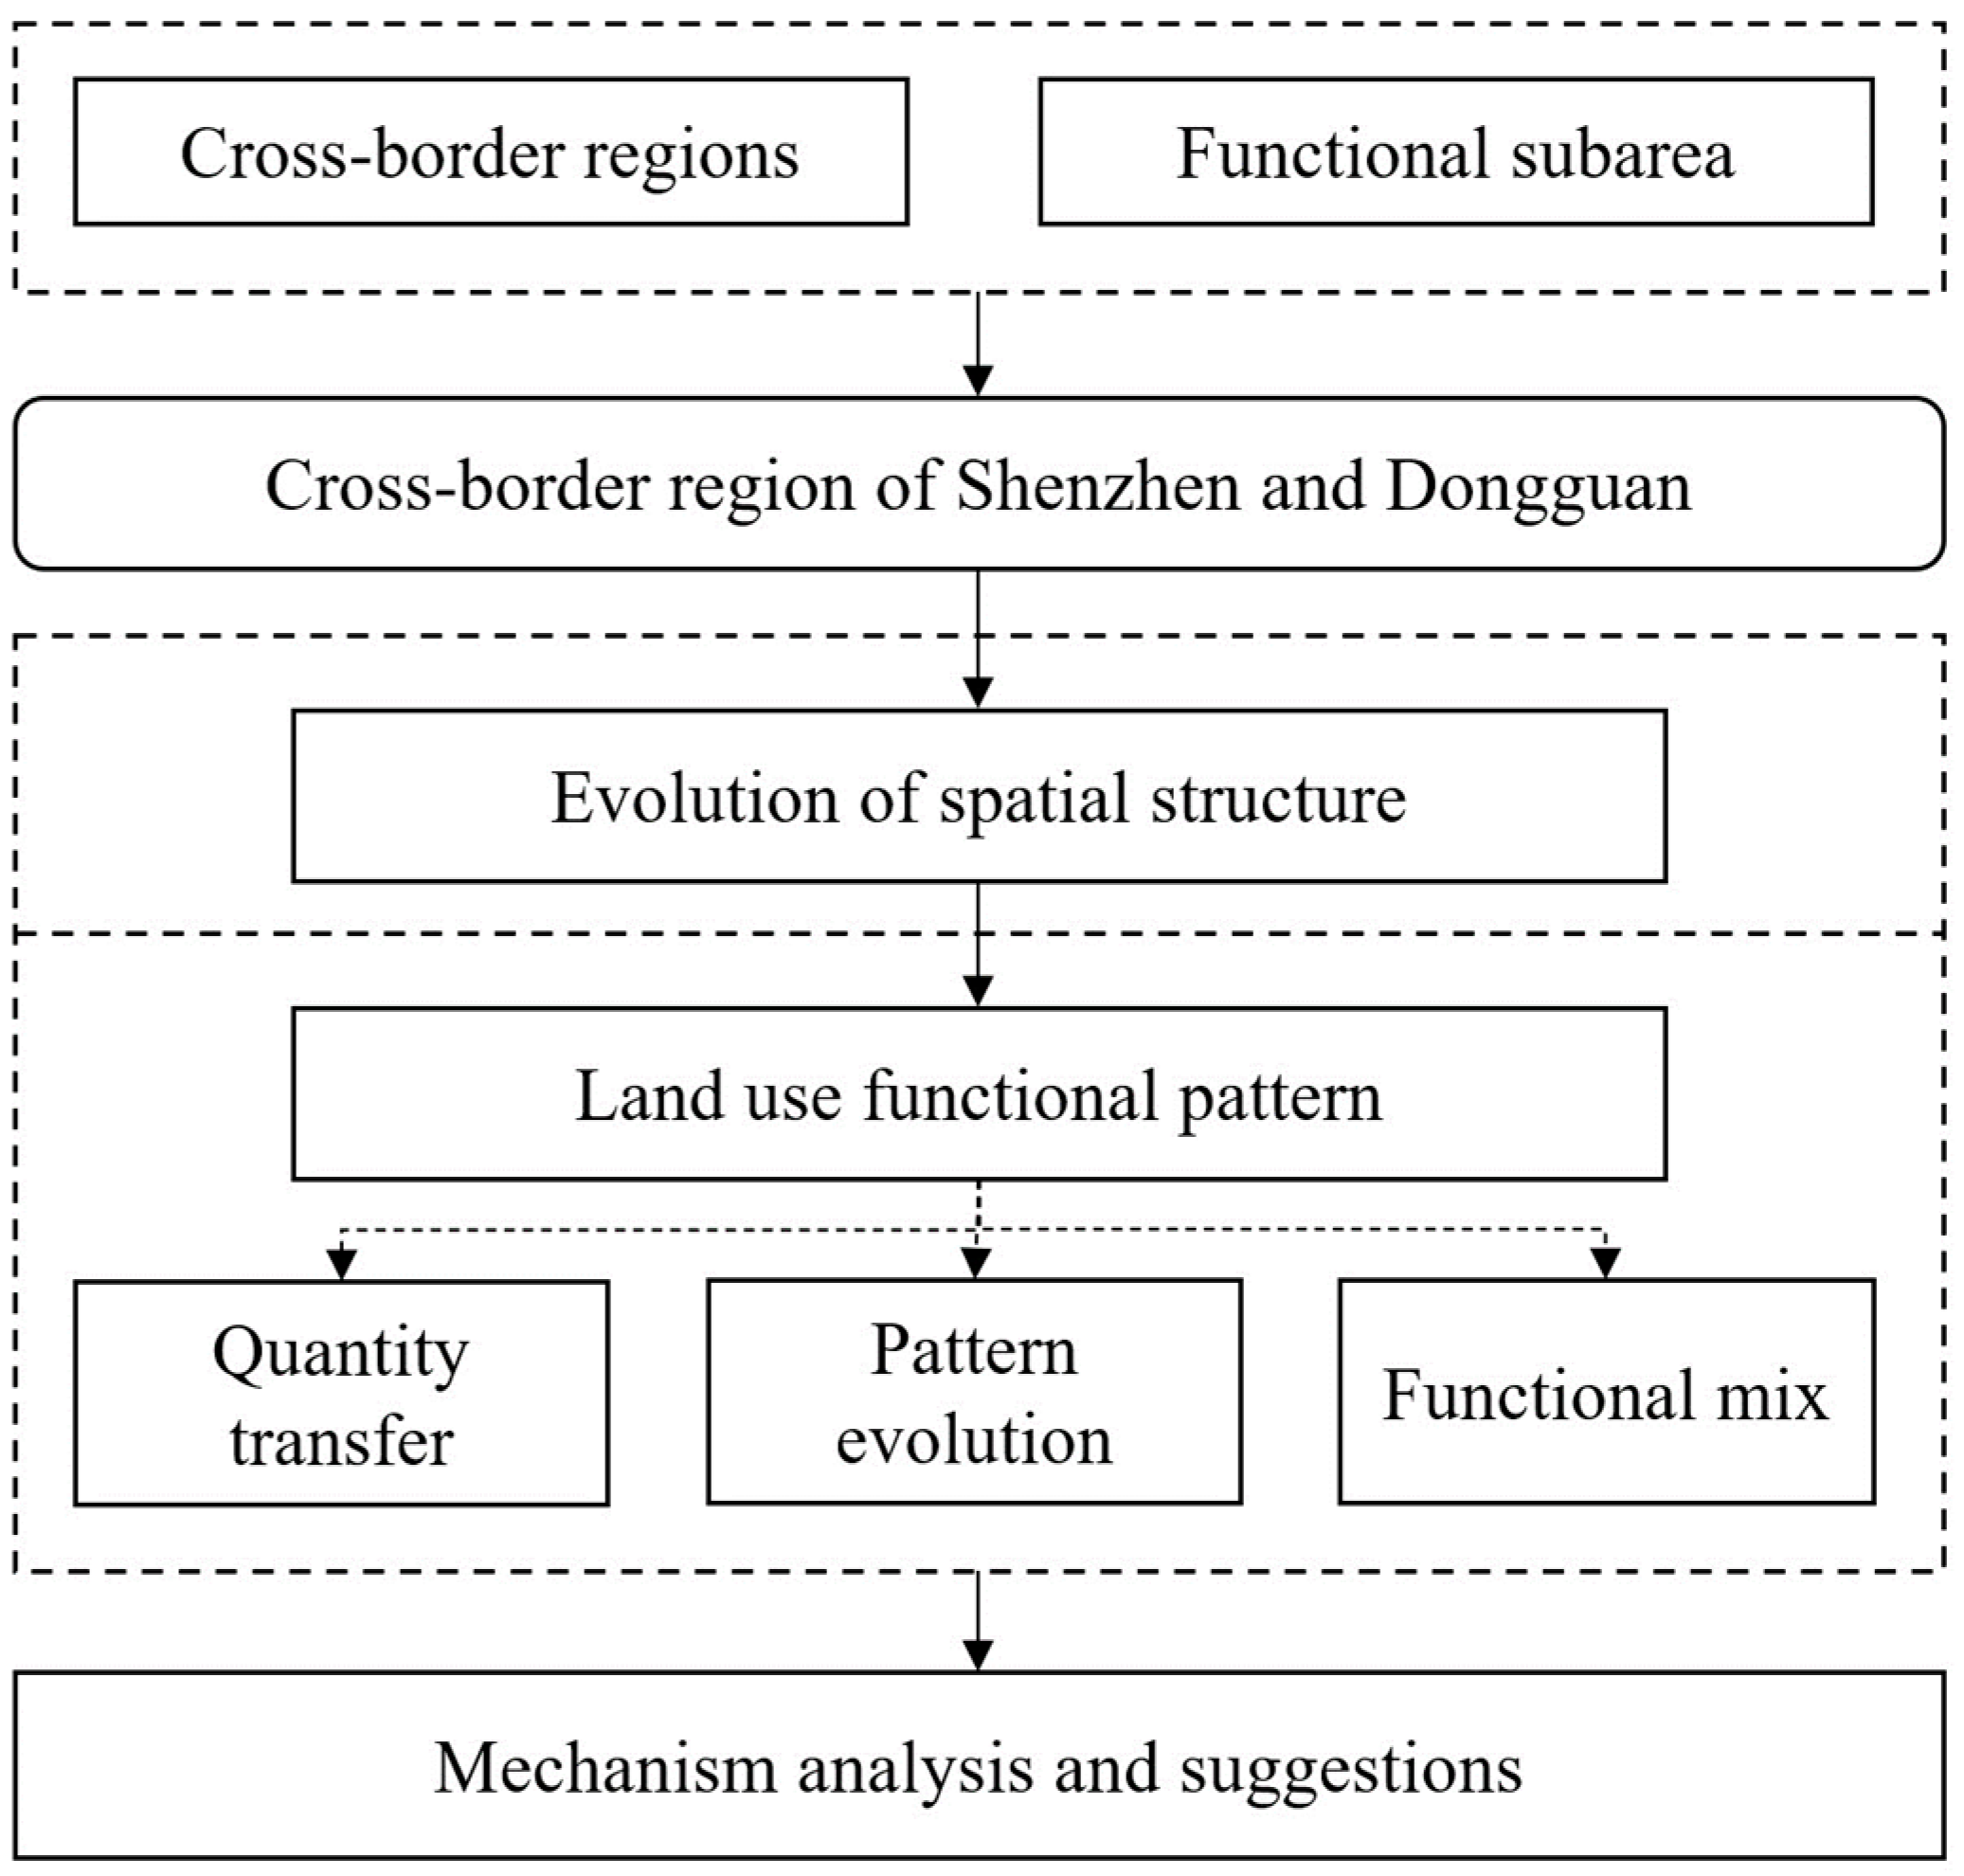
Figure 3.
Conceptual graph of spatial growth structure.
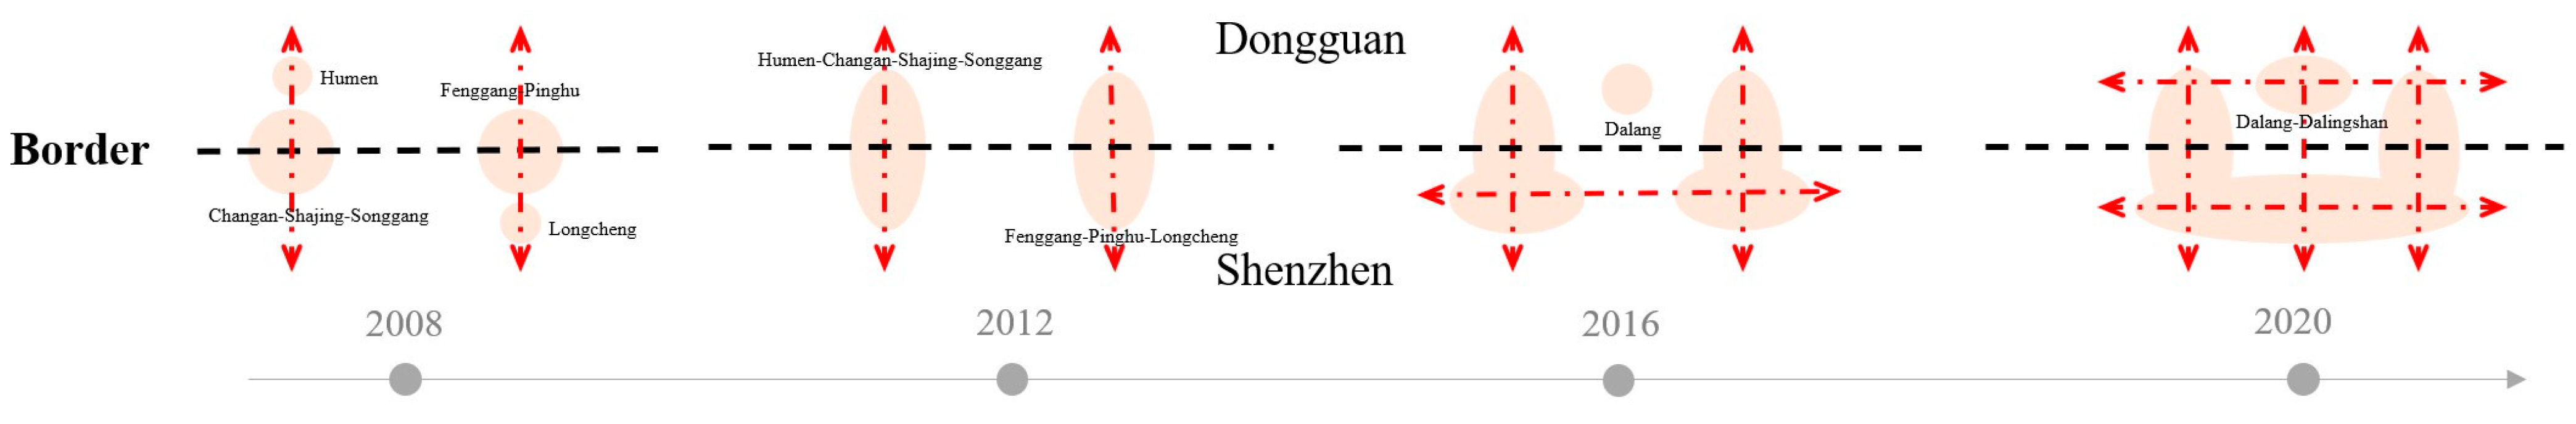
Figure 4.
Chordal diagrams of land use transfer. (a) 2008–2014; (b) 2014–2022.

Figure 5.
The evolution of land use functions in 2008–2022. (a) 2008; (b) 2014; (c) 2022.
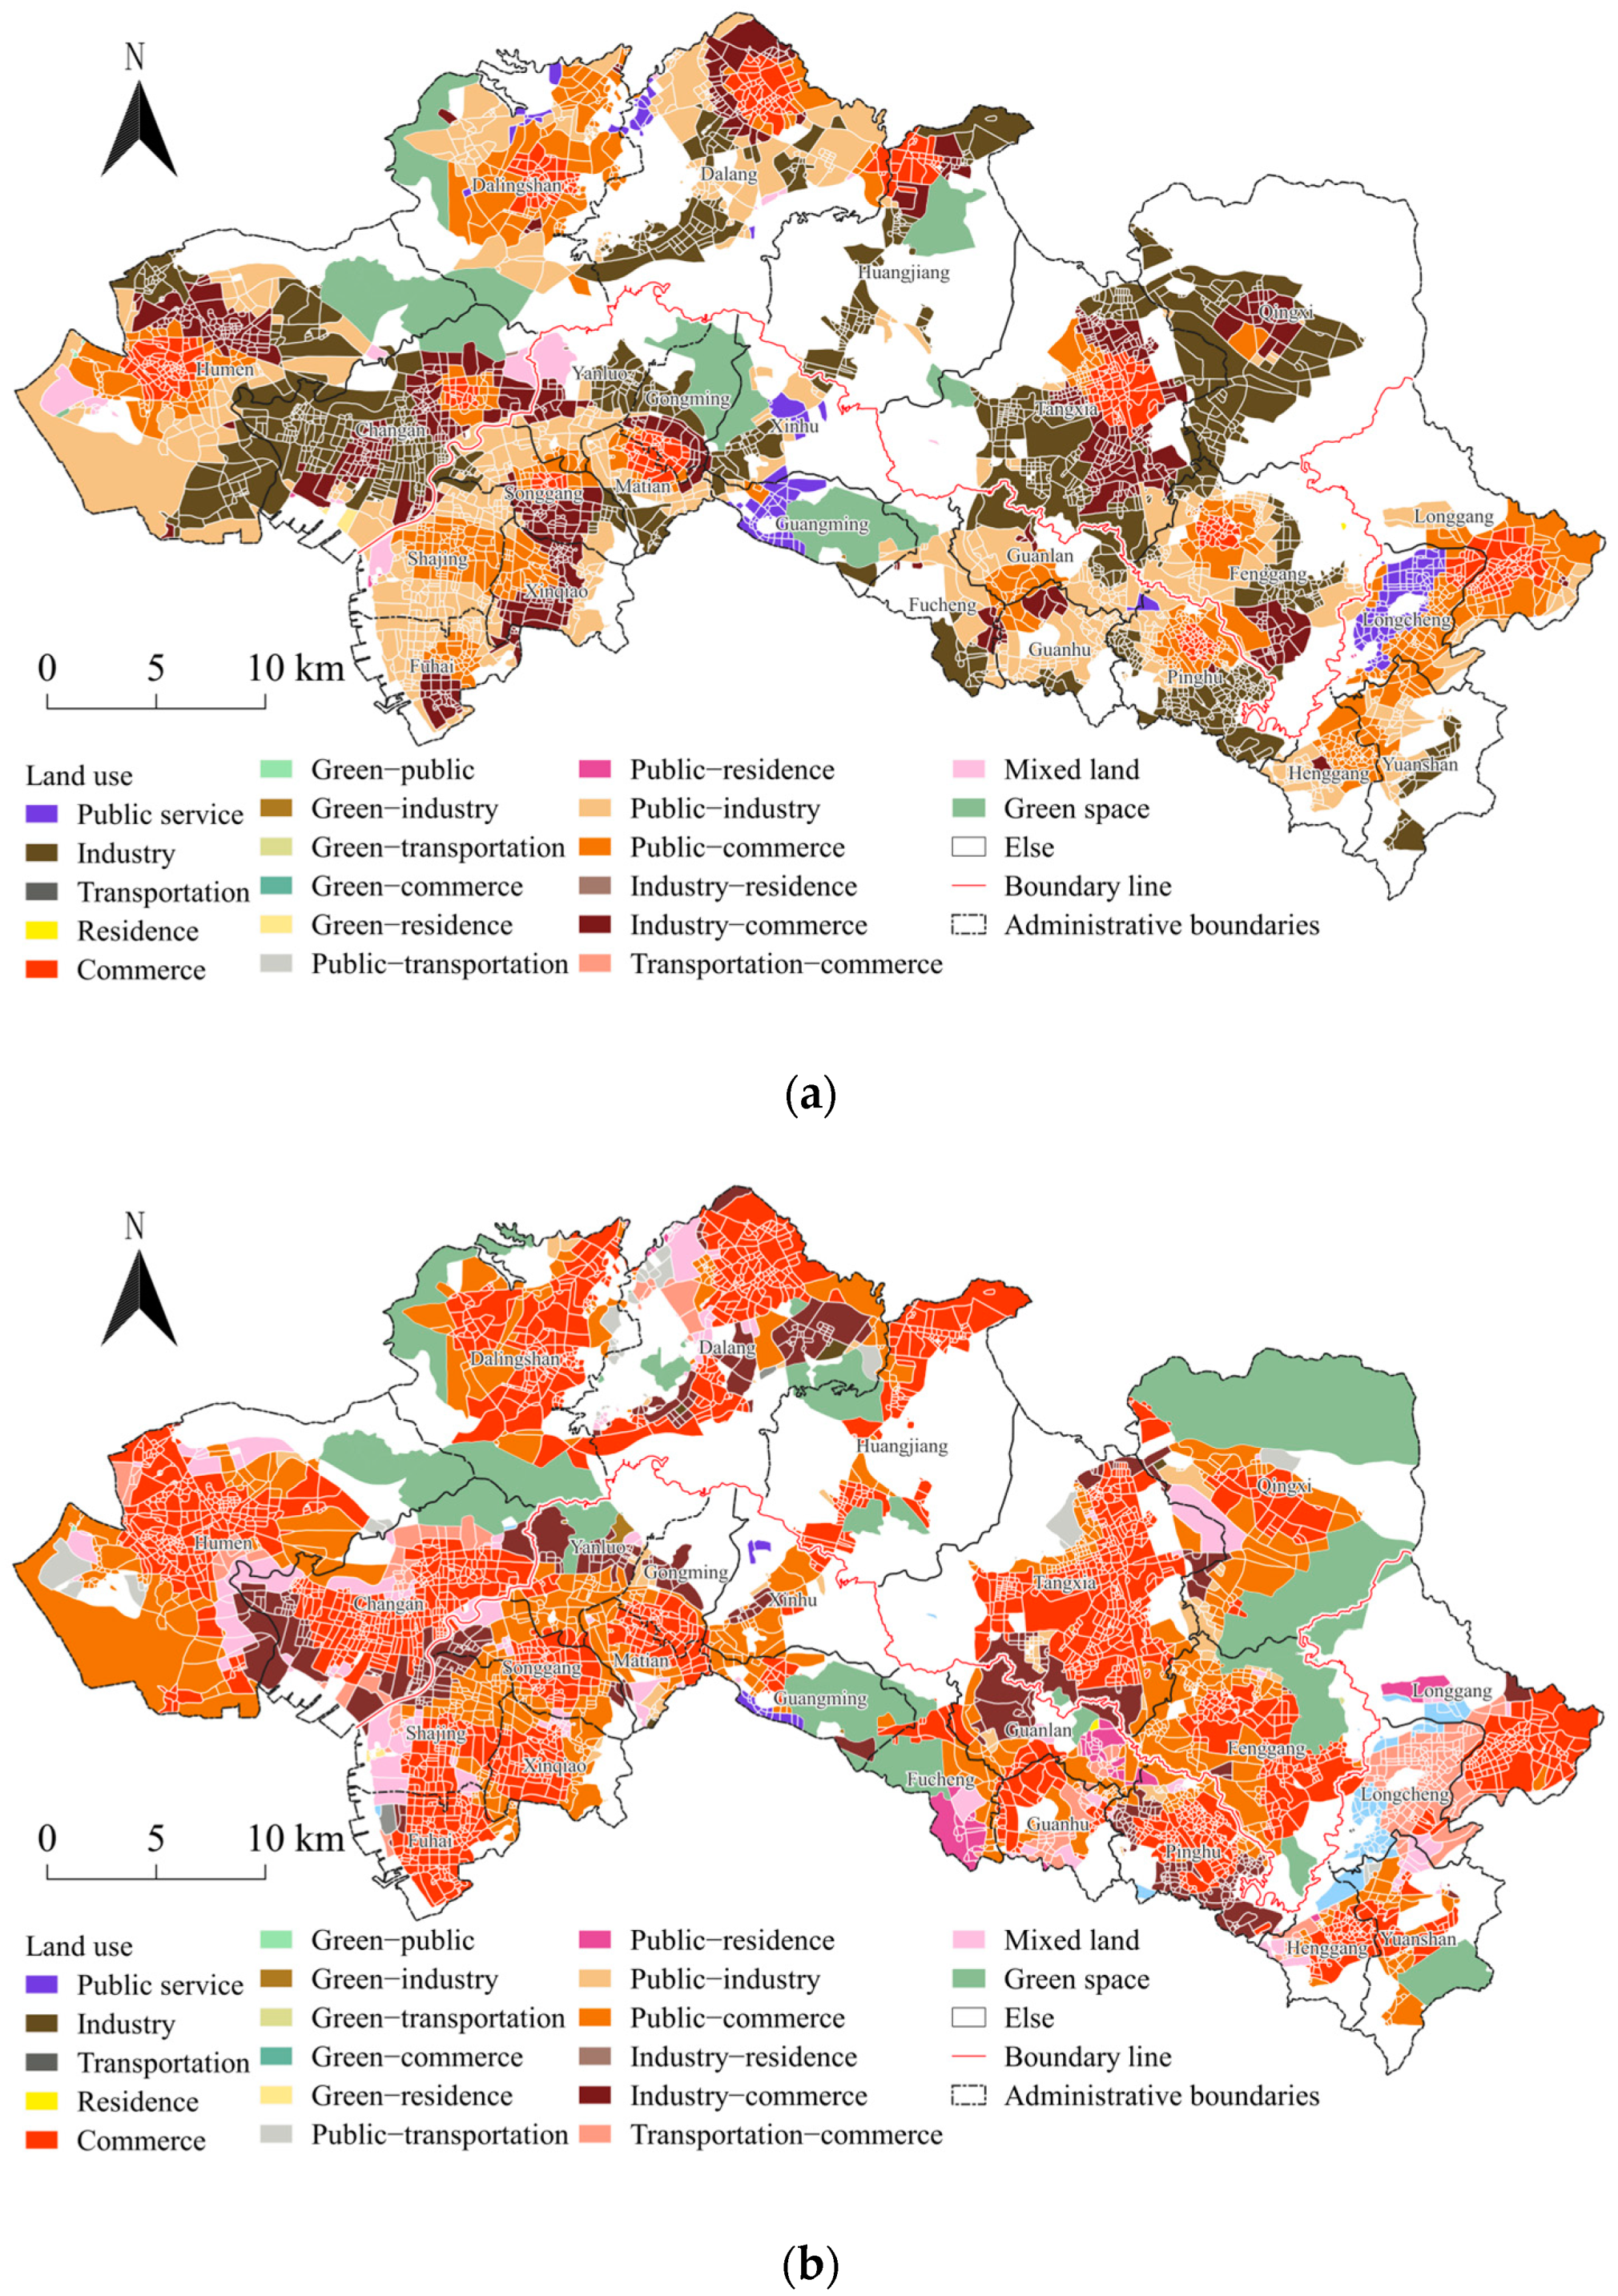
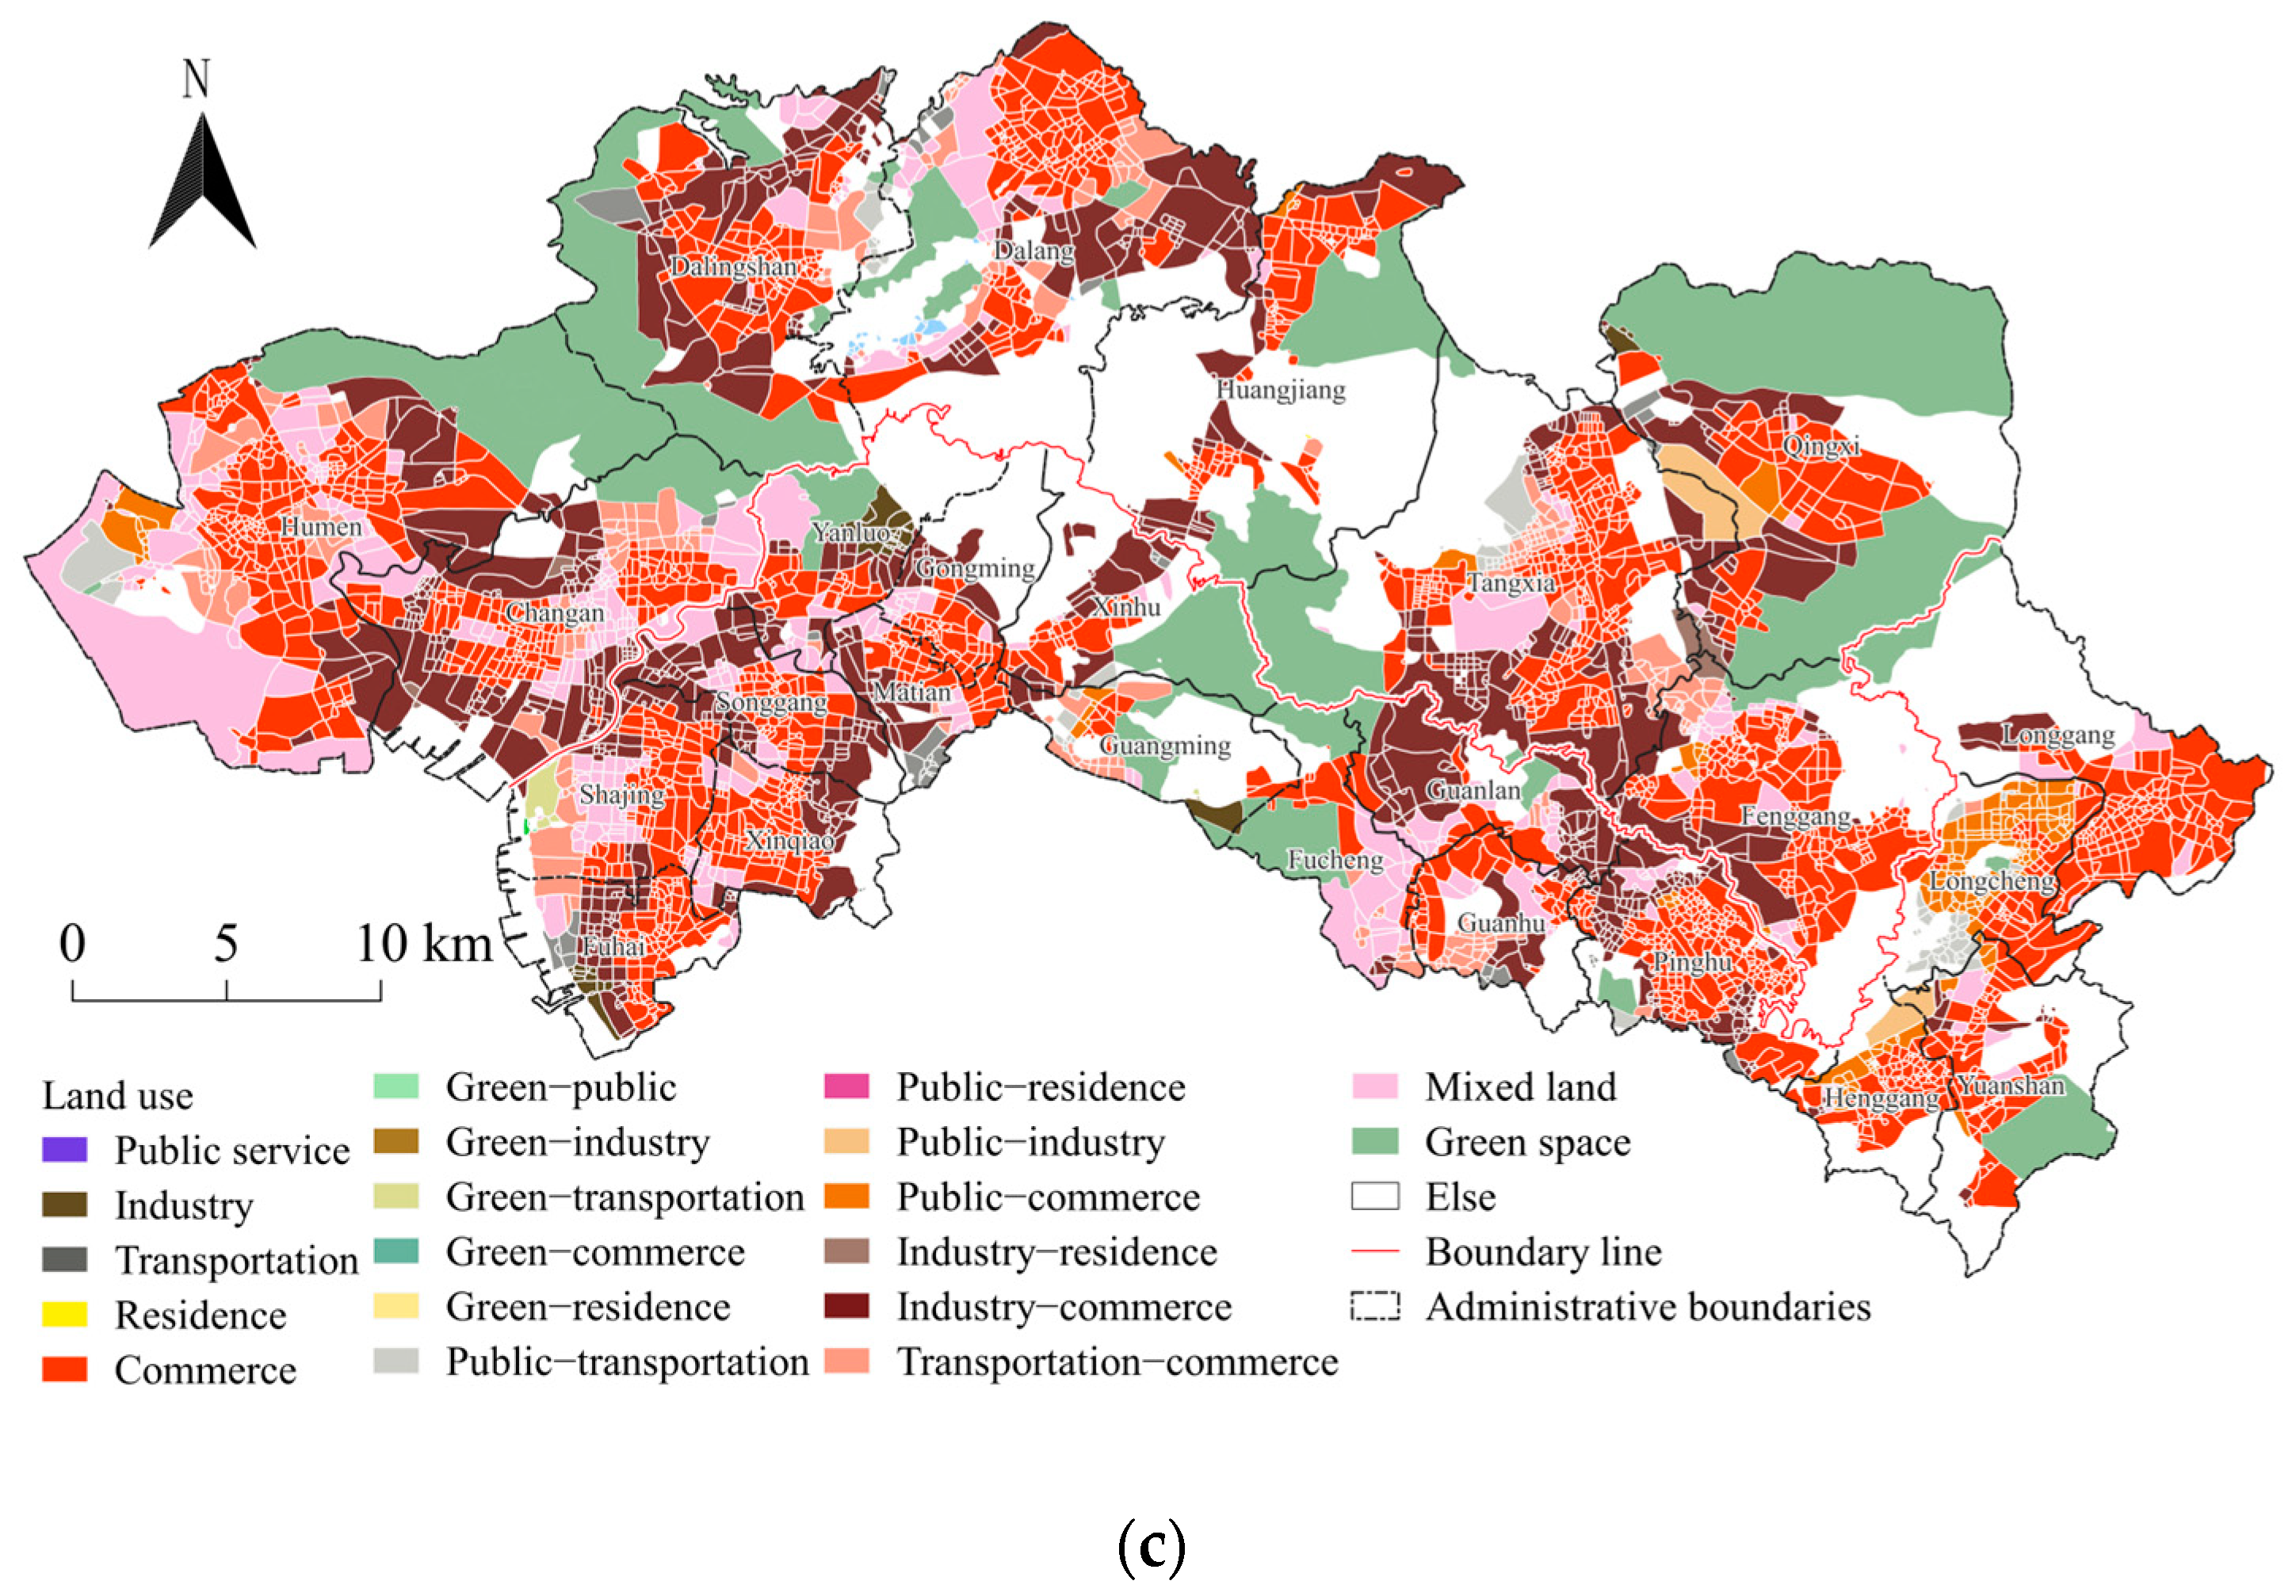
Figure 6.
The evolution of industrial land in 2008–2022. (a) 2008; (b) 2014; (c) 2022.
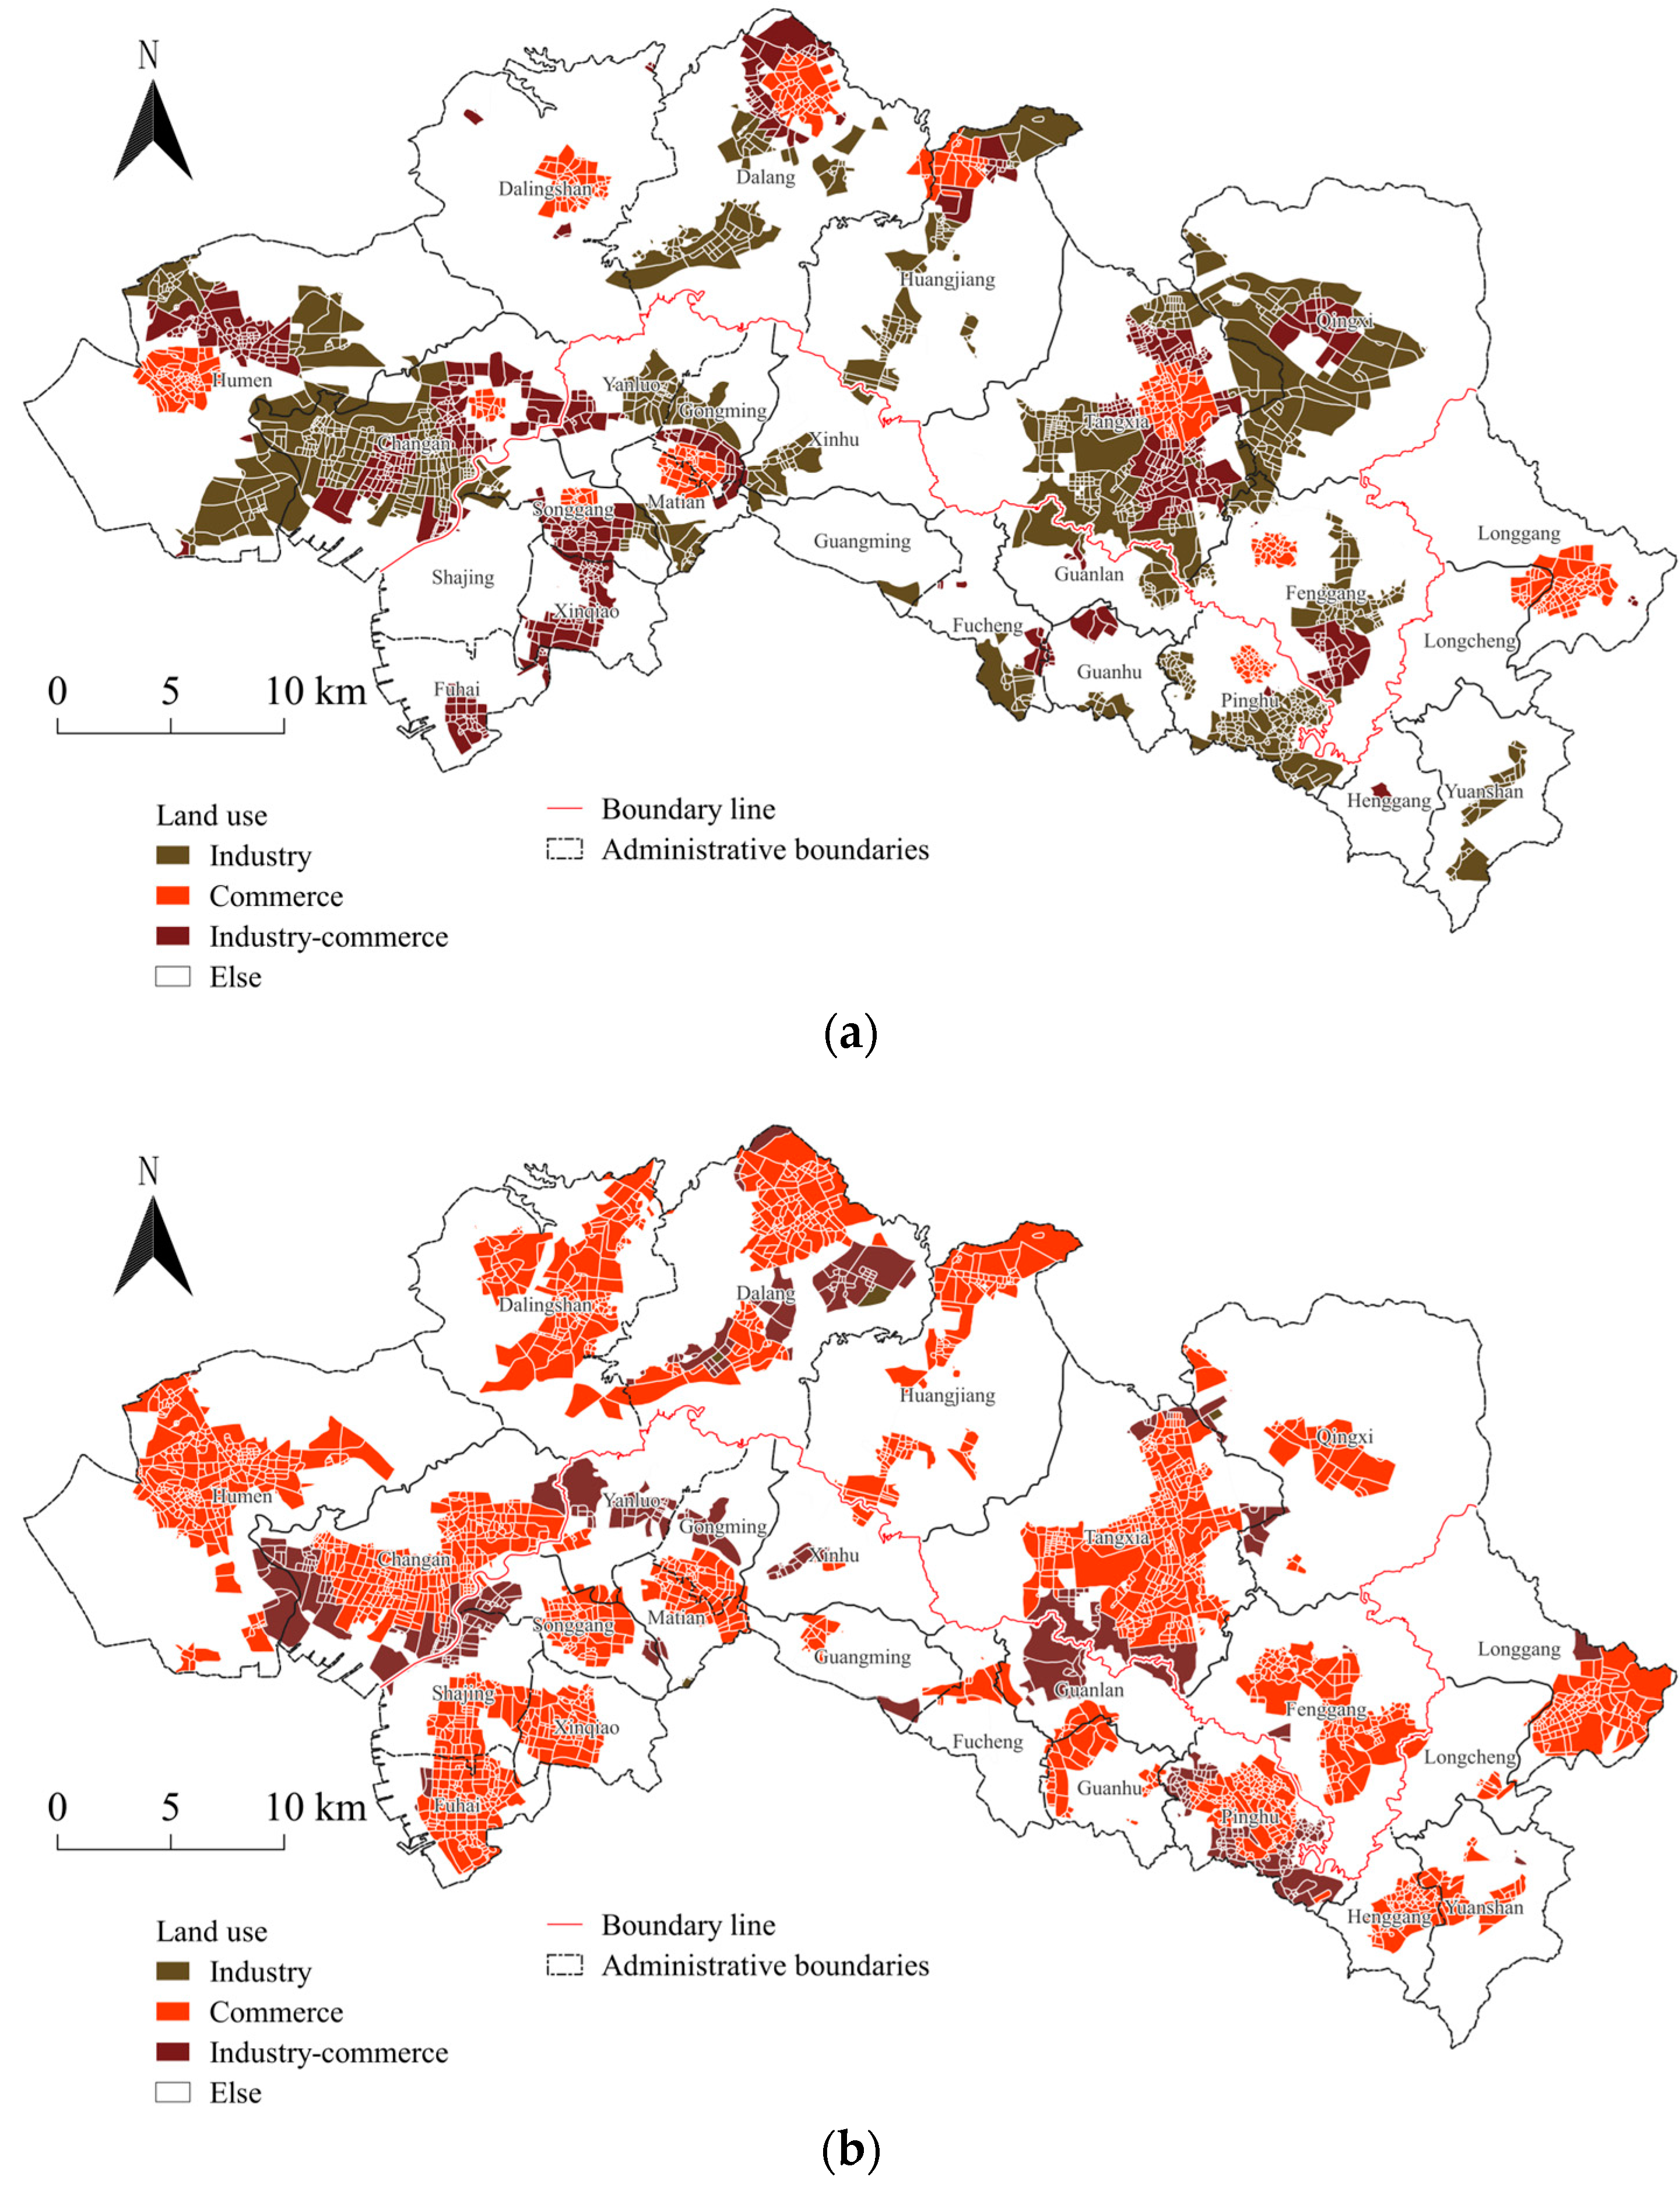
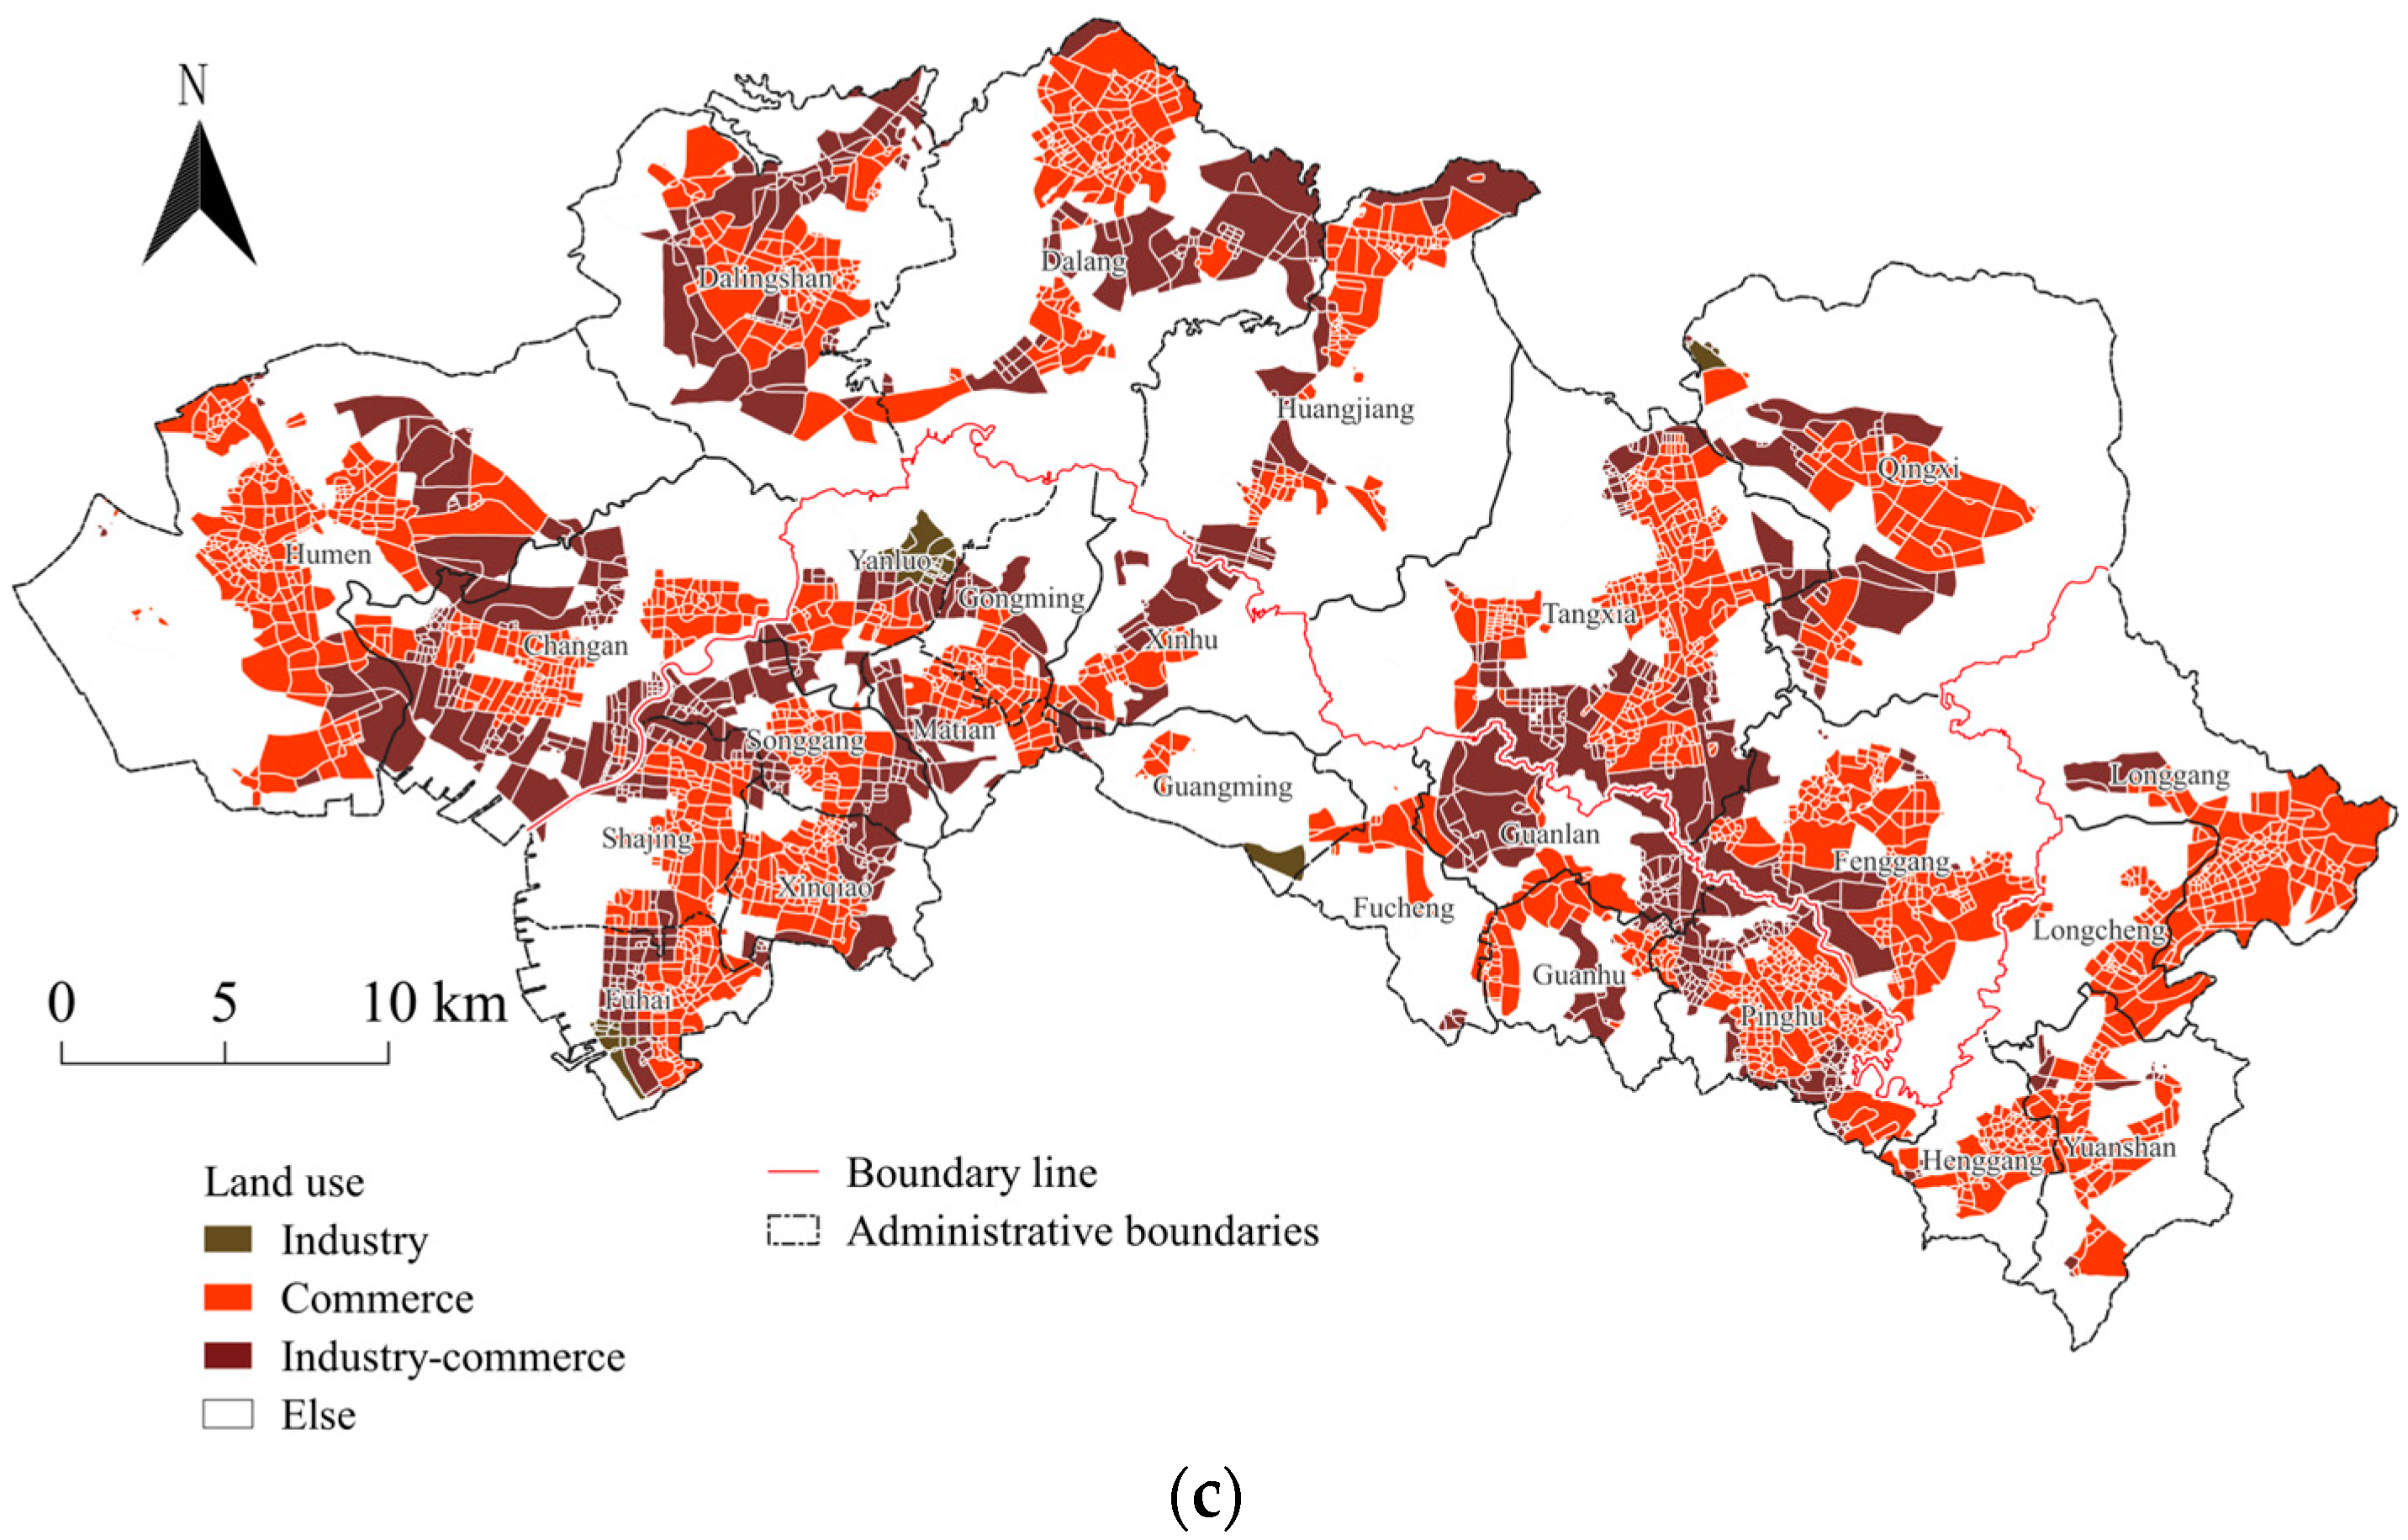
Figure 7.
Schematic diagram of the spatial pattern of industrial land use.
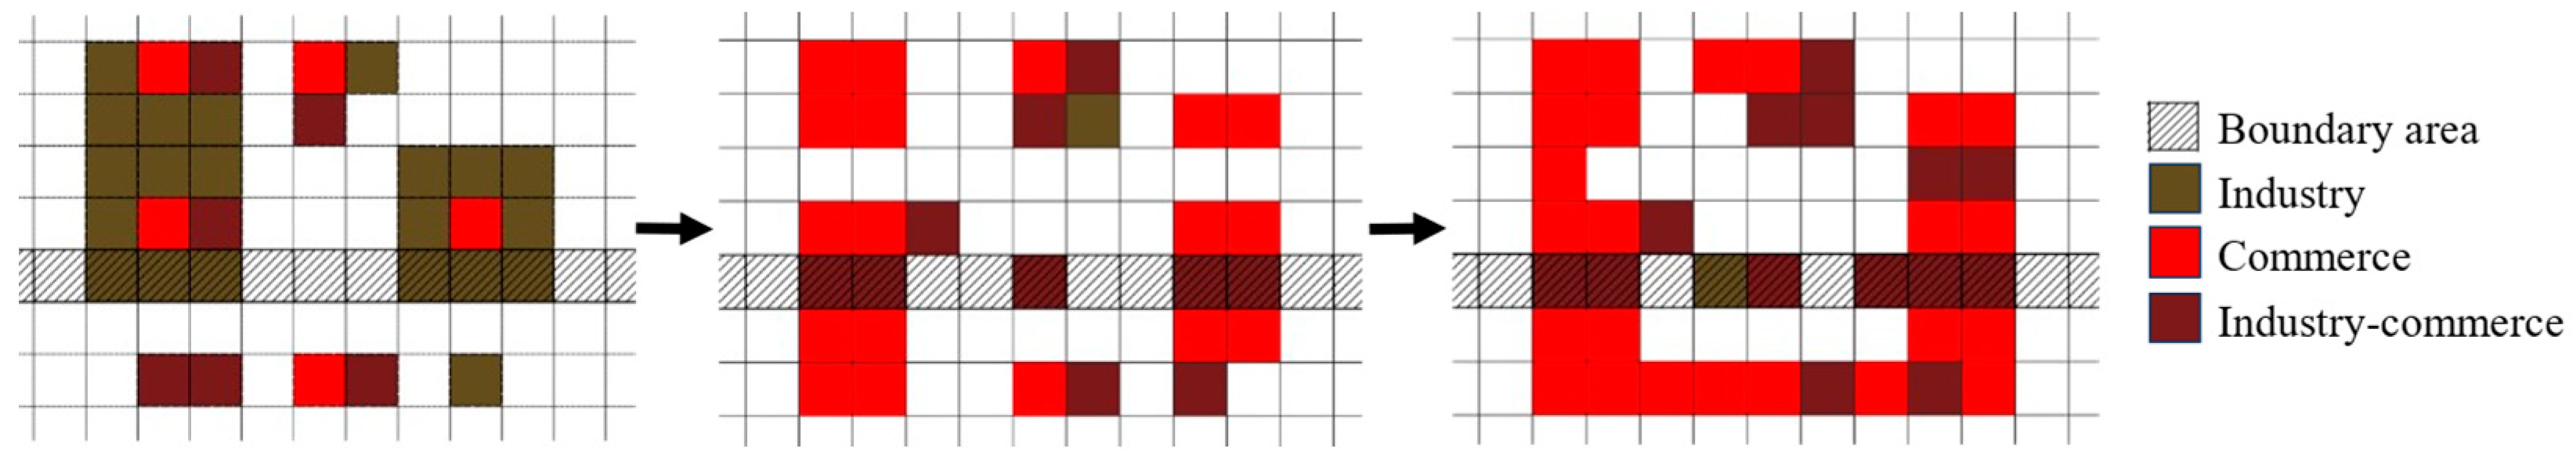
Figure 8.
The mixing degree of land use function in 2008–2022. (a) 2008; (b) 2014; (c) 2022.


Table 1.
Introduction of data.
| Data | Source | Introduction | Pretreatment |
|---|---|---|---|
| Land use data | National Earth System Science Data Center [45] | The data type is a 30 m × 30 m grid divided into nine categories: farmland, forests, shrubs, grasslands, water bodies, ice and snow, bare land, impermeable surfaces, and wetlands. Among them, impermeable surfaces refer to surfaces covered by impermeable materials, including surfaces with low permeability such as building roofs, parking lots, and roads, which can represent the level of urbanization. | Extract impermeable water bands, re project, and crop |
| Night light data | National Environmental Information Center (NCEI) Earth Observation Group (https://eogdata.mines.edu/products/vnl/, (accessed on 17 March 2023)) | Representing the level of regional socio-economic development, it can reflect social and economic factors such as population concentration, urbanization, and economic activity. | Based on the consistency of time resolution, perform data correction between DMSP-OLS data and SNPP-VIIRS data |
| POIs | Gaode Map API (https://console.amap.com/dev/index, (accessed on 3 April 2023)) | Data are real-time, dynamic, easily obtainable, high in accuracy, and have strong practical significance. Density analysis of various POIs can be used to describe the distribution of various types of land or facilities in urban space. Commonly used POIs include multiple categories such as residential, commercial, public facilities, and transportation. | There is cross-duplication between the original POI data types, resulting in data redundancy. Therefore, the operations of reclassifying, filtering, and removing outliers are necessary |
| Road network data | OpenStreetMap (https://www.openstreetmap.org, (accessed on 3 April 2023)) | As the “natural boundary” of a city, the irregular grid units formed by the road network are the basic units for formulating urban planning, dividing urban socio-economic functions, and undertaking urban service management. | Buffer zone analysis, dual line to single line conversion, pruning of suspended roads, road extension, and a series of topology corrections; partition density calculation |
Table 2.
The classification of POI.
| Primary Classification | Secondary Classification | Three Level Classification |
|---|---|---|
| Residence | Business residential (residential areas, commercial-residential related) | Residential communities, villas, apartments, dormitories, etc. |
| Public Service | Public facilities, science and education, cultural services, healthcare services, government agencies and social organizations, living services, sports, and leisure services | Government agencies, clinics, hospitals, schools, libraries, museums, community reading centers, exhibition centers, nursing homes, elderly activity centers, etc. |
| Commerce | Life services, commercial residential buildings, catering, shopping, financial and insurance services, sports and leisure services, accommodation services, companies, and enterprises | Supermarkets, shopping centers, restaurants, hotels, banks, commercial office buildings, insurance companies, consulting companies, commercial companies, etc. |
| Industry | Corporate enterprises, commercial-residential (industrial parks) | Companies, enterprises, factories, science and technology parks, industrial parks, logistics parks, etc. |
| Transportation | Transportation facility services | Parking lots, bus stops, bus stops, service areas, etc. |
| Green Space | Scenic spot | Parks, squares, tourist attractions, etc. |
Source: Classification and Planning of Urban and Rural Land Use Standard GB50137 [46] (Revised).
Table 3.
The statistics of land use in 2008–2022.
| Land Use Type | 2008 | 2014 | 2022 | |||
|---|---|---|---|---|---|---|
| Quantity | Percentage | Quantity | Percentage | Quantity | Percentage | |
| Mixed land | 45 | 0.80 | 269 | 4.78 | 665 | 11.82 |
| Green space | 29 | 0.52 | 34 | 0.60 | 44 | 0.78 |
| Public Service | 295 | 5.24 | 25 | 0.44 | 0 | 0.00 |
| Industry | 1430 | 25.42 | 12 | 0.21 | 55 | 0.98 |
| Transportation | 1 | 0.02 | 14 | 0.25 | 5 | 0.09 |
| Residence | 4 | 0.07 | 4 | 0.07 | 4 | 0.07 |
| Commerce | 630 | 11.20 | 2860 | 50.84 | 2710 | 48.18 |
| Green-Public | 16 | 0.28 | 6 | 0.11 | 0 | 0.00 |
| Green-Industry | 11 | 0.20 | 13 | 0.23 | 5 | 0.09 |
| Green-Transportation | 3 | 0.05 | 12 | 0.21 | 37 | 0.66 |
| Green-Residence | 11 | 0.20 | 15 | 0.27 | 2 | 0.04 |
| Green-Commerce | 0 | 0.00 | 0 | 0.00 | 2 | 0.04 |
| Public-Industry | 1254 | 22.29 | 135 | 2.40 | 3 | 0.05 |
| Public-Transportation | 3 | 0.05 | 122 | 2.17 | 152 | 2.70 |
| Public-Residence | 45 | 0.80 | 90 | 1.60 | 6 | 0.11 |
| Public-Commerce | 962 | 17.10 | 1076 | 19.13 | 215 | 3.82 |
| Industry-Transportation | 0 | 0.00 | 13 | 0.23 | 89 | 1.58 |
| Industry-Residence | 4 | 0.07 | 0 | 0.00 | 12 | 0.21 |
| Industry-Commerce | 882 | 15.68 | 482 | 8.57 | 1153 | 20.50 |
| Transportation-Residence | 0 | 0.00 | 123 | 2.19 | 44 | 0.78 |
| Transportation-Commerce | 0 | 0.00 | 320 | 5.69 | 422 | 7.50 |
Quantity refers to the number of grids of a specified type, and percentage refers to the proportion of a specified type of grids in the total number of grids.
Table 4.
Relevant policy guidance for the mixing of various types of land use.
| Policy | Unit | Year | Main Content |
|---|---|---|---|
| National Plan on New Urbanization (2014–2020) | The Central Committee of the Communist Party of China (CPC) and the State Council | 2014 | Strengthen the transformation of urban functions in existing development zones and promote the transformation from single production functions to comprehensive urban functions. |
| Several Opinions on Further Strengthening the Management of Urban Planning and Construction | 2016 | Create a convenient and fast lifestyle circle. | |
| Several Opinions on Expanding and Optimizing Urban Development Space and Accelerating the Promotion of High-Quality Development | The People’s Government of Dongguan Municipality | 2019 | Encourage a moderate increase in land development intensity and mixed and three-dimensional composite utilization of land use; accelerate the improvement of the implementation mechanism for mixed land use; encourage the mixed use of public management and service facility land, transportation facility land, urban green space, and various types of land; and support the allocation of a certain proportion of commercial office, supporting residential and public service facility land for new industrial land (M0). |
| Shenzhen Territorial Spatial Masterplan (2020–2035) | Shenzhen Planning and Natural Resources Bureau | 2021 | Promote the three-dimensional development and utilization of cities and the mixing of functions; build diverse urban complexes; promote the comprehensive development of TOD models; encourage the integration of building functions; and stimulate the vitality of production and living spaces. |
| The 14th Five-Year Plan for the Protection and Development of Territorial Spatial Planning in Shenzhen Municipality | The People’s Government of Shenzhen Municipality | 2022 | Encourage the integration of building functions, create a diverse, convenient, and compact space that integrates businesses and offices, education and research, public services, cultural and entertainment functions, and stimulate the vitality of urban life and production space. |
Disclaimer/Publisher’s Note: The statements, opinions and data contained in all publications are solely those of the individual author(s) and contributor(s) and not of MDPI and/or the editor(s). MDPI and/or the editor(s) disclaim responsibility for any injury to people or property resulting from any ideas, methods, instructions or products referred to in the content. |
© 2024 by the authors. Licensee MDPI, Basel, Switzerland. This article is an open access article distributed under the terms and conditions of the Creative Commons Attribution (CC BY) license (https://creativecommons.org/licenses/by/4.0/).
Share and Cite
MDPI and ACS Style
Wu, L.; Lang, W.; Chen, T. Deciphering Urban Land Use Patterns in the Shenzhen–Dongguan Cross-Boundary Region Based on Multisource Data. Land 2024, 13, 161. https://doi.org/10.3390/land13020161
AMA Style
Wu L, Lang W, Chen T. Deciphering Urban Land Use Patterns in the Shenzhen–Dongguan Cross-Boundary Region Based on Multisource Data. Land. 2024; 13(2):161. https://doi.org/10.3390/land13020161
Chicago/Turabian StyleWu, Likun, Wei Lang, and Tingting Chen. 2024. "Deciphering Urban Land Use Patterns in the Shenzhen–Dongguan Cross-Boundary Region Based on Multisource Data" Land 13, no. 2: 161. https://doi.org/10.3390/land13020161
Note that from the first issue of 2016, this journal uses article numbers instead of page numbers. See further details here.