
Precise Identification of Site Characteristics and Risk Management of Ningdong Coal Power Base
1
School of Public Policy and Management, China University of Mining and Technology, Xuzhou 221116, China
2
Ningxia Coal Industry Co., Ltd. of CHN ENERGY, Yinchuan 750000, China
3
School of Environment and Spatial Informatics, China University of Mining and Technology, Xuzhou 221116, China
4
Engineering Research Center of Mine Ecological Restoration, Ministry of Education, Xuzhou 221116, China
5
School of Mechanical and Electrical Engineering, China University of Mining and Technology, Xuzhou 221116, China
6
Department of Strategic Planning, China Energy Investment Group, Beijing 100011, China
*
Author to whom correspondence should be addressed.
Land 2024, 13(1), 3; https://doi.org/10.3390/land13010003
Submission received: 7 November 2023
/
Revised: 5 December 2023
/
Accepted: 7 December 2023
/
Published: 19 December 2023
Abstract
:With the active development of coal-related industries in Ningdong, problems such as land degradation caused by coal-based site expansion and soil pollution caused by coal-based solid waste discharge are getting progressively worse. The identification of space types and the proposal of risk management are the key basic issues of regional energy resource low-carbon development and ecological protection. This article proposes an index system for feature extraction at the regional and site scales. The spatial–temporal evolution trends and differences in Ningdong coal power base from 2003 to 2021 were identified and interpreted through feature recognition based on Landsat images at the regional scale. Accurate site type recognition was conducted based on 10 m resolution Sentinel-2 images from 2021. We utilized the PSR (pressure–state–response) model for a comprehensive assessment of risk management in Ningdong. The results of this study show that the coal site > the coal chemical site > the coal power site, and the risk of the coal power base is in a controllable state; thus, we put forward a zoning control strategy. Our data on the pollution risk management of large-scale coal-fired power generation complexes are of significant importance for site remediation and regional ecological restoration.
1. Introduction
Ningdong coal power base is the most representative coal, coal power, and coal chemical industry cluster bases in China. It is one of the fourteen national large coal bases with a production capacity of 100 million tons, comprising nine large coal power bases generating 10 million kilowatts and encompassing four demonstration zones for the modern coal chemical industry [1]. With the long-term development of industries, the Ningdong coal power base is expected to generate 29.04 million tons of industrial solid waste by 2022, which includes 7.35 million tons of coal gangue and 6.34 million tons of chemical waste [2]. It has led to problems such as a large industrial solid waste disposal gap, open piles of fly ash, gangue dumps, and ore slag piles occupying grasslands [3,4]. These problems not only lead to soil contamination and a waste of resources, but also increase the risk of combined contamination from related solid waste utilization, land compaction, and disposal sites [5]. The identification of site spatial types and risk control strategies are proposed as the key fundamental issues in terms of regional energy resources, low-carbon development, and ecological protection.
With advancements in remote sensing technology, it has become possible to identify the characteristics of mining features and obtain precise spatial information about different types of mining sites [6,7]. In recent years, both political and academic circles have conducted comprehensive investigations using multi-factor systematic approaches to gather basic information about different types of sites—for example, the China national basic special project “Investigation of Land Degradation Factors in Key Mining Areas in the West” [8] and the South African national project “Predictive identification methods using artificial intelligence”. Shiyi Yi [9] and Beckley [10] constructed a conceptual model for contaminated sites in order to investigate and integrate the fundamental information of the sites. Another crucial research focus is the selection of indicators for classification systems in the categorization of coal-related regional sites. Xiaonuo Li [11] and Wanner [12] have developed a classification index system of contaminated sites and evaluated a categorization control based on site conditions. In a study on zoning control [13,14,15], Dong Linming [16] et al. summarized the variations in, merits of, and drawbacks of zoning methods and evaluation indexes in various countries. Krzaklewski et al. [17] constructed a classification system for reclaimed mining sites and classified their sites according to the standing conditions. These studies lack consideration of spatial characteristics pertaining to multi-source coal-based sites extracted at both the regional and site scale. This limitation hinders the accurate identification of spatial site types and the clarification of impact boundaries in coal-related areas.
This paper established a multi-source coal-based site feature extraction index system. It utilized both the regional and site scale to extract the characteristic features of the Ningdong coal power base. We quantitatively analyzed the distribution, area, and quantity of coal-based sites, including coal, coal power, and coal chemical sites, within the Ningdong coal power base. Our aim is to tackle the challenge of accurately identifying coal-related sites, enabling the state to map out potential areas of risk, identify the cumulative trends of site pollution in coal-related industries, and propose risk management strategies. Moreover, we propose risk control strategies for coal-based sites within large-scale coal power bases.
2. Data Sources and Classification System
2.1. Study Area Delineation
The Ningdong coal power base belongs to the Ningxia Hui autonomous region. It is located on the east bank of the Yellow River [18]. It extends from 106.42° to 106.85° E and from 37.91° to 38.30° N. The key core area is 1000.42 km2, as shown in Figure 1.
It was developed and constructed in 2003. As a result of its abundant coal resources, three major industries, coal mining, coal chemistry, and coal power, have developed into industrial clusters. Together with Yulin in Shaanxi and Ordos in inner Mongolia, it constitutes China’s Golden Energy Triangle. It has a coal productivity of 9.16 × 10¹⁰ t/a, a coal chemical production capacity of 2.25 × 10⁷ t/a, and an installed thermal power capacity of 1.70 × 10⁷ kw/a [19]. Additionally, it is a major large coal industry center, coal chemical industry base, and the main base of the “West-East Power Transmission” project in China.
2.2. Data Source
Landsat image data (30 m) from November to December in 2003, 2010, and 2021 and Sentinel-2 image data (10 m) from December of 2021 were selected for our analysis. The raw data underwent several pre-processing steps, including radiometric calibration, atmospheric correction, and geometric correction. The information of the images is shown in Table 1. In this study, a combination of support vector machine classification and visual interpretation techniques was employed. This approach facilitated the extraction of coal-based site information from Landsat images at a regional scale. Additionally, it enabled the identification of coal-based site features from Sentinel-2 image data at a finer site scale.
2.3. Indicator System
China has proposed “three living spaces”, which refer to “production space, living space and ecological space”. Ecological space is the territorial space with ecological protection functions that can provide ecological products and services. Living space is the space used for people’s activities in their daily lives. Production space is the specific functional area in which people engage in production activities. Based on the analysis results of the Landsat and Sentinel-2 data, along with the land use status and the 14th Five-Year Plan of Ningdong coal power base, a classification system for coal-based sites was developed by taking into consideration the spatial characteristics of ecology, life, and production. The regional scope mainly includes bare land, grassland/cultivated land/woodland/shrubs (the green vegetation that withered in November and December is classified as one category to facilitate the identification of different site types), water, residential areas, roads, coal, coal power, and coal chemical. The site scope mainly includes open pits, industrial squares, solid waste, coal storage yards, coal gangue piles, cooling towers, coal power equipment, coal power waste dumps, coal chemical production sites, and chemical waste dumps. The specific features and interpreted signs of the site information are shown in Table 2.
3. Ningdong Coal Power Base/Regional Feature Identification
3.1. Ningdong Coal Power Base/Regional Feature Information Extraction
3.1.1. Feature Information Extraction
According to the life cycle of the mining area, the nodes of the early development (2003), the climax of development (2010), and the transition of development (2021) of the Ningdong coal power base are used to extract the regional-scale characteristic features using ArcGIS in combination with GoogleEarth, as shown in Figure 2. The study area is dominated by green vegetation cover and bare land, with less water and a smaller road area. Residential clusters are sparsely distributed throughout the region. In 2003, coal mining activities were concentrated in the central part of the Ningdong coal power base. By 2010, coal mining had shifted to the northern section of the base. In 2021, the coal mining area was primarily concentrated in the middle eastern part of the base. With the largest area among the coal-based sites, the coal mining area was primarily concentrated in the middle eastern part of the base in 2021. The coal power sites started to be constructed in the middle eastern part of the base in 2010. The coal chemical industry was in the middle of the Ningdong coal power base in 2003. However, in 2021, the core area was relocated to the north of the base.
3.1.2. Accuracy Verification
To ensure the accuracy of the results, an accuracy verification was conducted by comparing the extracted information with actual measurement results. In order to verify the accuracy of the regional-scale feature classification results, we compare them to high-resolution GoogleEarth images of the same period, use the stratified random sampling method to verify the point sampling method, select an average of 50 sample points for each feature class for analysis, and calculate the confusion matrix and kappa coefficient to verify the classification results. As shown in Table 3, the overall accuracy reached over 85% in 2003 and 2010 and 83.007% in 2021. The Kappa coefficients of the classification maps extracted from the regional-scale feature information of the three phases were above 0.8, and the classification results were more accurate.
3.2. Characteristics of Ningdong Coal Power Base Site
According to the statistics of the number of various types of sites in the Ningdong coal power base from 2003 to 2021 (Table 4), it is evident that during this period, the green vegetation cover and bare land area of the Ningdong coal power base decreased, while the areas of coal, coal power, the coal chemical industry, and roads increased. The increase in water area and residential agglomeration were relatively modest. These trends indicate a robust development of the Ningdong coal power base over eighteen years, and the expansion trend of coal-based sites is obvious. Coal, coal power, and coal chemical sites have increased significantly, not only causing damage to the ground surface, but also polluting the ground and air with the exhaust gas, slag, and wastewater produced by power plants and chemical plants, seriously damaging the local ecological environment.
During the period from 2003 to 2010, there was a decrease in green vegetation cover and bare land by 32.07 km2 and 25.07 km2, respectively. Additionally, the areas of coal, roads, the coal chemical industry, coal power generation, residential catchments, and water decreased by 23.55 km2, 10.60 km2, 10.19 km2, 6.49 km2, 6.10 km2, and 0.21 km2, respectively. During the period from 2010 to 2021, the green vegetation cover and bare land decreased by 71.21 km2 and 24.83 km2, respectively. Similarly, the areas of coal, the coal chemical industry, roads, coal power generation, water, and residential catchments decreased by 35.21 km2, 34.83 km2, 12.55 km2, 9.52 km2, 3.47 km2, and 0.45 km2, respectively.
3.3. Analysis of Changes in Spatial Characteristics of Ningdong Coal Power Base
3.3.1. Land Use Dynamics Formula
The dynamic attitude model is employed in this study to analyze the changes in the area of different land use types, the magnitude of these changes, which reflects the amount and proportion of changes in land use, and the differences in the changes between the different land use types. In this study, the dynamic attitude model is used to reflect the amount and laws of land use changes and monitor the change in different types of land use in the coal power base [20,21,22]. It is calculated as Equation (1).
where denotes the dynamic attitude of a land use type during the study period; denotes the number of land use types at the beginning of the study; denotes the number of land use types at the end of the study; and denotes the length of the study.
3.3.2. Land Use Dynamic Data Results
The land use dynamic attitude reflects the amount and laws of land use changes, reflecting the drastic degree of changes in each characteristic feature of the coal power base, and quantitatively analyses the dynamic characteristics of land use in Ningdong coal power base from 2003 to 2021. The data results are shown in Table 5.
3.3.3. Analysis of the Results of Land Use Trends
With rapid socio-economic development, Ningdong has emerged as a “national key development zone”, leading to significant growth in the coal, coal power, and coal chemical industries. The attitude reflected in Table 6 indicates changes in the green vegetation cover of Ningdong coal-based sites from 2003 to 2021. The degrees of change in the green vegetation cover of Ningdong coal-based sites in the two phases were −0.69% and −1.02%. The change in green vegetation cover is a decreasing trend. The changes in bare land over the two periods were −1.23% and −0.85%. The bare land change has a slow decreasing trend, but also shows that the Ningdong coal power base’s coal production is rising from year to year. Water changes over the two periods have an increasing dynamic attitude. Road development showed an upward trend with changes of 19.43% and 6.20% between the two periods. Residential areas also exhibited a gradual increase with changes of 10.18% and 0.28% between the two periods. In the construction process of the Ningdong coal electrification base, the residential areas gradually became where the industrial workers of the coal electrification base lived. For the maintenance of its population, Ningdong township launched the national new townships comprehensive pilot. Coal has shown a substantial increase over the two periods, with degrees of change of 58.21% and 10.91%, respectively. This indicates a rapid upward trend in its development, with the largest amount of change. The main period of development for coal power is observed to be from 2010 to 2021, demonstrating a continued upward trend during this time. The coal chemical industry in the period of 2003–2021 was in a rapid development stage, with the degree of change as high as 85.06%. The ever-increasing number of coal-based sites has seriously affected the local ecological environment, and there is a huge amount of solid waste generation. The large-scale coal power base in Ningdong has a low comprehensive utilization rate and negative ecological effects. The problem of multi-source coal-based solid waste needs to be solved, and key purification and control technologies need to be urgently researched.
3.4. Transfer Matrix Analysis of Spatial Characteristics of Ningdong Coal Power Base
3.4.1. Transfer Matrix
By adopting the transfer matrix, we can analyze the transformation between various utilization types of multi-source coal-based sites over the two periods, including information on the source, destination, and quantity size of the transformation [23,24]. Through the multi-temporal spatial characterization, it clarifies the changes in the regional-scale characteristic feature types and area quantities of the Ningdong coal power base, as well as analyses the dynamic process and development trends of its spatial feature evolution. The specific calculation of the transfer matrix is shown in Equation (2).
where s is the area of the land use type; n is the land use type; and represents the area of land of type i at the beginning of the study period which is converted to type j at the end of the study period.
3.4.2. Transfer Matrix Analysis Result Map
The ArcGIS overlay analysis tool was used to overlay the land use type maps of the Ningdong coal power base over the two periods to obtain the transfer and change data of different land types over the two periods, and Origin was used to produce the transfer matrix analysis result map (Figure 3). The transfer area of green vegetation cover was the largest in the two time periods, which was 63.90 km2 and 91.96 km2. The main transfer types are coal, roads, and the coal chemical industry, indicating that the Ningdong coal power base mainly occupies green vegetation cover and bare land when it expands in the process of development. The decrease in vegetation cover and the increase in industrial land damage the ecological environment, so those at the Ningdong coal power base need to explore feasible and practical ways towards low-carbon, high-efficiency sustainable development, as well as to pay attention to the issues of moderate exploitation, sustainable use, and repair of damages when generating electricity from coal.
Bare land is mostly converted to green vegetation cover during 2003–2010 and mostly converted to coal, coal power, the coal chemical industry, and roads during 2010–2021. Roads were mainly built on land with green vegetation cover, with a maximum shift of 18.80 km2. Coal, coal power, and the coal chemical industry were mainly built on land with green vegetation cover and bare land. A total of 33.46 km2 of land with green vegetation cover shifted to coal sites during 2010–2021, which was the largest shift. And 20.94 km2 of land with green vegetation cover shifted to coal chemical industry sites during 2010–2021, which was the second largest shift. The expansion of coal mining, coal power generation, and the coal chemical industry has led to a substantial occupation of land. However, the comprehensive utilization rate of coal-based solid waste remains low, resulting in a significant amount of pollution of the regional ecological environment. This situation has become a detrimental factor constraining regional economic and social development, impacting the establishment of regional ecological civilization, and hindering the implementation of the national energy strategy. Consequently, there is an urgent need to delineate the spatial structure of coal-based sites.
4. Scale Analysis of Coal, Coal Power, and Coal Chemical Sites Based on Sentinel-2 Data
4.1. Distribution of Coal, Coal Power, and Coal Chemical Sites
Landsat remote sensing images with a spatial resolution of 30 m were used to identify regional-scale feature spatial characteristics, and then Sentinel-2 images with a resolution of 10 m were used to identify site-scale feature spatial characteristics with relative accuracy. The 2021 Sentinel-2 image data were selected to correct the extracted Landsat coal-based site feature information and to extract more accurate land class information.
We used Google Earth to compare these results with the classification result map, as shown in Figure 4. It can verify the accuracy of the classification results of coal, coal power, and the coal chemical industry at the site scale. The results show that the overall accuracy is 82.384%, and the Kappa coefficient reached 0.8017, which is a good classification situation. The resulting distribution map of coal power, coal, and the coal chemical industry is shown in Figure 5. In the revised map, coal occupies 66.78 km2, the coal chemical industry occupies 47.35 km2, and coal power occupies 18.32 km2, and their distributions account for 6.68%, 4.73%, and 1.83% of the Ningdong coal power base, as shown in Table 6.
4.2. Spatial Structure of Coal, Coal Power, and Coal Chemical Sites
4.2.1. Spatial Structure of Coal Sites
The distribution of coal sites is more scattered, mainly concentrated in the eastern/central part (Figure 5). Ningdong coal mining is mostly shaft mining. The area of industrial squares is 22.07 km2, the area of solid waste is 21.59 km2, the area of coal storage sites is 11.61 km2, and the area of coal gangue piles is 10.25 km2, which take up less land. The area of open-pit quarries is 1.39 km2, and a small amount of accompanying solid waste and coal gangue piles exist around them.
4.2.2. Spatial Structure of Coal Power Sites
Ningdong transforms the coal extracted locally and mainly sends it to Shandong, Zhejiang, and other places. It has built several large-scale power plants, becoming an important base for China’s “west-east power transmission”. Coal power sites are centrally located in the northern and central parts of the Ningdong coal power base (Figure 6), which is relatively concentrated and occupies a small amount of land. Condensation towers are a characteristic, identifying element of coal power sites, which are small and generally cylindrical, occupying an area of about 0.41 km2, while the areas of coal power equipment and coal power waste dumps are 10.36 km2 and 7.55 km2, respectively.
4.2.3. Spatial Structure of Coal Chemical Industry
The Ningdong large-scale coal power base has built a coal chemical industry, and its main projects include coal-to-oil, coal-based olefin, coal-based methanol, paraformaldehyde, and so on. Coal chemical industry sites are centrally distributed in the north of the Ningdong coal power base, with a regular and concentrated distribution. A total of 29.13 km2 is occupied by coal chemical industry production sites and 18.54 km2 is occupied by coal chemical industry waste dumps, as shown in Figure 7.
Overall, the distribution of multi-source coal-based sites is coal sites > coal chemical sites > coal power sites. The large expansion of coal-based sites and the accumulation of solid wastes pose a great risk of pollution to the mining land. Soil loosening caused by ground subsidence affects the richness and diversity of plant species in the mining area and neighboring regions, and the on-site disposal of untreated coal-based solid waste can cause “secondary pollution”, such as the accumulation of heavy metals in the soil which exceed standard levels. Therefore, it is necessary to carry out risk warning and risk control strategies according to the type and number of sites, as well as the degree of difficulty of site remediation works.
5. Risk Control of Ningdong Coal Power Base
5.1. “Pressure–State–Response” Control Evaluation
The PSR (pressure–state–response) model was initially proposed and developed by the United Nations Organization for Economic Co-operation and Development (OECD) to assess environmental conditions around the world [25]. It shows the interaction relationship between people and the environment. The development of the Ningdong coal power base relies on natural resources obtained through mineral activities such as coal mining and processing, which provide energy. However, these activities also result in the generation of solid waste, fly ash, slag, and other by-products, leading to environmental degradation and impacting natural resource reserves and environmental quality. In response to these environmental changes, societies implement environmental strategies, economic policies, and various protective measures, forming a cyclical pressure–state–response relationship between human activities and the environment. Environmental deterioration reflects neglect and inadequate control, while increased control measures and policies, along with a heightened awareness of environmental management, contribute to improved environmental conditions.
The PSR model was utilized to develop an evaluation system for multi-source coal-based site control. This involves establishing an evaluation index system, determining positive and negative indicators, standardizing the indicator data, employing the entropy weighting method to calculate the weights, and computing the evaluation composite score [26,27,28]. Pressure indicators include human behaviors that positively or negatively impact the environment. State indicators are qualitative indicators, reflecting the pressure of the research object and finding the relevant changes that have occurred in the system. Response indicators are constructed with a selection of quantitative indicators, indicating people’s responses to changes and answering the question of what humans have done and what they should do. The main basis for distinguishing between positive and negative indicators is that the larger the value of the indicator, the better or worse the result for the Ningdong coal power base. Consequently, the pressure indicator is a negative indicator, while the state indicator and the response indicator are positive indicators. For positive indicators, the indicator value is positively correlated with the environmental conditions. A higher value indicates better environmental conditions and improved control of the Ningdong coal power base. Conversely, for negative indicators, the indicator value is negatively correlated with the environmental conditions. A higher value suggests deteriorating environmental conditions and poorer control of the Ningdong coal power base.
The standardized calculation is shown in Equation (3):
where is the standardised value and represents the ith indicator.
The weights are calculated as shown in Equation (4):
where is the weight and is the information entropy.
The study area is mainly located in Ningdong, Lingwu in the Ningxia Hui autonomous region, and the main source of industrial economy in Lingwu is the Ningdong coal and electricity base. The data used for the PSR model indicators include the statistical bulletin of the national economic and social development of the Ningxia Hui autonomous region, the statistical yearbook, the statistical yearbook of China’s counties, and the statistics published by the Ningdong energy and chemical base. Some of the indicators were replaced by Lingwu’s or Yinchuan’s indicators. Any missing data were made up using linear interpolation, and the evaluation system, indicator weights, and specific sources of indicator data are shown in Table 7.
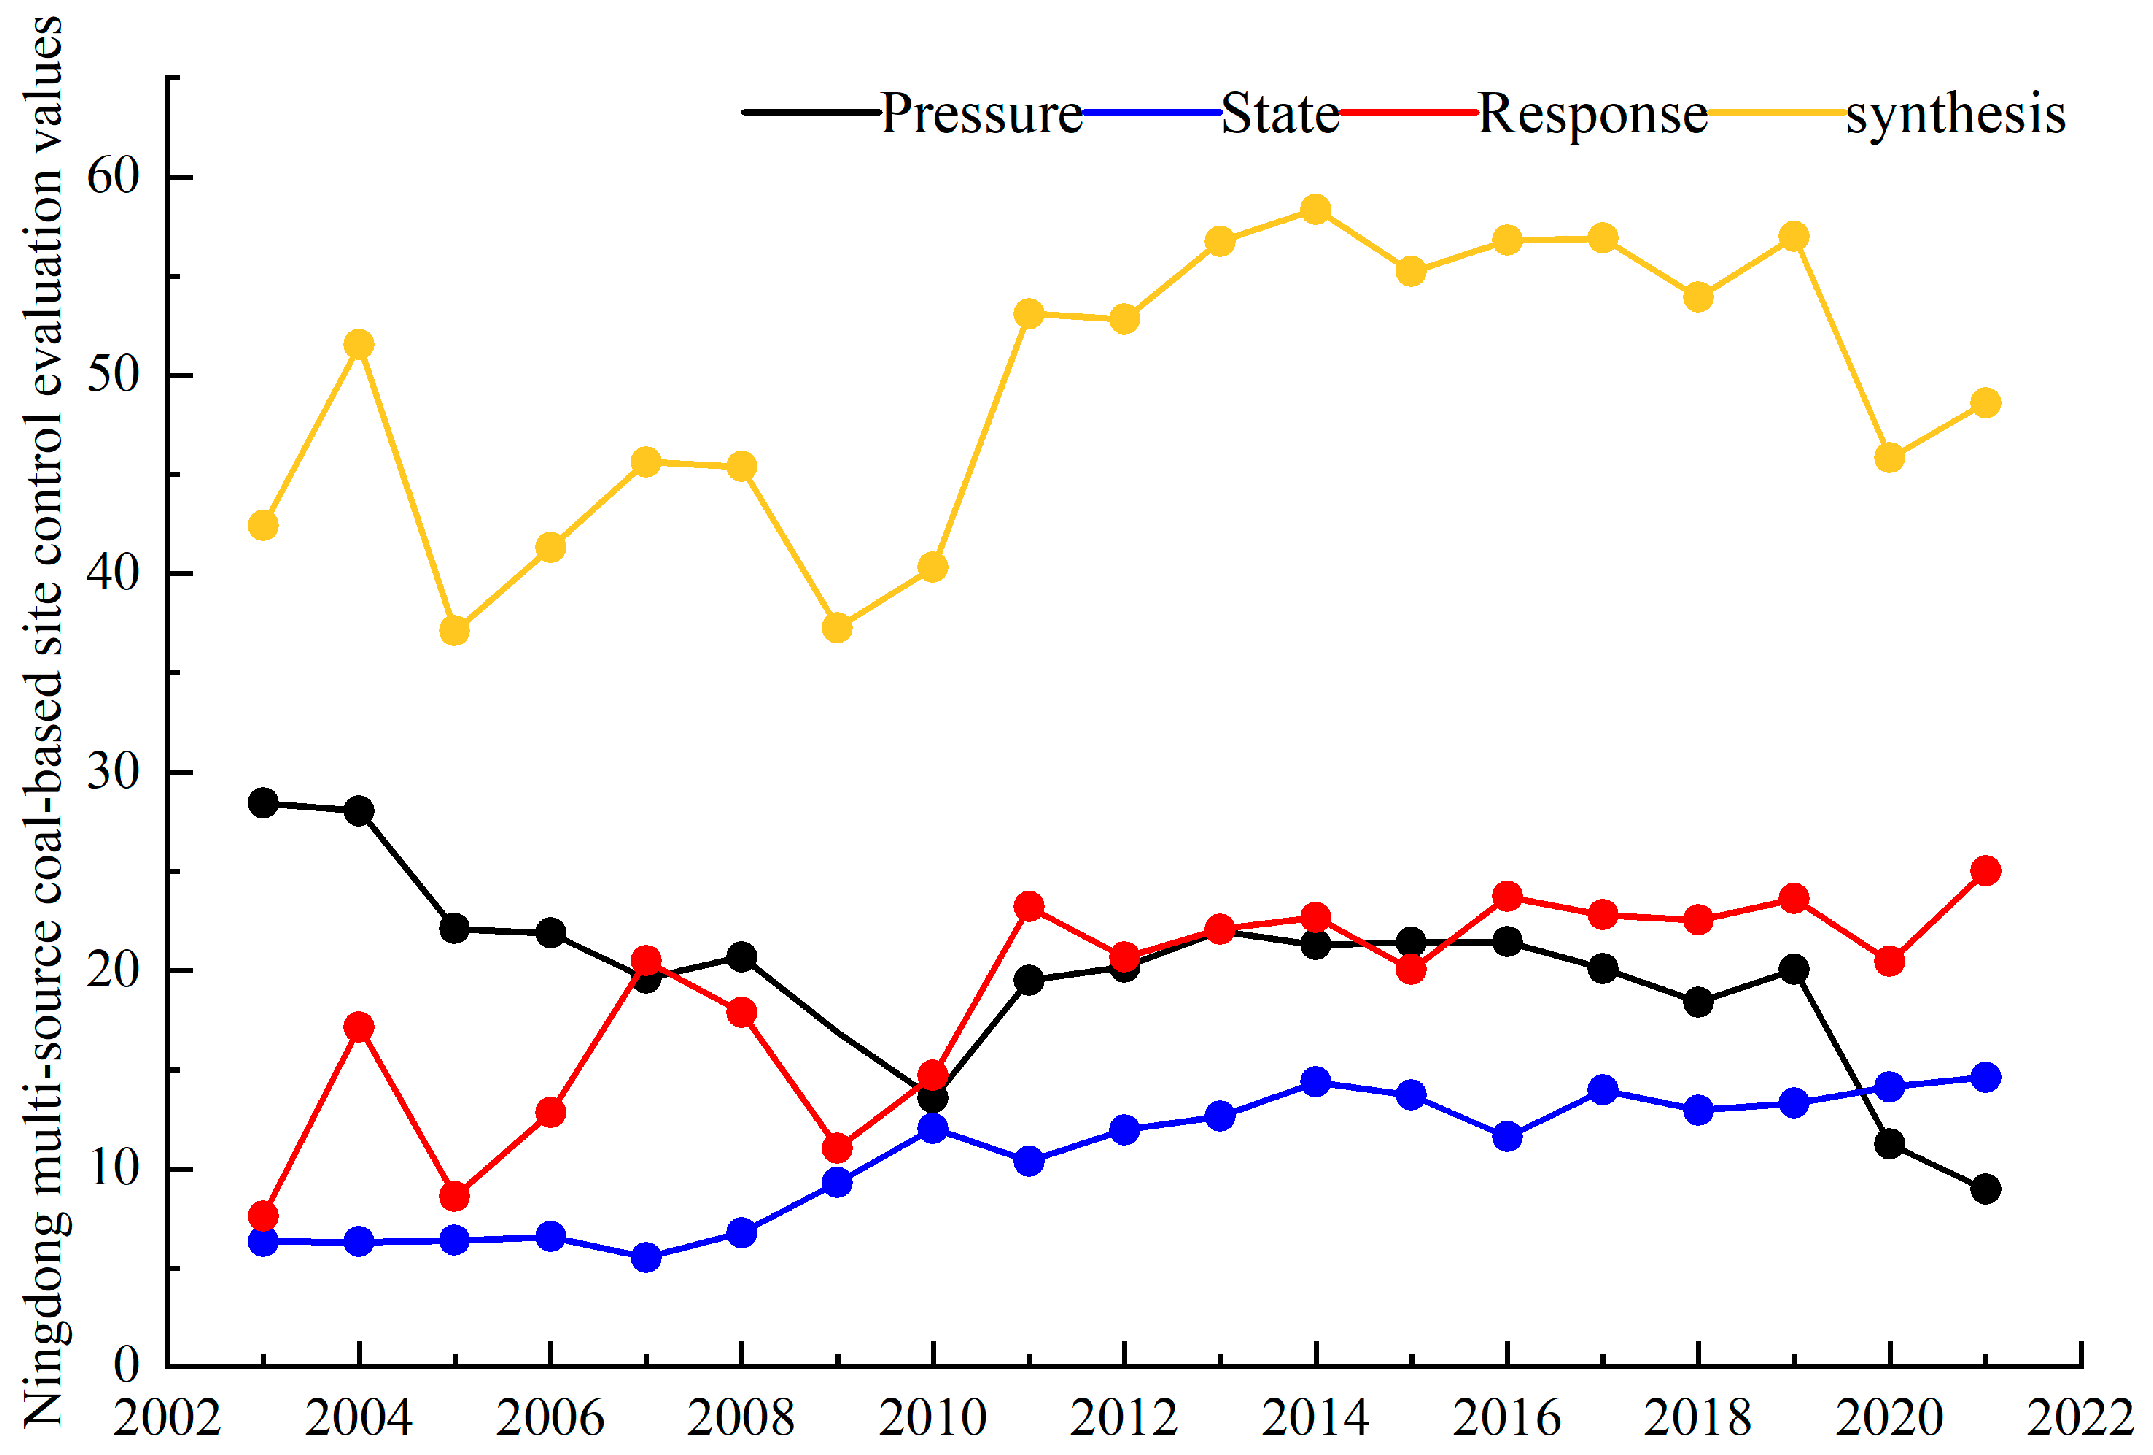
(1) Based on the data presented in Figure 8, it is evident that the overall comprehensive indicators for the Ningdong coal power base have exhibited a gradual upward trend, rising from 42.41 in 2003 to 48.61 in 2021. This trend indicates a continuous improvement in the control of the Ningdong coal power base over this period and that the protection of the environment has achieved certain results. The control score from 2003 to 2011 has a large upward and downward change. But the control score from 2011 to 2019 has a more stable change. There is a clear downward trend in 2020; although the overall trend is improving, the stability is poor, and the effect on the protection of the ecological environment is limited.
(2) Pressure indicators are classified as negative indicators, indicating a negative correlation between the indicator value and environmental force. A higher indicator value indicates a lesser environmental force. As indicated in Table 8, the indicator value shows a downward trend from 2003 to 2010. The Ningdong coal power base is in the early stage of development, and in conjunction with the protective policy responses, its impact on the environment is relatively limited. The significant increase in the indicator value from 2010 to 2011 can be attributed to the proposal of the “Golden Triangle” energy comprehensive development strategy by Mongolia, Shaanxi, Gansu, and Ningxia in 2010. The extensive development of energy in the Ningdong area has had a discernible impact on the ecological environment. The 2019–2021 indicator value has a certain downward trend, and industrial upgrades of the Ningdong coal power base achieved good results.
(3) The status indicator rises from 6.34 points in 2011 to 14.62 points in 2020, showing a clear upward trend, indicating that the ecological environment of the Ningdong coal and electricity base improved to some extent. In 2007, the Ningdong was officially identified as the second batch of national pilot parks for recycling economy in order to realize the transformation of advantages in terms of resources into economic advantages. There was some ecological damage, and there was a decrease in the value of the indicator. The implementation of the 12111 development strategy between 2015 and 2016, characterized by rapid energy development, appears to have exerted significant pressure on the environment, resulting in a substantial decline in environmental indicators. At the twelfth party congress of the Ningxia Hui autonomous region in 2017, it was made clear that the Ningdong coal power base needs to accelerate the construction process to ensure that the coal chemical industry and the fine chemical industry carry on transforming their development. Thus, the amount of environmental pollution was curbed to a certain extent.
(4) The response indicator fluctuated significantly from 2003 to 2011, displaying notable volatility. However, the trend from 2011 to 2021 showed a tendency towards stability, with the response indicator being influenced by a range of factors, most notably government policies. Although there are different rises and falls in each year, the overall trend is upward, from 7.63 points in 2003 to 25.02 points in 2021, and the control of the Ningdong coal power base is better in terms of response indicators.
5.2. Risk Management
The ecosystems of the Ningdong coal-based sites are diverse and abundant, integrating the spatial characteristics of life, production, and ecology. This involves categorizing ecological functions, delineating distinct levels, and aligning them with the levels of suitability for various types of coal-based sites. By leveraging kinetic attitude data, our results from the transfer matrix analysis, and the evaluation scores of the pressure–state–response method, refined risk management and control positioning can be executed. This approach facilitates the formulation of corresponding control strategies aimed at “ecological benefits, economic benefits, and social benefits”, ultimately fostering high-quality sustainable development within the mining area.
5.2.1. Control Zoning Based on Site Characteristics
According to the classification system of multi-source coal-based site utilization, combined with the concept of “three living spaces” and low-carbon synergy, a risk control assessment is carried out for the Ningdong coal power base [29,30,31]. The living area includes the residential gathering area, which is located in the northern/central part of the Ningdong coal power base, and the scattered area is distributed in the southeastern part of the base. The ecological conservation area includes the land covered by green vegetation, bare land, and water, which accounts for the largest area and is the key area for safeguarding and maintaining the ecological environment of the region. The production monitoring and early warning area includes the coal power, coal, and coal chemical industries, which are centrally located in the northern and southeastern parts of the base. The damage and destruction control area is the core area for control and management. The damage repair and reconstruction areas include open-pit mining, solid waste, coal power waste dumps, and chemical waste dumps. And the other control areas include roads and undeveloped land, which account for a small proportion of the Ningdong coal power base.
5.2.2. Risk Control Strategy
As shown in Table 9, the living area mainly prevents the ecological risk from becoming larger and prevents the ecosystem from further evolving and degrading. The ecological maintenance area is susceptible to the impact of the expansion of the industrial site’s encroachment on the one hand and the stacking of coal gangue and chemical waste on the other hand. The implementation of ecological resilience restoration [32] emphasizes near-natural restoration, the conservation of land, the planting of grass, water preservation, and the retention of land untouched by industrial development, etc. We should pay attention to these hazards, as well as the land’s ecological vulnerability. We should also pay attention to the land’s ecological vulnerability to prevent the ecological risks from increasing, which would lead to irreversible ecological evolution. The production monitoring and early warning area is a sensitive area in the core lot, which needs to be protected to prevent the ecological deterioration of the area caused by over-exploitation and energy and chemical waste dumping. The damage repair and reconstruction area implements engineering resilience restoration [33], which covers green technology, dynamic pre-reclamation, waste land remediation, and landscape reclamation engineering, etc. Other control areas reduce anthropogenic damage and therefore implement ecological resilience restoration. Other control zones should reduce the interference of human factors and control risks through the resilience of the ecosystem itself.
6. Conclusions
Firstly, the spatial characteristic classification index system of multi-source coal-based sites in the Ningdong coal power base was constructed, and the characteristic changes in various types of coal-related sites in the Ningdong coal power base were analyzed. The area of coal-based sites had the following distribution from 2003 to 2021: the coal chemical industry > coal > coal power. Secondly, the distribution characteristics and spatial structure of multi-source coal-based sites in the Ningdong coal power base at the regional scale and site scale are clarified. Coal chemical industry sites have the largest scope and are concentrated in the northern region of the base. Thirdly, based on the PSR model, the current control effect of the Ningdong coal power base is evaluated. The overall control effect of the coal power base needs to be improved and enhanced. A risk control strategy is proposed that is compatible with the evolutionary characteristics of the site.
This paper introduces a coal-based site type composition system designed for large-scale coal power bases in Ningdong. It explores the quantity of, variety in, and distribution of multi-source coal-based sites and clarifies the ecological background characteristics of large-scale coal power bases in Ningdong, along with the boundaries of influence from coal-related industries. This paper also contributes data for managing pollution risks at large-scale coal power bases and offers a technological methodology and practical support for controlling potential pollution at these coal-based sites, managing the sites, and conducting ecological restoration in the area. This work holds significant value as a reference for the ecological security of the region, clean production, and low-carbon sustainable development.
Author Contributions
Conceptualization, J.D.; Data curation, X.F.; Funding acquisition, J.D.; Project administration, J.D.; Supervision, K.M. and W.Z.; Validation, Y.R.; Writing—original draft, X.F.; Writing—review and editing, J.D. All authors have read and agreed to the published version of the manuscript.
Funding
This research was funded by the Graduate Innovation Program of China University of Mining and Technology, grant number 2023WLJCRCZL256, and Jinjiaqu Coal Mine Enterprise Project of Ningxia Coal Industry Group Co., LTD.
Data Availability Statement
The Landsat images (2003, 2010, 2021) from USGS can be accessed at https://www.usgs.gov/ (accessed on 5 April 2022). The Sentinel-2 images (2021) from the European Space Agency can be accessed at https://scihub.copernicus.eu/maintenance.html#/home (accessed on 5 April 2022). The data used for the PSR model indicators include the statistical bulletin of the national economic and social development of the Ningxia Hui autonomous region, the statistical yearbook, the statistical yearbook of China’s counties, and statistics published by the Ningdong energy and chemical base.
Conflicts of Interest
The authors declare no conflict of interest.
References
- General Office of the People’s Government of the Autonomous Region on the issuance of the Ningdong Energy and Chemical Industry Base “14th Five-Year Plan” Development Plan Notice-Ningxia. Available online: https://www.nx.gov.cn/zwgk/qzfwj/202112/t20211207_3207682.html (accessed on 6 November 2022).
- Letter from the Department of Ecology and Environment of the Ningxia Hui Autonomous Region on the Co-Operation of Proposal No.056 of the First Session of the Thirteenth National People’s Congress of the Autonomous Region. Available online: https://sthjt.nx.gov.cn/zfxxgk/zfxxgkml/202306/t20230615_4147072.html (accessed on 4 December 2023).
- The Comprehensive Utilization of Coal Gangue Resources to Improve the Quality of the Large Space. Available online: http://paper.people.com.cn/zgnyb/html/2022-06/13/content_25923312.htm (accessed on 6 November 2022).
- Ningdong Energy and Chemical Industry Base to Implement the Second Round of Central Ecological Environmental Protection Supervision Report Rectification Programme. Available online: http://ningdong.nx.gov.cn/xwdt_277/gsgg/202211/t20221117_3847116.html (accessed on 4 December 2023).
- Sarim, M.; Jan, T.; Khattak, S.A.; Mihoub, A.; Jamal, A.; Saeed, M.F.; Soltani-Gerdefaramarzi, S.; Tariq, S.R.; Fernández, M.P.; Mancinelli, R.; et al. Assessment of the Ecological and Health Risks of Potentially Toxic Metals in Agricultural Soils from the Drosh-Shishi Valley, Pakistan. Land 2022, 11, 1663. [Google Scholar] [CrossRef]
- Liang, T.; Werner, T.T.; Heping, X.; Jingsong, Y.; Zeming, S. A Global-Scale Spatial Assessment and Geodatabase of Mine Areas. Glob. Planet. Chang. 2021, 204, 103578. [Google Scholar] [CrossRef]
- Kim, D.-P.; Kim, S.-B.; Back, K.-S. Analysis of Mine Change Using 3D Spatial Information Based on Drone Image. Sustainability 2022, 14, 3433. [Google Scholar] [CrossRef]
- Pre-Acceptance Meeting of the Project “Survey on Land Degradation Factors in Key Mining Areas in the West” Held in Nanjing-China University of Mining and Technology. Available online: https://cesi.cumt.edu.cn/info/1083/1778.htm (accessed on 6 November 2022).
- Yi, S.; Li, X.; Chen, W. A Classification System for the Sustainable Management of Contaminated Sites Coupled with Risk Identification and Value Accounting. Int. J. Environ. Res. Public Health 2023, 20, 1470. [Google Scholar] [CrossRef] [PubMed]
- Beckley, L.; McHugh, T. A Conceptual Model for Vapor Intrusion from Groundwater through Sewer Lines. Sci. Total Environ. 2020, 698, 134283. [Google Scholar] [CrossRef] [PubMed]
- Li, X.; Jiao, W.; Xiao, R.; Chen, W.; Liu, W. Contaminated Sites in China: Countermeasures of Provincial Governments. J. Clean. Prod. 2017, 147, 485–496. [Google Scholar] [CrossRef]
- Wanner, P.; Freis, M.; Peternell, M.; Kelm, V. Risk Classification of Contaminated Sites-Comparison of the Swedish and the German Method. J. Environ. Manag. 2023, 327, 116825. [Google Scholar] [CrossRef] [PubMed]
- Li, X.; Xiao, R.; Chen, W.; Chang, C.; Deng, Y.; Xie, T. A Conceptual Framework for Classification Management of Contaminated Sites in Guangzhou, China. Sustainability 2017, 9, 362. [Google Scholar] [CrossRef]
- The Establishment of the Zoning Control System of “Three Lines and One List” Ecological Environment in Mianyang_Mianyang Municipal People’s Government. Available online: http://www.my.gov.cn/english/dynamic/27006721.html (accessed on 6 November 2023).
- Xu, F.; Shao, Y.; Xu, B.; Li, H.; Xie, X.; Xu, Y.; Pu, L. Evaluation and Zoning of Cultivated Land Quality Based on a Space–Function–Environment. Land 2023, 12, 174. [Google Scholar] [CrossRef]
- Linming, D.; Jinghui, S.; Jiameng, C.; Xianglan, L.; Jingqi, D.; Hongzhen, Z.; Lai, Z. International comparative study of risk classification methods for soil and groundwater contamination in industrial sites. Environ. Pollut. Prev. 2023, 45, 113–121. [Google Scholar] [CrossRef]
- Krzaklewski, W.; Pietrzykowski, M. Site classification in post-mining areas reclaimed for forestry use with special focus on the phytosociological-soil method. Sylwan 2007, 151, 51–57. [Google Scholar] [CrossRef]
- Xu, Z.; Lian, J.; Zhang, J.; Bin, L. Investigating and Optimizing the Water Footprint in a Typical Coal Energy and Chemical Base of China. Sci. Total Environ. 2020, 727, 138781. [Google Scholar] [CrossRef] [PubMed]
- Li, P.; Chen, P.; Shen, J.; Deng, W.; Kang, X.; Wang, G.; Zhou, S. Dynamic Monitoring of Desertification in Ningdong Based on Landsat Images and Machine Learning. Sustainability 2022, 14, 7470. [Google Scholar] [CrossRef]
- Kuang, W.; Zhang, S.; Du, G.; Yan, C.; Wu, S.; Li, R.; Lu, D.; Pan, T.; Ning, J.; Guo, C.; et al. Monitoring Periodically National Land Use Changes and Analyzing Their Spatiotemporal Patterns in China during 2015–2020. J. Geogr. Sci. 2022, 32, 1705–1723. [Google Scholar] [CrossRef]
- Liping, C.; Yujun, S.; Saeed, S. Monitoring and Predicting Land Use and Land Cover Changes Using Remote Sensing and GIS Techniques—A Case Study of a Hilly Area, Jiangle, China. PLoS ONE 2018, 13, e0200493. [Google Scholar] [CrossRef] [PubMed]
- Girma, R.; Moges, A.; Fürst, C. Integrated Modeling of Land Degradation Dynamics and Insights on the Possible Future Management Alternatives in the Gidabo River Basin, Ethiopian Rift Valley. Land 2023, 12, 1809. [Google Scholar] [CrossRef]
- An, X.; Jin, W.; Zhang, H.; Liu, Y.; Zhang, M. Analysis of Long-Term Wetland Variations in China Using Land Use/Land Cover Dataset Derived from Landsat Images. Ecol. Indic. 2022, 145, 109689. [Google Scholar] [CrossRef]
- Zhou, Y.; Li, X.; Liu, Y. Land Use Change and Driving Factors in Rural China during the Period 1995–2015. Land Use Policy 2020, 99, 105048. [Google Scholar] [CrossRef]
- Lai, S.; Sha, J.; Eladawy, A.; Li, X.; Wang, J.; Kurbanov, E.; Lin, Z.; Wu, L.; Han, R.; Su, Y.-C. Evaluation of Ecological Security and Ecological Maintenance Based on Pressure-State-Response (PSR) Model, Case Study: Fuzhou City, China. Hum. Ecol. Risk Assess. Int. J. 2022, 28, 734–761. [Google Scholar] [CrossRef]
- Ashraf, A.; Haroon, M.A.; Ahmad, S.; Abowarda, A.S.; Wei, C.; Liu, X. Use of remote sensing-based pressure-state-response framework for the spatial ecosystem health assessment in Langfang, China. Environ. Sci. Pollut. Res. 2023, 30, 89395–89414. [Google Scholar] [CrossRef]
- Xu, C.; Zhou, K.; Xiong, X.; Gao, F. Assessment of Coal Mining Land Subsidence by Using an Innovative Comprehensive Weighted Cloud Model Combined with a PSR Conceptual Model. Environ. Sci Pollut Res 2022, 29, 18665–18679. [Google Scholar] [CrossRef] [PubMed]
- Qiu, M.; Zuo, Q.; Wu, Q.; Yang, Z.; Zhang, J. Water Ecological Security Assessment and Spatial Autocorrelation Analysis of Prefectural Regions Involved in the Yellow River Basin. Sci. Rep. 2022, 12, 5105. [Google Scholar] [CrossRef] [PubMed]
- China Energy Ningxia Power’s 2 GW Photovoltaic Project Breaks Ground. Available online: https://www.ceic.com/gjnyjtwwEn/xwzx/202110/fd8c8ed5b69644d680a1fe55baf73fb3.shtml (accessed on 6 November 2023).
- Xiao, P.; Xu, J.; Zhao, C. Conflict Identification and Zoning Optimization of “Production-Living-Ecological” Space. Int. J. Environ. Res. Public Health 2022, 19, 7990. [Google Scholar] [CrossRef] [PubMed]
- Xia, N.; Hai, W.; Tang, M.; Song, J.; Quan, W.; Zhang, B.; Ma, Y. Spatiotemporal Evolution Law and Driving Mechanism of Production–Living–Ecological Space from 2000 to 2020 in Xinjiang, China. Ecol. Indic. 2023, 154, 110807. [Google Scholar] [CrossRef]
- Jonathan, W.; Coffman, G. Integrating the resilience concept into ecosystem restoration. Restor. Ecol. 2023, 31, 5. [Google Scholar] [CrossRef]
- Pawar, B.; Park, S.; Hu, P.; Wang, Q. Applications of Resilience Engineering Principles in Different Fields with a Focus on Industrial Systems: A Literature Review. J. Loss Prev. Process Ind. 2021, 69, 104366. [Google Scholar] [CrossRef]
Figure 1.
Location of Ningdong coal power base.

Figure 2.
Regional scale classification map of Ningdong coal power base.

Figure 3.
The transfer matrix of Ningdong coal power base.

Figure 4.
Sentinel-2 local control of site-scale classification. (a) Typical coal power and coal chemical regions. (b) Typical residential areas. (c) Typical coal and coal power areas.
Figure 4.
Sentinel-2 local control of site-scale classification. (a) Typical coal power and coal chemical regions. (b) Typical residential areas. (c) Typical coal and coal power areas.
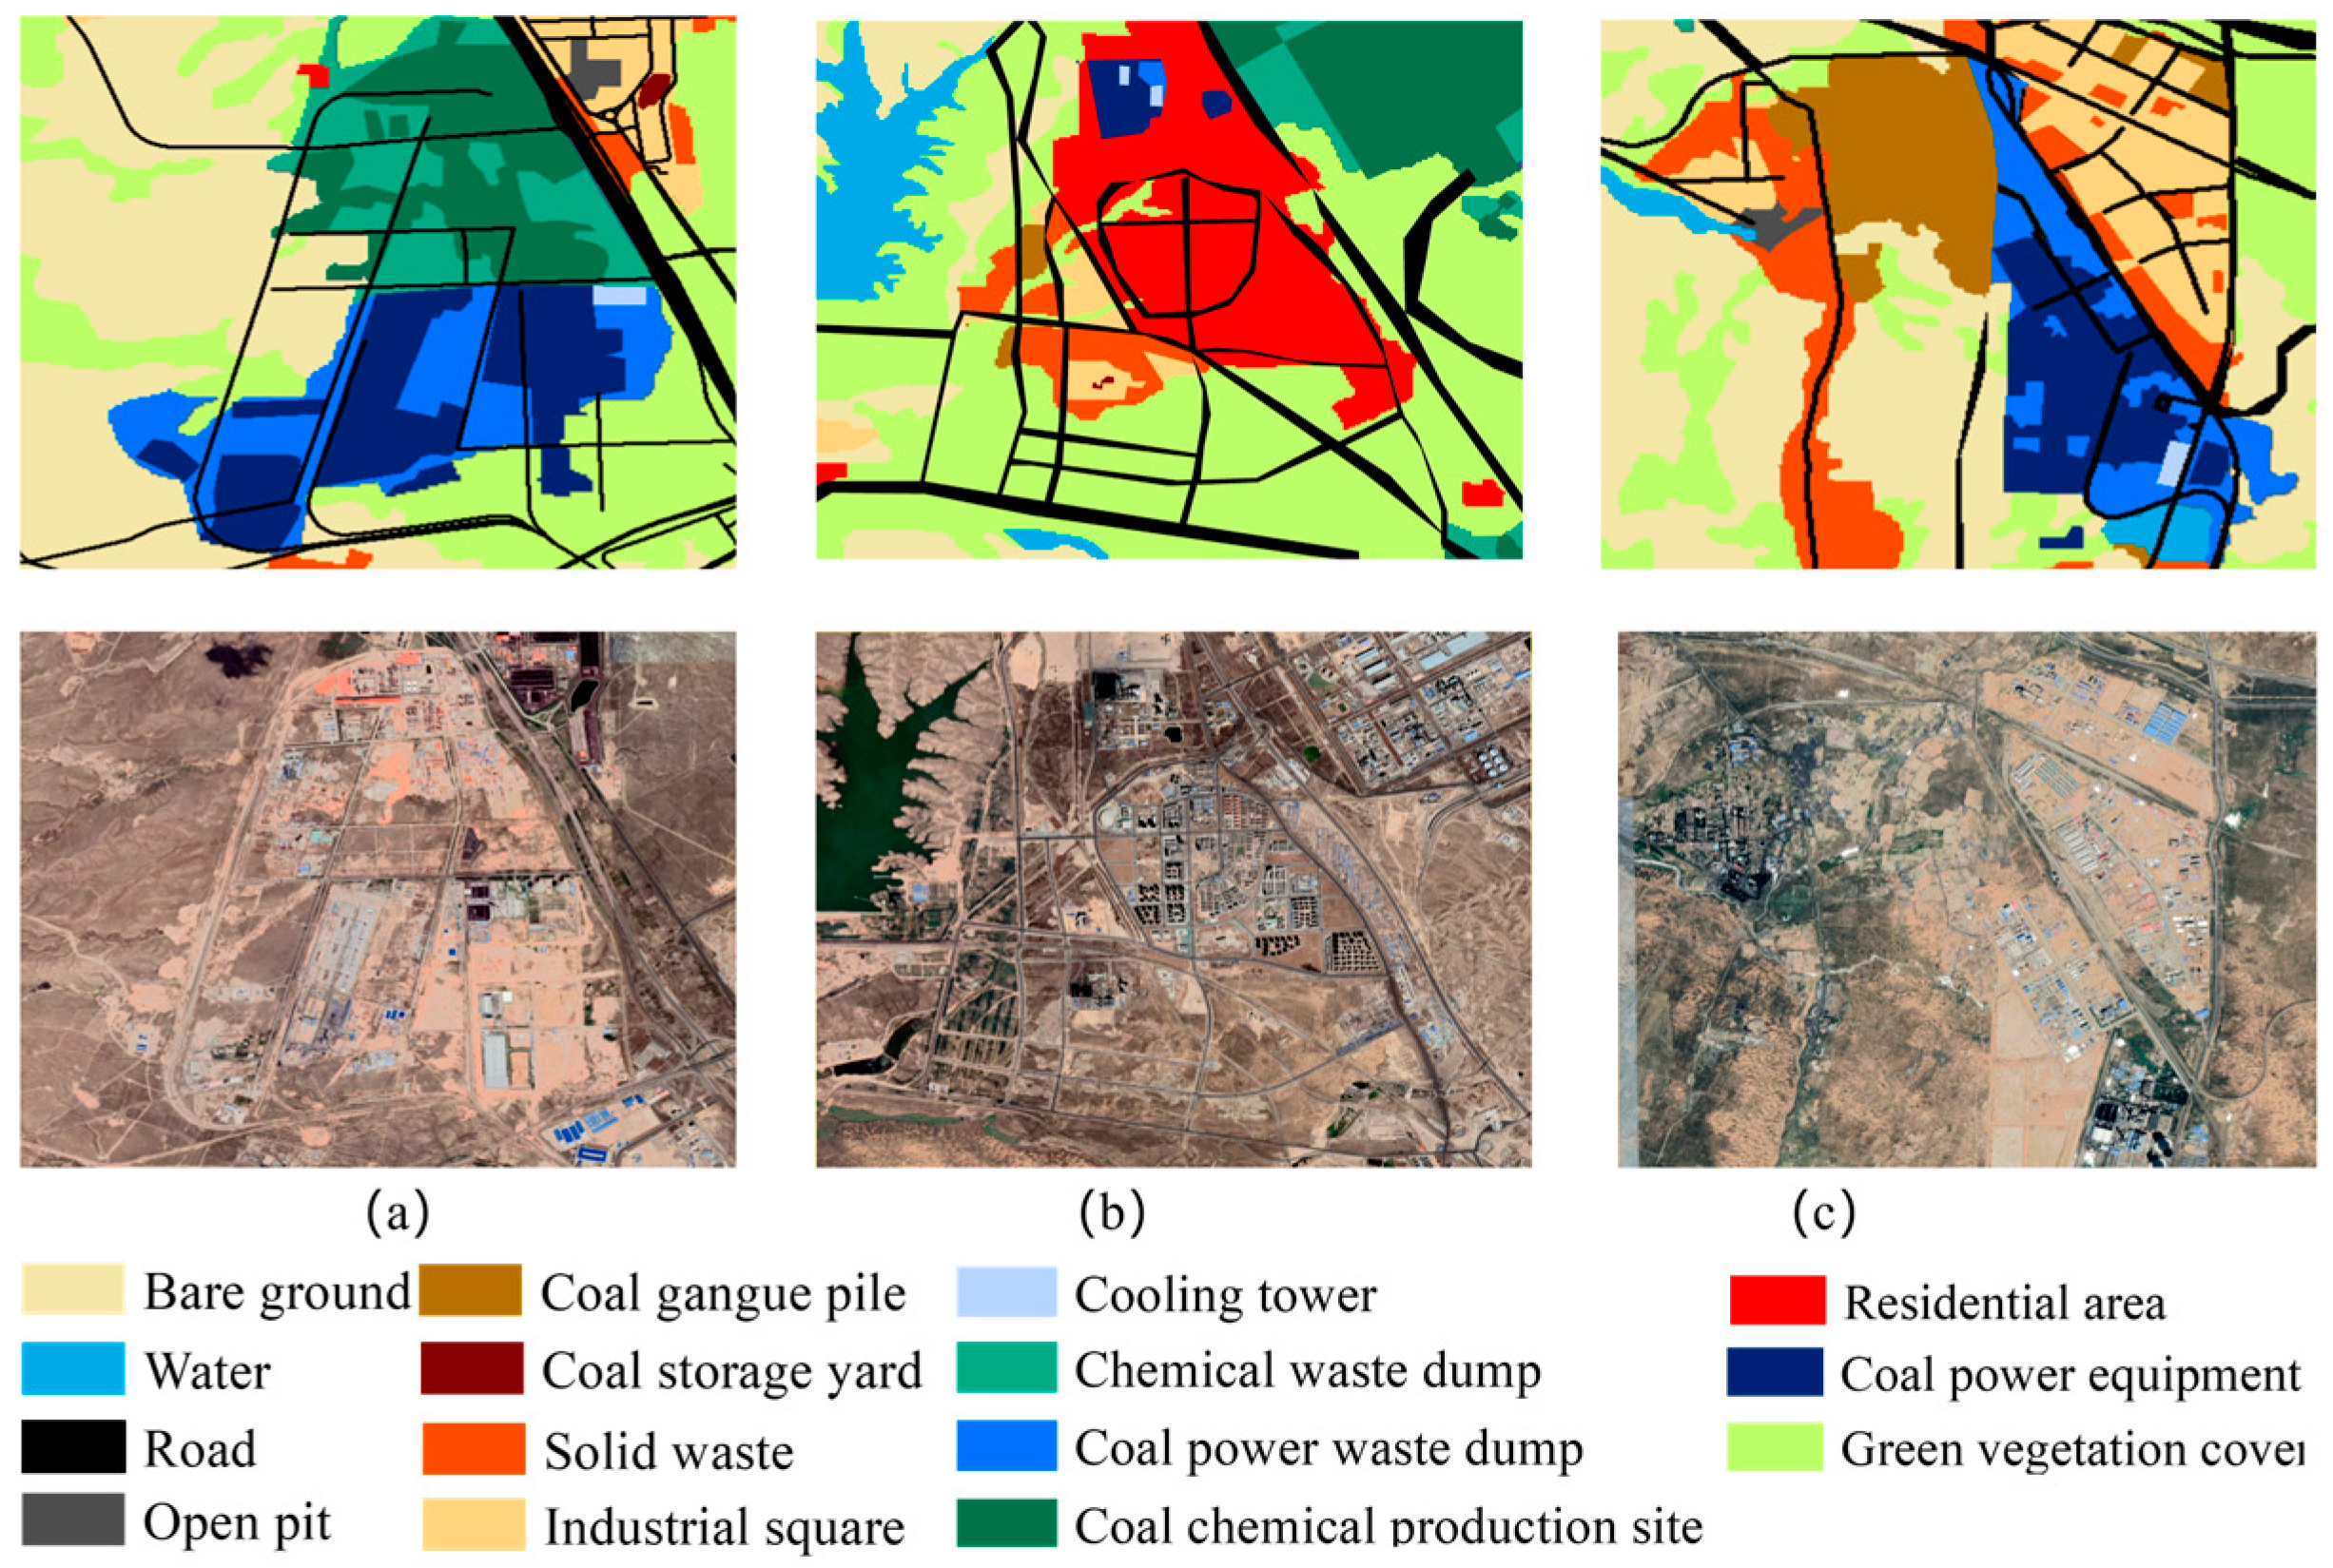
Figure 5.
(A–I) Schematic diagram of coal site structure at Ningdong.
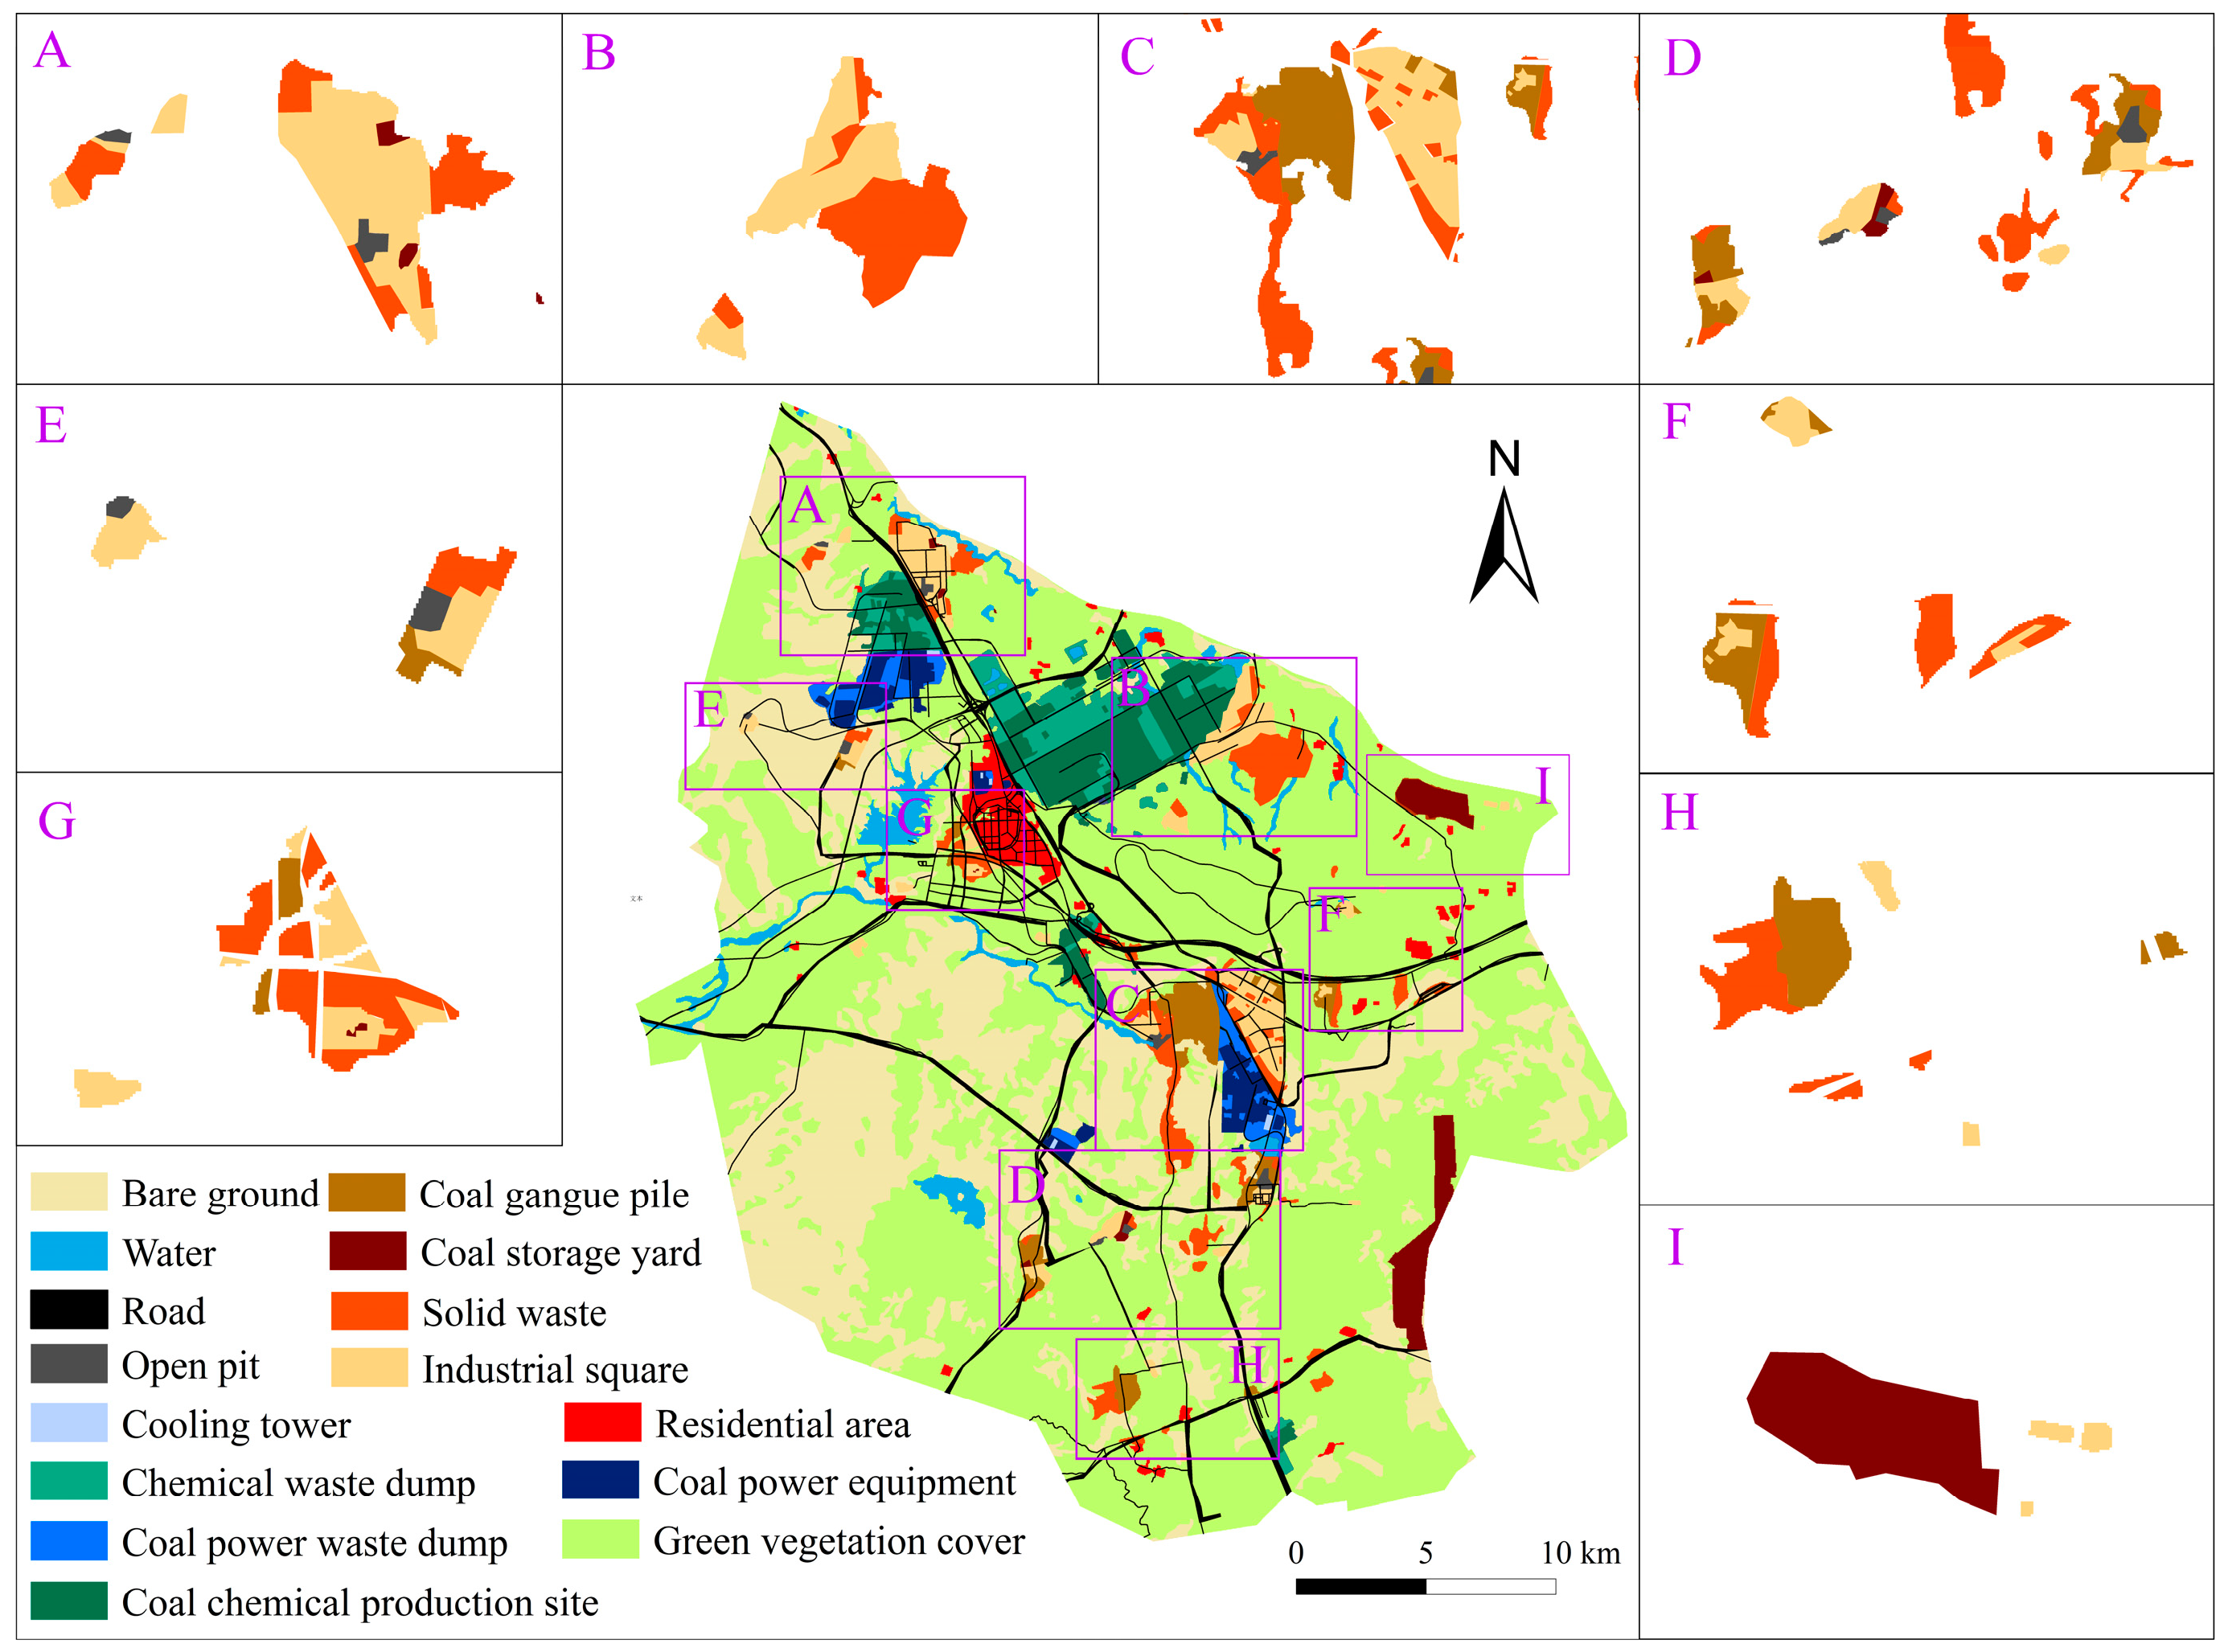
Figure 6.
(A–D) Ningdong coal power site partial map.

Figure 7.
(A–D) Partial view of coal chemical site at Ningdong.
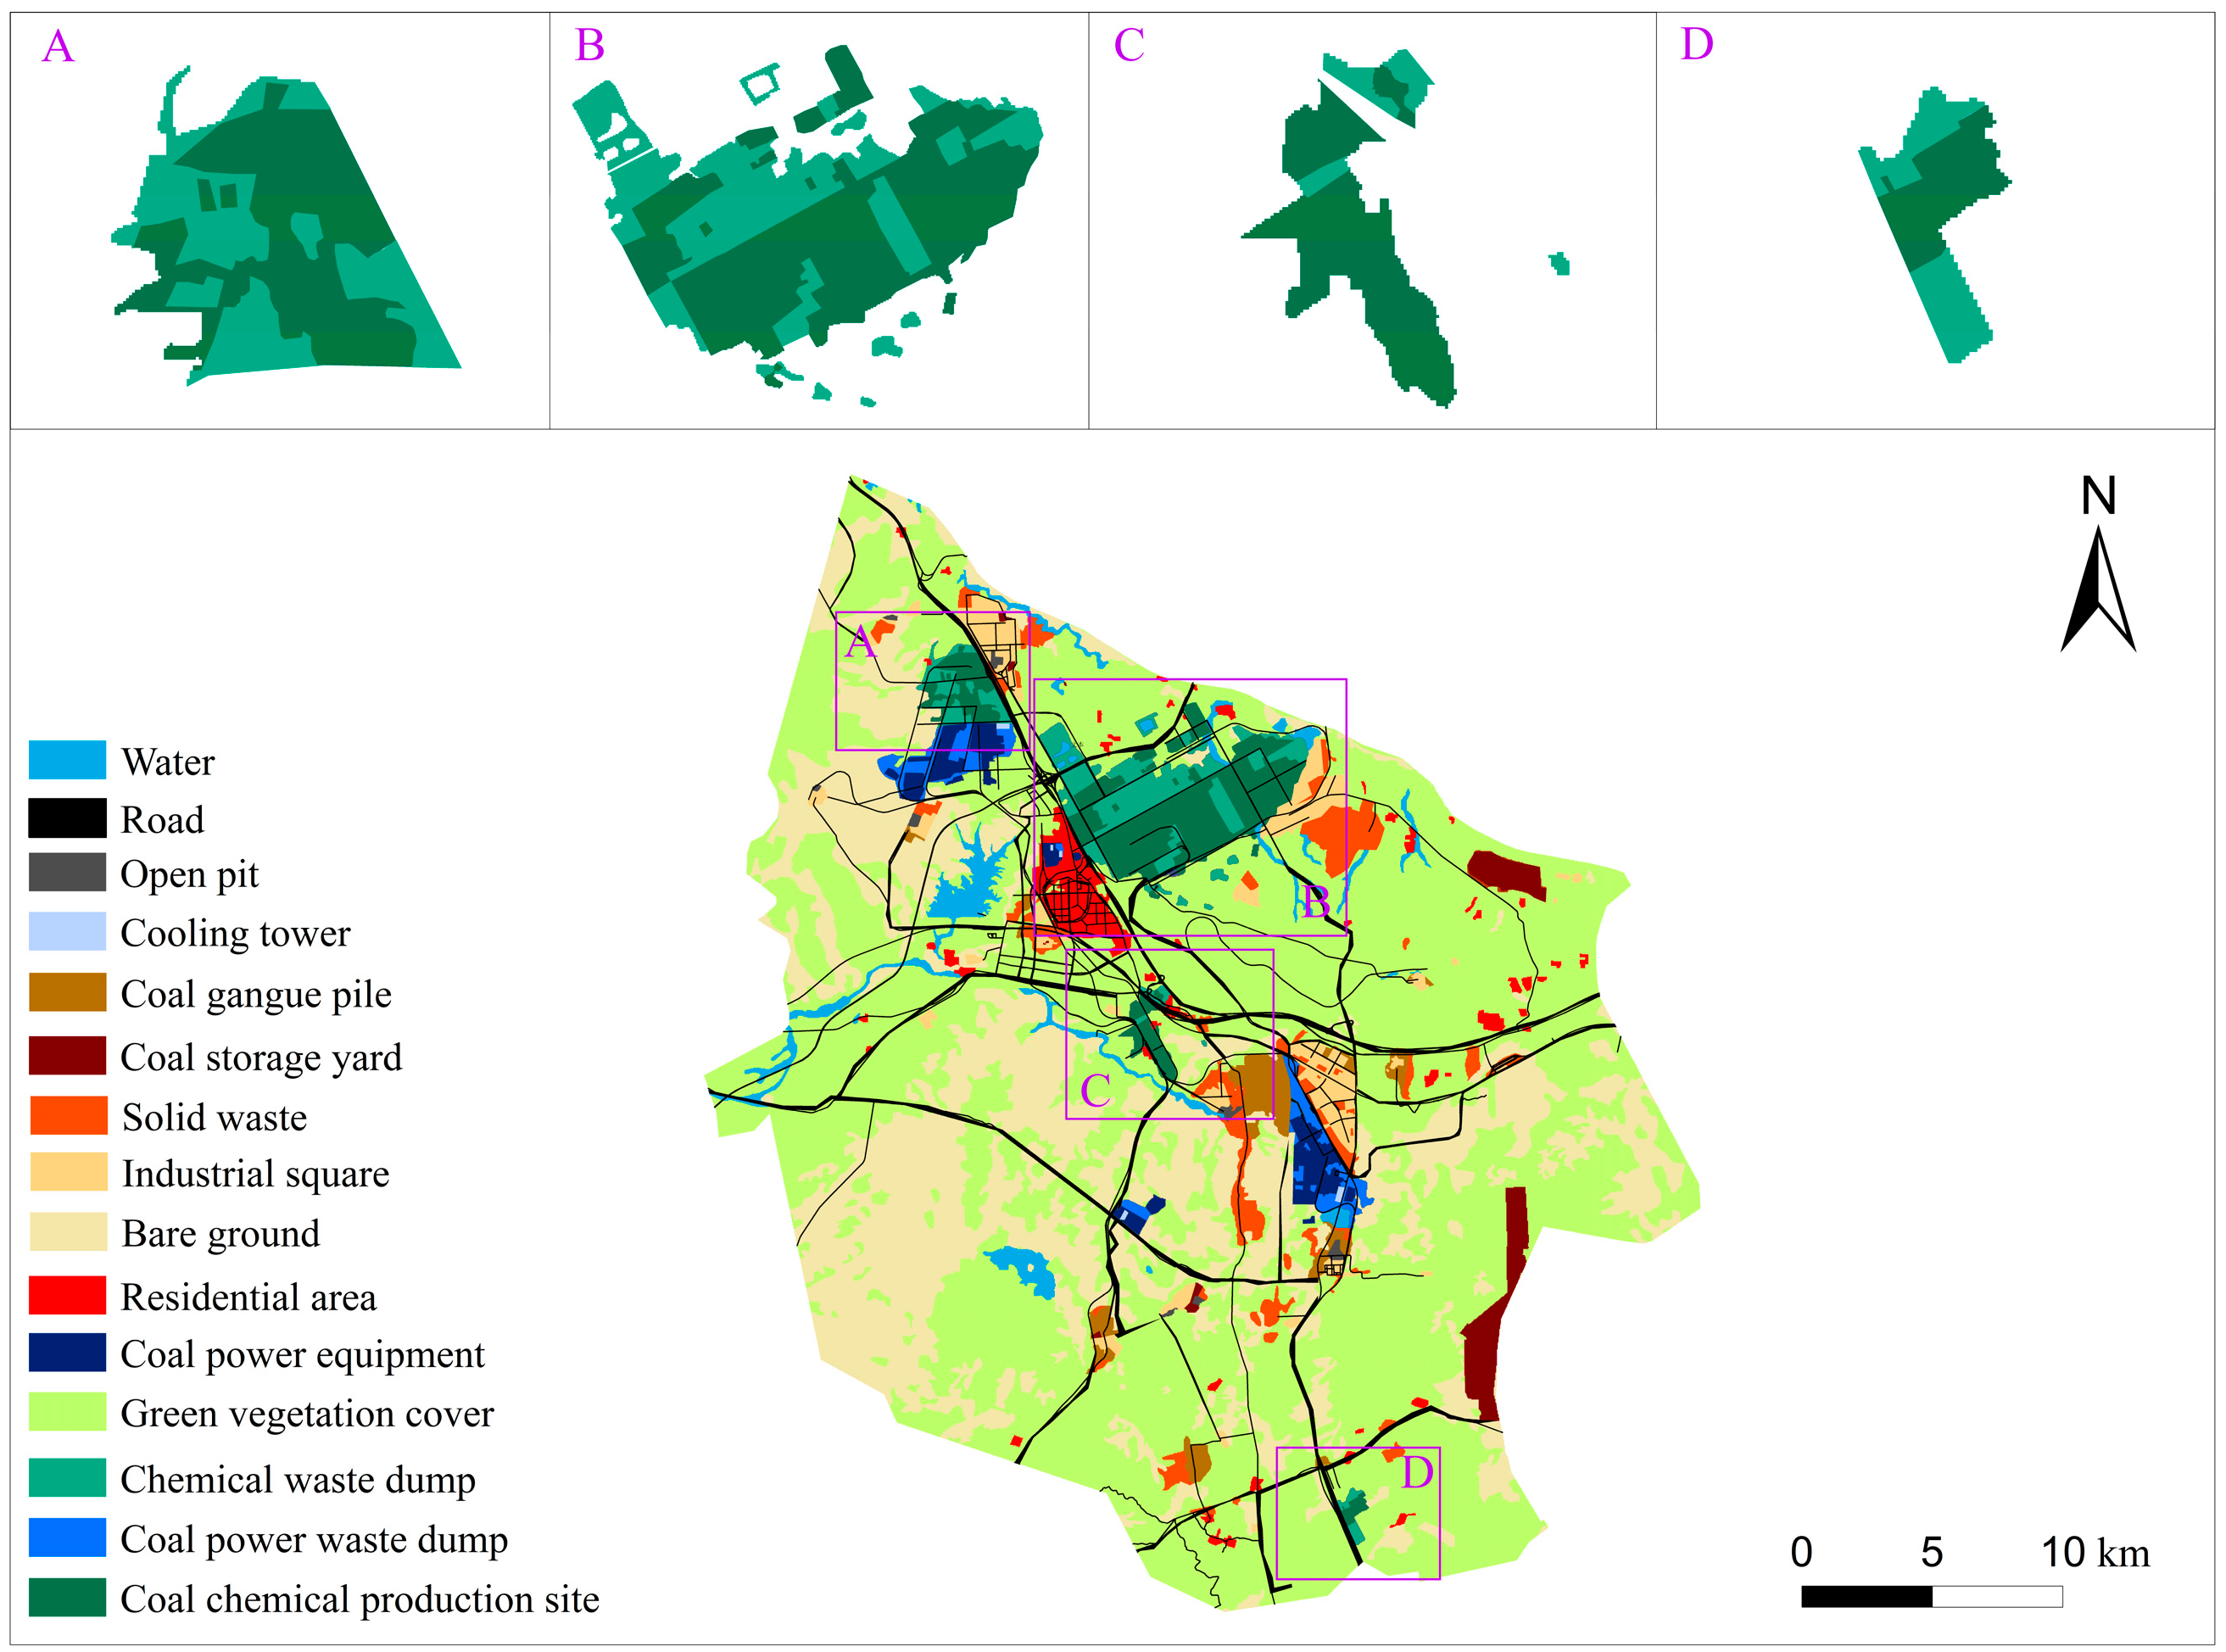
Figure 8.
Ningdong coal power base control evaluation score for 2003–2021.

Table 1.
Image data information.
| Date | Resolution/m | Type | Cloud Cover |
|---|---|---|---|
| 4 December 2003 | 30 | Landsat-TM | 6.00% |
| 8 December 2010 | 30 | Landsat-TM | 6.00% |
| 18 November 2021 | 30 | Landsat-OLI | 2.39% |
| 22 December 2021 | 10 | Sentinel-2 | 4.00% |
Table 2.
Coal-based site characteristic feature classification index system.
| Type | Characteristics | Sample | Type | Characteristics | Sample | ||
|---|---|---|---|---|---|---|---|
| Coal | Open pit | Uniformly toned black; Large patches |  | Coal power | Cooling tower | Black circular area with great height and distinctive shadows, tower of concrete material with distinctive areas of high intensity. |  |
| Industrial square | Around the open pit; Red and blue in shape |  | Coal power equipment | Reddish-blue, regular in shape, concentrated, with neatly distributed equipment |  | ||
| Solid waste | Light or dark grey; Rounded, semicircular, or conical; Patchy texture; Little surface vegetation |  | Coal power waste dumps | Located in the coal powerhouse, rough-textured and irregular in shape |  | ||
| Coal storage yard | Black or light black; Regular in shape; Large in size; Mainly in the vicinity of industrial squares |  | Coalchemical | Coal chemical production sites | Black, bright blue, yellow. or purple in color, with concentrated industrial facilities, regular shapes, and distinct boundaries |  | |
| Coal gangue pile | Light grey; rough textured and irregular in shape |  | Chemical waste dumps | Greyish-white in color with smooth texture and distinct accumulations |  | ||
Table 3.
Regional-scale classification accuracy verification.
| Year | Overall Accuracy | Kappa Factor |
|---|---|---|
| 2003 | 85.176% | 0.8023 |
| 2010 | 85.517% | 0.8220 |
| 2021 | 83.007% | 0.8003 |
Table 4.
Ningdong coal power base utilization type area.
| Year | Green Vegetation Cover | Bare Land | Water | Road | Residential Area | Coal | Coal Power | Coal Chemical |
|---|---|---|---|---|---|---|---|---|
| 2003 | 668.37 | 292.04 | 16.16 | 7.80 | 8.56 | 5.78 | 0.00 | 1.71 |
| 2010 | 636.29 | 266.97 | 16.37 | 18.40 | 14.66 | 29.34 | 6.49 | 11.90 |
| 2021 | 565.09 | 242.14 | 19.84 | 30.95 | 15.11 | 64.55 | 16.01 | 46.73 |
Table 5.
Ningdong coal power base utilization dynamic attitude for 2003–2021.
| Year | Projects | Type of Land Use | |||||||
|---|---|---|---|---|---|---|---|---|---|
| Green Vegetation Cover | Bare Land | Water | Road | Residential Area | Coal | Coal Power | Coal Chemical | ||
| 2003–2010 | Variation/km2 | −32.07 | −25.07 | 0.21 | 10.60 | 6.10 | 23.55 | 6.49 | 10.19 |
| Attitude/% | −0.69% | −1.23% | 0.18% | 19.43% | 10.18% | 58.21% | 0.00% | 85.06% | |
| 2010–2021 | Variation/km2 | −71.21 | −24.83 | 3.47 | 12.55 | 0.45 | 35.21 | 9.52 | 34.83 |
| Attitude/% | −1.02% | −0.85% | 1.93% | 6.20% | 0.28% | 10.91% | 13.34% | 26.60% | |
| 2003–2021 | Variation/km2 | −103.28 | −49.90 | 3.68 | 23.16 | 6.55 | 58.76 | 16.01 | 45.02 |
| Attitude/% | −39.14 | 0.25 | 3.26 | 1.95 | −5.65 | 11.66 | 3.03 | 24.64 | |
Table 6.
Multi-source coal base site area.
| Type | Area/km2 | Percentage/% | Type | Area/km2 | Percentage/% |
|---|---|---|---|---|---|
| Coal | 66.78 | 6.68 | Industrial park | 22.07 | 2.20 |
| Solid waste | 21.59 | 2.16 | |||
| Coal storage area | 11.61 | 1.16 | |||
| Waste rock pile | 10.25 | 1.02 | |||
| Open pit | 1.39 | 0.14 | |||
| Coal power | 18.32 | 4.73 | Cooling tower | 0.41 | 0.04 |
| Coal power equipment | 10.36 | 1.03 | |||
| Coal power waste dumps | 7.55 | 0.75 | |||
| Coal chemical. | 47.35 | 1.83 | Coal chemical production sites | 29.13 | 2.91 |
| Coal chemical waste dumps | 18.54 | 1.85 |
Table 7.
Evaluation index system, weights, and data sources of multi-source coal base sites based on PSR model.
Table 7.
Evaluation index system, weights, and data sources of multi-source coal base sites based on PSR model.
| Target Layers | Normative Layer | Elementary Layer | Indicator Layer | Indicators | Weight | Data Sources |
|---|---|---|---|---|---|---|
| Evaluation index system for control of Ningdong multi-source coal-based sites | Pressure indicator (P) | Socio-economic (P1) | Population of Nindong Township/person | N | 0.0669 | Statistical Yearbook of China’s Counties |
| Mining employment/person | N | 0.0481 | Statistical Yearbook of China’s Counties | |||
| Ecosystems (P2) | General industrial solid waste generation/tons | N | 0.0581 | Ningxia Hui Autonomous Region Statistical Yearbook | ||
| Total industrial wastewater discharge/tons | N | 0.0517 | Ningdong Energy and Chemical Base Statistics | |||
| Total industrial emissions/billion standard cubic meters | N | 0.0579 | Ningdong Energy and Chemical Base Statistics | |||
| Mining land in towns and villages and industrial and mining land/ha | N | 0.0719 | Ningxia Hui Autonomous Region Statistical Yearbook | |||
| Status indicator (S) | Natural state (S1) | Mineral reserves/billion tons | P | 0.0592 | Ningxia Hui Autonomous Region Statistical Yearbook | |
| Socio-economic (S2) | Investment in fixed assets in the mining industry/ten thousand RMB | P | 0.0618 | Ningxia Hui Autonomous Region Statistical Yearbook | ||
| Investment in fixed assets in the electricity, gas and water production, and supply industry/USD million | P | 0.0424 | Ningxia Hui Autonomous Region Statistical Yearbook | |||
| Per capita gross household income of urban residents/USD | P | 0.0476 | Statistical Yearbook of China’s Counties | |||
| Response indicator (R) | Socio-economic (R1) | Mining GDP/billion | P | 0.0516 | Ningdong Energy and Chemical Base Statistics | |
| GDP of electricity, gas, and water production and supply industry/billion dollars | P | 0.0576 | Ningxia Hui Autonomous Region Statistical Yearbook | |||
| Gross mining product as a share of GDP/per cent | P | 0.0613 | Ningxia Hui Autonomous Region Statistical Yearbook | |||
| Internal expenditure on R&D equivalent to GDP/% | P | 0.0448 | Ningxia Hui Autonomous Region Statistical Yearbook | |||
| Total imports/exports/million | P | 0.0508 | Ningxia Hui Autonomous Region Statistical Yearbook | |||
| Ecosystems (R2) | Solid waste management projects/unit | P | 0.0496 | Statistical Yearbook of China’s Counties | ||
| Wastewater treatment projects/unit | P | 0.0495 | Ningxia Hui Autonomous Region Statistical Yearbook | |||
| Exhaust gas treatment project/unit | P | 0.0693 | Ningdong Energy and Chemical Base Statistics |
Table 8.
Ningdong coal power base control evaluation composite score table for 2003–2021.
| Year | Pressure | State | Response | Synthesis | Year | Pressure | State | Response | Synthesis |
|---|---|---|---|---|---|---|---|---|---|
| 2004 | 28.04 | 6.33 | 17.16 | 51.53 | 2014 | 21.30 | 14.38 | 22.67 | 58.35 |
| 2005 | 22.11 | 6.39 | 8.62 | 37.12 | 2015 | 21.43 | 13.73 | 20.05 | 55.21 |
| 2006 | 21.89 | 6.58 | 12.85 | 41.32 | 2016 | 21.45 | 11.63 | 23.72 | 56.80 |
| 2007 | 19.61 | 5.54 | 20.48 | 45.63 | 2017 | 20.10 | 13.99 | 22.81 | 56.90 |
| 2008 | 20.70 | 6.79 | 17.90 | 45.38 | 2018 | 18.40 | 12.97 | 22.56 | 53.93 |
| 2009 | 16.89 | 9.33 | 11.06 | 37.28 | 2019 | 20.05 | 13.31 | 23.62 | 56.98 |
| 2010 | 13.57 | 12.04 | 14.71 | 40.31 | 2020 | 11.25 | 14.14 | 20.45 | 45.84 |
| 2011 | 19.51 | 10.38 | 23.20 | 53.10 | 2021 | 8.97 | 14.62 | 25.02 | 48.61 |
| 2012 | 20.18 | 11.97 | 20.68 | 52.82 |
Table 9.
Multi-source coal-based site zoning control.
| Zoning | Characterization | Control Positioning | Area/km2 |
|---|---|---|---|
| Living area | Residential area | Prevent the increase in regional ecological risks and the further evolution and degradation of ecosystems | 14.28 |
| Ecological conservation area | Green vegetation cover, bare land, water | Ecological resilience restoration | 820.19 |
| Production monitoring and early warning zone | Coal-based sites | Preventing over-exploitation | 83.83 |
| Damage repair and reconstruction area | Open pits, solid waste, coal and power waste dumps, chemical waste dumps | Engineered resilience repair | 49.07 |
| Other regulated area | Roads, undeveloped land | Reducing the impact of anthropogenic disturbances and relying on ecosystem resilience to manage risks | 33.05 |
Disclaimer/Publisher’s Note: The statements, opinions and data contained in all publications are solely those of the individual author(s) and contributor(s) and not of MDPI and/or the editor(s). MDPI and/or the editor(s) disclaim responsibility for any injury to people or property resulting from any ideas, methods, instructions or products referred to in the content. |
© 2023 by the authors. Licensee MDPI, Basel, Switzerland. This article is an open access article distributed under the terms and conditions of the Creative Commons Attribution (CC BY) license (https://creativecommons.org/licenses/by/4.0/).
Share and Cite
MDPI and ACS Style
Ren, Y.; Feng, X.; Ma, K.; Zhai, W.; Dong, J. Precise Identification of Site Characteristics and Risk Management of Ningdong Coal Power Base. Land 2024, 13, 3. https://doi.org/10.3390/land13010003
AMA Style
Ren Y, Feng X, Ma K, Zhai W, Dong J. Precise Identification of Site Characteristics and Risk Management of Ningdong Coal Power Base. Land. 2024; 13(1):3. https://doi.org/10.3390/land13010003
Chicago/Turabian StyleRen, Yuxin, Xiaotong Feng, Kun Ma, Wen Zhai, and Jihong Dong. 2024. "Precise Identification of Site Characteristics and Risk Management of Ningdong Coal Power Base" Land 13, no. 1: 3. https://doi.org/10.3390/land13010003
Note that from the first issue of 2016, this journal uses article numbers instead of page numbers. See further details here.