Abstract
Healthy ecosystems are crucial for sustainable regional development. The lack of spatial distribution patterns and driving factors of ecosystem health limited ecosystem management and urban planning. Understanding the spatiotemporal variation characteristics of ecosystem health and its driving factors can contribute to ecosystem management. Based on the “vigor–organization–resilience” (VOR) framework, this paper focuses on increasing ESs and forming an improved “vigor–organization–resilience–ecosystem services (VORS)” framework to evaluate the ecosystem health of Guizhou Province in 2010 and 2020. At the same time, we used the geographic detector model to investigate the driving factors of ecosystem health in the region. The results revealed the following: (1) The areas of forest land accounted for more than 52%. Simultaneously, farmland and forest land decreased, while construction land increased from 2010 to 2020. Construction land was mainly converted from forest land, grassland and farmland. (2) The level of ecosystem health in Guizhou Province spatially increased from northwest to southeast, with the central part exhibiting the lowest health level. The ecosystem health index (EHI) was mainly moderate, accounting for 78.32% and 83.80% in 2010 and 2020, respectively. (3) Among the 11 selected driving factors, the gross domestic product (GDP), general public budget revenue, annual average temperature, average annual precipitation, and night light index significantly affected ecosystem health. Our research refines ecosystem health research and the results will contribute to effective and precise decision-making in ecosystem management and the implementation of land use policies.
1. Introduction
As the foundation of human survival and development, natural ecosystems provide abundant food and fuel resources, regulate the climate, and maintain biodiversity [,,]. Moreover, healthy ecosystems are crucial for economic and societal development. Therefore, assessing ecosystem health is vital to providing sufficient support for ecosystem conservation efforts []. However, anthropogenic disturbances to regional ecosystems have been gradually increasing, inducing various environmental problems and weakening ecosystem functions at global or regional scales due to increasing industrialization and urbanization. These disturbances include water scarcity [,,], soil erosion [,,], rock desertification [,], and biodiversity reduction [,]. At the same time, urbanization and industrialization have led to changes in land use patterns and increased land fragmentation, which has a significant impact on ecosystems, including the loss of habitats, reduction in productivity in agriculture and forests, and decreases in the climate-regulating functions provided by plants [].
Several studies have focused on the significance of ecosystem health, whereas only a few studies have focused on ecosystem health assessment. Schaeffer et al. introduced the concept of ecosystem health metrics, which combined ecosystem health with human and nonhuman animal health []. Ropport proposed a specific meaning of ecosystem health, defining it as the stability and sustainability of an ecosystem. Additionally, he stated that a healthy ecosystem should be able to preserve its organization and recover under external pressure []. In 1993, Costanza argued that a healthy ecosystem should be the desired endpoint of environmental management []. Several macroecological studies have highlighted ecosystem health as fundamental to comprehensive ecosystem evaluation and a critical problem facing ecosystem management [,,,,]. Generally, ecosystem health refers to the capacity of an ecosystem to preserve its structural and functional integrity and recover from external damage.
Hence, researchers have increasingly devoted themselves to assessing ecosystem health at various scales worldwide, including selecting assessment methods, and establishing indicator systems. Different assessment methods have been developed and modified for the scientific evaluation of the ecosystem health index (EHI) in recent decades. These methods include the vigor–organization–resilience (VOR) framework [,], the pressure state response model [,,], the hierarchical analysis method [,,], principal component analysis [], and the fuzzy evaluation method [,]. Most relevant studies showed that the VOR framework, proposed by Rapport in 1989 [], has been extensively used. Furthermore, several studies have confirmed that the VOR framework is more effective than other classifications in various fields of ecosystem assessment, such as grasslands [,], forests [], watersheds [,], wetlands [], and cities [,,]. However, the VOR framework focused on measuring ecosystem status and resilience to external disturbances, ignoring that a healthy ecosystem can provide ecosystem services (ESs) for the economy and society [,]. The Millennium Ecosystem Assessment noted that ESs were defined as a wide range of goods and services provided by ecosystems for human welfare [,]. ESs, as benefits or a form of well-being to society, are closely associated with the functioning of ecosystems. Hence, the vigor–organization–resilience–ecosystem services (VORS) framework was developed by combining the state, structure, and functions of ecosystems with ESs. Yan et al. adopted the VORS framework to assess ecosystem health in the upstream region of the Liao River Basin using seven indicators, including net primary production (NPP), the Shannon diversity index (SHDI), and ecology elasticity []. Pan et al. selected the NPP, landscape index, ecosystem resilience, grain production, and water yield of the Invest model to assess ecosystem health based on the VORS framework []. The VORS framework can be used to express both the quality and services of natural ecosystems [], which can be expressed through ecosystem status, external disturbances, and the stability of ecological service provision. Consequently, we employed the VORS framework in this study to evaluate ecosystem health in Guizhou Province.
Ecosystem health is closely related to natural and socioeconomic conditions such as temperature, slope, population growth, and urban expansion. Many previous studies have proven this relationship using regression [,], principal component [], and correlation analyses []. Although these models enable the identification of influencing factors in ecosystem health, they often neglect the multicollinearity and spatial relationships among these factors [,]. Compared to these models, the geographical detector (GD) model has the advantage of handling spatial correlations and evaluating weights of factors with non-normal distributions and nonlinearities []. Because the GD model can detect spatial differentiation for measuring the significance of stratified heterogeneity [], it has been used in several studies, including those regarding land degradation [], urban shrinkage [], tourism eco-efficiency [], and urban park use []. Considering its effectiveness in exploring the strength of driving factors, the GD model has been commonly applied to quantitatively explore the various driving factors of ecosystem health.
Guizhou Province has a reputation for being a typical karst region. The karst landscape in this region occupies 62% of the total area, making the local ecosystem sensitive and fragile and ultimately causing soil erosion, rock desertification, and biodiversity reduction. In recent decades, owing to China’s Western Development Strategy, Guizhou Province has experienced rapid economic and population growth []. However, these developments have caused significant landscape changes, exerted substantial pressure on the ecosystem, and severely jeopardized the region’s ability for sustainable ecological development [], leading to issues such as rocky desertification and soil erosion [,]. Hence, investigating ecosystem health in this region and implementing effective measures to improve the environmental situation are essential. Presently, only a few studies have explored ecosystem health in China’s karst regions, with some exploring this issue at the county level, including regions such as Qiannan Prefecture, Huajiang Demonstration Area, Guiyang City, and Bailidujuan Forest Park [,,]. Previous studies have mostly concentrated on evaluating ecosystem health in small regions rather than at the provincial scale. Research at the provincial level can show healthy ecosystem changes in the entire Guizhou Province and is crucial for protecting the ecological environment and the rational use of land in this region.
By combing through the existing research results, it was found that the change of land use types affects landscape structure, biodiversity, environmental and socio-economic changes, which in turn affects ecosystem services and ecosystem health []. Therefore, the study of use land use patterns is of great significance for evaluating ecological effects []. Many researchers studied regional ecosystem health based on the VOR framework [,], and focused on ecosystem structures and status, while ignoring the ESs provided by the ecosystem to humans. ESs are the welfare and well-being that the ecosystem provides to human society. Some findings also focused on ESs and used them to measure the integrity of ecosystem health []. However, ESV was mostly used to calculate ESs, which was based on the value-equivalent factor of ecosystem services to evaluate ESs. The ecosystem service assessment matrix can reveal the capacity of different ecosystems to provide ecosystem services under land use patterns. Therefore, it is necessary to introduce ESs to improve the VORS framework. Additionally, in terms of driving factors, regression and principal component analysis often neglect the multicollinearity and spatial relationships among factors. The GD model can measure the significance of stratified heterogeneity by detecting spatial differentiation, so the GD model was used to measure driving factors.
As a typical karst area, Guizhou Province has a fragile ecological environment. In recent decades, the rapid urbanization of Guizhou Province has led to significant changes in land use types, changed the structure and function of the ecosystem, and resulted in ecological and environmental problems such as soil erosion, rocky desertification, biodiversity loss, and farmland vigor download. How to achieve the coordinated development of ecosystem health and socio-economic status has become an urgent issue to promote the high-quality development of Guizhou Province. Therefore, it is necessary to evaluate the ecosystem health of Guizhou Province. Systematic ecosystem health evaluation should address two issues: the diagnosis of the ecosystem health level and the discussion of driving factors of ecosystem health. In this study, Guizhou Province has been taken as the study area, and we aimed to explore the following: (1) temporal and spatial changes in land use; (2) spatiotemporal variation characteristics of ecosystem health; (3) quantitatively exploring the driving factors of ecosystem health. This paper aimed to provide references and suggestions for policy choices regarding environmental protection and ecological restoration.
2. Materials and Methods
2.1. Research Area
Guizhou Province has a total area of 176,000 km2 (103°36′–109°35′ E; 24°37′–29°13′ N) (Figure 1). The region has faced severe ecological challenges (e.g., soil erosion) due to its typical karst landscape and sensitive ecosystem [,]. In recent years, Guizhou Province has increased its ecological rectification and protection efforts, such as conducting mine ecological restoration and the integrated protection and restoration project in the Wuling mountain area. These policies and projects ensure the sound development of ecology in Guizhou Province.
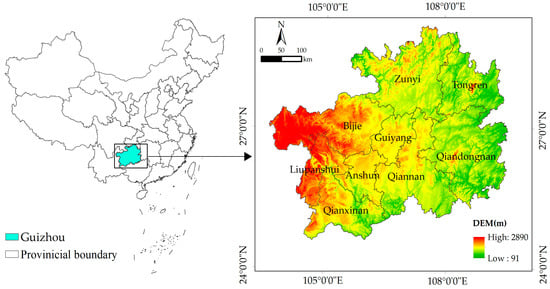
Figure 1.
Study area.
Guizhou Province comprises 6 prefecture-level cities, 3 ethnic autonomous prefectures, and 88 counties. In 2020, the regional gross domestic product (GDP) of Guizhou Province was CNY 178.26 billion, increasing by 4.5% compared to that in 2019. The urbanization rate in Guizhou Province was 33.81% in 2010 and 53.15% in 2020, with an increase of 20% over the last decade. Rapid urbanization affected land use in Guizhou Province, negatively impacting its ecosystems []. Economic development, urban expansion, and fragile karst landscapes have severely disrupted ecosystem health in Guizhou Province.
2.2. Data Description
The data contained statistical and spatial data. All spatial data were resampled to 1 km using ArcGIS 10.7 software. The data were preprocessed using ArcGIS 10.7 and Fragstats 4.2 software. Ecosystem organization was calculated using Fragstats 4.2 software. Ecosystem resilience and ESs were calculated using ArcGIS 10.7. The detailed data description is shown in Table 1.

Table 1.
Data sources.
2.3. Methods
2.3.1. Framework for Ecosystem Health Assessment
The research framework in this study comprised two stages (Figure 2). In the first stage, the vigor, organization, resilience, and ESs in 2010 and 2020 were separately quantified. Then, the EHI of Guizhou Province was evaluated. Land use was identified as one of the key influencing factors for ESs [,]. Therefore, the ES supply and demand evaluation matrices proposed by Burkhard et al. [] were adopted to assess ESs in Guizhou Province. In the second stage, the GD model was applied to identify key factors that significantly affected ecosystem health in Guizhou Province between 2010 and 2020.
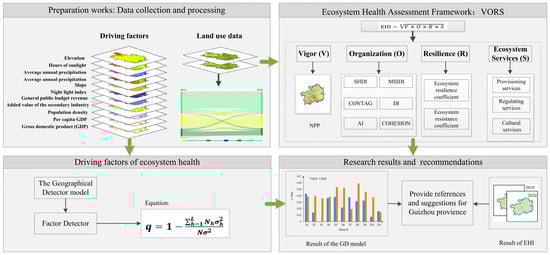
Figure 2.
Framework for ecosystem health assessment in Guizhou Province.
2.3.2. Ecosystem Health Evaluation
A healthy ecosystem should be able to support its sustainable development and supply ESs to humans. Ecosystem health was assessed using the following four indicators: vigor, organization, resilience, and ESs, which were generally measured using the EHI [,,]. Among them, the ecological benefits of humans were quantified based on services, and the integrity of the ecosystem structure and function was measured using the following three indicators: vigor, organization, and resilience. The ecosystem was considered healthy when its structure, functions, and processes were relatively stable and had the capacity to continuously provide ESs for human survival and social development []. They were thought to have equivalent effects on ecosystem health and were given similar weight for the EHI [,]. The EHI is determined as follows:
where, the EHI indicates the ecosystem health index, V represents ecosystem vigor, O signifies ecosystem organization, R indicates ecosystem resilience, and S represents ecosystem services.
The relevant indicators for assessing ecosystem health were difficult to analyze and evaluate. To finish the calculation and comparison of the data, we had to normalize each indicator and remove any dimensional variations. The normalization range approach was used to standardize positive and negative indicators within a range of 0–1 [,]. The computation formulas are as follows:
where, Yij is the standardized value of xij, xij is the value of the index j in year i, and xjmax and xjmin are the maximum and minimum values of the indicator j in all the years.
Ecosystem vigor typically refers to the metabolic ability, activity, or NPP of an ecosystem []. Previous studies have confirmed that NPP is more efficient for measuring ecosystem vigor than are other factors [,,]. NPP represents plant productivity, indicating the amount of energy plants use for growth and reproduction after primarily consuming energy for respiration. In this study, NPP was determined as the index for expressing ecosystem vigor in Guizhou Province.
Ecosystem organization refers to the ability of an ecosystem to remain stable under pressure from anthropological activities [,]. It is typically evaluated using three categories of landscape pattern indexes: heterogeneity, connectivity, and morphology []. Specifically, the SHDI [] and modified Simpson diversity index [] were used to quantify landscape heterogeneity. The contagion Index [] and landscape division Index [] were used to demonstrate landscape connectivity, while the aggregation index and patch cohesion Index were used to demonstrate landscape morphology [].
Ecosystem organization represents the number and diversity of the relationships between components. The richness of the landscape factors corresponds to the complexity of ecosystems, and complex organizational structures present a healthy ecosystem []. The landscape diversity index was positively correlated with the complexity of the landscape. Moreover, each category of the landscape structure indexes contributes differently to ecosystem organization, as illustrated by assigning appropriate weights in the overall assessment process. Landscape heterogeneity and landscape connectivity affect ecosystem health, describe different aspects of the ecosystem structure and cannot be substituted for one another; the weight of these two aspects needs to be equal. In this study, the weights were set as 0.35 [,]. However, landscape morphology plays a comparatively lesser role; thus, its weight was set to 0.3 [,]. SHDI and CONTAG are more important than MSIDI and DI because they can determine whether or not the landscape is clustered or fragmented. Therefore, SHDI and CONTAG were set to 0.2, whereas MSIDI and DI were set to 0.15 []. Since AI and COHESION are equally dominant in landscape morphology, their weights were both set to 0.15. The weight of each variable can be determined based on relevant research [,]. The specific equation is expressed as follows:
where, EO represents ecosystem organization, LH signifies landscape heterogeneity, LC denotes landscape connectivity, CC represents the patch connectivity index of important ecological functions, SHDI indicates the Shannon diversity index, MSIDI represents the modified Simpson diversity index, CONTAG represents the contagion index, DI is the landscape division index, AI indicates the aggregation index, and COHESION signifies the patch cohesion index.
Ecosystem resilience refers to the ability of an ecosystem to preserve its original function and status after suffering external disruptions []. Ecosystem resilience generally encompasses two aspects: (1) the ability to resist external disturbances and maintain stability by avoiding decline or damage through self-regulatory mechanisms, measured by the ecosystem resilience coefficient; (2) the ability to recover from damages caused by external disturbances, measured by the ecosystem resistance coefficient. If the external disturbance is so great that the self-regulatory ability is extremely weak, resilience is more emphasized. Conversely, if the capacity for self-regulation and recovery is smaller than that for resistance to external disturbances, more attention is paid to the resistance. Since land use contributed to ecosystem resilience in different ways, the summation of area-weighted ecosystem resilience coefficients for all land use types was employed to measure ecosystem resilience [,]. In general, land use types that reflect natural ecosystems may recover more easily when experiencing external stress, whereas human-dominated land use types (construction land) are less resilient to external pressures []. Based on relevant reference materials, ecosystem resilience was determined [,,]. In this study, both coefficients were assigned based on land use types in Guizhou Province, which were reclassified into six types (Table 2).
Table 2.
Resilience and resistance coefficients of different land use types.
As for the weighting setting, the weights were determined based on whether or not the self-regulation ability of the ecosystem exceeds the external interference. If external disturbances are less than the self–adjustment ability of the ecosystem, resistance should be emphasized []. Because the regional development of Guizhou Province was slow and human interference was relatively low, the weight of resistance was higher than that of resilience, with the resilience and resistance values being 0.4 and 0.6, respectively [,]. The equation is as follows:
where, R is ecosystem resilience. Cresilience and Cresistance represent the ecosystem resilience and resistance coefficients, respectively, of land use type i in the study area.
ESs are referred to as environmental service functions []. In addition, ESs refer to a variety of direct and indirect ecological services and intangible ecological benefits provided by natural ecosystems to human beings []. ESs include provisioning services, regulating services, cultural services, and support services [,]. Provisioning services are fundamental to human survival and health; regulating services mitigating drought and flood, cultural services bring satisfaction to human life, and support services maintaining ecosystem capacity and landscapes. In most previous studies, the ecosystem service value (ESV) [,] and the Invest model [] were utilized to calculate ESs. In this study, the supply, demand, and balance of ESs were evaluated and mapped using the supply and demand evaluation matrices of ESs determined according to land use, initially proposed by Burkhard et al. []. This approach serves as a model that connects land use to the supply and demand of ESs while revealing the ability of different ecosystems to provide ESs due to land use by assigning biophysical units to the supply capacity of ESs and human demand []. The value of each item in the supply or demand matrix, ranging from 0 to 5, reflects the relationship between the supply or demand of ESs and a specific land use type. The values indicate the level of correlation; 0 = no correlation, 1 = low correlation, 2 = average correlation, 3 = medium correlation, 4 = high correlation, and 5 = very high correlation [,]. In this study, ESs were divided into 3 categories and 22 subcategories: provisioning (11 subcategories), regulating (9 subcategories), and cultural (2 subcategories) services. The 6 land cover types were linked to the 22 subcategories to construct the supply, demand, and balance matrices of ESs in Guizhou Province. Notably, the value of each subcategory for each land use type should be adjusted to reflect distinctive local factors. The supply and demand matrices of ESs for Guizhou Province were based on the quantitative evaluation of the supply, demand, and balance of ESs by Wu Xue et al. []. Wu et al. [] studied the supply and demand matrices of ESs in China. These matrices can be used to compare ESs in Guizhou Province with those in other provinces. In addition, the matrix score of ESs relies on multiple data, such as monitoring data, expert knowledge, and questionnaire data; however, due to the lack of funds and technology, the matrix score of Guizhou Province cannot be obtained. Therefore, this study uses the supply and demand matrices of ESs as a matrix for ESs in Guizhou Province.
2.3.3. Influential Factors for Ecosystem Health
The spatial heterogeneity and driving factors of ecosystem health can be identified using the GD model proposed by Wang et al. []. We compared the variation in ecosystem health with the characteristics of the detection factors using the GD model.
- (1)
- Factor detector
The q-statistic was used to determine the primary impact of each explanatory variable, X (influencing factors in Table 3), on the dependent variable, Y (EHI) []. The equation is as follows:
where h = 1, 2,...; L is a specific stratum of the variable X (influencing factor) and dependent variable Y (EHI); and N is the number of cells in stratum h and the total area, respectively; and are the variances in Y (EHI) values. The range of values for q is [0, 1], and a higher value of q reflects a greater explanatory power of X (driving factor) in clarifying Y (EHI) [,]. If the q-value is 1, X can completely account for the variation in Y. In contrast, if the q-value is 0, then X and Y have no relationship. The q-statistic was used to determine the primary impact that each explanatory variable, X (the influencing factors in Table 3), had on the dependent variable, Y (EHI) []. Eleven influencing factors were determined based on previous studies [,,] and the actual situation of Guizhou Province.
Table 3.
Influencing factors of ecosystem health.
- (2)
- Interaction detector
The interaction detector determines if the factors interact with variable Y (ecosystem health). Because the elements of nature interact, evaluating these interactions is necessary as they do not exist independently in nature. The interaction between the ecosystem health detection parameters was determined using an interaction detector [,], which could detect any relationship between the components. The methods employed are shown in Table 4.
Table 4.
Types of interactions.
3. Results
3.1. Spatiotemporal Distribution of Land Use
The spatiotemporal distribution of land use in Guizhou Province is shown in Figure 3. The six types of land use in Guizhou Province in 2010 and 2020 were sequenced in order of total area as follows: forestland > farmland > grassland > construction land > water body > unused land. Forestland had the largest percentage of the six land use types, with areas of 94,833 km2 and 93,027 km2, accounting for 53.85% and 52.83% in 2010 and 2020, respectively. Moreover, farmland showed a decrease of 986 km2, decreasing from 49,275 km2 in 2010 to 48,289 km2 in 2020. The construction land and water body areas increased significantly with the decrease in forestland and farmland. Water bodies increased by 0.4% from 2010 to 2020, while construction lands showed a greater increase of 0.99% in the same time. Between 2010 and 2020, the construction land in Guizhou Province increased by 1736 km2, primarily due to rapid population and economic growth. Farmland was primarily concentrated in the east of Guizhou Province, forestland was principally distributed in the north, and water bodies were relatively scattered. Furthermore, most of the construction land was located near the central part of Guiyang City, which serves as the political, economic, cultural, and transportation center.
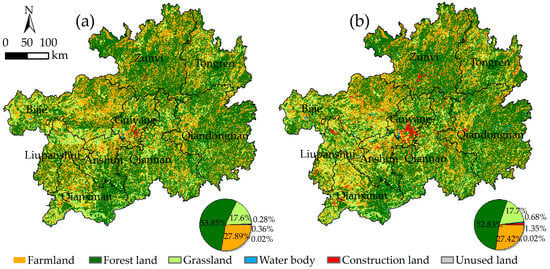
Figure 3.
Land use patterns in Guizhou Province in (a) 2010 and (b) 2020.
Figure 4 showed significant transitions among farmland, forestland, and grassland, although their overall areas were relatively stable during the study period. Around 6144 km2 of farmland was transformed into grassland, and about 5991 km2 of grassland was converted into farmland. In addition, forestland underwent significant changes, with 16,765 km2 and 6772 km2 of forestland being converted into farmland and grassland, respectively. Construction land, mainly converted from farmland, forestland, and grassland, increased from 642 km2 to 2378 km2. During the research period, approximately 123 km2 of farmland, 76 km2 of forestland, and 46 km2 of grassland were converted into construction land. The changes in water bodies between 2010 and 2020 were insignificant, with minor changes occurring in unused lands during the same period.
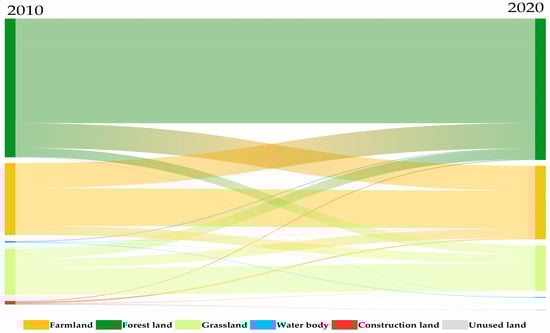
Figure 4.
Land use transfer in Guizhou Province between 2010 and 2020.
3.2. Analysis of Ecosystem Spatial Pattern
3.2.1. Vigor
As shown in Figure 5, ecosystem vigor in Guizhou Province changed significantly between 2010 and 2020. The values of vigor in 2010 and 2020 were generally lower in the northeast and higher in the southwest. The highest recorded value of ecosystem vigor was 3.2767, while the lowest was 0.0674. The distribution of ecosystem vigor values was related to regional land use. Areas with dense vegetation cover, such as forestland and grassland, exhibited high ecosystem vigor, whereas construction land mainly showed low ecosystem vigor. In 2010, the highest recorded ecosystem vigor was predominantly concentrated in the southwestern and southern parts, specifically Qianxinan and Qiannan. However, it had spread to all regions of the province by 2020. This change indicated an increase in vegetation coverage and an overall improvement of the ecosystem, primarily due to the implementation of environmental protection policies by local governments and the conversion of farmland into forest, effectively protecting and improving vegetation coverage in the region. Ecosystem vigor is an important indicator of productivity. However, as a typical karst area, Guizhou Province had poor sloping farmland, poor soil, and a low productivity of farmland, resulting in an ecosystem vigor that was not as good as that of forestland and grassland [,].
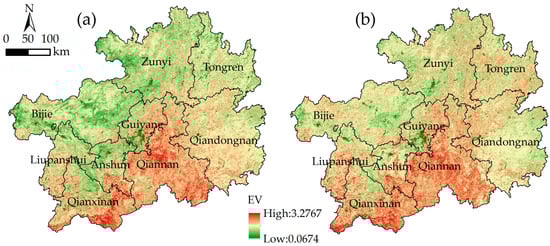
Figure 5.
Ecosystem vigor in Guizhou Province in (a) 2010 and (b) 2020.
Moreover, the vigor in the western regions (i.e., Bijie, Liupanshui, and Anshun) increased from low to high from 2010 to 2020. Historically, the ecological environment in these regions was extraordinarily fragile, especially with significant rocky desertification [,]. The destruction of the ecological environment due to economic development accelerated the degradation of ecological health. Conversely, the vigor in the eastern part of Guizhou Province, especially in Qiandongnan, declined from 2010 to 2020 due to the conversion of grassland and forestland into farmland and construction land. Guiyang City, experiencing rapid urbanization and having poor metabolic capacity in the urban ecosystem, exhibited the lowest vigor over the study period.
3.2.2. Organization
Ecological organization remained relatively stable over the research period compared to vigor, indicating that the ecosystem in Guizhou Province has a superior ability to maintain its balance even under anthropological pressure. Figure 6 illustrates that in 2010 and 2020, the highest organization values were predominantly distributed in the northeast and south of the study region, where forestland was abundant and predominant. Conversely, the lowest values were distributed in the western and central parts of the province, characterized by limited forestland and a high degree of land use fragmentation. This distribution characteristic was mainly due to the typical karst landforms of Guizhou Province, which make the land discontinuous and fragmented.
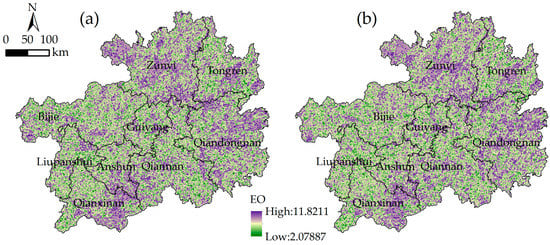
Figure 6.
Ecosystem organization in Guizhou Province in (a) 2010 and (b) 2020.
3.2.3. Resilience
Figure 7 depicts the variation in ecosystem resilience in Guizhou Province. The average value of ecosystem resilience increased from east to west between 2010 and 2020, illustrating an improvement in overall ecosystem resilience in Guizhou Province. The resilience values ranged from 0.16 to 0.8, with 0.16 being the lowest value. In 2010, the western region had the highest ecological resilience value. Following the distribution of land use (Figure 3a), this region, with abundant grassland, had relatively high ecosystem resilience and resistance, enabling it to maintain or regain stability under severe external disturbances associated with economic development. Conversely, the eastern and northern regions, with abundant forestland, showed the lowest ecosystem resilience values. The long growth cycle of forests in these regions contributed to their reduced capacity to recover from external disturbances. The reason for this phenomenon was that Guizhou Province was a typical karst landform. Because of poor soil fertility, the recovery of forest was difficult after destruction; the recovery and stability of forest ecosystems were lower than those of grassland ecosystems.
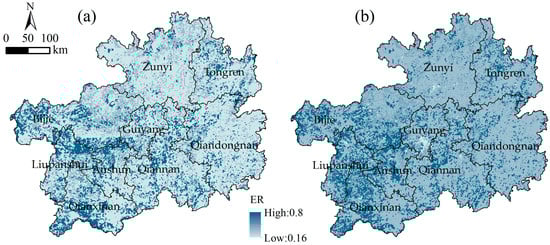
Figure 7.
Ecosystem resilience in Guizhou Province in (a) 2010 and (b) 2020.
By 2020, the value of ecosystem resilience in Guizhou Province exhibited an increasing trend. Specifically, the most notable improvements in resilience occurred in the northern, eastern, and southern regions, primarily due to the increasing emphasis on local ecological protection and the weakening of external disturbances, such as economic development. Notably, the value of ecosystem resilience in Guiyang City and the urban area of Zunyi City had decreased by 2020 due to their significantly inferior ability to maintain and restore the stability of the local ecosystem under severe external disturbances due to urbanization.
3.2.4. Ecosystem Services
The supply, demand, and balance of ESs in 2010 and 2020 were quantified and mapped using the LULC matrix (Figure 8). In 2010, the highest values of ecosystem supply (47.3) were observed across most regions of Guizhou Province, indicating their strong ecological supply capacity. The western regions, such as Bijie, Liupanshui, and Qianxinan, were dominated by a higher value (27.5). The lowest value (4.3) occurred in Guiyang City, where a high population and urbanization resulted in insufficient ecological supply. By 2020, the lowest value of ecosystem supply (4.3) had spread to surrounding regions, predominantly in urban areas experiencing an increase in construction land. Simultaneously, the value of ecosystem supply in the western regions had decreased significantly, indicating that the distribution of the highest value (47.3) decreased, whereas the distribution of the lower value (27.5) increased. This change was likely due to increasing anthropological disturbances, such as road construction and farmland development. Furthermore, except for the central and western regions, the value of ecosystem supply in other regions showed minimal changes during the study period, benefiting from the effective protection of local ecology.
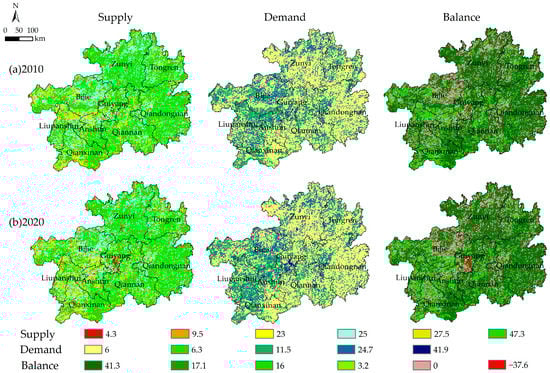
Figure 8.
Ecosystem services of Guizhou Province in (a) 2010 and (b) 2020.
In 2010 and 2020, the spatial pattern of total ecosystem demand in Guizhou Province was basically stable, showing a spatial pattern of high in the east and low in the west, similarly to the distribution of ecosystem resilience. In 2010, the lowest value (six) of ecosystem demand dominated most areas of Guizhou Province, indicating their inferior ecosystem demand capacity. In addition, the higher value (24.7) was distributed across the western, central, and northwestern regions of Guizhou Province. Due to ecosystem demand and ecosystem resilience being based on land use, the spatial distributions of them show extraordinarily similar patterns. From 2010 to 2020, the distribution of the lowest value (six) of ecosystem demand exhibited significant changes in most areas. Conversely, the value of ecosystem demand in the west and Guiyang City significantly increased. Areas with a marked growth in value of 11.5 were largely observed in the west due to the conversion from forestland into grassland. The highest value (41.9) in Guiyang City extended from the center of the city to the entire region due to rapid urbanization and population expansion.
Regarding ecosystem balance, a surplus situation was observed in the east, while a deficit was observed in the central region. In 2010, the deficit area (−37.6), corresponding to the region with a high demand for ecological services, was mostly located in the central region of Guizhou Province, specifically Guiyang City. This phenomenon was mainly because Guiyang City had a larger urban area and more construction land, resulting in a low value of ES supply compared to the high-demand regions, ultimately leading to a significant ES deficit. The surplus value of ESs (41.3) was widely distributed in the eastern, northern, and southern regions of Guizhou Province, primarily because these areas had higher supply (47.3) and demand (6) values. The balance value of ESs (0) was primarily distributed in the western region, especially in Bijie, due to the high distribution of supply (23) and demand (24.7) values in this region. The balance value of ESs in 2020 was comparable to that in 2010 in this region, showing a significant deficit of ESs in Guiyang. The deficit value (37.6) increased, while surpluses of ESs persisting in the eastern, northern, and southern regions. The most notable change during the study period was the increase in the ES deficit in Guiyang City due to the predominance of low supply values (4.3) and the high distribution of demand values (41.9). The changes in other regions were not significant.
3.3. Distribution of the EHI
Using the equal interval method, the EHI in 2010 and 2020 was comprehensively evaluated and separated into five grades: Level 1 (0–0.2, extremely poor), Level 2 (0.2–0.4, poor), Level 3 (0.4–0.6, moderate), Level 4 (0.6–0.8, good), and Level 5 (0.8–1, relatively good) [,,]. As shown in Figure 9 Levels 2 and 3 were distributed in most areas of Guizhou Province in 2010, implying that human disturbance weakened local ecosystem health. Moreover, Level 1, covering 308.50 km2 (0.18%) of the overall area, was primarily dominant in the central metropolitan regions of Guiyang City and Zunyi City, which were associated with abundant construction land. Level 4 was scattered across Chishui City, Weining County, and Jiangkou County, characterized by national scenic spots and nature reserves. Level 5 was minimally distributed and scattered, covering an area of 31.76 km2 (0.02%). This rare distribution unveiled that despite the high vegetation coverage (including forestland and grassland), a significant gap remained in the orderly protection of the ecosystem in Guizhou Province. Overall, the distribution of the EHI in Guizhou Province was uneven; that is, the EHI in the southeast significantly exceeded that in the northwest.
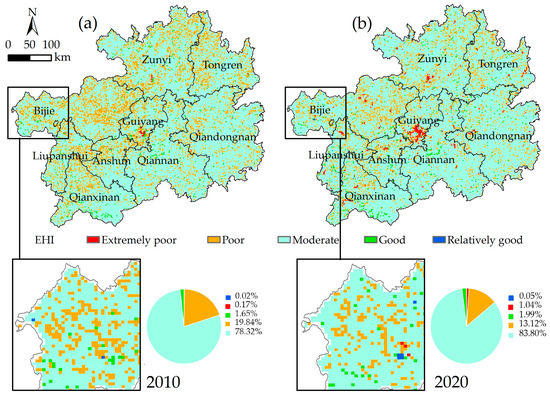
Figure 9.
Ecosystem health index of Guizhou Province in (a) 2010 and (b) 2020.
In 2020, the changes in quantity and spatial distribution of the EHI in Guizhou Province were significant. Level 2 and Level 3 were still the two levels with the biggest percentage in area. On the one side, the area of Level 2 reduced by 6.72%, accounting for 11,818.73 km2, and the range of Level 2 distinctly shrunk, especially in the northwestern region (mainly including Tongren, Bijie and Liupanshui), which resulted in more fragmented distribution. On the other side, areas with a noticeable upgrade in Level 3 were primarily located in the northwest. The total area of Level 3 ascended to 147,566.70 km2, accounting for 83.80%. Of note is that the distribution of Level 1 extended and occupied more urban areas in each region, with the area rising by 0.86% (from 308.50 km2 to 1825.39 km2) while the most marked growth was undoubtedly located in Guiyang City. Similarly, the distribution of Level 4 also became wider and denser, and the area climbed to 3505.84 km2, representing approximately 2.00%. These results generally reflect that, the ecosystem health of Guizhou Province improved during the decade, and the gap in the ecosystem health between the southeast and the northwest gradually narrowed. Nevertheless, Level 5 had almost no spatial change, although it had tiny growth in area, increasing by 0.03%. Therefore, in establishing a healthier ecosystem, even high-quality ecological protection areas remained a challenge for Guizhou Province.
3.4. Driving Factors of Ecosystem Health
- (1)
- Factor detector
Figure 10 displays the results of the factor detector. In 2010, the magnitude of influence of each factor was sorted as follows: GDP (0.0432) > general public budget revenue (0.0381) > slope (0.0380) > added value of the secondary industry (0.0365) > average annual precipitation (0.0326) > annual average temperature (0.0318) > night light index (0.0215) > elevation (0.0163) > per capita GDP (0.0141) > hours of sunlight (0.007) > population density (0.0002). The GDP and general public budget revenue were significantly correlated with ecosystem health in 2010. This was due to GDP and general public budget revenues being important indicators with which to measure the level of human socioeconomic activity in a region. The economic and social development level of the region increased, human activities strengthened, and interference in the ecological environment increased, which led to a decline in ecosystem health. The ecosystem health in Guizhou Province was significantly impacted by the slope, average annual precipitation, and average annual temperature in 2010. Due to the karst landscape, there was minimal ecological damage from humans in areas with high slopes and altitudes, which were not conducive to human activities. However, in the flat areas, the local ecosystem’s health was negatively impacted by human activity and urban sprawl. Moreover, temperature directly affects land use, specifically the forest area in built-up and wetland areas, which serve as indicators of ecological health [,]. In addition, precipitation showed a correlation with ecosystem health levels. Previous studies have proven that excessive regional precipitation can cause soil erosion and damage the ecosystem [,], harming local ecosystem health.
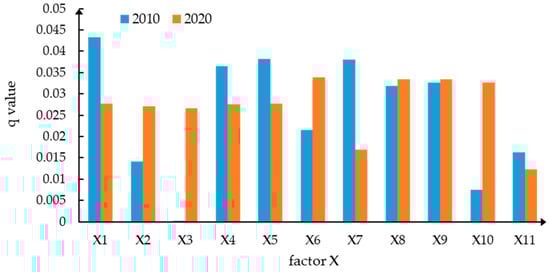
Figure 10.
Detection results of ecosystem health in Guizhou Province.
By 2020, the explanatory degrees of each factor in Guizhou Province were as follows: night light index (0.0339) > annual average temperature (0.0334) > average annual precipitation (0. 0334) > hours of sunlight (0.0327) > GDP (0.0277) > general public budget revenue (0.0276) > added value of the secondary industry (0.0275) > per capita GDP (0.0271) > population density (0.0266) > slope (0.0169) > elevation (0.0123). The ecosystem health in Guizhou Province was significantly impacted by the night light index, annual average temperature, average annual precipitation, and hours of sunlight in 2020. From 2010 to 2020, the night light index increasingly influenced ecosystem health in Guizhou Province because human socioeconomic activities became increasingly intensive. In the study period, the GDP, average annual precipitation, annual average temperature, night light index and general public budget revenue were the main influencing factors of ecosystem health of Guizhou Province.
- (2)
- Interaction detector
The results of the interaction detector demonstrated that the factor interactions increased the effects of each factor on ecosystem health. Figure 11 illustrates the outcomes of these factor interactions in 2010. There were 66 pairs of interactions between two factors on ecosystem health, in which 24 pairs exhibited a bivariate enhancement effect: X1–X3, X1–X4, X1–X5, X1–X7, X1–X8, X1–X9, X2–X3, X2–X4, X2–X5, X3–X4, X3–X5, X3–X6, X3–X7, X3–X8, X3–X9, X3–X10, X4–X5, X4–X9, X4–X10, X4–X11, X5–X7, X5–X8, X6–X7, and X7–X8. The remaining 31 sets exhibited a nonlinear enhancement effect, with 11 sets exhibiting a single-factor effect. In the nonlinear enhancement characteristic, the X9–X7 pair had the highest impact on ecosystem health in Guizhou Province, with the q-value being equal to 0.1087. The X8–X7 and X10–X7 pairs had increased influence on ecosystem health, with q-values of 0.1 and 0.0996, respectively. Figure 12 shows that the interactions between driving factors had bivariate and nonlinear enhancement effects on ecosystem health in 2020. A total of 24 pairs showed a nonlinear enhancement effect: X1–X3, X1–X7, X1–X11, X2–X3, X2–X7, X2–X11, X3–X4, X3–X5, X3–X7, X3–X11, X4–X5, X4–X7, X4–X11, X5–X7, X5–X11, X6–X7, X6–X11, X7–X8, X7–X9, X7–X10, X7–X11, X8–X11, X9–X11, and X10–X11. The remaining 31 sets exhibited a bivariate enhancement effect, with 11 sets exhibiting a single-factor effect. In this study, the interactions among different factors enhanced the influence of some factors on ecosystem health, such as X7–X11 (0.0776) and X7–X10 (0.067).
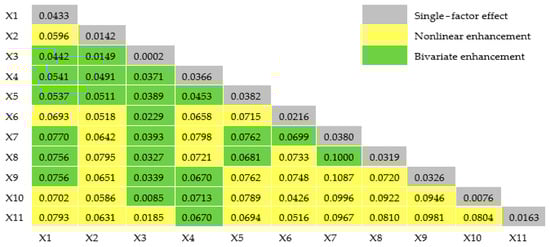
Figure 11.
Interactions among influencing factors in 2010. Notes: X1: Gross domestic product; X2: Per capita GDP; X3: Population density; X4: Added value of the secondary industry; X5: General public budget revenue; X6: Night light index; X7: Slope; X8: Annual average temperature; X9: Average annual precipitation; X10: Hours of sunlight; X11: Elevation.
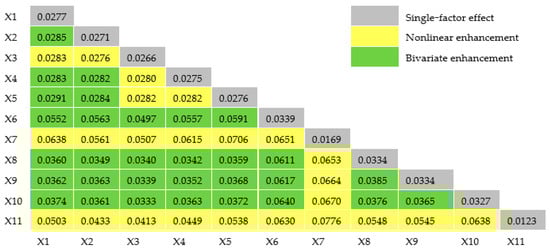
Figure 12.
Interactions among influencing factors in 2020.
4. Discussion
4.1. Comparison of EHI Results
We constructed the VORS framework to quantify ecosystem health in Guizhou Province in 2010 and 2020, adopting land use change to enhance the ecosystem quality influenced by human activities []. The VORS framework incorporated ESs as an extension of the VOR framework, and many studies have highlighted the need to integrate ESs into ecosystem health assessments [], because ESs are the most accurate in identifying regional differences []. This study incorporates ESs into ecosystem health assessments, because they may attract the attention of governments and the public, which are promoting ecosystem conservation in Guizhou Province. A growing number of studies have highlighted the need to include ecosystem ESs in ecosystem health assessments [,], mainly through ecosystem service value (ESV) [] and Invest models []. Previous studies have demonstrated that studying land use change is more conducive to exploring changes in the EHI [,]. Forestland, regarded as a typical kind of ecological land, had higher vigor and organization in the ecosystem than did grassland and water bodies. The significant increase in forestland area improved vegetation cover, enhanced ecosystem service provisioning capacity, and promoted ecosystem health in Guizhou Province. In recent decades, ecological engineering projects such as returning farmland to forestlands, afforestation and reforestation have played a crucial role in enhancing ecosystem health in the region []. However, rapid population growth and urban expansion occupied large amounts of ecological land, interfering with ecosystem structures and processes, and causing the deterioration of ecosystem health in Guiyang city. The EHI of Guizhou Province gradually improved throughout the study period, although its growth was relatively slow. These findings are consistent with those of previous studies. For example, Li et al. used the VOR framework and found a slight improvement in the EHI of Guizhou Province from 2000 to 2010. Their results showed that in 2010, the EHI was lower in the west than in the east under four different scenarios [].
Furthermore, exploring differences in the EHI and its driving factors was crucial for scientific research and policy [,]. The GD model was employed to pinpoint the driving factors of ecosystem health in Guizhou Province. The results of single-factor geographic exploration were statistically significant at the 99% significance level (p < 0.01). The GDP, annual average temperature, average annual precipitation, and night light index were found to be the strongest influencing factors on ecosystem health. GDP had the highest q-value in 2010 (0.0433), while the night light index had the highest q-value in 2020 (0.0339). The degree of human social activity in an area was mostly determined by the GDP and night light index, which exhibited a significant negative correlation with ecosystem health. This conclusion was the same as that of He et al. []. These results were mainly due to increased regional economic development, alleviated strain on the ecosystem environment, and the increased EHI. Conversely, annual average temperature and average annual precipitation had significantly positive effects on the EHI, indicating that they were important causes of variations in ecosystem health. In the short term, temperature change had a minimal direct impact on EHI, but it indirectly impacted how the land was used in the region []. Temperature influenced the EHI in the study region by altering the ecosystem health evaluation indicators, such as the green space area in the study region []. This is similar to other studies, in which it was shown that ecosystem health was affected by complex factors such as temperature and precipitation [,]. Some studies prove that the out-migrant population could alleviate regional ecological pressures and have a positive impact on ecosystem health []. However, in this study, population density had less of an impact on ecosystem health in Guizhou Province. The reason for this may be that the population density selected in this paper does not take into account the floating population. According to the results, increased attention should be given to the combined development of the economy and environmental protection in Guizhou Province. Moreover, the wetlands, forests, and natural ecology in the research area should be conserved to improve the overall ecological conditions and ecosystem health.
4.2. Insights for the Ecosystem Health of Guizhou Province
The overall ecosystem health in Guizhou Province improved during the study period. However, there were still significant differences in ecosystem health throughout the study region. The findings revealed that high values of ecosystem vigor were concentrated in the southeast and south of the study region, while low values were distributed in Guiyang City. This phenomenon was because forest coverage in the southeast and south was relatively high, with the forest coverage rates in Qiandongnan and Qiannan reaching 67.89% and 64.66%, respectively. Additionally, low vigor values were due to Guiyang City having more construction land than ecological land. Moreover, the distribution of ecosystem organization and vigor values was similar, proving that the environmental protection policy in the southeast and south was effective and should be implemented in the future. In addition, during development, the unsustainable expansion of construction land should be controlled in Guiyang. Furthermore, the ecosystem resilience values were high in the east and low in the west, with the low values mainly distributed in the western region of Guizhou Province, while the high values were primarily distributed in the east. We measured the ecosystem supply and demand assessment matrix to determine the ES value of Guizhou Province. Surplus ESs were principally distributed in the eastern region. We observed that the causes of these characteristics were similar to those of the vigor value, which was related to the dispersion of land use types and forest cover.
It is suggested that Guizhou Province should protect important ecological resources, increase the connectivity between ecological landscapes, optimize the ecological security pattern, and maintain the integrity of ecosystem structure and function, in order to improve ecosystem health. Meanwhile, Guizhou Province should implement hierarchical planning and management in the process of ecological protection, and formulate different environmental protection plans and ecological management systems according to the characteristics of each region. In nature reserves, the government should form a network system of nature reserves, establish a unified ecological environment monitoring network, and maintain regional ecosystems to the greatest extent. Nature reserves such as Fanjing Mountain, Libo Maolan, Weining Caohai and Leigong Mountain should be protected. Especially in Bijie City, where the ecosystem health level is poor, the protection of nature reserves should be strengthened. In urban development regions, the Guizhou province should implement reasonable urban planning, strictly limit the scale of urban land, control the direction of land use development, improve land use efficiency, and achieve high-quality economic development and ecological protection. Guiyang City is a rapidly developing region, but the region with the worst ecological situation, so we should pay attention to the coordination between the development of Guiyang City and ecological protection. In areas with a fragile ecological environment, the Guizhou province should reduce human interference, combine artificial restoration with natural restoration, coordinate the relationship between resource utilization and environmental protection, and correctly handle the contradiction between ecological protection and the development needs of local residents. In Liupanshui City, there are many typical historical mines, and the problem of rocky desertification is prominent, so ecological projects such as mine ecological restoration and soil erosion control should be carried out. Moreover, as a typical karst area, Guizhou Province has a prominent problem of rocky desertification. In the process of controlling rocky desertification and maintaining the ecological environment, the government should make use of land resources and suitable climatic conditions in mountainous areas, select appropriate plant varieties, closing mountains for reforestation, control soil erosion, curb land rocky desertification, improve land productivity, and develop the economy. In addition, the implementation of the ecological policy of returning farmland to forest and grassland will reduce the cultivated land area of local residents, reduce grain production and household income, in order to make up for this deficiency, increase scientific and technological talents, provide financial support, develop ecological agriculture, and provide a solid material foundation for sustainable social development.
4.3. Limitations and Future Research Directions
Ecosystems are extremely complicated systems that include all aspects of the natural environment and human interactions. In this study, the VORS framework provided initial insights into ecosystem health in Guizhou Province during the study period, although it did not offer a complete standard []. The VORS framework is an extension of the VOR framework and has proven effective in assessing ecosystem health in different regions. However, certain uncertainties were encountered during its use. (1) Because the organization, resilience, and ESs directly impacted the evaluation results, their weights were given significant consideration when building the framework []. Although the weights of the factors were chosen according to the actual condition in Guizhou Province and previous research findings, the index weight used in this study was subjective and could not completely represent the components of the index system. Therefore, the objectivity of the indicator weighting should be improved in the future. (2) We used the supply and demand evaluation matrices to calculate ESs. ES supply and demand capacity depended on expert scoring, which was still inevitably subjective. Thus, the Invest model should be adopted to measure ESs. (3) Eleven influencing factors were selected for research, considering the availability of data. However, these influencing factors were universal and did not account for the typical karst landforms and soils of Guizhou Province, which could significantly impact the results. Hence, more attention should be devoted to exploring the impact of factors such as karst landforms, topography, and ecological policies on ecosystem health. Despite these limitations, this study holds significance and provides information for researchers seeking to understand ecosystem health and influencing factors. Furthermore, the findings of this study provide an important reference for ecological management and the land use policy of Guizhou Province.
5. Conclusions
Using the VORS framework, we assessed ecosystem health in Guizhou Province. The GD model was used to identify the main factors driving changes in the EHI and evaluate the causes of EHI variations on spatial and temporal scales. The results showed that Guizhou Province has a large forest area, accounting for 53.9% and 52.8% of the forest land in 2010 and 2020, respectively. The overall state of ecosystem health in Guizhou Province had exhibited a healthier distribution feature in the southwest than northeast over the past 20 years. While the deterioration was mainly distributed in Guiyang City, a deterioration ring in ecosystem health was discerned surrounding Guiyang City. The results of the GD model indicate that the GDP, average annual precipitation, annual average temperature, night light index, and general public budget revenue were the most important factors explaining the change in ecosystem health.
The results of this study are of great significance for improving the health of regional ecosystems. However, due to the limitations of data acquisition and weight setting of the indicator system, there are still some shortcomings. In future research, the index system will be enriched to provide a more accurate reference for environmental protection.
Author Contributions
Conceptualizing, L.Y., D.Y. and M.Z.; methodology, D.Y.; software, L.Y. and D.Y.; verification, L.Y., D.Y. and M.Z.; formal analysis, D.Y. survey, D.Y. resources, L.Y.; data management, M.Z. writing—original draft Preparation, D.Y. writing—review and editing, L.Y. visualization, M.Z. supervision, L.Y.; project management, L.Y. capital acquisition, L.Y. All authors have read and agreed to the published version of the manuscript.
Funding
This research was funded by the “Rural spatial restructuring in poverty-stricken mountainous areas of Guizhou based on spatial equity: A case study of the Dianqiangui Rocky Desertification Area” project of the National Natural Science Foundation of China, grant number 41861038.
Data Availability Statement
Not applicable.
Conflicts of Interest
The authors declare no conflict of interest.
References
- Rapport, D.J.; Costanza, R.; McMichael, A.J. Assessing ecosystem health. Trends Ecol. Evol. 1998, 13, 397–402. [Google Scholar] [CrossRef] [PubMed]
- Rapport, D.J. What Constitutes Ecosystem Health? Perspect. Biol. Med. 1989, 33, 120–132. [Google Scholar] [CrossRef]
- Peng, J.; Liu, Y.; Li, T.; Wu, J. Regional ecosystem health response to rural land use change: A case study in Lijiang City, China. Ecol. Indic. 2017, 72, 399–410. [Google Scholar] [CrossRef]
- He, J.; Pan, Z.; Liu, D.; Guo, X. Exploring the regional differences of ecosystem health and its driving factors in China. Sci. Total Environ. 2019, 673, 553–564. [Google Scholar] [CrossRef] [PubMed]
- Omer, A.; Elagib, N.A.; Zhuguo, M.; Saleem, F.; Mohammed, A. Water scarcity in the Yellow River Basin under future climate change and human activities. Sci. Total Environ. 2020, 749, 141446. [Google Scholar] [CrossRef]
- Ekmekcioğlu, Ö.K.; Koc, K.; Dabanli, I.; Deniz, A. Prioritizing urban water scarcity mitigation strategies based on hybrid multi-criteria decision approach under fuzzy environment. Sustain. Cities Soc. 2022, 87, 104195. [Google Scholar] [CrossRef]
- Filho, W.L.; Totin, E.; Franke, J.A.; Andrew, S.M.; Abubakar, I.R.; Azadi, H.; Nunn, P.D.; Ouweneel, B.; Williams, P.A.; Simpson, N.P. Understanding responses to climate-related water scarcity in Africa. Sci. Total Environ. 2022, 806, 150420. [Google Scholar] [CrossRef]
- Wei, J.; Zhou, J.; Tian, J.; He, X.; Tang, K. Decoupling soil erosion and human activities on the Chinese Loess Plateau in the 20th century. Catena 2006, 68, 10–15. [Google Scholar] [CrossRef]
- Kucuker, D.M.; Giraldo, D.C. Assessment of soil erosion risk using an integrated approach of GIS and Analytic Hierarchy Process (AHP) in Erzurum, Turkiye. Ecol. Inform. 2022, 71, 101788. [Google Scholar] [CrossRef]
- Liu, Y.; Hou, X.; Qiao, J.; Zhang, W.; Fang, M.; Lin, M. Evaluation of soil erosion rates in the hilly-gully region of the Loess Plateau in China in the past 60 years using global fallout plutonium. Catena 2023, 220, 106666. [Google Scholar] [CrossRef]
- Peng, X.; DaiI, Q. Drivers of soil erosion and subsurface loss by soil leakage during karst rocky desertification in SW China. Int. Soil Water Conserv. Res. 2021, 10, 217–227. [Google Scholar] [CrossRef]
- Wu, Z.; Zhu, D.; Xiong, K.; Wang, X. Dynamics of landscape ecological quality based on benefit evaluation coupled with the rocky desertification control in South China Karst. Ecol. Indic. 2022, 138, 108870. [Google Scholar] [CrossRef]
- Waldron, A.; Miller, D.C.; Redding, D.; Mooers, A.; Kuhn, T.S.; Nibbelink, N.; Roberts, J.T.; Tobias, J.A.; Gittleman, J.L. Erratum: Corrigendum: Reductions in global biodiversity loss predicted from conservation spending. Nature 2017, 553, 530. [Google Scholar] [CrossRef] [PubMed]
- Bawa, K.S.; Sengupta, A.; Chavan, V.; Chellam, R.; Ganesan, R.; Krishnaswamy, J.; Mathur, V.B.; Nawn, N.; Olsson, S.B.; Pandit, N.; et al. Securing biodiversity, securing our future: A national mission on biodiversity and human well-being for India. Biol. Conserv. 2020, 253, 108867. [Google Scholar] [CrossRef]
- Shrestha, M.K.; York, A.M.; Boone, C.G.; Zhang, S. Land fragmentation due to rapid urbanization in the Phoenix Metropolitan Area: Analyzing the spatiotemporal patterns and drivers. Appl. Geogr. 2012, 32, 522–531. [Google Scholar] [CrossRef]
- Schaeffer, D.J.; Herricks, E.E.; Kerster, H.W. Ecosystem health: I. Measuring ecosystem health. Environ. Manag. 1988, 12, 445–455. [Google Scholar] [CrossRef]
- Costanza, R. Ecosystem health and ecological engineering. Ecol. Eng. 2012, 45, 24–29. [Google Scholar] [CrossRef]
- Tiwari, B.; Barik, S.; Tripathi, R. Biodiversity Value, Status, and Strategies for Conservation of Sacred Groves of Meghalaya, India. Ecosyst. Health 1998, 4, 20–32. [Google Scholar] [CrossRef]
- Burger, J.; Gochfeld, M. On developing bioindicators for human and ecological health. Environ. Monit. Assess. 2001, 66, 23–46. [Google Scholar] [CrossRef]
- Svenja, B.; Kevan, P. Are There Ecological Foundations for Ecosystem Health? Environmentalist 2003, 23, 255–263. [Google Scholar]
- Watson, R.T.; Patz, J.; Gubler, D.J.; Parson, E.A.; Vincent, J.H. Environmental health implications of global climate change. J. Environ. Monit. 2005, 7, 834–843. [Google Scholar] [CrossRef] [PubMed]
- Pinto, U.; Maheshwari, B.L.; Ollerton, R.L. Analysis of long-term water quality for effective river health monitoring in peri-urban landscapes—A case study of the Hawkesbury–Nepean river system in NSW, Australia. Environ. Monit. Assess. 2012, 185, 4551–4569. [Google Scholar] [CrossRef] [PubMed]
- Xiao, R.; Yu, X.; Shi, R.; Zhang, Z.; Yu, W.; Li, Y.; Chen, G.; Gao, J. Ecosystem health monitoring in the Shanghai-Hangzhou Bay Metropolitan Area: A hidden Markov modeling approach. Environ. Int. 2019, 133, 105170. [Google Scholar] [CrossRef]
- Liao, C.; Yue, Y.; Wang, K.; Fensholt, R.; Tong, X.; Brandt, M. Ecological restoration enhances ecosystem health in the karst regions of southwest China. Ecol. Indic. 2018, 90, 416–425. [Google Scholar] [CrossRef]
- Sahana, M.; Saini, M.; Areendran, G.; Imdad, K.; Sarma, K.; Sajjad, H. Assessing Wetland ecosystem health in Sundarban Biosphere Reserve using pressure-state-response model and geospatial techniques. Remote. Sens. Appl. Soc. Environ. 2022, 26, 100754. [Google Scholar] [CrossRef]
- Xiao, Z.; Liu, R.; Gao, Y.; Yang, Q.; Chen, J. Spatiotemporal variation characteristics of ecosystem health and its driving mechanism in the mountains of southwest China. J. Clean. Prod. 2022, 345, 131138. [Google Scholar] [CrossRef]
- Sun, B.; Tang, J.; Yu, D.; Song, Z.; Wang, P. Ecosystem health assessment: A PSR analysis combining AHP and FCE methods for Jiaozhou Bay, China1. Ocean Coast. Manag. 2018, 168, 41–50. [Google Scholar] [CrossRef]
- Ren, Y.; Zhang, F.; Li, J.; Zhao, C.; Jiang, Q.; Cheng, Z. Ecosystem health assessment based on AHP-DPSR model and impacts of climate change and human disturbances: A case study of Liaohe River Basin in Jilin Province, China. Ecol. Indic. 2022, 142, 109171. [Google Scholar] [CrossRef]
- Zou, S.; Qian, J.; Xu, B.; Tu, Z.; Zhang, W.; Ma, X.; Liang, Y. Spatiotemporal changes of ecosystem health and their driving mechanisms in alpine regions on the northeastern Tibetan Plateau. Ecol. Indic. 2022, 143, 109396. [Google Scholar] [CrossRef]
- Xie, F.; Gu, J.-G.; Lin, Z.-W. Assessment of aquatic ecosystem health based on principal component analysis with entropy weight: A case study of Wanning Reservoir (Hainan Island, China). Yingyong Shengtai Xuebao 2014, 25, 1773–1779. [Google Scholar]
- Sun, C.; Chen, W. Fuzzy comprehensive model based on combination weighting in watershed application of ecological health assessment. IOP Conf. Series: Earth Environ. Sci. 2019, 227, 052009. [Google Scholar] [CrossRef]
- Cheng, W.; Xi, H.; Sindikubwabo, C.; Si, J.; Zhao, C.; Yu, T.; Li, A.; Wu, T. Ecosystem health assessment of desert nature reserve with entropy weight and fuzzy mathematics methods: A case study of Badain Jaran Desert. Ecol. Indic. 2020, 119, 106843. [Google Scholar] [CrossRef]
- Ma, J.; Ding, X.; Shu, Y.; Abbas, Z. Spatio-temporal variations of ecosystem health in the Liuxi River Basin, Guangzhou, China. Ecol. Inform. 2022, 72, 101842. [Google Scholar] [CrossRef]
- Ma, Y.; Wang, S.; Zhang, Q.; Guo, K.; He, Y.; Chen, D.; Sui, M.; Zhang, G.; Zang, L.; Liu, Q. Aerial Seeding Promotes the Restoration of Ecosystem Health in Mu Us Sandy Grasslands in China. Agriculture 2022, 12, 1255. [Google Scholar] [CrossRef]
- Tao, N.; Liu, D.; Wu, J. Assessment of forest ecosystem health based on fuzzy evaluation method-a case study of forest ecosystem in liangshui natural reserve. Rev. Int. Contam. Ambient. 2019, 35, 159–164. [Google Scholar] [CrossRef]
- Zhao, X.; Huang, G. Urban watershed ecosystem health assessment and ecological management zoning based on landscape pattern and SWMM simulation: A case study of Yangmei River Basin. Environ. Impact Assess. Rev. 2022, 95, 106794. [Google Scholar] [CrossRef]
- Zhou, Y.; Yue, D.; Li, S.; Liang, G.; Chao, Z.; Zhao, Y.; Meng, X. Ecosystem health assessment in debris flow-prone areas: A case study of Bailong River Basin in China. J. Clean. Prod. 2022, 357, 131887. [Google Scholar] [CrossRef]
- Ekumah, B.; Armah, F.A.; Afrifa, E.K.; Aheto, D.W.; Odoi, J.O.; Afitiri, A.-R. Geospatial assessment of ecosystem health of coastal urban wetlands in Ghana. Ocean Coast. Manag. 2020, 193, 105226. [Google Scholar] [CrossRef]
- Liu, G.; Yang, Z.; Chen, B.; Zhang, Y.; Zhang, L.; Zhao, Y.; Jiang, M. Emergy-based urban ecosystem health assessment: A case study of Baotou, China. Commun. Nonlinear Sci. Numer. Simul. 2009, 14, 972–981. [Google Scholar] [CrossRef]
- Das, M.; Das, A.; Mandal, A. Research note: Ecosystem Health (EH) assessment of a rapidly urbanizing metropolitan city region of eastern India—A study on Kolkata Metropolitan Area. Landsc. Urban Plan. 2020, 204, 103938. [Google Scholar] [CrossRef]
- Liu, Y.; Xu, N.; Li, Z.; Wang, J.; Zeng, H. Differential impact of constructed land expansion on ecosystem health: A case study in the coastal region of the East China Sea. Ecol. Eng. 2022, 180, 106665. [Google Scholar] [CrossRef]
- Rapport, D.J. Ecosystem services and management options as blanket indicators of ecosystem health. J. Aquat. Ecosyst. Health 1995, 4, 97–105. [Google Scholar] [CrossRef]
- Yu, W.; Zhang, D.; Liao, J.; Ma, L.; Zhu, X.; Zhang, W.; Hu, W.; Ma, Z.; Chen, B. Linking ecosystem services to a coastal bay ecosystem health assessment: A comparative case study between Jiaozhou Bay and Daya Bay, China. Ecol. Indic. 2022, 135, 108530. [Google Scholar] [CrossRef]
- Xue, J.; Gui, D.; Lei, J.; Zeng, F.; Mao, D.; Zhang, Z. Model development of a participatory Bayesian network for coupling ecosystem services into integrated water resources management. J. Hydrol. 2017, 554, 50–65. [Google Scholar] [CrossRef]
- Pan, Z.; He, J.; Liu, D.; Wang, J.; Guo, X. Ecosystem health assessment based on ecological integrity and ecosystem services demand in the Middle Reaches of the Yangtze River Economic Belt, China. Sci. Total Environ. 2021, 774, 144837. [Google Scholar] [CrossRef]
- Xiao, Y.; Guo, L.; Sang, W. Impact of Fast Urbanization on Ecosystem Health in Mountainous Regions of Southwest China. Int. J. Environ. Res. Public Health 2020, 17, 826. [Google Scholar] [CrossRef]
- Cheng, X.; Chen, L.; Sun, R.; Kong, P. Land use changes and socio-economic development strongly deteriorate river ecosystem health in one of the largest basins in China. Sci. Total Environ. 2018, 616–617, 376–385. [Google Scholar] [CrossRef]
- Bebianno, M.; Pereira, C.; Rey, F.; Cravo, A.; Duarte, D.; D’Errico, G.; Regoli, F. Integrated approach to assess ecosystem health in harbor areas. Sci. Total Environ. 2015, 514, 92–107. [Google Scholar] [CrossRef]
- Bae, D.-Y.; Kumar, H.K.; Han, J.-H.; Kim, J.-Y.; Kim, K.-W.; Kwon, Y.-H.; An, K.-G. Integrative ecological health assessments of an acid mine stream and in situ pilot tests for wastewater treatments. Ecol. Eng. 2010, 36, 653–663. [Google Scholar] [CrossRef]
- Luo, L.; Mei, K.; Qu, L.; Zhang, C.; Chen, H.; Wang, S.; Di, D.; Huang, H.; Wang, Z.; Xia, F.; et al. Assessment of the Geographical Detector Method for investigating heavy metal source apportionment in an urban watershed of Eastern China. Sci. Total Environ. 2018, 653, 714–722. [Google Scholar] [CrossRef]
- Fan, Z.; Duan, J.; Lu, Y.; Zou, W.; Lan, W. A geographical detector study on factors influencing urban park use in Nanjing, China. Urban For. Urban Green. 2021, 59, 126996. [Google Scholar] [CrossRef]
- Wang, J.-F.; Li, X.-H.; Christakos, G.; Liao, Y.-L.; Zhang, T.; Gu, X.; Zheng, X.-Y. Geographical detectors-based health risk assessment and its application in the neural tube defects study of the Heshun region, China. Int. J. Geogr. Inf. Sci. 2010, 24, 107–127. [Google Scholar] [CrossRef]
- Wang, J.-F.; Zhang, T.-L.; Fu, B.-J. A measure of spatial stratified heterogeneity. Ecol. Indic. 2016, 67, 250–256. [Google Scholar] [CrossRef]
- Wu, W.; Zhang, J.; Sun, Z.; Yu, J.; Liu, W.; Yu, R.; Wang, P. Attribution analysis of land degradation in Hainan Island based on geographical detector. Ecol. Indic. 2022, 141, 109119. [Google Scholar] [CrossRef]
- Peng, W.; Fan, Z.; Duan, J.; Gao, W.; Wang, R.; Liu, N.; Li, Y.; Hua, S. Assessment of interactions between influencing factors on city shrinkage based on geographical detector: A case study in Kitakyushu, Japan. Cities 2022, 131, 103958. [Google Scholar] [CrossRef]
- Guo, L.; Li, P.; Zhang, J.; Xiao, X.; Peng, H. Do socio-economic factors matter? A comprehensive evaluation of tourism eco-efficiency determinants in China based on the Geographical Detector Model. J. Environ. Manag. 2022, 320, 115812. [Google Scholar] [CrossRef] [PubMed]
- Zhuo, C.; Deng, F. How does China’s Western Development Strategy affect regional green economic efficiency? Sci. Total Environ. 2019, 707, 135939. [Google Scholar] [CrossRef] [PubMed]
- Pan, S.; Liang, J.; Chen, W.; Li, J.; Liu, Z. Gray Forecast of Ecosystem Services Value and Its Driving Forces in Karst Areas of China: A Case Study in Guizhou Province, China. Int. J. Environ. Res. Public Health 2021, 18, 12404. [Google Scholar] [CrossRef]
- Wang, S.-J.; Liu, Q.-M.; Zhang, D.-F. Karst rocky desertification in southwestern China: Geomorphology, landuse, impact and rehabilitation. Land Degrad. Dev. 2004, 15, 115–121. [Google Scholar] [CrossRef]
- Xu, E.Q.; Zhang, H.Q. Characterization and interaction of driving factors in karst rocky desertification: A case study from Changshun, China. Solid Earth 2014, 5, 1329–1340. [Google Scholar] [CrossRef]
- Chen, S.; Zhou, Z.; Yan, L.; Li, B. Quantitative Evaluation of Ecosystem Health in a Karst Area of South China. Sustainability 2016, 8, 975. [Google Scholar] [CrossRef]
- Wang, Z.; Liu, Y.; Li, Y.; Su, Y. Response of Ecosystem Health to Land Use Changes and Landscape Patterns in the Karst Mountainous Regions of Southwest China. Int. J. Environ. Res. Public Health 2022, 19, 3273. [Google Scholar] [CrossRef] [PubMed]
- Peng, J.; Liu, Y.; Wu, J.; Lv, H.; Hu, X. Linking ecosystem services and landscape patterns to assess urban ecosystem health: A case study in Shenzhen City, China. Landsc. Urban Plan. 2015, 143, 56–68. [Google Scholar] [CrossRef]
- Li, R.-Q.; Dong, M.; Cui, J.-Y.; Zhang, L.-L.; Cui, Q.-G.; He, W.-M. Quantification of the Impact of Land-Use Changes on Ecosystem Services: A Case Study in Pingbian County, China. Environ. Monit. Assess. 2007, 128, 503–510. [Google Scholar] [CrossRef]
- Das, M.; Das, A.; Pereira, P.; Mandal, A. Exploring the spatio-temporal dynamics of ecosystem health: A study on a rapidly urbanizing metropolitan area of Lower Gangetic Plain, India. Ecol. Indic. 2021, 125, 107584. [Google Scholar] [CrossRef]
- Zhang, X.; Gou, P.; Chen, W.; Li, G.; Huang, Y.; Zhou, T.; Liu, Y.; Nie, W. Spatiotemporal distribution characteristics of ecosystem health and the synergetic impact of its driving factors in the Yangtze River Delta, China. Environ. Sci. Pollut. Res. 2023, 1–14. [Google Scholar] [CrossRef]
- Yuan, J.; Wu, Q.; Liu, J. Understanding indigenous knowledge in sustainable management of natural resources in China. For. Policy Econ. 2012, 22, 47–52. [Google Scholar] [CrossRef]
- Sun, M.; Li, X.; Yang, R.; Zhang, Y.; Zhang, L.; Song, Z.; Liu, Q.; Zhao, D. Comprehensive partitions and different strategies based on ecological security and economic development in Guizhou Province, China. J. Clean. Prod. 2020, 274, 122794. [Google Scholar] [CrossRef]
- Tolessa, T.; Senbeta, F.; Kidane, M. The impact of land use/land cover change on ecosystem services in the central highlands of Ethiopia. Ecosyst. Serv. 2017, 23, 47–54. [Google Scholar] [CrossRef]
- Wu, X.; Wang, S.; Fu, B.; Liu, Y.; Zhu, Y. Land use optimization based on ecosystem service assessment: A case study in the Yanhe watershed. Land Use Policy 2018, 72, 303–312. [Google Scholar] [CrossRef]
- Burkhard, B.; Kroll, F.; Müller, F.; Windhorst, W. Landscapes’ capacities to provide ecosystem services—A concept for land-cover based assessments. Landsc. Online 2009, 15, 1–22. [Google Scholar] [CrossRef]
- Carpenter, S.R.; Mooney, H.A.; Agard, J.; Capistrano, D.; DeFries, R.S.; Diaz, S.; Dietz, T.; Duraiappah, A.K.; Oteng-Yeboah, A.; Pereira, H.M.; et al. Science for managing ecosystem services: Beyond the Millennium Ecosystem Assessment. Proc. Natl. Acad. Sci. USA 2009, 106, 1305–1312. [Google Scholar] [CrossRef] [PubMed]
- Chen, W.; Zhao, H.; Li, J.; Zhu, L.; Wang, Z.; Zeng, J. Land use transitions and the associated impacts on ecosystem services in the Middle Reaches of the Yangtze River Economic Belt in China based on the geo-informatic Tupu method. Sci. Total Environ. 2019, 701, 134690. [Google Scholar] [CrossRef]
- Wang, Z.; Yang, Z.; Shi, H.; Han, F.; Liu, Q.; Qi, J.; Lu, Y. Ecosystem Health Assessment of World Natural Heritage Sites Based on Remote Sensing and Field Sampling Verification: Bayanbulak as Case Study. Sustainability 2020, 12, 2610. [Google Scholar] [CrossRef]
- Meng, L.; Huang, J.; Dong, J. Assessment of rural ecosystem health and type classification in Jiangsu province, China. Sci. Total Environ. 2018, 615, 1218–1228. [Google Scholar] [CrossRef]
- Yan, Y.; Zhao, C.; Wang, C.; Shan, P.; Zhang, Y.; Wu, G. Ecosystem health assessment of the Liao River Basin upstream region based on ecosystem services. Acta Ecol. Sin. 2016, 36, 294–300. [Google Scholar] [CrossRef]
- Kang, P.; Chen, W.; Hou, Y.; Li, Y. Linking ecosystem services and ecosystem health to ecological risk assessment: A case study of the Beijing-Tianjin-Hebei urban agglomeration. Sci. Total Environ. 2018, 636, 1442–1454. [Google Scholar] [CrossRef]
- Li, W.; Wang, Y.; Xie, S.; Cheng, X. Spatiotemporal evolution scenarios and the coupling analysis of ecosystem health with land use change in Southwest China. Ecol. Eng. 2022, 179, 106607. [Google Scholar] [CrossRef]
- Xu, W.; He, M.; Meng, W.; Zhang, Y.; Yun, H.; Lu, Y.; Huang, Z.; Mo, X.; Hu, B.; Liu, B.; et al. Temporal-spatial change of China’s coastal ecosystems health and driving factors analysis. Sci. Total Environ. 2022, 845, 157319. [Google Scholar] [CrossRef] [PubMed]
- Xiao, F.; Ouyang, H.; Zhang, Q.; Fu, B.; Zhang, Z. Forest ecosystem health assessment and analysis in China. J. Geogr. Sci. 2004, 14, 18–24. [Google Scholar] [CrossRef]
- Hasani, M.; Pielesiak, I.; Mahiny, A.S.; Mikaeili, A. Regional ecosystem health assessment based on landscape patterns and ecosystem services approach. Acta Ecol. Sin. 2023, 43, 333–342. [Google Scholar] [CrossRef]
- Frondoni, R.; Mollo, B.; Capotorti, G. A landscape analysis of land cover change in the Municipality of Rome (Italy): Spatio-temporal characteristics and ecological implications of land cover transitions from 1954 to 2001. Landsc. Urban Plan. 2011, 100, 117–128. [Google Scholar] [CrossRef]
- Lance, H.; Gunderson, L.P.J. Resilience and the Behavior of Large-Scale System. Ecol. Econ. 2007, 60, 662–663. [Google Scholar] [CrossRef]
- Colding, J. ‘Ecological land-use complementation’ for building resilience in urban ecosystems. Landsc. Urban Plan. 2007, 81, 46–55. [Google Scholar] [CrossRef]
- Xiao, R.; Liu, Y.; Fei, X.; Yu, W.; Zhang, Z.; Meng, Q. Ecosystem health assessment: A comprehensive and detailed analysis of the case study in coastal metropolitan region, eastern China. Ecol. Indic. 2018, 98, 363–376. [Google Scholar] [CrossRef]
- Fisher, B.; Turner, R.K.; Morling, P. Defining and classifying ecosystem services for decision making. Ecol. Econ. 2009, 68, 643–653. [Google Scholar] [CrossRef]
- De Groot, R.; Brander, L.; Van Der Ploeg, S.; Costanza, R.; Bernard, F.; Braat, L.; Christie, M.; Crossman, N.; Ghermandi, A.; Hein, L.; et al. Global estimates of the value of ecosystems and their services in monetary units. Ecosyst. Serv. 2012, 1, 50–61. [Google Scholar] [CrossRef]
- Costanza, R.; d’Arge, R.; de Groot, R.; Farber, S.; Grasso, M.; Hannon, B.; Limburg, K.; Naeem, S.; O’Neill, R.V.; Paruelo, J.; et al. The value of the world’s ecosystem services and natural capital. Nature 1997, 387, 253–260. [Google Scholar] [CrossRef]
- Maes, J.; Liquete, C.; Teller, A.; Erhard, M.; Paracchini, M.L.; Barredo, J.I.; Grizzetti, B.; Cardoso, A.; Somma, F.; Petersen, J.-E.; et al. An indicator framework for assessing ecosystem services in support of the EU Biodiversity Strategy to 2020. Ecosyst. Serv. 2016, 17, 14–23. [Google Scholar] [CrossRef]
- Xie, G.; Zhang, C.; Zhen, L.; Zhang, L. Dynamic changes in the value of China’s ecosystem services. Ecosyst. Serv. 2017, 26, 146–154. [Google Scholar] [CrossRef]
- Burkhard, B.; Kroll, F.; Nedkov, S.; Müller, F. Mapping ecosystem service supply, demand and budgets. Ecol. Indic. 2012, 21, 17–29. [Google Scholar] [CrossRef]
- Burkhard, B.; Kandziora, M.; Hou, Y.; Müller, F. Ecosystem Service Potentials, Flows and Demands—Concepts for Spatial Localisation, Indication and Quantification. Landsc. Online 2014, 34. [Google Scholar] [CrossRef]
- Burkhard, B.; Müller, A.; Müller, F.; Grescho, V.; Anh, Q.; Arida, G.; Bustamante, J.V.; Van Chien, H.; Heong, K.; Escalada, M.; et al. Land cover-based ecosystem service assessment of irrigated rice cropping systems in southeast Asia—An explorative study. Ecosyst. Serv. 2015, 14, 76–87. [Google Scholar] [CrossRef]
- Wu, X.; Liu, S.; Zhao, S.; Hou, X.; Xu, J.; Dong, S.; Liu, G. Quantification and driving force analysis of ecosystem services supply, demand and balance in China. Sci. Total Environ. 2018, 652, 1375–1386. [Google Scholar] [CrossRef] [PubMed]
- Ding, Y.; Zhang, M.; Qian, X.; Li, C.; Chen, S.; Wang, W. Using the geographical detector technique to explore the impact of socioeconomic factors on PM2.5 concentrations in China. J. Clean. Prod. 2019, 211, 1480–1490. [Google Scholar] [CrossRef]
- Liu, X.; Wang, H.; Wang, X.; Bai, M.; He, D. Driving factors and their interactions of carabid beetle distribution based on the geographical detector method. Ecol. Indic. 2021, 133, 108393. [Google Scholar] [CrossRef]
- Ren, B.; Wang, Q.; Zhang, R.; Zhou, X.; Wu, X.; Zhang, Q. Assessment of Ecosystem Services: Spatio-Temporal Analysis and the Spatial Response of Influencing Factors in Hainan Province. Sustainability 2022, 14, 9145. [Google Scholar] [CrossRef]
- Gao, S.; Dong, G.; Jiang, X.; Nie, T.; Yin, H.; Guo, X. Quantification of Natural and Anthropogenic Driving Forces of Vegetation Changes in the Three-River Headwater Region during 1982–2015 Based on Geographical Detector Model. Remote Sens. 2021, 13, 4175. [Google Scholar] [CrossRef]
- Wang, Y.; Dai, Q.; Ding, P.; Li, K.; Yi, X.; He, J.; Peng, X.; Yan, Y.; Zhao, M.; Yang, Y. Rapid Response of Runoff Carrying Nitrogen Loss to Extreme Rainfall in Gentle Slope Farmland in the Karst Area of SW China. Water 2022, 14, 3341. [Google Scholar] [CrossRef]
- Li, S.; Ren, H.; Xue, L.; Chang, J.; Yao, X. Influence of bare rocks on surrounding soil moisture in the karst rocky desertification regions under drought conditions. Catena 2014, 116, 157–162. [Google Scholar] [CrossRef]
- Chen, Q.; Xiong, K.; Lan, A. Remote sensing monitoring of Karst Rocky Desertification in Guizhou Province Based on 3S. J. Arid. Land Resour. Environ. 2014, 28, 62–67. [Google Scholar] [CrossRef]
- Qian, C.; Qiang, H.; Qin, C.; Wang, Z.; Li, M. Spatiotemporal Evolution Analysis and Future Scenario Prediction of Rocky Desertification in a Subtropical Karst Region. Remote Sens. 2022, 14, 292. [Google Scholar] [CrossRef]
- Sun, T.; Lin, W.; Chen, G.; Guo, P.; Zeng, Y. Wetland ecosystem health assessment through integrating remote sensing and inventory data with an assessment model for the Hangzhou Bay, China. Sci. Total Environ. 2016, 566–567, 627–640. [Google Scholar] [CrossRef] [PubMed]
- Pan, Z.; He, J.; Liu, D.; Wang, J. Predicting the joint effects of future climate and land use change on ecosystem health in the Middle Reaches of the Yangtze River Economic Belt, China. Appl. Geogr. 2020, 124, 102293. [Google Scholar] [CrossRef]
- Ye, J.-S.; Reynolds, J.F.; Maestre, F.T.; Li, F.-M. Hydrological and ecological responses of ecosystems to extreme precipitation regimes: A test of empirical-based hypotheses with an ecosystem model. Perspect. Plant Ecol. Evol. Syst. 2016, 22, 36–46. [Google Scholar] [CrossRef]
- Halpern, B.S. Building on a Decade of the Ocean Health Index. One Earth 2020, 2, 30–33. [Google Scholar] [CrossRef]
- Mallick, J.; AlQadhi, S.; Talukdar, S.; Pradhan, B.; Bindajam, A.A.; Islam, A.R.M.T.; Dajam, A.S. A Novel Technique for Modeling Ecosystem Health Condition: A Case Study in Saudi Arabia. Remote Sens. 2021, 13, 2632. [Google Scholar] [CrossRef]
- Tang, D.; Liu, X.; Zou, X. An improved method for integrated ecosystem health assessments based on the structure and function of coastal ecosystems: A case study of the Jiangsu coastal area, China. Ecol. Indic. 2018, 84, 82–95. [Google Scholar] [CrossRef]
Disclaimer/Publisher’s Note: The statements, opinions and data contained in all publications are solely those of the individual author(s) and contributor(s) and not of MDPI and/or the editor(s). MDPI and/or the editor(s) disclaim responsibility for any injury to people or property resulting from any ideas, methods, instructions or products referred to in the content. |
© 2023 by the authors. Licensee MDPI, Basel, Switzerland. This article is an open access article distributed under the terms and conditions of the Creative Commons Attribution (CC BY) license (https://creativecommons.org/licenses/by/4.0/).