Article

Research on the Sustainable Development of Natural-Social-Economic Systems Based on the Emergy Accounting Method—A Case Study of Liyang in China

1
Department of Urban and Rural Planning, School of Landscape Architecture, Beijing Forestry University, Beijing 100083, China
2
Department of Urban Planning, School of Architecture, Tsinghua University, Beijing 100084, China
3
School of Public Administration, Xi’an University of Architecture and Technology, Xi’an 710055, China
4
School of Urban Construction, Beijing City University, Beijing 101309, China
*
Author to whom correspondence should be addressed.
Land 2023, 12(7), 1362; https://doi.org/10.3390/land12071362
Submission received: 23 May 2023 / Revised: 23 June 2023 / Accepted: 5 July 2023 / Published: 7 July 2023

Abstract

:
Coordinating the relationship between resources, environmental protection, and economic development is essential for regional sustainable development. Various frameworks and models for quantifying the sustainable development of regional natural–social–economic systems have been produced. This paper focused on measuring regional sustainable development from the perspective of sustainable consumption and production. The study improved the emergy sustainable indices and the evaluation system commonly used in the method of emergy accounting by introducing input and output emergy into the emergy flows. Then, we proposed new subsystem sustainable indexes for evaluating and analyzing the sustainable development trend of the complex natural–social–economic system in Liyang from 2005 to 2020 by adopting the entropy weight method. The results showed that Liyang was generally in a state of sustainable development, with good social sustainability. The economic and natural sustainability indexes were low, which might cause unsustainable risks in the future. From the input structure and production efficiency perspective, the secondary industry with the highest emergy output has a meager net output rate. In contrast, the tertiary industry has a higher net output rate (NOR) and better output efficiency, which should be the core industry in the region’s future development. From the perspective of environmental impact and resource and environmental carrying capacity, the natural contribution rate and environmental carrying rate should be improved and the waste emergy rate necessary to be reduced. This study hopes to provide implications for formulating regional land use, industrial planning, and sustainable development policies.

1. Introduction

Sustainable development was first proposed in 1980. It is a complex concept that not only includes the sustainable development of the economy and society, but also includes the sustainable development of nature and resources [1]. Sustainable development is now one of the most essential strategies for global development, and of course in China. With the rapid urbanization process in the past decades, the focus of China’s development has shifted from the city to the countryside [2,3]. As the link between urban and rural areas, townships are prominent in implementing urban–rural integration and rural revitalization policies in China [4]. Compared with cities, which are composed of artificial environments, one of the most critical issues in rural development and county development is that development and construction must take into account the damage to the natural environment [5,6]. Therefore, the county’s sustainable development must pay more attention to resolving the contradiction between development and protection [7,8].
Since the last century, a multitude of studies have explored regional sustainable development from the perspective of the interaction between the natural environment and human social systems [9,10,11]. Various frameworks and models have been developed to quantify the sustainable development of regional ecosystems. For instance, the ecological cycle assessment (ECA) framework and the urban metabolism (UM) framework [12] are characterized by their emphasis on the development process, stages, and cycles of ecosystems. The Ecological Footprint (EF) measurement and the Pressure–State–Response (PSR) framework, proposed by the United Nations Environment Program (UNEP) [13,14,15], are two methodologies that focus on measuring the impact of human activities on natural resources and the environment, as well as the carrying capacity fed back by the ecosystem. The system dynamics (SD) model specializes in decomposing a system into several subsystems, such as social, land, and environmental subsystems, and interpreting the interactions between these multiple subsystems [16,17]. Finally, the social-ecological system (SES) framework focuses on the governance of natural and human systems [18].
Emergy theory was first proposed by Odum (1983), which evolved from systems ecology [19,20] and energetics [21]. Emergy accounting measurement links the regional ecological and social–economic systems by directly and indirectly converting all energy sources, materials, environmental elements, human labor, and services required into a standard unit [22]. It has been widely applied in many countries [23,24,25,26,27,28]. In past research, it often appeared in combination with other frameworks and models such as EF [8,29,30,31,32], ECA [33], UM [12], PSR [13], and SD [34,35]. Compared with other sustainable development models, the emergy accounting measurement has the following advantages. Firstly, it comprehensively considers the elements of the natural–social–economic system, especially the natural environment system. It includes resources such as the atmosphere, minerals, and energy sources such as solar energy and potential rainwater energy in natural systems. Consideration is also given to the energy value that waste can store, which is often ignored by other models [36]. Secondly, it assigns a simple and scientific measure of value to natural and human activities. The emergy conversion coefficients could also integrate elements such as renewable resources, manufactured articles, capital goods, and high-level energy such as labor and information [34]. Finally, multi-dimensional calculations and evaluations are possible through emergy accounting. The contribution of nature and human production to the total emergy of the system can be calculated and emergy indicators in different regions are comparable [37,38].
The research applied the emergy method often uses indicators such as emergy sustainable indices (ESI) to measure the sustainability of the system [39,40,41,42]. These indicators actually reveal more of the self-supporting features of a system. It is always the case that the less supported by import emergy, the more utilization of a system’s own emergy, and the better its sustainability. However, under the current massive and high-speed flows of international and national production factors, few cities could develop independently [43]. Indicators such as ESI have great limitations when reflecting the development efficiency of composite systems [42], especially in the sustainability of consumption and production. According to the sustainable development goals (SDGs) of the United Nations, responsible consumption and production are critical for regional sustainable development [1]. Increases in the net welfare of economic activities by reducing resource consumption, environmental degradation, and pollution throughout the entire life cycle are great transitions for ensuring sustainable consumption and production patterns [1]. In this context, this paper intended to start from the perspective of sustainable consumption and production, introduce input and output emergy accounting, and establish a new sustainable evaluation system, in order to conduct sustainable evaluation research on the natural–social–economic composite system in urban–rural areas.
Liyang is a typical urban–rural area with contradictions between natural ecological protection and agricultural development and economic development. Based on identifying the development characteristics of Liyang, this study incorporated the input and output of economic activities into the general emergy diagram of its natural–social–economic system, especially the fixed asset investment and labor input elements. Through the accounting of the input, output, and waste emergy in the production process from 2005 to 2020, the sustainability of its complex natural–social–economic system was evaluated by using the entropy weight method. In theory, on the one hand, the introduction of the input–output concept has enriched the application scenarios of emergy theory, especially in the fields of production efficiency and sustainable consumption and production. On the other hand, based on the combination of the emergy method and the entropy weight method, a new evaluation index that can reflect the comprehensive sustainability and the subsystem sustainability was proposed so that the status and trend of regional sustainable development could be quantified. In practice, it provided methodology and empirical experiences for the sustainable development evaluation of complex systems in areas with developed economies and provided policy inspiration for the development and protection of counties and towns.

2. Materials and Methods

2.1. Study Area and Data Source

Liyang is a county-level city located in Jiangsu Province in eastern China (Figure 1). It covers an area of 1535 Km2. The population of Liyang City was 785,500, and the annual GDP was CNY 108.64 billion in 2022. Liyang had good natural endowments and climatic conditions, which was the critical area for grain production in Jiangsu Province. In 2022, the annual grain sown area was 549.73 Km2, and the total grain output was 409,200 tons. With 35% of the land area, Liyang produced more than 57% of the grain in Changzhou. The grain yield per unit area was 742.64 kg/Km2, 28% higher than the national average. Meanwhile, Liyang was a county-level city with a well-developed industry, and it ranked 19th in the list of “Top 100 Counties of China’s County Economy and Basic Competitiveness in 2022”. The process of rapid development has also brought a series of problems, such as air and water pollution. Due to these characteristics, the coordination of contradictions between development and protection is a vital issue in the sustainable development of Liyang.
This study established an emergy accounting database by sorting out the natural resources and socio-economic statistics of Liyang City from 2005 to 2020. All the data were obtained from the Liyang Statistical Yearbook (2006–2021) and the Changzhou Statistical Yearbook (2006–2021).

2.2. The Emergy Accounting Method

The steps of the emergy accounting method usually include drawing the emergy flows diagram, calculating the emergy accounting index, and constructing a natural–social–economic sustainable development evaluation system based on emergy accounting.

2.2.1. Emergy Flows

In Odum’s emergy theory, the operation of the socio-economic system is supported by the materials and energy from the natural system [44]; the waste generated by the production and consumption of the socio-economic system can then be assimilated through the self-purification ability of the natural system. Therefore, the emergy flow diagram contains the energy and resources of the natural ecosystem, materials, assets, and information invested for agriculture, industry, service, and residents’ livelihood, the products and currency produced by the socio-economic systems, and waste generated from production and daily life (Figure 2).

2.2.2. Emergy Accounting

The emergy accounting method could convert all energy, materials, productions, and services in the emergy flows diagram into a standard unit through the emergy conversion rate (UEV). The UEVs used in this study were detailed in Table 1.
Combining the general emergy flows and the development characteristics of the study area, the emergy accounting indexes in this paper mainly highlight the input–output efficiency. All indexes are integrated into three parts: input, output, and waste. The input includes resources and energy inputs of natural systems; materials, assets, and information inputs of socio-economic systems. These inputs can be divided into renewable emergy and non-renewable emergy. For example, solar energy, wind energy, potential rainwater energy, and rainwater chemical energy are the emergy of renewable resources (R). The topsoil layer’s net loss energy and soil organic matter’s net loss energy are the emergy of non-renewable resources (N). In the socio-economic system, seeds, organic fertilizers, and labor are input renewable emergy (IR), but fixed assets and other production factors are input non-renewable emergy (IN). In output emergy (O) accounting, we use GDP to measure the output of the secondary and tertiary industries. Since only the industrial products with the largest annual output are listed in the yearbook, and a large number of small-volume industries products are not listed, GDP could better cover all the output. However, there are fewer types of agricultural products, and the emergy accounted byproducts is not much different from GDP. Thus, we used the product emergy instead of agricultural GDP which could reflect the changes in the agricultural structure. Waste emergy (W) includes gas, water, and solid emissions from production and living.

2.2.3. The Natural–Social–Economic Sustainable Development Evaluation System

Liyang is a complex natural–social–economic system and the sustainability of the system is formed by each subsystem. According to the characteristics of emergency flows and accounting in Liyang, this research follows the principles of scientific, representativeness, and operability, and constructs an evaluation system including three levels: target, criteria, and indicators (Table 2).
The first criterion is the natural sustainable index (NSI). As mentioned in the introduction, emergy theory could account for the natural energy on the earth such as solar, runoff, and tidal energy, and could also measure the waste emergy. This study selects indicators of the natural contribution rate (NCR), environmental carrying rate (ECR), and waste rate (WR). The NCR measures the emergy contribution of the local natural elements in the system. The higher the value, the more significant the impact of the natural resources on this region. The ECR can reflect the environmental pressure of the system. The higher the value, the more significant the proportion of non-renewable emergy input in the region, and the greater the environmental carrying pressure. The WR is the value of waste emergy generated per unit of output, the higher the value, the more waste emissions during the production process [42,44].
The second criterion is derived from the social subsystem, the social sustainable index (SSI). Combined with the input–out concept induced in this study, we proposed three indicators to represent the sustainability of the social system, per capita emergy utilization (EU), per capita emergy output (EO), and per capita electricity emergy (EE). The EU shows the intensity of emergy utilization in a region. The higher the input means the higher the emergy consumption. The EO refers to emergy output capability of the region, which is comparable with other cities or counties. The EE measures the living standard and quality of residents, which is a typical emergy index used to evaluate regional social development [50].
The third criterion, economic sustainable index (ESI), refers to the sustainability of the economic subsystem. From the perspective of sustainable production and consumption, high efficiency and green development are the essential requirements. Thus, we constructed two indicators in this part: the net emergy output rate (NOR) and the emergy investment rate (EIR). The NOR represents the output performance of the system. The higher the value, the greater the output per unit investment, and the better the emergy output performance. The EIR indicates the dependence of regional development on exploiting natural emergy [51]. The higher the value, the more significant the impact of economic investment in the region and less dependence on or taking advantage of natural resources.
Based on the value of sustainable indexes, the sustainable development condition of each system could be divided into four grades: great sustainable (0.75–1), good sustainable (0.5–0.75), weak sustainable (0.25–0.5), and unsustainable (0–0.25).

2.3. Entropy Weighting Method

The entropy weighting method (EWM) is an objective mathematical weighting method. It is able to measure the degree of dispersion of each index. The more discrete the index, the greater its impact on the evaluation. The weight calculation of EWM includes the following steps:
  • Define the positive and negative of each index, and standardize the data:
The following Equation (1) are for the standardization of positive/negative indexes:
Y i j = X i j m i n X i j m a x X i j m i n X i j + 1   Y i j = m a x X i j X i j m a x X i j m i n X i j + 1
where X i j is the i t h index of the jth year. Y i j is the standardization of X i j . m a x X i j and m i n X i j are the maximum and minimum values of index i .
2.
Calculate the entropy value of each index:
P i j = Y i j j = 1 n Y i j
E i = ln ( n ) 1 i = 1 m P i j ln P i j
where P i j is the proportion of index i of the j th year. E i is the entropy value of index i . There are m indexes and n years of data for each index.
3.
Measure the weight of each index:
W i = 1 E i i = 1 m 1 E i
where W i is the weight of index i .
4.
Calculation of the sustainability composite index Fi:
F i = j = 1 n W i Y i j

3. Results

3.1. The Emergy Accounting Results in Liyang

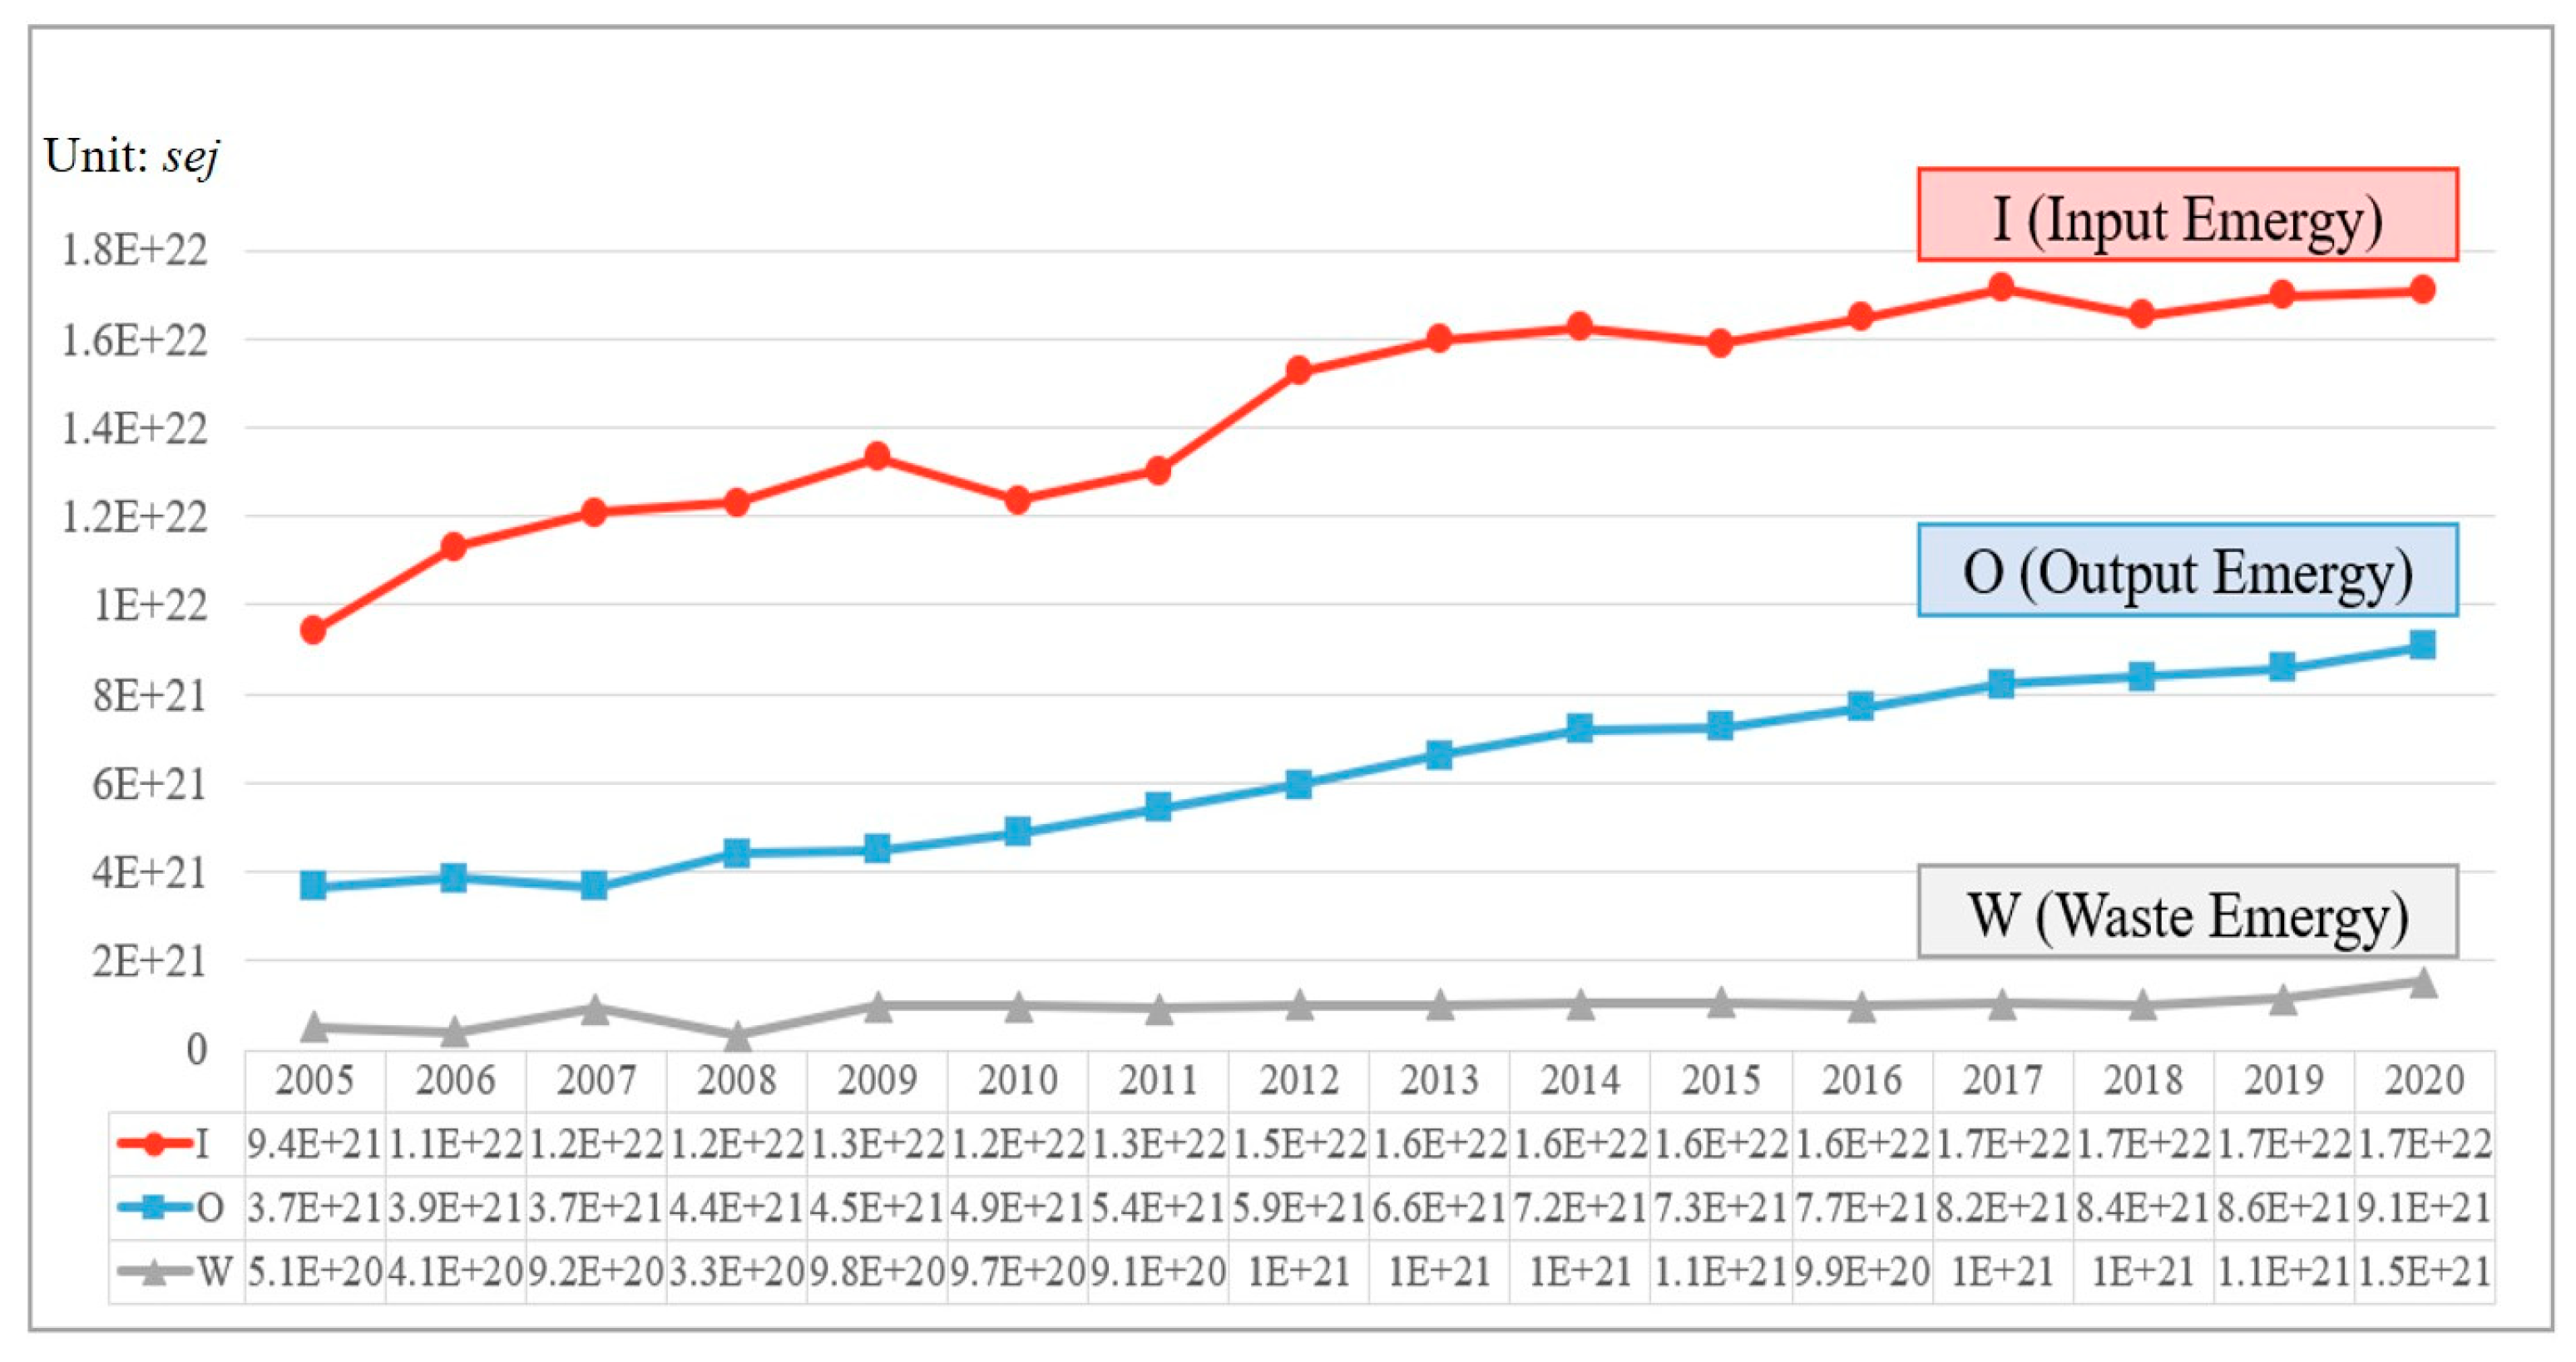
3.1.1. Overview of Emergy Flows and Emergy Accounting Results

From 2005 to 2020, with the regional progress of technology and economy, the input, output, and waste emergy in the system all increased (Figure 3). By 2020, the emergy input from nature and environment, emergy investment of human labor, production factors, etc., reached 1.71E + 22 sej, the total output emergy was 9.08E + 21 sej, and the emergy value of waste emissions was 1.52E + 21 sej. In these 16 years, the value of input emergy has increased by 7.62E + 21 sej, compared with 2005, the total growth rate of input emergy was only 80.71%, and the average annual growth rate was about 5.0%. The increase in output emergy was 5.43E + 21 sej, the growth rate reached 148.69%, and the average annual growth rate was 9.3%. The growth rate of waste energy value was the highest, achieving 198.73%, with an average annual growth rate of 12.4%.

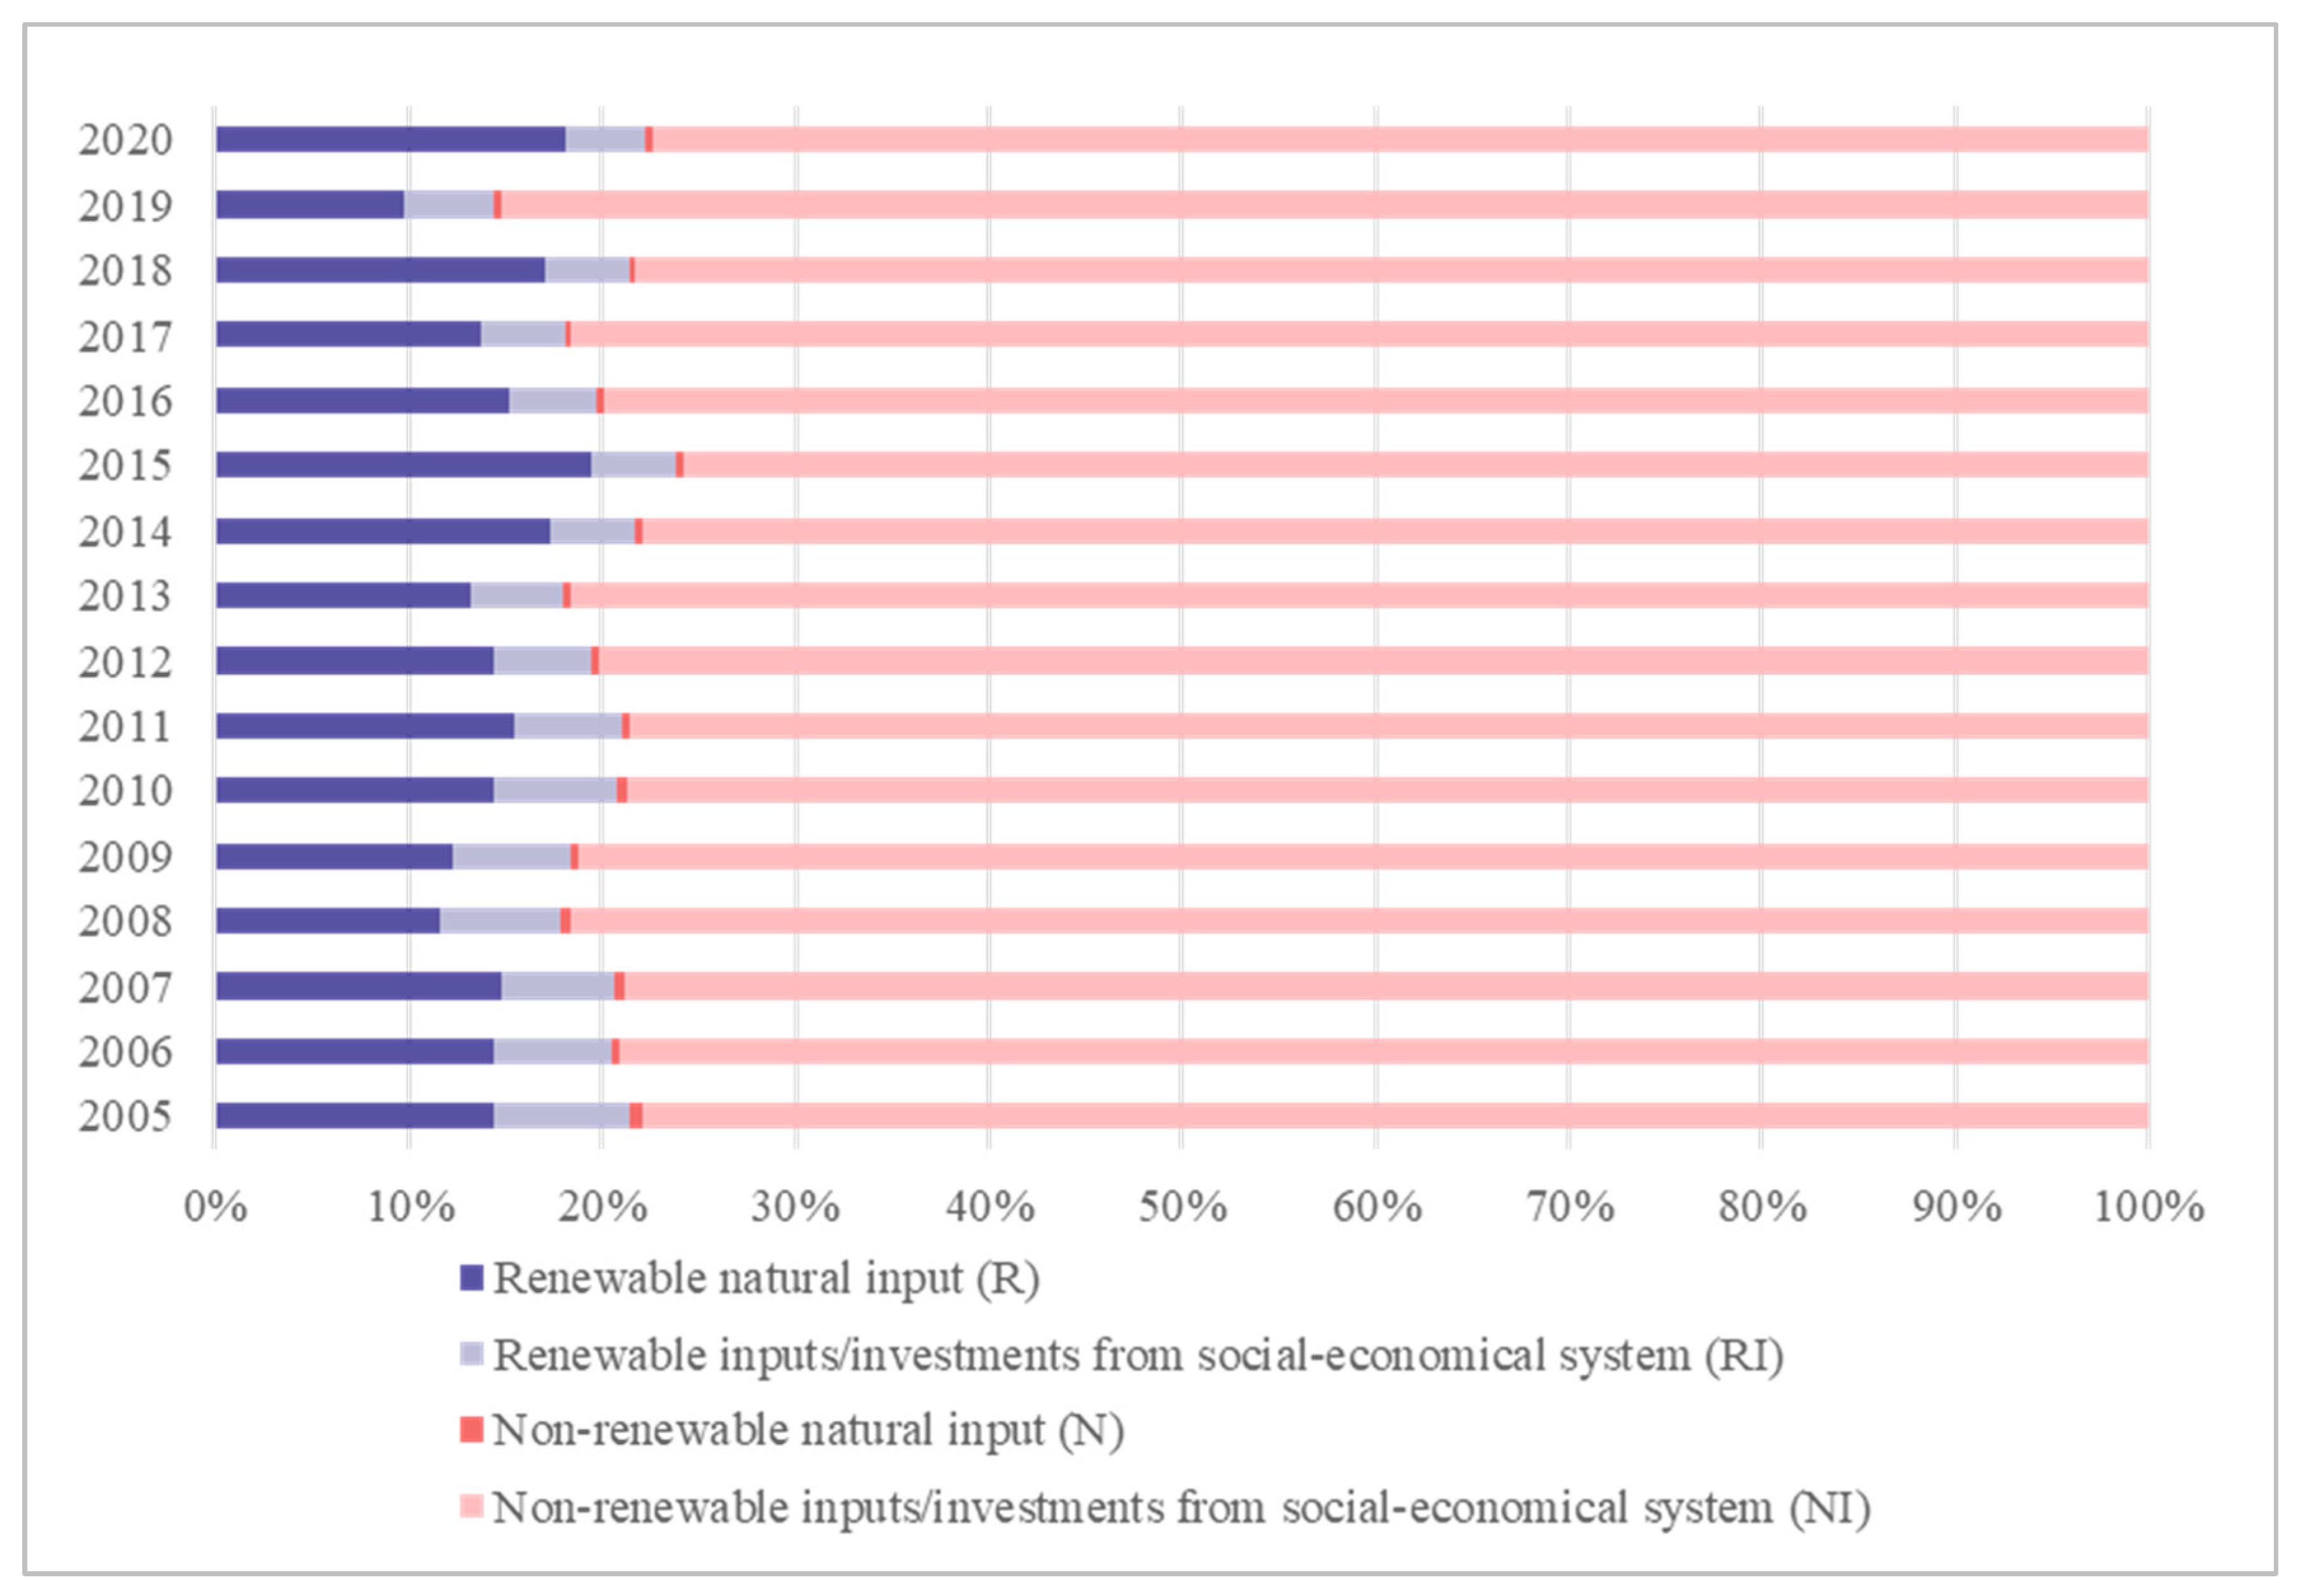
3.1.2. Analysis of Input Structure

(1)
Renewable inputs or non-renewable inputs?
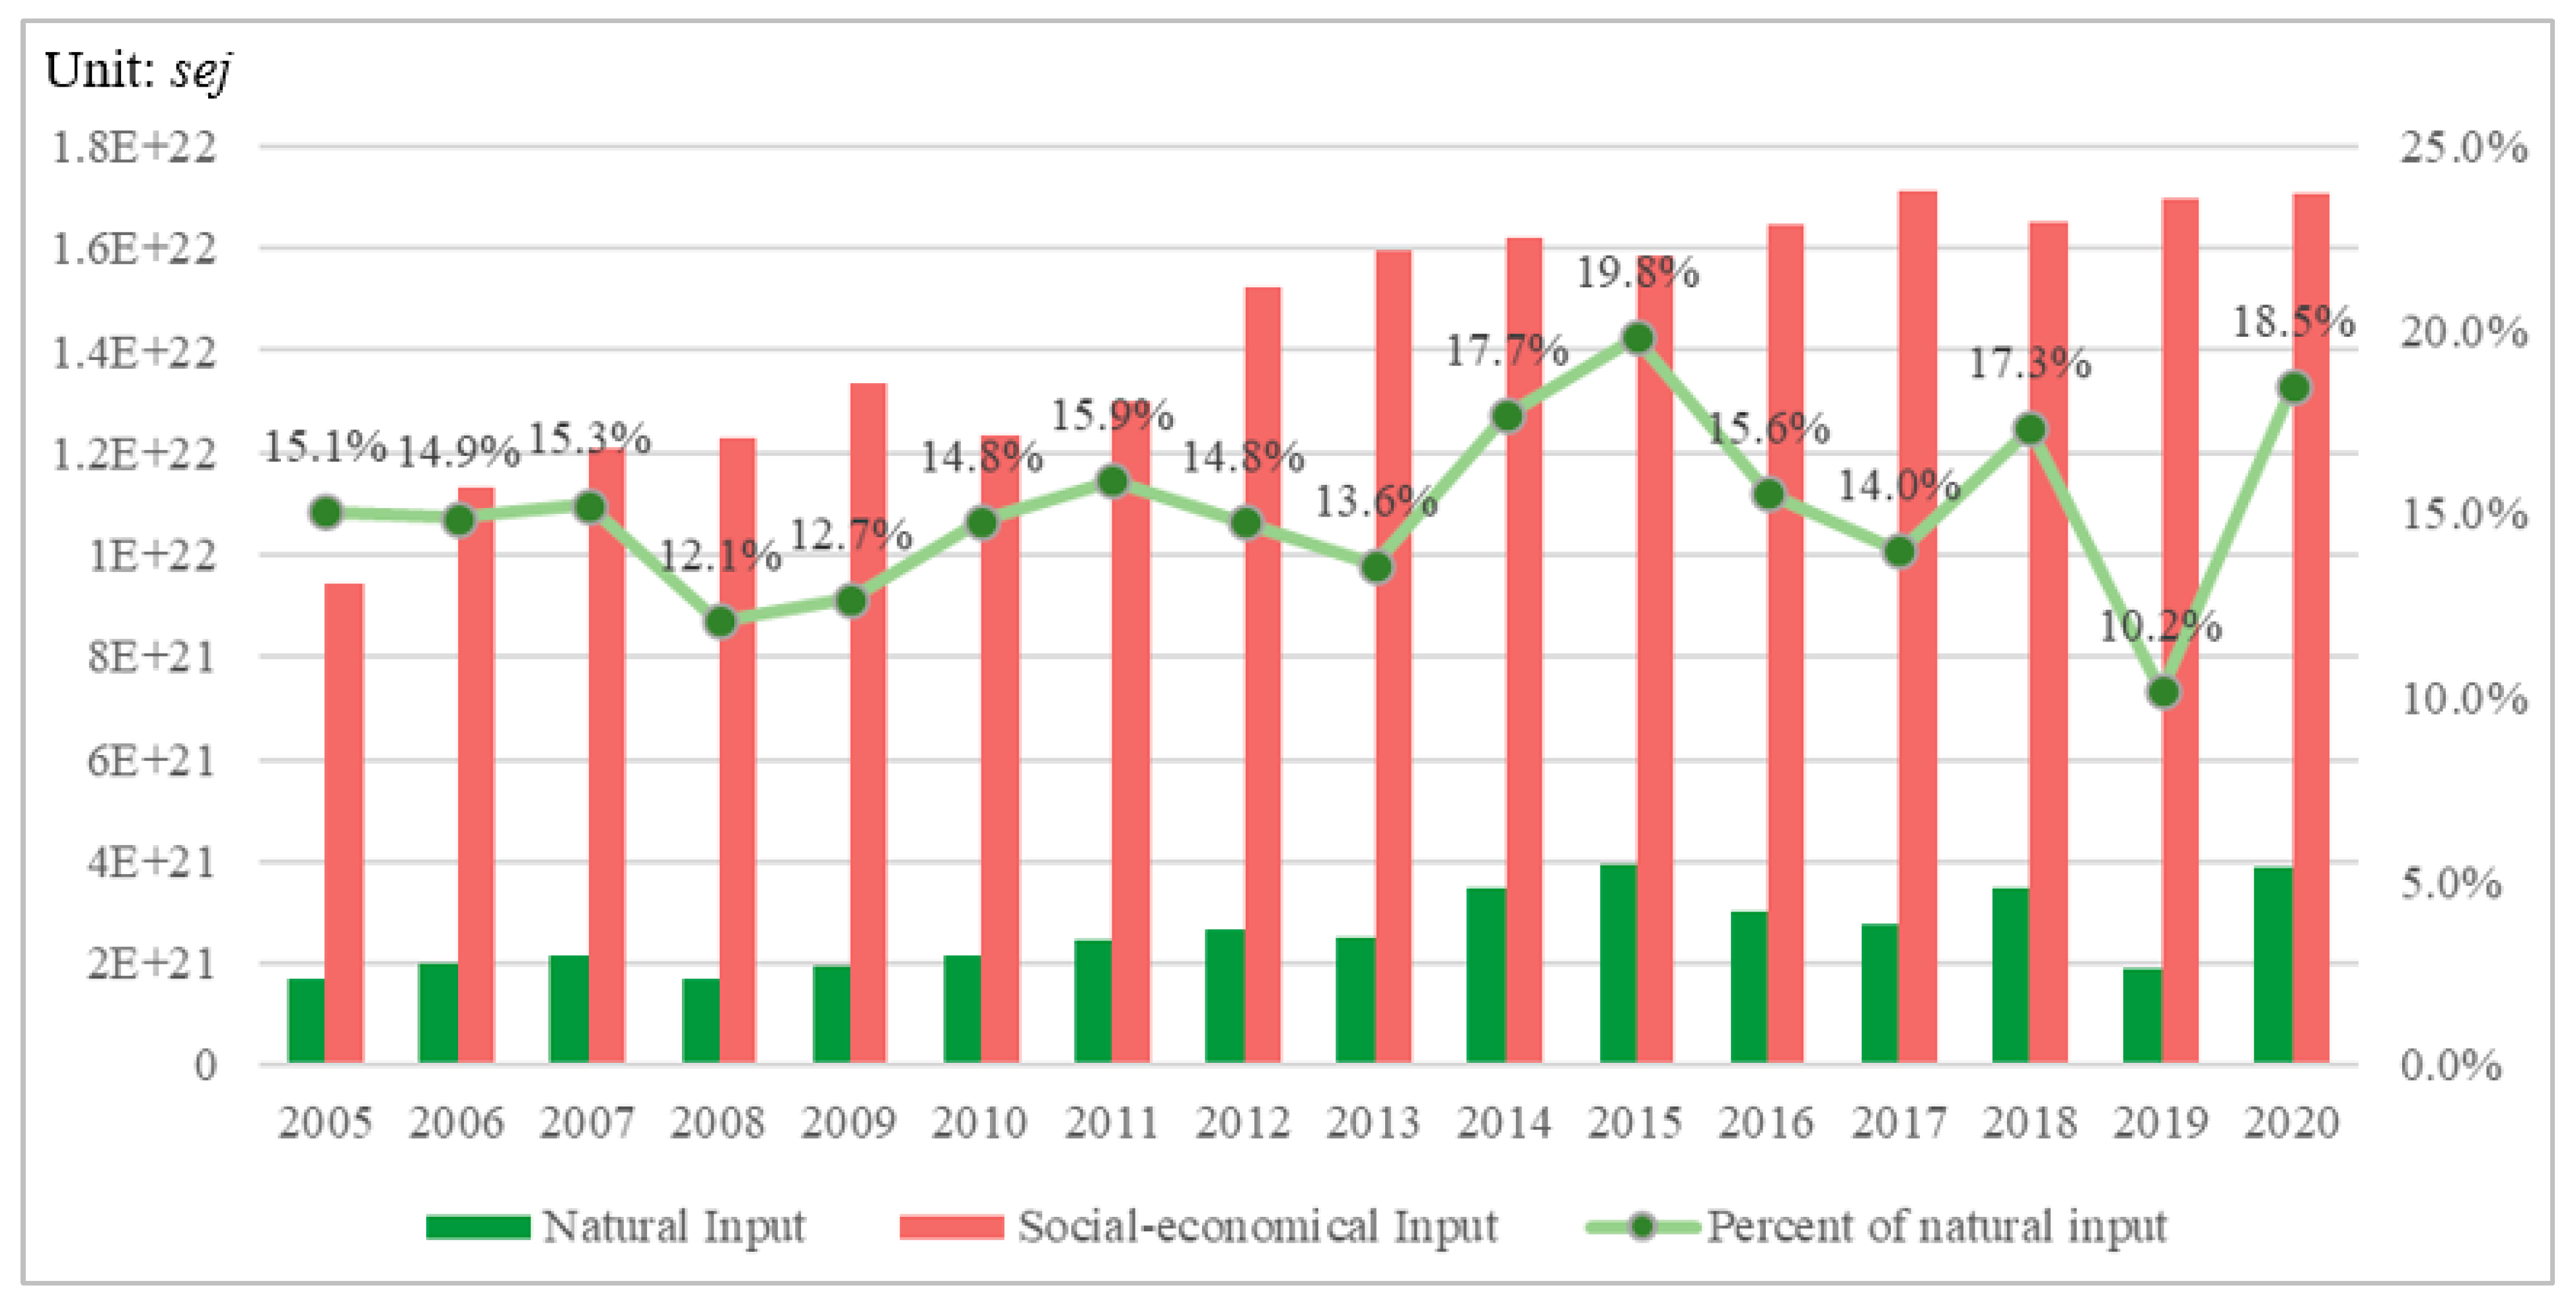
As shown in Figure 4, from 2005 to 2020, non-renewable inputs accounted for most emergy inputs, while renewable inputs only accounted for between 14.4% and 23.8%. Among the renewable inputs, there were more renewable natural inputs. Among non-renewable inputs, most were inputs/investments from the social–economic systems, and non-renewable natural input was minimal, accounting for less than 1% of the overall emergy input. The proportion of renewable emergy showed a fluctuating upward trend in the past 16 years. The lowest was 2.39E + 21 sej in 2005, and the highest was 4.72E + 21 sej in 2015. The most significant influencing factor is precipitation because the maximum energy value of renewable resources in Liyang is the potential energy of rainwater.
(2)
Emergy from natural resources and investment emergy from the social–economic system
Since the non-renewable natural emergy input was very low, the natural input was mainly based on renewable emergy—that is, the potential energy of rainwater—which is mainly determined by the annual precipitation. During these 16 years, the input of natural emergy accounted for less than 20% of the total emergy input, maintaining between 10.2% and 19.8% (Figure 5). While the investments of labor, fixed assets, and other production factors of the socio-economic system account for more than 80% of the overall input, the social–economic emergy input is mainly affected by the consumption of raw coal and electric energy (Figure 6).
(3)
Emergy input structure based on industrial structure
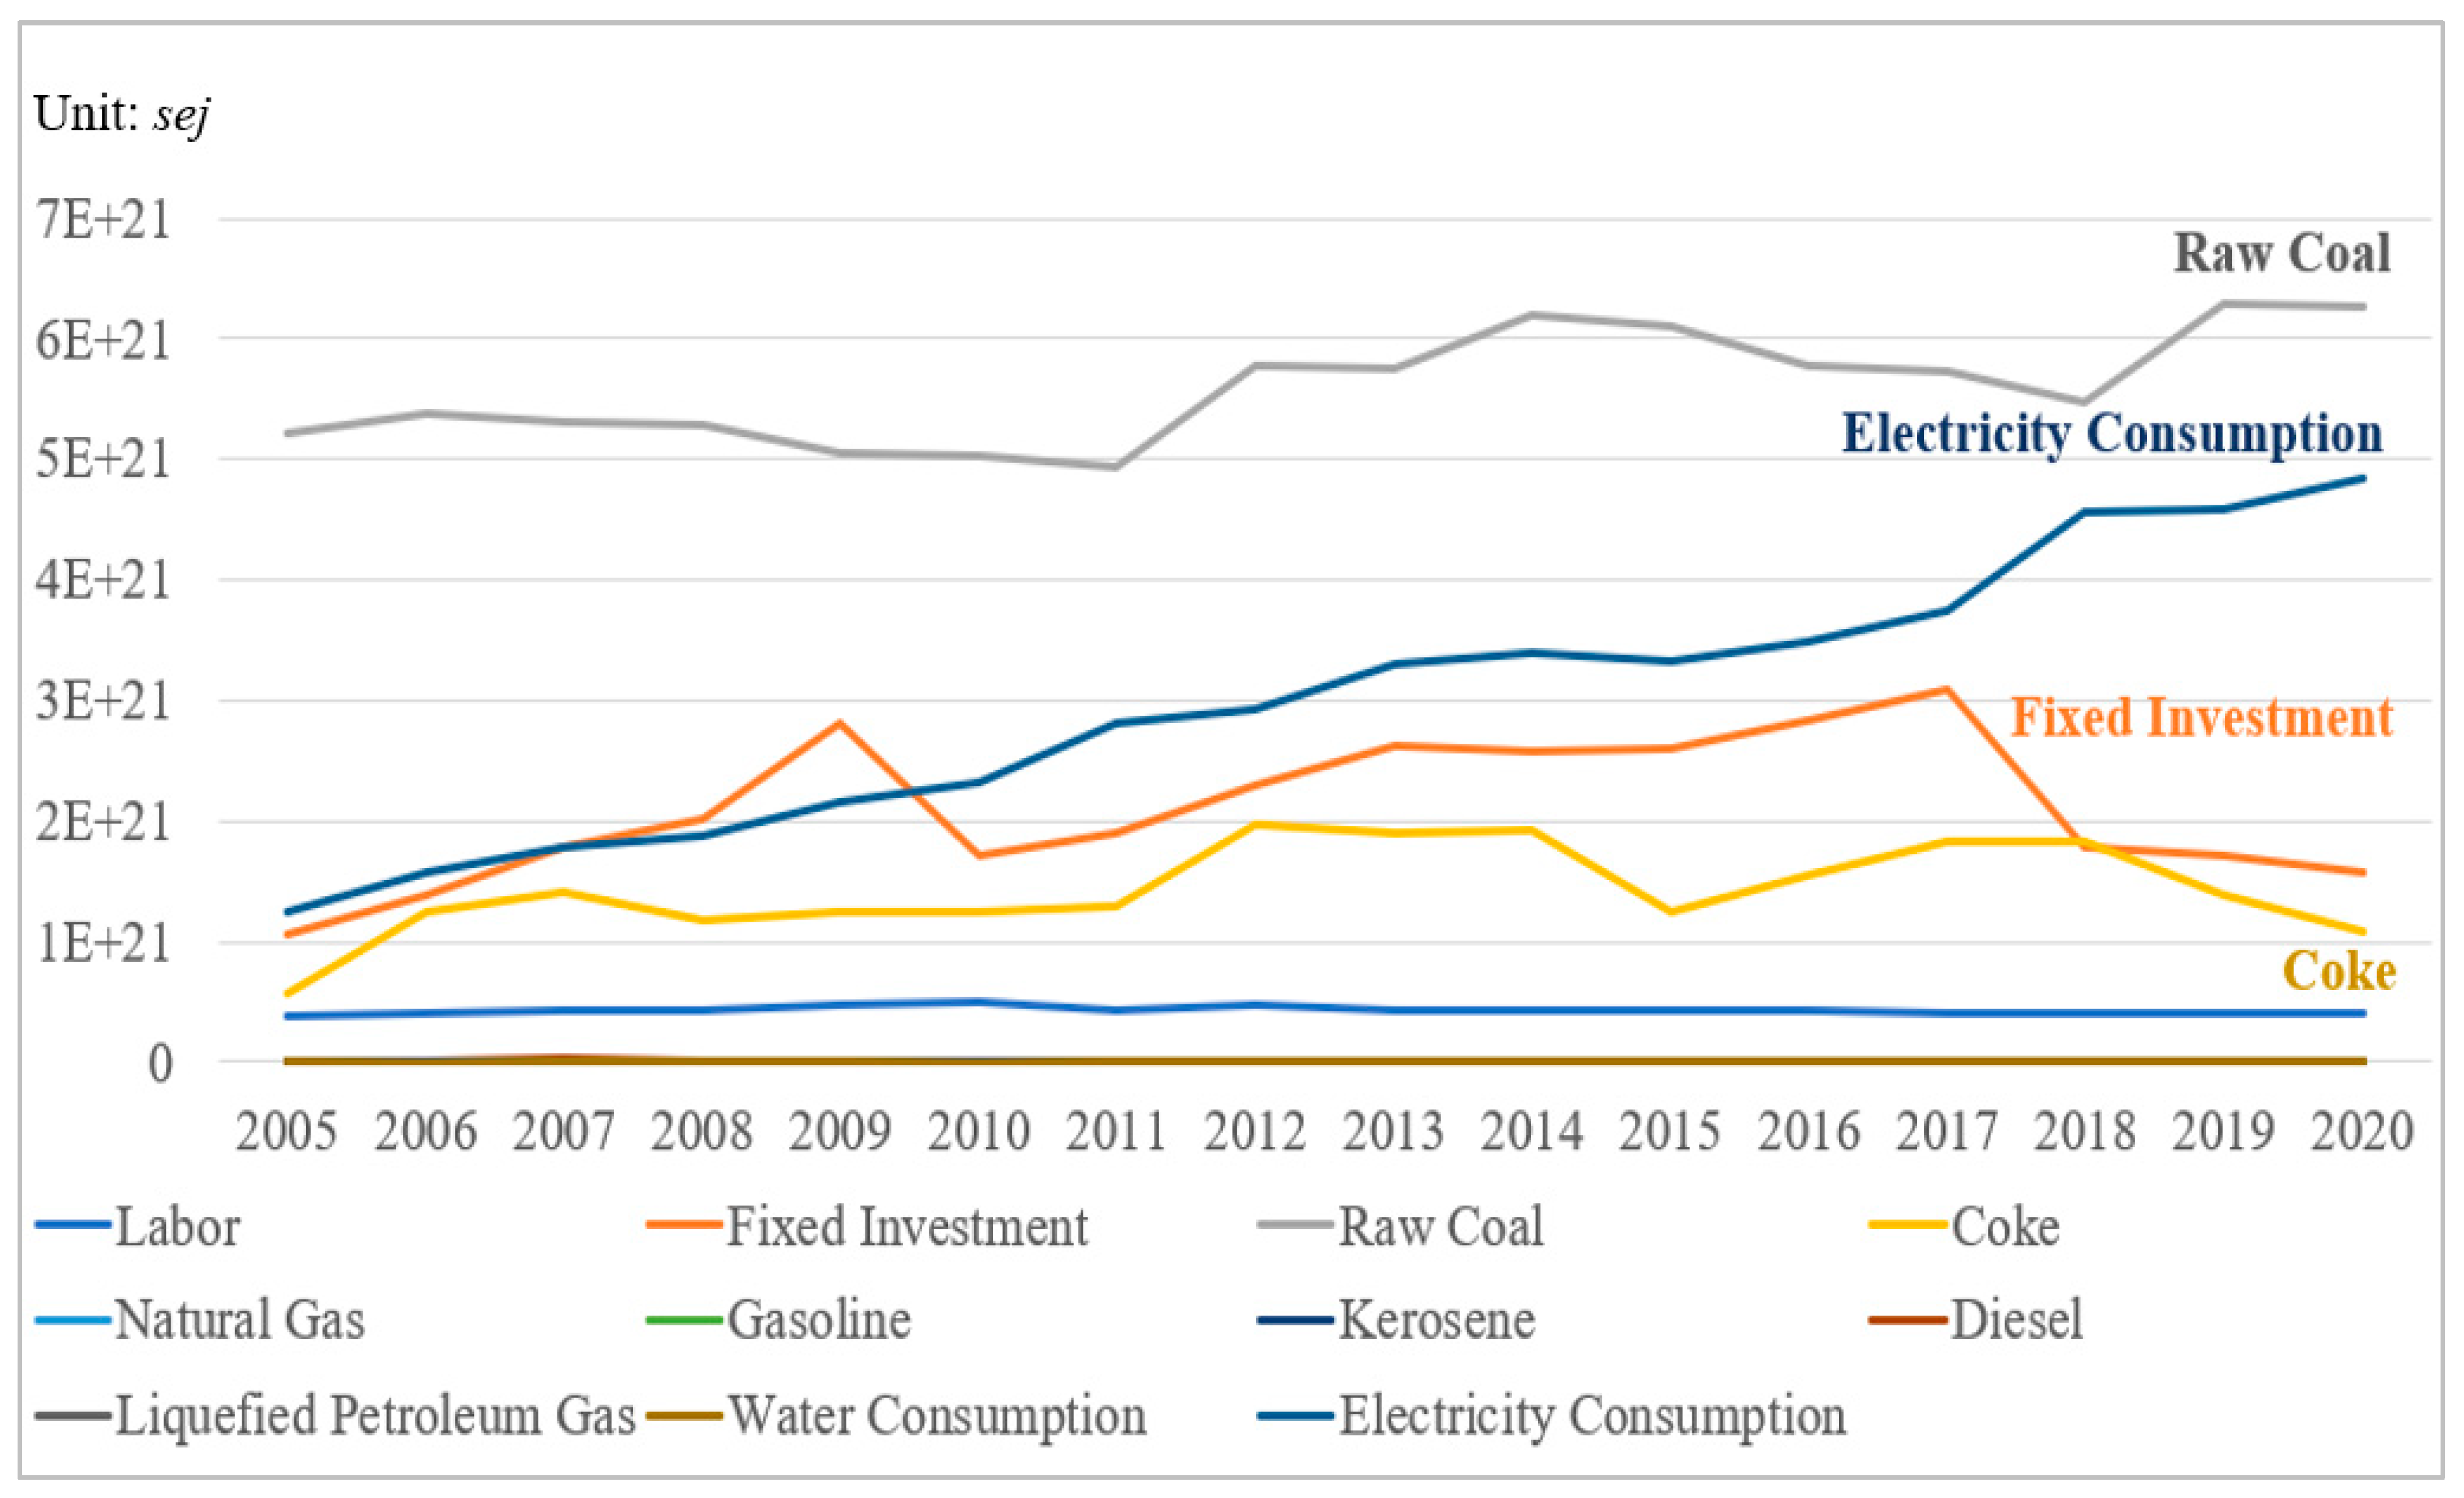
Among the emergy inputs and investments in Liyang, agriculture emergy inputs were the least and showed a slight downward trend, from 4.42E + 20 sej in 2005 to 3.81E + 20 sej in 2020. The emergy input into the tertiary industry and daily life were second, but it shows an apparent upward trend. In 2005, the total input of tertiary industry and life was similar to the emergy of agriculture, which was 5.04E + 20 sej. After 16 years of rapid growth, it reached 2.49E + 21 sej, an increase of nearly five times, while the inputs and investments in the secondary industry were the largest, increasing from 8.50E + 21 sej in 2005 to 1.42E + 22 sej in 2020.
During these 16 years, the proportion of emergy input in agriculture has dropped from 4.7% to 2.2%, with a reduction of more than half. Although the emergy input of secondary production has increased year by year, the proportion of input has dropped from more than 90% to 83.2%. The ratio of emergy input in tertiary industry and life has increased significantly, from 5.3% in 2005 to 14.6% in 2020 (Figure 7).
(4)
Analysis of emergy input structure from the perspective of production factors
As shown in Figure 8a, from the industrial production process perspective, the emergy value of labor input was relatively small, maintaining between 7.50E + 20 sej and 9.09E + 20 sej in 16 years. The input emergy of fixed asset investment was higher than that of labor, rising from 1.12E + 21 sej to 2.96E + 21 sej, and reaching a peak of 4.03E + 21 sej in 2017. The fixed asset investment emergy presented evident stages: 2005–2009, 2010–2016, and 2017–2020. In 2010 and 2017, there were significant downward adjustments, and then there was a periodic upward trend related to the government’s financial allocation. Other production factors, especially the input of non-renewable resources required by industrial production, account for most of the emergy inputs, such as the consumption of raw coal, electricity, coke, etc. (Figure 8b).

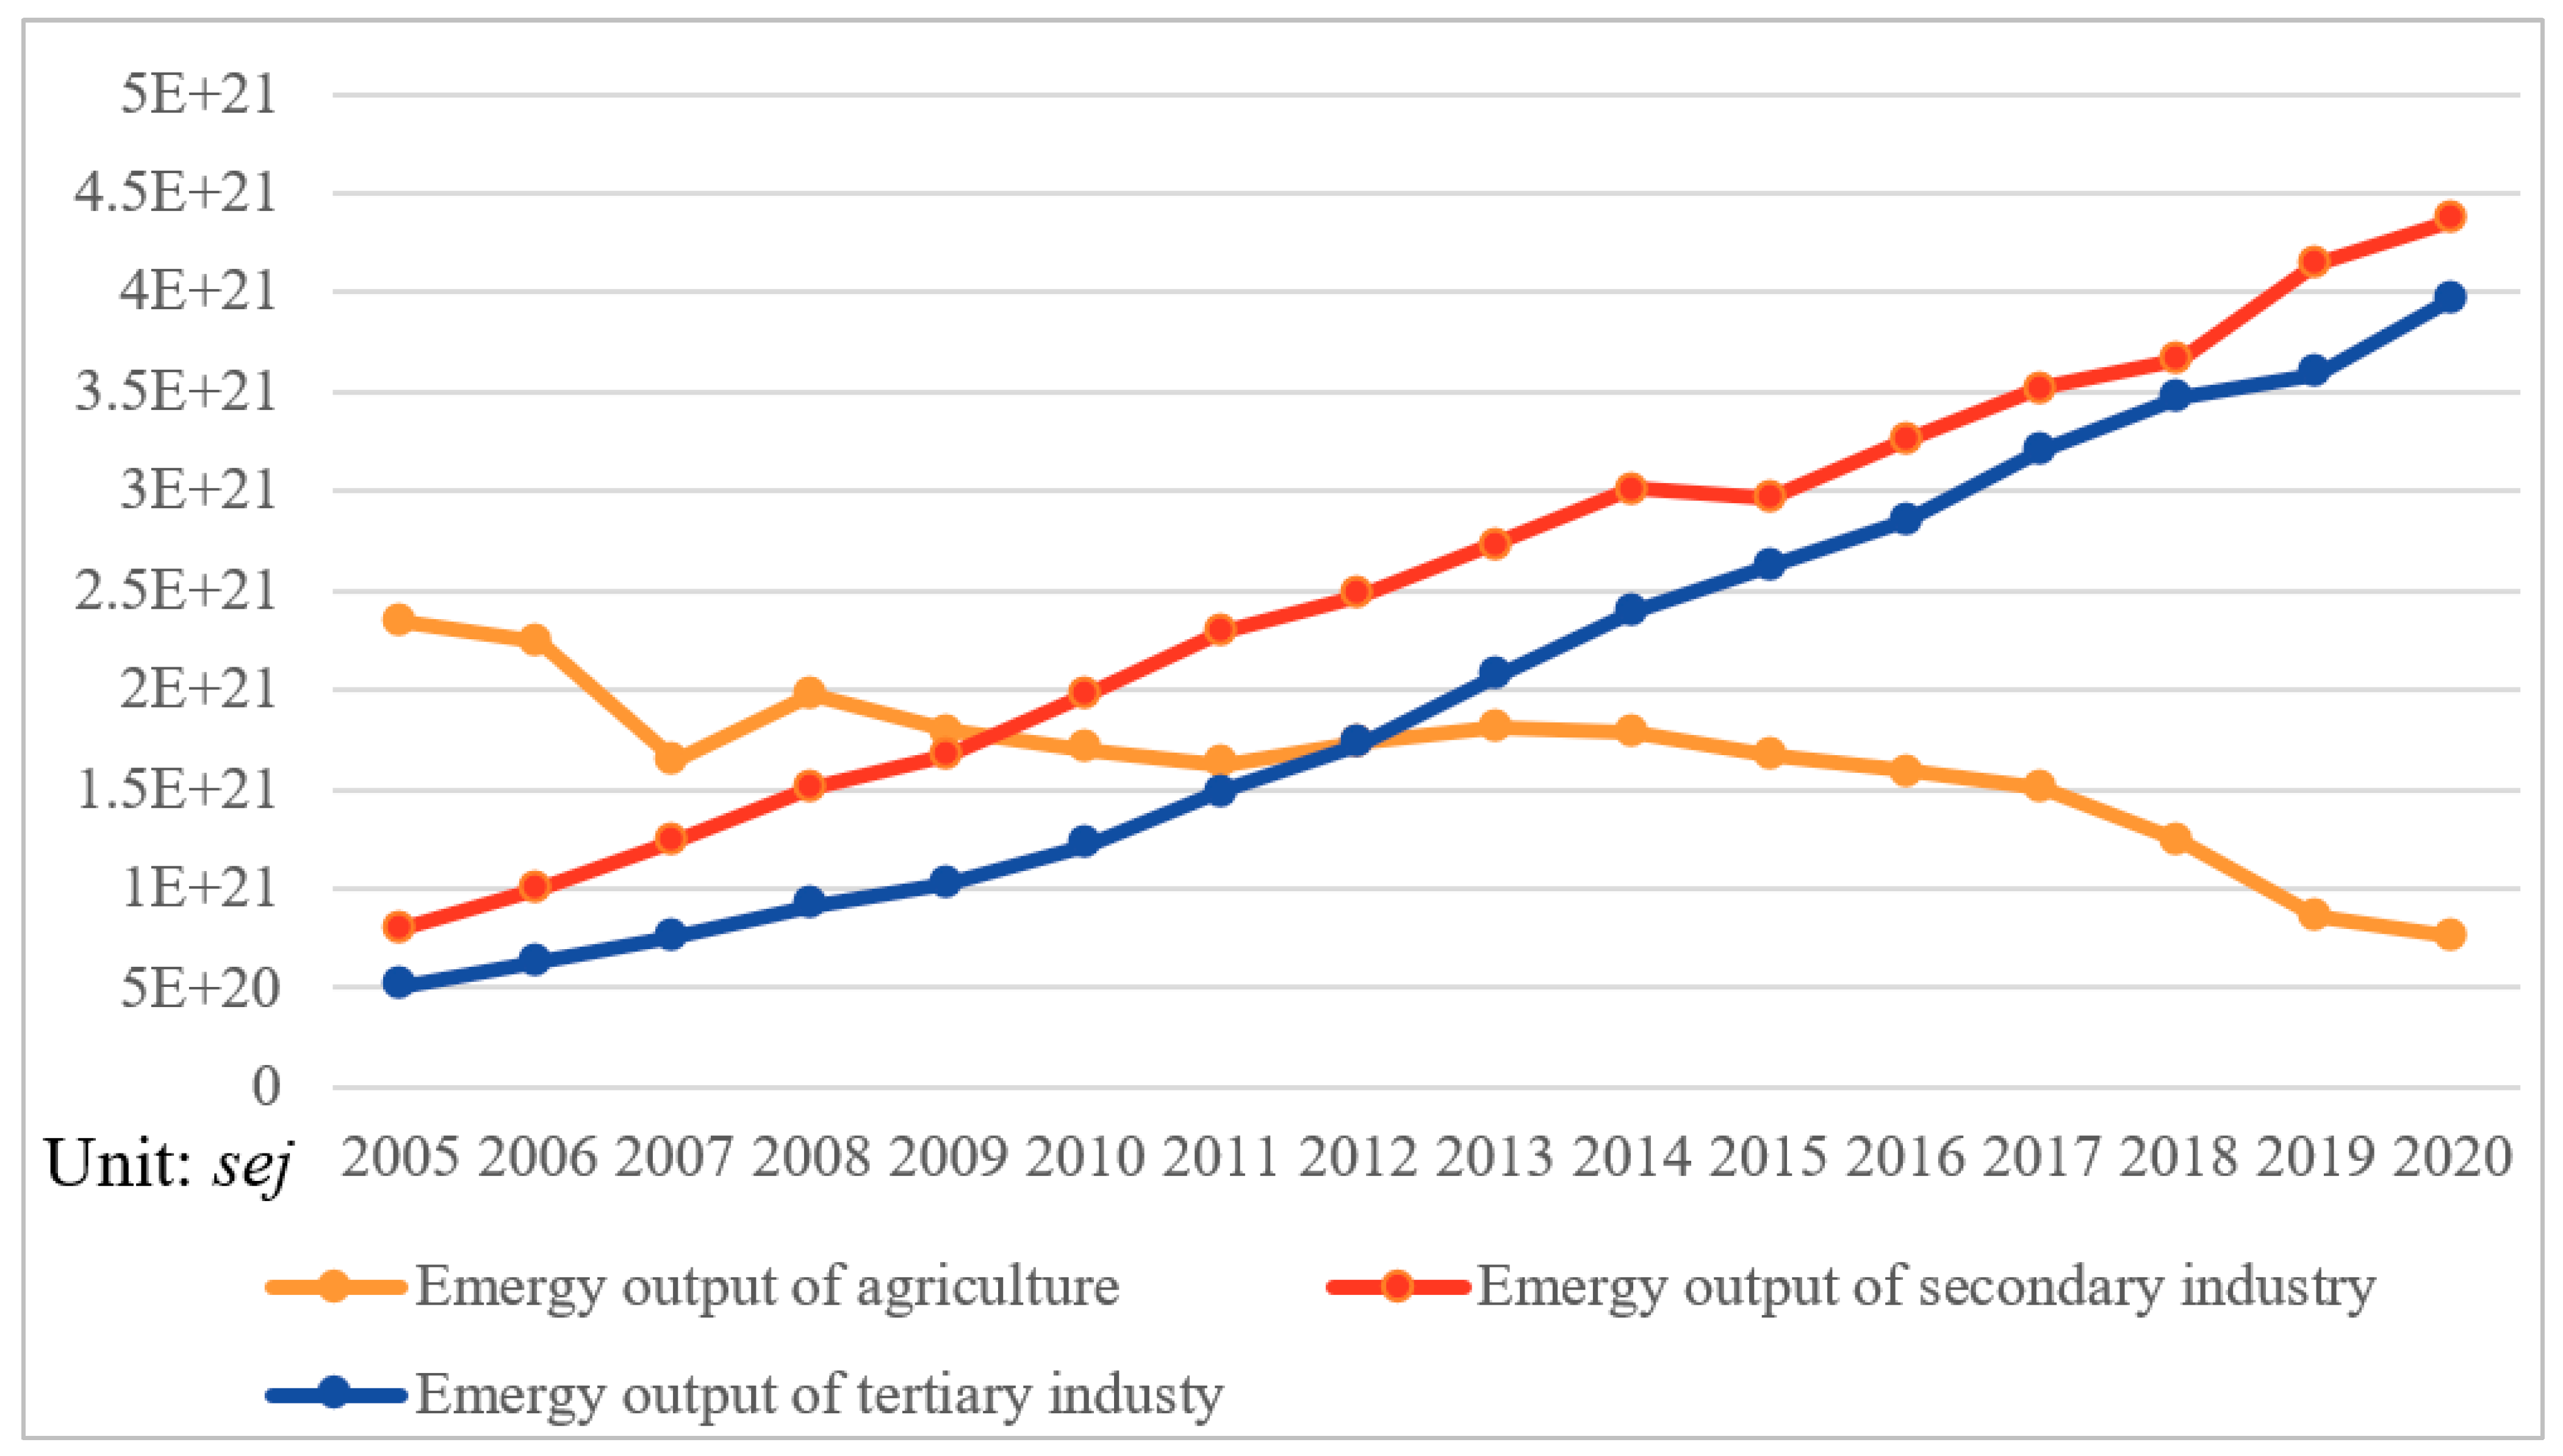
3.1.3. Analysis of Output Structures

(1)
The output structures
During the past 16 years, the agricultural emergy output of Liyang’s natural–social–economic system showed a decreasing change, while the output of the industries increased year by year. According to the output differentiation of agriculture and industries, the output structure can be divided into three stages: 2005–2009, 2010–2012, and 2013–2020 (Figure 9).
From 2005 to 2009, the emergy value of agricultural output was the dominant output of Liyang’s natural–social–economic system. In 2005, the emergy output of agriculture in Liyang was 2.34E + 21 sej, which is 2.9 times that of the secondary industries and 4.6 times that of the tertiary industries, and it accounted for 64.1% of the total output. However, in 2010, the proportion of agricultural output emergy dropped to 34.8%, and the secondary industry output emergy ratio rose to 40.3%, surpassing agriculture and becoming the leading industry in Liyang. The service industry output still ranked third. This ranking did not change until 2012. From 2013 to 2020, the output emergy of secondary industry was still the largest in the system, accounting for 40.8–48.3%. However, as the emergy agricultural output continued to decline, the output of the tertiary industry exceeded it, rising from 31.3% in 2013 to 43.7% in 2020, while the proportion of agricultural output emergy in 2020 dropped to 7.56E +20 sej, accounting for only 8.3% of the output emergy.
(2)
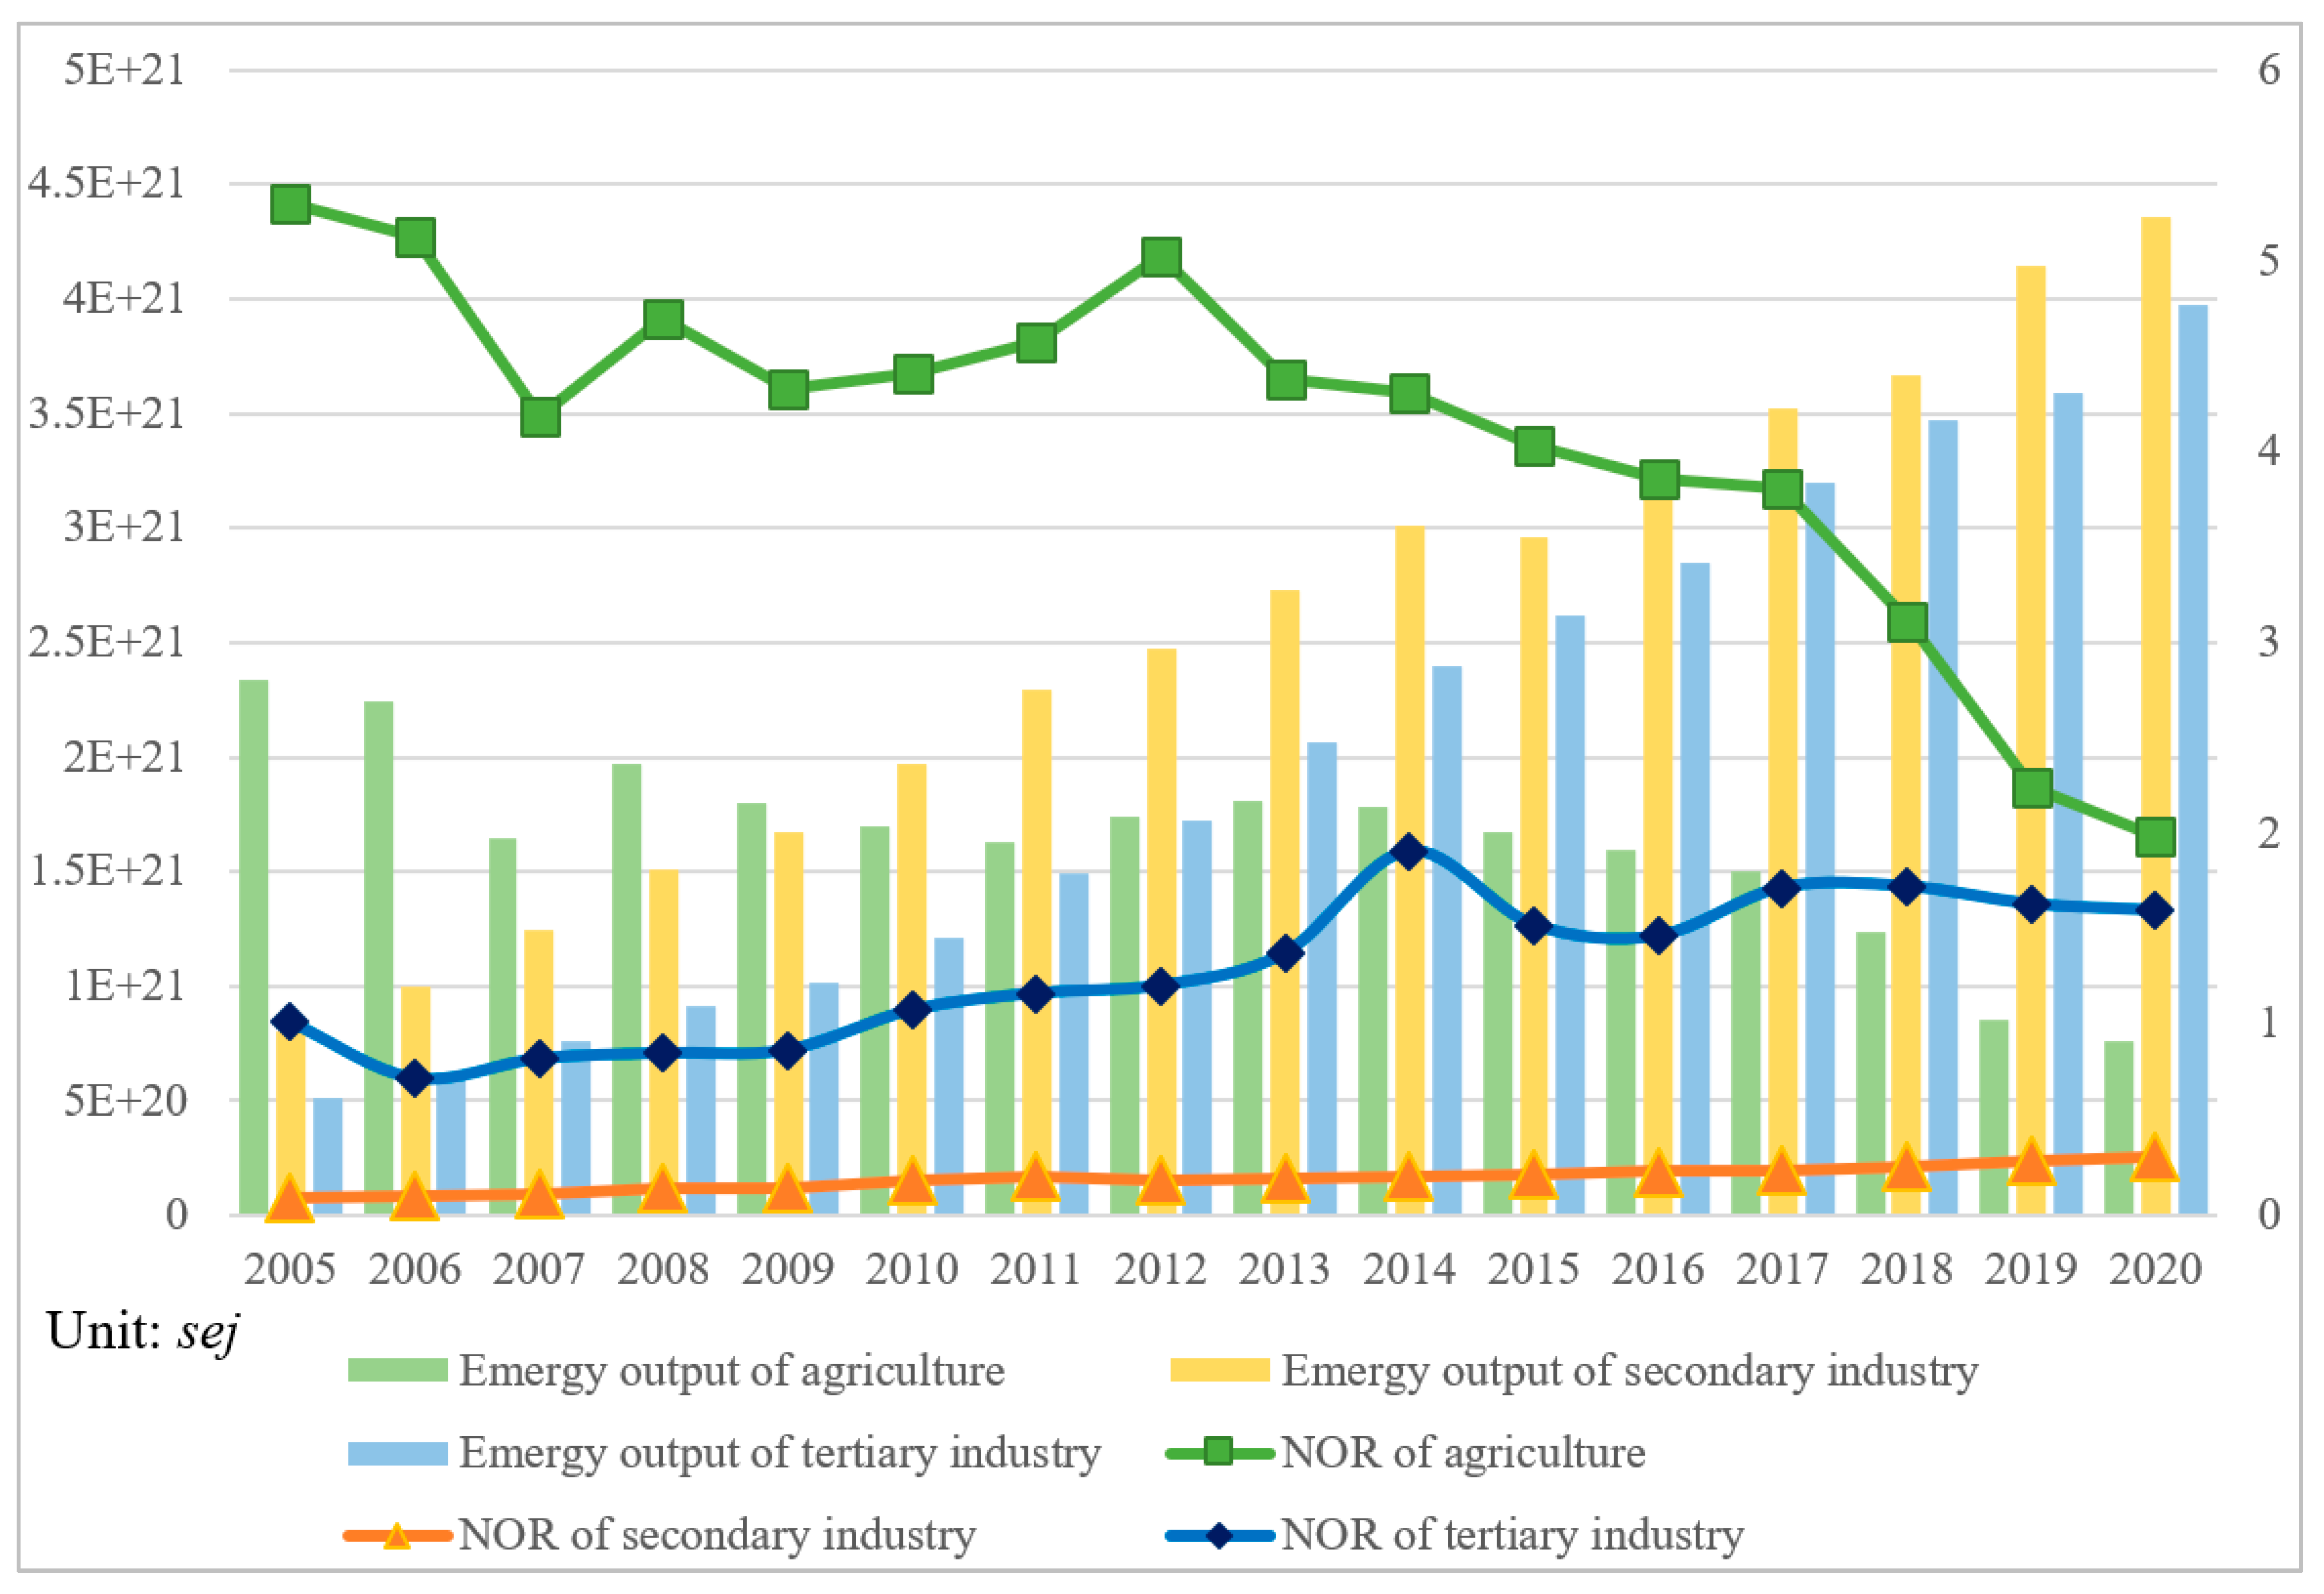
The production efficiency based on the output structure
Combined with the emergy input, we calculated each industry’s emergy net output rate (NOR). As shown in Figure 10, during 2005–2020, the NOR of agriculture was the highest, followed by the service industry. The second industry with the enormous emergy output has the lowest NOR.
The emergy NOR of agriculture was between 1.99 and 5.30, which means that, every unit of emergy input can produce 1.99–5.30 units of emergy, which had a relatively high emergy conversion efficiency. The emergy NOR of secondary industries was very low, only 0.09–0.31 units of emergy could be produced while per unit of emergy was input. The NOR of the tertiary industry was between 0.72 and 1.91, and in 2020, it was only 0.39 lower than the agricultural NOR.
In the past 16 years, the NOR of agriculture showed a downward trend, while the output efficiency of industry and tertiary industries increased significantly. These development trends were in line with the region’s industrial development law.

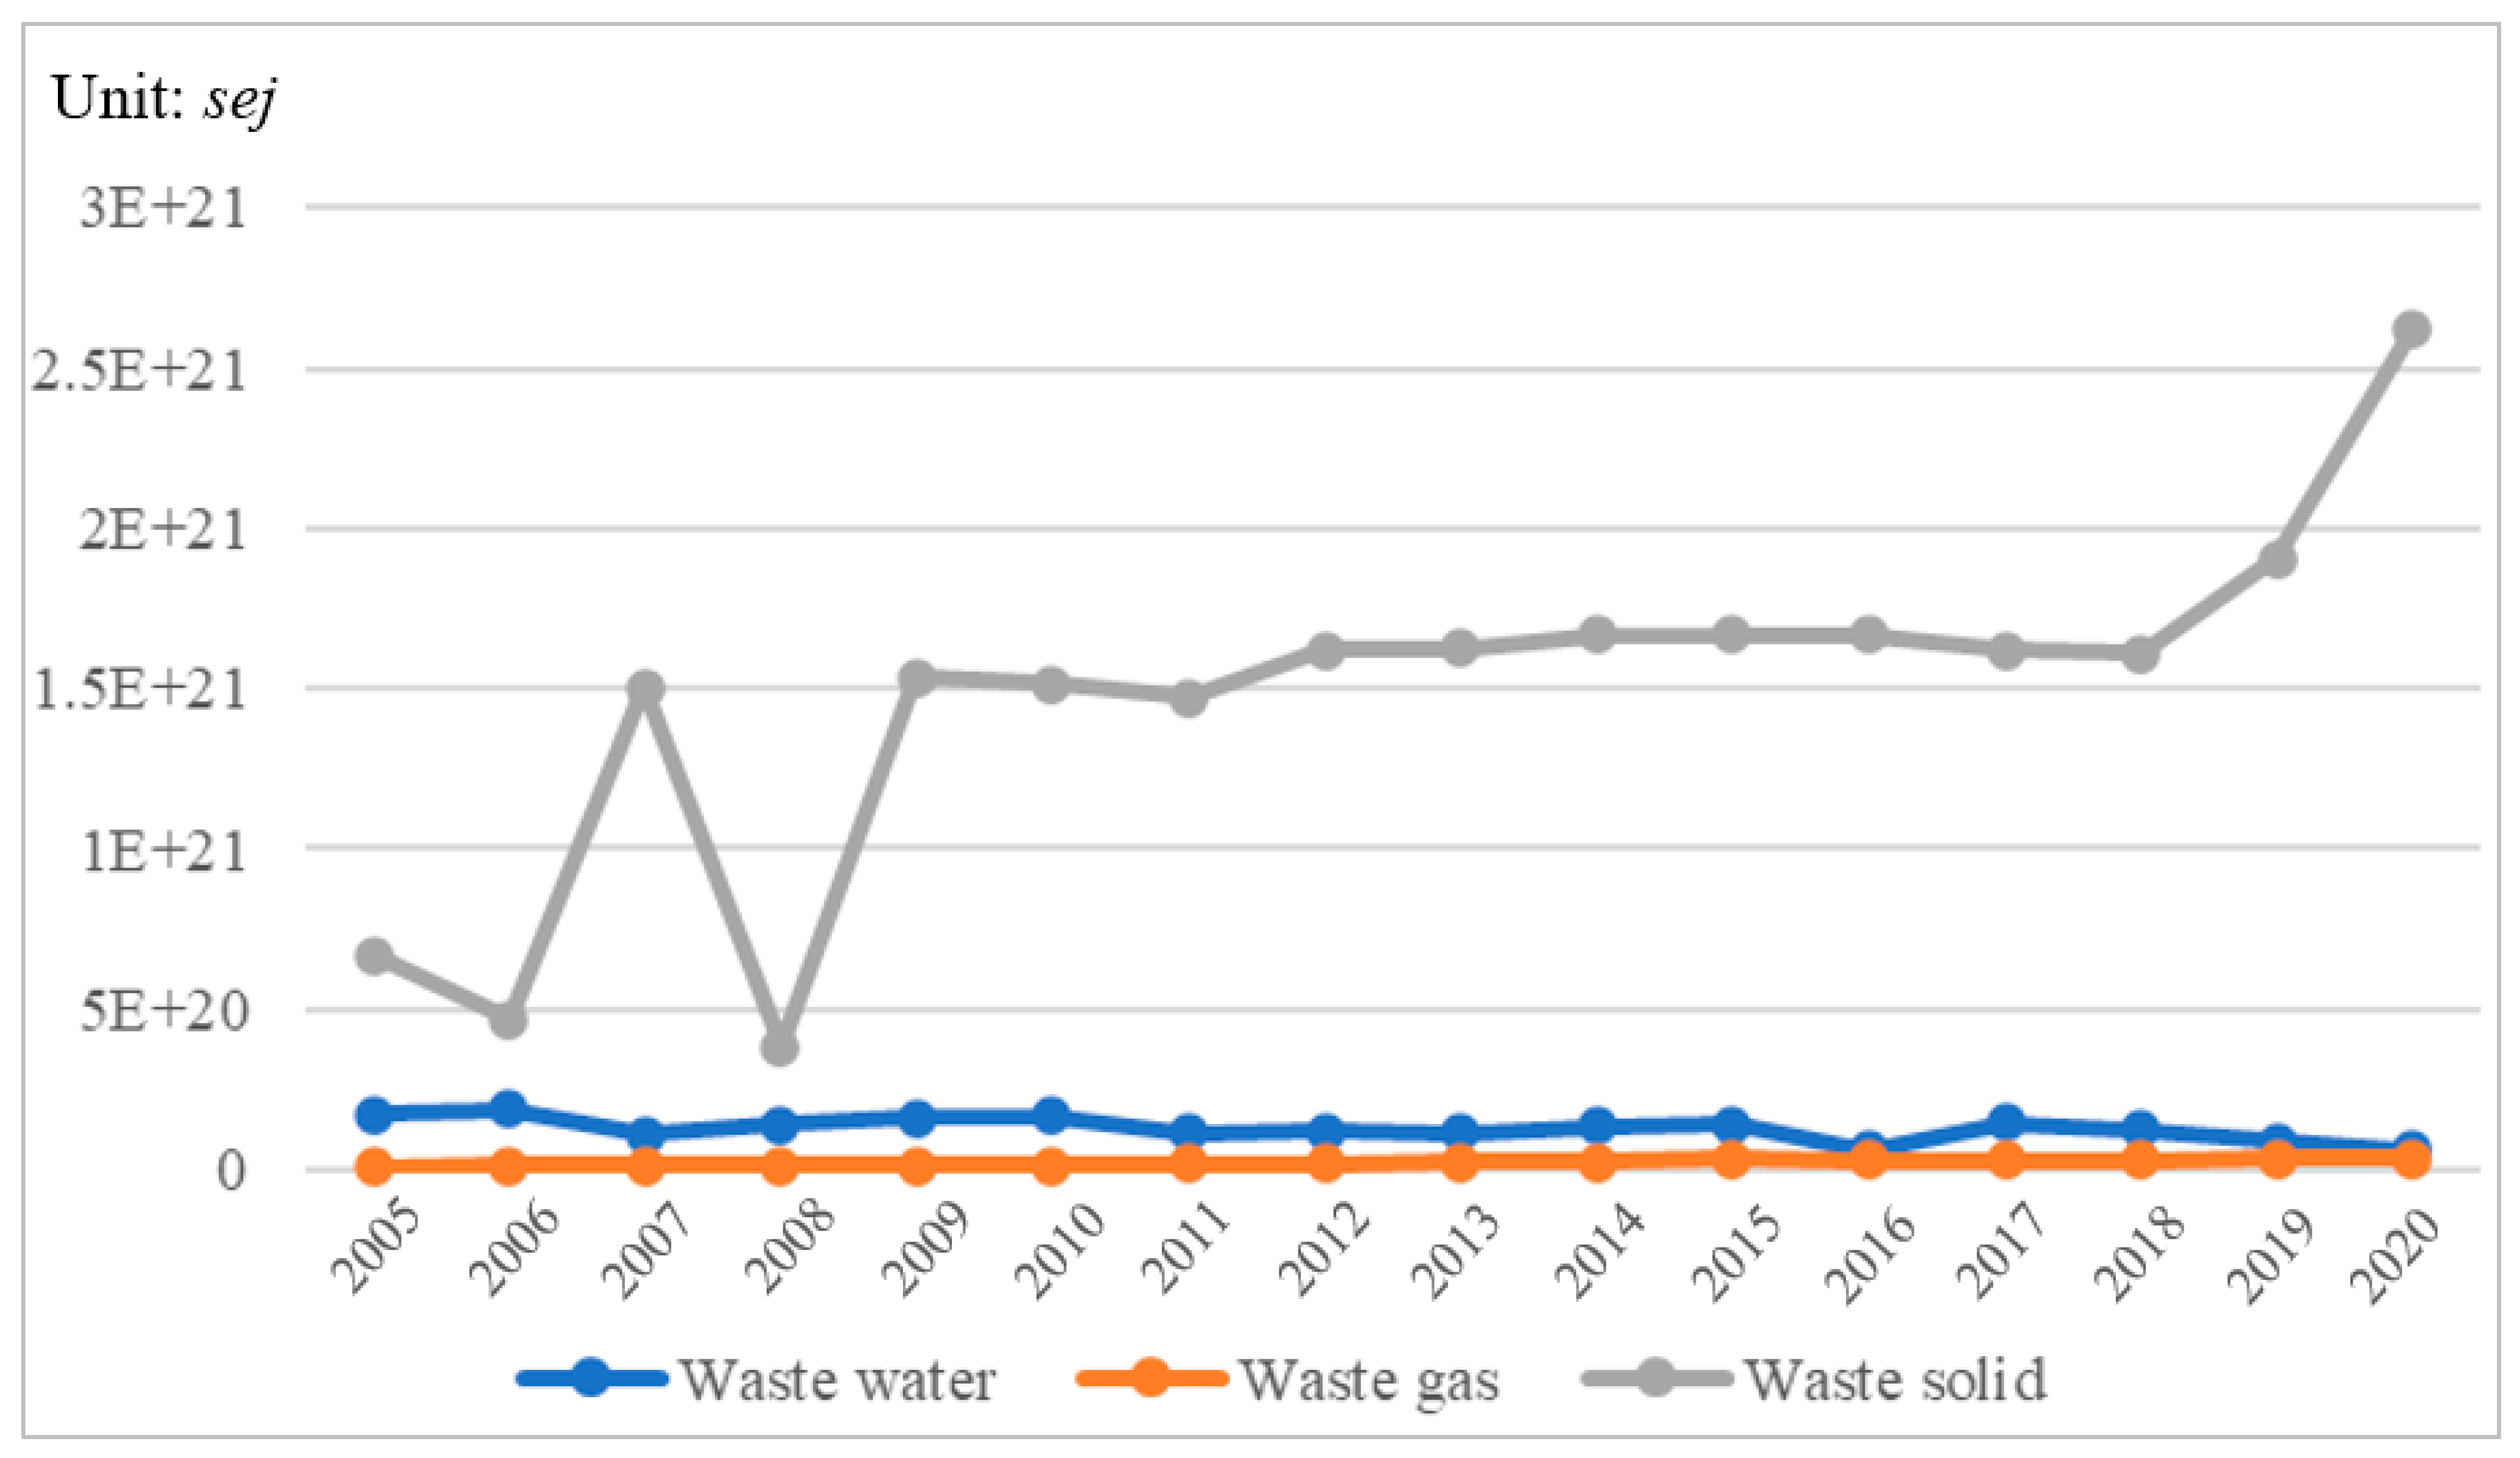
3.1.4. Analysis of Waste Emergy Structure

From 2005 to 2020, solid waste was the primary source of waste emergy in Liyang, accounting for 70.3% to 96.4% of the total (Figure 11). Then, it came from the wastewater, and the emergy of gas emission accounts for a minor proportion. This was related to the industrial development of Liyang. Since 2005, industries with large production capacities in Liyang have included cement, Portland cement clinker, steel, and pig iron, which contain a large amount of industrial solid waste such as smelting.

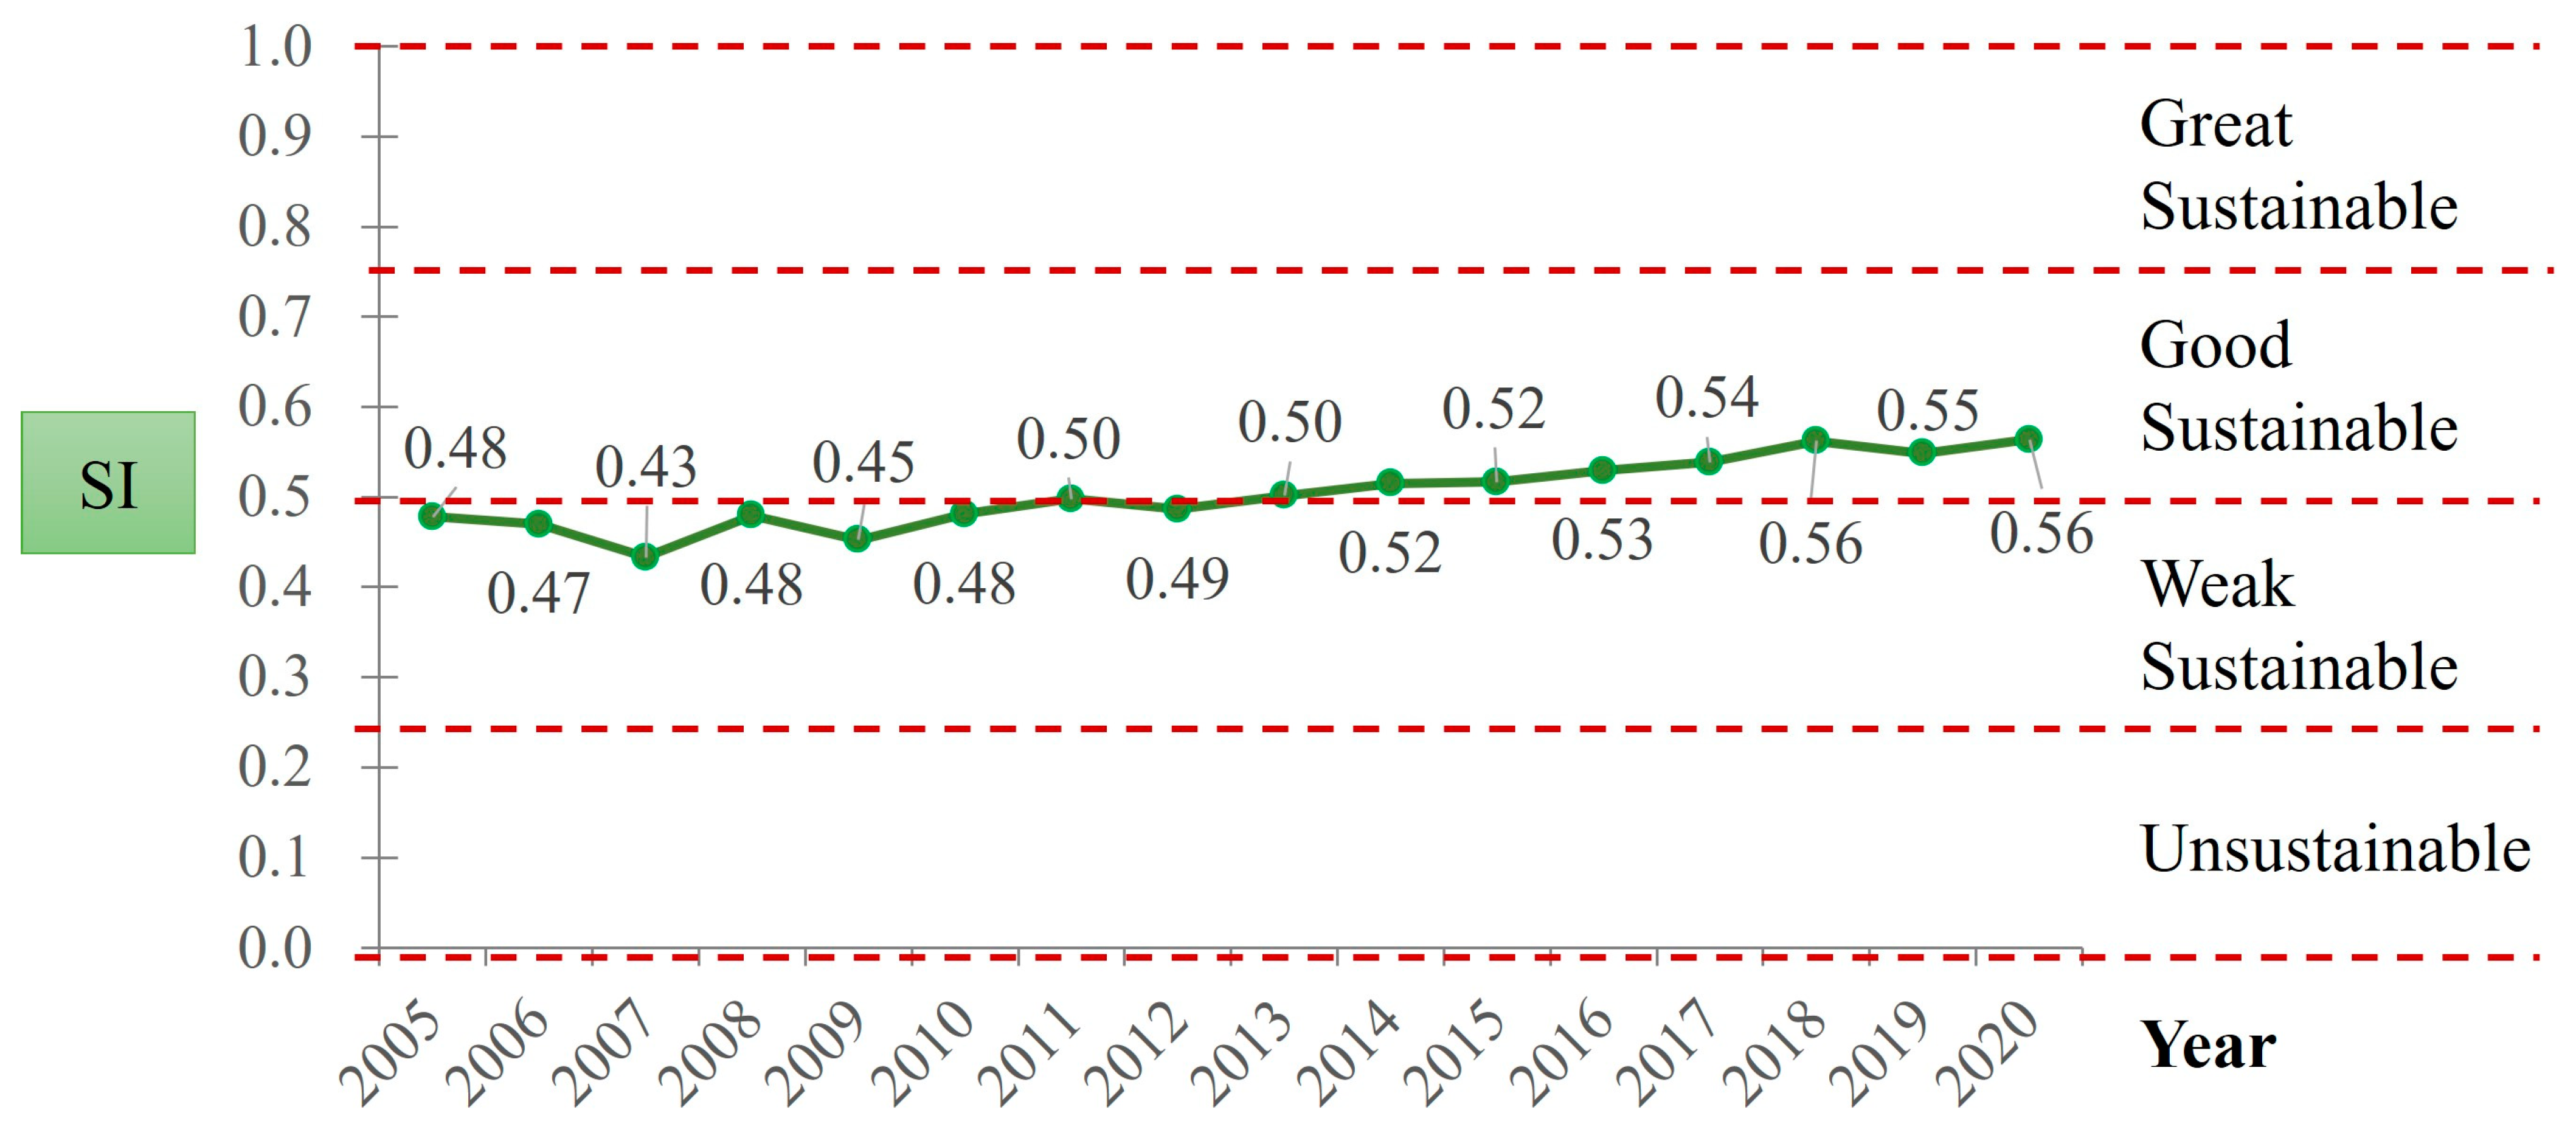
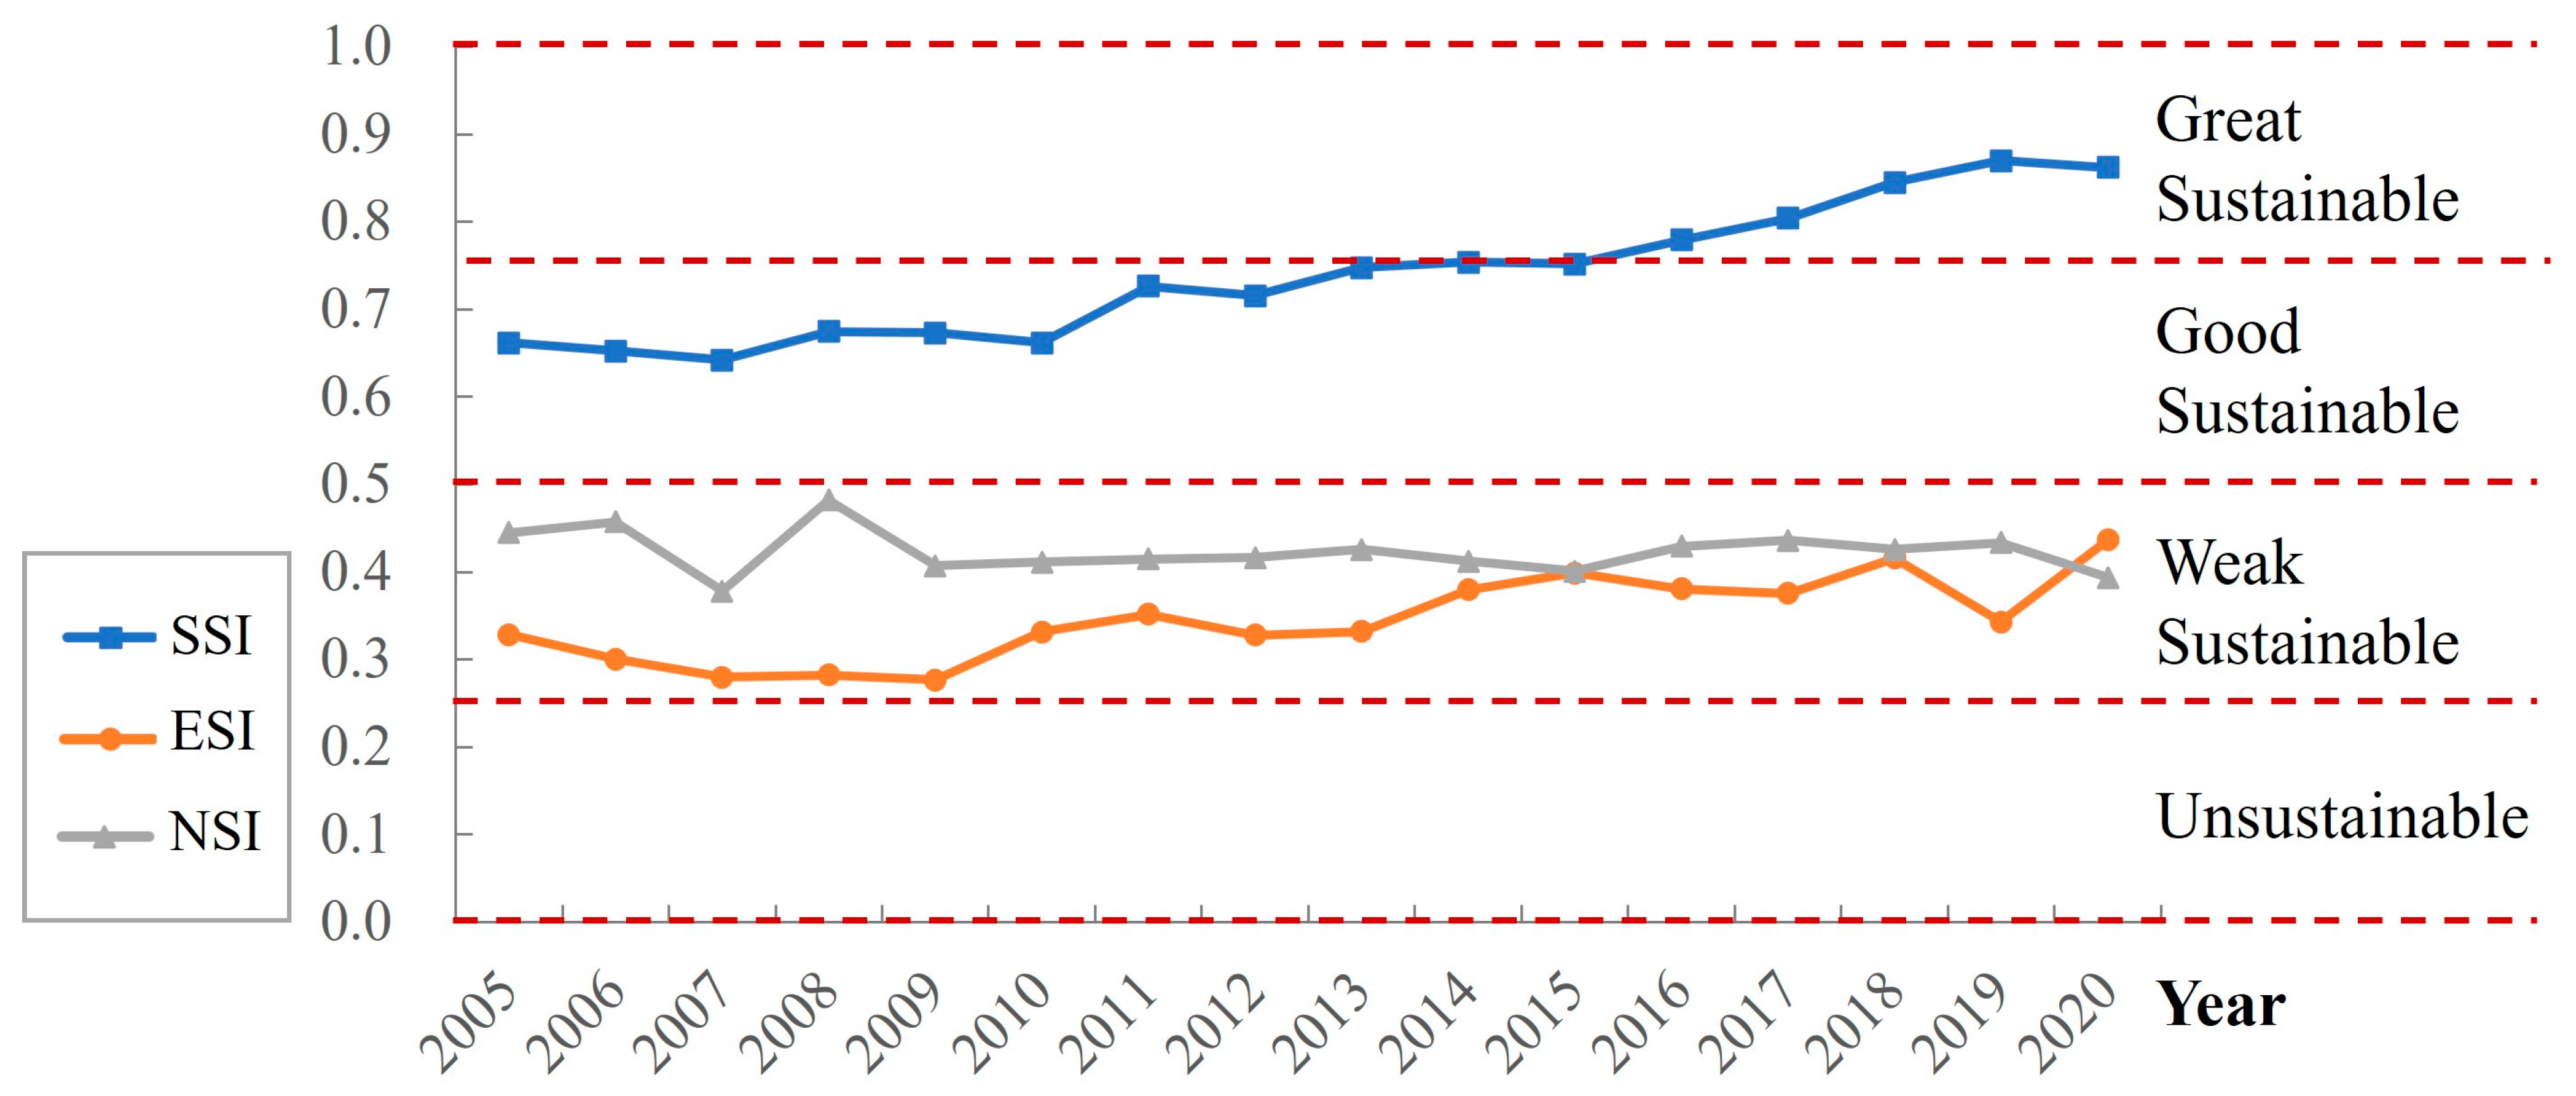
3.2. The Sustainable Assessment of Liyang Natural–Social–Economic System Based on EWM

Based on EWM, we derived the weight of each indicator. According to these weights, a comprehensive sustainability index (SI) and sub-indexes of the social sustainable index (SSI), the economic sustainable index (ESI), and the natural sustainable index (NSI) were calculated. As an overview of the complex Natural–Social–Economic system of Liyang (Figure 12), the SI fluctuated from 2005 to 2009, and since 2009, it has continued to rise significantly. And after 2013, the value of SI was above 0.5, and the condition of Liyang’s complex system changed from weak sustainable to good sustainable. Overall, the SI performed well in this period, and since 2013, the development of the complex natural–social–economic system of Liyang was sustainable.
Compared with other weight measurement methods, one of the advantages of the EWM is that it can identify the contribution of each subsystem (Figure 13). In subsystems, social sustainable indicators perform best. SSI has been growing from 0.65 in 2005 to 0.86 in 2020. Since 2013, the social sustainable condition in Liyang has passed “good sustainable” to “great sustainable”. The results of SSI show that Liyang has strong social sustainability. Compared with SSI, Liyang’s ESI and NSI are relatively inferior in this period. From 2005 to 2020, the sustainable development conditions of both the economic sub-system and natural sub-system were “weak sustainable”. Economic sustainability continued to decline from 2005 to 2009. After the new urbanization policy in 2009, ESI began to turn from decline to growth. Apart from the significant fluctuation in 2019, the ESI was an increasing trend. However, the NSI was relatively stable and showed a slight downward trend. It indicated that both the natural environment and the economic subsystem in the region might be weak sustainable, but the economic system has a comparatively better trend. It was necessary to enhance the efficiency of natural resources and energy utilization and reduce the emergy waste in the production process through improving pollution treatment technology and strengthening environmental protection and governance strategies.

4. Discussion

According to the above emergy analysis and sustainable development evaluation results, especially the weak sustainable condition of economic and natural subsystems, Liyang City still has potential in terms of input–output efficiency and green development. It is worth digging deeper and proposing improvement strategies. This part discusses the input structure and efficiency, green development, and the application of this methodology.

4.1. Input Structure, Input–Output Efficiency, and Sustainable Production and Consumption

From the analysis of the input structure and production efficiency in Liyang, we found that the production efficiency of agriculture, with the lowest output emergy and declining yearly, was the highest. Liyang has a good resource endowment and is very suitable for growing food and cash crops. In functional zoning and regional planning, Liyang is one of the central agricultural production areas in China. On the one hand, cultivated land protection and agricultural development are supervised by the state and the provincial government; on the other hand, agricultural production areas could grant various preferential policies during agricultural development. Therefore, in the follow-up development strategy, local governments in Liyang are unlikely to ignore agriculture completely. Instead, they will pay more attention to regional agricultural development in accordance with national agricultural policies. In future planning, rather than reducing the proportion of agriculture, it is more necessary to improve the level of agricultural modernization and increase the emergy output and the efficiency of agriculture.
However, the secondary industry with the highest output has a very low NOR, which is a very inefficient development arrangement. Promoting the NOR of the secondary industry is an imperative problem to be solved in the next stage of Liyang’s development. On the one hand, it is urgent to increase technology investment to upgrade industries with high energy consumption and waste resources and energy, reducing emergy consumption and improving industrial output efficiency; on the other hand, strengthen the government management and public supervision of industrial investment, unnecessary investment should be diminished, and the structure of investment could be adjusted to favor more efficient and green industries.
As the second-largest output category, the tertiary industry has higher NOR and better output efficiency. Especially in the ten years after 2010, the tertiary industry’s output emergy and efficiency performed very well. As a developed county in eastern China, Liyang has the triple advantages of good location high-tech labor and large investment, and is a fertile soil suitable for the development of high-efficiency tertiary industries. In future regional development, the tertiary industry should play the role of an important engine for sustainable development.

4.2. Environmental Impact and Regional Green Development

From the perspective of environmental impact and resource and environmental carrying capacity, the natural contribution rate (NCR) and environmental carrying rate (ECR) of Liyang’s natural–social–economic system were both low. In contrast, the waste rate (WR) was relatively high, making natural sustainability a shortcoming for regional sustainable development.
In the follow-up development in Liyang, the NCR could be improved through the efficient utilization of resources and energy, and green production technology in the production process. Strategies to increase ECR include promoting the replacement of chemical fertilizers with organic fertilizers and improving seed production technology to serve the modernization of agriculture and the seed industry. In these ways, the proportion of renewable emergy is increased, and thus the environmental carrying rate could be increased. The policy implications for reducing the waste rate include first, strengthening the regulation and rectification of industries with high energy consumption, and wasting resources and energy, strictly controlling the waste emissions of industries, especially solid waste emissions. Secondly, through the introduction of new technologies and technological upgrading, strengthen the utilization of solid waste emissions, such as reshaping solid waste from smelting to produce new stone products. Thirdly, Liyang is an area with relatively large surface runoff and many lakes and rivers, which has a good environment. To protect its ecological system, the government could increase public awareness, and adopt a dual governance approach of both top-down government regulation and bottom-up public supervision, thus promoting the efficiency of wastewater, gas, and solid waste governance.

4.3. Comparisons and Potential Applications of the Evaluation System and Methodology

The feasibility and generalizability of evaluation systems and methods determine whether they have scientific and practical value. Therefore, we compared the methods and results of sustainable development research in other regions. Since there are not many relevant research results in Liyang, this paper compares the results of regions in similar geographical areas or other county-level cities, such as the Taihu Lake city cluster [50], Shenzhen [47], and Xiamen City [52], and researchers who adopt methods of EAM, UM, and EF, etc., are also taken into comparison. However, it is found that for the measurement of sustainable development, even the results of emergency accounting are very different. Several possible problems are summarized: (1) Some emergy items are classified into differentiated flows, such as by Zhao et al., who included electricity, diesel, liquefied petroleum gas, and petroleum as emergy consumption [53]. However, Liu and Dong classified them into non-renewable input [51]. which would cause an obvious difference in the results. (2) The UEVs are differentiated in research; for example, the UEV of vegetables is 7.37 × 10⁴ (sej/J) in the Xiamen study but 2.70 × 10⁴ (sej/J) in other research [46,52], which might greatly affect the results. This study considers these issues and tries to make all the items and UEVs come from the same reference when accounting. (3) As mentioned above, indicators of ESI are difficult to compare in regions.
Based on the input–output concept, this study discards the import emergy element in traditional emergy research and introduces the input emergy element to construct the evaluation system. Adhering to the SDGs, sustainable production and consumption is an issue that each region will face in the development process. It is more about the sustainability of the development process than the development status. Further, as this is a newly established indicator system, there is a lack of comparative data from other areas, to fully analyze the generalizability of the indicators, evaluation systems, and methods, further studies need to be conducted in similar areas.

5. Conclusions

Coordinating social and economic development and natural environment protection is crucial for regional sustainable development. Based on the emergy theory, this paper calculated the input, output, and waste emergy in Liyang’s production and development process and evaluated its sustainability with the entropy weighting method. The main conclusions are as follows.
(1) During the period from 2005 to 2020, both the input and output emergy increased rapidly, and the growth rate of output emergy was higher than that of input emergy, which generally belonged to a relatively healthy stage of rapid development. However, during this process, the waste emergy increased too fast, and the impact on the environment has been neglected. (2) Among the emergy inputs, non-renewable resources accounted for 76–86%, and the contribution of natural resource emergy was less than 20%. Most emergy inputs were to the secondary industry, which was followed by the tertiary industry, and the least was input to agriculture. For the input factors of production, the emergy consumption of energy such as raw coal and electric inputs was the most. (3) Among the emergy output, agricultural emergy showed a downward trend, lagging behind the secondary industry and the tertiary industry in 2010 and 2013, respectively. By 2020, the output of the secondary and tertiary industries became the primary output industry in Liyang. However, the NOR of the secondary industry was very low, while the NOR of the tertiary industry was relatively high and showed an upward trend. (4) The emission of solid waste accounted for the majority of waste emergy. (5) Overall, Liyang was in a state of sustainable development after 2013, with great social sustainability, but the economic sustainability and the natural sustainability index are low, which might cause unsustainable risks in the future.
This paper tries to apply the emergy theory by integrating the input–output concept and proposes a method to quantify the sustainability of the complex natural–social–economic system. However, there are still many deficiencies and limitations. For example, even though we could account for the total natural resource emergy in the region, we could not measure how much emergy is actually used in the production process, so the accuracy of the natural input emergy needs to be improved. Due to the limited data on energy sources, we cannot distinguish whether the energy, such as raw coal, coke, and electricity, was produced within the system or purchased from outside the system. As a result, the self-supportability of the system has yet to be measured, which is also a critical dimension of sustainability. Regarding the study area, Liyang is a relatively small site, and it is better to join multiple areas for comparative study. We will try to improve these limitations in future research. This article hopes to provide implications for formulating regional land use, industrial planning, and sustainable development policies.

Author Contributions

Conceptualization, Y.G. and L.T.; methodology, Y.G. and L.T.; software, Y.G., A.H. and H.Z.; validation, J.Y., Y.P., Y.W. and B.G.; formal analysis, Y.G., A.H. and J.Y.; investigation, Y.P., Y.W. and B.G.; resources, Y.G., L.T. and A.H.; data curation, Y.G., A.H. and H.Z.; writing—original draft preparation, Y.G., A.H., H.Z., J.Y., Y.P., Y.W. and B.G.; writing—review and editing, Y.G. and L.T.; visualization, Y.G. and H.Z.; supervision, Y.G. and L.T.; project administration, L.T. and Y.G.; funding acquisition, L.T., Y.G. and A.H. All authors have read and agreed to the published version of the manuscript.

Funding

This research was funded by the Fundamental Research Funds for the Central Universities, grant number BLX202112, the National Key Research and Development Program of China, grant number 2018YFD1100105, the Beijing Outstanding Young Scientist Program, grant number JJWZYJH01201910003010, the National Natural Science Foundation of China, grant number 42201272, and Beijing High-precision Discipline Project, Discipline of Ecological Environment of Urban and Rural Human Settlements.

Institutional Review Board Statement

Not applicable for studies not involving humans or animals.

Informed Consent Statement

Not applicable for studies not involving humans.

Data Availability Statement

No new data were created or analyzed in this study. Data sharing does not apply to this article.

Conflicts of Interest

The authors declare no conflict of interest.

References

  1. Colglazier, W. Sustainable development agenda: 2030. Science 2015, 349, 1048–1050. [Google Scholar] [CrossRef] [PubMed]
  2. Yang, Q.; Liu, G.; Giannetti, B.F.; Agostinho, F.; Almeida, C.M.; Casazza, M. Emergy-based ecosystem services valuation and classification management applied to China’s grasslands. Ecosyst. Serv. 2020, 42, 101073. [Google Scholar] [CrossRef]
  3. Liu, Z.J.; Li, B.; Chen, M.Y.; Li, T. Evaluation on sustainability of water resource in karst area based on the emergy ecological footprint model and analysis of its driving factors: A case study of Guiyang city, China. Environ. Sci. Pollut. Res. 2021, 28, 49232–49243. [Google Scholar] [CrossRef]
  4. Liu, L.; Di, B.F.; Zhang, M.Y. The tradeoff between ecological protection and economic growth in China’s county development: Evidence from the soil and water conservation projects during 2011–2015. Resour. Conserv. Recycl. 2020, 156, 104745. [Google Scholar] [CrossRef]
  5. Liu, Y.; Qiao, J.J.; Xiao, J.; Han, D.; Pan, T. Evaluation of the Effectiveness of Rural Revitalization and an Improvement Path: A Typical Old Revolutionary Cultural Area as an Example. Int. J. Environ. Res. Public Health 2022, 19, 13494. [Google Scholar] [CrossRef]
  6. Xu, Y.N.; Wang, T.; Liu, W.J.; Zhang, R.F.; Hu, Y.M.; Gao, W.S.; Chen, Y.Q. Rural system sustainability evaluation based on emergy analysis: An empirical study of 321 villages in China. J. Clean. Prod. 2023, 389, 136088. [Google Scholar] [CrossRef]
  7. Wang, Z.H.; Yang, L.; Yin, J.; Yin, J.H.; Zhang, B. Assessment and prediction of environmental sustainability in China based on a modified ecological footprint model. Resour. Conserv. Recycl. 2018, 132, 301–313. [Google Scholar] [CrossRef]
  8. Li, J.X.; Chen, Y.N.; Xu, C.C.; Li, Z. Evaluation and analysis of ecological security in arid areas of Central Asia based on the emergy ecological footprint (EEF) model. J. Clean. Prod. 2019, 235, 664–677. [Google Scholar] [CrossRef]
  9. Patterson, T.; Gulden, T.; Cousins, K.; Kraev, E. Integrating environmental, social and economic systems: A dynamic model of tourism in Dominica. Ecol. Model. 2004, 175, 121–136. [Google Scholar] [CrossRef]
  10. Yli-Pelkonen, V.; Niemelä, J. Linking ecological and social systems in cities: Urban planning in Finland as a case. Biodivers. Conserv. 2005, 14, 1947–1967. [Google Scholar] [CrossRef]
  11. Melgar-Melgar, R.E.; Hall, C.A. Why ecological economics needs to return to its roots: The biophysical foundation of socio-economic systems. Ecol. Econ. 2020, 169, 106567. [Google Scholar] [CrossRef]
  12. Barles, S. Society, energy and materials: The contribution of urban metabolism studies to sustainable urban development issues. J. Environ. Plan. Manag. 2010, 53, 439–455. [Google Scholar] [CrossRef]
  13. Wolfslehner, B.; Vacik, H. Evaluating sustainable forest management strategies with the Analytic Network Process in a Pressure-State-Response framework. J. Environ. Manag. 2008, 88, 1–10. [Google Scholar] [CrossRef] [PubMed]
  14. Nakajima, E.S.; Ortega, E. Carrying capacity using emergy and a new calculation of the ecological footprint. Ecol. Indic. 2016, 60, 1200–1207. [Google Scholar] [CrossRef]
  15. Chen, H.S. Evaluation and analysis of eco-security in environmentally sensitive areas using an emergy ecological footprint. Int. J. Environ. Res. Public Health 2017, 14, 136. [Google Scholar] [CrossRef] [Green Version]
  16. Hester, J., Jr. Systems Analysis for Social Policies: Urban Dynamics. Jay W. Forrester. MIT Press, Cambridge, Mass. 1969. xiv+ 290, pp., illus. $12.50. Science 2017, 168, 693–694. [Google Scholar] [CrossRef]
  17. Qian, L.Y.; Wang, F.F.; Cao, W.; Ding, S.; Cao, W.Z. Ecological health assessment and sustainability prediction in coastal area: A case study in Xiamen Bay, China. Ecol. Indic. 2023, 148, 110047. [Google Scholar] [CrossRef]
  18. Ostrom, E. A general framework for analyzing sustainability of social-ecological systems. Science 2009, 325, 419–422. [Google Scholar] [CrossRef]
  19. Odum, H.T. Systems Ecology: An Introduction; John Wiley and Sons: New York, NY, USA, 1983. [Google Scholar]
  20. Odum, H.T.; Brown, M.T. Carrying Capacity for Man and Nature in South Florida, Final Report to National Park Service; US Department of Interior and State of Florida, Division of State Planning: Gainesville, FL, USA, 1975.
  21. Lotka, A.J. Contribution to the energetics of evolution. Proc. Natl. Acad. Sci. USA 1922, 8, 147–151. [Google Scholar] [CrossRef]
  22. Ulgiati, S.; Brown, M.T.; Bastianoni, S.; Marchettini, N. Emergy-based indices and ratios to evaluate the sustainable use of resources. Ecol. Eng. 1995, 5, 519–531. [Google Scholar] [CrossRef]
  23. Brown, M.T.; Ulgiati, S. Energy quality, emergy, and transformity: HT Odum’s contributions to quantifying and understanding systems. Ecol. Model. 2004, 178, 201–213. [Google Scholar] [CrossRef]
  24. Chen, G.Q. Exergy consumption of the earth. Ecol. Model. 2005, 184, 363–380. [Google Scholar] [CrossRef]
  25. Jørgensen, S.E.; Nielsen, S.N.; Mejer, H. Emergy, environ, exergy and ecological modelling. Ecol. Model. 1995, 77, 99–109. [Google Scholar] [CrossRef]
  26. Liu, G.Y.; Yang, Z.F.; Chen, B.; Zhang, Y.; Zhang, L.X.; Zhao, Y.W.; Jiang, M.M. Emergy-based urban ecosystem health assessment: A case study of Baotou, China. Commun. Nonlinear Sci. Numer. Simul. 2009, 14, 972–981. [Google Scholar] [CrossRef]
  27. Zhang, L.X.; Chen, B.; Yang, Z.F.; Chen, G.Q.; Jiang, M.M.; Liu, G.Y. Comparison of typical mega cities in China using emergy synthesis. Commun. Nonlinear Sci. Numer. Simul. 2009, 14, 2827–2836. [Google Scholar] [CrossRef]
  28. Rugani, B.; Huijbregts, M.A.; Mutel, C.; Bastianoni, S.; Hellweg, S. Solar energy demand (SED) of commodity life cycles. Environ. Sci. Technol. 2011, 45, 5426–5433. [Google Scholar] [CrossRef]
  29. Zhang, J.X.; Ma, L. Urban ecological security dynamic analysis based on an innovative emergy ecological footprint method. Environ. Dev. Sustain. 2021, 23, 16163–16191. [Google Scholar] [CrossRef]
  30. Wang, Y.; Zhu, Y.; Yu, M. Measuring the implementation effects of rural revitalization in China’s Jiangsu Province: Under the analytical framework of “deconstruction, assessment and brainstorming”. Growth Chang. 2022, 53, 1146–1169. [Google Scholar] [CrossRef]
  31. Yao, X.C.; Chen, W.W.; Song, C.C.; Gao, S.Q. Sustainability and efficiency of water-land-energy-food nexus based on emergy-ecological footprint and data envelopment analysis: Case of an important agriculture and ecological region in Northeast China. J. Clean. Prod. 2022, 379, 134854. [Google Scholar] [CrossRef]
  32. Pan, X.F.; Guo, S.C. Dynamic decomposition and regional differences of urban emergy ecological footprint in the Yangtze River Delta. J. Environ. Manag. 2023, 326, 116698. [Google Scholar] [CrossRef]
  33. Du, Y.W.; Wang, Y.C.; Li, W.S. Emergy ecological footprint method considering uncertainty and its application in evaluating marine ranching resources and environmental carrying capacity. J. Clean. Prod. 2022, 336, 130363. [Google Scholar] [CrossRef]
  34. Liu, G.Y.; Yang, Z.F.; Chen, B.; Ulgiati, S.G. Emergy-based dynamic mechanisms of urban development, resource consumption and environmental impacts. Ecol. Model. 2014, 271, 90–102. [Google Scholar] [CrossRef]
  35. Fang, W.; An, H.Z.; Li, H.J.; Gao, X.Y.; Sun, X.Q.; Zhong, W.Q. Accessing on the sustainability of urban ecological-economic systems by means of a coupled emergy and system dynamics model: A case study of Beijing. Energy Policy 2017, 100, 326–337. [Google Scholar] [CrossRef]
  36. Hoekstra, A.Y.; Wiedmann, T.O. Humanity’s unsustainable environmental footprint. Science 2014, 344, 1114–1117. [Google Scholar] [CrossRef]
  37. Lu, H.F.; Ye, Z.; Zhao, X.F.; Peng, S.L. A new emergy index for urban sustainable development. Sheng Tai Xue Bao 2003, 23, 1363–1368. (In Chinese) [Google Scholar]
  38. Lei, K.; Wang, Z. Emergy synthesis and simulation for Macao. Energy 2008, 33, 613–625. [Google Scholar] [CrossRef]
  39. Sergio, U.; Mark, T.B. Monitoring patterns of sustainability in natural and man-made ecosystems. Quat. Int. 1998, 108, 23–36. [Google Scholar]
  40. Wang, C.; Liu, F.; Wang, Y. Emergy-based comparative analysis of an ecological economy in the Yangtze River Delta. Environ. Eng. Res. 2023, 28, 210325. [Google Scholar] [CrossRef]
  41. Xiao, X.; Wang, Q.; Guan, Q.; Shao, W.; Luo, H.; Shan, Y.; Mi, J. Assessing the sustainability of ecosystems over fourteen years of cultivation in Longnan City of China based on emergy analysis method. J. Environ. Manag. 2022, 307, 114513. [Google Scholar] [CrossRef] [PubMed]
  42. Lan, S.F.; Qin, P. Energy Value Analysis of Ecological Economic System; Chemical Industry Press: Beijing, China, 2002; Volume 407, pp. 35–36. (In Chinese) [Google Scholar]
  43. Brahmasrene, T.; Lee, J.W. Assessing the dynamic impact of tourism, industrialization, urbanization, and globalization on growth and environment in Southeast Asia. Int. J. Sustain. Dev. World Ecol. 2017, 24, 362–371. [Google Scholar] [CrossRef]
  44. Odum, H.T. Environmental Accounting: Emergy and Environmental Decision Making; John Wiley and Sons: New York, NY, USA, 1996. [Google Scholar]
  45. Xu, Y.; Huang, H.S.; Yuan, G. Analysis of Ecological Security Changes in Hilly Areas Based on Emergy Ecological Footprint: Case Study of Jiujiang City, Jiangxi Province. Sci. Technol. Eng. 2021, 21, 6081–6088. (In Chinese) [Google Scholar]
  46. Huang, H.; Shi, Y.; Ran, S.S.; Su, H.R.; Liu, J.E. Dynamic research on sustainable development of farmland-livestock production system based on emergy theory. J. Nat. Resour. Policy Res. 2020, 35, 869–883. (In Chinese) [Google Scholar] [CrossRef]
  47. Zhu, Y.L.; Li, M.J.; Hou, M.Z.; Long, Y.Z.; Wang, M.X. Analysis of Emergy Structure, Function and Efficiency of Agro-ecosystem in Hunan Province. Agric. Sci. Technol. 2013, 14, 186. (In Chinese) [Google Scholar]
  48. Zhao, Y.; Ma, J.; Li, X.F.; Yu, M. Optimization and Application of Emergy Ecological Footprint Model Based on Account System: Taking Liaoning Province as an Example. Ecol. Econ. 2022, 11, 161–166+208. (In Chinese) [Google Scholar]
  49. Yu, F.; Li, X.B.; Wang, H.; Zhang, L.J.; Xu, W.H.; Fu, R. Accounting of Gross Ecosystem Product based on emergy analysis and ecological land classification in China. Acta Ecol. Sin. 2016, 36, 1663–1675. [Google Scholar]
  50. Jia, X.L.; Zhou, Y.; Yan, J.L.; Wei, Y.G. Sustainable development of an ecological-economic system in the Taihu Lake city cluster based on emergy analysis. Acta Ecol. Sin. 2019, 39, 6487–6499. (In Chinese) [Google Scholar]
  51. Liu, H.G.; Dong, X.C. Emergy Structure, Efficiency and Driving Factors of Agricultural Input and Output in the Yangtze River Economic Belt. Chin. Agric. Sci. Bull. 2022, 38, 130–138. (In Chinese) [Google Scholar]
  52. Sun, X.R.; Shui, W.; Zheng, J.Y.; Tao, Y.; Li, H. Evaluation of metabolic sustainability in Xiamen based on emergy analysis. Acta Ecol. Sin. 2021, 41, 4342–4353. (In Chinese) [Google Scholar]
  53. Zhao, Z.Q.; Li, S.C.; Gao, Y. Emergy-based modification for ecological footprint accounting and application to open eco-economic system: A case study of Shenzhen City. Acta Ecol. Sin. 2008, 28, 2220–2231. (In Chinese) [Google Scholar]
Figure 1. The location of the study area.
Land 12 01362 g001
Figure 2. General emergy diagram of the natural–social–economic system (source: authors).
Land 12 01362 g002
Figure 3. Overview of emergy accounting of Liyang natural–social–economic system.
Land 12 01362 g003
Figure 4. The ratio of renewable and non-renewable emergy input of Liyang (2005–2020).
Land 12 01362 g004
Figure 5. The natural and social–economic emergy input of Liyang (2005–2020).
Land 12 01362 g005
Figure 6. The social–economic emergy input from 2005 to 2020 in Liyang.
Land 12 01362 g006
Figure 7. Emergy input structure based on the industrial structure in Liyang (2005–2020).
Land 12 01362 g007
Figure 8. Emergy input structure based on the perspective of production factors. ((a) post all the production factors. (b) shows the ratios of other production factors.)
Land 12 01362 g008
Figure 9. Emergy output structure in Liyang (2005–2020).
Land 12 01362 g009
Figure 10. The emergy NOR of industries in Liyang.
Land 12 01362 g010
Figure 11. The waste emergy in Liyang from 2005 to 2020.
Land 12 01362 g011
Figure 12. The comprehensive sustainability index (SI) in Liyang from 2005 to 2020.
Land 12 01362 g012
Figure 13. The sustainability indexes of sub-systems based on EWM in Liyang from 2005 to 2020.
Land 12 01362 g013
Table 1. Emergy items and emergy transformity.
ItemsUnitUEV (sej/unit)Refs.ItemsUnitUEV (sej/unit)Refs.
Renewable resources emergy (R)27Liquefied Petroleum GasJ111,000[45]
1SunlightJ1[44]28TourismCNY80,703,633,975[44]
2Wind, Kinetic EnergyJ62329Foreign CapitalCNY80,703,633,975
3Rain, ChemicalJ4700Output emergy (O)
4Rain, GeopotentialJ15,40030GDPCNY80,703,633,975[44]
5Earth CycleJ29,00031RiceJ35,900[42]
Non-renewable resources emergy (N)32WheatJ68,000
6Topsoil LossJ74,000[44]33CornJ27,000
7Organic Matter Lossg1,700,000,00034BeanJ690,000
Input renewable emergy (IR)35Tuber CropJ2700
8LaborJ483,000[46]36Oil CropJ690,000
9SeedsJ66,000[46]37CottonJ860,000
10Organic Fertilizerg3,870,000,00038SugarcaneJ84,000
Input non-renewable emergy (IN)39VegetableJ27,000
11Fixed InvestmentCNY80,703,633,975[44]40MelonJ27,000
12Total Agricultural Machinery PowerJ202,000[46]41TeaJ254,000
13Nitrogen Fertilizerg5,870,000,00042FruitJ53,000
14Phosphate Fertilizerg22,600,000,00043Chinese ChestnutJ690,000[47]
15Potash Fertilizerg2,210,000,00044Bamboo ShootJ27,000
16Compound Fertilizerg3,560,000,00045WoodJ44,000
17Pesticideg2,060,000,00046BambooJ44,000
18Agricultural Filmg483,000,00047PorkJ1,710,000[42]
19Electricity ConsumptionJ159,000[42]48MuttonJ2,000,000
20Water Consumptiong219,00049PoultryJ1,710,000
21Raw CoalJ66,900[45]50Silkworm CocoonJ2,570,000
22CokeJ39,800[48]51Aquatic ProductJ2,000,000
23Natural GasJ48,000Waste emergy (W)
24GasolineJ66,00052Waste WaterJ1,120,000[49]
25KeroseneJ66,00053Waste GasJ1,120,000
26DieselJ66,00054Solid WasteJ3,020,000
Notes: J is the energy unit joule, g is the weight unit gram, and CNY is the currency unit of China.
Table 2. The natural–social–economic sustainable development evaluation system.
TargetCriteriaIndicatorsDefinitionPositive/Negative
Sustainable Index (SI)Natural Sustainable Index (NSI)Natural contribution rate (NCR)(R + N)/(R + N + IR + IN)+
Environmental carrying rate (ECR)(N + IN)/(R + IR)
Waste rate (WR)W/O
Social Sustainable Index (SSI)Per capita emergy utilization (EU)(IR + IN)/P
Per capita emergy output (EO)O/P+
Per capita electricity emergy (EE)E/P+
Economic Sustainable Index (ESI)The net emergy output rate (NOR)O/(IR + IN)+
The emergy investment rate (EIR)(IR + IN)/(R + N)
Notes: P is the population in Liyang, and E refers to the annual electricity consumption.
Disclaimer/Publisher’s Note: The statements, opinions and data contained in all publications are solely those of the individual author(s) and contributor(s) and not of MDPI and/or the editor(s). MDPI and/or the editor(s) disclaim responsibility for any injury to people or property resulting from any ideas, methods, instructions or products referred to in the content.

