

A Comparative Study on Land Use/Land Cover Change and Topographic Gradient Effect between Mountains and Flatlands of Southwest China

1
Department of Geography and Land Engineering, Yuxi Normal University, Yuxi 653100, China
2
School of Geographic Sciences, Hunan Normal University, Changsha 410081, China
3
Key Laboratory of Karst Ecosystem and Treatment of Rocky Desertification, Ministry of Natural Resources, Institute of Karst Geology, CAGS, Guilin 541004, China
4
Karst Ecosystem, Observation and Research Station, Pingguo 541004, China
*
Author to whom correspondence should be addressed.
Land 2023, 12(6), 1242; https://doi.org/10.3390/land12061242
Submission received: 24 May 2023
/
Revised: 14 June 2023
/
Accepted: 15 June 2023
/
Published: 17 June 2023
(This article belongs to the Topic Karst Environment and Global Change)
Abstract
:Topography plays an important role in restricting the formation of and change in land use/land cover (LULC) patterns. To compare the LULC change and topographic gradient effects between mountains and flatlands, the geo-informatic atlas, terrain position index, distribution index and diversity index were used to analyze the LULC patterns in Yuxi from 2000 to 2020. The results were as follows: (1) the temporal–spatial variation in LULC was obviously different. From 2000 to 2020, land use change in the flatlands was more severe than that in the mountains. The transfer amount of forestland in the mountains was the largest, with the transfer-out and transfer-in accounting for 48.53% and 31.05%. However, in the flatlands, the biggest changes were found in the transfer-out of cultivated land and the transfer-in of build-up land, which were 46.91% and 38.20%, respectively. The LULC types in the mountains changed dramatically from 2000 to 2010, while those in the flatlands changed dramatically from 2010 to 2020. (2) There were obvious differences in the topographic gradient effects. The dominant distributions of land use types in the low-terrain area were the same, but the dominance of build-up land in the flatlands and that of wetland in the mountains were the largest. In the mountains, the dominant distribution of grassland was in the medium-terrain position, while that of forestland was in the high position, and the opposite was found in the flatlands. In addition, the variation trend of the diversity index in the mountains was relatively simple, but the variation range was large, ranging from 0 to 1.677, and high diversity was mainly found in the medium- and high-terrain positions. However, the variation trend in the flatlands was complex, but only ranged from 0.918 to 1.994, and high diversity was found in the low-terrain positions. The differences in the LULC change and terrain gradient effects between the mountains and flatlands were mainly caused by natural, socio-economic and policy factors, which can provide a certain reference for differentiated land use policies for regional coordinated and sustainable development.
1. Introduction
In the long history of research on human–land relationships, land use/land cover (LULC) change has always played the role of core entry point and basic carrier [1,2]. As an important carrier of socio-economic development and human activities, LULC reflects the long-term influence of natural and human factors on land [3], and directly or indirectly reflects the coupling state and change trend of human–land relationships through the representation of temporal and spatial changes in natural and human factors [4,5], representing a core issue of major international research projects. Therefore, strengthening the research on LULC change not only contributes to a deep understanding of human–land relationships, but also constitutes the premise and basis for realizing human–land coordination and social sustainable development.
Topography, as the basic factor of land use dynamic changes, deeply participates in the evolution of LULC temporal–spatial patterns, and directly or indirectly affects the land use layout by restricting human activities [6]. The difficulty and intensity of changing human activities determine the regional evolution of LULC [7,8]. Therefore, under different terrain conditions, the effects of natural and socio-economic conditions are very different. The complex topography and landform in mountainous areas make the geographical environment highly heterogeneous in space [9,10], and the land use change presents obvious topographic gradient differentiation, which has a profound impact on economic construction and agricultural production activities. Therefore, to analyze the relationship between land use change and topographic gradients in mountainous areas and explore the law of land use change under the action of topographic factors [11,12] is conducive to realizing the sustainable use of land resources and maintaining regional food and ecological security [13]. At present, the correlation between topographic gradient change characteristics and land use based on DEM has become an important perspective of LULC research. Therefore, most existing studies mainly extract the elevation, slope, topographic relief and other factors through DEM, and analyze the spatial distribution and change characteristics of land use on topographic gradients by means of the terrain position index and distribution index [14,15]. A geo-informatic atlas can integrate the spatial difference in geographical phenomena and the temporal variation in geographical processes by means of geo-information and geographic computing [16], and can reproduce the process of human–land relationships from multiple angles, layers and scales. Therefore, it has become a trend to analyze land use change by combining topographic factors and geo-infographic maps [17]. In summary, such studies mainly focus on exploring the topographic gradient effect from the perspective of entire regions [18,19], while there are relatively few studies from the perspective of different topographic and geomorphic regions, especially the sub-regions of “mountains” and “flatlands” [20], which are unique to the mountainous area of southwest China, and have not attracted enough attention to form a meaningful research system.
Yuxi City is located in the southwest mountainous area of China. The rapid development of the society and economy has brought drastic changes in land use. However, land use is restricted by topography, showing obvious spatial differences, with typical mountain–flatland features. [21]. The flatlands have a flat terrain, suitable for cultivation and construction, while the mountains have complex natural conditions, which make them difficult to use [22]; however, there is a co-evolutionary relationship in the process of land use evolution [23,24] because they are in the same region. Therefore, as two unique geographical spaces in the southwest mountainous area of China, how the mountains and flatlands play their respective roles in regional sustainable development according to their characteristics of land use evolution has become an important research topic [25]. The purpose of this study is to explore the differences in the temporal–spatial evolution of LULC and the effects of different topographic gradients between mountains and flatlands. To achieve this purpose, land use transfer chord diagrams and change characteristic maps are used to analyze land use characteristics, and the topographic position index, distribution index and diversity index are used to analyze the terrain gradient effects. This study is helpful in understanding the temporal–spatial evolution differences in LULC in different geographic spaces in the same region, and provides a reference for the formulation of differentiated territorial spatial planning in the southwest mountainous area of China.
2. Materials and Methods
2.1. Study Area
Yuxi City is located in the central part of Yunnan Province, in the low latitudes of the Yunnan Plateau, between 23°19′~24°53′ north latitude and 101°16′~103°09′ east longitude (Figure 1). It borders the provincial capital Kunming in the north, Honghe Prefecture in the southeast, Pu’er City in the southwest and Chuxiong Prefecture in the northwest. The terrain is high in the northwest and low in the southeast, with a staggered distribution of mountains, canyons, plateaus and basins. The western part is mainly a deep-cut alpine valley, and the middle-eastern part belongs to the central Yunnan Mountains. The terrain in most areas is undulating, and there are many intermountain basins of different sizes scattered among the mountains. The eastern region is mainly characterized by plateau lacustrine, including Fuxian Lake, Xingyun Lake and Qilu Lake. The Chengjiang, Jiangchuan and Tonghai lacustrine basins are formed around three lakes, with a flat and open terrain [26]. Affected by altitude, the climate is three-dimensional and diverse: winters are not severely cold, nor are summers scorching hot; rather there are four spring-like seasons with distinct dry and wet seasons. The region experiences a subtropical plateau monsoon climate, where the annual average temperature is 15.4–24.2 °C, and the average annual precipitation is 787.8–1000 mm, mostly concentrated in June–October, with heavy rainfall mainly in June–August. Due to the complex terrain and large height difference, the mountains receive more rainfall than the flatlands, the temperature is lower and the temperature difference between day and night varies significantly throughout the day and year from the top of the mountains to the valley.
2.2. Data Source and Processing
To analyze the temporal–spatial evolution of land use and the characteristics of topographic gradient effects, the following steps were adopted: (1) the terrain and other natural environmental conditions of the study area were investigated and obtained, and spatial classification was carried out. According to previous research results [21], the study area was divided into two different geographical spaces, namely mountains and flatlands, on the scale of towns and villages according to topographic factors (Figure 1). On the basis of this, this study directly examined the land use change in mountains and flatlands by referring to the results of the zoning. (2) Based on the LULC change data, the status quo of LULC and its temporal–spatial change characteristics were analyzed. (3) The topographic position index was calculated by combining the elevation, slope and topographic relief, and the response characteristics of LULC types were analyzed from the topographic position gradient.
The data supporting this study mainly included two categories: (1) Landsat series images downloaded from the United States Geological Survey (USGS) website (https://earthexplorer.usgs.gov, accessed on 6 October 2022). The image resolution was 30 m, and the time series was 2000–2020, divided into three periods (2000, 2010, 2020). These data were generated through manual visual interpretation, with an accuracy of more than 85%, which was deemed appropriate for this study. LULC types were divided into six primary categories, including cultivated land (CL), grassland (GL), forestland (FL), wetland (WL), water body (WB) and build-up land (BL). (2) Digital elevation model (DEM) data (30 × 30 m) were obtained from the Geospatial Data Cloud (http://www.gscloud.cn, accessed on 20 September 2022), while slope and relief data were calculated from the DEM data using ArcGIS 10.6, and the methods for performing the five-level division and area statistics were those described in the literature [27].
2.3. Methods
2.3.1. Transfer Chord Diagram and Evolution Characteristic Map
The visualization of the relationships between data can be presented using a transfer chord diagram, in which the data points are arranged in a circular, radial order, and the lines are used to show relationships between the data [28]. In a transfer chord diagram, different colors and the thickness of the lines can show different types of connections and strengths. LULC change mainly reflects the mutual transfer relationship between different land use types. Therefore, a transfer chord diagram can be used to visually display the transfer matrix of LULC change and realize the visualization of the direction and intensity of its transfer.
A change characteristic map can reorganize the land use types in different periods to obtain the information of land use change patterns in multiple periods, in order to conduct a more intuitive and quantitative analysis of the temporal–spatial transformation. According to the literature [29] and the actual situation of the study area, LULC change patterns were divided into five types: (1) stable, where there was no change in both phases during the period 2000–2020; (2) early change, where the types changed only in 2000–2010; (3) late change, where the types changed only in 2010–2020; (4) continuous change, where the types changed both in 2000–2010 and 2010–2020, but the types were different in 2000 and 2020; and (5) recurrent change, where the types changed both in 2000–2010 and 2010–2020, but the types were the same in 2000 and 2020.
2.3.2. Terrain Position Index
In order to fully reflect the spatial differentiation of the topographic gradient, the topographic position index was calculated by referring to previous studies [30] combined with Yuxi City’s characteristic large topographic relief, and considering the spatial differences in elevation, slope and topographic relief comprehensively. The formula is as follows:
where T is the terrain position index; E, S and R are, respectively, the elevation, slope and relief value of any point; and , and are, respectively, the average elevation, slope and relief where the point is located.
2.3.3. Distribution Index
To eliminate the dimensional influence, the distribution index was constructed to describe the distribution of different LULC types on the topographic gradient. The calculation formula is as follows:
where D is the distribution index, e is the terrain gradient, i represents different land use types, Si is the total area of the ith land use type, Sie is the area of the ith land use type on the eth topographic gradient, Se is the total area of the eth topographic gradient and St is the total area of the study area. When D > 1, it indicates that the land use type has a dominant distribution on a certain topographic gradient, and the higher the value of D, the more obvious the dominance.
2.3.4. Diversity Index
The diversity index can be used to represent the uniformity and spatial dispersion of the land use type distribution in the study area [31]. The higher the value of H, the more complex the land use type and the better its uniformity.
where H is the diversity index, H ≥ 0; Pi represents the area proportion of the ith land use type. The higher the value of H, the better the distribution uniformity of the land use type in the study area. If it approaches 0, it indicates that the dispersion degree of land use types in the study area is large, and the uniformity degree is poor.
3. Results
3.1. Characteristics of LULC Change
3.1.1. Spatial Distribution of LULC
From 2000 to 2020, the LULC in the mountains and flatlands was dominated by forestland and cultivated land, but there was obviously more grassland, construction land and water bodies in the flatlands than in the mountains (Figure 2 and Figure 3). In the mountains, cultivated land was mainly distributed in the eastern region and along the Ailao Mountain river valley in the west; forestland coverage was the most extensive, with the largest distribution in the central and western regions (Figure 2). In the flatlands, cultivated land was concentrated and contiguous, staggered with build-up land; the transition zone between cultivated land and forestland was covered with grassland; water area included three lakes from north to south (Figure 3). The wetland coverage was small and did not stand out, mainly being scattered around Yuan River and the three lakes. Among the six types, in the mountains, the area of forestland was the largest, ranging from 753,703.94 hm2 to 774,316.12 hm2, accounting for 64.51% to 66.27%, followed by cultivated land, with an area of 286,797.19–294,986.67 hm2, accounting for 24.55–25.25%. These types were followed by grassland, accounting for 8.25–9.09%, while the other three types accounted for less than 1% (Table A1). In the flatlands, forestland, cultivated land and grassland remained the top three in area, which accounted for 37.69%–38.70%, 30.71%–34.33% and 16.14%–17.35%, respectively. However, the areas of water bodies and build-up land were significantly larger than those in the mountains, with the area of water bodies ranging from 26,574.46 hm2 to 28,223.11 hm2, accounting for 8.11%–8.61%, and the area of construction land ranging from 8391.10 hm2 to 23,063.47 hm2, accounting for 2.56%–7.03% (Table A2).
3.1.2. Analysis of LULC Changes
As can be seen in the transfer chord diagram, the intensity of land transfer in the mountains during the period 2000–2010 was higher than that during the period 2010–2020, and land use transfer mainly occurred among forestland, cultivated land and grassland. From 2000 to 2010, the transfer-out area of forestland, cultivated land and grassland ranked the top three, accounting for 50.47%, 26.28% and 20.95% of the total transferred area; the top three types in transfer-in area were cultivated land, grassland and forestland, accounting for 35.05%, 31.36% and 30.87%, respectively (Table A3). From 2010 to 2020, the transfer-in area of cultivated land and grassland decreased significantly. Compared with 2000–2010, cultivated land changed from net transfer-in to net transfer-out. At the same time, the transfer of construction land was obvious, where the transfer-in area accounted for 9.39%, with a net increase of 6903.49 hm2 (Table A4). From 2000 to 2020, for both transfer-in and transfer-out, the order of the transfer area was forestland, cultivated land and grassland (Table A5).
In the flatlands, the transfer intensity from 2010 to 2020 was significantly higher than that from 2000 to 2010, and land use transfer mainly occurred among cultivated land, forestland, grassland and build-up land (Table A6 and Table A7). From 2000 to 2010, the net transfer-out area of cultivated land was the largest, accounting for 17.98%; the top two net transfer-in area were grassland and forestland, accounting for 15.83% and 7.74%, respectively. From 2010 to 2020, the net transfer-out of arable land, grassland and forestland accounted for 25.70%, 12.98% and 10.88%, respectively. However, construction land showed a significant increase, with a net transfer-in area of 14,381.35 hm2 and an increase of 165.66%, accounting for 46.97% of the total transferred area. During this period, the transfer intensity of forestland, cultivated land and grassland became weaker, but urban construction land expanded very quickly. From 2000 to 2020, the transfer changes mainly occurred between cultivated land and construction land, accounting for 46.91% and 38.20%, respectively (Table A8).
The change characteristic map showed that the stable type was the most widely distributed (Figure 4 and Figure 5), with an area of 1,024,940.08 hm2 and 282,838.68 hm2, accounting for 87.74% and 86.29% of the total area, respectively (Table A9 and Table A10). The area proportion of early change (5.32%) was greater than that of late change (4.26%) in the mountains, but the area proportion of early change (4.37%) was smaller than that of late change (6.92%) in the flatlands, indicating that the LULC change in the different regions in the two stages was obviously different. The proportion of the continuous change area was small, but it was still higher in the flatlands (0.93%) than in the mountains (0.51%), and the proportion of the recurrent change area was higher in the mountains (2.16%) than in the flatlands (1.49%). This indicates that the land use change in the flatlands was more drastic than that in the mountains; that is, the low-lying areas suitable for infrastructure construction and development experienced more drastic changes in land use, while the intensity of human activities in the mountains was relatively weak and changed little.
3.2. Topographic Characteristics and Terrain Gradient Distribution of LULC
3.2.1. Topographic Features in the Study Area
The topographic position index was calculated with a raster calculator and divided into five levels using the natural breakpoint method (Figure 6d). As can be seen in Figure 6, the terrain of Yuxi City is high in the northwest and low in the southeast, with great differences in topography. According to the gathering of land use area under various terrains in the figure, the area proportion of grades III and IV in altitude accounts for 89.61% (Figure 6a, Table A11), the area proportion of grades III, IV and V in slope accounts for 87.81% (Figure 6b, Table A11) and the area proportion of grades III and IV in topographic relief accounts for 86.03% (Figure 6c, Table A11), indicating that the area with a medium-high altitude, and medium-relief terrain is large. The area proportion of topographic positions II, III and IV accounts for 78.77%, which indicates that Yuxi City has a high degree of topographic complexity. Most of the areas have a medium-high terrain, mainly distributed on the Ailao Mountain from northwest to southwest and in the north. The low topographic positions are mainly distributed in the eastern regions with a low slope and relief, including Hongta District, the three lake plains and the eastern part of Huaning County, followed by the Yuanjiang River Valley.
3.2.2. Land Use Distribution Index on Topographic Gradient in Mountains
The topographic position distribution indices of the LULC types were calculated, as shown in Figure 7. The topographic position index T (0–1.6212) was divided into 50 levels, and according to the distribution advantages of each land use type, it was further categorized into three terrain position sections: low (1–15), medium (15–25) and high (25–50).
It can be seen in Figure 7 that the topographic gradients of land use types in the mountains were significantly different. The dominant distribution of cultivated land in the low-terrain section was obvious, but its distribution dominance first increased and then decreased. The distribution index showed a downward trend in different periods, but an abrupt change occurred at position 7, and high values were mainly concentrated among positions 1–6. There were differences in the peak gradients of the cultivated land distribution index in 2000, 2010 and 2020, which occurred at positions 2 (3.383), 4 (3.501) and 6 (3.253), respectively. Grassland was mainly distributed among positions 15–26, and its dominant area was obviously the medium-terrain section. The distribution index undulated on the topographic gradient, forming two small wave peaks, but the peak positions were similar in the different periods. Forestland was mainly distributed among positions 26–50, and the dominant areas were mainly the medium- and high-terrain sections. The distribution index increased continuously, and it reached its highest values at position 50 in 2000, 2010 and 2020, which were 1.509, 1.547 and 1.552, respectively. From 2000 to 2020, the forestland distribution index continued to decline in the low section and continued to increase in the high section. Wetland was mainly distributed among positions 4–17, and the dominant distribution area was concentrated in the low section, with a few areas in the middle section and zero areas in the high section. From 2000 to 2020, the distribution index increased first and then decreased; specifically, it significantly declined in the low section. The water area was relatively small, mainly distributed among positions 3–19. The dominant distribution area was formed in the low section, but its dominance increased first and then decreased with time. Construction land was mainly distributed among positions 1–20, forming an obvious dominant distribution area in the low section, and its advantages decreased significantly with the gradients. In 2000, 2010 and 2020, the values of the distribution index appeared at positions 1, 2 and 2, respectively.
3.2.3. Land Use Distribution Index on Topographic Gradient in Flatlands
As can be seen in Figure 8, cultivated land in the flatlands was mainly distributed among topographic positions 5–21, and the overall change trend was similar to that in the mountains. A sudden change point was formed at position 7, which showed a “decrease-increase-decrease” trend with the terrain position gradients, and then rose after a second trough was formed at position 43. From 2000 to 2020, the distribution index increased first and then decreased in the low section, but that in the middle and high sections continued to increase, indicating that the distribution advantage of cultivated land in the low section decreased gradually. Grassland was mainly distributed among positions 18–50, and its distribution index continued to rise. The dominant area was the high section, followed by the middle section, and the peak value appeared at position 44. From 2000 to 2020, the distribution index first decreased and then increased on the same gradients. Forestland was mainly distributed among positions 21–40, showing a wavy rise and then a decline. The peak value was found at position 35 in the three years. The dominant distribution area was concentrated in the middle section, but the distribution index in the high section showed an increasing trend. Wetland and water area were distributed among positions 9–16 and 7–16, respectively, with the low section as the dominant distribution area. The peak distribution index of wetland was found at positions 12 and 14, and that of water bodies was found at position 7. The distribution advantage of wetland in the low section first decreased and then increased with time, while that of the water area first increased and then decreased. Construction land was mainly distributed among positions 8–17, forming a significant dominant distribution area in the low section; the peak was formed at position 11 in the three years, and its distribution advantage increased in the low and middle sections; Compared with 2000 and 2010, the distribution index increased significantly at positions 5 and 6, from 0.000 and 0.000 to 3.922 and 4.422.
3.3. Land Use Type Diversity on Topographic Gradient
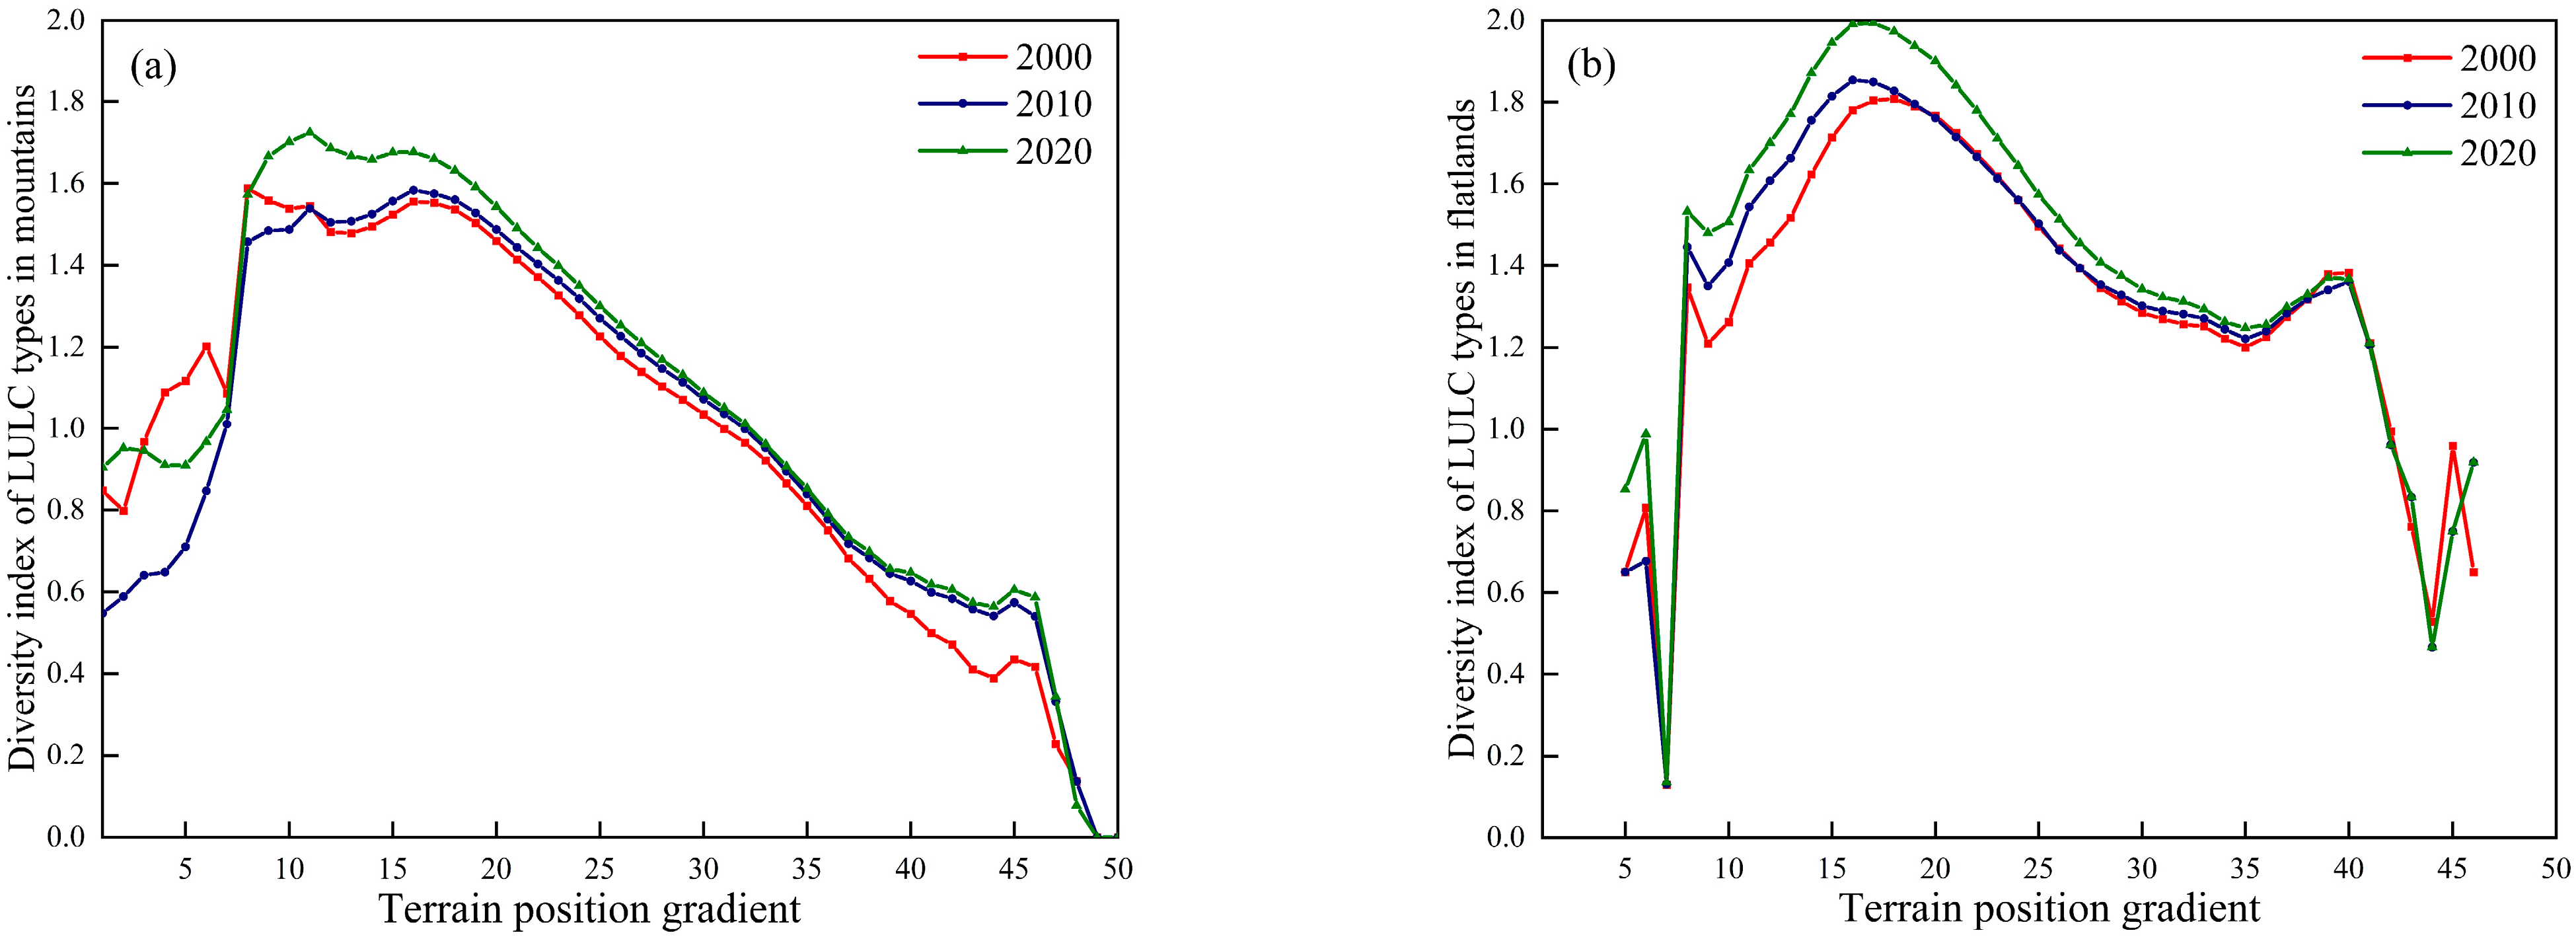
The land use diversity index of the mountains and flatlands on different topographic gradients reflected the similarities and differences in land use diversity and its changes in the topographic gradients in the two regions (Figure 9). In the mountains, the diversity index increased first and then decreased with the topographic position, and the difference between the high and low values was large, ranging from 0 to 1.677. In the flatlands, the change trend was more complex, with frequent up-down-up alternation and greater volatility, but the gap between the high and low values was small, only ranging from 0.918 to 1.994. From 2000 to 2020, the diversity in the mountains peaked at position 16, while that in the flatlands peaked at positions 18, 16, and 17 in the three years. Before reaching the peak value, the diversity increased and then decreased with the increase in the topographic position.
In different topographic positions, diversity was manifested in different forms in the mountains and flatlands. The land use type diversity in the mountains was higher than that in the flatlands at positions 1 to 12, but the land use type diversity in the flatlands was higher than that in the mountains at positions 13 to 50, indicating that the distribution of land use types in the mountains was more uniform than that in the flatlands in the low section, while the opposite was true in the medium- and high-terrain sections. After the peak, the diversity decreased with the topographic gradient, but the decrease trend in the flatlands was significantly smaller than that in the mountains. In terms of time, except for the mountains in the low-terrain section, the diversity in 2000 was higher than that in 2020 and 2010, and for the rest of the topographic position sections, whether in the mountains or the flatlands, the size order of the land use diversity was 2020 > 2010 > 2000.
4. Discussion
4.1. The Forming Causation of Diferences
Through the comparison and analysis of the temporal–spatial dynamic evolution of LULC and its topographic gradient effects between the mountains and flatlands, it was observed that there were similar characteristics, but also obvious spatial differences. Combined with the actual situation of the study area, the causes can be discussed from three aspects: natural factors, socio-economic factors and policy factors.
Unlike plain areas or deltas, where the natural environmental conditions have weak restrictions on LULC [32,33], the distribution and change characteristics of land use in mountainous areas are obviously restricted and influenced by the natural environment. Yuxi City has a broken topography and obvious differences in terrain and relief, where the area with a high topographic position index has a high altitude, large slope and large terrain relief. Many factors restrict human production activities, development and construction [34], meaning that areas with a high topography position experience less human interference and damage. In the mountains and flatlands, there was a common feature that the medium- and high-terrain position areas were mainly the dominant distribution areas of forestland and grassland, while the low-terrain position areas were mainly dominated by cultivated land, build-up land and water bodies [35,36]. However, compared with the flatlands, the natural environment of the mountains is more complex, which determined the different distribution patterns and change directions of LULC in the two geographical spaces to a large extent. Although land use transfer mainly occurred among cultivated land, forestland and grassland, there were obvious differences in the amount of land use transfer. The transfer amount of forestland was the largest in the mountains, while that of cultivated land was the largest in the flatlands. Meanwhile, the transfer direction of forestland in the mountains was mainly conversion to cultivated land and grassland, while the transfer direction of cultivated land in the flatlands was mainly conversion to build-up land. Fang also came to a similar conclusion when studying land use change in a karst trough area [37].
The differences in social and economic development level and human activity intensity further aggravate the differences in land use evolution in space [38,39]. The LULC changes were more obvious in the flatlands with a relatively low and flat terrain, which is consistent with the temporal–spatial variation characteristics of land use dynamics in previous studies [40,41]. The land use changes in the later stage of the flatlands were significantly stronger than those in the earlier stage. This is mainly because, since 2010, the flatlands have entered an accelerated urbanization process; the population has migrated from the mountains to the flatlands and from the high topographic positions to the low topographic positions [42]; non-agricultural construction land has increased rapidly; and the transfer intensity of cultivated land, grassland and forestland to build-up land has increased, especially farmland in the low-terrain area [39]. The stage changes in cultivated land in the mountains are consistent with the development trend of the mountains. The level of social and economic development in the early stage is low, farmers in the mountains mainly earn a living only by farming, and the traditional production and lifestyle of mountain residents still consume a large amount of forests, as well as the reclamation of nearby cultivated land, leading to the transfer of massive forestland to cultivated land and grassland [23]. However, in the later stage, with the continuous improvement at the social and economic development level, farmers in the mountains leave to work for a living, resulting in population outflow, abandoning the cultivated land [43], transferring it to grassland and forestland. Under the influence of population migration and distribution, construction land closely related to human activities in the flatlands expands rapidly in the low-terrain area, while forestland and grassland in the mountains increase in the high-terrain area.
The policy factors can reflect the macro-control of the government on the allocation of land resources and promote the formation of the topographic gradient effect of land use change [44]. In 2002, Yuxi City launched the project of returning farmland to forestland and grassland. The project was mainly aimed at sloping farmland above 25°, mainly concentrated in the mountains, and converting arable land to grassland and woodland in the mountains and some high-terrain position areas in the flatlands. In 2008, a pilot project for the comprehensive control of stony desertification was carried out and achieved obvious results, where unused land and grassland in the high-terrain position areas were converted to forestland. In addition, in recent years, the implementation of the “ecological city” concept, soil erosion control, poverty alleviation, rural revitalization and other policies has further affected the change in land use on the topographic gradient.
In this study, with the increase in the topographic gradient, the land use diversity of the mountains decreased significantly, mainly due to the restrictions of the terrain, the reduction in human activities, the abandonment of farmland and the implementation of the policy of returning farmland to forestland and grassland, resulting in the transfer of cultivated land to forestland and grassland, and a decrease in diversity. However, although the land use diversity of the flatlands also decreased with the topographic gradient, the reduction range was obviously less than that of the mountains. The main reason is that the population density in the flatlands is large, and the land demand is higher than that of the mountains; with the development of the low-topographic position area and the implementation of the national farmland protection policy, the land demand has to be increased in the high-topographic position area [25,45]. These results once again verify the influence of natural, socio-economic and policy factors on the differences in land use evolution and topographic gradient effects in different geographical spaces, and further show that these influencing factors do not act independently. On this basis, the basic pattern of land use determined by natural, socio-economic and policy factors further aggravates the differentiation in time and space, thus introducing completely different temporal and spatial distribution characteristics of LULC to the mountains and flatlands on different topographic gradients [20], which also triggers the need for differentiated territorial spatial planning and ecological protection policies for different landform types in the same region.
4.2. Limitations and Future Study
While some solid results were obtained in this study, we also recognize it still had some limitations. As two different geographical spaces, the differences in temporal–spatial evolution and topographic gradient distribution of LULC in the mountains and flatlands are mainly restricted and limited by natural geographical conditions, but the impacts of human activities and related policies were more important in the later period. This study made a comparative analysis on some policies, such as returning farmland to forestland, controlling rocky desertification and ecological protection. However, at this stage, new national policies, such as rural revitalization and new-type urbanization construction, especially the specific and differentiated policies of the two regions in the future, have not been discussed in depth. In addition, the topographic position index was used to explore the spatial heterogeneity of LULC, but the weight of the influence of various topographic factors remains unclear, and the weight of different factors was not considered in the calculation process. Therefore, further discussion is needed in future research to provide more practical policies for the construction of ecological environments in mountainous areas.
5. Conclusions
This study focused on the temporal–spatial evolution and topographic gradient effects of LULC in different geographical spaces in the southwest mountainous area of China, with a view to providing a reference for similar research and land use policy formulation in these regions. There were obvious differences in the temporal–spatial evolution and topographic gradient effects of LULC between the mountains and flatlands, which were mainly caused by the natural geographical conditions, socio-economic development level, and national and local policies. The research results showed that the flatlands, with superior topographic conditions, had a high level of socio-economic development and drastic changes in LULC, with an obvious increase in construction land and a decrease in cultivated land among the low topographic positions; the intensity of human activities among the high topographic positions also showed an increasing trend. In the mountains, being restricted by natural geographical conditions and policy factors, land use diversity was high in the low-terrain area, while the human activity intensity decreased rapidly in the high-terrain positions, showing an obvious natural recovery of ecological vegetation. However, it is the differentiation of these divergences that gives the mountains and flatlands different functional positionings in the same region. The rapid improvement of the urbanization level in the flatlands and the natural ecological restoration in the mountains provide impetus and support for regional socioeconomic development and ecological environmental protection, respectively, and jointly promote the sustainable development of the region.
Author Contributions
Writing original draft, L.W.; conceptualization, L.W. and B.X.; methodology, L.W.; software, L.W. and H.Y.; validation, B.X. and W.L.; investigation, L.W. and Y.Y.; writing—original draft preparation, L.W. and Y.Y.; writing—review and editing, B.X. and W.L.; visualization, L.W. and H.Y.; funding acquisition, B.X. and W.L. All authors read and contributed to the manuscript. All authors have read and agreed to the published version of the manuscript.
Funding
This research was funded by the National Natural Science Foundation of China, grant number 42161041, the Science and Technology planning Project of Yunnan Province, grant number 202305AC160089, the National Key Research and Development Program of China, grant number 2022YFF1300705, the Open Project of Key Laboratory of Karst Ecosystem and Treatment of Rocky Desertification, Ministry of Natural Resources and Guangxi Key Science and Technology Innovation Base on Karst Dynamics, grant number YRSW-2023-085.
Data Availability Statement
The data presented in this study are available in the article.
Acknowledgments
We appreciate the critical and constructive comments and suggestions from the reviewers that helped to improve the quality of this manuscript. We also would like to offer our sincere thanks to those who participated in the data processing and provided constructive comments for this study.
Conflicts of Interest
The authors declare no conflict of interest.
Appendix A

Table A1.
LULC area and proportion in the mountains from 2000 to 2020.
| Year | Types | CL | GL | FL | WL | WB | BL |
|---|---|---|---|---|---|---|---|
| 2000 | Area (hm2) | 286,797.19 | 96,411.58 | 774,316.12 | 37.80 | 7939.09 | 2861.68 |
| Proportion (%) | 24.55 | 8.25 | 66.27 | 0.00 | 0.68 | 0.24 | |
| 2010 | Area (hm2) | 294,986.67 | 106,123.59 | 756,017.65 | 256.57 | 7339.49 | 3639.82 |
| Proportion (%) | 25.25 | 9.08 | 64.71 | 0.02 | 0.63 | 0.31 | |
| 2020 | Area (hm2) | 290,004.86 | 106,211.13 | 753,703.94 | 219.70 | 7682.05 | 10,543.28 |
| Proportion (%) | 24.82 | 9.09 | 64.51 | 0.02 | 0.66 | 0.90 |
Note: CL, cultivated land; GL, grassland; FL, forestland; WL, wetland; WB, water body; BL, build-up land.
Table A2.
LULC area and proportion in the flatlands from 2000 to 2020.
| Year | Types | CL | GL | FL | WL | WB | BL |
|---|---|---|---|---|---|---|---|
| 2000 | Area (hm2) | 112,534.91 | 53,360.99 | 125,161.70 | 171.19 | 28,223.11 | 8391.10 |
| Proportion (%) | 34.33 | 16.28 | 38.18 | 0.05 | 8.61 | 2.56 | |
| 2010 | Area (hm2) | 108,536.75 | 56,886.83 | 126,881.71 | 284.12 | 26,574.46 | 8681.73 |
| Proportion (%) | 33.11 | 17.35 | 38.70 | 0.09 | 8.11 | 2.65 | |
| 2020 | Area (hm2) | 100,666.40 | 52,911.22 | 123,547.81 | 277.63 | 27,374.26 | 23,063.47 |
| Proportion (%) | 30.71 | 16.14 | 37.69 | 0.08 | 8.35 | 7.03 |
Note: CL, cultivated land; GL, grassland; FL, forestland; WL, wetland; WB, water body; BL, build-up land.
Table A3.
LULC transfer matrix in the mountains from 2000 to 2010.
| Types | CL | GL | FL | WL | WB | BL | Transfer-Out Area (hm2) | Transfer-Out Proportion (%) |
|---|---|---|---|---|---|---|---|---|
| CL | – | 4597.81 | 18,628.37 | 40.30 | 321.49 | 948.40 | 24,536.37 | 26.28 |
| GL | 9891.24 | – | 9286.15 | 69.35 | 142.75 | 174.56 | 19,564.03 | 20.95 |
| FL | 21,894.89 | 24,416.69 | – | 103.30 | 567.96 | 140.41 | 47,123.26 | 50.47 |
| WL | 5.83 | 2.44 | 3.46 | – | 4.03 | 0.07 | 15.83 | 0.02 |
| WB | 515.54 | 232.46 | 867.07 | 21.61 | – | 1.91 | 1638.60 | 1.76 |
| BL | 417.32 | 26.95 | 39.02 | 0.00 | 4.11 | – | 487.40 | 0.52 |
| Transfer-in area (hm2) | 32,724.81 | 29,276.36 | 28,824.07 | 234.56 | 1040.35 | 1265.35 | 93,365.51 | 100.00 |
| Transfer-in proportion (%) | 35.05 | 31.36 | 30.87 | 0.25 | 1.11 | 1.36 | 100.00 |
Note: CL, cultivated land; GL, grassland; FL, forestland; WL, wetland; WB, water body; BL, build-up land.
Table A4.
LULC transfer matrix in the mountains from 2010 to 2020.
| Types | CL | GL | FL | WL | WB | BL | Transfer-Out Area (hm2) | Transfer-Out Proportion (%) |
|---|---|---|---|---|---|---|---|---|
| CL | – | 5216.37 | 15,047.19 | 17.99 | 402.81 | 4588.65 | 25,273.02 | 31.19 |
| GL | 4923.87 | – | 14,644.41 | 4.49 | 214.53 | 1627.54 | 21,414.85 | 26.43 |
| FL | 14,567.22 | 16,089.46 | – | 3.76 | 585.96 | 1379.48 | 32,625.88 | 40.27 |
| WL | 15.31 | 4.50 | 9.13 | – | 56.75 | 0.00 | 85.70 | 0.11 |
| WB | 224.61 | 110.98 | 552.89 | 22.91 | – | 9.31 | 920.70 | 1.14 |
| BL | 559.18 | 81.83 | 59.13 | 0.00 | 1.35 | – | 701.49 | 0.87 |
| Transfer-in area (hm2) | 20,290.20 | 21,503.14 | 30,312.75 | 49.15 | 1261.41 | 7604.98 | 81,021.64 | 100.00 |
| Transfer-in proportion (%) | 25.04 | 26.54 | 37.41 | 0.06 | 1.56 | 9.39 | 100.00 | – |
Note: CL, cultivated land; GL, grassland; FL, forestland; WL, wetland; WB, water body; BL, build-up land.
Table A5.
LULC transfer matrix in the mountains from 2000 to 2020.
| Types | CL | GL | FL | WL | WB | BL | Transfer-Out Area (hm2) | Transfer-Out Proportion (%) |
|---|---|---|---|---|---|---|---|---|
| CL | – | 4722.22 | 22,706.77 | 48.33 | 456.95 | 5011.38 | 32,945.66 | 27.93 |
| GL | 10,431.39 | – | 12,940.87 | 39.56 | 232.88 | 1762.87 | 25,407.57 | 21.54 |
| FL | 24,702.73 | 30,176.16 | – | 87.91 | 732.10 | 1547.74 | 57,246.63 | 48.53 |
| WL | 6.69 | 2.71 | 3.07 | – | 3.05 | 0.05 | 15.58 | 0.01 |
| WB | 476.51 | 225.72 | 939.12 | 21.66 | – | 23.83 | 1686.84 | 1.43 |
| BL | 534.55 | 82.04 | 43.00 | 0.00 | 4.73 | – | 664.31 | 0.56 |
| Transfer-in area (hm2) | 36,151.87 | 35,208.85 | 36,632.84 | 197.45 | 1429.71 | 8345.88 | 117,966.59 | 100.00 |
| Transfer-in proportion (%) | 30.65 | 29.85 | 31.05 | 0.17 | 1.21 | 7.07 | 100.00 | – |
Note: CL, cultivated land; GL, grassland; FL, forestland; WL, wetland; WB, water body; BL, build-up land.
Table A6.
LULC transfer matrix in the flatlands from 2000 to 2010.
| Types | CL | GL | FL | WL | WB | BL | Transfer-Out Area (hm2) | Transfer-Out Proportion (%) |
|---|---|---|---|---|---|---|---|---|
| CL | – | 3218.24 | 3416.38 | 1.19 | 226.21 | 899.15 | 7761.18 | 34.86 |
| GL | 1175.36 | – | 3860.75 | 0.04 | 6.65 | 22.73 | 5065.53 | 22.75 |
| FL | 1404.04 | 5061.17 | – | 1.69 | 116.76 | 25.74 | 6609.40 | 29.69 |
| WL | 90.07 | 5.02 | 65.35 | – | 4.10 | 0.16 | 164.69 | 0.74 |
| WB | 593.23 | 245.11 | 887.12 | 274.70 | – | 2.60 | 2002.76 | 9.00 |
| BL | 496.03 | 60.61 | 102.46 | 0.00 | 0.65 | – | 659.74 | 2.96 |
| Transfer-in area (hm2) | 3758.72 | 8590.15 | 8332.06 | 277.62 | 354.37 | 950.37 | 22,263.30 | 100.00 |
| Transfer-in proportion (%) | 16.88 | 38.58 | 37.43 | 1.25 | 1.59 | 4.27 | 100.00 | – |
Note: CL, cultivated land; GL, grassland; FL, forestland; WL, wetland; WB, water body; BL, build-up land.
Table A7.
LULC transfer matrix in the flatlands from 2010 to 2020.
| Types | CL | GL | FL | WL | WB | BL | Transfer-Out Area (hm2) | Transfer-Out Proportion (%) |
|---|---|---|---|---|---|---|---|---|
| CL | – | 2028.72 | 1430.96 | 17.34 | 273.04 | 9646.02 | 13,396.08 | 43.75 |
| GL | 3462.43 | – | 2773.40 | 2.46 | 144.46 | 2531.94 | 8914.69 | 29.11 |
| FL | 1731.95 | 2887.94 | – | 108.16 | 433.45 | 2486.29 | 7647.79 | 24.98 |
| WL | 0.82 | 0.05 | 2.21 | – | 150.20 | 0.00 | 153.27 | 0.50 |
| WB | 74.53 | 8.48 | 86.20 | 18.82 | – | 18.22 | 206.25 | 0.67 |
| BL | 257.65 | 13.66 | 24.58 | 0.00 | 5.23 | – | 301.12 | 0.98 |
| Transfer-in area (hm2) | 5527.38 | 4938.85 | 4317.36 | 146.78 | 1006.38 | 14,682.47 | 30,619.20 | 100.00 |
| Transfer-in proportion (%) | 18.05 | 16.13 | 14.10 | 0.48 | 3.29 | 47.95 | 100.00 | – |
Note: CL, cultivated land; GL, grassland; FL, forestland; WL, wetland; WB, water body; BL, build-up land.
Table A8.
LULC transfer matrix in the flatlands from 2000 to 2020.
| Types | CL | GL | FL | WL | WB | BL | Transfer-Out Area (hm2) | Transfer-Out Proportion (%) |
|---|---|---|---|---|---|---|---|---|
| CL | – | 3668.33 | 2831.26 | 9.44 | 386.60 | 11,903.15 | 18,798.77 | 46.91 |
| GL | 3732.12 | – | 4132.50 | 0.67 | 44.69 | 1822.91 | 9732.88 | 24.29 |
| FL | 2098.57 | 5422.75 | – | 29.02 | 199.86 | 1489.95 | 9240.14 | 23.06 |
| WL | 78.71 | 4.18 | 47.48 | – | 17.35 | 15.98 | 163.71 | 0.41 |
| WB | 494.56 | 149.90 | 552.08 | 231.01 | – | 76.22 | 1503.77 | 3.75 |
| BL | 524.03 | 36.52 | 68.82 | 0.00 | 6.96 | – | 636.34 | 1.59 |
| Transfer-in area (hm2) | 6927.98 | 9281.68 | 7632.14 | 270.14 | 655.46 | 15,308.21 | 40,075.61 | 100.00 |
| Transfer-in proportion (%) | 17.29 | 23.16 | 19.04 | 0.67 | 1.64 | 38.20 | 100.00 | – |
Note: CL, cultivated land; GL, grassland; FL, forestland; WL, wetland; WB, water body; BL, build-up land.
Table A9.
LULC change types and area statistics in the mountains from 2000 to 2020.
| Change Types | Area (hm2) | Proportion (%) |
|---|---|---|
| Stable | 1,024,940.08 | 87.74 |
| Early change | 62,158.31 | 5.32 |
| Late change | 49,812.49 | 4.26 |
| Continuous change | 5972.17 | 0.51 |
| Recurrent change | 25,218.14 | 2.16 |
Note: Stable, where the LULC type was the same in the three years; Early change, where the LULC type changed during 2000–2010, but did not change during 2010–2020; Late change, where the LULC type changed during 2010–2020, but did not change during 2000–2010; Continuous change, where the LULC type was not the same in the three years; Recurrent change, where the LULC types changed during 2000–2010 and 2010–2020, but the types in 2000 and 2020 were the same.
Table A10.
LULC change types and area statistics in the flatlands from 2000 to 2020.
| Change Types | Area (hm2) | Proportion (%) |
|---|---|---|
| Stable | 282,838.68 | 86.29 |
| Early change | 14,328.74 | 4.37 |
| Late change | 22,684.31 | 6.92 |
| Continuous change | 3058.75 | 0.93 |
| Recurrent change | 4873.73 | 1.49 |
Note: Stable, where the LULC type was the same in the three years; Early change, where the LULC type changed during 2000–2010, but did not change during 2010–2020; Late change, where the LULC type changed during 2010–2020, but did not change during 2000–2010; Continuous change, where the LULC type was not the same in the three years; Recurrent change, where the LULC types changed during 2000–2010 and 2010–2020, but the types in 2000 and 2020 were the same.
Table A11.
Area and proportion statistics of different topographic index levels in Yuxi City.
| Topographic Index | Grade | I | II | III | IV | V |
|---|---|---|---|---|---|---|
| Elevation | Area (hm2) | 14,437.10 | 140,901.25 | 1,022,170.92 | 317,957.94 | 126.08 |
| Proportion (%) | 0.97 | 9.42 | 68.35 | 21.26 | 0.01 | |
| Slope | Area (hm2) | 50,503.28 | 131,396.58 | 440,079.70 | 504,090.16 | 366,055.63 |
| Proportion (%) | 3.38 | 8.81 | 29.49 | 33.78 | 24.53 | |
| Relief | Area (hm2) | 45,424.43 | 174,840.57 | 936,492.90 | 453,406.61 | 5485.81 |
| Proportion (%) | 2.81 | 10.82 | 57.96 | 28.06 | 0.34 | |
| Terrain position | Area (hm2) | 113,470.07 | 299,128.09 | 447,219.14 | 428,743.96 | 203,202.10 |
| Proportion (%) | 7.61 | 20.05 | 29.98 | 28.74 | 13.62 |
Note: I, II, III, IV and V represent different topographic factor levels respectively.
References
- Smiraglia, D.; Ceccarelli, T.; Bajocco, S.; Perini, L.; Salvati, L. Unraveling landscape complexity: Land use/land cover changes and landscape pattern dynamics (1954–2008) in contrasting peri-urban and agro-forest regions of Northern Italy. Environ. Manag. 2015, 56, 916–932. [Google Scholar] [CrossRef] [PubMed]
- Chen, F.; Bai, X.Y.; Liu, F.; Luo, G.J.; Tian, Y.C.; Qin, L.Y.; Li, Y. Analysis long-term and spatial changes of forest cover in typical karst areas of China. Land 2022, 11, 1349. [Google Scholar] [CrossRef]
- Xiao, B.Q.; Bai, X.Y.; Zhao, C.W.; Tan, Q.; Li, Y.B.; Luo, G.J.; Wu, L.H.; Chen, F.; Li, C.J.; Ran, C.; et al. Responses of carbon and water use efficiencies to climate and land use changes in China’s karst areas. J. Hydrol. 2023, 617, 128968. [Google Scholar] [CrossRef]
- Zhang, Z.M.; Huang, X.F.; Zhou, Y.C. Spatial heterogeneity of soil organic carbon in a karst region under different land use patterns. Ecosphere 2020, 11, e03077. [Google Scholar] [CrossRef] [Green Version]
- Olorunfemi, I.E.; Fasinmirin, J.T.; Olufayo, A.A.; Komolafe, A.A. GIS and remote sensing-based analysis of the impacts of land use/land cover change (LULCC) on the environmental sustainability of Ekiti State, southwestern Nigeria. Environ. Dev. Sustain. 2020, 22, 661–692. [Google Scholar] [CrossRef]
- Wang, Q.M.; Yang, K.; Xu, Q.L.; Gao, R. Topographic gradient effect of land use change map in Dianchi Basin. Res. Soil Water Conserv. 2018, 25, 238–244. [Google Scholar]
- Zhang, J.; Ren, Z.Y. Spatiotemporal pattern and terrain gradient effect of land use change in Qinling-Bashan mountains. Trans. Chin. Soc. Agric. Eng. 2016, 32, 250–257. [Google Scholar]
- Dai, Y.Z.; Li, J.F. Terrain gradient effect of spatiotemporal evolution of ecological land and ecosystem service value in Dongting Lake Area. Res. Soil Water Conserv. 2018, 25, 197–204. [Google Scholar]
- Zhou, R.R.; Peng, P.; Zhou, G.H.; Tang, C.L.; Liu, X.H. Analysis of poverty characteristics and poverty influencing factors in different terrain areas. Trans. Chin. Soc. Agric. Eng. 2019, 35, 253–261. [Google Scholar]
- Lauer, W. Human development and environment in the Andes: A geoecological overview. Mt. Res. Dev. 1993, 13, 157–166. [Google Scholar] [CrossRef]
- Zhao, Y.Z.; Cao, J.N.; Zhang, X.D.; He, G.B. Topographic gradient effect and spatial pattern of land use in Baota District. Arid. Land Geogr. 2020, 43, 1307–1315. [Google Scholar]
- Zhang, L.; Wang, P.; Duan, X.; Zhao, Z.J. Terrain gradient effect and spatial structure characteristics of land use in Dashanbao area. Bull. Soil Water Conserv. 2022, 42, 315–321. [Google Scholar]
- Li, P.J.; Zuo, D.P.; Xu, Z.X.; Gao, X.X. Land use/cover and landscape patterns based on terrain in the Yarlung Tsangpo River basin, China. Mt. Res. 2022, 40, 136–150. [Google Scholar]
- Yang, Y.L.; Ma, M.G.; Zhou, Z.Y. Research on land use patterns and temporal and spatial evolution in mountainous watershed based on topographic gradient. Eng. Surv. Mapp. 2017, 26, 8–16. [Google Scholar]
- Shi, Y.; Han, R.; Guo, L. Temporal–spatial distribution of ecosystem health and its response to human interference based on different terrain gradients: A case study in Gannan, China. Sustainability 2020, 12, 1773. [Google Scholar] [CrossRef] [Green Version]
- Xiong, L.; Bai, X.Y.; Zhao, C.W.; Li, Y.B.; Tan, Q.; Luo, G.J.; Wu, L.H.; Chen, F.; Li, C.J.; Ran, C.; et al. High-resolution datasets for global carbonate and silicate rock weathering carbon sinks and their change trends. Earth’s Future 2022, 10, e2022EF002746. [Google Scholar] [CrossRef]
- Wang, Q.M.; Yang, K.; Li, L.X.; Zhu, Y.H. Assessing the terrain gradient effect of landscape ecological risk in the Dianchi Lake Basin of China Using Geo-Information Tupu Method. Int. J. Environ. Res. Public Health 2022, 19, 9634. [Google Scholar] [CrossRef]
- Liao, Y.M.; Yin, L.J.; Lan, A.J.; Zhai, X.; Shi, H.J.; Zhang, Y.B.; Zhong, J.S. Analysis of terrain gradient effect on land use change under different landforms in poor mountainous areas of northwest Guizhou. Ecol. Sci. 2023, 42, 111–118. [Google Scholar]
- Zhai, X.; Lan, A.J.; Liao, Y.M.; Mao, C.Y.; Zhong, J.S. Influence of terrain gradient on the spatio-temporal characteristics of land use pattern: Taking Bijie City as an example. J. Natrual Sci. Hunan Norm. Univ. 2022, 45, 70–80. [Google Scholar]
- Zhang, H.; Li, Y.B. Coupling and coordinated evolution between land-use and landscape in mountain-basin system in the context of rural transformation: A case study of six mountain-basin systems in Guizhou province, China. Mt. Res. 2021, 39, 248–261. [Google Scholar]
- Wu, L.; Xie, B.G.; Xiao, X.; Xue, B.; Li, J.Z. Classification method and determination of mountainous area types at township scales: A case study of Yuxi City, Yunnan Province. Complexity 2020, 2020, 3484568. [Google Scholar] [CrossRef]
- Li, Y.B.; Chen, H.; Luo, G.J. Spatial distribution of different scale flatland in Guizhou Province, China. Sci. Geogr. Sin. 2019, 39, 1830–1840. [Google Scholar]
- Li, Y.; Yao, Y.; Xie, J.; Wang, F.; Bai, X. Spatial-temporal evolution of land use and landscape pattern of the mountainbasin system in Guizhou Province. Acta Ecol. Sin. 2014, 34, 3257–3265. [Google Scholar]
- Wu, L.; Li, Z.H.; Zhang, Y.; Xie, B.G. Complex behavior analysis of a fractional-order land dynamical model with holling-II type land reclamation rate on time delay. Discret. Dyn. Nat. Soc. 2020, 2020, 1–10. [Google Scholar] [CrossRef]
- Feng, Y.Y.; Zhao, Y.L.; Xue, C.L.; Wei, X.F. Differentiation characteristics and optimization of mountain basin lands suitable for contrstructions: A case study of Guiyang City. J. Nat. Sci. Hunan Norm. Univ. 2021, 44, 21–29. [Google Scholar]
- Wu, L.; Xie, B.G. The variation differences of cultivated land ecological security between flatland and mountainous areas based on LUCC. PLoS ONE 2019, 14, e0220747. [Google Scholar] [CrossRef] [Green Version]
- Zhong, X.H.; Liu, S.Z. Research on the mountain classification in China. Mt. Res. 2014, 32, 129–140. [Google Scholar]
- Wang, X.J.; Liu, G.X.; Xiang, A.C.; Xiao, S.M.; Lin, D.R.; Lin, Y.B.; Lu, Y. Terrain gradient response of landscape ecological environment to land use and land cover change in the hilly watershed in South China. Ecol. Indic. 2023, 146, 109797. [Google Scholar] [CrossRef]
- Ding, Z.Q.; Hua, H.L.; Wang, P.; Li, Y.H. Land use change geo-spectrum and its topographic gradient effect in the core areas of Hani Terraces, a World Heritage Site. Trans. Chin. Soc. Agric. Eng. 2021, 37, 225–234. [Google Scholar]
- Zhang, X.B.; Luo, J.; Shi, P.J.; Zhou, L. Spatial-temporal evolution pattern and terrain gradient differentiation of ecosystem service value in Zhangye, Northwest China at the grid scale. Chin. J. Appl. Ecol. 2020, 31, 543–553. [Google Scholar]
- Tian, R.Y.; Wang, Y.K.; Fu, B.; Liu, Y. DEM-based topographic unit diversity index and its algorithm. Prog. Geogr. 2013, 32, 121–129. [Google Scholar]
- Yang, H.J.; Gou, X.H.; Xue, B.; Ma, W.J.; Kuang, W.N.; Tu, Z.Y.; Gao, L.L.; Yin, D.C.; Zhang, J.Z. Research on the change of alpine ecosystem service value and its sustainable development path. Ecol. Indic. 2023, 146, 109893. [Google Scholar] [CrossRef]
- Zhou, Z.; Quan, B.; Deng, Z.W. Effects of land use changes on ecosystem service value in Xiangjiang River Basin, China. Sustainability 2023, 15, 2492. [Google Scholar] [CrossRef]
- Zhang, Z.M.; Huang, X.F.; Zhou, Y.C. Factors influencing the evolution of human-driven rocky desertification in karst areas. Land Degrad. Dev. 2020, 32, 817–829. [Google Scholar] [CrossRef]
- Wang, L.J.; Ma, S.; Jiang, J.; Zhao, Y.G.; Zhang, J.C. Spatiotemporal variation in ecosystem services and their drivers among different landscape heterogeneity units and terrain gradients in the Southern Hill and Mountain Belt, China. Remote Sens. 2021, 13, 1375. [Google Scholar] [CrossRef]
- Liu, M.; Bai, X.Y.; Tan, Q.; Luo, G.J.; Zhao, C.W.; Wu, L.H.; Luo, X.L. Climate change enhances the positive contribution of human activities to vegetation restoration in China. Geocarto Int. 2022, 37, 2082542. [Google Scholar] [CrossRef]
- Fang, B.K.; Li, X.D.; Cheng, D.Y. Study on land use change of karst trough valley based on terrain differentiation. Ecol. Sci. 2022, 41, 142–150. [Google Scholar]
- Huang, X.; Liu, J.; Peng, S.Y.; Huang, B.M. The impact of multi-scenario land use change on the water conservation in central Yunnan urban agglomeration, China. Ecol. Indic. 2023, 147, 109922. [Google Scholar] [CrossRef]
- Wang, X.X.; Peng, L.; Liu, S.J.; Wei, Y.Y. Characteristics and the driving mechanism of urban construction land expansion in mountainous areas of southwest China. Chin. J. Ecol. 2021, 40, 2895–2903. [Google Scholar]
- Wang, F.L.; Fu, W.; Chen, J.C. Spatial–temporal evolution of ecosystem service value in Yunnan Based on Land Use. Land 2022, 11, 2217. [Google Scholar] [CrossRef]
- Yi, F.; Yang, Q.K.; Wang, Z.J.; Li, Y.H.; Cheng, L.L.; Yao, B.; Lu, Q. Changes in land use and ecosystem service values of Dunhuang Oasis from 1990 to 2030. Remote Sens. 2023, 15, 564. [Google Scholar] [CrossRef]
- Guo, L.Y.; Wang, D.L.; Qiu, J.J.; Li, G.W.; Yu, L. Spatio-temporal patterns of land use change along the Bohai Rim in China during 1985–2005. J. Geogr. Sci. 2009, 19, 568–576. [Google Scholar] [CrossRef]
- Tian, Y.J.; Li, X.B.; Ma, G.X.; Hao, H.G. Influences of labor emigration from agriculture on the production abandonment of cultivated land in ecological sensitive areas. China Land Sci. 2010, 24, 4–9. [Google Scholar]
- Li, C.J.; Bai, X.Y.; Tan, Q.; Luo, G.J.; Wu, L.H.; Chen, F.; Xi, H.P.; Luo, X.L.; Ran, C.; Chen, H.; et al. High-resolution mapping of the global silicate weathering carbon sink and its long-term changes. Glob. Chang. Biol. 2022, 28, 4377–4394. [Google Scholar] [CrossRef]
- Gong, Q.Q.; Sun, P.L.; Liu, Q.G.; Mo, J.X. Topographical gradient characteristics of land-use changes in the Agro-Pastoral Ecotone of Northern China. Land 2022, 11, 2195. [Google Scholar] [CrossRef]
Figure 1.
The geographical location and characteristics of the study area: (a) the location of Yunnan Province in China; (b) the location of Yuxi in Yunnan Province; (c) the elevation and landforms of Yuxi City.
Figure 1.
The geographical location and characteristics of the study area: (a) the location of Yunnan Province in China; (b) the location of Yuxi in Yunnan Province; (c) the elevation and landforms of Yuxi City.

Figure 2.
LULC distribution and area statistics in the mountains. (a–c) LULC distribution from 2000 to 2020. (d) Area statistics. LULC types include cultivated land (CL), forestland (FL), grassland (GL), wetland (WL), water bodies (WB) and build-up land (BL).
Figure 2.
LULC distribution and area statistics in the mountains. (a–c) LULC distribution from 2000 to 2020. (d) Area statistics. LULC types include cultivated land (CL), forestland (FL), grassland (GL), wetland (WL), water bodies (WB) and build-up land (BL).
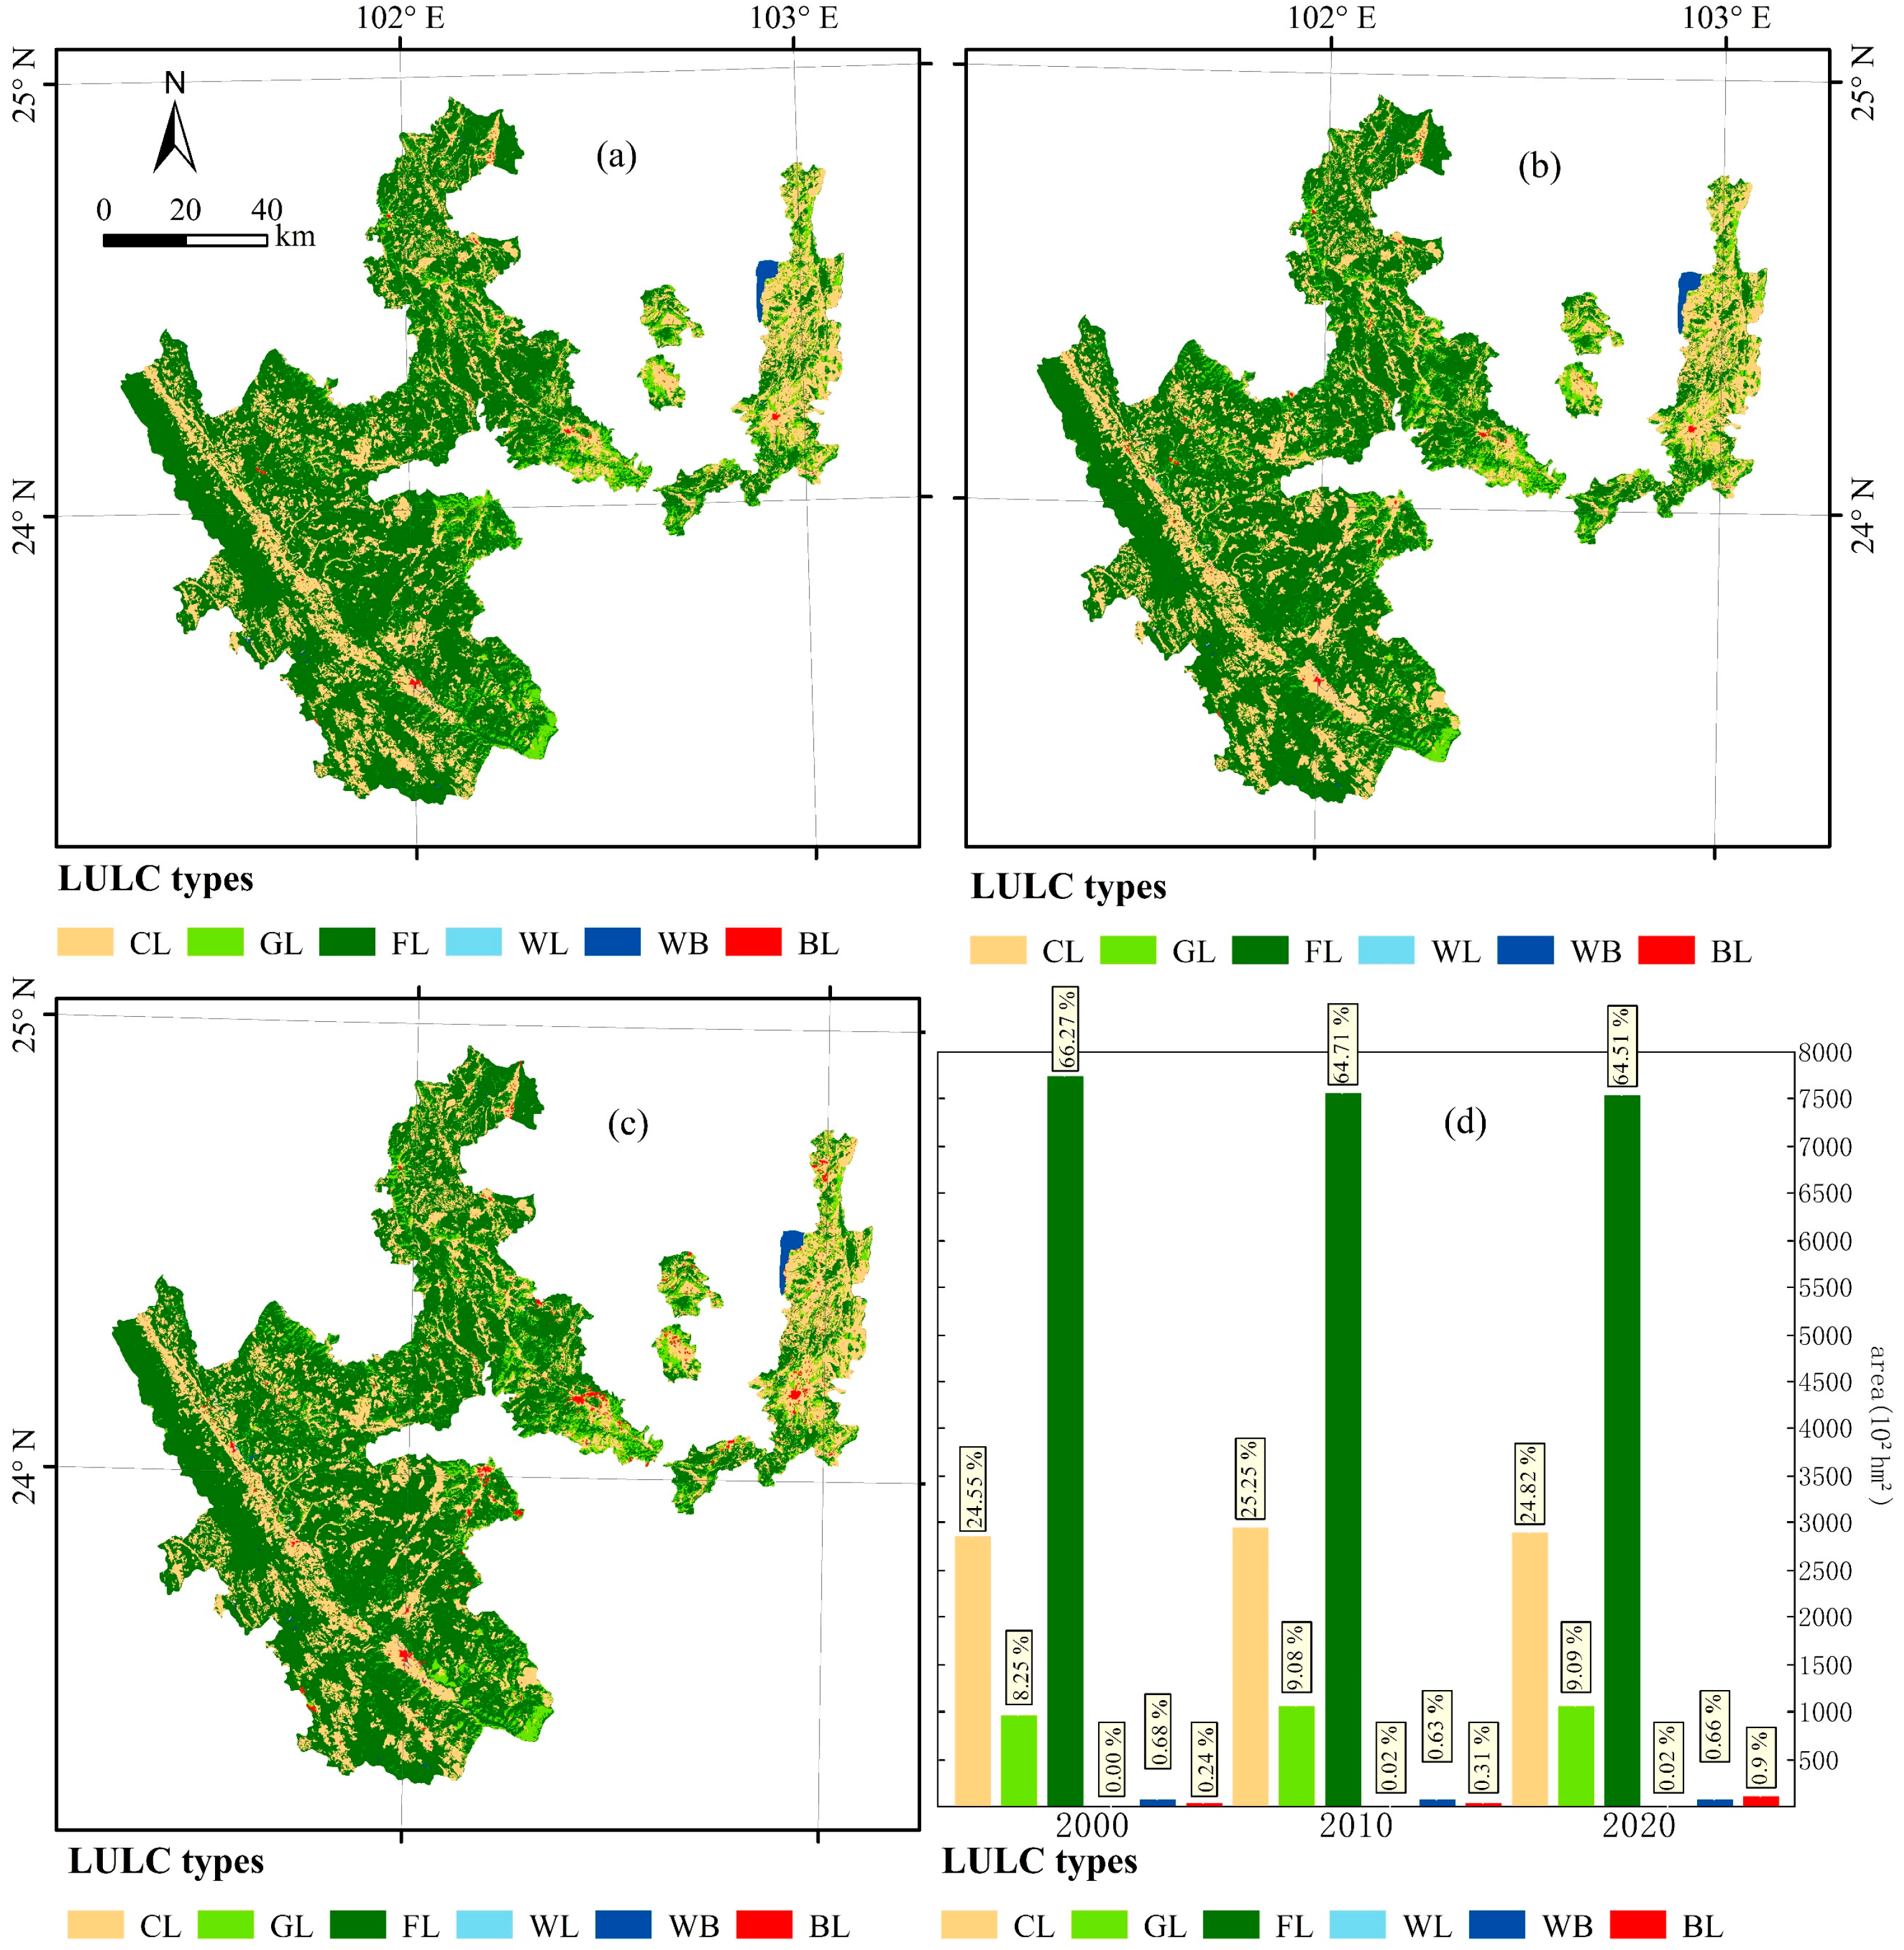
Figure 3.
LULC distribution and area statistics in the flatlands. (a–c) LULC distribution from 2000 to 2020. (d) Area statistics.
Figure 3.
LULC distribution and area statistics in the flatlands. (a–c) LULC distribution from 2000 to 2020. (d) Area statistics.
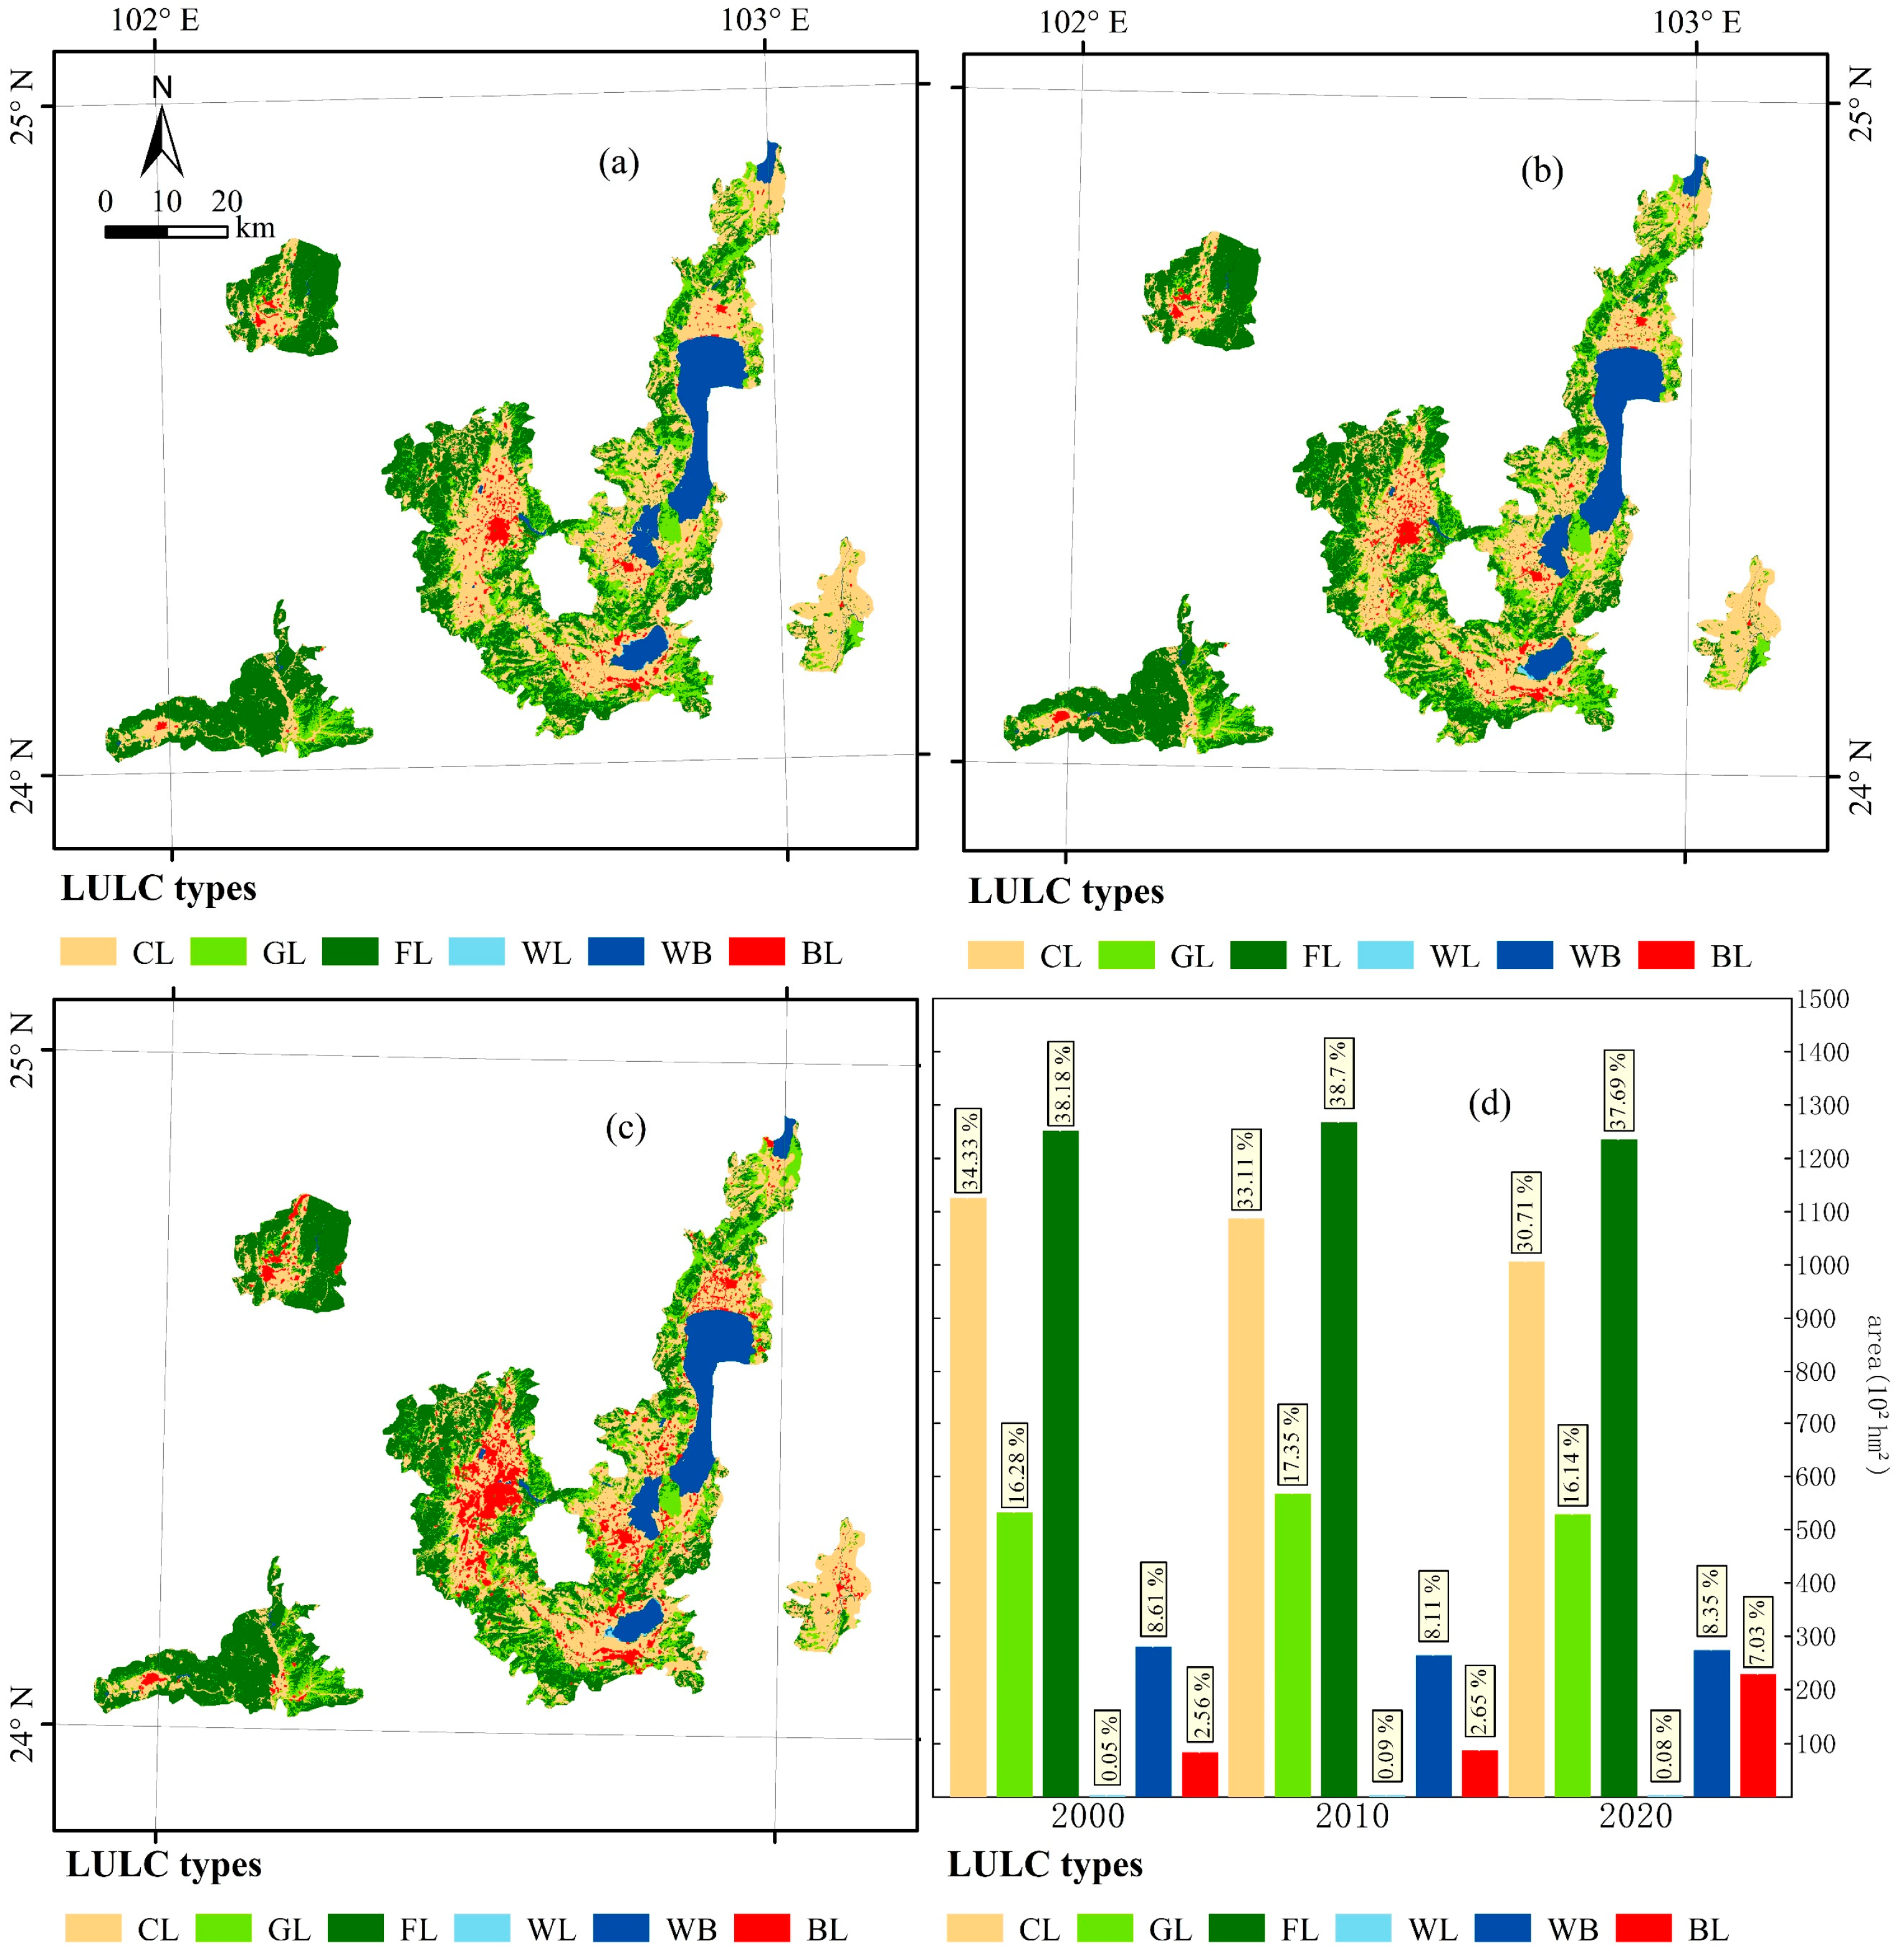
Figure 4.
LULC change in the mountains from 2000 to 2020. (a–c) LULC transfer chord diagram from 2000 to 2010, from 2010 to 2020 and from 2000 to 2020, respectively. (d) LULC change characteristic map from 2000 to 2020.
Figure 4.
LULC change in the mountains from 2000 to 2020. (a–c) LULC transfer chord diagram from 2000 to 2010, from 2010 to 2020 and from 2000 to 2020, respectively. (d) LULC change characteristic map from 2000 to 2020.

Figure 5.
LULC change in the flatlands from 2000 to 2020. (a–c) LULC transfer chord diagram from 2000 to 2010, from 2010 to 2020 and from 2000 to 2020, respectively. (d) LULC change characteristic map from 2000 to 2020.
Figure 5.
LULC change in the flatlands from 2000 to 2020. (a–c) LULC transfer chord diagram from 2000 to 2010, from 2010 to 2020 and from 2000 to 2020, respectively. (d) LULC change characteristic map from 2000 to 2020.
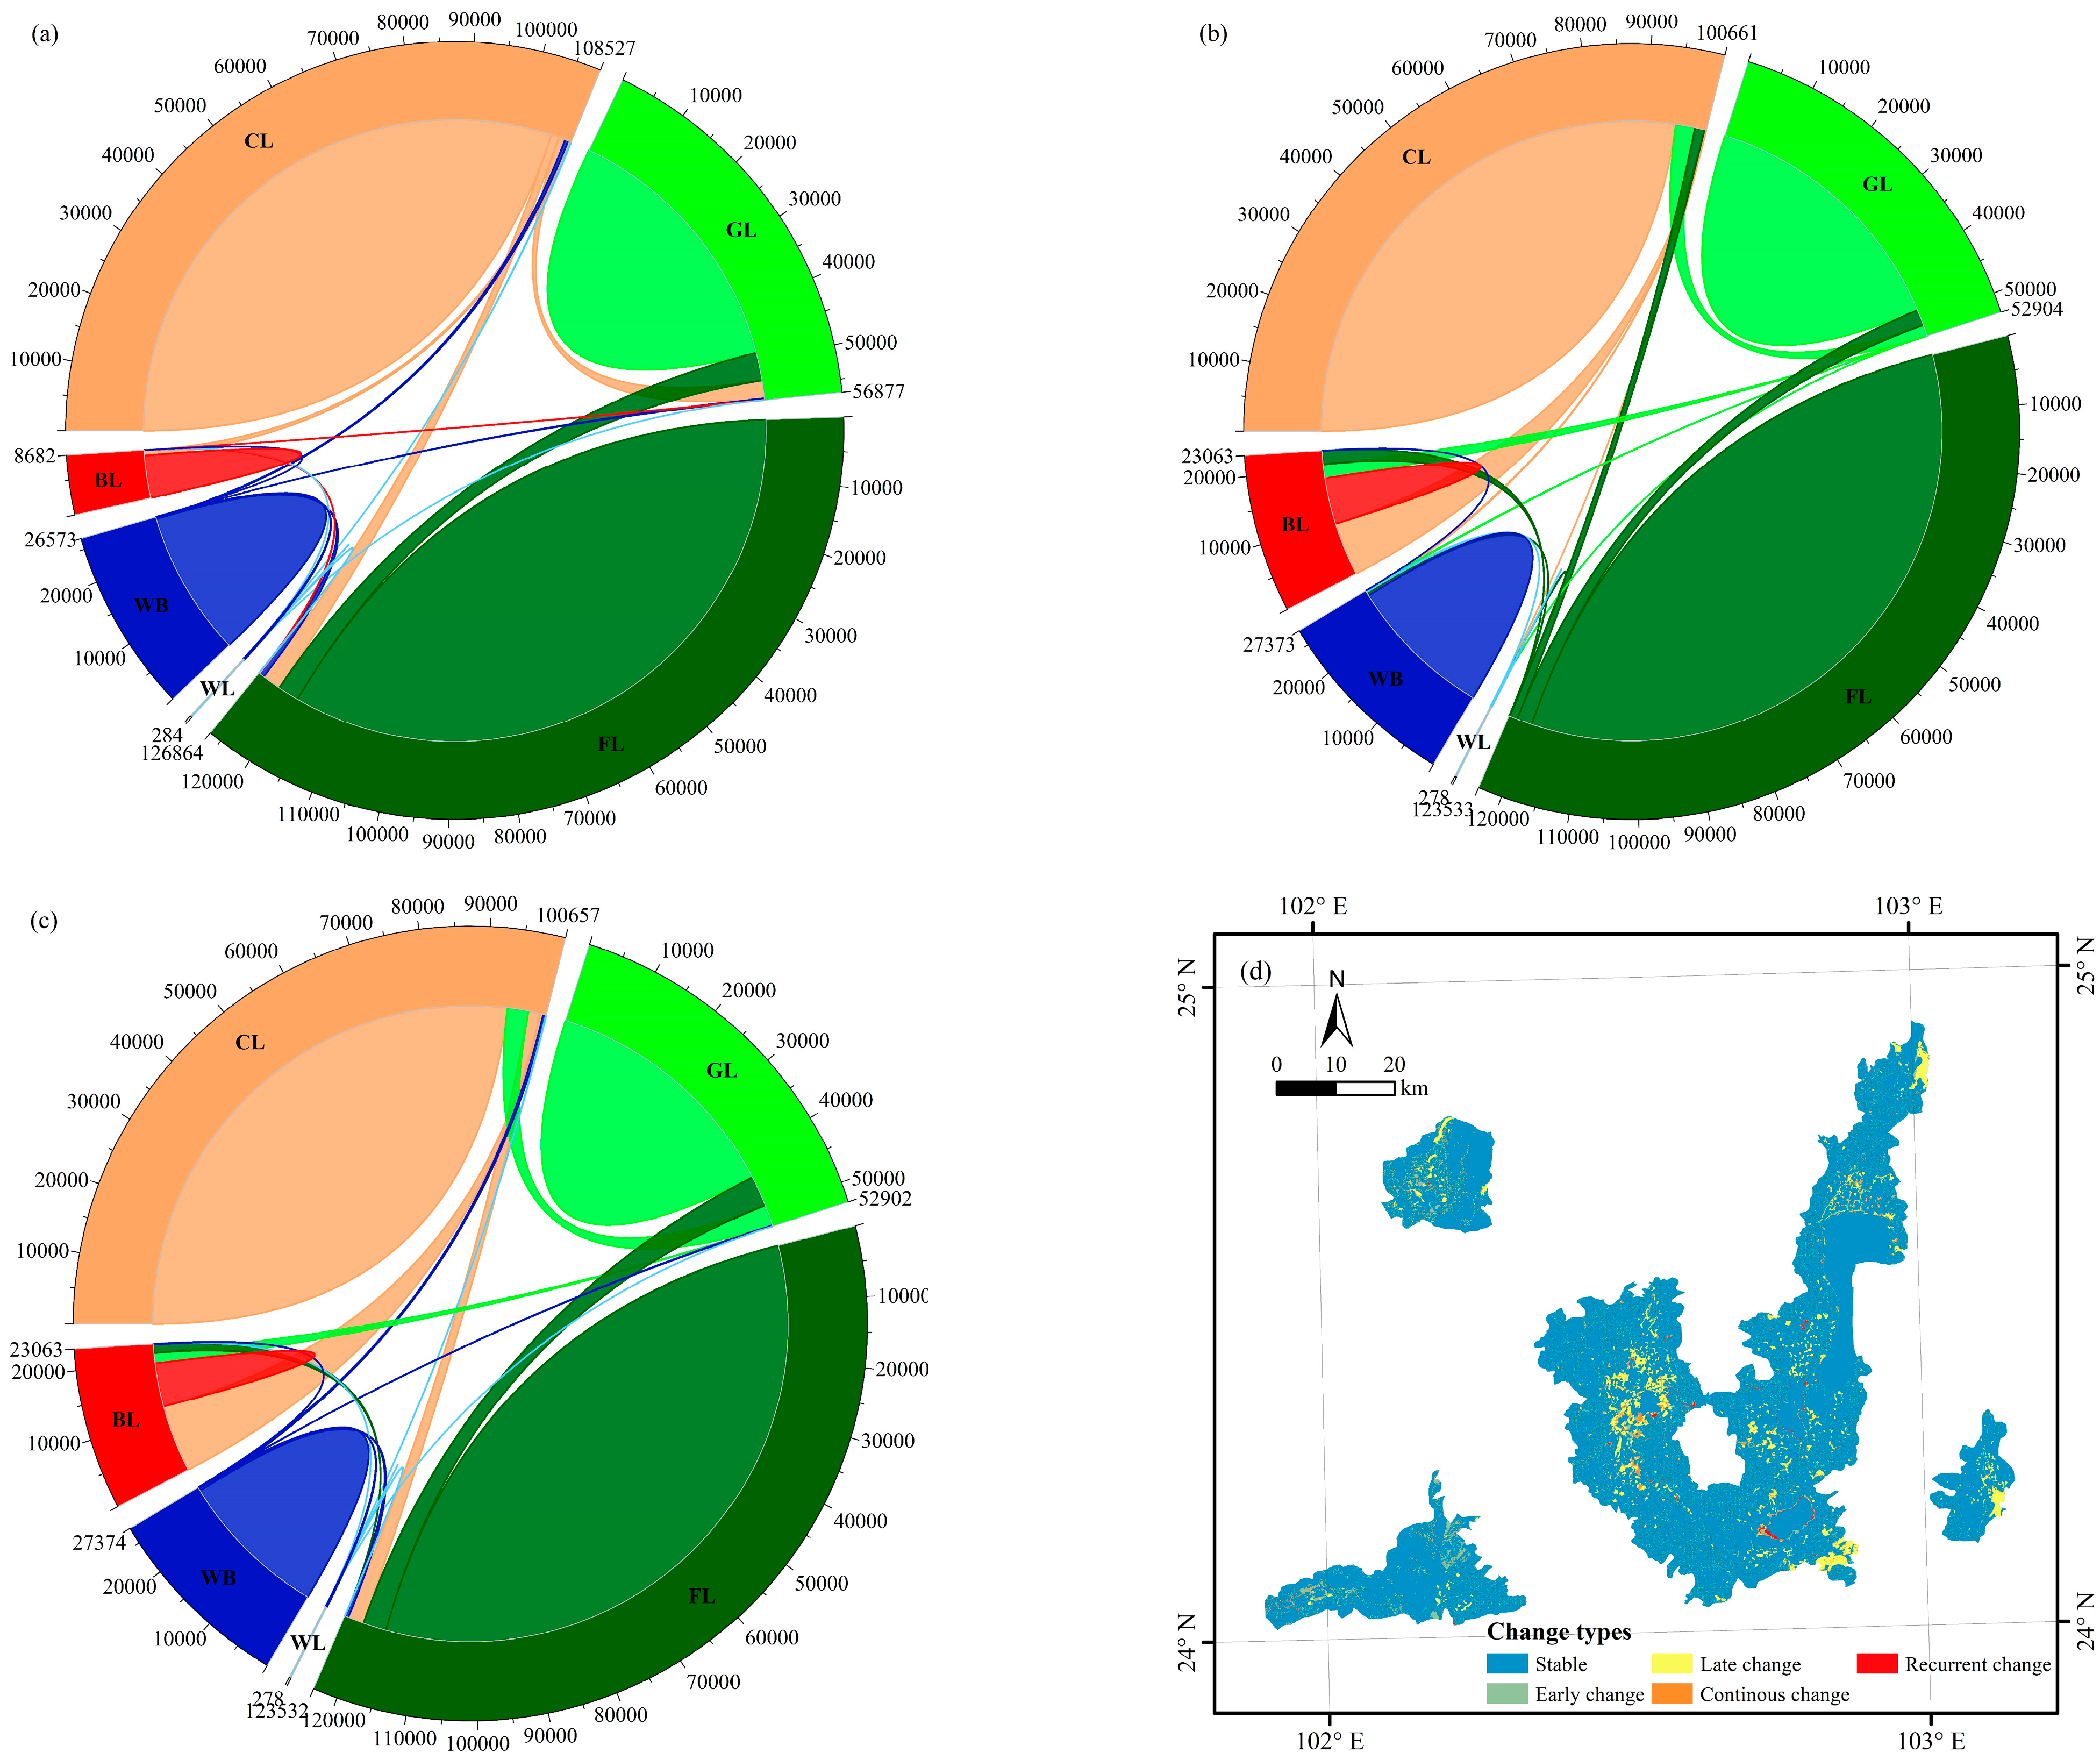
Figure 6.
Spatial distribution of topographic features: (a) elevation; (b) slope; (c) relief; (d) terrain position.
Figure 6.
Spatial distribution of topographic features: (a) elevation; (b) slope; (c) relief; (d) terrain position.
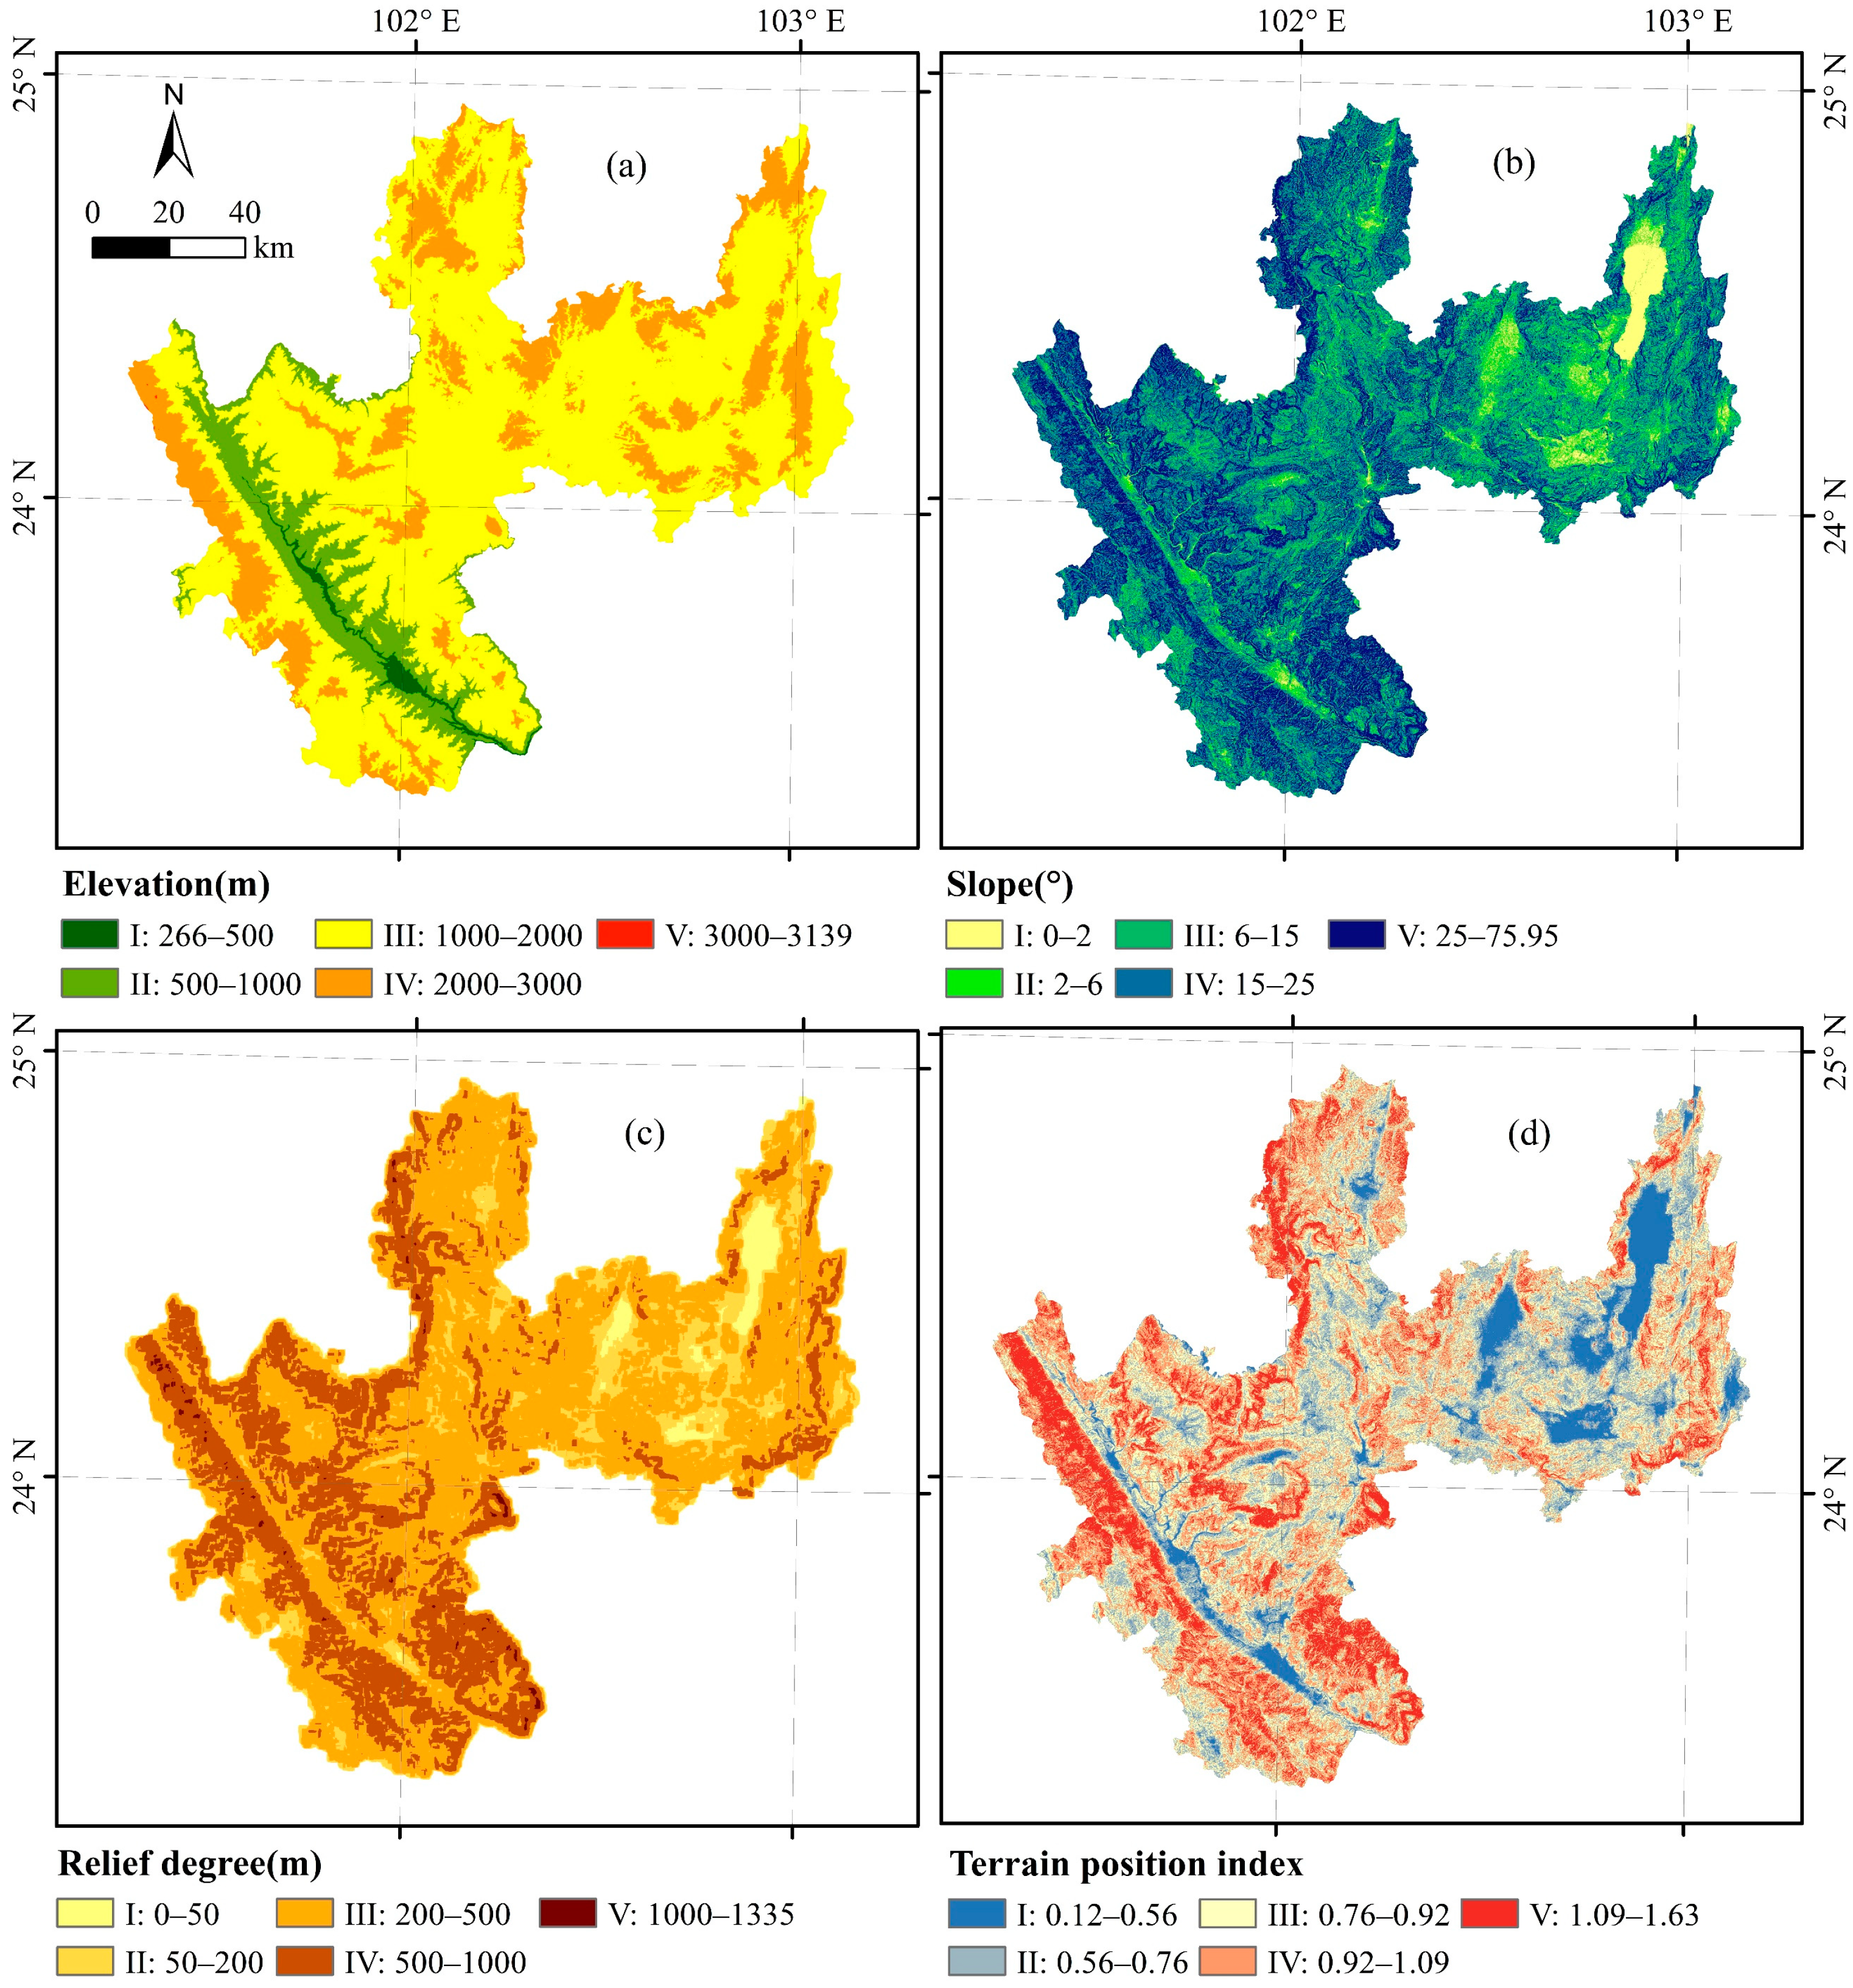
Figure 7.
Distribution index of land use types on the topographic gradient in the mountains: (a–c) LULC distribution index for different topographic gradients in 2000, 2010 and 2020, respectively; (d) LULC distribution index for different topographic gradients in the three years.
Figure 7.
Distribution index of land use types on the topographic gradient in the mountains: (a–c) LULC distribution index for different topographic gradients in 2000, 2010 and 2020, respectively; (d) LULC distribution index for different topographic gradients in the three years.
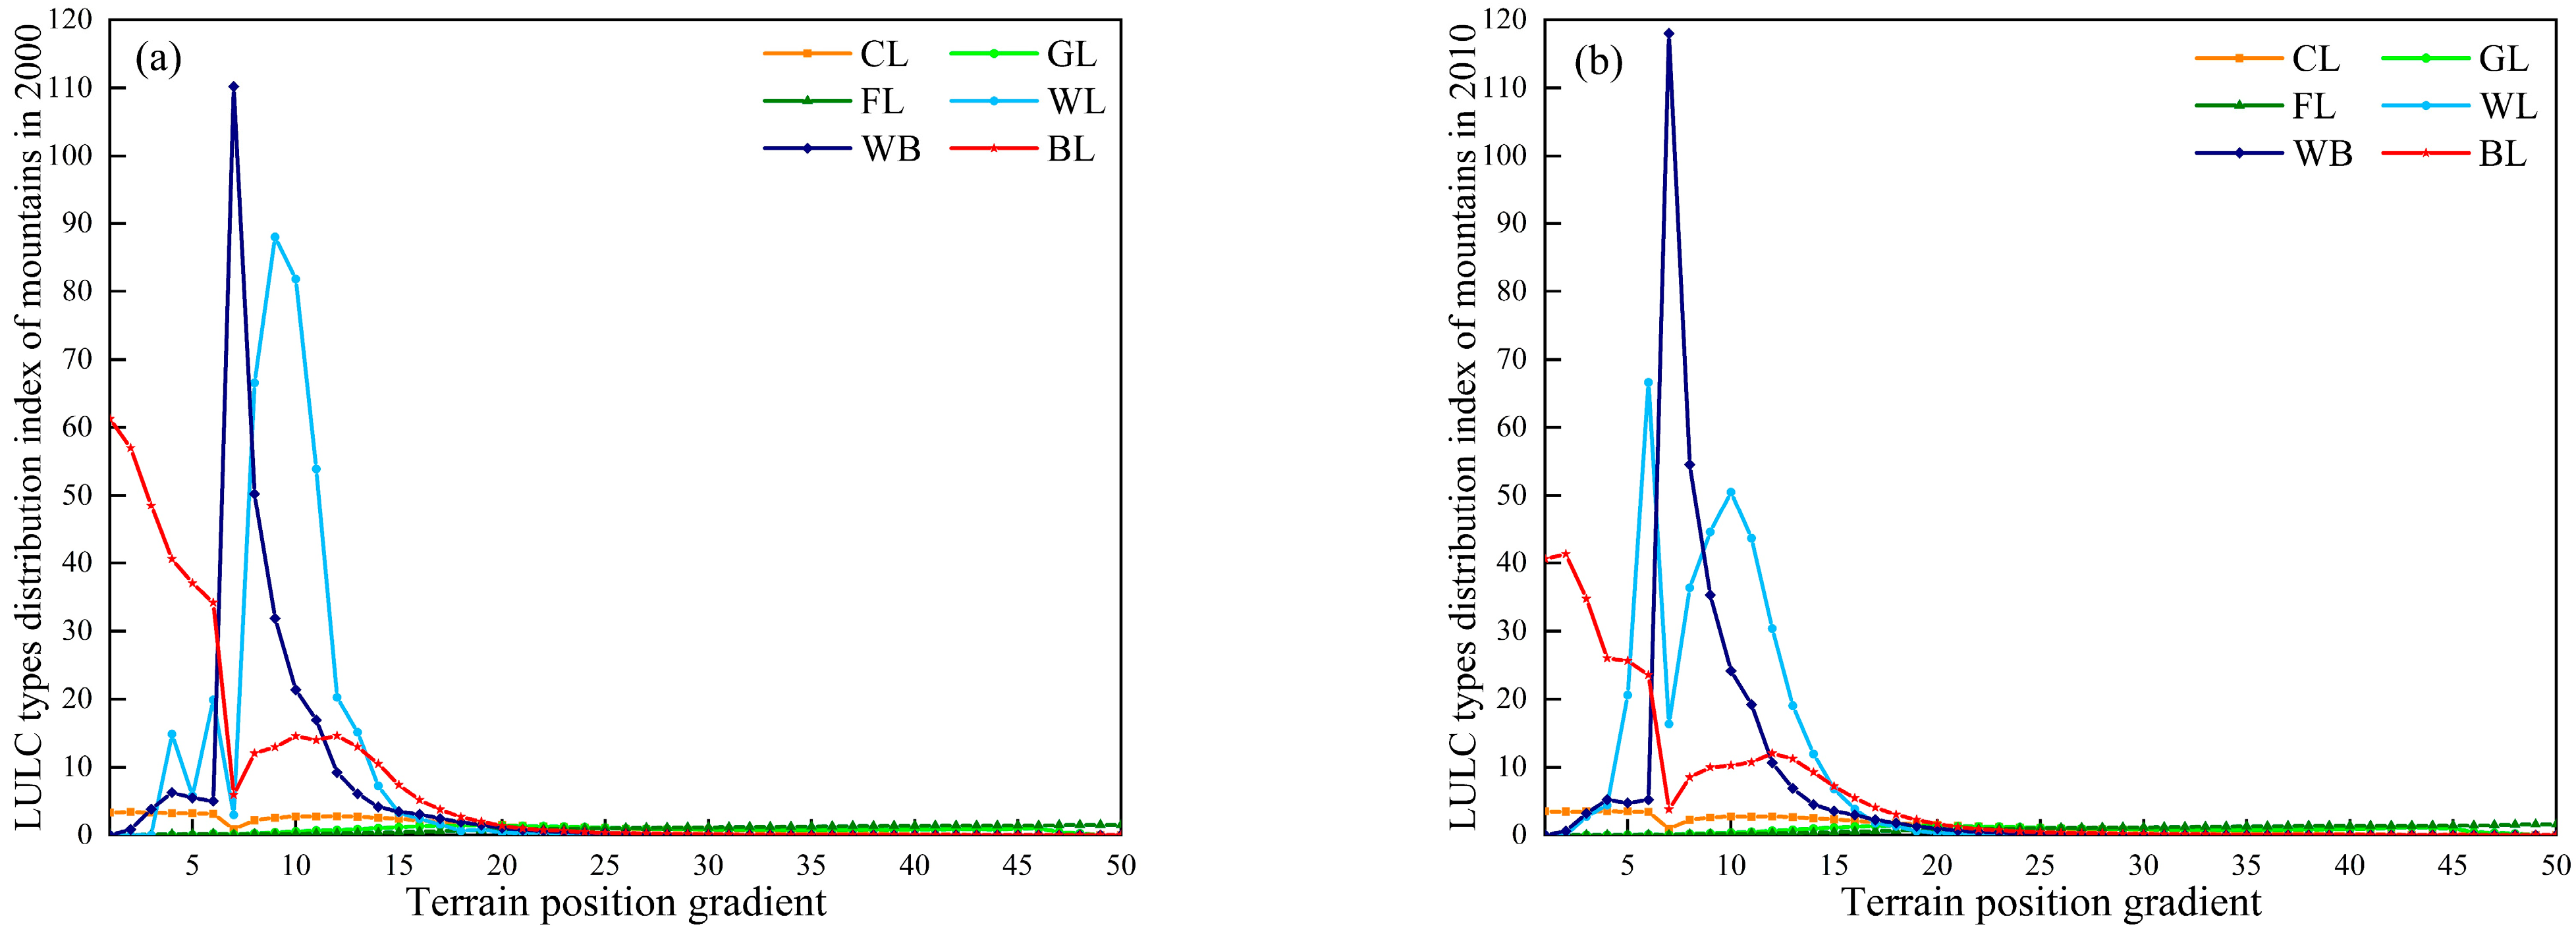
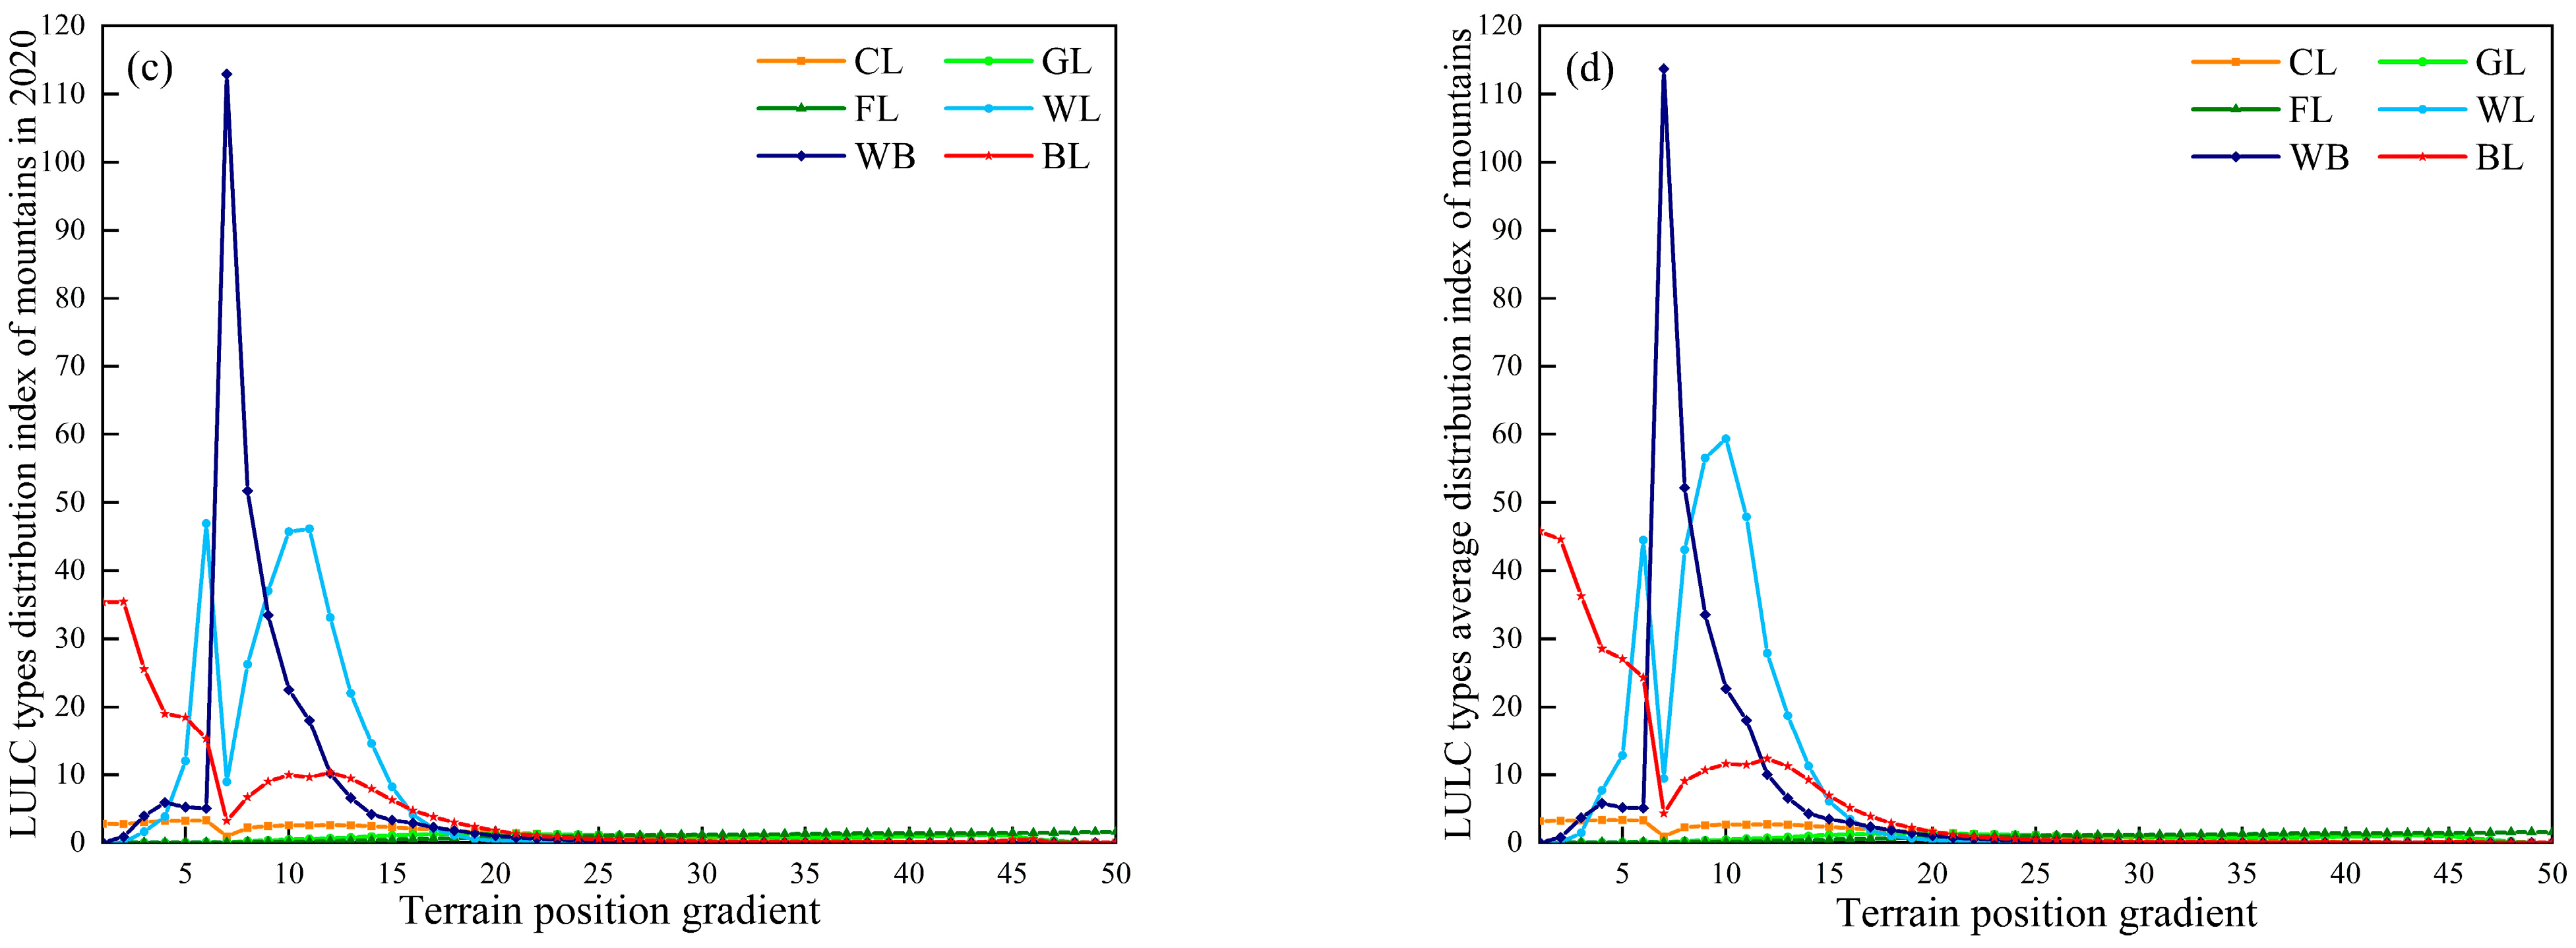
Figure 8.
Distribution index of land use types on the topographic gradient in the flatlands: (a–c) LULC distribution index for different topographic gradients in 2000, 2010 and 2020, respectively; (d) LULC distribution index for different topographic gradients in the three years.
Figure 8.
Distribution index of land use types on the topographic gradient in the flatlands: (a–c) LULC distribution index for different topographic gradients in 2000, 2010 and 2020, respectively; (d) LULC distribution index for different topographic gradients in the three years.
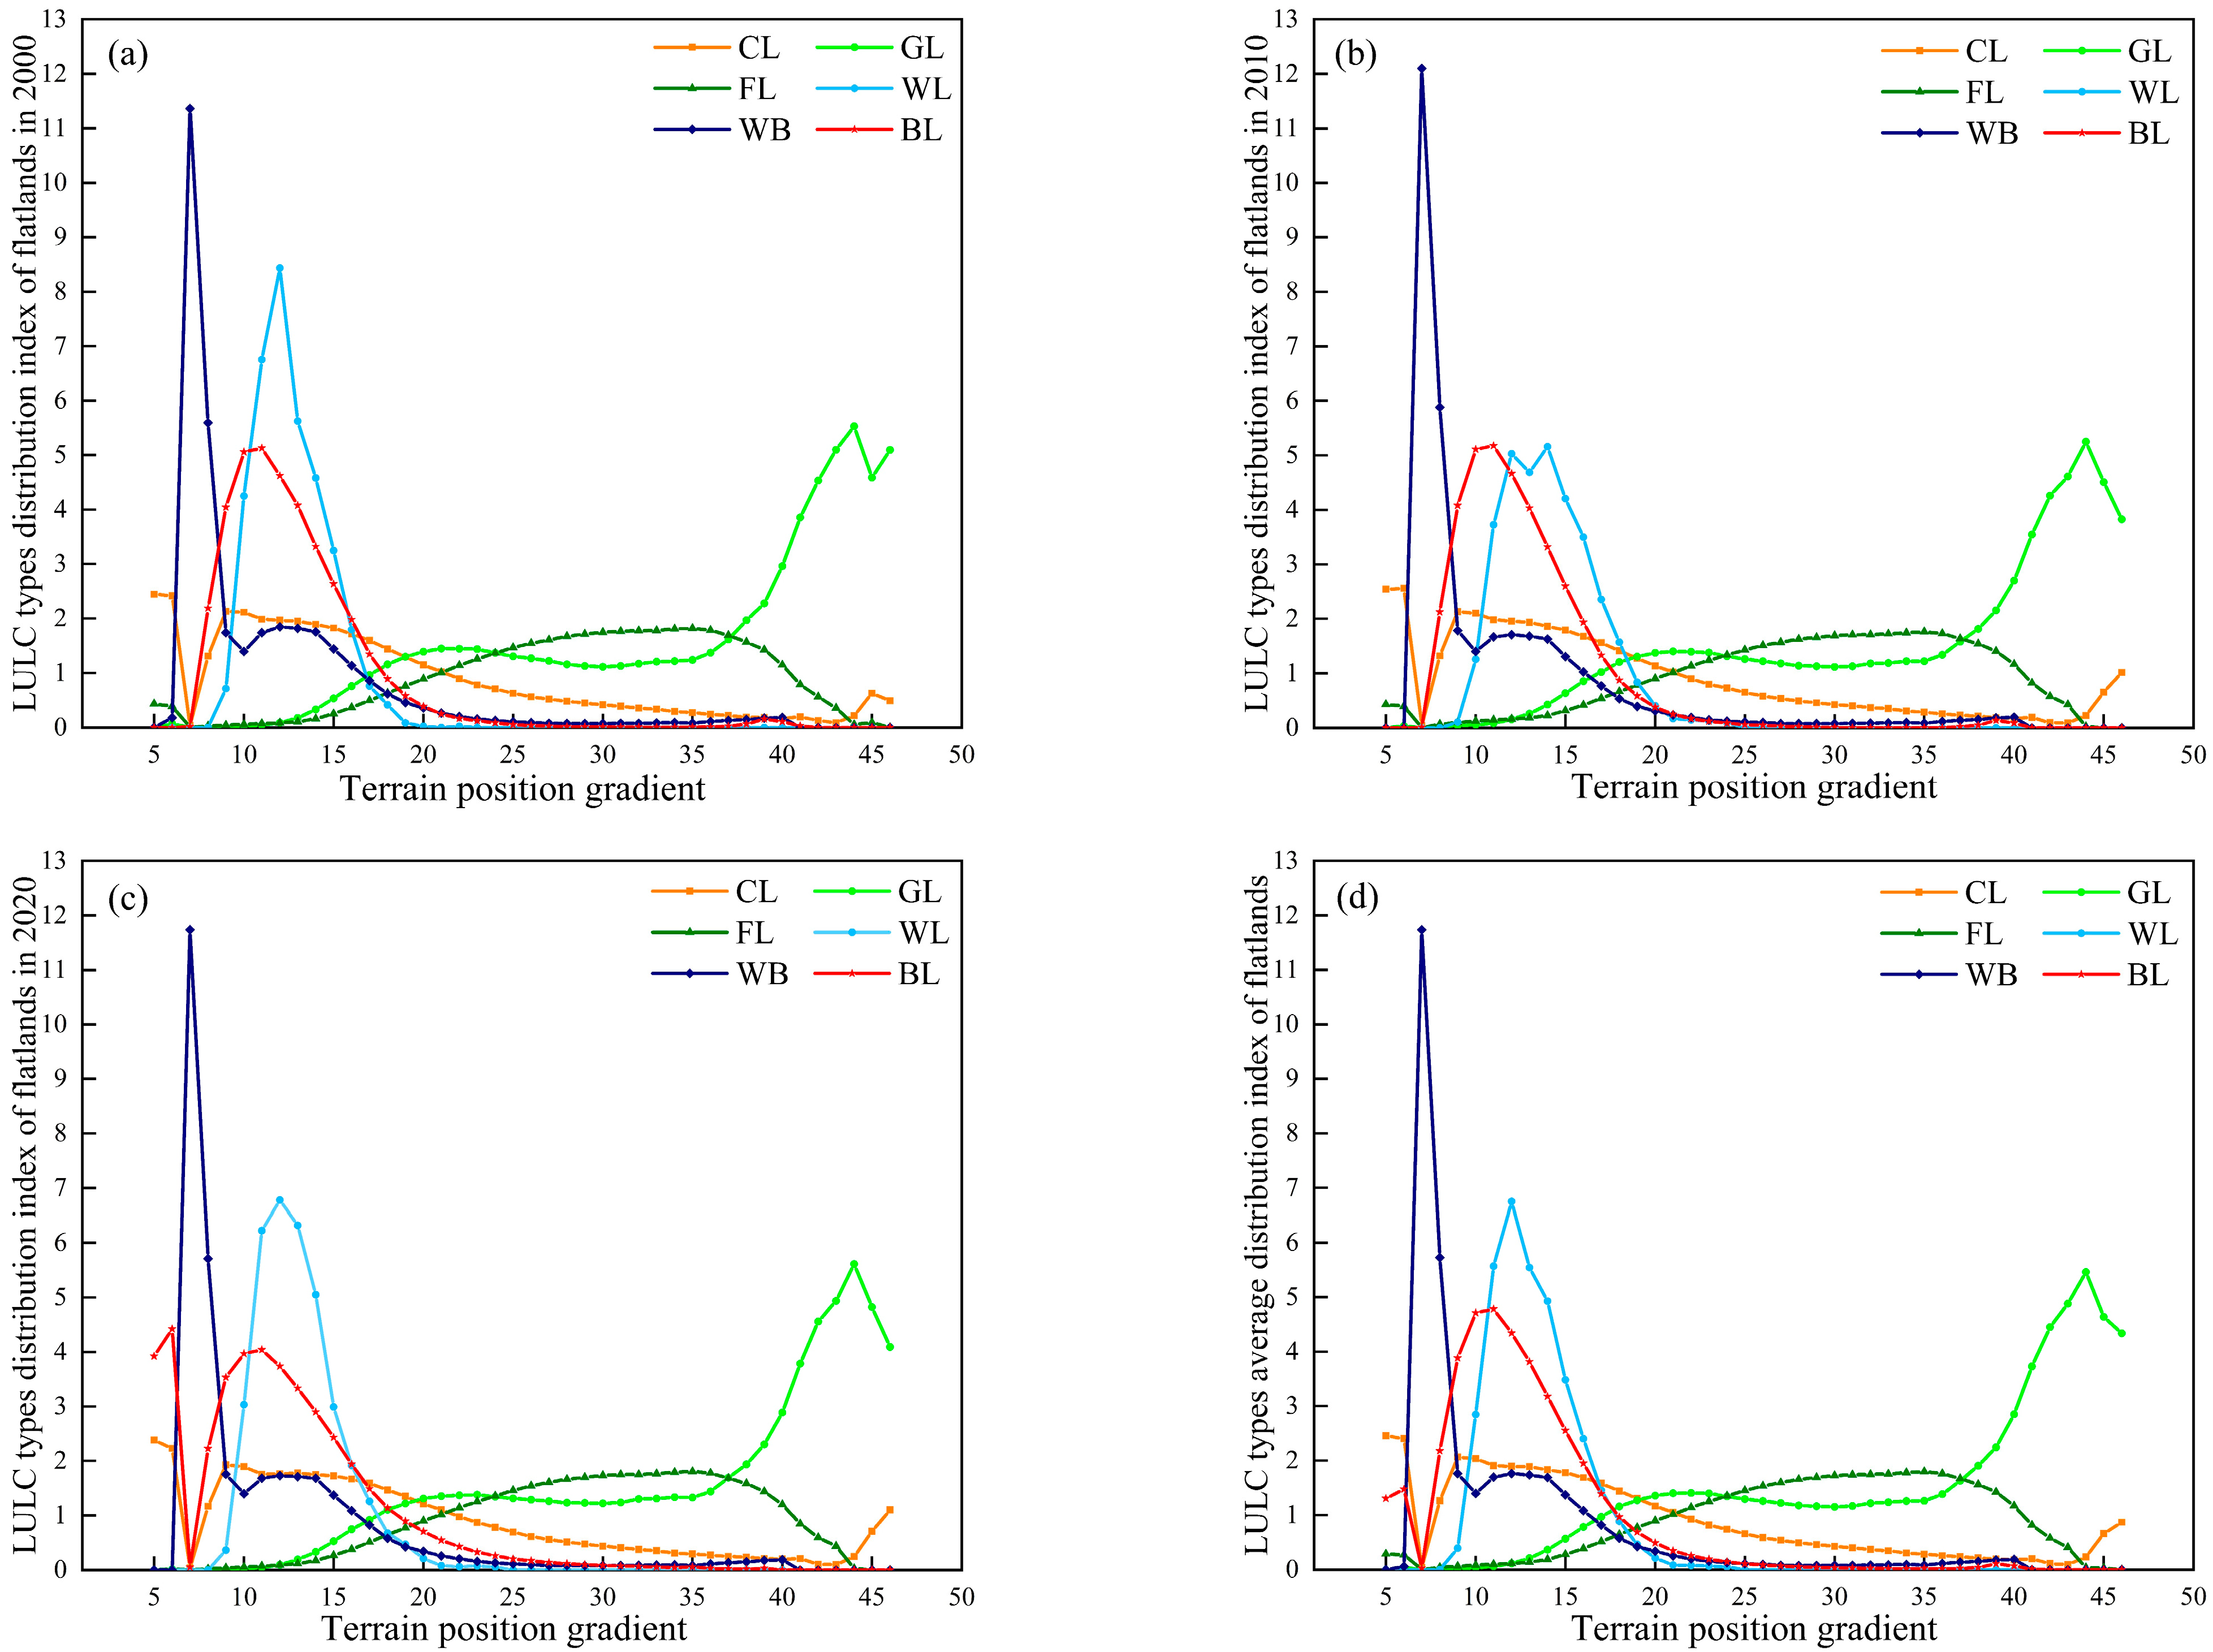
Figure 9.
Diversity indices of land use types on different topographic gradients: (a) Land use diversity index of different topographic gradients in the mountains; (b) Land use diversity index of different topographic gradients in the flatlands.
Figure 9.
Diversity indices of land use types on different topographic gradients: (a) Land use diversity index of different topographic gradients in the mountains; (b) Land use diversity index of different topographic gradients in the flatlands.
Disclaimer/Publisher’s Note: The statements, opinions and data contained in all publications are solely those of the individual author(s) and contributor(s) and not of MDPI and/or the editor(s). MDPI and/or the editor(s) disclaim responsibility for any injury to people or property resulting from any ideas, methods, instructions or products referred to in the content. |
© 2023 by the authors. Licensee MDPI, Basel, Switzerland. This article is an open access article distributed under the terms and conditions of the Creative Commons Attribution (CC BY) license (https://creativecommons.org/licenses/by/4.0/).
Share and Cite
MDPI and ACS Style
Wu, L.; Yang, Y.; Yang, H.; Xie, B.; Luo, W. A Comparative Study on Land Use/Land Cover Change and Topographic Gradient Effect between Mountains and Flatlands of Southwest China. Land 2023, 12, 1242. https://doi.org/10.3390/land12061242
AMA Style
Wu L, Yang Y, Yang H, Xie B, Luo W. A Comparative Study on Land Use/Land Cover Change and Topographic Gradient Effect between Mountains and Flatlands of Southwest China. Land. 2023; 12(6):1242. https://doi.org/10.3390/land12061242
Chicago/Turabian StyleWu, Li, Yanjun Yang, Hailan Yang, Binggeng Xie, and Weiqun Luo. 2023. "A Comparative Study on Land Use/Land Cover Change and Topographic Gradient Effect between Mountains and Flatlands of Southwest China" Land 12, no. 6: 1242. https://doi.org/10.3390/land12061242
Note that from the first issue of 2016, this journal uses article numbers instead of page numbers. See further details here.