
Soil Quality Mediates the Corn Yield in a Thin-Layer Mollisol in Northeast China

1
State Key Laboratory of Soil and Sustainable Agriculture, Institute of Soil Science, Chinese Academy of Sciences, Nanjing 210008, China
2
College of Earth Sciences, Guilin University of Technology, Guilin 541004, China
3
University of Chinese Academy of Sciences, Beijing 100049, China
4
School of Resources and Environment, Northeast Agricultural University, Harbin 150030, China
*
Author to whom correspondence should be addressed.
Land 2023, 12(6), 1187; https://doi.org/10.3390/land12061187
Submission received: 14 April 2023
/
Revised: 23 May 2023
/
Accepted: 3 June 2023
/
Published: 6 June 2023
(This article belongs to the Special Issue New Insights in Mollisol Quality and Management)
Abstract
:Soil quality (SQ) is critical to sustainable agricultural development. It is sensitive to the crop yield, especially in thin-layer black-soil regions, which have experienced severe degradation in recent years. However, how to evaluate the SQ and its influence on land productivity is not clear in regions with thin black-soil coverage. Therefore, an integrated soil quality index (SQI) was constructed using diverse datasets along a 30 km transect in a typical thin-layer black-soil region of China. The results showed that obvious soil degradation was observed in this area. Black-soil thickness (BST), soil organic matter (SOM), and the total nitrogen (TN) content were the most strongly correlated with corn yield among the 13 investigated indexes, with Pearson coefficients of 0.65, 0.39 and 0.34, respectively. The minimum-dataset-based SQI using six soil properties within 0–30 cm was the optimal solution for SQ evaluation in the study area. The good performance of the established SQI using the optimal method was supported by its strong correlation with the corn yield, with a Pearson coefficient and linear R2 of 0.75 and 0.56, respectively. The BST identified by differences in colour across the soil profile provided powerful information for the SQI, the value of which would be underestimated by 8% if this index were ignored. The linear R2 between the SQI and corn yield decreased from 0.56 to 0.49 when the BST index was removed. This study showed the significance of improving the SQ in thin-layer black-soil regions. The core of soil management is to prevent the losses of surface black soil and improve the SOM content in this region. These findings can help farmers and decision makers adopt proper measures to improve SQ and thereby crop yield.
1. Introduction
The black-soil region of Northeast China plays a critical role in national food security. As the most important grain production base, it contributes 20% of the grain and more than 40% of the maize in China [1]. As the typical soils of this region, mollisols are characterized by a black or dark colour, high soil fertility, and high productivity [2].
Mollisols in Northeast China have been experiencing severe degradation due to natural and anthropogenic factors [3,4]. This degradation is partly caused by land use conversions from natural forest or grassland to farmland during the past decades. However, unreasonable farming-system-induced anthropogenic degradation has played an increasingly important role in recent years. For example, intensive tillage and crop-residue removal has resulted in soil erosion [5] and dehumification [6] in the Chinese black-soil region. The average black-soil thickness (BST) has decreased from 60–70 cm in the 1950s to the current thickness of 20–30 cm [7]. The black-soil region has become the only region with decreasing soil organic matter (SOM) content in recent decades in China [8]. Black-soil degradation decreases the resistance of crop yields to extreme meteorological conditions [9,10], which is considered one of the necessary indicators of sustainable agricultural systems [11].
As one of the most important features of black-soil degradation, the BST varies considerably across the typical black-soil region of China. The topography contributes the most to the changes in BST at small hillslope and catchment scales [2]. However, the climate is the dominant factor affecting the variation in the BST at large scales [12,13]. The BST generally decreases from north to south in the black-soil region with changes in climate. Thus, the typical black-soil region was accordingly divided into thick- and thin-layer regions based on the BST, with a threshold of approximately 40 cm [14]. The average BST of the thick-layer region was approximately twice that of the thin-layer region. The degradation risk is therefore higher in thin-layer black-soil regions than in regions with deep black-soil coverage. Soil quality (SQ) is therefore likely more sensitive to land productivity in thin-layer regions.
The soil quality index (SQI) integrates the information related to the SQ. The determination of a proper SQI is critical for the development of a sustainable agricultural system [15,16]. However, the index system for the SQI is affected by a series of factors, including the target function of soils, the scaling of studies, and the methods to select datasets. The productivity function is definitely the first concern in the context of needing to feed an increasing population [16,17]. Soil indexes related to land productivity are therefore always employed in SQ evaluation for agricultural soils [18]. Due to the spatial variability of the soil attributes and the difference in studying scales, it is nearly impossible to identify a consistent SQ evaluation system across studies [19,20]. Generally, as more indexes are employed for the soil evaluation system, a more comprehensive SQ is reflected. However, a strong correlation among some soil indexes makes it unnecessary to collect all of the soil indexes. Therefore, many different methods have been employed to select the dataset for SQ evaluation. Among them, the total dataset (TDS), important dataset (IDS), and minimum dataset (MDS) are popular methods when soil indexes are selected [21,22,23]. Furthermore, sampling depths and depth intervals are inconsistent, even within the same study area, which makes the SQ evaluation system more complicated. Taking the number of selected indexes as an example, it decreased from twelve [24] to eight [25] and even to three [26], even when using the same index selection method. In addition, unfortunately, many studies on SQ evaluation in cultivated fields have not been linked to crop yield. Therefore, we hypothesized that an MDS-based SQI could account for the variations in corn yield in the thin-layer black-soil region.
Accordingly, in a typical thin-layer black-soil region, the SQ was evaluated based on a detailed investigation of the corn yield and 13 soil physical and chemical indexes at 62 sampling sites along a 31 km transect. The specific objectives were to (i) compare the performances of diverse methods and sampling strategies for SQ evaluation; and (ii) identify the critical indexes of the SQI through the linkage with the corn yield.
2. Materials and Methods
2.1. Study Area
This study was carried out in Lishu County (123°45′~124°53′ E, 42°49′~43°46′ N), Jilin Province, China. This area belongs to a temperate semi-humid continental monsoon climate, with annual average precipitation and potential evaporation of 573 and 808 mm, respectively. Temperature is one of the limiting factors affecting crop growth in this area. The annual average temperature is 5.9 °C, and the annual accumulated temperature higher than 10 °C is approximately 3078 °C. The study area is rainy and hot during the crop growing season. The abovementioned meteorological data were monitored at Lishu Station between 1986 and 2008. In recent years, the climate has changed considerably in the northeast of China, characterized by increasing precipitation and temperature. For example, in the past five years, from 2018 to 2022, the precipitation in the study area increased significantly by 17.6% to 674 mm, and the air temperature increased by 27.1% to 7.5 °C compared with the mean values from 1986 to 2008.
The study area belongs to a typical black-soil region, with a BST generally less than 40 cm. Therefore, this area has always been termed the thin-layer black-soil region. The area faces severe water and wind erosion caused by the combined factors of terrain, climate, and unreasonable agricultural activity. The study area plays an important role in China’s food security and is located in the centre of the Golden Corn Belt of China.
A 30 km transect (124°7′57″~124°30′10″ E, 43°20′9″~43°21′6″ N) with 5 slopes was chosen to evaluate the impacts of soil quality on corn yield. This sample scale was selected for two reasons. First, this moderate sampling scale avoids introducing more factors, such as climate features, tillage mode, and management habits. In addition, these moderate sampling scales can cover an abundant variability in SQ. For example, the SOM content at 0–20 cm changed from 1.2 to 2.7%, and the BST varied between 0 and more than 50 cm. The vast scope of these critical indexes is essential to investigate the influences of the SQ on the corn yield. More information on the soil properties for the transect is presented in Table 1.
2.2. Sampling and Measurements
In total, 62 sites were sampled along the 30 km transect in October 2021. The sampling interval along the transect was approximately 1 km. For each slope, seven sites were sampled from the top to the foot. The crop type of all 62 sites was corn, and the sites used similar farming systems. The following data were collected:
- (1)
- Corn yield
An area of 20 × 20 m was chosen to estimate the corn yield of each site. First, the number of rows (a) and columns (b) was recoded to calculate the quantity of corn plants in the 400 m2 area. Then, four adjacent corn plants with the average size of the sampling area were taken to the laboratory to obtain the air-dried grain weight (c, kg). To match the soil properties with the corn yield, the soil samples were sampled within the scope of the four chosen corn plants. The corn yield (kg ha−1) was calculated using the following formula:
- (2)
- Black-soil thickness
In this study, the BST was determined visually by digging 0–50-cm soil profiles in the field. The location where the colour of the soils changed from black or dark to yellow or light red was identified as the lower boundary of the black soil. The depth from the surface soil layer to this boundary was the BST. Figure 1 shows an example of how the BST was determined using this method in two soil profiles. This visual method could judge the BST exactly under conditions with clear boundaries, such as in Figure 1a. However, the BST under some conditions had less clear boundaries, such as in Figure 1b, in which case the BST was approximately estimated. The maximum measured depth in this study was 50 cm. That is, if the BST exceeded 50 cm, then its exact thickness was not confirmed and was recorded as 50 cm.
- (3)
- Soil penetration resistance
The soil penetration resistance (SPR) was measured using a soil compaction meter (SC900, Spectrum Technologies Inc., Aurora, CO, USA). In the 0–40-cm soil profile, the SPR values were measured at 2.5 cm intervals with three replicates for each sampling site. The means of 0–20 cm and 20–40 cm represented the soil compaction degree of the surface soil layer and the subsurface layer, respectively.
- (4)
- Other soil properties
Disturbed and undisturbed soil samples were collected to measure the basic physical and chemical properties of each site. Disturbed soil samples were sampled at 0–50 cm depths with 10-cm intervals. Three repetitions were drilled to obtain a mixed sample at each depth. Therefore, a total of 310 soil samples was collected at 62 sites. The soil particle compositions of sand (0.05–2 mm), silt (0.002–0.05 mm), and clay (<0.002 mm) were determined by the sieve–pipette method [27]. The SOC was measured using the method of Walkley and Black [28]. Other soil properties, including the pH, total nitrogen (TN), total phosphorus (TP), total potassium (TK), alkali-dissolvable nitrogen (AN), available phosphorus (AP), and available potassium (AK), were measured using conventional methods [29,30]. Undisturbed soil samples were collected at 5–10 cm and 25–30 cm using a 100-cm3 steel cutting ring. These undisturbed samples were used to measure the soil bulk density (BD) by the oven drying method.
2.3. Data Analysis
2.3.1. Indexes for Three Types of Datasets
The total dataset (TDS) comprised all 13 investigated soil indexes. The important dataset (IDS) consisted of some of the indexes that were sensitive and significantly related to the corn yield. The sensitivity of the indexes was judged by the strength of the variation, indicated by the coefficient of variation (CV). Four groups were divided according to the CV [18]: non-sensitive (CV < 10%), low-sensitive (10% ≤ CV < 50%), medium-sensitive (50% ≤ CV < 100%), and strong-sensitive indicators (CV ≥ 100%).
Principal component analysis (PCA) combined with the norm value was employed to establish the minimum dataset (MDS) [31]. The principal components with eigenvalues >1 and those explaining more than 10% of the variability of the model were included. The chosen principal components should explain at least 70% of the variance. Then, the index with the highest norm value of each component was selected to form the MDS. The normal value reflects the ability of the variable to explain the variation in the target variable, i.e., the corn yield in the present study. The norm value is calculated by the following formula [32]:
where Nik is the norm value of the ith index for the kth principal component, μik is the loading of the index, and λk is the eigenvalue of the kth principal component.
2.3.2. Soil Quality Index (SQI)
The integration of the selected indexes within the SQI was realized using Equation (3) [33,34]. There are three types of SQI based on the TDS, IDS, and MDS, named the SQI-TDS, SQI-IDS, and SQI-MDS, respectively.
where n is the number of soil indexes for each dataset, Wi is the weight of the ith variable, and Q(xi) is the membership degree.
The membership degree is determined by the membership function, which has ascending and descending forms. The ascending membership function is used when the variable is positively correlated with the soil function. In contrast, the membership degree is calculated using the reduced function. The formulas of the two types of membership functions are as follows [9,35]:
Ascending membership function formula:
The reduced-type membership function formula:
where Xij is the jth value of the ith index, and Ximax and Ximin are the maximum and minimum values of the ith index at the 62 sampling sites, respectively.
2.4. Statistical Analysis
The Pearson correlation was applied to test the correlations between the different variables, such as the soil properties. The PCA was utilized to construct the MDS. The t-test was employed to evaluate the differences between the three types of SQI. Regression analysis was used to fit the relationships of the investigated soil properties with the depth and the linear equation between the SQI and the corn yield. The data analysis was conducted using SPSS 26.0 (SPSS Inc. Chicago, IL, USA).
3. Results
3.1. Characteristics of the Soil’s Physical and Chemical Properties
Obvious soil degradation was observed mainly due to the intensive cultivation in recent decades. First, the subsurface soils were compacted, as indicated by a much higher BD at 20–40 cm than at the surface soil layer, with means of 1.5 and 1.2 g cm−3, respectively (Table 1). The SPR, however, did not reach the 2 MPa threshold for crop growth, which was partly due to the extremely high moisture conditions during the sampling period. Second, the SOM content of the study area was found to be at a relatively low level, varying between 12.4 and 26.9 g kg−1, with a mean of 18.8 g kg−1. This content was 20% lower than that 40 years ago based on the second soil survey of Jilin Province. Third, the soils suffered from acidification mainly due to the overuse of chemical fertilizers. Acidification was mainly observed in the surface soil layer, with average pH values of 4.9 and 6.3 at the 0–20 and 20–40 cm soil depths, respectively (Table 1).
The index of the CV over space was employed to reflect the sensitivity of the soil properties. Most of the indexes exhibited low sensitivity at both the 0–20 and the 20–40 cm depths, with CV values ranging between 10% and 50%, including the SOM, TN, TP, TN, AP, AK, and the soil’s silt and clay contents (Table 1). However, the pH and TK were not sensitive, with CV values lower than 10% at both depths. The sensitivity remained the same in the 0–20 and 20–40 cm soil layers, except for the BD and AP. The sensitivity of the BD decreased with the increasing soil depth. In contrast, the sensitivity of the AP increased from low to medium with the increasing soil depth (Table 1).
Significant depth dependences were observed for all the investigated soil properties at the 0-50 cm depth except for the TK and soil silt content (p < 0.05). However, the specific relationships differed between the soil properties. The soil sand content, SPR, and pH increased with the increasing soil depth. The other indexes had inverse trends with the soil depth (Figure 2). The changes in the soil particle components with the soil depth could be described well with a power function. The soil nutrition indexes generally exponentially decreased with the increasing soil depth. The soil pH, however, linearly increased with the increasing soil depth from 4.87 at 0–10 cm to 6.81 at 40–50 cm (Figure 2).
3.2. Correlations between the Soil Properties and the Corn Yield
The corn yield of the 62 sampling locations ranged between 6374 and 13,071 kg ha−1 with a CV value of 16.8%. The Pearson correlation analysis showed that the BST, SOM, TN, and soil sand content were the four most important indexes affecting the yield. These four indexes were significantly correlated with the corn yield at all five investigated soil depths, with average Pearson correlation coefficients of 0.65, 0.39, 0.34, and 0.31, respectively (Table 2). Notably, no correlations were observed between the soil indexes of the clay content, SPR, pH, and TP and corn yield at any soil depth. Other soil indexes were significantly correlated with corn yield only at some soil depths, e.g., the BD at the surface soil layer, the TK at soil depths below 20 cm, and the AK at soil depths below 10 cm (Table 2).
3.3. Soil Quality Index (SQI) Establishment
Three datasets were employed to establish the SQI, i.e., the total dataset (TDS), the important dataset (IDS), and the minimum dataset (MDS). To determine the optimal sampling depths, the SQIs were calculated based on the datasets under five sampling depths with 10 cm depth intervals, i.e., 0–10, 0–20, 0–30, 0–40, and 0–50 cm. The number of identified soil indexes increased with the increasing sampling depths from 11 to 47, 5 to 25, and 2 to 8 for the SQI-TDS, SQI-IDS, and SQI-MDS, respectively (Table 3). The required soil indexes for the SQI-MDS were only 32–50% of those of the SQI-IDS and 17–25% of those of the SQI-TDS. The MDS method significantly simplified the index system for soil quality evaluation. However, both the SOM and BST were identified as essential indexes of the MDS for each sampling strategy. The SOM at the 0–10 cm depth was more critical for the SQI when the soil samples were collected within the 0–30 cm soil layers. However, the SOM in the 20–30 cm soil layer was selected as the indicator when the sampling depth increased to 0–40 and 0–50 cm (Table 3). In addition, the TN, AK, and soil sand content were generally important indexes for the MDS.
Significant correlations (p < 0.01) were observed among the TDS-, IDS- and MDS-based SQIs at all five depths. The strength of the correlation was related to the sampling depth and the type of dataset employed. The correlations based on the 0–10-cm soil properties were the weakest, and those based on the dataset of 0–30 cm were the strongest of the five depths. The correlations between the SQI-TDS and SQI-IDS were the strongest, and those between the SQI-TDS and SQI-MDS were the weakest, with mean Pearson correlation coefficients of 0.91 and 0.78 and linear R2 values of 0.83 and 0.64, respectively (Table 4).
Both the magnitude and the variability of the SQI were affected by the type of dataset. The values of the SQI-MDS were higher than those of the SQI-TDS and SQI-TDS, with means of 0.61, 0.59, and 0.50, respectively. The spatial variability, indicated by the CV values, decreased from 25.9% for the SQI-MDS to 17.9% for the SQI-TDS (Table 5). In addition, the differences in the spatial variability among the three types of SQIs decreased with the increasing sampling depth. For example, when the samples were collected at a depth of 0–10 cm, the CV value of the SQI-MDS was 25% higher in absolute value than that of the SQI-TDS. The differences decreased to 2.5% when the sampling depth increased to 0–50 cm (Table 5).
To evaluate the performance of the SQI, correlation analysis was conducted between the SQI and the corn yield. Significant positive correlations were observed at all the investigated soil depths (p < 0.01). On the one hand, this significant positive correlation suggested that the corn yield was abundantly affected by the SQ. On the other hand, it indicated that the SQI was an effective tool in assessing the crop productivity in the study area. The strongest correlation with the corn yield was identified for the SQI-MDS using soil properties from the 0–30 cm depth, with a Pearson coefficient of 0.75 and a linear R2 of 0.56 (Table 6). Six indexes were identified as the MDS for this optimal SQI, i.e., SOM0–10cm, BST, AP10–20cm, TN10–20cm, AK10–20cm, and BD0–20cm. The cumulative contribution rate of these six indexes reached 80%, which supported the feasibility of using the MDS to replace the TDS in the study area. According to the weight value of each index, the SQI-MDS was expressed as follows:
where Q(X1) to Q(X6) are the affiliated values of the SOM0–10cm, BST, AP10–20cm, TN10–20cm, AK10–20cm, and BD0–20cm, respectively.
Most of the BSTs (45 out of 62) of the studied transect varied between 0 and 50 cm, with a mean of approximately 20 cm. To test the influence of the identified BST based on the colours on the SQ, the performances of the SQI based on the datasets with and without the BST index were compared using the MDS of 0–30 cm. Then, the mean of the SQI-MDS decreased from 0.62 to 0.57 when the BST index was ignored (Table 7). More importantly, the correlation between the established SQI-MDS and corn yield decreased, with the linear R2 decreasing from 0.56 to 0.49 (Figure 3).
4. Discussion
4.1. Optimum Solution for the SQ Evaluation
In the present study, the strength of the correlation between the SQI and the corn yield was set to evaluate the applicability of the constructed method for the SQI. The MDS generally performed the best among the three established methods (Table 6). In addition to the good performance, the MDS method saves costs, requiring less than one-fourth of the soil indexes of the IDS (Table 3). Therefore, the MDS method is recommended for SQ evaluation in the thin-layer black-soil region, which is supported by the results of previous studies conducted in agricultural cropping systems in regions similar to the present study [18], thick-layer black-soil regions [36] and South America [16]. Specifically, robust relationships were established between the crop yield and the SQI-MDS in Heilongjiang Province, China [36] and in Jilin Province, China [18]. Marion et al. found that the SQI based on the dataset reduction approaches saved costs but did not decrease the efficiency of the SQ evaluation [16]. The good performance of the MDS method could be attributed to the fact that it covers most of the soil information and avoids data repeatability. In addition, the existence of the dominant factors affecting the corn yield, i.e., the BST and the SOM in the present study, might be one of the advantages to the MDS method. The performance of the MDS might decrease in other regions without the dominant factors related to land productivity. In the deep-layer black-soil region, for example, the contributions of the BST and the SOC to the SQI might decrease due to the high fertility level. Therefore, the MDS-based SQI provides reliable decision making with lower labour costs in the thin-layer black-soil region.
The sampling depth affected the performance of the constructed SQI. The soil samples collected in 0–30 cm had the most robust relationship between the SQI-MDS and the corn yield, with a Pearson correlation coefficient of 0.75 and a linear R2 of 0.56. In contrast, the correlations were the weakest when the samples were collected from 0 to 50 cm with the same depth interval (Table 6). The sampling depth was found to be critical to the SQ evaluation [25,36]. The sampling depths used, however, seemed arbitrary in previous studies. For example, in studies conducted in the black-soil region, the sampling depth varied between the top 20 cm and 0–50 cm [21,37]. Based on the present study, increasing the sampling depth to 40 or 50 cm did not improve or even worsened the performance of the constructed SQI. This phenomenon might be explained by the information redundancy caused by too many indexes involved when sampling at a deep depth. The optimum sampling depth depends on both the heterogeneity of the soils and the target crop type. The stronger the heterogeneity of the soils across the profile and the deeper the crop roots are, the larger the sampling depth should be. The soils of the thick-layer black-soil region were more homogeneous than those of the thin-layer region. Therefore, it is reasonable to infer that the required sampling depth might be less than 30 cm for thick-layer regions.
4.2. Role of the BST Index for SQ Evaluation
The existence of black soil makes the farmland of Northeast China highly productive [2]. However, the BST index has always been missing in SQ evaluations in this region [25,38]. One important reason is that the BST is difficult to measure in the field. According to U.S. Soil Taxonomy, the BST was determined by nine indexes, such as the colour, SOM content, and soil structure [39]. Although this method is quantitative, it is also time and labour consuming, which limits its application.
The colour of soils is the most critical index of the BST. Some studies employed this single index to determine the BST [40]. This intuitive judgement method is controversial due to its subjectivity and cross reading [12]. Based on the present study, however, identifying the BST by the difference in colour was reliable in the thin-layer black-soil region. This conclusion was strongly supported by the significant difference in the performances of the established SQI with and without the BST index. First, the mean SQI was significantly higher with the BST than without it, with values of 0.62 and 0.57, respectively (Table 7). In addition, the linear R2 between the SQI and corn yield decreased from 0.56 to 0.49 when the BST index was ignored (Figure 3).
Using the changes in colour across the soil profile to determine the BST is suitable in the thin-layer black-soil region. This region generally has a BST less than 40 cm [14], which is easy to dig or drill to reach its lower boundary. However, the BST generally exceeds 50 cm and is even deeper than 100 cm in the thick-layer black-soil region. Geophysical techniques, such as ground penetrating radar, have advantages in collecting soil thickness information in regions with deep black soil [41]. These geophysical techniques can obtain continuous soil thickness information at a relatively low cost. However, the inverse accuracy of the BST is generally unsatisfactory. A combination of measurements at the point scale and environmental correlation statistical models is presently the most reasonable method to determine the BST information at a large scale considering both accuracy and cost [2].
4.3. The Key to Improving Soil Quality
Black-soil degradation has drawn increasing attention in China in recent years [42,43]. Soil erosion [44], a lower carbon input than output [6], and soil compaction [45] are the three most important factors accounting for the degradation of mollisols. The roles of the three factors in the SQ evaluation were reflected by the BST, SOM, and SPR indexes in the present study. The correlation analysis showed that the SPR was not the limiting factor for the corn yield (Table 2). The neglectable role of soil compaction could be indicated by the low SPR, much lower than the 2 MPa threshold identified to affect crop growth [46,47]. This result disagreed with a previous report that soil compaction was considered a threat to agricultural production in the study area [45]. One possible reason for the weak influence of the soil compaction on the crop yield might be the high rainfall in 2021. The soil moisture status was negatively related to the SPR. Therefore, a high soil moisture content would decrease the effect of soil compaction [48].
Stable and high yield is one of the important indicators of SQ, which mostly depends on the inherent soil productivity [49]. Among the identified six soil indexes for the MDS, the BST and SOM were definitely the core of the SQ in the thin black-soil region, which presented a strong buffering capacity for crop yield from the climate conditions. The importance of the two factors to soil productivity has been frequently reported [16,50,51]. For example, based on a three-year field experiment, Guo et al. found that the corn yield decreased by 9–22% when the BST decreased from 30 to 10 cm [52]. The SOM is considered to be the main determining factor of corn yield [53,54], and the SOM is always identified as the top contributor to the SQ in diverse regions [16,49,51]. As a compressive index, the BST generally means a high SOM and a high nitrogen content. However, its contribution to the SQI could not be replaced by other indexes. This was indicated by the linear R2 between the constructed SQI and corn yield decreasing from 0.56 to 0.49 when the BST index was neglected (Figure 3). Unfortunately, black soil is lost at rates as high as 0.3–1.0 cm/year [3], which is almost 100 times its formation rate [55]. Under this context, the BST declined sharply from 50–80 cm in the 1950s to 20–40 cm presently [4]. In some areas of the typical black-soil region, the black soil has completely disappeared. Even worse, the loss of black soil was coupled with a decrease in the SOM content and other nutrients in farmland. For instance, there was an approximately 12% decrease in organic carbon and a 43% decrease in available phosphorus with the loss of the surface black soil [56].
Conservation tillage has been shown to be an effective measure to prevent soil degradation and reconstruct the functions of degraded soil [57]. This tillage system can prevent surface soil loss by wind and water [58,59], increase the SOM content by adding straw input [60,61], and mitigate the soil compaction by reducing the usage of machinery [45,62]. However, the influences of conservation tillage on yields are region-dependent. In thin black-soil regions, after 5–7 years of conservation tillage, farmland can produce comparable or higher crop yields than conventional tillage [63]. Therefore, it is necessary to transform farming systems from conventional to conservation tillage to improve the SQ in fragile regions with a thin black-soil coverage.
5. Conclusions
The present study evaluated the effects of the soil’s physical and chemical properties on corn yield using the SQI tool in the thin-layer black region. A total of 13 soil indexes was investigated at 0–50 cm soil depths along a 31 km transect at 62 sampling sites. The following conclusions were drawn:
- The SQI tool was used to account for the variations in corn yield in the thin-layer black region. The performance of the constructed SQI was affected by both the dataset type and the sampling depth. Generally, the MDS-based SQI using the soil indexes of the 0–30 cm depth had a robust relationship with the corn yield.
- Using the differences in the colour of the soil profile to judge the BST was effective in the thin-layer black region. The BST identified by this intuitive method had a significant correlation with the corn yield. Furthermore, the degree of explanation of the variance in the corn yield by the constructed SQI decreased considerably when the BST index was ignored.
- The SOM and BST played the most important roles in the SQ evaluation system of the thin-layer black region. Therefore, preventing the loss of surface black soil and increasing the SOM content are key to improving the inherent land productivity in regions with thin black-soil coverage.
Author Contributions
Conceptualization, L.G.; methodology, L.G. and W.F.; software, W.F. and X.Z.; validation, X.Z., L.L. and S.Z.; formal analysis, X.Z. and L.L.; investigation, L.G. and W.F.; resources, L.G. and X.P.; data curation, L.L.; writing—original draft preparation, L.G. and W.F.; writing—review and editing, L.G. and X.P.; visualization, X.Z. and W.F.; supervision, L.G. and X.P.; project administration, L.G.; funding acquisition, L.G. All authors have read and agreed to the published version of the manuscript.
Funding
This work was funded by the National Key Research and Development Program of China (2021YFD1500801) and the Strategic Priority Research Program of the Chinese Academy of Sciences (XDA28010101).
Data Availability Statement
The data are not publicly available due to privacy.
Acknowledgments
We thank the editor and anonymous reviewers for their valuable contributions to this manuscript. Special thanks to Lishu experimental station of China Agricultural University to provide convenience during field sampling.
Conflicts of Interest
The authors declare no conflict of interest.
References
- Cai, H.; Ma, W.; Zhang, X.; Ping, J.; Yan, X.; Liu, J.; Yuan, J.; Wang, L.; Ren, J. Effect of subsoil tillage depth on nutrient accumulation, root distribution, and grain yield in spring maize. Crop J. 2014, 2, 297–307. [Google Scholar] [CrossRef] [Green Version]
- Zhang, S.; Liu, G.; Chen, S.; Rasmussen, C.; Liu, B. Assessing soil thickness in a black soil watershed in northeast China using random forest and field observations. Int. Soil Water Conserv. Res. 2021, 9, 49–57. [Google Scholar] [CrossRef]
- Fan, H.; Cai, Q.; Chen, G.; Cui, M. Comparative study of the soil erosion and control in the three major black soil regions in the world. J. Nat. Resour. 2005, 20, 387–393. [Google Scholar]
- Feng, Z.; Zheng, F.; Hu, W.; Li, G.; Xu, X. Impacts of mollic epipedon thickness and overloaded sediment deposition on corn yield in the Chinese Mollisol region. Agric. Ecosyst. Environ. 2018, 257, 175–182. [Google Scholar] [CrossRef]
- Fang, H. Impacts of rainfall and soil conservation measures on soil, SOC, and TN losses on slopes in the black soil region, northeastern China. Ecol. Indic. 2021, 129, 108016. [Google Scholar] [CrossRef]
- Li, N.; Li, L.; Zhu-Barker, X.; Cheng, J.; Liu, J.; Chang, S. Foreword: Degradation and evolution of Mollisols under different management practices and climate change. Soil Sci. Soc. Am. J. 2022, 86, 1379–1382. [Google Scholar] [CrossRef]
- Fan, H.; Cai, Q.; Wang, H. Condition of soil erosion in phaeozem region of northeast China. J. Soil Water Conserv. 2004, 18, 66–70. [Google Scholar]
- Zhao, Y.; Wang, M.; Hu, S.; Zhang, X. Economics-and policy-driven organic carbon input enhancement dominates soil organic carbon accumulation in Chinese croplands. Proc. Natl. Acad. Sci. USA 2018, 115, 4045–4050. [Google Scholar] [CrossRef] [Green Version]
- Yang, W.; Zheng, F.; Han, Y.; Wang, Z. Investigating spatial distribution of soil quality index and its impacts on corn yield in a cultivated catchment of the Chinese Mollisol region. Soil Sci. Soc. Am. J. 2016, 80, 317–327. [Google Scholar] [CrossRef] [Green Version]
- Zhang, X.; Liu, X. Key issues of mollisols research and soil erosion control strategies in China. Bull. Soil Water Conserv. 2020, 40, 340–344. [Google Scholar]
- Arshad, M.; Martin, S. Identifying critical limits for soil quality indicators in agro-ecosystems. Agric. Ecosyst. Environ. 2002, 88, 153–160. [Google Scholar] [CrossRef]
- Liu, K.; Wei, M.; Dai, H.; Liu, G.; Jia, S.; Song, Y.; Liang, S. Spatiotemporal variation of black soil thickness in black soil region of Northeast China. Geol. Resour. 2022, 31, 434–442. [Google Scholar]
- Shi, Z.; Allison, S.; He, Y.; Levine, P.; Hoyt, A.; Beem-Miller, J.; Zhu, Q.; Wieder, W.; Trumbore, S.; Randerson, J. The age distribution of global soil carbon inferred from radiocarbon measurements. Nat. Geosci. 2020, 13, 555–559. [Google Scholar] [CrossRef]
- Zhang, Z. The thickness changes of Ah horizon after the phaeozems cultivated. J. Heilongjiang Bayi Agric. Univ. 2010, 2, 1–3, (In Chinese with English Abstract). [Google Scholar]
- Yu, P.; Liu, S.; Zhang, L.; Li, Q.; Zhou, D. Selecting the minimum data set and quantitative soil quality indexing of alkaline soils under different land uses in northeastern China. Sci. Total Environ. 2018, 616, 564–571. [Google Scholar] [CrossRef]
- Marion, L.; Schneider, R.; Cherubin, M.; Colares, G.; Wiesel, P.; Costa, A.; Lobo, E. Development of a soil quality index to evaluate agricultural cropping systems in southern Brazil. Soil Tillage Res. 2022, 218, 105293. [Google Scholar] [CrossRef]
- Hatfield, J.L. Soil degradation, land use, and sustainability. In Convergence of Food Security, Energy Security and Sustainable Agriculture; Springer: Berlin/Heidelberg, Germany, 2014; pp. 61–74. [Google Scholar]
- Mei, N.; Gu, Y.; Li, D.; Liang, X.; Yuan, J.; Liu, J.; Ren, J.; Cai, H. Soil quality evaluation in topsoil layer of black soil in Jilin Province based on minimum data set. Trans. CSAE 2021, 37, 91–98, (In Chinese with English Abstract). [Google Scholar]
- Liu, Z.; Fu, B.; Liu, G.; Zhu, Y. Soil quality: Concept, indicators and its assessment. Acta Ecol. Sin. 2006, 26, 901–913. [Google Scholar]
- Qi, Y.; Darilek, J.; Huang, B.; Zhao, Y.; Sun, W.; Gu, Z. Evaluating soil quality indices in an agricultural region of Jiangsu Province, China. Geoderma 2009, 149, 325–334. [Google Scholar] [CrossRef]
- Li, X.; Wang, D.; Ren, Y.; Wang, Z.; Zhou, Y. Soil quality assessment of croplands in the black soil zone of Jilin Province, China: Establishing a minimum data set model. Ecol. Indic. 2019, 107, 105251. [Google Scholar] [CrossRef]
- Jiang, M.; Xu, L.; Chen, X.; Zhu, H.; Fan, H. Soil quality assessment based on a minimum data set: A case study of a county in the typical river delta wetlands. Sustainability 2020, 12, 9033. [Google Scholar] [CrossRef]
- Selmy, S.; Al-Aziz, S.; Jiménez-Ballesta, R.; García-Navarro, F.; Fadl, M. Soil Quality Assessment Using Multivariate Approaches: A Case Study of the Dakhla Oasis Arid Lands. Land 2021, 10, 1074. [Google Scholar] [CrossRef]
- Huang, T.; Yue, X.J.; Ge, X.Z.; Wang, X.D. Evaluation of soil quality on gully region of loess plateau based on principal component analysis. Agric. Res. Arid Areas 2010, 28, 141–147. [Google Scholar]
- Chen, Y.; Wang, H.; Zhou, J.; Xing, L.; Zhu, B.S.; Zhao, Y.C.; Chen, X.Q. Minimum data set for assessing soil quality in farmland of northeast China. Pedosphere 2013, 23, 564–576. [Google Scholar] [CrossRef]
- Zhang, Y.; Wang, Z.; Wang, Y.; Wang, Y.; Wang, X.; Han, G.; An, G. Soil Quality Evaluation with Different Treatment Models in Yimeng Mountainous Area Based on minimum Data Set. Res. Soil Water Conserv. 2023, 30, 241–247. [Google Scholar]
- Gee, G.; Bauder, J.; Klute, A. Methods of Soil Analysis, Part 1, Physical and Mineralogical Methods; Soil Science Society of America, Inc.: Madison, WI, USA, 1986. [Google Scholar]
- Walkley, A.; Black, I.A. An examination of the Degtjareff method for determining soil organic matter, and a proposed modification of the chromic acid titration method. Soil Sci. 1934, 37, 29–38. [Google Scholar] [CrossRef]
- Shi, Y.; Zhang, Q.; Liu, X.; Zheng, L. Organic manure input and straw cover improved the community structure of nitrogen cycle function microorganism driven by water erosion. Int. Soil Water Conserv. Res. 2022, 10, 129–142. [Google Scholar] [CrossRef]
- Zhang, Y.; Li, P.; Liu, X.; Xiao, L.; Shi, P.; Zhao, B. Effects of farmland conversion on the stoichiometry of carbon, nitrogen, and phosphorus in soil aggregates on the Loess Plateau of China. Geoderma 2019, 351, 188–196. [Google Scholar] [CrossRef]
- Li, G.; Chen, J.; Sun, Z.; Tan, M. Establishing a minimum dataset for soil quality assessment based on soil properties and land-use changes. Acta Ecol. Sin. 2007, 27, 2715–2724, (In Chinese with English Abstract). [Google Scholar] [CrossRef]
- Wu, C.; Liu, G.; Huang, C.; Liu, Q.; Guan, X. Soil quality assessment of the Yellow River Delta based on MDS and fuzzy logic model. Resour. Sci. 2016, 38, 1275–1286. [Google Scholar]
- Raiesi, F. A minimum data set and soil quality index to quantify the effect of land use conversion on soil quality and degradation in native rangelands of upland arid and semiarid regions. Ecol. Indic. 2017, 75, 307–320. [Google Scholar] [CrossRef]
- Andrews, S.; Karlen, D.; Mitchell, J. A comparison of soil quality indexing methods for vegetable production systems in Northern California. Agric. Ecosyst. Environ. 2002, 90, 25–45. [Google Scholar] [CrossRef]
- Santhi, C.; Arnold, J.; Williams, J.; Hauck, L.; Dugas, W. Application of a watershed model to evaluate management effects on point and nonpoint source pollution. Trans. ASAE 2001, 44, 1559. [Google Scholar] [CrossRef]
- Zhou, M.; Xiao, Y.; Li, Y.; Zhang, X.; Wang, G. Soil quality index evaluation model in responses to six-year fertilization practices in Mollisol. Aech. Agron. Soil Sci. 2020, 68, 180–194. [Google Scholar] [CrossRef]
- Tian, K.; Zhang, B.; Zhang, H.; Huang, B.; Yang, J. Evaluation of soil quality in major grain-producing region of the North China Plain: Integrating minimum data set and established critical limits. Ecol. Indic. 2020, 117, 106613. [Google Scholar] [CrossRef]
- Li, X.; Li, H.; Yang, L.; Ren, Y. Assessment of soil quality of croplands in the Corn Belt of Northeast Chin. Sustainability 2018, 10, 248. [Google Scholar] [CrossRef] [Green Version]
- Soil Survey Staff. Soil Survey Staff. Soil taxonomy: A basic system of soil classification for making and interpreting soil surveys. In USDA NRCS Agriculture Hand Book No. 436, 2nd ed.; U.S. Gov. Print. Office: Washington, DC, USA, 1999. [Google Scholar]
- Duan, X.; Xie, Y.; Ou, T.; Lu, H. Effects of soil erosion on long-term soil productivity in the black soil region of northeastern China. Catena 2011, 87, 268–275. [Google Scholar] [CrossRef]
- Liu, C.; Liu, G.; Li, H.; Wang, X.; Chen, H.; Dan, C.; Shen, E.; Shu, C. Using ground-penetrating radar to investigate the thickness of mollic epipedons developed from loessial parent material. Soil Tillage Res. 2021, 212, 105047. [Google Scholar] [CrossRef]
- Han, X.; Zhou, W. Research perspectives and footprint of utilization and protection of black soil in northeast China. Acta Pedofil. Sin. 2021, 58, 1341–1358. [Google Scholar]
- Zhang, S.; Sun, L.; Jamshidi, A.H.; Niu, Y.; Liu, X. Assessment of the degree of degradation of sloping cropland in a typical black soil region. Land Degrad. Dev. 2022, 33, 2220–2230. [Google Scholar] [CrossRef]
- Wang, C.; Zhang, G.; Zhu, P.; Chen, S.; Wan, Y. Spatial variation of soil functions affected by land use type and slope position in agricultural small watershed. Catena 2023, 225, 107029. [Google Scholar] [CrossRef]
- Wang, H.; Wang, L.; Ren, T. Long-term no tillage alleviates subsoil compaction and drought-induced mechanical impedance. Int. Agrophys. 2022, 36, 297–307. [Google Scholar] [CrossRef]
- Bengough, A.; McKenzie, B.; Hallett, P.; Valentine, T. Root elongation, water stress, and mechanical impedance: A review of limiting stresses and beneficial root tip traits. J. Exp. Bot. 2011, 62, 59–68. [Google Scholar] [CrossRef] [PubMed] [Green Version]
- Bueno, J.; Amiama, C.; Hernanz, J.L.; Pereira, J.M. Penetration resistance, soil water content, and workability of grasslands soils under two tillage systems. Trans. ASABE 2006, 49, 875–882. [Google Scholar] [CrossRef]
- Hu, W.; Jia, X.; Zhu, X.; Su, A.; Huang, B. Influence of moisture content on intelligent soil compaction. Autom. Constr. 2020, 113, 103141. [Google Scholar] [CrossRef]
- Zhang, J. Improving inherent soil productivity underpins agricultural sustainability. Pedosphere 2023, 33, 3–5. [Google Scholar] [CrossRef]
- Gu, Z.; Xie, Y.; Gao, Y.; Ren, X.; Cheng, C. Quantitative assessment of soil productivity and predicted impacts of water erosion in the black soil region of northeastern China. Sci. Total Environ. 2018, 637, 706–716. [Google Scholar] [CrossRef]
- Serri, D.; Pérez-Brandan, C.; Meriles, J.; Salvagiotti, F.; Bacigaluppo, S.; Malmantile, A.; Vargas-Gil, S. Development of a soil quality index for sequences with different levels of land occupation using soil chemical, physical and microbiological properties. Appl. Soil Ecol. 2022, 180, 104621. [Google Scholar] [CrossRef]
- Guo, L.; Yang, Y.; Zhao, Y.; Li, Y.S.; Sui, Y.Y.; Tang, C.X.; Jin, J.; Liu, X.B. Reducing topsoil depth decreases the yield and nutrient uptake of maize and soybean grown in a glacial till. Land Degrad. Dev. 2021, 32, 2849–2860. [Google Scholar] [CrossRef]
- Li, P.; Zhang, T.; Wang, X.; Yu, D. Development of biological soil quality indicator system for subtropical China. Soil Tillage Res. 2013, 126, 112–118. [Google Scholar] [CrossRef]
- Zou, W.X.; Qiu, C.; Han, X.Z. Effects of long-term manure application on black soil fertility and maize yield. Soils Crops 2020, 9, 407–418. [Google Scholar]
- Wen, L.; Zheng, F.; Shen, H.; Bian, F.; Jiang, Y. Rainfall intensity and inflow rate effects on hillslope soil erosion in the Mollisol region of Northeast China. Nat. Hazards 2015, 79, 381–395. [Google Scholar] [CrossRef]
- Larney, F.; Akinremi, O.; Lemke, R.; Klaassen, V.; Janzen, H. Crop response to topsoil replacement depth and organic amendment on abandoned natural gas wellsites. Can. J. Soil Sci. 2003, 83, 415–423. [Google Scholar] [CrossRef] [Green Version]
- Carretta, L.; Tarolli, P.; Cardinali, A.; Nasta, P.; Masin, R. Evaluation of runoff and soil erosion under conventional tillage and no-till management: A case study in northeast Italy. Catena 2021, 197, 104972. [Google Scholar] [CrossRef]
- Xu, X.; Xu, Y.; Chen, S.; Xu, S.; Zhang, H. Soil loss and conservation in the black soil region of Northeast China: A retrospective study. Environ. Sci. Policy 2010, 13, 793–800. [Google Scholar] [CrossRef]
- Chen, Y.; Liu, S.; Li, H.; Li, X.F.; Song, C.Y.; Cruse, R.M.; Zhang, X.Y. Effects of conservation tillage on corn and soybean yield in the humid continental climate region of Northeast China. Soil Tillage Res. 2011, 115, 56–61. [Google Scholar] [CrossRef]
- Zhu, F.; Lin, X.; Guan, S.; Dou, S. Deep incorporation of corn straw benefits soil organic carbon and microbial community composition in a black soil of Northeast China. Soil Use Manag. 2022, 38, 1266–1279. [Google Scholar] [CrossRef]
- Liang, A.; Yang, X.; Zhang, X.; Chen, X.; Mclaughlin, N.; Wei, S.; Zhang, Y.; Jia, S.; Zhang, S. Changes in soil organic carbon stocks under 10-year conservation tillage on a Black soil in Northeast China. J. Agric. Sci. 2016, 154, 1425–1436. [Google Scholar] [CrossRef]
- Hernández, T.; Slater, B.; Corbalá, R.; Shaffer, J. Assessment of long-term tillage practices on physical properties of two Ohio soils. Soil Tillage Res. 2019, 186, 270–279. [Google Scholar] [CrossRef]
- He, J.; Li, H.; Rasaily, R.; Wang, Q.; Cai, G.; Su, Y.; Qiao, X.; Liu, L. Soil properties and crop yields after 11 years of no tillage farming in wheat–maize cropping system in North China Plain. Soil Tillage Res. 2011, 113, 48–54. [Google Scholar] [CrossRef]
Figure 1.
Sketch map of judging the black-soil thickness by colour with clear boundary (a) and fuzzy boundary (b).
Figure 1.
Sketch map of judging the black-soil thickness by colour with clear boundary (a) and fuzzy boundary (b).

Figure 2.
Changes in the investigated soil properties with the soil depth.
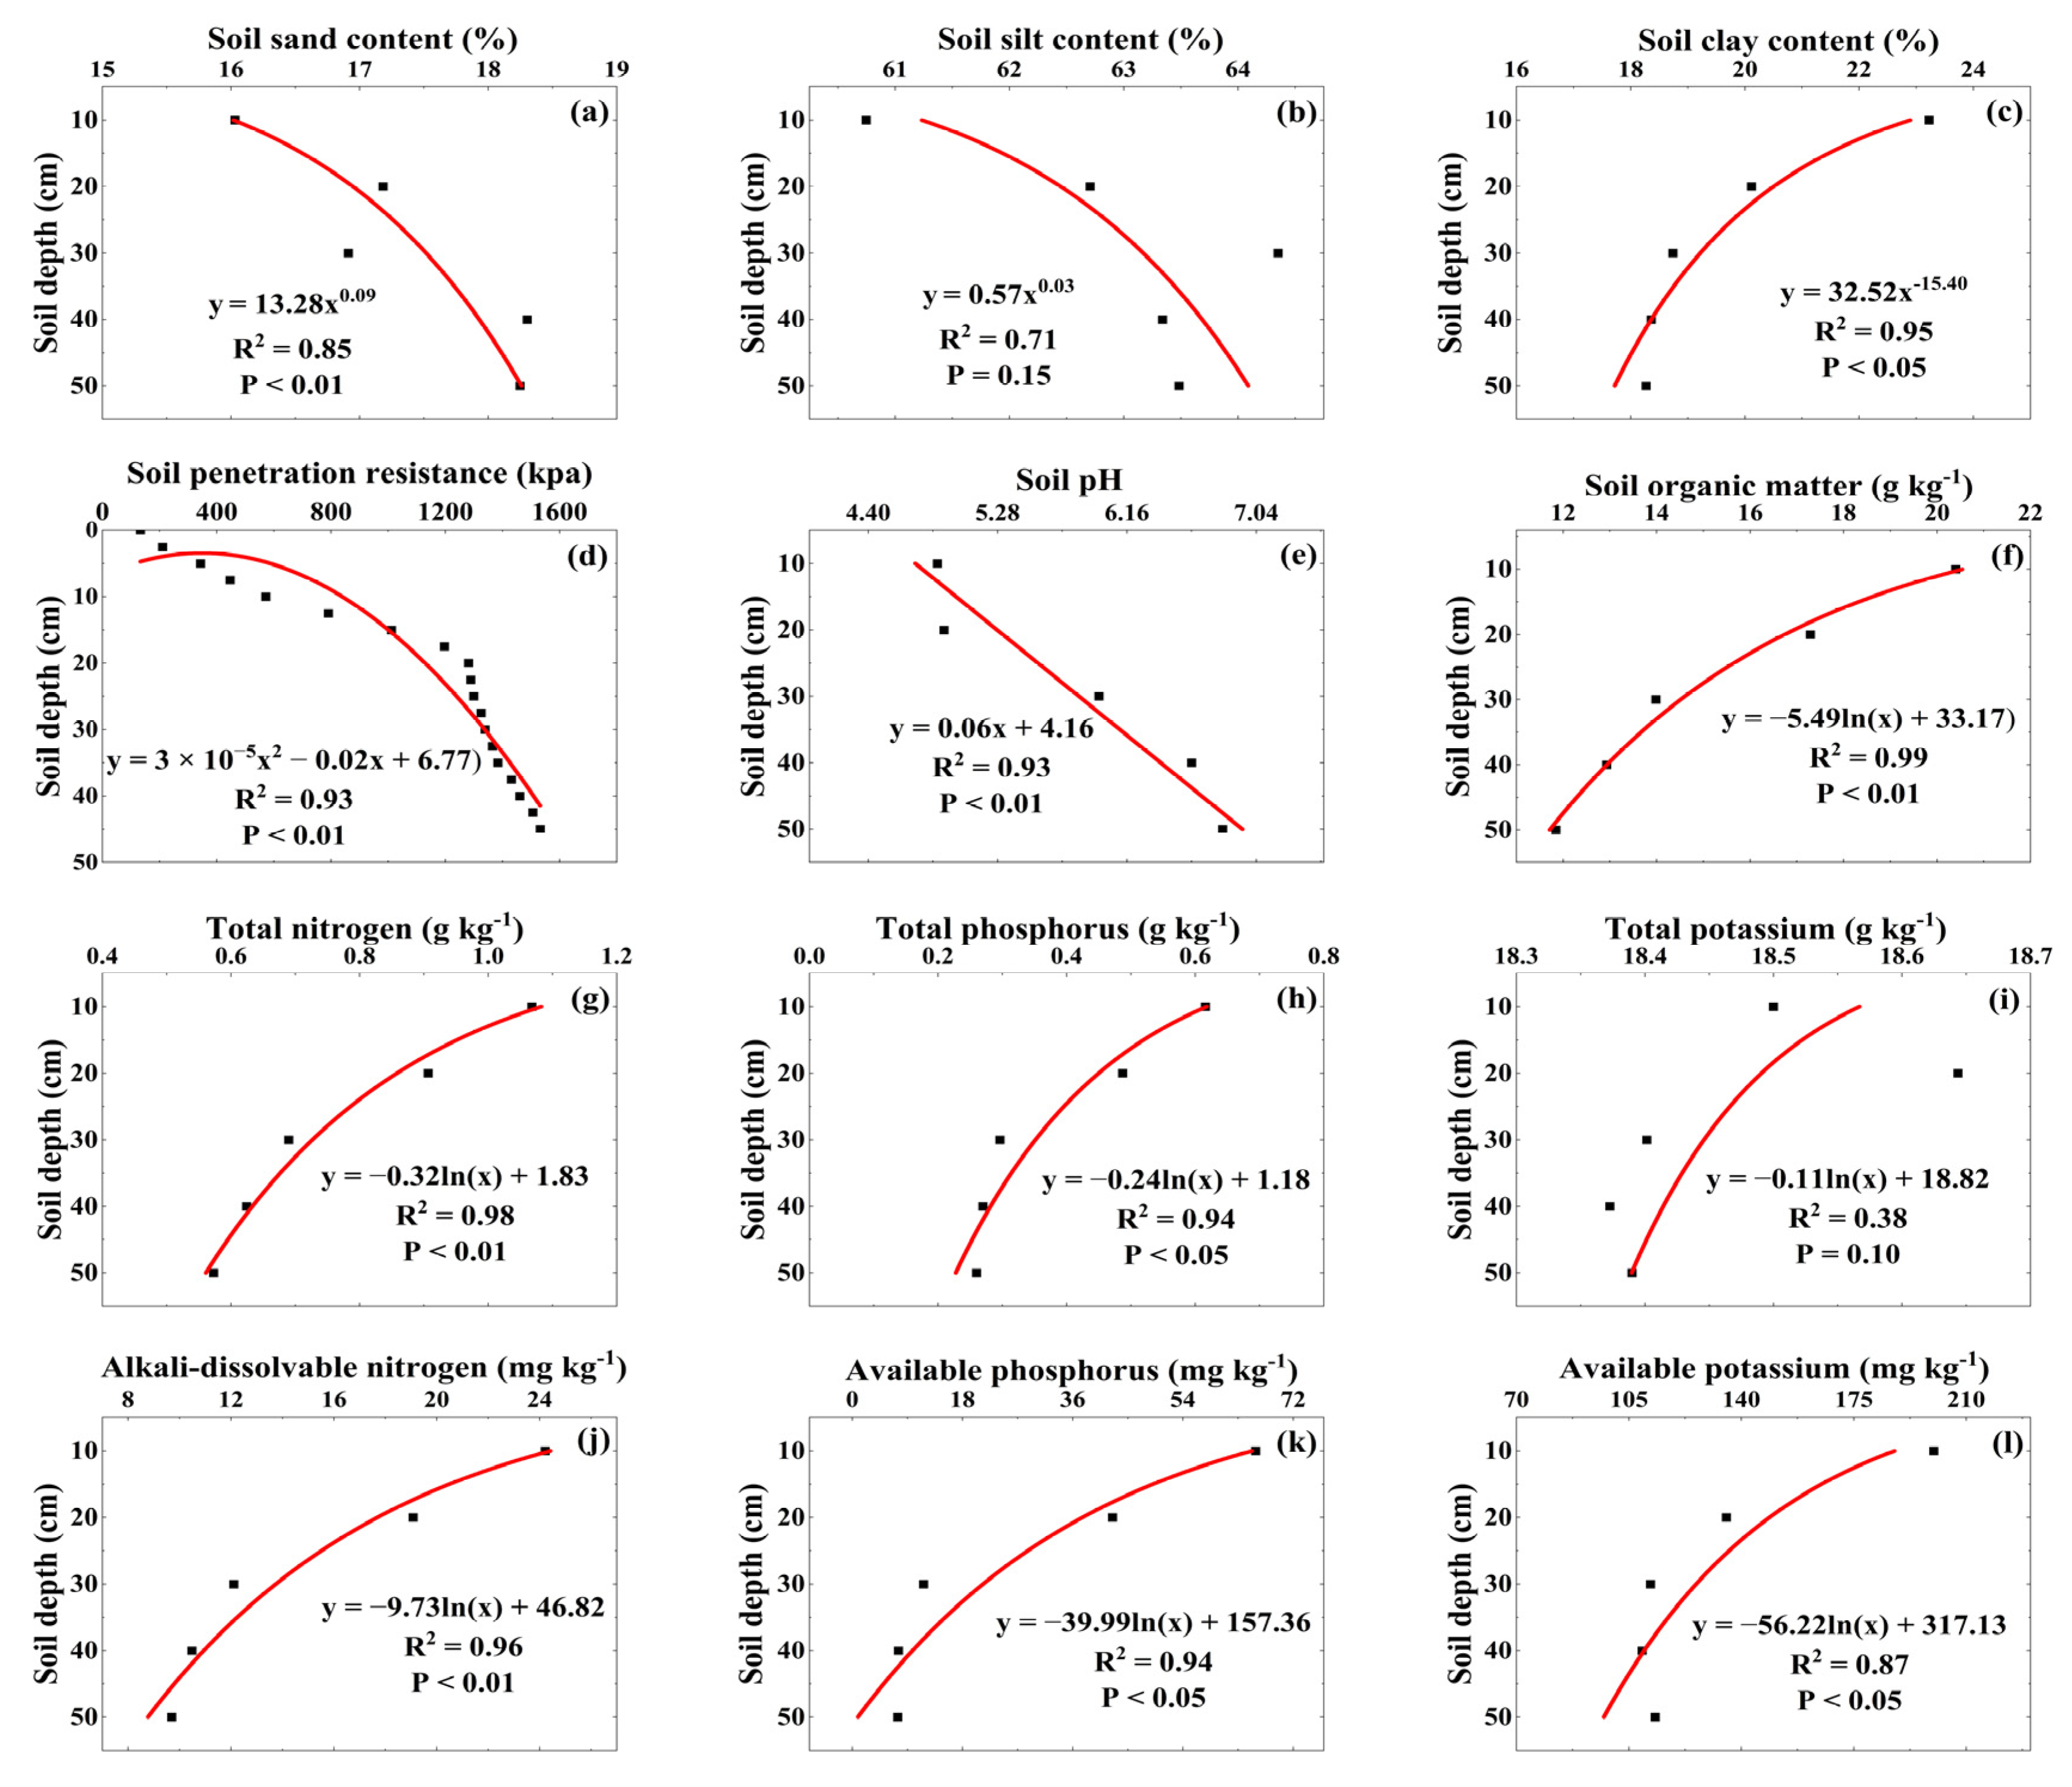
Figure 3.
Correlations between the established soil quality index (SQI) using the minimum dataset (MDS) with (a) and without (b) the BST index and corn yield.
Figure 3.
Correlations between the established soil quality index (SQI) using the minimum dataset (MDS) with (a) and without (b) the BST index and corn yield.


Table 1.
Summary of the soil properties at the surface and subsurface soil layers of the investigated transect (n = 62).
Table 1.
Summary of the soil properties at the surface and subsurface soil layers of the investigated transect (n = 62).
| Soil Properties | 0–20 cm | 20–40 cm | ||||||
|---|---|---|---|---|---|---|---|---|
| Max. | Min. | Mean | CV | Max. | Min. | Mean | CV | |
| BD (g cm−3) | 1.7 | 1.0 | 1.2 | 11.4 | 1.7 | 1.2 | 1.5 | 6.6 |
| Sand (%) | 43.8 | 1.6 | 16.6 | 55.8 | 48.5 | 2.2 | 17.6 | 67.3 |
| Silt (%) | 83.0 | 33.3 | 61.7 | 16.3 | 83 | 29.1 | 63.8 | 18.3 |
| Clay (%) | 47.4 | 4.2 | 21.7 | 36.8 | 48.8 | 4.2 | 18.6 | 47.0 |
| SPR (kPa) | 1166.1 | 397.2 | 664.8 | 25.5 | 2045.8 | 693.8 | 1299.1 | 20.6 |
| pH | 6.6 | 4.0 | 4.9 | 9.3 | 7.6 | 4.9 | 6.3 | 8.5 |
| SOM (g kg−1) | 26.9 | 12.4 | 18.8 | 18.6 | 28.6 | 4.7 | 13.5 | 37.7 |
| TN (g kg−1) | 1.6 | 0.4 | 1.0 | 25.1 | 1.3 | 0.3 | 0.7 | 35.5 |
| TP (g kg−1) | 1.0 | 0.3 | 0.6 | 25.3 | 0.6 | 0.1 | 0.3 | 36.0 |
| TK (g kg−1) | 24.4 | 15.8 | 18.6 | 9.1 | 22.1 | 15.5 | 18.4 | 8.9 |
| AN (mg kg−1) | 35.5 | 12.3 | 21.7 | 22.9 | 19.2 | 4.0 | 11.3 | 29.5 |
| AP (mg kg−1) | 127.1 | 12.1 | 54.4 | 46.2 | 37.4 | 2.3 | 9.6 | 84.9 |
| AK (mg kg−1) | 435.6 | 87.4 | 167.6 | 37.4 | 340.8 | 47.6 | 110.4 | 41.9 |
Notes: Max., maximum; Min., minimum; CV, coefficient of variation, %; BD, soil bulk density; SPR, soil penetration resistance; SOM, soil organic matter; TN, total nitrogen; TP, total phosphorus; TK, total potassium; AN, alkali-dissolvable nitrogen; AP, available phosphorus; AK, available potassium.
Table 2.
Pearson correlation between the soil properties and the corn yield at five soil depths.
| Indexes | Soil Depths (cm) | ||||
|---|---|---|---|---|---|
| 0–10 | 10–20 | 20–30 | 30–40 | 40–50 | |
| BST | 0.654 ** | ||||
| BD | −0.213 * | 0.062 | |||
| Sand | −0.245 * | −0.326 ** | −0.405 ** | −0.259 * | −0.333 * |
| Silt | 0.122 | 0.157 | 0.272 * | 0.199 | 0.287 * |
| Clay | 0.084 | 0.203 | 0.187 | 0.078 | 0.062 |
| SPR | −0.040 | −0.073 | −0.31 | −0.211 | −0.209 |
| pH | 0.007 | 0.100 | 0.047 | 0.102 | 0.140 |
| SOM | 0.432 ** | 0.429 ** | 0.418 ** | 0.359 ** | 0.308 * |
| TN | 0.384 ** | 0.297 * | 0.376 ** | 0.383 ** | 0.261 * |
| TP | 0.171 | 0.180 | −0.074 | −0.088 | −0.118 |
| TK | −0.166 | −0.144 | −0.250 * | −0.209 * | −0.274 * |
| AN | 0.183 | 0.172 | 0.369 ** | 0.192 | 0.175 |
| AP | 0.144 | 0.274 * | 0.113 | −0.058 | 0.011 |
| AK | −0.155 | −0.226 * | −0.231 * | −0.325 ** | −0.326 ** |
Notes: “*” and “**” indicate that the correlation is significant at the 0.05 and 0.01 levels, respectively; BST, black-soil thickness; BD, soil bulk density; SPR, soil penetration resistance; SOM, soil organic matter; TN, total nitrogen; TP, total phosphorus; TK, total potassium; AN, available nitrogen; AP, available phosphorus; AK, available potassium.
Table 3.
Number of soil indexes of the TDS, IDS, and MDS and the specific indexes of the MDS for the SQI establishment at five sampling depths.
Table 3.
Number of soil indexes of the TDS, IDS, and MDS and the specific indexes of the MDS for the SQI establishment at five sampling depths.
| Sampling Strategy | Number of Indexes | Identified Indexes of MDS | |||
|---|---|---|---|---|---|
| Soil Depth (cm) | Depth Interval (cm) | TDS | IDS | MDS | |
| 0–10 | 10 | 11 | 5 | 2 | SOM0–10cm, BST |
| 0–20 | 10 | 20 | 10 | 5 | SOM0–10cm, BST, TN0–10cm, AK10–20cm, BD0–20cm |
| 0–30 | 10 | 29 | 16 | 6 | SOM0–10cm, BST, TN10–20cm, AK10–20cm, AP10–20cm, BD0–20cm |
| 0–40 | 10 | 38 | 20 | 7 | SOM20–30cm, BST, TN10–20cm, AK30–40cm, AP10–20cm, BD0–20cm, Sand0–10cm |
| 0–50 | 10 | 47 | 25 | 8 | SOM20–30cm, BST, TN0–10cm, TN40–50cm, AK30–40cm, BD0–20cm, Sand0–10cm, Silt20–30cm |
Notes: SQI, soil quality index; TDS, total dataset; IDS, important dataset; MDS, minimum dataset; SOM, soil organic matter; BST, black-soil thickness; TN, total nitrogen; AK, available potassium; BD, soil bulk density; AP, available phosphorus. The subscripts of the soil index represent the soil depths.
Table 4.
Correlations among the three types of SQI based on Pearson and linear regression analyses.
| Sampling Strategy | SQI-TDS and SQI-IDS | SQI-TDS and SQI-MDS | SQI-IDS and SQI-MDS | ||||
|---|---|---|---|---|---|---|---|
| Soil Depth (cm) | Depth Interval (cm) | Pearson Coefficient | R2 | Pearson Coefficient | R2 | Pearson Coefficient | R2 |
| 0–10 | 10 | 0.727 ** | 0.53 | 0.456 ** | 0.21 | 0.903 ** | 0.82 |
| 0–20 | 10 | 0.952 ** | 0.91 | 0.835 ** | 0.70 | 0.924 ** | 0.85 |
| 0–30 | 10 | 0.960 ** | 0.92 | 0.894 ** | 0.80 | 0.929 ** | 0.86 |
| 0–40 | 10 | 0.954 ** | 0.91 | 0.883 ** | 0.77 | 0.913 ** | 0.82 |
| 0–50 | 10 | 0.946 ** | 0.90 | 0.849 ** | 0.72 | 0.923 ** | 0.85 |
Notes: SQI, soil quality index; TDS, total dataset; IDS, important dataset; MDS, minimum dataset, “**” after the number means significant correlation at 0.01 levels.
Table 5.
Summary of the SQI based on the three types of datasets at five sampling depths.
| Sampling Strategy | Variables | Indicators | |||
|---|---|---|---|---|---|
| Soil Depth (cm) | Depth Interval (cm) | SQI-TDS | SQI-IDS | SQI-MDS | |
| 0–10 | 10 | Max. | 0.68 | 0.84 | 1.00 |
| Min. | 0.31 | 0.25 | 0.04 | ||
| Mean | 0.51 b | 0.59 ab | 0.58 a | ||
| CV | 14.87 | 24.70 | 39.87 | ||
| 0–20 | 10 | Max. | 0.73 | 0.86 | 0.90 |
| Min. | 0.26 | 0.25 | 0.24 | ||
| Mean | 0.52 b | 0.59 a | 0.59 a | ||
| CV | 17.93 | 21.57 | 23.62 | ||
| 0–30 | 10 | Max. | 0.70 | 0.83 | 0.90 |
| Min. | 0.28 | 0.30 | 0.28 | ||
| Mean | 0.50 b | 0.59 a | 0.62 a | ||
| CV | 18.65 | 22.14 | 21.95 | ||
| 0–40 | 10 | Max. | 0.67 | 0.82 | 0.86 |
| Min. | 0.32 | 0.34 | 0.27 | ||
| Mean | 0.49 b | 0.59 a | 0.64 a | ||
| CV | 18.77 | 21.54 | 21.29 | ||
| 0–50 | 10 | Max. | 0.68 | 0.81 | 0.83 |
| Min. | 0.32 | 0.35 | 0.24 | ||
| Mean | 0.49 b | 0.59 a | 0.62 a | ||
| CV | 19.24 | 21.27 | 22.62 | ||
Notes: SQI, soil quality index; TDS, total dataset; IDS, important dataset; MDS, minimum dataset. Max., maximum; Min., minimum; CV, coefficient of variation, %; means with different lowercase letters indicate significant differences among the SQIs with the same sampling depth at the 0.05 level.
Table 6.
Correlations between the corn yield and the three types of SQI at five sampling depths.
| Sampling Strategy | SQI-TDS | SQI-IDS | SQI-MDS | ||||
|---|---|---|---|---|---|---|---|
| Soil Depth (cm) | Depth Interval (cm) | Pearson Coefficient | R2 | Pearson Coefficient | R2 | Pearson Coefficient | R2 |
| 0–10 | 10 | 0.592 ** | 0.35 | 0.689 ** | 0.48 | 0.650 ** | 0.42 |
| 0–20 | 10 | 0.661 ** | 0.44 | 0.656 ** | 0.43 | 0.685 ** | 0.47 |
| 0–30 | 10 | 0.652 ** | 0.43 | 0.641 ** | 0.41 | 0.746 ** | 0.56 |
| 0–40 | 10 | 0.608 ** | 0.37 | 0.630 ** | 0.40 | 0.679 ** | 0.45 |
| 0–50 | 10 | 0.569 ** | 0.32 | 0.613 ** | 0.38 | 0.598 ** | 0.36 |
Notes: SQI, soil quality index; TDS, total dataset; IDS, important dataset; MDS, minimum dataset, “**” after the number means significant correlation at 0.01 levels.
Table 7.
Summary statistics of the SQI-MDS with and without the black-soil thickness (BST) index.
| Variables | With BST | Without BST |
|---|---|---|
| Maximum | 0.90 | 0.84 |
| Minimum | 0.28 | 0.33 |
| Mean | 0.62 a | 0.57 b |
| Coefficient of variation | 21.89 | 23.17 |
Notes: SQI, soil quality index; MDS, minimum dataset. Means followed by different lowercase letters are significantly different at the 0.05 level.
Disclaimer/Publisher’s Note: The statements, opinions and data contained in all publications are solely those of the individual author(s) and contributor(s) and not of MDPI and/or the editor(s). MDPI and/or the editor(s) disclaim responsibility for any injury to people or property resulting from any ideas, methods, instructions or products referred to in the content. |
© 2023 by the authors. Licensee MDPI, Basel, Switzerland. This article is an open access article distributed under the terms and conditions of the Creative Commons Attribution (CC BY) license (https://creativecommons.org/licenses/by/4.0/).
Share and Cite
MDPI and ACS Style
Fang, W.; Zhong, X.; Peng, X.; Li, L.; Zhang, S.; Gao, L. Soil Quality Mediates the Corn Yield in a Thin-Layer Mollisol in Northeast China. Land 2023, 12, 1187. https://doi.org/10.3390/land12061187
AMA Style
Fang W, Zhong X, Peng X, Li L, Zhang S, Gao L. Soil Quality Mediates the Corn Yield in a Thin-Layer Mollisol in Northeast China. Land. 2023; 12(6):1187. https://doi.org/10.3390/land12061187
Chicago/Turabian StyleFang, Wei, Xuemei Zhong, Xinhua Peng, Linyuan Li, Shaoliang Zhang, and Lei Gao. 2023. "Soil Quality Mediates the Corn Yield in a Thin-Layer Mollisol in Northeast China" Land 12, no. 6: 1187. https://doi.org/10.3390/land12061187
Note that from the first issue of 2016, this journal uses article numbers instead of page numbers. See further details here.