
Spatial Distribution Characteristics and Driving Factors of Tourism Resources in China

1
College of Water Resources and Architectural Engineering, Tarim University, Alaer 843300, China
2
Institute of Urban and Rural Planning Theories and Technologies, College of Civil Engineering and Architecture, Zijingang Campus, Zhejiang University, Hangzhou 310058, China
3
Center for Balance Architecture, Zhejiang University, Hangzhou 310058, China
*
Author to whom correspondence should be addressed.
Land 2023, 12(5), 1029; https://doi.org/10.3390/land12051029
Submission received: 27 March 2023
/
Revised: 19 April 2023
/
Accepted: 28 April 2023
/
Published: 8 May 2023
(This article belongs to the Special Issue Geospatial Data for Landscape Change)
Abstract
:The spatial distribution characteristics and influencing factors of tourist attractions in China are analyzed by GIS and SPSS. The spatial distribution characteristics and main influencing factors of urban landscape tourism resources in China are deeply explored in order to provide a reference for the construction of a national park system and for the optimal allocation of tourism resources in the future. The results show the following: (1) the spatial pattern of tourism resources in China is strong in the southeast and weak in the northwest. It shows the spatial structure of a global concentrated contiguous distribution, A-level zonal distribution, and national point distribution. The distribution pattern of concentrated contiguous areas is consistent with the spatial distribution of major urban agglomerations in China. (2) There is a serious imbalance in the allocation of A-level tourist attractions in Central, Southwest, Northwest, and Northeast China. The allocation of A-level tourist attractions in East China is in an absolute dominant position, whereas that in South China and North China is at a medium level. National tourism resources show obvious characteristics of being strong in the east and weak in the west. We mainly take the provincial capital city as the core point of agglomeration, showing the obvious “administrative district” distribution characteristics. (3) The level of urban management, the scale of urban construction, the development of the real estate industry, the employment population of tertiary industry, and the level of urban economic development are all factors that have a significant correlation with the spatial distribution of urban tourism resources.
1. Introduction
China is currently seeking to address the problems of protection and management existing in the development of scenic spots. The Decision of the Central Committee of the Communist Party of China on Several Major Issues Concerning Comprehensively Deepening Reform, adopted in 2013, proposed to delimit the red line of ecological protection and establish a national park system. The Overall Plan for the Reform of Ecological Civilization System was issued in 2015. The plan proposes to reform the system of setting up various types of protected areas separately by various departments, and reorganize the functions of nature reserves, scenic spots, and cultural and natural heritage and other protected areas. In 2017, the central government issued the Overall Plan for the Establishment of National Park System, which clearly accelerated the construction of a nature reserve system with national parks as the core, clear levels and clear classification [1]. The 19th National Congress of the Communist Party of China also emphasized the establishment of a natural reserve system with national parks as the main body and the construction of a land space development and protection system. In 2019, the Central Committee issued the Guiding Opinions on Establishing a Natural Reserve System with National Parks as the Main Body again. The document further requires the comprehensive evaluation of various nature reserves, such as scenic spots, forest parks, and geological parks, and their classification according to the ecological value, natural attributes, and management objectives of nature reserves. A classification system of nature reserves based on national parks, supplemented by natural parks and nature reserves, has been gradually constructed [2], and scenic spots have also been explicitly included in the national park system. With the establishment of the national status of scenic spots, the spatial distribution of scenic tourism resources has gradually become a major topic of academic research.
In recent years, the types of tourism resource research have been gradually enriched, and the current research topics include cultural tourism resources, heritage tourism resources, eco-tourism resources, forest tourism resources, geological tourism resources, ice and snow tourism resources, rural tourism resources, and so on. The research field has gradually shifted from theoretical and conceptual research to practical application research. Among them, research value, impact, evaluation, and sustainable development are the areas that scholars pay most attention to. For example, Gustavo Adolfo Vázquez Martínez evaluated the tourism resources of the San Luis Potosí Plateau in Mexico based on the multi-criteria evaluation method, evaluated some tourism destinations with the greatest tourism development potential, and determined the inherent characteristics of tourist attractions and activities, suggesting the development of tourism corridors in this area [3]. Aunkrisa Sangchumnong surveyed the Klang mangrove tourist attractions in Central Thailand through participatory action research, summarized four important characteristics of the tourism resources in the area, and proposed four key points for the development of the area, one of which is to adhere to sustainable tourism [4]. Chen Jianbo selected 23 indicators from four aspects of landscape value, health value, environmental conditions, and development conditions to construct an evaluation index system for health tourism resources [5]. Through a literature analysis, in-depth interviews, and field visits, Chen Zhiyong took the tourism resources of Tianlong Tunpu in Guizhou Province as an example for study and found that the composition characteristics of rural tourism resources and the particularity of human capital led to the difficult development of rural tourism property rights [6]. Nicola MacLeod has studied the choice of destinations for literature lovers, who tend to avoid organized attractions and favor personalized tours, and they use travel to enhance their reading of their favorite books. She emphasized the interdependence of literature and tourism, highlighting the important role of imagination in the travel experience and memory [7]. In addition, based on the structure of international tourism in Veneto, Italy, Bevilacqua E analyzed the influence of the structure of tourism resources on the spatial planning and layout of tourism [8]. Stephen L.J. Smith discussed the positive impact of tourism resources such as cottage/boating resources on regional tourism development [9]. Juan M. Hernández analyzed the space of scenic spots from the perspectives of accessibility, spatial structure, and geographical location, and put forward the main factors affecting the layout of tourism spatial planning [10,11]. With the rise of GIS spatial analysis software, scholars have gradually expanded the research field of the spatial distribution visualization of tourism resources [11,12].
In the field of tourism resource research in China, the development, evaluation, current situation, and analysis of tourism resources are the focus of Chinese scholars. Chinese scholars began to pay attention to the development of tourism resources as early as in the 1980s, but they did not put forward specific suggestions [13]. In the 1990s, Chinese scholars began to turn to the research mode of combining resource development and evaluation, and then combined development evaluation and protection [14]. With the rapid development of China’s economy, many regions have developed tourism resources through tourism resource evaluation, and then developed a tourism industry [15,16]. Therefore, the study of tourism resource development has always occupied an important position [17]. However, since the beginning of the 21st century, research topics such as spatial structure, resource protection, and zoning have gradually emerged [18]. Baicui Xu began to study the spatial distribution characteristics of national scenic spots [19,20] and explored the locations of national scenic spots to maximize the economic benefits of national tourism resources [21,22]. Li Xin explored the spatial distribution characteristics, accessibility, location selection, use efficiency, and economic benefits of 5A and A-level tourist attractions, and put forward corresponding countermeasures [23,24]. Priporas, Constantinos-Vasilios constructed a small model of tourist participation activities to analyze the impact of different tourism activities on the development of tourist attractions [25]. The analysis model of influencing factors has gradually become a hotspot in the study of tourism resource distribution. Some scholars have also adopted network analysis, location theory, scale theory, and other research methods to study the identification of scenic resources, scenic area management, historical origins, scenic area systems, and other fields [26,27]. A study found that natural resource endowment, the regional economic development level, traffic convenience, topography, historical and cultural heritage, and the importance of local government management and other related factors have a significant impact on the distribution of tourist attractions [28,29]. Among them, topography and geomorphology have the most significant impacts on the locations of national parks [30].
To date, only a few studies have analyzed the main influencing factors of the distribution of tourism resources in the whole region, and the influencing factors are mainly concentrated in the aspects of topography, historical and cultural deposits, and the degree of attention paid by local government management [31]. For example, Jia Wang found that the historical and cultural heritage of Chinese cities led to the concentration of tourism resources [32]. Shuying Zhang found that the local government-issued corresponding tourism resource protection policy is conducive to the development of tourism resources [33]. There are few studies on the spatial distribution factors of landscape tourism resources from the national level [34]. Tourist attractions refer to areas with a beautiful natural environment, concentrated cultural landscape, concentrated supporting resources, certain scale, and sightseeing conditions, enabling people to visit, rest, watch, and carry out scientific and cultural activities [35]. It is not difficult to find that a scenic spot is not only a complex involving the protection and development of human and natural environmental resources, but also a spatial carrier of national, supportive, recreational public service resources. With the development of different regions, China’s tourism resources also have an important spatial correspondence with the “basic economic zones” in Chinese history [36], which has also led to the unbalanced construction of tourism resources in some regions. In addition, the current domestic and foreign research mainly focuses on the spatial distribution characteristics and influencing factors of scenic spots at all levels, and few scholars discuss the spatial distribution pattern of tourism resources in the whole region from the national level. China’s city classification includes municipalities directly under the central government, sub-provincial cities, ordinary prefecture-level cities, and county-level cities, but it does not include counties. The research scale of the provincial level is too large, and the research scale of the county level is too small. Based on this, this paper attempts to explore the spatial distribution characteristics of China’s tourism resources and its influencing factors in a prefecture-level city, and systematically analyze the distribution of China’s tourism resources. The authors use point of interest (POI) data of tourist attractions and urban construction statistical yearbooks with high precision, wide coverage, and convenient statistical analysis. This paper explores whether the tourism resources of prefecture-level cities in China are evenly distributed in geographical space. Is there an unbalanced distribution of tourism resources in quantity? Is there an inferior distribution of tourism resources in quality? We explore the internal driving factors by using multiple regression and Getis–Ord Gi [30,37]. This paper also tries to establish an explanatory model of the factors affecting the spatial distribution of tourism resources in order to provide a reference for the balancing and optimization of the allocation of tourism resources in China.
2. Methods and Materials
2.1. Research Methods
Firstly, this study uses Kernel density to analyze the macro-spatial pattern of tourist attractions. Secondly, the standard deviation ellipse is used to judge the change trend of high-quality tourism resources. Then, this paper uses hot spot analysis (Getis-Ord Gi) and Location quotient to study the agglomeration characteristics of tourist attractions. Finally, this study uses statistical analysis method to explore the main influencing factors of the spatial distribution characteristics of tourist attractions. The main analysis methods are as follows.
2.1.1. Kernel Density
Kernel density was proposed by Emanuel Parzen (1962) to calculate the density of an object around each grid cell. This paper calculates the density distribution of tourism resources in China according to the input point data of scenic spots, and graphically transforms the result into a continuous kernel density surface [38,39]. The spatial distribution characteristics of scenic spots in China are depicted from a quantitative perspective. The higher the concentration degree of scenic spots, the higher the nuclear density, and vice versa. The kernel density is calculated as follows:
Among them, Q is the point whose density needs to be measured, and is the estimated value of the density of the point. is the position of the nth scenic spot falling within the circle with Q as the center and r as the radius, and r is the step length, i.e., the extension width of the curved surface starting from Q in space [38].
2.1.2. Getis–Ord Gi
Combined with the point data of tourist attractions, this study uses Getis–Ord Gi * to judge the relationship between the total number of tourist attractions and visualizes the relationship as a hot area and a cold area [30,37].
In order to facilitate comparative analysis, the is standardized and changed to:
Here, is the mathematical expectation of . is the variance of . The value is positive and the statistical results are significant, which means that region i is located in the high hotspot cluster area of the tourist attraction. If is negative and the statistical results are significant, it means that region i is located in the cold spot cluster area of the tourist attraction.
2.1.3. Location Quotient
The Location Quotient was first proposed by P. Haggett to analyze the relative advantages and disadvantages of research objects within the research scope [40,41]. This study mainly uses the proportional model to measure the spatial construction level of tourist attractions. First, this study calculates the number of scenic spots within the total percentage of scenic spots of the country, and then calculates the population of the region within the percentage of the total population, and, finally, the two results are divided. The ratio is used to measure the level of tourism resource construction in each study area [41]. The formula is:
In the formula, LQ is the location quotient of tourist attractions in the study area, is the total number of tourist attractions in i city, n is the total population scale of i city, represents the total number of tourist attractions in the study area, and N represents the total population in the study area. When LQ < 1, it indicates that the scale of tourism resource construction of the prefecture-level city is at a disadvantage relative to the whole country. When LQ = 1, the scale of tourism resource construction of this prefecture-level city is equivalent to that of the national cities. If LQ > 1, this indicates that the construction scale of tourism resources of this prefecture-level city is in an advantageous position within the whole country. The greater the LQ is, the more significant the agglomeration of tourism resource construction in this region is, and it is in a relatively advantageous position.
2.1.4. Statistical Analysis Methods
In order to deeply investigate the internal influencing factors of the spatial distribution of tourism resources, this study will use multiple regression analysis and correlation analysis in SPSS19.0 software. Based on the comprehensive analysis of the impact index system in the existing literature [16,18,28,29,32,34], it is found that the main factor causing serious damage to scenic spots comes from the rapid urbanization and construction in China. Therefore, we selected the relevant indicators of urbanization and construction. We identified the hypothetical influencing variables, such as the urban construction land area, urban residential land area, urban construction financial expenditure, and urban management level, from the China Urban Statistical Yearbook (Table 1). This paper explores and analyzes the internal factors that affect the spatial agglomeration and distribution of tourism resources, and constructs an explanatory model of the spatial distribution of tourism resources in China, identifying the relevant influencing factors such as urban construction investment, urban scale expansion, and economic output. Then, the robustness of the model is tested, and the main motivation and evolution mechanism of the spatial distribution of tourism resources in China are explained by relevant explanatory variables. This is expected to provide a reference for the optimization of the balanced allocation of tourism resources. The general expression relation of the model is:
where Y is the number of class i scenic spots, α is a constant term, β is the coefficient of each variable, and X is each variable selected.
2.2. Data Collection
The authors used point of interest (POI) data of tourist attractions and urban construction statistical yearbooks. Among them, POI data are the basic data of location-based services (LBS), which can be obtained from open platforms such as Baidu Maps, Gaode Maps, Google Maps, Open Street Maps, etc. [42]. They are obtained through the application programming interface (API). Based on the API, this study uses BigeMap software to collect the data of Baidu Maps tourist attractions in 2020 (https://lbsyun.baidu.com/index.php?title=webapi/guide/webservice-placeapi (accessed on 29 December 2020)). The data mainly cover the name, grade, and latitude and longitude of tourist attractions. The data were obtained in December 2020. The authors obtained a total of 81,120 tourist attractions’ location data. We removed the incomplete fields and duplicated location and name data and randomly selected scenic spots of interest to be preliminarily compared and screened with natural reserves protected by Chinese government agencies. When the data were completely consistent, we finally obtained the point data of 79,500 tourist attractions. In addition, in order to study the quality distribution characteristics of tourist attractions in various cities, in this study, according to the classification standard of China’s scenic spots, the research data were divided into three categories: national tourism landscape area (AAAAA level), provincial tourism scenic spot (AAAA level, AAA level, AA level, A level), and general scenic spot [43]. For convenience of description, the authors describe the provincial tourist scenic spot as A-level. The other type of data was obtained from the China Urban Statistical Yearbook 2020. They mainly include statistical data on the urban construction, population size, economic level, and social development of 339 prefecture-level cities in China. It should be noted that, due to the slow updating of statistical data in some regions, the statistical data of some cities in Hong Kong, Macao, Taiwan, and the Xinjiang Uygur Autonomous Region of China are missing, so the study area does not cover the above regions. Therefore, the statistical sample of this study neglected the above cities. Then, 339 prefecture-level cities were screened using statistical software, and the cities with incomplete statistical yearbook data were removed. We finally screened out 289 sample cities that were included in the statistical analysis (Table 1).
3. Spatial Distribution Characteristics
3.1. Macro-Pattern of Tourism Resources
According to the spatial and temporal distribution characteristics of the total number of tourist attractions in China, China’s tourism resources show a spatial structure with a dense contiguous distribution across the whole region (Figure 1A), a belt distribution of A-level scenic spots (Figure 1B), and a national point distribution (Figure 1C), and they show a spatial pattern of being strong in the southeast and weak in the northwest. Among them, the total number of scenic spots in the southeast coastal area is the most obvious, forming the “Hong Kong–Fuzhou–Hangzhou” scenic spot cluster belt, and also forming a scenic spot cluster belt along the middle and lower reaches of the Yangtze River and Yellow River. Scenic spots are mainly concentrated in areas with sufficient water resources and complex geological conditions. A-level scenic spots are especially strong in the east and weak in the west. The A-level scenic spots form the coastal agglomeration belt of “Hangzhou–Jinan–Beijing”. Mainly concentrated in the lower reaches of the Yangtze River and Yellow River, rich water resources have also created rich tourism resources. The Jiangnan area is the core node of the A-class belt structure, which also confirms the good scenery of Jiangnan, dating back to ancient times. National scenic spots are mainly represented by provincial capitals and historical and cultural cities. The provincial capital city is influenced by politics, and the national scenic spots show the distribution characteristics of “administrative regionalization”. Most of them are concentrated in the south of the Yangtze River, which also shows the spatial distribution characteristics of being strong in the southeast and weak in the northwest. According to the total number of scenic spots, the scenic spots in East China account for 31% of the whole country, and the number of scenic spots is in an absolute dominant position within the whole country. South China and Southwest China account for 13%, and Northwest China and North China account for 10%. The total number of scenic spots in Northwest China and North China is the lowest in China, forming an unbalanced distribution pattern between east and west and north and south. From the point of view of the distribution core density of tourist attractions, in addition to the characteristics of being concentrated and contiguous, it also presents the spatial characteristics of being strong in the southeast and weak in the northwest, and the regional agglomeration is also consistent with the main economic development circles, such as the China River Delta, Pearl River Delta, Beijing–Tianjin–Hebei, and Chengdu–Chongqing, which shows that the spatial distribution of tourist attractions and the level of economic development show a positive correlation again. The total amount of tourism resources in East China is in an absolute dominant position within the whole country, and the construction advantage of A-level tourist attractions is the most obvious. South China and North China are at a medium level, whereas Southwest, Northeast, and Northwest China are inferior areas regarding the total number of A-level tourist attractions.
3.2. Changing Trend of High-Quality Tourism Resources
The authors take the national tourist scenic spots as the research object and calculate and draw the center of gravity and standard deviation ellipse of national, A-level, and ordinary tourist scenic spots (Figure 2), so as to depict the dynamic spatial distribution situation of China’s tourism resources. The center of gravity of national tourist attractions is located in Suizhou, Northern Hubei Province. The center of gravity of national A-level scenic spots moves northward to Nanyang City, Henan Province, whereas the distribution center of national scenic spots moves southward to Jingmen City, Hubei Province. The center of gravity of high-quality tourism resources shows an obvious southward trend and gradually moves away from the “Hu Huanyong Line”, and the high-quality tourism resources show the trend of gathering in South China. The total amount of high-quality tourism resources in Central China, West China, and North China needs to be further improved. From the perspective of the range of the ellipse rotation angle, it generally presents a north–south trend. The coverage of A-level scenic spots is the widest, and the ellipse angle shifts obviously to the southwest. The elliptical coverage of national tourist attractions has obviously moved southward, and the advantages of the high-quality tourism resources gathered in South China are obvious. From the change range of the ellipse axis length, the increase in the axis length in the X axis direction is the largest, which shows that the high-quality tourism resources show obvious diffusion and a change trend in the X axis direction. The length of the Y axis continues to shorten, indicating that the scenic spots on the north–south axis still show the phenomenon of a large quantity and low quality. According to the proportions of A-level tourist attractions, the areas with a high proportion of A-level tourist attractions are mainly concentrated around the border, in the Xinjiang Uygur Autonomous Region, Heilongjiang, Shandong, Guangxi, and other regions. Among them, only 30 cities’ A-level tourist attractions accounted for more than 50%. Only a quarter of the cities account for more than 30% of the A-level tourist attractions. Half of the cities accounted for less than 20% of the A-level tourist attractions. Obviously, the coverage of high-quality scenic spots above Grade A needs to be further increased to meet the increasing demand for high-quality tourism resources. There are also three low-quality distribution belts of “Taiyuan–Wuhan–Guangzhou”, “Hohhot–Xining–Lhasa”, and southeast coastal areas. The scenic tourism spots in the belt area show the characteristics of “large quantity and low quality”. It is necessary for the local government to further strengthen the investment in tourism resource construction and improve the quality and quantity of A-level and above scenic spots in the region, so as to improve the quality rate of regional tourism resources.
3.3. Characteristics of Tourism Resource Agglomeration
The hotspot analysis (Getis-Ord Gi*) tool in ArcGIS10.0 was used to analyze the hot and cold areas of the national tourism scenic spot construction. Through the self-defined breakpoint method, the hot and cold areas of tourist attractions were divided into five levels: the core hot area, sub-core hot area, insignificant area, edge cold spot area, and core cold spot area (Figure 3). The hotspot value of the core hotspot area is the highest, which indicates that the tourism scenic spot development in this area is highly concentrated and is the hotspot range of scenic spot development, and the remaining hotspot values decrease in turn. The hotspot value of the core cold spot area is negative and the minimum, representing the cold spot range of scenic spot development. The hotspots of scenic spot development in China are mainly concentrated around Shandong, Anhui, and Fujian provinces, and the development of scenic spots in the upper reaches of the Yangtze River is the hottest. The cold spots of scenic spot development in China are mainly concentrated in remote areas such as Xinjiang, Heilongjiang, and Yunnan, which matches the regional economic development level. Beijing, Liaoning, Inner Mongolia, and other provinces have been added to the development hotspots of Class A scenic spots, and the development hotspots of Class A scenic spots have obviously moved northward. The hotspots of national scenic spots gradually turn towards the Yangtze River, and the hotspots in Western China are the most concentrated, which is consistent with the policy orientation of western development in recent years. To summarize, from the hot and cold characteristics of the development of scenic spots, we can find that the level of regional economic development and policy support have an impact on the development and construction of scenic spots.
In addition to exploring the spatial distribution characteristics of tourism resources from the two levels of quantity and quality, we also explore the advantages and disadvantages of the construction of national tourism resources from the perspective of scenic spot agglomeration. Location quotients are used to measure the advantages and disadvantages of tourist attractions in regional construction [44]. Through statistics, it is found that the LQ of 66.67% prefecture-level cities is less than 1, which indicates that more than half of the cities in China are in an inferior position in terms of tourism resource construction. The larger the LQ is, the more significant the agglomeration of tourism resource construction in this region is, and it is in a relatively advantageous position. The tourism resources are characterized by belt agglomeration with a high location quotient and area agglomeration with a low location quotient in China. Among them, “Hohhot–Xining–Lhasa” and “Hangzhou–Fuzhou”, two highly advantageous tourism resource gathering belts in the belt area of urban tourism resources, showed a strong advantage. At the same time, they have also formed a planar inferior agglomeration area with the three northeastern provinces, Henan, Hebei, and Yunnan, as the core.
4. Main Factors Affecting the Distribution of Tourism Resources
From the above analysis, it is not difficult to find that the city’s water resources, geographical conditions, and economic level have a significant impact on the spatial distribution of tourism resources. However, the factors affecting the distribution of tourism resources are far more numerous, and some scholars have begun to propose that urban development and construction have an important impact on the distribution of tourism resources [16,18,28,29,32,34,41,45]. This study intends to start from the urban tertiary industry employment population, urban construction land area, urban construction financial investment, and so on, to deeply explore the impact mechanism of urban development and construction on the distribution of national tourism resources. The study comprehensively analyzes the impact index system of the existing literature [28,46], and finds that the main factor causing serious damage to scenic spots comes from the rapid urbanization and construction in China. Therefore, we selected the relevant indicators of urbanization and construction. This mainly includes influencing factors such as the urban construction land area, urban residential land area, urban construction financial expenditure, and urban management level (Table 2). With the help of the statistical analysis function of SPSS21.0 software, the explanatory variables that are significantly related to the absolute number of urban tourist attractions are screened out using correlation analysis tools, and then multiple regression analysis is carried out on the relevant explanatory variables by means of forced entry (Enter). The influencing factors of weak collinearity, a low fitting degree, and poor robustness, such as the urban employment population, urban consumption level, and per capita wage, are gradually eliminated. Finally, the explanatory constants with a high fitting degree to the absolute quantity change of urban tourist attractions are obtained.
It is not difficult to find from the table that the collinearity diagnosis results (VIF values) of each explanatory variable are less than 7.5, indicating that there is no collinearity relationship among the variables. The Sig. value of each variable was less than 0.05, indicating that each variable had a significant influence on the explanatory model [47]. At the same time, the absolute value of the T value of the explanatory model is far greater than 1.96, which further shows that each explanatory variable has a strong influence on the explanatory model. Finally, the Sig. values of the explanatory models were all found to be 0.000 a in the regression variance test (Table 3), indicating that the explanatory models were of great statistical significance. Moreover, the R2 value of the interpretation model is greater than 0.6, which proves once again that the interpretation model has good robustness, a high fitting degree, and excellent quality. It can be used to explain the main motivation and mechanism behind the absolute number change distribution of tourist attractions in each city. The histogram of regression model residuals also conforms to a normal curve distribution (Figure 4), which further indicates that the regression model has a high degree of fitting and has strong statistical significance, and it can be used to analyze and explain the main factors affecting the spatial distribution of urban tourist attractions. The explanatory model is:
Y = −90.641 + 0.001X1 − 0.375X2 + 0.001X3 + 0.002X4 + 0.106X5 + 0.003X6
Among them, X1 represents the number of employed persons in urban units at the end of the tertiary industry in the whole city. X2 represents the area of urban construction land (km2). X3 represents the land area of the administrative region of the whole city (km2). X4 represents the per capita GDP of the whole city (yuan). X5 represents the residential sales area of the whole city (10,000 m2). X6 represents the employees of urban units at the end of the year in public administration, social protection, and social organizations.
From the interpretive model, first of all, it is not difficult to find that the year-end employment of the tertiary industry in the city is positively correlated with the increase or decrease in the number of urban tourist attractions. The increase in the number of employees in the local tertiary industry helps to increase the absolute number of tourist attractions. The contraction of the number of employees in the tertiary industry will also lead to a reduction in the number of regional tourist attractions. The city government should strengthen the skills training of the tertiary industry employees and improve the service level of the tourist attractions in order to improve the service quality of the tourist attractions. The residential sales area of the whole city also shows a significant positive correlation with the number of urban tourist attractions. This also shows that the development of the urban real estate industry also directly affects the level of urban tourism resource construction; the healthy development of the real estate industry is conducive to the development and construction of high-quality tourism resources. Per capita GDP also shows a significant positive correlation with the number of urban tourist attractions. Regional per capita GDP is also one of the measures of urban economic development, which also reflects that urban economic benefits also affect the increase or decrease in the number of urban tourist attractions to a certain extent. When the urban economy is in recession, the resources for the development and construction of urban tourism resources are bound to decrease. Of course, the higher the per capita GDP, the higher the per capita income level, and people are more willing to visit tourist attractions for consumption, further promoting the development of tourist attractions. Moreover, the employees of public management, social protection, and social organizations in urban units at the end of the year are also positively correlated with urban tourist attractions. The number of personnel engaged in public management, social protection, and social organizations is directly related to the level of urban management, which also shows that the development of the urban management level also directly affects the development of urban tourist attractions. Of course, besides the significant positive correlation, there is a negative correlation between the area of urban construction land and the number of urban tourist attractions. From the coefficient of explanatory variables, it can be seen that if other variables remain unchanged, the increase in construction land in cities will reduce tourist attractions. This can also be seen in the urban construction of the city’s tourist attractions of the destruction. Based on this, urban transition or blind construction is not conducive to the protection and development of urban tourism resources. When the city develops the real estate industry, it also needs to increase the investment in the construction of tourist attractions, to solve the problem of increasing construction land and reducing tourism resources.
In summary, the scale of urban construction, the employment population of the tertiary industry, the urban economy, the level of urban management, and the development of the tertiary industry are the main factors affecting the increase and decrease in the number of urban tourism resources. At the same time, an excellent real estate economy is the driving force for the high-quality development and construction of tourism resources. The two complement each other and promote each other. Of course, with the process of urban construction and expansion, we should also increase the investment in tourism resource construction, so as to enable the two to develop in a balanced and coordinated way as far as possible [48].
5. Discussion
The results show that the quantity distribution of tourism resources in China is sparse in the west and dense in the east, the area scale is wide in the west and small in the east, and the tourism development is sparse in the west and prosperous in the east. The urban construction scale, urban population scale, government financial expenditure, development of tertiary industry, and urban economic development level are the main reasons for the increase and decrease in tourism resources. Tourism resources are significantly affected by urbanization: 66.8% of scenic spots are within 30 km of towns, and 92.8% of scenic spots are within 100 km of towns. Most of the scenic spots are affected by the geological conditions and human activities, and the degree of landscape ecological fragmentation is high [49].
5.1. Scenic Spots Are Included in the National Park System
With the introduction of the guidance for the construction of the national park system, scenic spots have begun to play the role of important public resources in the public eye. Protection should be included in the unified planning of land and space when different scenic spots formulate protection development planning, management, and maintenance measures. We should pay attention to the characteristic value system of protecting scenic resources, advocating for local protection, benefit sharing, and giving full play to the spiritual education and ecological poverty alleviation functions of scenic spots. Moreover, we should optimize the structure of existing nature reserves and clarify the systems of various nature reserves [50]. The construction of a natural reserve system with national parks as the main body can neither be simply added up nor pushed back. A large part of this needs to be integrated and optimized from existing nature reserves, which means that eligible scenic spots should be managed as national parks.
5.2. Optimization of Landscape Pattern in Urban Built-Up Area
According to the research results, for every 1 km2 of construction land in the city, the city will lose 0.455 tourist attractions. Rapid urban expansion is also the main factor responsible for destroying scenic spots. Large-scale urban land hardening and traffic line construction cut and occupy the scenic land, deepening the fragmentation of scenic spots. The landscape pattern in the city should be taken as the object of tourism resource protection and control and be included in the red line of ecological protection [51]. When unreasonable urban construction has a negative impact on the pattern of scenic spots, we should limit the destruction of construction activities to scenic spots and prevent the unlimited spread of urban land. The city should delimit reasonable urban development boundaries. For seriously damaged scenic spots, ecological restoration and ecological repair should be carried out. It is necessary to restore the damaged tourism resource system to its natural state through artificial reconstruction.
5.3. Scenic Spot Pattern Optimization
When given the role of public resource carrier, the balanced allocation and homogeneous construction of scenic spots are particularly important [52,53]. The mismatch of recreation resources will also lead to the inability to meet people’s growing needs for a better life, and there is no way to solve the contradiction between people’s growing needs for a better life and unbalanced and inadequate development. Based on this, in view of the unbalanced spatial distribution of national tourism resources found in this study, policy suggestions for the optimization of the pattern of scenic spots are put forward as follows. First of all, in view of the spatial pattern of strong in the southeast and weak in the northwest, the state needs to formulate national park system construction policies according to local conditions. Local governments need to give priority to strengthening the investment in the construction of scenic spots in Northwest China to improve the quality of scenic spots in the low-quality gathering belt of “Inner Mongolia–Qinghai–Tibet”. Secondly, we should optimize the structure of existing nature reserves, clarify the relationship between scenic spots and nature reserves, integrate and optimize some high-quality scenic spots, and bring them into the nature reserve system with national parks as the main body. Lastly, with these measures, the government’s fiscal expenditure is properly inclined, the scale of urban construction is strictly controlled, and the urban tourism industry is vigorously developed, which is helpful to increase and improve the quality of urban tourism resources.
6. Conclusions
- China’s tourism resources have gradually formed a “Jinan–Hangzhou–Xiamen” construction advantage belt. The total number of tourism resources in East China is in an absolute dominant position within the whole country, and the construction advantage of A-level tourist attractions is the most obvious. South China and North China are at a medium level, whereas Southwest, Northeast, and Northwest China are inferior areas regarding the total amount of A-level tourist attractions. The spatial distribution characteristics of high location entropy point aggregation, middle location entropy belt aggregation, and low location entropy sheet aggregation are shown.
- On the whole, China’s tourism resources show a spatial pattern of being strong in the southeast and weak in the northwest, showing a spatial structure of concentrated, contiguous distribution in the whole region, A-level belt distribution, and state-level point distribution. The distribution pattern of concentrated, contiguous areas is consistent with the spatial distribution of major urban agglomerations in China. There is a serious imbalance in the allocation of A-level tourist attractions, and the imbalance in the allocation of A-level tourist resources in the east and west is the most significant. It is necessary to further improve the allocation of A-level tourism resources in the central and western regions. The allocation level of A-level tourism resources in the eastern region is relatively high, which drives the improvement in the tourism resource level in the surrounding areas and forms a major correlation with the surrounding areas. The distribution of national scenic spots is strong in the south and weak in the north. The national scenic spots mainly cluster in provincial capitals, forming a stable and balanced cross-distribution pattern. However, the national scenic spots show obvious distribution characteristics of “administrative regionalization”.
- China’s tourism resources have formed three low-quality distribution zones of “Taiyuan–Wuhan–Guangzhou”, “Hohhot–Xining–Lhasa”, and the southeast coast, whereas “Hohhot–Xining–Lhasa” and the two low-quality gathering zones of the southeast coast also show a strong construction advantage, which also reflects that the two belt gathering areas have great potential to improve the landscape quality.
- The scale of urban construction, the scale of employees in the tertiary industry, the level of urban management, the development of the tertiary industry, and the level of urban economic development are closely related to the spatial distribution of tourism resources. The regression coefficients of the related dependent variables are positive, which indicates that some variables have both positive and negative effects on the spatial distribution of tourism resources at different levels.
Author Contributions
H.H. conceived and designed the study; X.Z. performed the experiments and analyzed the data. Y.T. and Z.C. reviewed and edited the manuscript. All authors have read and agreed to the published version of the manuscript.
Funding
This research is supported by the Center for Balance Architecture of Zhejiang University (Project No: K Heng 20203512-02B, Index and Planning Methods of Resilient Cities). This research is supported by the New Think Tank Project of Shaanxi Provincial Department of Education Key Scientific Research Program (Project No.: 22JT013, Research on Spatial Allocation Characteristics and Optimization of Basic Education Facilities in Shangluo City Based on Big Data Perspective).
Data Availability Statement
Not applicable.
Conflicts of Interest
The authors declare no conflict of interest.
References
- Wang, T.; Wang, L.; Ning, Z.Z. Spatial pattern of tourist attractions and its influencing factors in China. J. Spat. Sci. 2020, 65, 327–344. [Google Scholar] [CrossRef]
- Shuxin, W.; Chunping, T.; Jiankuo, D.; Zi, T.; Chenyan, L.; Yarong, W. A responsible tourism system at glacier tourism sites: Reducing the impacts of tourism activities on glaciers. J. Resour. Ecol. 2022, 13, 697–707. [Google Scholar] [CrossRef]
- Vázquez, G.A.; Solís, M.V.V. Evaluation of Natural and Cultural Resources to Create a Tourism Corridor in the Plateau of San Luis Potosí, Mexico. Investig. Geográficas Boletín Inst. Geogr. 2017, 94, 91–105. [Google Scholar]
- Sangchumnong, A. Development of a Sustainable Tourist Destination Based on the Creative Economy: A Case Study of Klong Kone Mangrove Community, Thailand. Kasetsart J. Soc. Sci. 2018, 2, 2452–3151. [Google Scholar] [CrossRef]
- Chen, J.B.; Ming, Q.Z. Evaluation of health tourism resources based on improved analytic hierarchy process. Geogr. Geogr. Inf. Sci. 2018, 34, 69–73. [Google Scholar] [CrossRef]
- Chen, Z.Y.; Wu, Y.P.; Li, T.Y. Analysis on the Stage Evolution and Property Right Dilemma of Rural Tourism Resources Development: A Case Study of Tianlong Tunpu in Guizhou Province. Trop. Geogr. 2012, 32, 201–209. [Google Scholar] [CrossRef]
- MacLeod, N.; Shelley, J.; Morrison, A.M. The touring reader: Understanding the bibliophile’s experience of literary tourism. Tour. Manag. 2018, 67, 388–398. [Google Scholar] [CrossRef]
- Bevilacqua, E.; Casti, E. The structure and impact of international tourism in the Veneto region, Italy. GeoJournal 1989, 19, 285–287. [Google Scholar] [CrossRef]
- Smith, S.L.J. Regional analysis of tourism resources. Ann. Tour. Res. 1987, 14, 254–273. [Google Scholar] [CrossRef]
- Pearce, D.G. Tourism Today. A Geographical Analysis; Longman Scientific & Technical: Harlow, UK, 1987. [Google Scholar]
- Hernández, J.M.; Kirilenko, A.P.; Stepchenkova, S. Net-work Approach to Tourist Segmentation via User Generated Content. Ann. Tour. Res. 2018, 73, 35–47. [Google Scholar] [CrossRef]
- Coghlan, A. Linking Natural Resource Management to Tourist Satisfaction: A Study of Australia’s Great Barrier Reef. J. Sustain. Tour. 2021, 20, 41–58. [Google Scholar] [CrossRef]
- Wu, J.Y. Study on spatial distribution characteristics of Chinese National Parks. Geogr. Res. 2014, 33, 1747–1757. [Google Scholar]
- Jinghu, P.; Junfeng, L.; Yibo, C. Quantitative geography analysis on spatial structure of A-grade tourist attractions in China. J. Resour. Ecol. 2015, 6, 12–20. [Google Scholar] [CrossRef]
- Lu, S.; Zhang, J.; Zhang, H. Spatial differential features of inbound tourists in Jiangsu, China. In Proceedings of the 2011 19th International Conference on Geoinformatics, Shanghai, China, 24–26 June 2011; pp. 1–4. [Google Scholar] [CrossRef]
- Qiu, Y.; Zhu, Z.; Huang, H.; Bing, Z. Study on the evolution of B&Bs spatial distribution based on exploratory spatial data analysis (ESDA) and its influencing factors—With Yangtze River Delta as an example. Eur. J. Remote Sens. 2021, 54 (Suppl. S2), 296–308. [Google Scholar] [CrossRef]
- Wu, X.; Chen, C. Spatial distribution and accessibility of high level scenic spots in Inner Mongolia. Sustainability 2022, 14, 7329. [Google Scholar] [CrossRef]
- Zhang, A.; Yang, Y.; Chen, T.; Liu, J.; Hu, Y. Exploration of spatial differentiation patterns and related influencing factors for National Key Villages for rural tourism in China in the context of a rural revitalization strategy, using GIS-based overlay analysis. Arab. J. Geosci. 2021, 14, 83. [Google Scholar] [CrossRef]
- Xu, B.; Pan, J. Spatial distribution characteristics of national protected areas in China. J. Geogr. Sci. 2019, 29, 2047–2068. [Google Scholar] [CrossRef]
- Yuxi, Z.; Linsheng, Z.; Ling-En, W.; Hu, Y. Measuring the conflict tendency between tourism development and ecological protection in protected areas: A study on National Nature Reserves in China. Appl. Geogr. 2022, 142, 102690. [Google Scholar] [CrossRef]
- Jin, S.; Yang, J.; Wang, E.; Liu, J. The influence of high-speed rail on ice–snow tourism in northeastern China. Tour. Manag. 2020, 78, 104070. [Google Scholar] [CrossRef]
- Liu, X.; Wang, C.; Jiang, D.; Wang, Y.; Gao, J.; Jin, C.; Ma, W.; Yuan, J. Selection of National Park Candidate Areas Based on Spatial Overlap Characteristics of Protected Areas in China. Sustainability 2022, 14, 2578. [Google Scholar] [CrossRef]
- Li, X.; Song, S.S.; Jin, F.H. Positioning and development of scenic spots in Zhejiang Province under the new situation—A study based on the construction of nature reserve system. Urban Plan. 2020, 44 (Suppl. S1), 34–40. [Google Scholar] [CrossRef]
- Stoffelen, A.; Vanneste, D. Tourism and cross-border regional development: Insights in European contexts. Eur. Plan. Stud. 2017, 25, 1013–1033. [Google Scholar] [CrossRef]
- Priporas, C.V.; Vassiliadis, C.A.; Stylos, N.; Fotiadis, A.K. The effect of sport tourists’ travel style, destination and event choices, and motivation on their involvement in small-scale sports events. Event Manag. 2018, 22, 745–765. [Google Scholar] [CrossRef]
- Vasiliadis, C.A.; Kobotis, A. Spatial analysis—An application of nearest–neighbour analysis to tourism locations in Macedonia. Tour. Manag. 1999, 20, 141–148. [Google Scholar] [CrossRef]
- Liu, D.; Yin, Z. Spatial-temporal pattern evolution and mechanism model of tourism ecological security in China. Ecol. Indic. 2022, 139, 108933. [Google Scholar] [CrossRef]
- Zhang, Y.; Li, W.; Li, Z.; Yang, M.; Zhai, F.; Li, Z.; Yao, H.; Li, H. Spatial Distribution Characteristics and Influencing Factors of Key Rural Tourism Villages in China. Sustainability 2022, 14, 14064. [Google Scholar] [CrossRef]
- Yang, R.; Zhang, X.; Xu, Q. Spatial Distribution Characteristics and Influencing Factors of Agricultural Specialized Villages in Guangdong Province, China. Chin. Geogr. Sci. 2022, 32, 1013–1034. [Google Scholar] [CrossRef]
- Liao, Z.; Zhang, L. Spatial distribution evolution and accessibility of A-level scenic spots in Guangdong Province from the perspective of quantitative geography. PLoS ONE 2021, 16, e0257400. [Google Scholar] [CrossRef]
- Shu, H.; Xiao, C.; Ma, T.; Sang, W. Ecological health assessment of chinese national parks based on landscape pattern: A case study in shennongjia national park. Int. J. Environ. Res. Public Health 2021, 18, 11487. [Google Scholar] [CrossRef]
- Wan, J.; Yan, J.; Wang, X.; Liu, Z.; Wang, H.; Wang, T. Spatial-temporal pattern and its influencing factors on urban tourism competitiveness in City agglomerations across the Guanzhong plain. Sustainability 2019, 11, 6743. [Google Scholar] [CrossRef]
- Zhang, S.; Liu, J.; Song, C.; Chan, C.-S.; Pei, T.; Wenting, Y.; Xin, Z. Spatial-temporal distribution characteristics and evolution mechanism of urban parks in Beijing, China. Urban For. Urban Green. 2021, 64, 127265. [Google Scholar] [CrossRef]
- Li, D.H.; Zhang, X.Y.; Lu, L.; Zhang, X.; Li, L. Spatial distribution characteristics and influencing factors of high-level tourist attractions in the yellow river basin. Econ. Geogr. 2020, 40, 70–80. [Google Scholar]
- Lin, G.; Xiang, L.; Sang, K. Scenic railway mapping: An analysis of spatial patterns in France based on historical GIS. ISPRS Int. J. Geo Inf. 2022, 11, 99. [Google Scholar] [CrossRef]
- Weng, G.; Li, H.; Li, Y. The temporal and spatial distribution characteristics and influencing factors of tourist attractions in Chengdu-Chongqing economic circle. Environ. Dev. Sustain. 2022, 1–22. [Google Scholar] [CrossRef]
- Songchitruksa, P.; Zeng, X. Getis–Ord spatial statistics to identify hot spots by using incident management data. Transp. Res. Rec. 2010, 2165, 42–51. [Google Scholar] [CrossRef]
- Parzen, E. On estimation of a probability density function and mode. Ann. Math. Stat. 1962, 33, 1065–1076. [Google Scholar] [CrossRef]
- Hyndman, R.J.; Bashtannyk, D.M.; Grunwald, G.K. Estimating and visualizing conditional densities. J. Comput. Graph. Stat. 1996, 5, 315–336. [Google Scholar]
- Isserman, A.M. The location quotient approach to estimating regional economic impacts. J. Am. Inst. Plan. 1977, 43, 33–41. [Google Scholar] [CrossRef]
- Billings, S.B.; Johnson, E.B. The location quotient as an estimator of industrial concentration. Reg. Sci. Urban Econ. 2012, 42, 642–647. [Google Scholar] [CrossRef]
- Park, J.; Kang, H.Y.; Lee, J. A spatial-temporal POI data model for implementing location-based services. J. Korean Soc. Surv. Geod. Photogramm. Cartogr. 2016, 34, 609–618. [Google Scholar] [CrossRef]
- Wang, T. Countermeasures for High Quality Development of China’s Tourist Attractions. Int. J. Educ. Humanit. 2022, 4, 29–33. [Google Scholar] [CrossRef]
- Moineddin, R.; Beyene, J.; Boyle, E. On the location quotient confidence interval. Geogr. Anal. 2003, 35, 249–256. [Google Scholar] [CrossRef]
- Yang, Y.; Liu, Z.H.; Qi, Q. Domestic tourism demand of urban and rural residents in China: Does relative income matter? Tour. Manag. 2014, 40, 193–202. [Google Scholar] [CrossRef]
- Kane, R.L. The futility utility weighting. J. Clin. Epidemiol. 2008, 61, 1195–1196. [Google Scholar] [CrossRef]
- Yildiz, Y.; Kirbas, A.; Gurer, O.; Bilal, M.S. Anaesthetic and post-operative management of a modified Norwood operation for hypoplastic left heart syndrome: A retrospective series of 11 cases. Cardiol. Young 2011, 21, 321–327. [Google Scholar] [CrossRef] [PubMed]
- Guo, T.-Y.; Zhang, P.; Shao, F.; Liu, Y.-S. Allocation optimization of bicycle-sharing stations at scenic spots. J. Cent. S. Univ. 2014, 21, 3396–3403. [Google Scholar] [CrossRef]
- Wei, X.; Shibo, F. Environment Protection and Profit: Impact of Environmental Management for Hotels Performance. Tour. Trib. 2014, 29, 83–91. [Google Scholar] [CrossRef]
- Zhang, X.; Li, S.; Yu, H. Analysis on the ecosystem service protection effect of national nature reserve in Qinghai-Tibetan Plateau from weight perspective. Ecol. Indic. 2022, 142, 109225. [Google Scholar] [CrossRef]
- Cui, M.; Zhou, J.X.; Huang, B. Benefit evaluation of wetlands resource with different modes of protection and utilization in the Dongting Lake region. Procedia Environ. Sci. 2012, 13, 2–17. [Google Scholar] [CrossRef]
- Wang, Q.; Zhang, J.H.; Yang, X.Z. Study on tourism water supply and demand system safety and dynamic control in Huangshan Mountain. J. Nat. Resour. 2007, 22, 896–906. [Google Scholar]
- Huang, C.L. Current status, protection and development strategies of Liuzhou rural eco-tourism resources. Guizhou Agric. Sci. 2013, 5, 234–238. [Google Scholar]
Figure 1.
Nuclear density distribution of scenic spots in China: (A) nuclear density distribution of scenic spots in China, (B) nuclear density distribution of A-level scenic spots in China, (C) nuclear density distribution of national scenic spots in China.
Figure 1.
Nuclear density distribution of scenic spots in China: (A) nuclear density distribution of scenic spots in China, (B) nuclear density distribution of A-level scenic spots in China, (C) nuclear density distribution of national scenic spots in China.

Figure 2.
Spatial distribution of high-quality scenic spots in China.
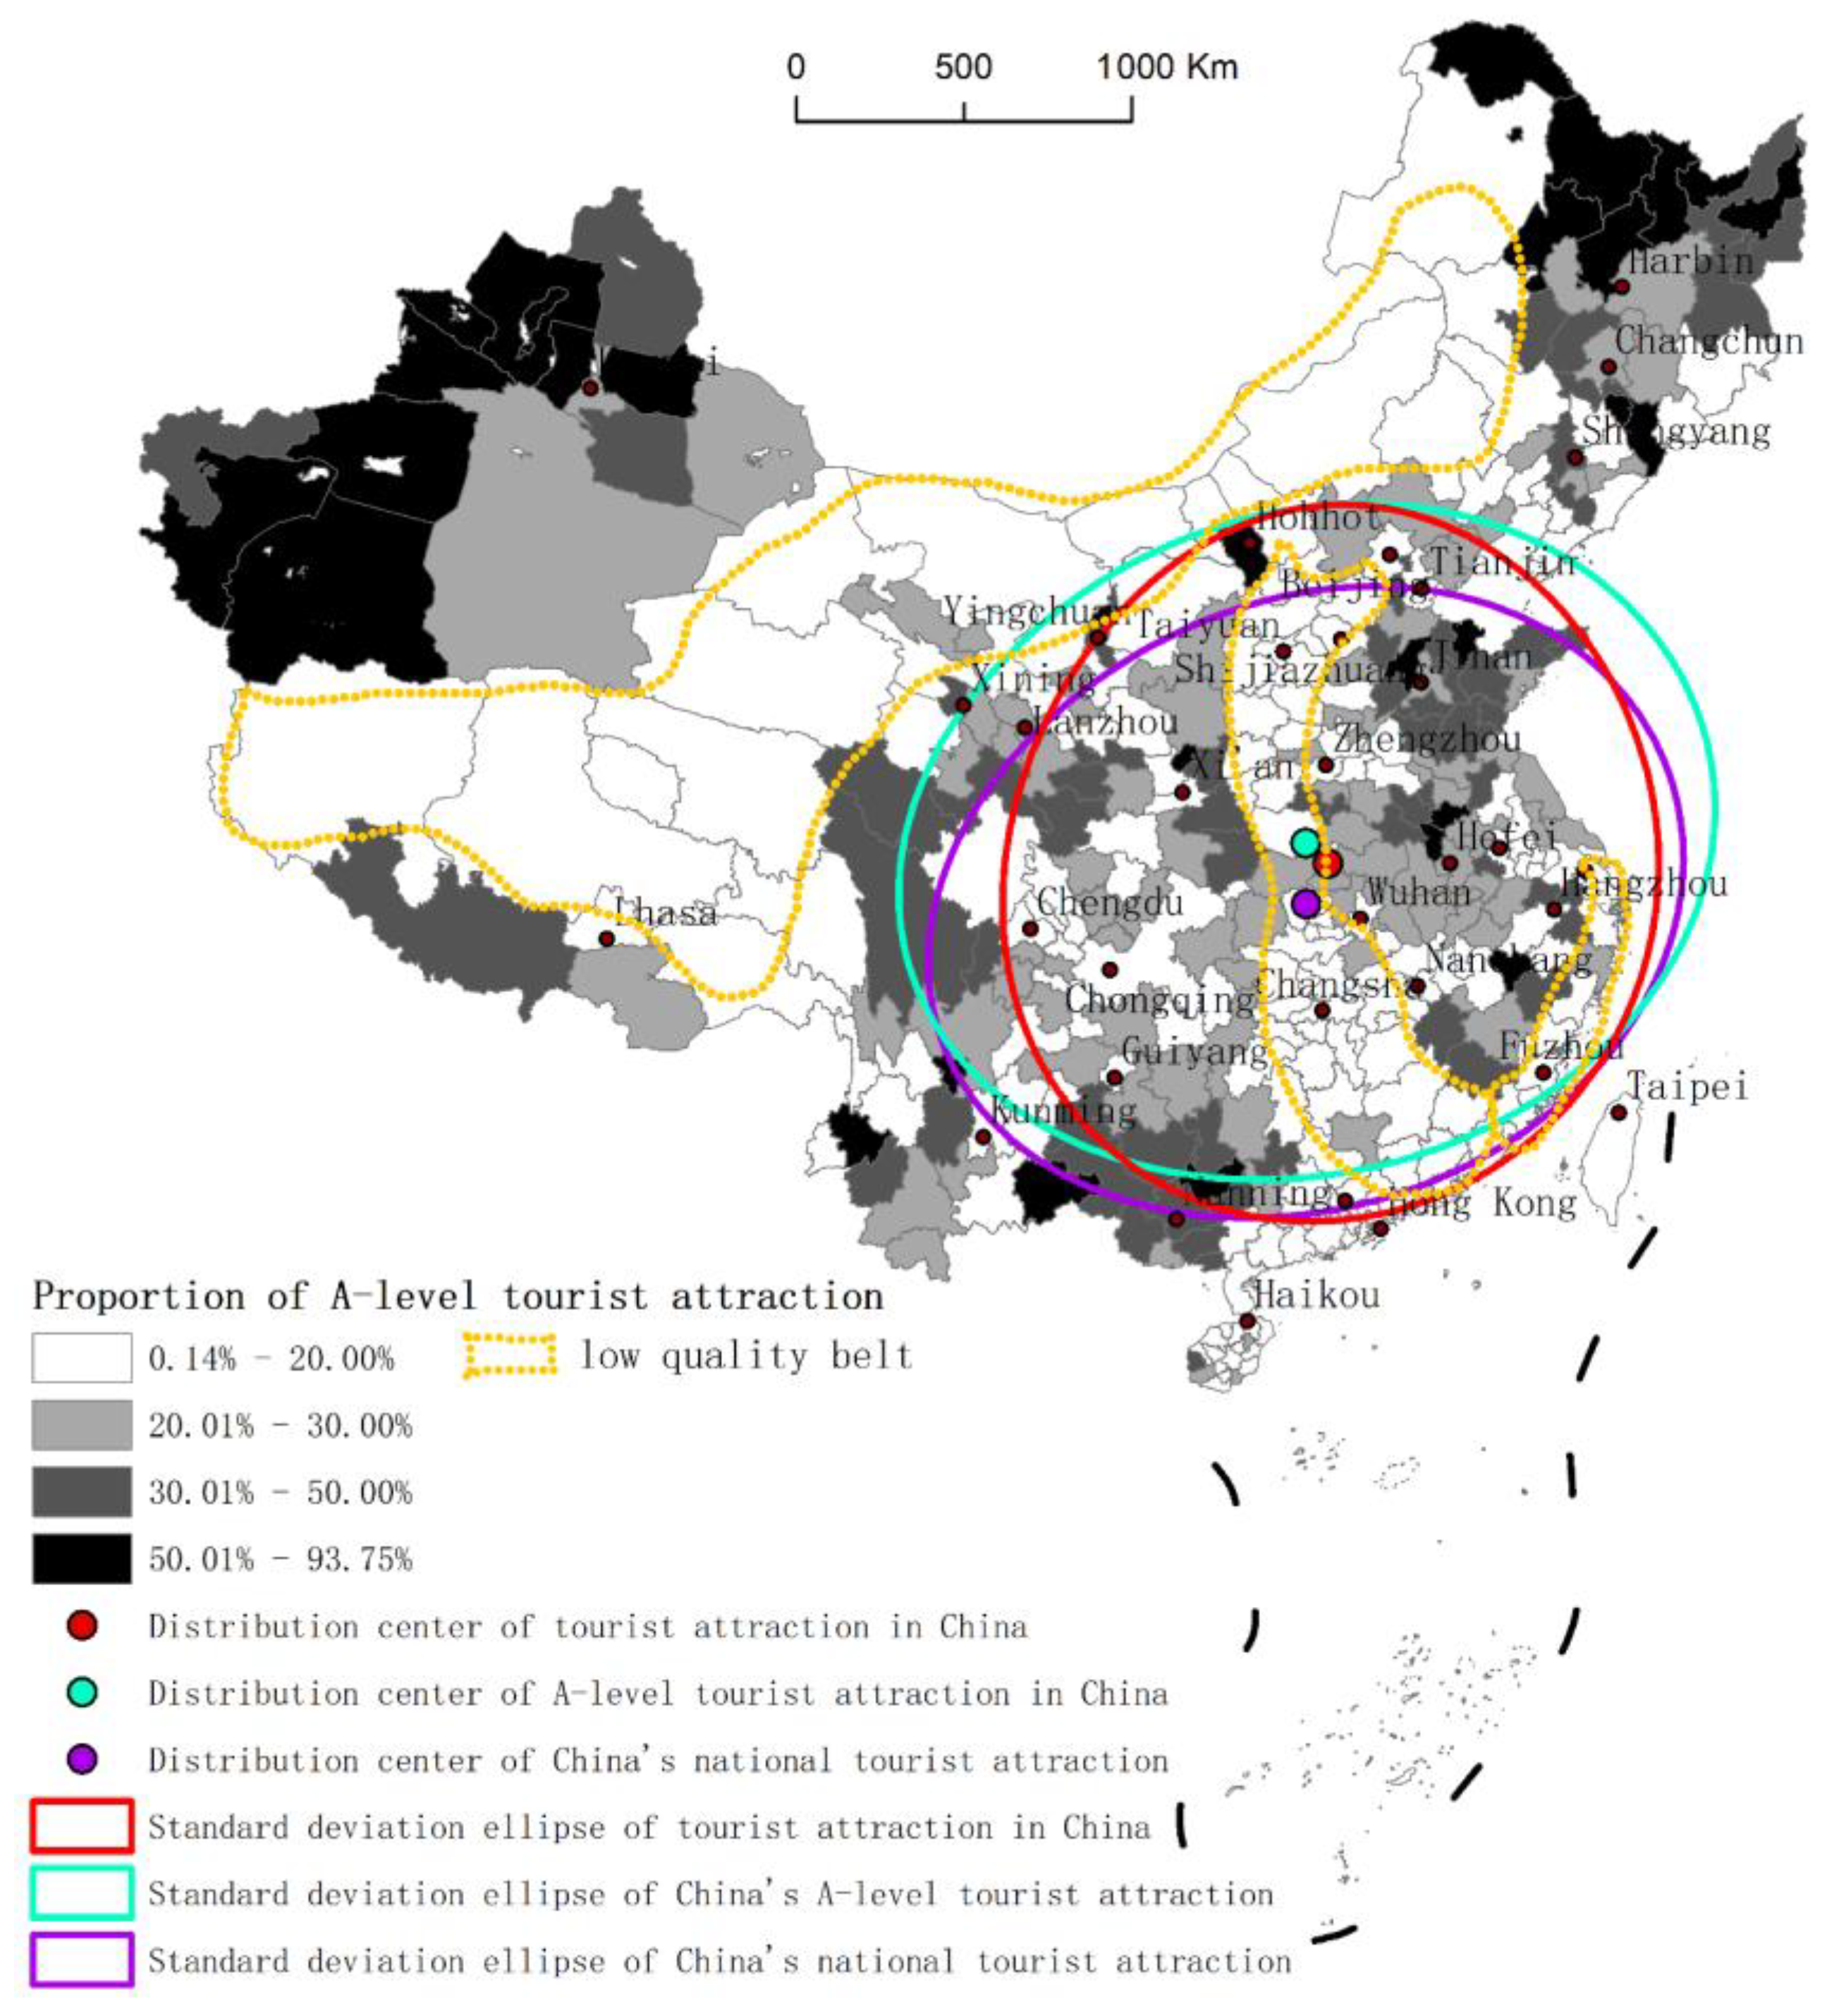
Figure 3.
Distribution of hot and cold zones in China’s tourist attractions: (A) national tourist scenic spots, (B) A-level scenic spots, (C) national scenic spots.
Figure 3.
Distribution of hot and cold zones in China’s tourist attractions: (A) national tourist scenic spots, (B) A-level scenic spots, (C) national scenic spots.
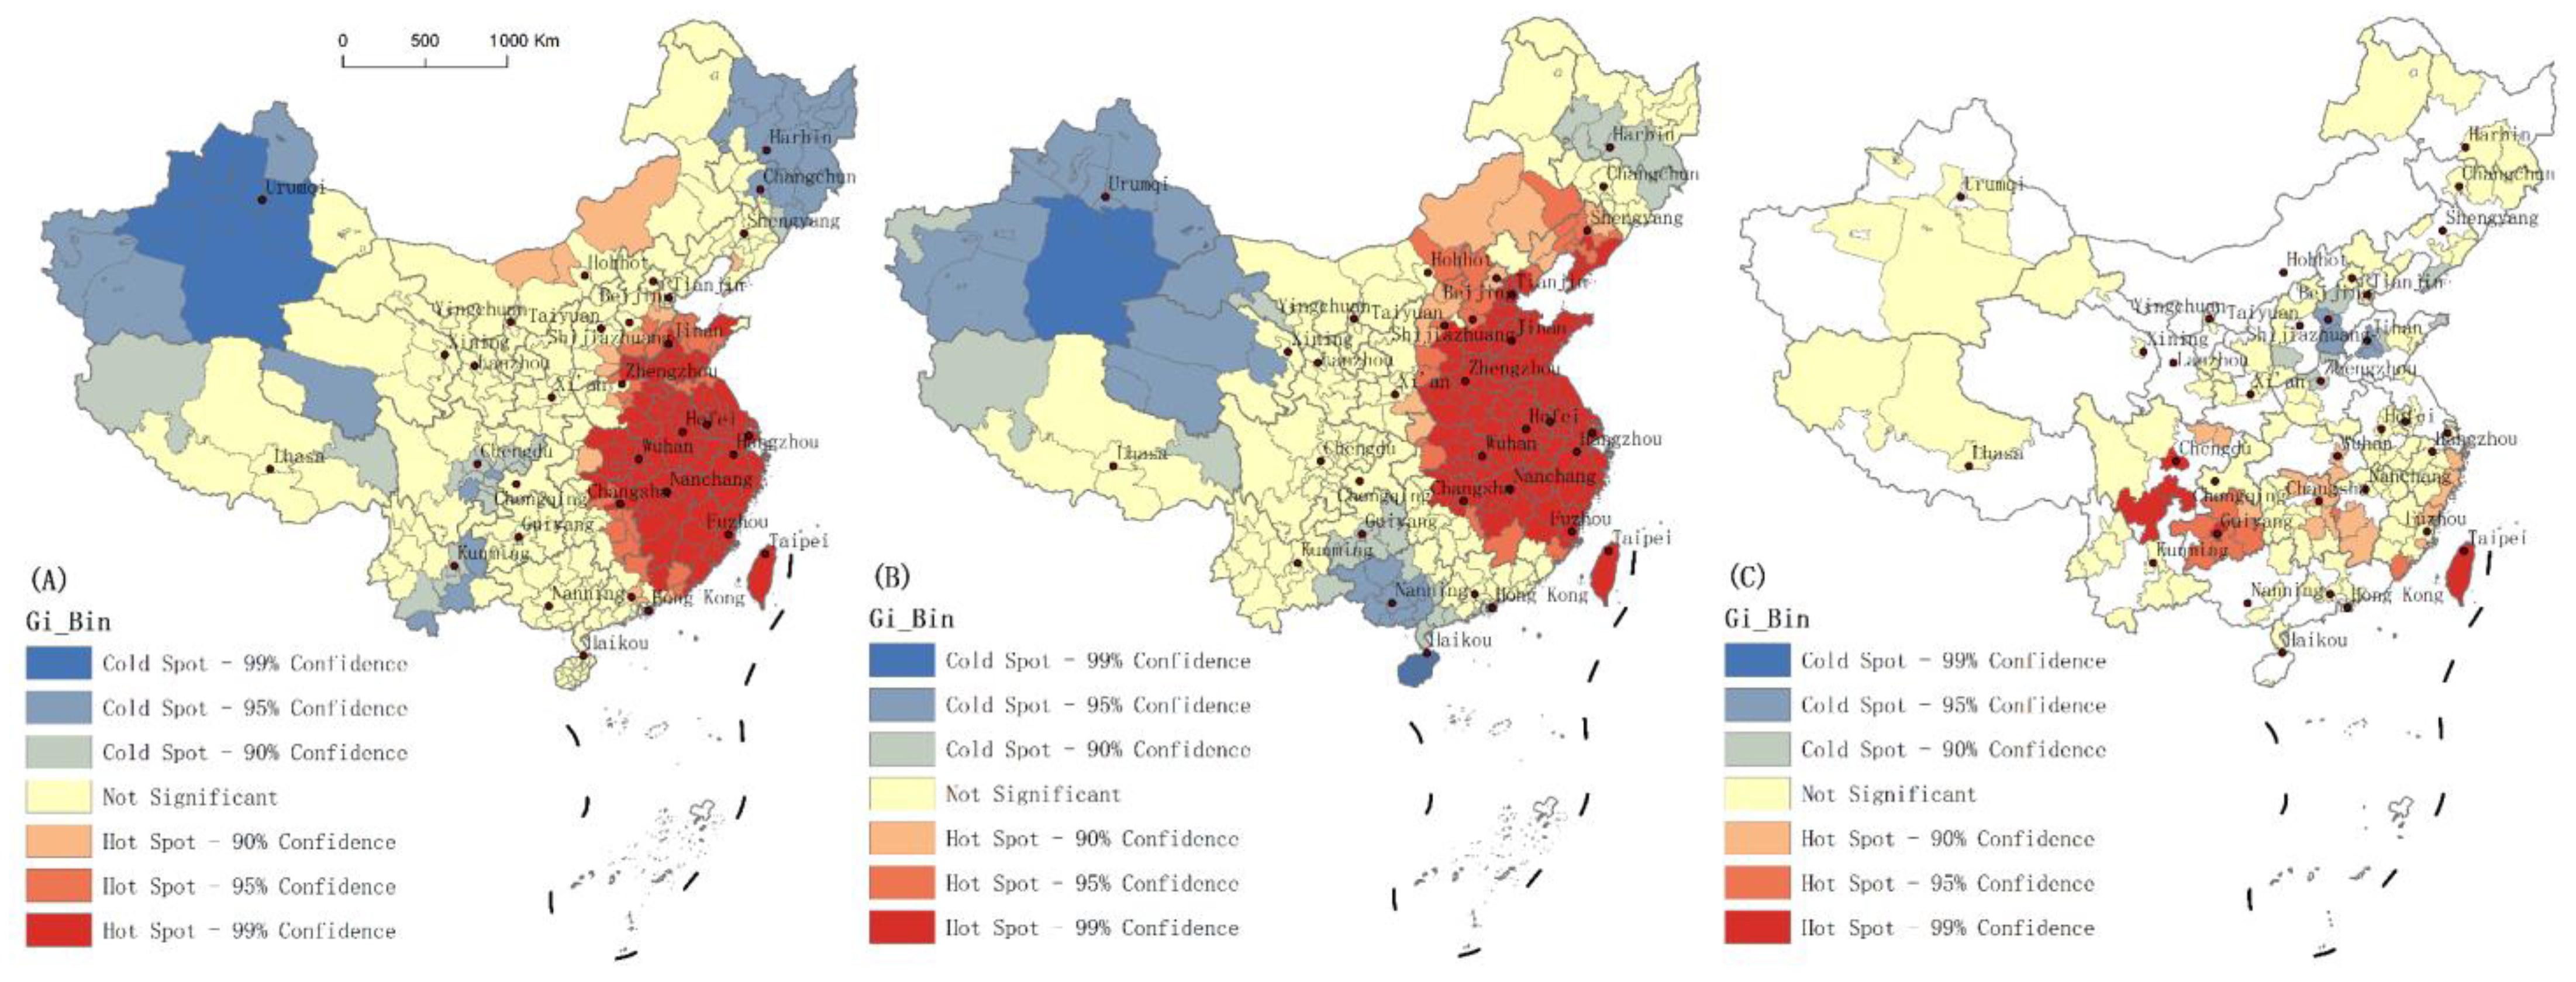
Figure 4.
Standardized residual histogram.


Table 1.
Selection and description of hypothesis-influencing variables.
| Influence Factor Hypothesis | Index Selection | Symbol | Unit | Average | Standard Deviation |
|---|---|---|---|---|---|
| Number of urban scenic spots | Y | 233.53 | 264.614 | ||
| Employment in tertiary industry | Number of employed persons in urban units at the end of the tertiary industry in the whole city | X1 | 316,588.21 | 591,375.155 | |
| Urban land use scale | Urban construction land area | X2 | km2 | 149.02 | 212.422 |
| Land area of administrative area of the whole city | X3 | km2 | 18,650.21 | 26,146.810 | |
| Urban economy | Per capita GDP | X4 | yuan | 60,679.49 | 35,109.878 |
| Living space | Residential sales area of the whole city | X5 | 10,000 m2 | 465.34 | 538.152 |
| Management level | Employees of urban units at the end of the year in public administration, social protection and social organizations | X6 | 55,436.33 | 44,730.088 |
Table 2.
Multiple linear regression analysis of the number of urban tourist attractions and related influencing variables.
Table 2.
Multiple linear regression analysis of the number of urban tourist attractions and related influencing variables.
| Model | Classification of Indicators | Variable | B | T | Sig. | VIF |
|---|---|---|---|---|---|---|
| Model 1: (Dependent variable: number of urban tourist attractions) | (constant) | −90.641 | −3.756 | 0.000 | ||
| Employment in tertiary industry | Number of employed persons in urban units at the end of the tertiary industry in the whole city (X1) | 0.001 | 5.126 | 0.000 | 6.491 | |
| Urban land use scale | Urban construction land area/km2 (X2) | −0.375 | −4.583 | 0.000 | 4.133 | |
| Land area of administrative area of the whole city/km2 (X3) | 0.001 | 3.250 | 0.001 | 1.040 | ||
| Urban economy | Per capita GDP/yuan (X4) | 0.002 | 6.092 | 0.000 | 1.418 | |
| Living space | Residential sales area of the whole city/10,000 m2 (X5) | 0.106 | 4.550 | 0.000 | 2.152 | |
| Management level | Employees of urban units at the end of the year in public administration, social protection and social organizations (X6) | 0.003 | 5.541 | 0.000 | 5.964 |
Table 3.
Fitting degree test and variance analysis of multivariate linear regression model.
| Model Summary b | ||||
|---|---|---|---|---|
| Model | R | R2 | Adjusted R2 | Sig. |
| 1 | 0.840 a | 0.705 | 0.699 | 0.000 a |
a Indicates ‘adjusted’, which means that the R2 adjusted by degrees of freedom is more reliable than the original R2. b Dependent variable: the number of urban tourist attractions.
Disclaimer/Publisher’s Note: The statements, opinions and data contained in all publications are solely those of the individual author(s) and contributor(s) and not of MDPI and/or the editor(s). MDPI and/or the editor(s) disclaim responsibility for any injury to people or property resulting from any ideas, methods, instructions or products referred to in the content. |
© 2023 by the authors. Licensee MDPI, Basel, Switzerland. This article is an open access article distributed under the terms and conditions of the Creative Commons Attribution (CC BY) license (https://creativecommons.org/licenses/by/4.0/).
Share and Cite
MDPI and ACS Style
Zhang, X.; Han, H.; Tang, Y.; Chen, Z. Spatial Distribution Characteristics and Driving Factors of Tourism Resources in China. Land 2023, 12, 1029. https://doi.org/10.3390/land12051029
AMA Style
Zhang X, Han H, Tang Y, Chen Z. Spatial Distribution Characteristics and Driving Factors of Tourism Resources in China. Land. 2023; 12(5):1029. https://doi.org/10.3390/land12051029
Chicago/Turabian StyleZhang, Xiaodong, Haoying Han, Yongjun Tang, and Zhilu Chen. 2023. "Spatial Distribution Characteristics and Driving Factors of Tourism Resources in China" Land 12, no. 5: 1029. https://doi.org/10.3390/land12051029
Note that from the first issue of 2016, this journal uses article numbers instead of page numbers. See further details here.