


Ex-Ante Eco-Efficiency Assessment of Dendromass Production: Conception and Experiences of an Innovation Project

1
Wood K Plus—Competence Centre for Wood Composites and Wood Chemistry, Kompetenzzentrum Holz GmbH, Altenberger Straße 69, 4040 Linz, Austria
2
Department of Economics and Social Sciences, Institute of Marketing and Innovation, University of Natural Resources and Life Sciences Vienna, Feistmantelstraße 4, 1180 Vienna, Austria
3
Institute of Environmental Systems Sciences, University of Graz, Merangasse 18, 8010 Graz, Austria
*
Author to whom correspondence should be addressed.
Land 2023, 12(4), 839; https://doi.org/10.3390/land12040839
Submission received: 28 February 2023
/
Revised: 28 March 2023
/
Accepted: 4 April 2023
/
Published: 6 April 2023
(This article belongs to the Special Issue Sustainable Land-Based Bioeconomy Development)
Abstract
:Rising demand for bio-based products exerts growing pressure on natural resources such as wood. The agricultural technique of short rotation coppice (SRC) to produce dendromass from fast growing trees has gained relevance to ease the pressure of demand for wood from forests. The European-funded project Dendromass4Europe supports the establishment of SRC in Western Slovakia and its biomass use for four new bio-based materials, in the context of a developing bioeconomy. Along with the development of the SRC and material value chains, eco-efficiency assessment is carried out to anticipate areas of critical concern and derive measures for improvement. Among many other assessment approaches, eco-efficiency assessment was conducted by combining Life Cycle Assessment (LCA) and socio-economic assessment to optimize the whole production system towards eco-efficiency. An LCA study provided necessary data to assess the environmental performance. The added value and revenue results from the socio-economic assessment were used to assess the economic performance. The value chain of the moulded fibre parts shows the best eco-efficiency value, but only because its economic performance is comparatively strong. The lightweight boards have the least environmental impact but do not perform so well in terms of eco-efficiency. The overall eco-efficiency of the full value chain can be optimized only with a specific combination of all four dendromass-based materials within the whole production system.
1. Introduction
“The bioeconomy means using renewable biological resources from land and sea, like crops, forests, fish, animals and micro-organisms to produce food, materials and energy” [1]. It has been recognized as one potential sustainability approach [2] to support rural development, reduce the use of fossil resources, and inherently cut down on greenhouse gas emissions [1,3]. Here, innovation is seen as a key ingredient in bringing forward the bioeconomy transition [1,4]. However, bioeconomic innovations are not per se more sustainable [5]. Rising demand for bio-based products exerts growing pressure on natural resources such as wood. Instead of sourcing wood only from semi-natural forests, as practiced widely in Europe, the agricultural technique of short rotation coppice (SRC) to produce dendromass from fast-growing trees has gained relevance to ease the pressure of demand for wood from forests. To avoid competition for fertile lands that are also used for food production, the establishment of SRC in Slovakia is limited to marginal agricultural lands, where crop yields are limited due to low soil fertility. The adoption of SRC is reportedly beneficial due to farm diversification and new possibilities for income generation; however, its success depends on situational factors including market conditions and legal settings combined with personal factors such as values and attitudes [6]. Fürtner et al. [7] reported on social concerns related to SRC regarding workers’ health, safety, and working conditions as well as local communities’ employment and living conditions. Meanwhile, regional value creation and economic development are important aspects that have not yet been sufficiently covered. Perdomo et al. [8] reviewed several life-cycle assessments (LCA) of agricultural wood production, and observed a focus on potential impacts of climate change, eutrophication, and acidification, highlighting fertilizer application, harvesting, and transportation as environmentally relevant issues [8].
Complex systems with interlinkages between different dimensions of sustainability and different levels of assessment need to be understood, while unintended effects, trade-offs, and potential shifts in impacts from one life-cycle stage to another, need to be assessed [9,10]. One aspect of sustainable development is the support of rural development by using regionally available resources, creating new job opportunities, and, in doing so, supporting regional economies [1].
For emerging technologies and new products, identifying environmental hotspots and providing information for decisionmakers are seen as crucial starting points for sustainable product and process development [11]. It was found that 80% of environmental impacts are determined in the product design phase [12]. In this phase of R&D, profit maximization is usually the main driver, while environmental aspects are often neglected [13]. Integrating eco-efficiency in all phases of the product life cycle, as well as in management practices, provides the possibility to improve environmental and economic performance [14]. The application of eco-efficiency during the innovation process, from idea to R&D and all the way to market deployment, makes it feasible to anticipate opportunities to guide further R&D investments—the term “ex-ante eco-efficiency” stresses that the assessment is conducted prior to full commercialization.
The World Business Council for Sustainable Development (WBCSD) is a CEO-led organization advocating for economic and sustainable development. It was founded by the Swiss consultant Stephan Schmidheiny. The WBCSD published the eco-efficiency concept of Schaltegger and Sturm [15] and with that brought it toa broad audience.
Eco-efficiency involves a combined assessment of a product system’s environmental performance and a product system’s value [16]. It is a relative measure to compare one production system to another; the comparison can consist in alternatives within the product system itself. This makes it suitable for following the progress of innovation projects, process improvements, or variations. Process changes can be directly translated into a product system’s increase or decline in eco-efficiency. Note that better eco-efficiency can be achieved when environmental performance or value is improved. However, worsening the environmental performance for the sake of a higher product system value is not acceptable, according to the ISO 14045:2012 [16].
For the assessment of the environmental impacts, the standard refers to LCA (ISO 14040:2006, 14044), but there are different interpretations of how value should be depicted, often referred to as the economic part of the eco-efficiency ratio.
“The value of the product system may be chosen to reflect, for example, its resources, production processes, delivery, use efficiency, or a combination of these. The value may be expressed in monetary terms or other value aspects” [16].
A review of the literature since 2009 indicated that the concept of eco-efficiency has been applied in various fields. For example, it has been used in the fields of energy [17,18,19,20,21,22,23], transportation [24,25], material production [18,26,27,28,29,30,31], processing [32,33,34,35,36,37,38], and recycling [39,40]. Environmental indicators were given in all application cases and mostly refer to the calculation of environmental impacts according to LCA (ISO 14040:2006). This is the case probably because the literature search strategy combined the keywords “Life Cycle Assessment” and “eco-efficiency”. Moreover, a strong link to LCA is implemented directly in the eco-efficiency assessment standard ISO 14045:2012. That standard clearly defines the environmental performance as a set of indicators, and its calculation is defined equally clearly. The studies include various impact indicators such as land use, resource depletion, water depletion, eutrophication potential, acidification potential, ozone depletion potential, photochemical ozone, formation potential, climate change, and human toxicity, amongst others. Compared to the environmental performance, the economic perspective is interpreted more diversely. A standard approach of indicating the (economic) value of a product system is not observed in the application cases, due to a lack of specification in the eco-efficiency standard (ISO 14045:2012) and WBCSD approach. Furthermore, there is no standard for calculating life-cycle costs (LCC), although LCC (as a term) is often referred to in different standards. Twenty-two out of 26 studies implemented the value proposition as monetary value. As the measure of value, one case instead referred to the safety and recyclability of a product [37] and another to the technical properties of the product [28]. Eight studies applied LCC [25,26,27,30,34,39,41], five applied value added [21,31,38,41,42], and others earnings before interests [32], net profit [23], net present value [26], and costs or price-related indicators [20,24,29,35,43].
Assessing and interpreting the sustainability of production systems is challenging, because multiple aspects of environmental, economic, and social issues can be involved. The impression that results are ambiguous can arise due to the occurrence of trade-offs between the different pillars of sustainability [10,44] and even within the economic, social, and environmental impact categories. The concept of eco-efficiency addresses part of this ambiguity by combining the environmental impact and the benefit of a production system into a single indicator. As a set of indicators should be studied for each pillar instead of only a one, trade-offs cannot be fully avoided. Taking this into consideration, the eco-efficiency of a production system and its alternatives can be compared more effectively, ideally aiming at decreasing environmental pressure while increasing the product system’s value. Eco-efficiency always represents a ratio and cannot be used to make absolute statements [45]. The concept of eco-efficiency is developed and applied differently from product or company level or at the macroeconomic level or in different sectors and application cases, based on different methods and indicators [46].
The authors of this publication conducted an eco-efficiency analysis of a demonstration project of dendromass production, assessing four bio-based value chains. The perspectives of the conducted LCA and socio-economic assessment of the demonstration project have been combined to derive recommendations for improving the environmental and economic performance of the four new bio-based materials.
2. Material and Methods
2.1. Eco-Efficiency Theory and Application
The international standard for eco-efficiency assessments ISO14045:2012 defines the eco-efficiency indicator as the “product system value divided by the environmental impact indicator” [16].
“The value of the product system may be chosen to reflect, for example, its resource, production, delivery or use efficiency, or a combination of these. The value may be expressed in monetary terms or other value aspects” [16]. The generally applicable indicators for product or service value are quantity of goods or services produced or provided to customers, and net sales [47].
The generally applicable indicators of environmental impact in product or service creation are energy consumption, materials consumption, water consumption, greenhouse gas emissions, and ozone-depleting substance emissions [47].
For calculating eco-efficiency, product service or value is divided by environmental impact or resource use. A greater value per unit of environmental impact or resource use is rated as more eco-efficient; however, careful interpretation is needed [47]. The WBCSD has developed a common framework for eco-efficiency indicators, with terminology consistent with the ISO 14000 series and the Global Reporting Initiative [47].
The international standard for eco-efficiency assessments ISO14045:2012 defines the eco-efficiency indicator as the “product system value divided by the environmental impact indicator” [16]. Requirements, recommendations, and guidelines for specific choices of categories for environmental impact and values are not included. The ISO 14045:2012 does not specify any units, since product system value can be functional or monetary.
Accordingly, an increase in eco-efficiency can be based on the following measures:
Maximizing the value of the product, for example, through higher efficiency in energy and material input; through the implementation of innovative products that can increase revenues; through optimized marketing activities.
Optimizing the production and use of the product and its input resources, for example, by increasing the productivity; by enhancing the sustainable use of renewable resources (e.g., cascading use); by extending the product’s life.
Reducing environmental impacts, for example, through reducing the use of toxic substances and emissions; through higher rates of material recycling and reuse [14].
While a consensus seems to exist regarding the environmental part of the ratio, there are different interpretations of how to depict the value, referred to as the economic aspect of eco-efficiency: “The value of the product system may be chosen to reflect, for example, its resource, production, delivery or use efficiency, or a combination of these. The value may be expressed in monetary terms or other value aspects” [16].
In this study, the eco-efficiency assessment follows this formula:
Eco-efficiency was assessed for a regional value chain located in the EU including dendromass production and four dendromass-based products, as well as for the value chain as a whole. The value chain is explained in more detail in the next section. According to ISO 14045:2012, the environmental indicator is related to product system value, which in this study is represented by the (regional) value added and the revenue.
2.2. Demonstration Project and System Definition
To meet the increasing demand for woody biomass in an emerging bioeconomy, short rotation coppices (SRC) are proposed as a promising opportunity. Fast-growing tree species such as poplar are cultivated in high stock density on agricultural land, to produce woody biomass within very short rotation periods (five to ten years) using fully mechanized harvesting. Wood biomass originating from such cultivation is called dendromass [48]. The European-funded project Dendromass4Europe (2017–2022, Horizon 2020 BBI-IA-DEMO, BBI JU Grant Numbers 745874) supported the establishment of 1285 ha SRP on marginal agricultural lands in Slovakia and demonstrated the valorisation of the dendromass into four value chains. With the complete harvest of dendromass, the following new bio-based materials (NBBM) were produced: lightweight boards (NBBM1), moulded fibre packaging (NBBM2), wood plastic composite terrace decking (NBBM3), and bark-enriched granulate for injection moulding (NBBM4) (see Figure 1).
Dendromass production refers to the activities on the fields of short rotation coppice in Slovakia, comprising field preparation, planting of poplar rods, and harvesting in a five-year cycle, as well as storage and transportation of the logs. There are various cultivation sites across several regions in Western Slovakia. It is assumed that the plantations have a lifespan of 20 years and are harvested every fifth year, with a planting density of 1667 cuttings per hectare. The calculations are broken down on an average of one year and one hectare with a yield of whole-stem-harvested poplar of 8.01 bdt/ha. NBBM1 (lightweight boards) is produced in Malacky, located in Western Slovakia, by the project partner IKEA Industry. The annual production volume of the lightweight board plant is estimated at 500,000 m³, starting with the poplar logs at factory gate following the dendromass production. NBBM2 (molded fiber parts) is produced in Łódź, Poland, by the project partner Pulp-Tec. The calculated scenario is an example of a molded fiber part used for the packaging of a water filter with an assumed production volume of 192.07 t per year. The product can be enriched with milled and sieved poplar bark, which can be used to substitute up to 20 % of the cardboard. The bark-enriched wood plastic composite (WPC) profiles (NBBM3) are produced near Ostrava, Czech Republic, by the project partner TerrainEco. It is assumed that the machinery can produce 80 t of WPC profiles per year. NBBM4 is produced in Neustadt, Germany, by the project partner Pulp-Tec Compound, with a production volume of 7.2 t of WPC granulate per year.
The project was accompanied by LCA and socio-economic assessments of the dendromass cultivation, the materials produced, and the value network as a whole—see project reports 5.2–5.8 for details under “https://cordis.europa.eu/project/id/745874/results (accessed on 3 March 2023)”. For the optimization of the project’s contribution to sustainable development, the LCA and socio-economic assessments were combined in the eco-efficiency metric.
The assessments—LCA and socio-economic assessment—were conducted in a modular manner by splitting the D4EU value chain system according to the main products produced. Figure 1 illustrates the whole D4EU product system.
These modules are later integrated into the assessment of the DEU value chain as a whole production system.
The first step of assessment requires the definition of the goal and scope. In the case of LCA, this means providing a clear description of the intended application of the study, stating the reasons why the study is being conducted, the intended audience, the system to be studied, the functional unit and system boundaries, among other important matters [49]. The current LCA aims to assess the potential environmental impacts of the new SRC-based value chains and to identify potential sustainability levers. This will support sustainable establishment of value chains while focusing on relevant environmental impact categories. Moreover, the LCA seeks to identify hotspots and derive possibilities for reducing the potential environmental impacts within the R&D of the project. The results of the LCA are of value for all project partners involved in the D4EU project, as its findings present quantifiable environmental information that will be of important use during decision-making processes.
The assessed product system is defined for each study and does not have to cover the entire life cycle of the product or product system [49]. In this study, a modular approach to the system is proposed and implemented, which allows for the analysis of individual unit processes instead of calculating several pathways. The approach consists of dividing the D4EU value chain into sub-systems, the NBBMs. Each NBBM can then be assessed as a standalone system. This approach allows the researcher to identify areas of concern and in some cases to offer technological alternatives. It furthermore facilitates the identification and addition of input/output flows, including products and co-products, which eases the integration of further life-cycle stages with technological advancements.
The environmental performance and product system value are calculated for a defined functional unit. “A Functional Unit is a quantified description of the function of a product that serves as the reference basis for all calculations regarding impact assessment” [50]. In this study, the functional units are:
- 1 ton of bone dry (bdt) dendromass,
- 1 m3 of finished NBBM1,
- 1 ton of NBBM2,
- 1 ton of NBBM3,
- 1 ton of finished NBBM4, and
- 1 ton of dendromass and the maximum of NBBMs that can be made from it, as the D4EU value chain.
The D4EU value chain entails the production of dendromass and the production of NBBM1–4. The production starts with soil preparation and planting of poplar rods, and ends with four finished products. The data used for assessing the eco-efficiency of D4EU were derived from combining the results of the LCA and the socio-economic assessment. In all four cases, meaning NBBM1–4, the demand for dendromass was larger than its supply. Therefore, four scenarios— base case, economic best case (scenario 1), environmental best case (scenario 2), and NBBM 1 only (scenario 3)—depict different distributions of the harvested dendromass to the four product systems (NBBM1–4).
Table 1 provides a summary of the dendromass distribution in the four scenarios, including the quantity of products produced and the quantity of dendromass used for each product system and scenario. For the base case scenario, it was assumed that 1 ton of dendromass is produced, from that the maximum amount of NBBM1 (5.15 m³), and the bark as a by-product of NBBM1, is split equally by mass between NBBM2 (0.40 t), NBBM3 (0.71 t) and NBBM4 (1.27 t). For scenario 1, the ratio between the NBBMs produced was changed to increase the economic output by limiting the production of NBBM3 and NBBM4 and allocating more dendromass to NBBM2. In scenario 2, a different allocation of dendromass to the NBBMs was assumed to reduce the total impacts on the value chain (Table 1). Additionally, in this scenario, all impact-reducing measures such as renewable electricity or different material inputs were applied. Dendromass input to NBBM1 remained the same as in the previous scenarios. Because the environmental performance of NBBM 1 was found to be best (Table 2), in scenario 3 it was assumed that only this product was produced from the dendromass, including heat recovery from bark incineration. The heat recovery was not valued in monetary terms for the socio-economic assessment.
2.3. Life Cycle Assessment/Environmental Performance
In this project, the products’ environmental performance was assessed by performing an LCA during the demonstration phase of the project innovation, which means that it is an ex-ante LCA with an explorative character, implemented to identify critical hotspots and improvement potentials before full commercial exploitation [51]. It also means that the LCA relies on assumptions and scenarios, since the technology needs to be modelled at a future point. Therefore, the present LCA is carried out in line with the demonstration of the project and by assessing different options in terms of assessment methodologies and process alternatives. This ex-ante LCA approach requires bidirectional communication between the stakeholders and the LCA practitioner in order to integrate new primary data, for instance, new technological advancements, iteratively throughout the project runtime (see [52]).
The life-cycle inventory entails the collection of data, calculation of data, and the allocation of flows and emissions. Here, all inputs and outputs of a product or product system are gathered, sorted, and clustered, and converted to correspond to the functional unit. Inputs and outputs in this context are product flows, material flows, and energy flows that can be connected to individual process steps of the product. This is the part of the LCA that requires the most time and effort [49].
Primary data were collected either by the LCA practitioners themselves, by industry experts, or the project partners. Different data collection strategies were used, such as data sheets, telephone calls, and checklists. By working closely with the project partners, both qualitative (e.g., system structure, improvements) and quantitative (e.g., amounts of energy) data were collected. In this life cycle inventory (LCI), a continuous data collection process was run alongside the project advancements.
Secondary data were obtained from publicly available databases and publications (e.g., technical data sets, project reports, scientific studies). Both data sources were continuously consulted to update the LCA models. The Ecoinvent database version 3.8 was used to update the previous LCA model (Deliverable 5.5). Furthermore, the LCA for NBBM4 was updated using primary data provided by the project partner Pulp Tec. Thus, the goal and scope and the primary data for the LCI phase were maintained as described in deliverable 5.5.
For this LCA, different impact categories were analysed, using the impact assessment method ReCiPe midpoint (H) and the impact categories global warming potential 100 (GWP100), fossil depletion potential (FDP), ozone depletion potential (ODP), terrestrial acidification potential (TAP100) and freshwater eutrophication potential (FEP). Additionally, the cumulative energy demand (CED)—often used as a proxy indicator in LCA studies [53]—was assessed. The environmental impact values for the dendromass and the four product systems are summarized in Table 2.
The dendromass production contributed a GWP of 41.86 kg of CO2 eq/bdt. This is similar to the results assessed by Schweier at al. [22]. NBBM1 had the best environmental performance in all impact categories, contrary to NBBM2 (Table 2). Meanwhile, NBBM 3 and 4 demonstrated similar environmental performance.
2.4. Product System Value
Implementing the concept of added value into D4EU allowed us to investigate an aspect of its socio-economic sustainability in a monetized form. The establishment of rural value chains is acknowledged to contribute to rural diversification, which can counteract depopulation in rural areas of Eastern Europe [54].Under the European Bioeconomy Strategy, bioeconomies seek to harness the potential of bio-based innovations in agriculture and to create new products, processes, and value chains for the development of rural areas in the European Union (2018). Value added calculations measure the generation of social wealth, which is potentially achieved through the economic activities of business entities [55].
A common definition for the term “added value”, as well as one for “region”, is missing in the scientific context. It can be assumed that regional added value is the sum of economic activities that can be attributed to a certain region—or, more specifically, that is created within this region. Meanwhile, the acquisition of products and services from outside the region can reduce the value creation of a region. Therefore, regional supplier networks are a fundamental element of increasing regional value creation (e.g., by purchasing input material and/or services from a defined region; see [56]). In this study, the region is defined by proximity rather than by state borders and includes all countries involved in producing the dendromass or the products.
Value added measures the residual return of an enterprise generated through the utilization of the enterprise’s productive capacity (e.g., labor and capital) [57]. The concept of value added allows investigation of socio-economic sustainability in a monetized form and indicates the monetary economic performance of an entity in relation to the (regional) society as the “wealth generated and distributed by an economic entity” [55,57]. Thus, the economic and social dimensions of business operations are combined [57].
The regional value added was assessed on the operational level for each of the five systems (dendromass production, NBBM1–4) separately and as a single value chain. The actors of the value-added creation are the organizations involved in project D4EU, namely, IKEA Industry, Pulp-Tec, TerrainEco, and Pulp-Tec Compound. By the creation of added value, the companies contribute to the gross domestic value added and thus to regional value creation. The potential of regional value added from the D4EU value chain is calculated following the formula given by Haller et al. [57]:
The input is calculated by multiplying the quantities of the external expenditures required by the respective market and the value of the external expenditures. Value added can be defined as the value created by the activities of a firm and its employees [55]. By this definition, obtaining subsidies does not create value for a region; consequently, they are not considered in the calculations of value added. Furthermore, the amortization of the infrastructure used (e.g., company buildings, machinery, etc.) is taken into account within the input. The output, which is the total value of the goods produced, is described by quantity times market price (= revenue). For the items’ revenue and output, the tax component is included. Internal employment costs (e.g., overhead costs) are not included in calculations of value added. Further information about the method of regional value added is presented in D 5.6.
The data used for the calculation of value added and revenue of D4EU processes were gathered through interviews carried out with the industrial partners (primary data) and with the help of data-collection sheets that were made available by the partners. In cases where primary data were lacking and for the calculation of previous land management forms, they were supplemented by secondary data from the literature and databases. A detailed list of the data and assumptions can be found in the appendix of deliverable 5.6 “https://cordis.europa.eu/project/id/745874/results” (accessed on 3 March 2023).
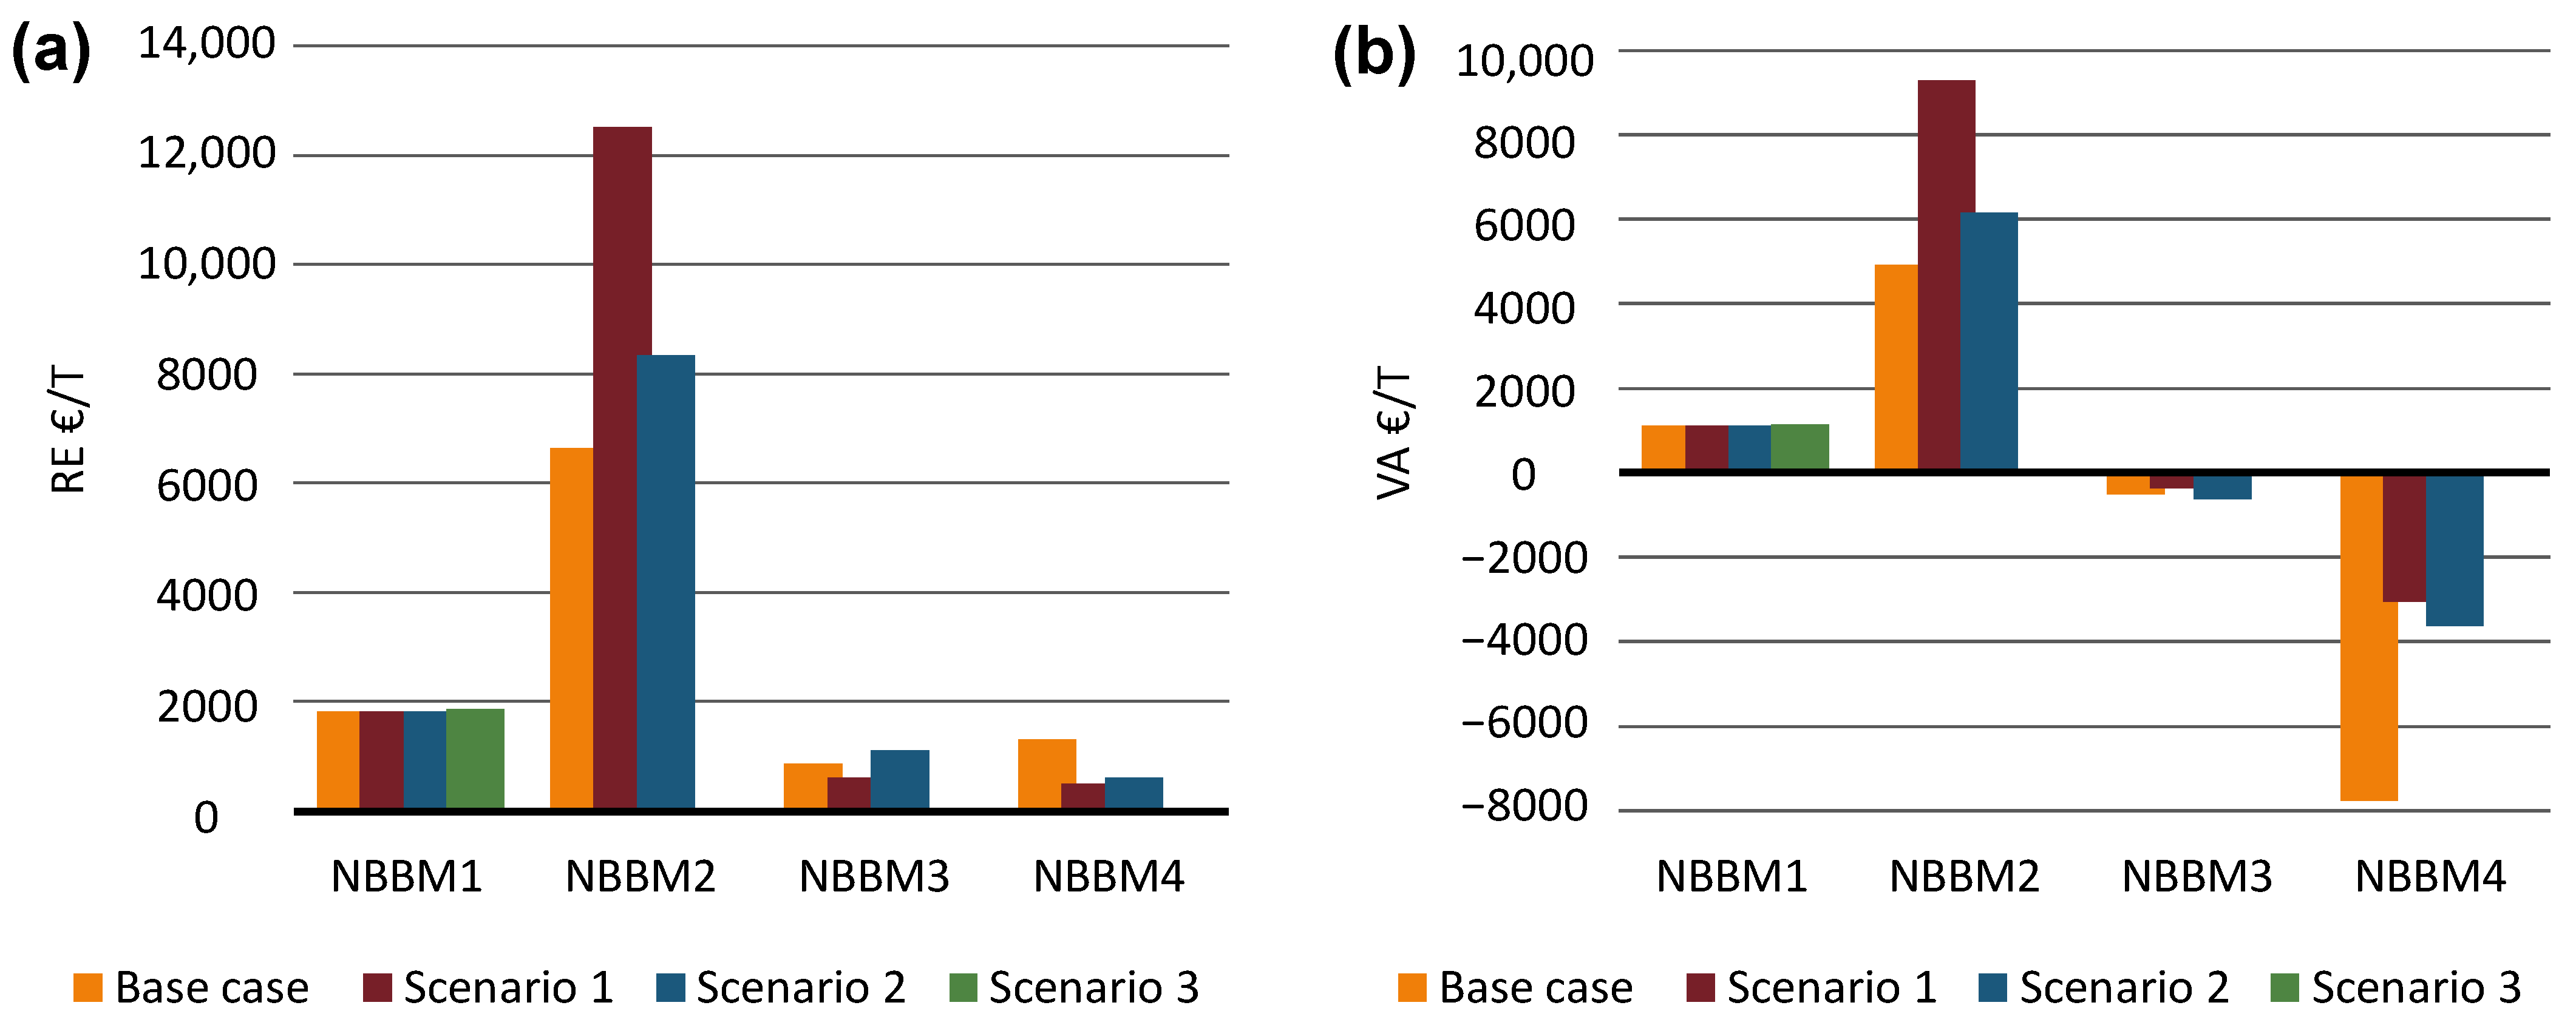
The product system values for the eco-efficiency calculations include regional value added (VA) and revenue (RE), as shown in Table 3. The results show that the highest added value and revenue per ton of product can be achieved with the production of NBBM2. Under the current assumptions and data used for calculating the value added by NBBM3 and 4, the value added is negative, meaning that no added value is created. The fact that no positive added value was created for those product systems may be because these items were produced within a demonstration project at a low technology readiness level (TRL). As production becomes established, the numbers may differ from the present results. However, such an upscaling process cannot be demonstrated on the basis of the currently available data.
3. Results
Eco-efficiency is presented here as the ratio of the two economic indicators, i.e., value added and revenue, to five different potential environmental impact categories. The higher the eco-efficiency metric, the higher the economic performance per unit of environmental performance. In the case of CED, negative eco-efficiency can occur when surplus energy is generated by the production system. In such a case, negative eco-efficiency indicates the value of the production system per unit of energy generated.
3.1. Eco-Efficiency of Each Product
The eco-efficiency was calculated using the value added and the revenue as product system value indicators. Regarding value added, the results show that calculation of the eco-efficiency was possible only for the production of dendromass and the products NBBM1 and NBBM2, because neither NBBM3 nor NBBM4 created added value at this stage of development in the demonstration phase (c.f. SI). Based on the results, NBBM2 can be described as more eco-efficient compared with NBBM1, although not because the potential environmental impacts are lower, but because the regional value added is relatively higher. Considering eco-efficiency based on revenue, NBBM2 performs best followed by NBBM1 in all impact categories. Looking at the cumulated energy demand, we see that the dendromass production creates less value per MJ input. Since dendromass is the feedstock for all the NBBMs, the environmental impact and product system value of the dendromass is integrated into the eco-efficiency calculation of the other products. More details on the results and their integration are presented for each scenario in the following section. The results can be understood as representing the eco-efficiency of D4EU as a whole.
Eco-efficiency of terrestrial acidification potential and freshwater eutrophication potential driven by the electricity mix represent environmental areas of concern. Phenol formaldehyde resins significantly contribute to global warming potential and fossil depletion potential.
The impact categories ODP and FEP typically involve very low amounts of emissions, which explains why the eco-efficiency ratio has a high numerical value. Comparison of the eco-efficiency ratio between different impact categories does not make sense. Negative eco-efficiency can occur when the economic performance is negative, representing a critical hotspot. In such a case, the efficiency measure is inappropriate—there is no economic benefit and the environment is impacted negatively—and has been excluded from illustration in the tables (Table 4, Table 5 and Table 6).
3.2. Environmental Performance and Product System Values of Scenarios
In the previous section, the eco-efficiency was reported for dendromass production and for each NBBM. Since the dendromass production provides the raw material for the NBBMs, it is no longer considered an upstream process but as part of the NBBMs. The environmental impacts and product system of the dendromass were subsequently allocated to the four NBBMs according to the allocation keys summarized in Table 1. The distribution of dendromass in four scenarios was shown to affect the total impacts of the four respective NBBMs. The changes in environmental performance and product system value are summarized in Figure 2 and Figure 3.
The results for the environmental performance of the NBBMs in the different scenarios as represented in Figure 2 show that the base case and scenario 1 (increased economic output) were associated with the highest environmental impacts in most categories. One exception here is the impact measured on cumulative energy demand, where the highest impacts for NBBM1 were caused in scenario 2 (environmental best case), because more dendromass is allocated, so more NBBM1 is produced. The negative results for NBBM1 in scenario 3 for the CED can be explained by the fact that the bark is used for energy generation, and this was considered as an avoided burden in the calculations. The lowest impacts for the NBBMs in most impact categories were observed in scenario 3, where all the dendromass is used for the production of NBBM1 (Table 1), since this valorization scenario is connected with the lowest environmental impacts (Table 2).
The revenue and value added of the NBBMs in the four scenarios are illustrated in Figure 3. Again, no value added was generated through the production of NBBM3 and 4, therefore these values were negative in all scenarios expect scenario 3 where no dendromass was allocated to those products. For Scenario 1, the ratio between the NBBMs produced was changed to increase the economic output by reducing the supply of dendromass to NBBM3 and NBBM4 and allocating more dendromass to NBBM2. By doing so, the value added reached 7021 € per ton of dendromass processed. The revenue of the D4EU value chain from 1 ton of dendromass input would be 15,502 €, compared to 10,679€ in the base case scenario. Building on the environmental best case shown in scenario 2, even higher value added can be achieved for NBBM1 and 2. Because NBBM1 offers the best environmental performance, in scenario 3 it was assumed that only this product is produced from dendromass, including heat recovery from bark incineration. Though the heat recovery was not valued in monetary terms, the results show that revenue and value added remained the same for NBBM1 but decreased for NBBM2 compared with scenario 2.
3.3. Eco-Efficiency of the Total Product System
The eco-efficiency based on value added in the base case cannot be illustrated (Table 6), because there is no value added in NBBM3 and NBBM4—value-added-based eco-efficiency is not applicable. Conclusions on eco-efficiency differ depending on scenario and impact category.
Table 6 depicts the eco-efficiency based on value added in the scenarios for the various impact categories. Considering value added and GWP, scenario 3 is most eco-efficient followed by scenarios 2 and 1. Scenario 2 performed best in TAP and FEP. Scenario 3 depicts the eco-efficiency of CED as negative, because surplus energy was generated. The base case is not ranked, because no total added value was generated under the demonstration conditions.
Eco-efficiency based on revenue for the base case assumptions is shown in Table 7. Scenario 2 performs best in GWP, TAP, FEP, and FDP. Scenario 3 is ranked heterogeneously over the several impact categories. The base case, which represents the initial D4EU set-up, is ranked last (Table 7) in most impact categories, which shows that improvement potentials were identified and already partially implemented.
Comparing the eco-efficiency based on value added (Table 6) and revenue (Table 7) of the base case scenario with scenarios 1 and 2, an increase in each impact category is confirmed (Table 7). The eco-efficiency based on value added is higher for scenario 2 than for scenario 1 (Table 6 and Table 7). A comparison of eco-efficiency based on revenue for the base case and scenario 2 shows an increase in each impact category (Table 7). Considering eco-efficiency on the basis of value added (Table 6), scenario 3 performs better, but on basis of revenue (Table 7), scenario 2 outperforms scenario 3.
4. Discussion and Conclusions
The eco-efficiency analysis conducted in this study revealed the ratio of economic benefit to environmental impacts for four dendromass-based value chains, and highlighted critical hotspots in the production system. Previous eco-efficiency studies have often focused on a single production system (e.g., energy, transportation, or material production) without considering alternative resource utilization. The value chains in this study used the same dendromass source, which means the system boundaries were expanded to include the whole value chain network using the same resource. This allowed investigation of the effects of varying shares of dendromass between the four value chains, supporting the identification of an optimized use of dendromass with respect to eco-efficiency. Furthermore, by taking this systemic view it was possible to examine the effects on the environment through different measures considering all value chains—for instance, high fuel consumption results in high CED values for the dendromass production, which are allocated to the NBBMs via their dendromass content. Reducing the fuel input per ton of dendromass produced results in an increase in eco-efficiency for all NBBM value chains.
Optimizing eco-efficiency requires allocation of more dendromass to the particular NBBM which results in the highest eco-efficiency value for the whole value chain. This was investigated under four scenarios. The results show that producing more NBBM1 for the sake of reducing impact (NBBM1 performs relatively well in terms of environmental impact) results in lower eco-efficiency for the whole production system because the value added and the revenue are relatively low (scenario 3).
Product-wise, NBBM2 has the best eco-efficiency performance because its economic performance is outstanding compared with the others. However, its environmental performance per ton of produce is worst. Producing more NBMM2 leads to better economic performance of D4EU; however, because of environmental considerations, producing less NBBM2 leads to improved eco-efficiency for the whole value chain (scenario 2).
On the product level, NBBM3 performs better than to NBBM2 in terms of environmental impacts; however, no added value was generated under the demonstration circumstances. This also applies to NBBM4. Furthermore, NBBM1 and NBBM2 compensate for the weak economic performance in scenarios 1 and 2. In the base case, NBBM1 and NBBM2 do not achieve economic compensation. Generation of value added by NBBM3 and NBBM4 will be a game changer for the eco-efficiency assessment; NBBM3 and NBBM4 use PVC as matrix material for the composites, which are not used for high value applications. In turn, PVC is especially critical in terms of ODP. Aiming at higher value applications can yield better eco-efficiency; however, the absolute reduction of PVC should be favoured. Alternatively, secondary PVC and company structures to enable product reclamation and the establishment of a recycling regime is a potential lever to eco-efficiency. The configuration of produce, values, and volumes is essential to optimize the eco-efficiency of the D4EU value chain, rather than maximizing the output of one single NBBM. Reducing environmental impacts as a local optimization measure will benefit all partners. Considering the studied project as case example for other bio-based value chain networks or industrial ecosystems, we learn that seeking a global optimum of resource utilization can yield potentials for increasing sustainable production, compared with focusing on individual value chains.
A limitation is presented by the fact that industrial scale production data is missing, because the production system with its NBBMs is still at a demonstration level. Such data is essential for eco-efficiency assessments, especially when choosing the value added to represent the product system value. Here the goal and scope predefine the choice of indicator representing the product system value. For studies investigating product systems at lower TRL (e.g., to support R&D), indicators such as potential revenue or price-related indicators might be more appropriate. In contrast, studies analysing product systems at a higher TRL gain insight into the full spectrum of potential economic indicators. Further research is necessary to provide more concrete recommendations on the choice of indicator in relation to the type of product system aligned with the TRL stage.
These environmental and economic assessments represent snapshots of the D4EU value chain configuration and scenarios thereof at a certain phase in demonstration (2017–2022). The eco-efficiency approach is useful to support R&D in identifying optimized use of a resource to obtain high economic output with low environmental impact.
Author Contributions
Conceptualization, F.H. and C.M.-B.; methodology, F.H., D.G.-F. and C.M.-B.; formal analysis, F.H. and C.M-B; investigation, F.H., D.G-F., L.W. and C.M.-B.; writing—original draft preparation, F.H. and C.M.-B.; writing—review and editing, F.H., L.W. and C.M.-B.; visualization, C.M-B.; supervision, F.H.; project administration, F.H.; funding acquisition, F.H. All authors have read and agreed to the published version of the manuscript.
Funding
This research was funded by the Bio-Based Industries Joint Undertaking under the European Union’s Horizon 2020 research and innovation program under grant agreement No. 745874 and the Austrian Research Promotion Agency (FFG) under the COMET program grant number 41481033.
Institutional Review Board Statement
Not applicable.
Informed Consent Statement
Not applicable.
Data Availability Statement
Data used for this study can be accessed via https://cordis.europa.eu/project/id/745874/results (accessed on 3 March 2023).
Conflicts of Interest
The authors declare no conflict of interest.
References
- European Commission (EC). A Sustainable Bioeconomy for Europe: Strengthening the Con-Nection between Economy, Society and the Environment; COM(2018) 673 final; European Commission: Brussels, Belgium, 2018. [Google Scholar]
- D’Amato, D.; Droste, N.; Allen, B.; Kettunen, M.; Lähtinen, K.; Korhonen, J.; Leskinen, P.; Matthies, B.D.; Toppinen, A. Green, circular, bio economy: A comparative analysis of sustainability avenues. J. Clean. Prod. 2017, 168, 716–734. [Google Scholar] [CrossRef]
- Imbert, E.; Ladu, L.; Morone, P.; Quitzow, R. Comparing policy strategies for a transition to a bioeconomy in Europe: The case of Italy and Germany. Energy Res. Soc. Sci. 2017, 33, 70–81. [Google Scholar] [CrossRef]
- De Besi, M.; Mccormick, K. Towards a bioeconomy in Europe: National, regional and industrial strategies. Sustainability 2015, 7, 10461–10478. [Google Scholar] [CrossRef] [Green Version]
- Gawel, E.; Pannicke, N.; Hagemann, N. A Path Transition Towards a Bioeconomy—The Crucial Role of Sustainability. Sustainability 2019, 11, 3005. [Google Scholar] [CrossRef] [Green Version]
- Ranacher, L.; Pollakova, B.; Schwarzbauer, P.; Liebal, S.; Weber, N.; Hesser, F. Farmers’ Willingness to Adopt Short Rotation Plantations on Marginal Lands: Qualitative Study About Incentives and Barriers in Slovakia. BioEnergy Res. 2021, 14, 357–373. [Google Scholar] [CrossRef]
- Fürtner, D.; Ranacher, L.; Perdomo Echenique, E.A.; Schwarzbauer, P.; Hesser, F. Locating Hotspots for the Social Life Cycle Assessment of Bio-Based Products from Short Rotation Coppice. BioEnergy Res. 2021, 14, 510–533. [Google Scholar] [CrossRef]
- Perdomo, E.A.; Schwarzbauer, P.; Fürtner, D.; Hesser, F. Life Cycle Assessment of Agricultural Wood Production—Methodological Options: A Literature Review. BioEnergy Res. 2021, 14, 492–509. [Google Scholar] [CrossRef]
- Karvonen, J.; Halder, P.; Kangas, J.; Leskinen, P. Indicators and tools for assessing sustaina-bility impacts of the forest bioeconomy. For. Ecosyst. 2017, 4, 2. [Google Scholar] [CrossRef] [Green Version]
- Mair-Bauernfeind, C. The Sustainability of Bioeconomic Innovations: Tools and Indicators for a Substitution Assessment. Ph.D. Thesis, Karl-Franzens-Universität Graz, Graz, Austria, 2020. [Google Scholar]
- Sandin, G.; Clancy, G.; Heimersson, S.; Peters, G.M.; Svanström, M.; Ten Hoeve, M. Making the most of LCA in technical inter-organisational R&D projects. J. Clean. Prod. 2014, 70, 97–104. [Google Scholar]
- McAloone, T.C.; Bey, N. Environmental Improvement through Product Development: A Guide; Danish Environmental Protection Agency: Copenhagen, Denmark, 2009. [Google Scholar]
- Lettner, M. Rethinking Technology and Product Development in the Context of the Emerging Bioeconomy: The Concept of Sustainable Innovation Readiness Level (Sirl). Ph.D. Thesis, Institut für Marketing und Innovation, BOKU-Universität für Bodenkultur Vienna, Vienna, Austria, 2018; p. 220. [Google Scholar]
- Ichimura, M.; Nam, S.; Bonjour, S.; Rankine, H.; Carisma, B.; Qiu, Y.; Khrueachot-Ikul, R. Eco-Efficiency Indicators: Measuring Resource-Use Efficiency and the Impact of Economic Activities on the Environment; United Nations Escap—Economic and SoCial Commission for Asia and the Pacific, Issue: Bangkok, Thailand, 2009. [Google Scholar]
- Schaltegger, S.; Sturm, A. Ökologie Induzierte Entscheidungsprobleme des Managements. Ansatzpunkte zur Ausgestaltung von Instrumenten; WWZ-Discussion PaperNo. 8914; Inst. f. Betriebswirtschaft: Basel, Switzerland, 1989. [Google Scholar]
- ISO 14045; Environmental Management—Eco-Efficiency Assessment of Product Systems—Principles, Requirements and Guidelines. International Organization for Standardization: Geneva, Switzerland, 2012.
- Arceo, A.; Biswas, W.K.; John, M. Eco-efficiency improvement of Western Australian remote area power supply. J. Clean. Prod. 2019, 230, 820–834. [Google Scholar] [CrossRef]
- Molina-Besch, K.; Pålsson, H. A simplified environmental evaluation tool for food packaging to support decision-making in packaging development. Packag. Technol. Sci. 2020, 33, 141–157. [Google Scholar] [CrossRef]
- Mehmeti, A.; Santoni, F.; Della Pietra, M.; Mcphail, S.J. Life cycle assessment of molten carbonate fuel cells: State of the art and strategies for the future. J. Power Sources 2016, 308, 97–108. [Google Scholar] [CrossRef]
- Muradin, M.; Joachimiak-Lechman, K.; Foltynowicz, Z. Evaluation of eco-efficiency of two alternative agricultural biogas plants. Appl. Sci. 2018, 8, 2083. [Google Scholar] [CrossRef] [Green Version]
- Silalertruksa, T.; Gheewala, S.H.; Pongpat, P. Sustainability assessment of sugarcane biorefinery and molasses ethanol production in Thailand using eco-efficiency indicator. Appl. Energy 2015, 160, 603–609. [Google Scholar] [CrossRef]
- Schweier, J.; Schnitzler, J.P.; Becker, G. Selected environmental impacts of the tech-nical production of wood chips from poplar short rotation coppice on marginal land. Biomass Bioenergy 2016, 85, 235–242. [Google Scholar] [CrossRef]
- Yang, Y.-H.; Lin, S.-J.; Lewis, C. Reduction of acidification from electricity—Generating industries in Taiwan by Life Cycle Assessment and Monte Carlo optimization. Ecol. Econ. 2009, 68, 1575–1582. [Google Scholar] [CrossRef]
- Ferreira, M.B.; Salvador, R.; Barros, M.V.; De Souza, J.T.; Rabelo TG, L.; De Fran-Cisco, A.C.; Coelho, R.; Piekarski, C.M. Eco-efficiency of the differential ratio change in a heavy-duty vehicle and implications for the automotive industry. Sustain. Prod. Consum. 2020, 21, 145–155. [Google Scholar] [CrossRef]
- Onat, N.C.; Kucukvar, M.; Afshar, S. Eco-efficiency of electric vehicles in the United States: A life cycle assessment based principal component analysis. J. Clean. Prod. 2019, 212, 515–526. [Google Scholar] [CrossRef]
- Al-Lami, A.; Hilmer, P.; Sinapius, M. Eco-efficiency assessment of manufacturing carbon fiber reinforced polymers (CFRP) in aerospace industry. Aerosp. Sci. Technol. 2018, 79, 669–678. [Google Scholar] [CrossRef]
- Changwichan, K.; Silalertruksa, T.; Gheewala, S.H. Eco-efficiency assessment of bioplastics production systems and end-of-life options. Sustainability 2018, 10, 952. [Google Scholar] [CrossRef] [Green Version]
- De Oliveira, S.A.; Nunes de Macedo, J.R.; Rosa, D.D.S. Eco-efficiency of poly (lactic acid)-Starch-Cotton composite with high natural cotton fiber content: Environmental and functional value. J. Clean. Prod. 2019, 217, 32–41. [Google Scholar] [CrossRef]
- Leejarkpai, T.; Mungcharoen, T.; Suwanmanee, U. Comparative assessment of global warming impact and eco-efficiency of PS (polystyrene), PET (polyethylene terephthalate) and PLA (pol-ylactic acid) boxes. J. Clean. Prod. 2006, 125, 95–107. [Google Scholar] [CrossRef]
- Mendoza, J.M.F.; D’Aponte, F.; Gualtieri, D.; Azapagic, A. Disposable baby diapers: Life cycle costs, eco-efficiency and circular economy. J. Clean. Prod. 2019, 211, 455–467. [Google Scholar] [CrossRef] [Green Version]
- Zhou, Y.; Stanchev, P.; Katsou, E.; Awad, S.; Fan, M. A circular economy use of recov-ered sludge cellulose in wood plastic composite production: Recycling and eco-efficiency assessment. Waste Manag. 2020, 99, 42–48. [Google Scholar] [CrossRef]
- Czaplicka-Kolarz, K.; Burchart-Korol, D.; Turek, M.; Borkowski, W. Model of Eco-Efficiency Assessment of Mining Production Processes. Arch. Min. Sci. 2015, 60, 477–486. [Google Scholar] [CrossRef] [Green Version]
- Foulet, A.; Bouchez, T.; Desmond-Le Quéméner, E.; Giard, L.; Renvoisé, L.; Aissani, L. Eco-design of microbial electrochemical technologies for the production of waste-based succinic acid thanks to a life cycle assessment. J. Clean. Prod. 2019, 225, 1155–1168. [Google Scholar] [CrossRef] [Green Version]
- Joachimiak-Lechman, K.; Selech, J.; Kasprzak, J. Eco-efficiency analysis of an inno-vative packaging production: Case study. Clean Technol. Environ. Policy 2019, 21, 339–350. [Google Scholar] [CrossRef] [Green Version]
- Kim, S.; Dale, B.E. Comparing alternative cellulosic biomass biorefining systems: Centralized versus distributed processing systems. Biomass Bioenergy 2015, 74, 135–147. [Google Scholar] [CrossRef] [Green Version]
- Niero, M.; Hauschild, M.Z.; Hoffmeyer, S.B.; Olsen, S.I. Combining Eco-Efficiency and Eco-Effectiveness for Continuous Loop Beverage Packaging Systems: Lessons from the Carlsberg Circular Community. J. Ind. Ecol. 2017, 21, 742–753. [Google Scholar] [CrossRef] [Green Version]
- Rönnlund, I.; Reuter, M.; Horn, S.; Aho, J.; Aho, M.; Päällysaho, M.; Ylimäki, L.; Pur-Sula, T. Eco-efficiency indicator framework implemented in the metallurgical industry: Part 1—A comprehensive view and benchmark. Int. J. Life Cycle Assess. 2016, 21, 1473–1500. [Google Scholar] [CrossRef]
- Zhao, Y.; Zhao, C. Eco-efficiency evaluation indicator of plantation harvesting system and its improvement based on material flow analysis. In Proceedings of the Asia-Pacific Power and Energy Engineering Conference, APPEEC, Wuhan, China, 25–28 March 2011. [Google Scholar]
- Berglund, L.; Breedveld, L.; Oksman, K. Toward eco-efficient production of natural nanofibers from industrial residue: Eco-design and quality assessment. J. Clean. Prod. 2020, 255, 120274. [Google Scholar] [CrossRef]
- Risse, M.; Weber-Blaschke, G.; Richter, K. Eco-efficiency analysis of recycling recovered solid wood from construction into laminated timber products. Sci. Total Environ. 2019, 661, 107–119. [Google Scholar] [CrossRef] [PubMed]
- Burchart-Korol, D.; Krawczyk, P.; Czaplicka-Kolarz, K.; Smoliński, A. Eco-efficiency of underground coal gasification (UCG) for electricity production. Fuel 2016, 173, 239–246. [Google Scholar] [CrossRef]
- Silalertruksa, T.; Gheewala, S.H. Competitive use of sugarcane for food, fuel, and biochemical through the environmental and economic factors. Int. J. Life Cycle Assess. 2020, 25, 1343–1355. [Google Scholar] [CrossRef]
- Valente, A.; Iribarren, D.; Gálvez-Martos, J.-L.; Dufour, J. Robust eco-efficiency assessment of hydrogen from biomass gasification as an alternative to conventional hydrogen: A life-cycle study with and without external costs. Sci. Total Environ. 2019, 650, 1465–1475. [Google Scholar] [CrossRef] [PubMed]
- Valdivia, C.; Seth, A.; Gilles, J.L.; García, M.; Jiménez, E.; Cusicanqui, J.; Navia, F. Adapting to Climate Change in Andean Ecosystems: Landscapes, Capitals, and Perceptions Shaping Rural Livelihood Strategies and Linking Knowledge Systems and Edwin Yucra. In Geography of Climate Change; Routledge: Abingdon, UK, 2013; pp. 111–127. [Google Scholar]
- Ehrenfeld, J.R. Eco-efficiency: Philosophy, Theory, and Tools. J. Ind. Ecol. 2005, 9, 6–8. [Google Scholar] [CrossRef]
- Huppes, G.; Ishikawa, M. A Framework for quantified eco-efficiency analysis. J. Ind. Ecol. 2005, 9, 25–41. [Google Scholar] [CrossRef]
- WBCSD: World Business Council for Sustainable Development. Eco-Efficiency: Learning Module; WBCSD World Business Council for Sustainable Development: Geneva, Switzerland, 2006. [Google Scholar]
- Knust, C. Kurzumtriebsplantagen–Stand des Wissens. Anbau und Nutzung von Bäumen auf landwirtschaftlichen Flächen. In Anbau und Nutzung von Bäumen auf landwirtschaftlichen Flächen; Reeg, T., Bemmann, A., Konold, W., Murach, D., Spiecker, H., Eds.; WILEY-VCH Verlag GmbH & Co. KgaA: Weinheim, Germany, 2009; pp. 1–9. ISBN 978-3-527-32417-0. [Google Scholar]
- Klöpffer, W.; Grahl, B. Life Cycle Assessment (LCA): A Guide to Best Practice; Wiley-VHC: Weinheim, Germany, 2009. [Google Scholar]
- Arzoumanidis, I.; D’eusanio, M.; Petti, L.; Traverso, M. Functional Unit Definition Criteria in Life Cycle Assessment and Social Life Cycle Assessment: A Discussion; Springer: Cham, Switzerland, 2020. [Google Scholar]
- Van der Giesen, C.; Cucurachi, J.; Kramer, G.; Tukker, A. A critical view on the current application of lca for new technologies and recommendations for improved practice. J. Clean. Prod. 2020, 259, 120904. [Google Scholar] [CrossRef]
- Lettner, M.; Hesser, F. Asking instead of telling-Recommendations for developing Life Cycle Assessment within technical R&D Projects. In Sustainable Production, Life Cycle Engineering and Management; Albrecht, S., Fischer, M., Leistner, P., Schebek, L., Eds.; Springer: Cham, Switzerland, 2021. [Google Scholar] [CrossRef]
- Huijbregts, M.A.J.; Rombouts, L.J.A.; Hellweg, S.; Frischknecht, R.; Hendriks, A.J.; van de Meent, D.; Ragas, A.M.J.; Reijnders, L.; Struijs, J. Is cumulative fossil energy demand a useful Indicator for the environmental performance of products? Environ. Sci. Technol. 2006, 40, 641–648. [Google Scholar] [CrossRef] [Green Version]
- Turnock, D. Rural diversification in Eastern Europe: Introduction. GeoJournal 1999, 46, 171–181. [Google Scholar] [CrossRef]
- Van Staden, C. The relevance of theories of political economy to the understanding of financial reporting in South Africa: The case of value-added statements. Account. Forum 2003, 27, 224–245. [Google Scholar] [CrossRef]
- Hoffmann, D. Creation of regional added value by regional bioenergy resources. Renew. Sustain. Energy Rev. 2009, 13, 2419–2429. [Google Scholar] [CrossRef]
- Haller, A.; Staden, C.J.V.; Landis, C. Value Added as part of Sustainability Reporting: Report-ing on Distributional Fairness or Obfuscation? J. Bus. Ethics 2018, 152, 763–781. [Google Scholar] [CrossRef]
Figure 1.
Schematic illustration of the D4EU production system.
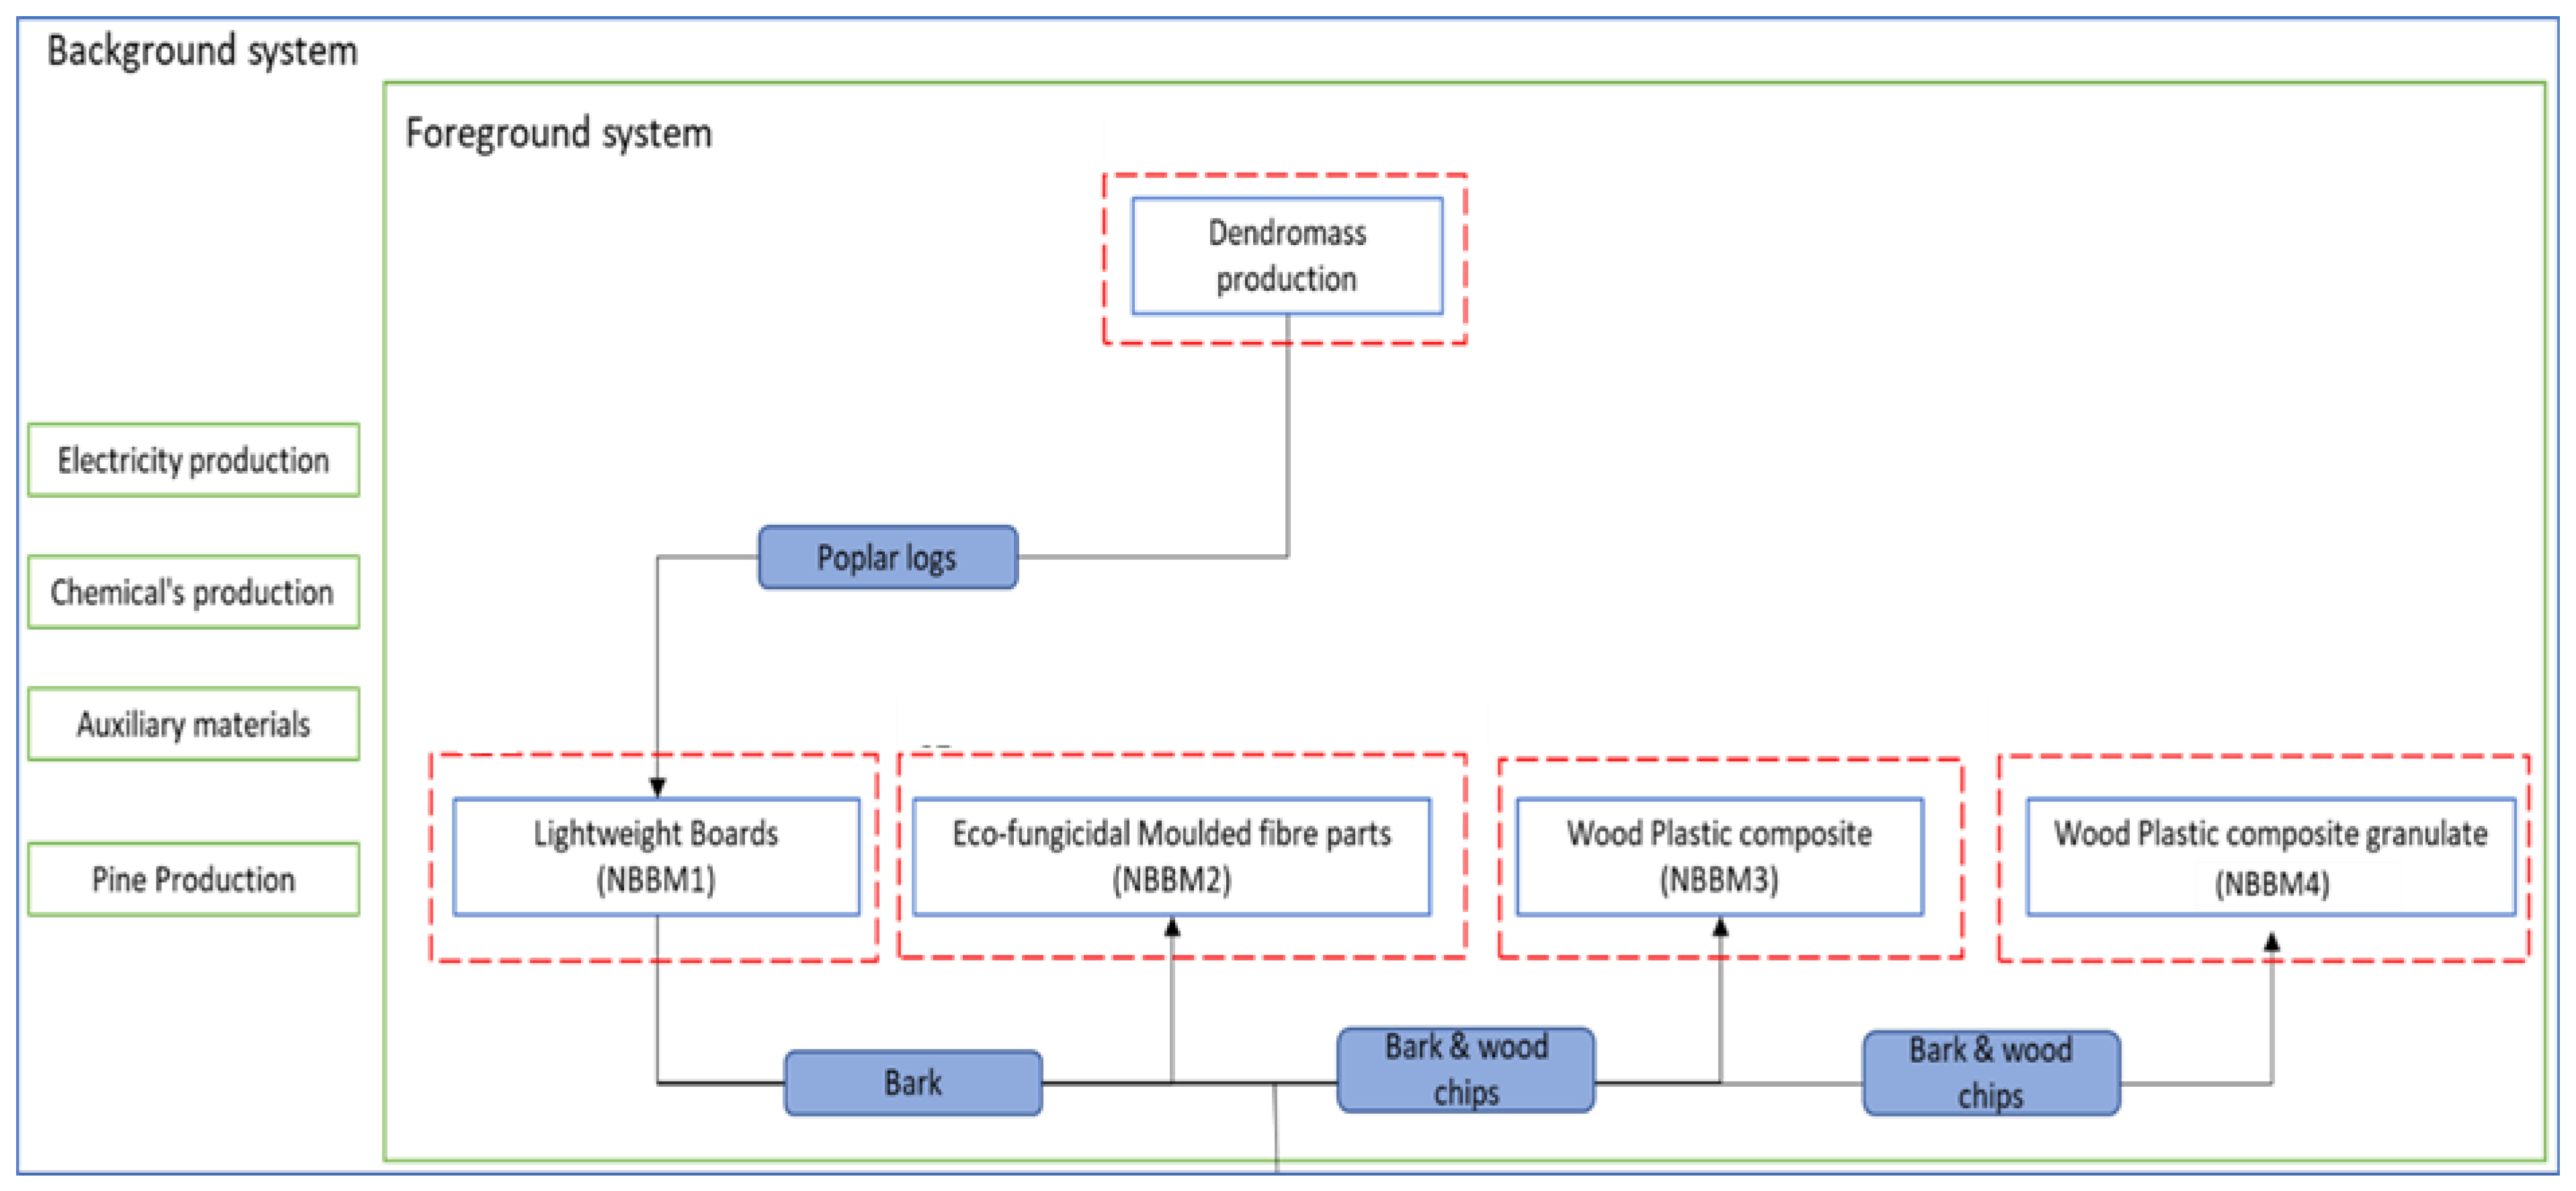
Figure 2.
(a) Global warming potential, (b) terrestrial acidification potential, (c) ozone depletion potential, (d) fossil depletion potential, (e) freshwater eutrophication potential, and (f) cumulative energy demand of NBBMs in four scenarios.
Figure 2.
(a) Global warming potential, (b) terrestrial acidification potential, (c) ozone depletion potential, (d) fossil depletion potential, (e) freshwater eutrophication potential, and (f) cumulative energy demand of NBBMs in four scenarios.
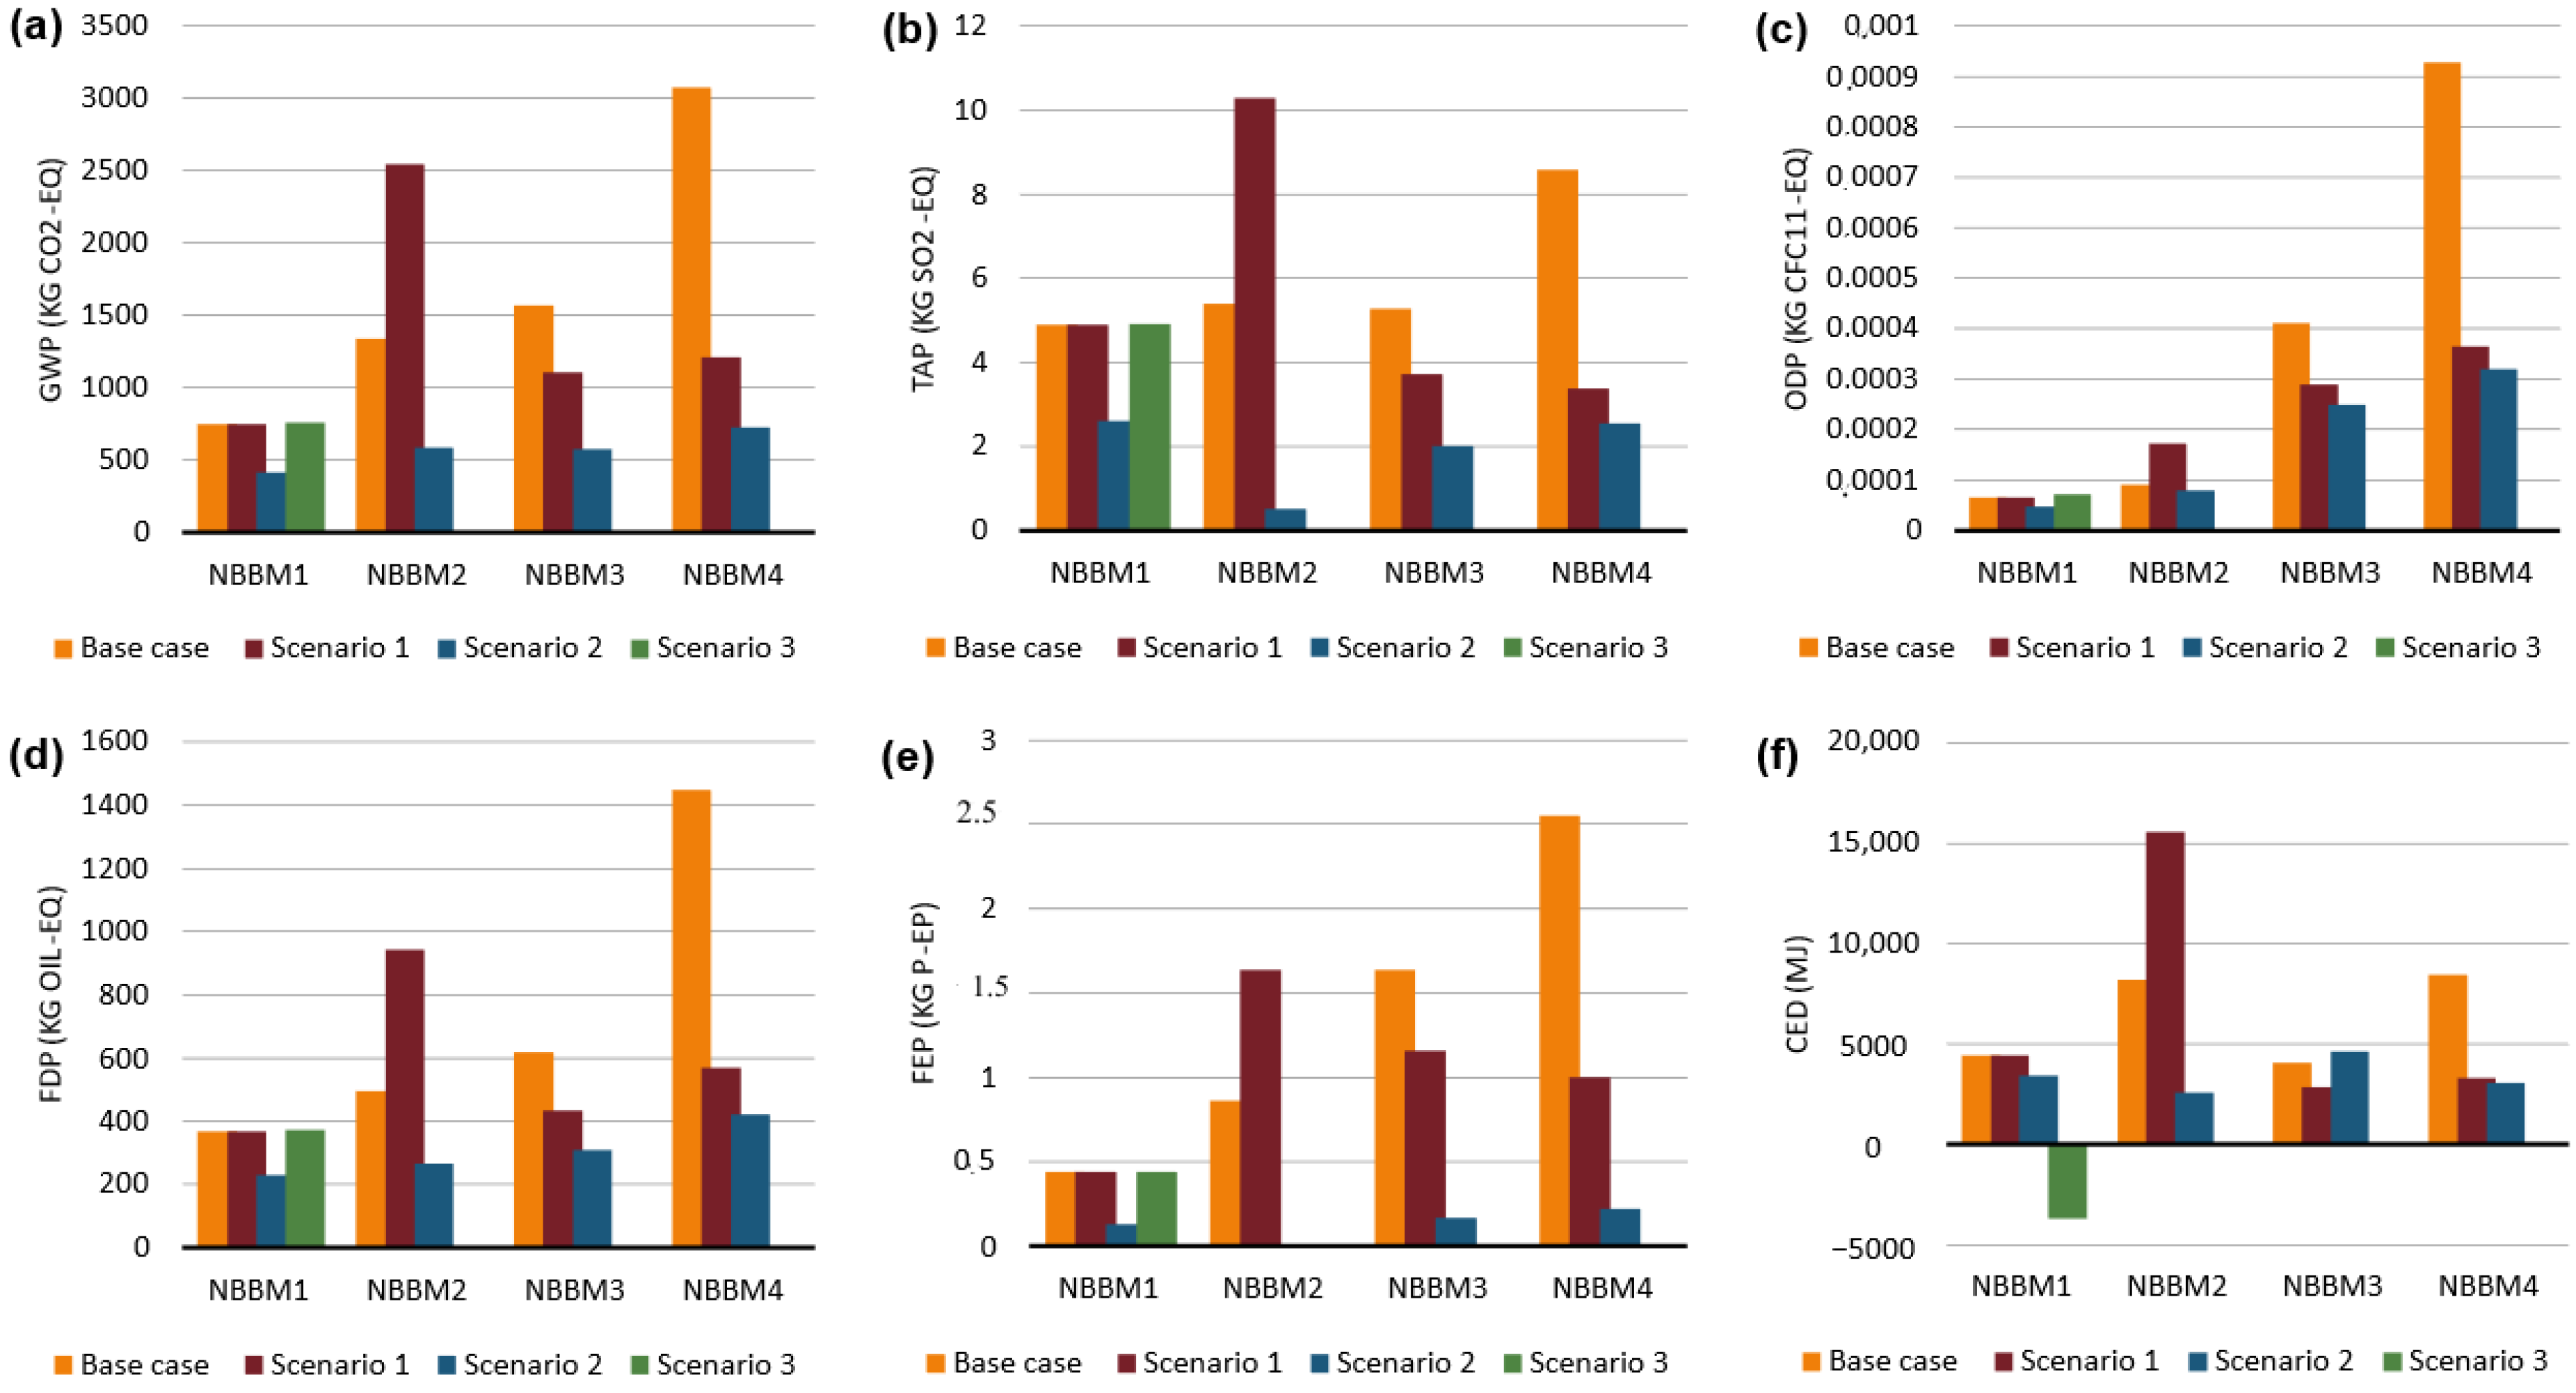
Figure 3.
Revenue (a) and value added (b) of NBBMs in four scenarios.

Table 1.
Distribution of dendromass to the four product systems in four scenarios.
| Scenario | Allocation Key | NBBM1 | NBBM2 | NBBM3 | NBBM4 |
|---|---|---|---|---|---|
| Base Case | Quantity produced (t) | 2.58 | 0.40 | 0.71 | 1.27 |
| Dendromass content (t) | 0.76 | 0.08 | 0.08 | 0.08 | |
| Scenario 1 (economic best case) | Quantity produced (t) | 2.58 | 0.75 | 0.50 | 0.50 |
| Dendromass content (t) | 0.76 | 0.15 | 0.06 | 0.03 | |
| Scenario 2 (environmental best case) | Quantity produced (t) | 2.58 | 0.50 | 0.90 | 0.60 |
| Dendromass content (t) | 0.76 | 0.10 | 0.10 | 0.04 | |
| Scenario 3 (NBBM1 only) | Quantity produced (t) | 2.58 | 0 | 0 | 0 |
| Dendromass content (t) | 1.00 | 0 | 0 | 0 |
Table 2.
Environmental performance of the dendromass production and NBBM1–4 per ton of product.
| Environmental Performance | Value/1 ton Bone Dry Dendromass | Value/1 ton NBBM1 | Value/1 ton NBBM2 | Value/1 ton NBBM3 | Value/1 ton NBBM4 |
|---|---|---|---|---|---|
| GWP (kg CO2-eq) | 4.19 × 10 | 2.79 × 10² | 3.39 × 10³ | 2.21 × 10³ | 2.42 × 10³ |
| TAP (kg SO2-eq) | 5.90 × 10⁻² | 1.52 | 1.37 × 10 | 7.43 | 6.75 |
| ODP (kg CFC11-eq) | 8.27 × 10⁻⁶ | 2.56 × 10⁻⁵ | 2.30 × 10⁻⁴ | 5.80 × 10⁻⁴ | 7.30 × 10⁻⁴ |
| FEP (kg P-ep) | 4.00 × 10⁻⁴ | 1.60 × 10⁻¹ | 2.18 | 2.31 | 2.01 |
| FDP (kg oil-eq) | 1.59 × 10 | 1.40 × 10² | 1.25 × 10³ | 8.71 × 10² | 1.14 × 10³ |
| CED (MJ) | 4.79 × 10² | 1.58 × 10³ | 2.07 × 10⁴ | 5.68 × 10³ | 6.63 × 10³ |
Table 3.
Product system value of the dendromass production and NBBM1–4 per ton of product.
| Economic Performance | Value/1 bdt Dendromass | Value/1 ton NBBM1 | Value/1 ton NBBM2 | Value/1 ton NBBM3 | Value/1 ton NBBM4 |
|---|---|---|---|---|---|
| VA €/t | 24 | 430 | 12,348 | −707 | −6071 |
| RE €/t | 24 | 711 | 16,667 | 1220 | 1027 |
Table 4.
Eco-efficiency based on value added by the production of dendromass and NBBM1–4 per ton of product (Base Case).
Table 4.
Eco-efficiency based on value added by the production of dendromass and NBBM1–4 per ton of product (Base Case).
| Eco-Efficiency (Base Case) | Value/1 bdt Dendromass | Value/1 ton NBBM1 | Value/1 ton NBBM2 | Value/1 ton NBBM3 | Value/1 ton NBBM4 |
|---|---|---|---|---|---|
| VA (€)/GWP (kg CO2-eq) | 5.70 × 10⁻¹ | 1.54 | 3.64 | ||
| VA (€)/TAP (kg SO2-eq) | 4.02 × 10² | 2.83 × 10² | 9.02 × 10² | ||
| VA (€)/ODP (kg CFC11-eq) | 2.87 × 10⁶ | 1.68 × 10⁷ | 5.37 × 10⁷ | ||
| VA (€)/FEP (kg P-ep) | 5.93 × 10⁴ | 2.69 × 10³ | 5.66 × 10³ | ||
| VA (€)/FDP (kg oil-eq) | 1.49 | 3.07 | 9.84 | ||
| VA (€)/CED (MJ) | 5.00 × 10⁻² | 2.70 × 10⁻¹ | 6.00 × 10⁻¹ |
Table 5.
Eco-efficiency based on revenue of the production of dendromass and NBBM1–4 per ton of product (Base Case).
Table 5.
Eco-efficiency based on revenue of the production of dendromass and NBBM1–4 per ton of product (Base Case).
| Eco-Efficiency (Base Case) | Value/1 bdt Dendromass | Value/1 ton NBBM1 | Value/1 ton NBBM2 | Value/1 ton NBBM3 | Value/1 ton NBBM4 |
|---|---|---|---|---|---|
| RE (€)/GWP (kg CO2-eq) | 5.70 × 10⁻¹ | 2.55 | 4.92 | 5.50 × 10⁻¹ | 4.20 × 10⁻¹ |
| RE (€)/TAP (kg SO2-eq) | 4.02 × 10² | 4.68 × 10² | 1.22 × 10³ | 1.64 × 10² | 1.52 × 10² |
| RE (€)/ODP (kg CFC11-eq) | 2.87 × 10⁶ | 2.78 × 10⁷ | 7.25 × 10⁷ | 2.10 × 10⁶ | 1.41 × 10⁶ |
| RE (€)/FEP (kg P-ep) | 5.93 × 10⁴ | 4.44 × 10³ | 7.65 × 10³ | 5.28 × 10² | 5.11 × 10² |
| RE (€)/FDP (kg oil-eq) | 1.49 | 5.07 | 1.33 × 10 | 1.40 | 9.00 × 10⁻¹ |
| RE (€)/CED (MJ) | 5.00 × 10⁻² | 4.50 × 10⁻¹ | 8.10 × 10⁻¹ | 2.10 × 10⁻¹ | 1.50 × 10⁻¹ |
Table 6.
Ranking of eco-efficiency (value added) performance of the different scenarios in the different impact categories (green = best to red = worst).
Table 6.
Ranking of eco-efficiency (value added) performance of the different scenarios in the different impact categories (green = best to red = worst).
| Eco-Efficiency (VA) | Base Case | Scenario 1 | Scenario 2 | Scenario 3 |
|---|---|---|---|---|
| VA (€)/GWP (kg CO2-Eq | n. a. | 1.25 | 1.33 | 1.50 |
| VA (€)/TAP (kg SO2-Eq) | n. a. | 315.27 | 397.40 | 230.35 |
| VA (€)/ODP (kg CFC11-Eq) | n. a. | 7,888,764.04 | 4,360,000.00 | 15,796,089.39 |
| VA (€)/FEP (kg P-Ep) | n. a. | 1655.90 | 5869.23 | 2570.45 |
| VA (€)/FDP (kg oil-Eq) | n. a. | 3.03 | 2.49 | 3.04 |
| VA (€)/CED (MJ) | n. a. | 0.27 | 0.13 | −0.31 |
Table 7.
Ranking of eco-efficiency (revenue) performance of the different scenarios in the different impact categories (green = best to red = worst).
Table 7.
Ranking of eco-efficiency (revenue) performance of the different scenarios in the different impact categories (green = best to red = worst).
| Eco-Efficiency (RE) | Base Case | Scenario 1 | Scenario 2 | Scenario 3 |
|---|---|---|---|---|
| RE (€)/GWP (kg CO2-Eq) | 1.59 | 2.76 | 5.20 | 2.45 |
| RE (€)/TAP (kg SO2-Eq) | 442.38 | 696.09 | 1548.96 | 377.80 |
| RE (€)/ODP (kg CFC11-Eq) | 7,119,333.33 | 17,417,977.53 | 16,994,285.71 | 25,907,821.23 |
| RE (€)/FEP (kg P-Ep) | 1945.17 | 3656.13 | 22,876.92 | 4215.91 |
| RE (€)/FDP (kg oil-Eq) | 3.64 | 6.69 | 9.70 | 4.98 |
| RE (€)/CED (MJ) | 0.42 | 0.59 | 0.51 | −0.50 |
Disclaimer/Publisher’s Note: The statements, opinions and data contained in all publications are solely those of the individual author(s) and contributor(s) and not of MDPI and/or the editor(s). MDPI and/or the editor(s) disclaim responsibility for any injury to people or property resulting from any ideas, methods, instructions or products referred to in the content. |
© 2023 by the authors. Licensee MDPI, Basel, Switzerland. This article is an open access article distributed under the terms and conditions of the Creative Commons Attribution (CC BY) license (https://creativecommons.org/licenses/by/4.0/).
Share and Cite
MDPI and ACS Style
Hesser, F.; Groiß-Fürtner, D.; Woitsch, L.; Mair-Bauernfeind, C. Ex-Ante Eco-Efficiency Assessment of Dendromass Production: Conception and Experiences of an Innovation Project. Land 2023, 12, 839. https://doi.org/10.3390/land12040839
AMA Style
Hesser F, Groiß-Fürtner D, Woitsch L, Mair-Bauernfeind C. Ex-Ante Eco-Efficiency Assessment of Dendromass Production: Conception and Experiences of an Innovation Project. Land. 2023; 12(4):839. https://doi.org/10.3390/land12040839
Chicago/Turabian StyleHesser, Franziska, Daniela Groiß-Fürtner, Leona Woitsch, and Claudia Mair-Bauernfeind. 2023. "Ex-Ante Eco-Efficiency Assessment of Dendromass Production: Conception and Experiences of an Innovation Project" Land 12, no. 4: 839. https://doi.org/10.3390/land12040839
Note that from the first issue of 2016, this journal uses article numbers instead of page numbers. See further details here.