Article

The Effect of Land Consolidation Projects on Carbon Footprint

Department of Geomatics Engineering, Faculty of Engineering and Natural Sciences, Konya Technical University, 42250 Konya, Turkey
Land 2023, 12(2), 507; https://doi.org/10.3390/land12020507
Submission received: 2 February 2023 / Revised: 15 February 2023 / Accepted: 16 February 2023 / Published: 18 February 2023
(This article belongs to the Special Issue New Insights in Integrated Land Management)

Abstract

:
In this study, transportation-induced carbon footprint values before and after the consolidation projects in two areas with similar agricultural characteristics were calculated. The IPCC Tier 1 method recommended by the IPCC (Intergovernmental Panel on Climate Change) was used to calculate the carbon footprint. Furthermore, the effects of changes in road lengths and routes in these areas after Land Consolidation (LC) on the fuel consumption of tractors and, accordingly, the carbon dioxide (CO2) emission values were also determined. As a result of the study, the carbon footprint value (GgCO2) decreased by 10% in the Fatih neighborhood and 33% in the Selimiye neighborhood after the land consolidation project. Carbon equivalent (CE) is used to measure the effects on greenhouse gas emissions and global warming and corresponds to the amount of carbon dioxide (CO2) emissions. In total, 490.21 kg CO2·ha−1 of greenhouse gas (GHG) emissions were mitigated. In light of these results, it can be concluded that LC can be considered a useful process in greenhouse gas mitigation strategy. Based on the values obtained from the study results, it was concluded that land consolidation contributed to reducing carbon footprint and increasing agricultural production and productivity in rural areas. The reduction in fuel consumption and carbon emissions in rural areas will contribute to reducing the adverse effects of air pollution and climate change.

1. Introduction

Economic growth and human activities have led to an increased concentration of greenhouse gas (GHG) emissions in the atmosphere [1,2]. Since pre-industrial times, there has been an increase of 40% in carbon dioxide (CO2) concentrations, mainly due to fossil fuel emissions and land use, including in the agricultural sector [3,4]. The agricultural sector, which constitutes at least 20% of total emissions worldwide, more than 44% of which is generated on the Asian continent, is one of the major emitters of GHG in the world [5,6]. The rapid increase in the use of mechanization in agriculture has significantly increased the amount of CO2 emissions [7]. The study by [8] demonstrated that fuel consumption increased with the widespread use of tractors in agriculture. Irregular parcel shapes and scattered parcels caused by land fragmentation prevent intensive agriculture by increasing the need for machinery and manpower during production [9]. Land fragmentation is considered one of the most important factors that reduces the profitability of agriculture [10,11,12]. Thus, land fragmentation is considered a threat to the profitability of farms [13,14]. In addition, the distribution of parcels in the village causes both the loss of time and fuel oil that indirectly affects the environment [15]. The use of agricultural machinery on parcels with fragmented and irregular shapes causes large amounts of CO2 emissions due to their use far exceeding the standards of the daily agricultural activities of farmers. The stress on tractors used on these parcels leads to excessive fuel consumption and, accordingly, air pollution. On the other hand, the dispersion of more than one parcel belonging to a farmer causes tractors to consume more fuel during the day. The increased amount of fuel consumed also leads to an increase in CO2 emissions at the same rate. Nowadays, global climate change has become a serious environmental problem due to the increase in CO2 and other GHG [16,17]. This problem also accelerates global warming [18]. It is highly important to reduce GHG in order to fight against this problem. At many international meetings, such as the Kyoto Protocol and the Paris Agreement, it has been recommended to reduce carbon emissions to the lowest possible level as a solution to this problem. Emission quotas have been imposed on countries to accurately calculate carbon emissions. With regard to compliance with quota values, it is necessary to establish a GHG inventory and calculate the carbon footprints of emissions [19]. A carbon footprint is described as a measure of the damage caused by human activities to the environment in terms of the amount of GHG generated. From this point of view, the important of reducing CO2 emissions is made apparent.
Land consolidation (LC) is a land management tool that readjusts land parcel shapes and reallocates land rights to minimize the fragmentation of farmland, increase agricultural production, and provide optimal living and working conditions in rural areas. LC has become a crucial part of rural development worldwide for more than a century to address land fragmentation problems, especially in countries where agricultural lands are highly fragmented, and is applied in many countries around the world [20,21]. LC is considered an important tool to modernize agriculture and rural development [22,23,24,25]. Additionally, land consolidation studies are very important in terms of improving the spatial structure of the village [26]. LC is an important policy to improve the quantity and quality of cultivated land, reduce land fragmentation, adjust land ownership, optimize the land use structure, accelerate the development of modern agriculture, prevent rural land use and the degradation of the rural ecosystem, improve the rural environment, and support rural development and poverty reduction [20,27,28,29,30,31].
In the literature, there are numerous studies on land consolidation. Some of these studies are important stages of LC: determination of land value [32,33,34], land reallocation [35,36,37], and land parceling [38,39]. Studies on the social dimension [40] and economic evaluation [41] of LC have been conducted recently. Other studies on LC focus on the evaluation of these projects. Various studies have been conducted to evaluate the effectiveness of LC [42,43,44,45]. Furthermore, very few studies have focused on the economic, social, and environmental evaluation of the effects of LC [23]. LC can be a contributing tool within the context of reducing carbon emissions in the agricultural sector. Improvement in the farming economy resulting from implementing land consolidation projects is usually associated with reduced fuel consumption on farms [46]. Ref. [47] conducted a study to evaluate the carbon effect of LC using life cycle assessment. Ref. [48] evaluated the land consolidation process from an environmental perspective. Ref. [49] investigated the joint effects of multiple land consolidation strategies on ecosystem service interactions. In their study, Ref. [50] established a carbon effect accounting and analysis framework for the three phases of the land consolidation project: project initiation and design, project implementation, and operation management.
Unlike in the above-mentioned articles, an attempt was made in this study to determine the effects of changes in road lengths and routes before and after the land consolidation project on the fuel consumption of tractors and, accordingly, transportation-induced carbon footprint values. Transportation usually indicates the amount of fuel consumed to provide raw materials, carry out farming operations, or transport the harvest in journeys between farms and parcels. The road distances traveled by enterprises in project areas between the neighborhood center and the field parcel before and after consolidation were calculated by network analysis in ArcGIS. The calculation was based on the distance from land parcels for all parcels before and after the LC project by considering the shape of the road network. Accordingly, carbon footprint values and carbon equivalents were calculated. An ecological assessment of LC projects based on transportation-induced carbon footprint values has never been carried out before. Thus, the present study has filled this gap in the literature.

2. Materials and Methods
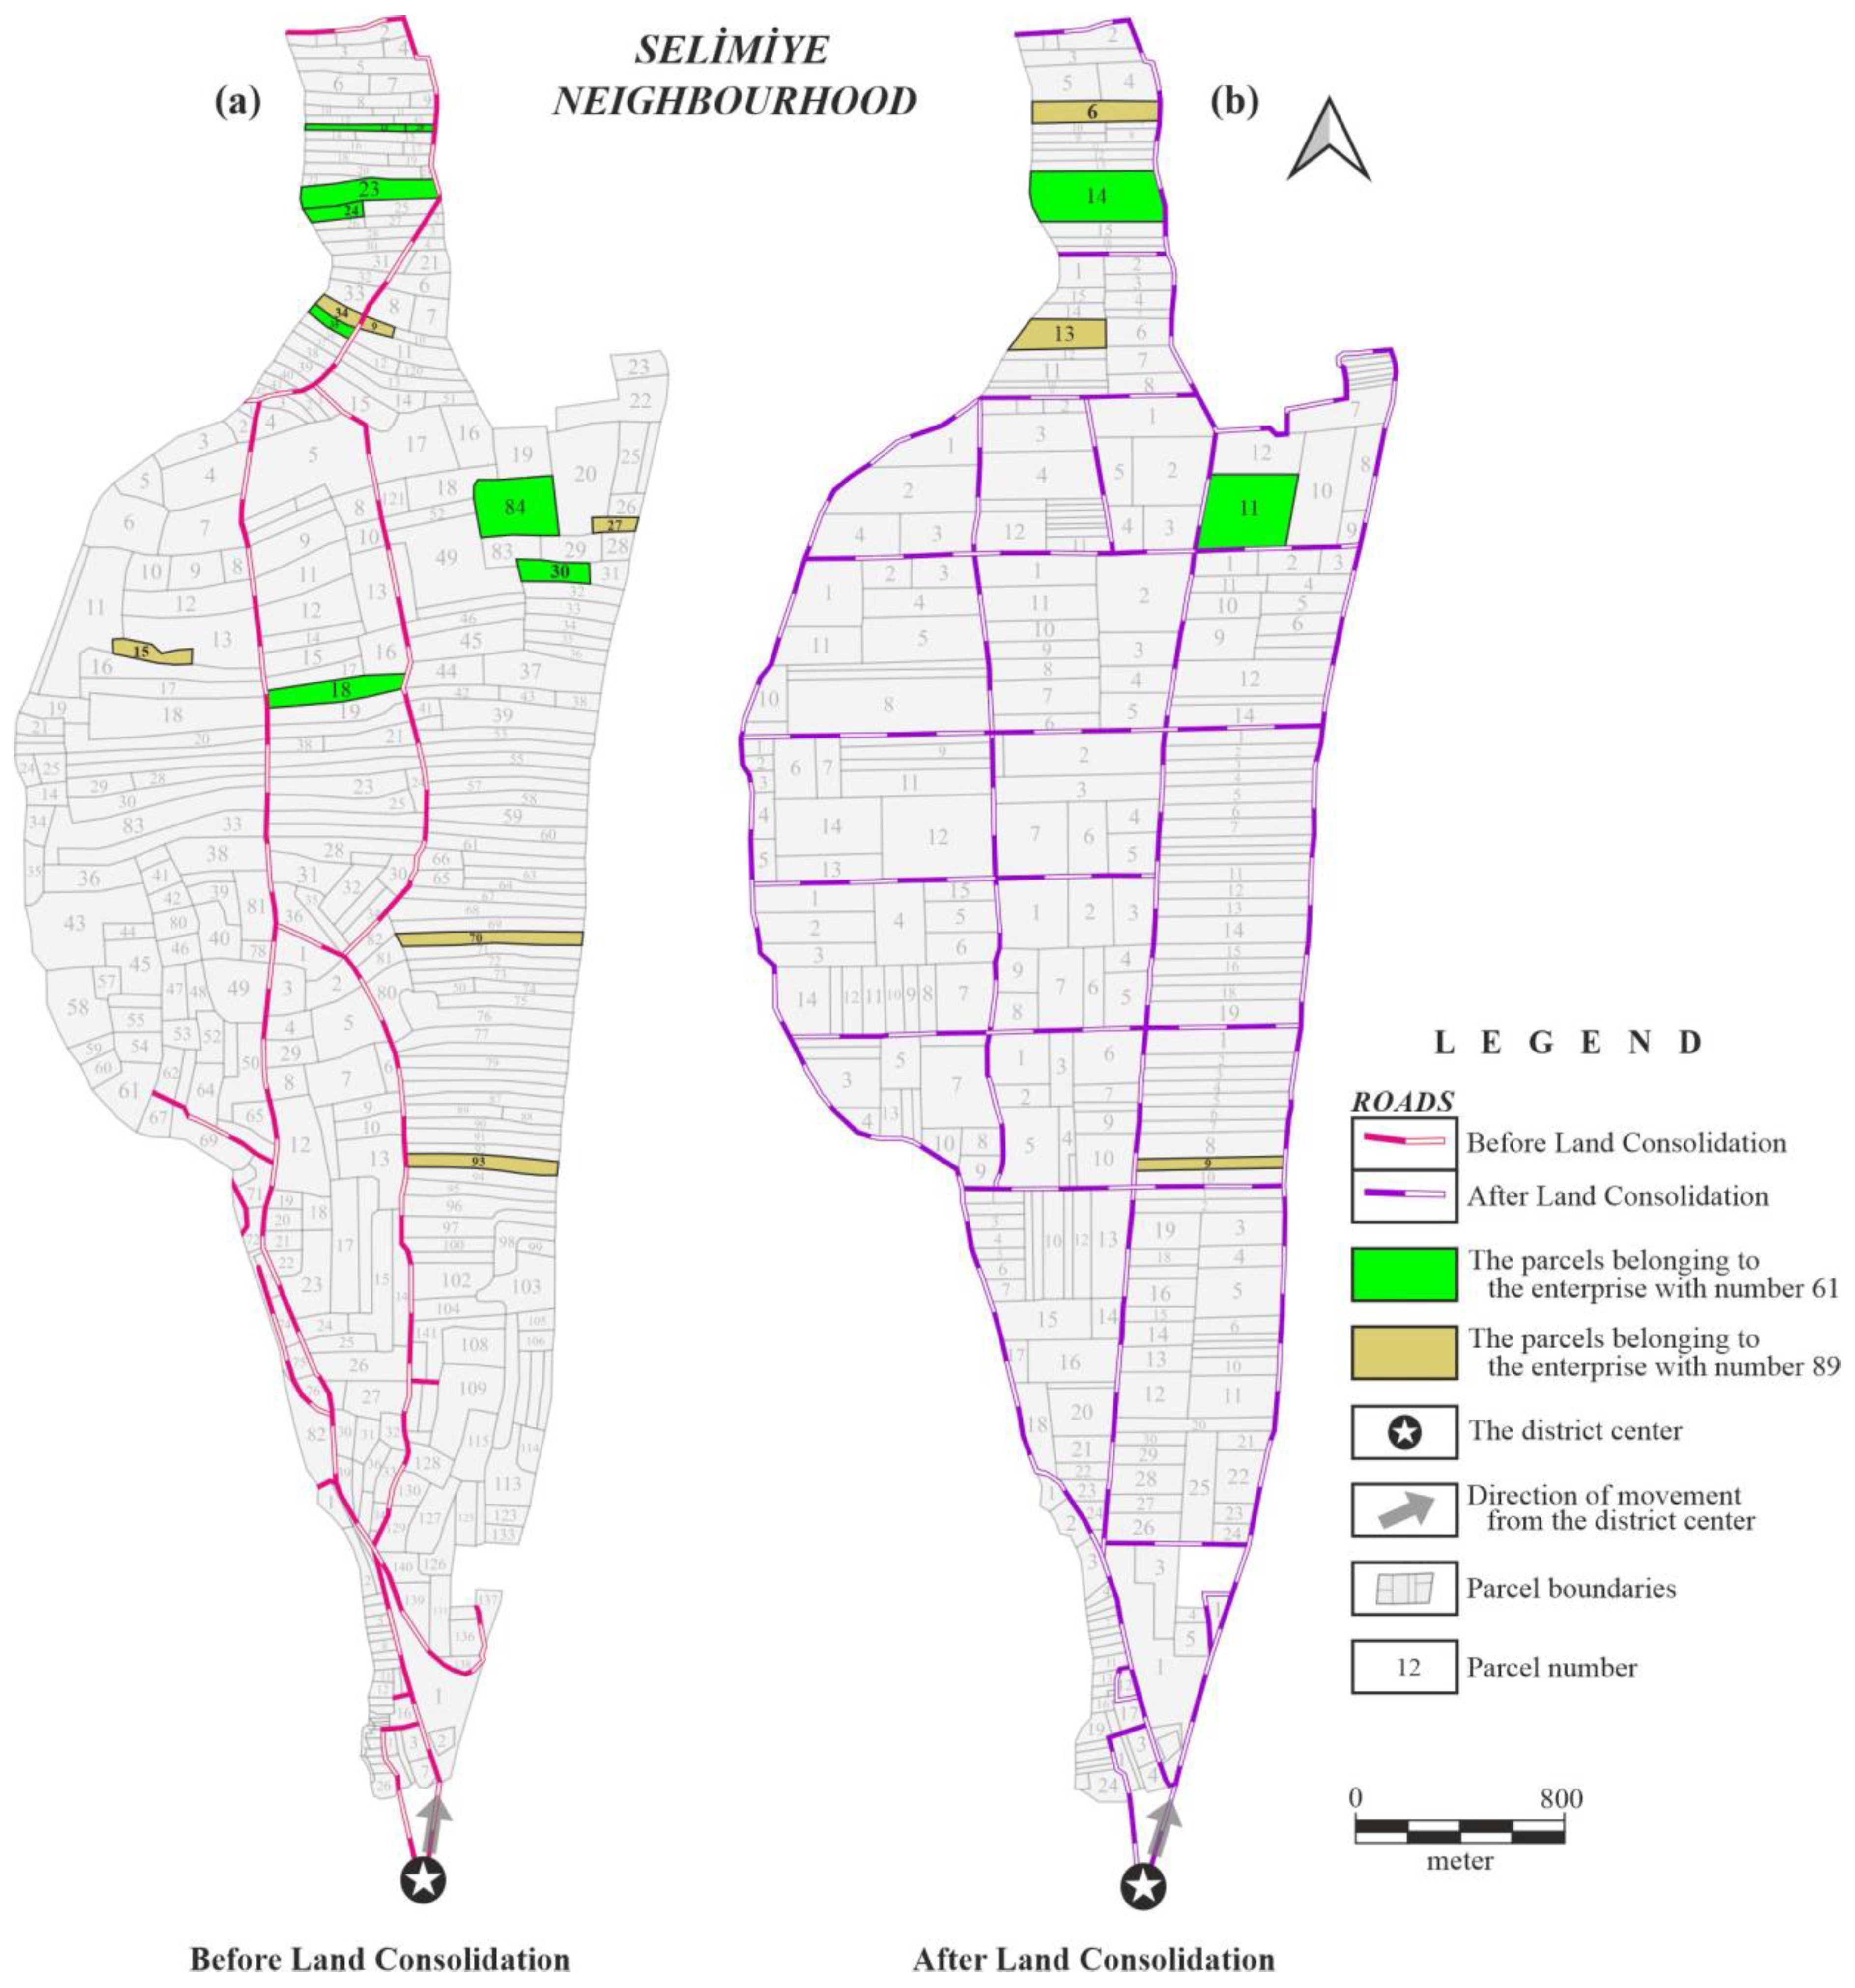
2.1. Study Area

Figure 1 shows the map of the study areas. The data of two different land consolidation projects, which were carried out in very close regions, were used in the study. These data included geometric data of parcels before and after the consolidation project, transportation networks, and ownership information of parcels. For the neighborhoods examined, both the location of the borders and the shape of the transportation network were determined before and after completing the consolidation project. Table 1 contains information about the projects used.

2.2. The Framework for Carbon Footprint Assessment of LC

After the land consolidation projects were completed, changes (to different extents) occurred in the shapes and locations of parcels belonging to enterprises. These changes also occurred in the shape of the transportation network (Figure 2).
In this study, changes in CO2 emissions before and after LC in the entire project area were calculated for each enterprise. The round trip of tractors (in two directions), journeys to parcels, and maneuvers inside parcels were taken into account in the calculations. It is not easy to determine the distances traveled by enterprises. It is impossible to determine the routes of enterprises, the order of parcel visitation, and the time spent for agrotechnical operations for each parcel. With the help of field survey data and the ArcGIS program, the road routes followed by landowners between the neighborhood center and agricultural lands were determined by network analysis of the maps before and after the consolidation. GIS-based network analysis applications include transportation planning, shipping, distribution, communication, and shortest path analysis. Digital data regarding linear objects such as roads, streets, and communication networks are among the most utilized sources of spatial information [51]. The main problem in network analysis is finding the shortest route from one node to another. It is necessary to create a topology from the road network in order to obtain accurate and good results from the analysis [52]. To this end, based on the route information of the road network in the consolidation area (before and after the consolidation project), graphical structures reflecting the shape of this network were created.

2.3. Calculation Procedure

The total amount of CO2 emissions generated directly or indirectly by a product that results from human activities during its entire life cycle is called its carbon footprint [53]. It is calculated in units of CO2. Carbon footprint can be examined under two headings: personal and institutional [54]. The carbon footprint resulting from human activities should be examined under the parameters of transportation, food production, housing, products, and services so that it can be understood more clearly. During the calculation of each parameter, the social and economic structure of each country differs. Under the transportation parameter, fuel use is the primary footprint, whereas public transportation, air transport, and automobiles are listed as secondary footprint parameters. In the current study, calculations were made based on the IPCC’s Tier 1 method. The steps of carbon footprint calculation are explained below.
Step 1. Determination of average fuel consumption (L/100 km):
Fuel consumption varied by engine type, engine characteristics, land structure, topography, condition of roads, and loading of tractors. In accordance with the studies conducted by [46,55,56,57], it was assumed that a tractor consumed an average of 0.44 L of diesel fuel per kilometer. In the present study, this value was used during the calculations.
Step 2. Calculation of fuel consumption (kt):
The amount of fuel consumed by motor vehicles in transportation sectors is calculated in kt (Equation (1)). In this study, calculations were made based on the diesel fuel type. The diesel fuel density was considered as 0.86 kg/L [58].
Fuel consumption = Distance (km) × Fuel consumption (L/km) × Fuel density (kg/L) × 10−6 (kt/kg)
Step 3. Calculation of energy consumption (TJ):
The energy content is calculated by multiplying the total amount of fuel consumption calculated in the road, rail, and air transport sectors by the fuel conversion factor, selected according to fuel type (Equation (2)). The fuel conversion factors are shown in Table 2.
Energy consumption = Fuel consumption (kt) × Fuel conversion factor (Tj/kt)
Step 4.Determination of the carbon content of fuel (tC):
The carbon content is found by multiplying the energy content of the fuel by the carbon emission factor, selected according to fuel type (Equation (3)). The fuel carbon emission factors are shown in Table 3.
Carbon content of fuel = Energy consumption (tj) × Carbon emission factor (tc/TJ)
Step 5. Calculation of C emission (tC):
Since not all of the fuel in the combustion chamber of vehicles is oxidized, the carbon content of the fuel is multiplied by the rate of carbon oxidation. The Rate of Carbon Oxidation was considered as (Gasoline-Diesel-LPG) = 0.99 (Equation (4)).
C Emission = Carbon content of fuel (TC) × Oxidation rate
Step 6. Calculation of CO2 emission (GgCO2):
To find the CO2 gas released from the fuel, C emission is multiplied by the mole weight ratio of CO2/C, and the CO2 emission is found (Equation (5)). The CO2 calculated is converted into GHG emission units (Gg) which are used by the IPCC.
CO 2   emission = C   emission   ( t )   ×   44 / 12   ( C O 2 / C )   ×   10 3   ( Gg / t )
While calculating carbon equivalents with the second method, fuel consumption was determined in L per hectare. Carbon emissions were also calculated in kg per hectare based on fuel consumption.
1 L of agricultural diesel = 2.664 kg of CO2
All calculations are expressed in km·ha−1 to compare the travels before and after LC. The parameter R ij is defined for each drawing. This parameter is the sum of distances in each cultivation operation ( R NCI ), crop monitoring and surveillance operations ( R seg ), and crop harvest operations ( R COS ) (Equation (7)) [48]. Calculations were repeated for before and after LC.
R ij = R NCI + R seg + R COS
The fuel consumption (K1) measured in L·ha−1, Equation (8) [48].
K 1 = n = 1 n R ij × E × c n
  • R ij : Distance between the parcel and the neighborhood center, in km,
  • E = Coefficient according to the type of road,
  • c = Fuel consumption according to energy requirements (light or heavy, L·km−1) (In the calculations, the type of road and the energy requirements for each travel were considered constant),
  • n = Number of exploitations in each LC.

3. Results

Many factors, such as the type of equipment used on parcels, soil structure, topography, the habits of the person driving the tractor such as gear, speed, and maneuvering, the road condition on off-field roads, the type of production, and the method followed in production, affect the fuel consumption of tractors. In the calculations, the main factors affecting fuel consumption are the distance of parcels from the neighborhood center, the number of parcels, and the distribution of parcels belonging to the enterprise. Carbon footprint and carbon emission values were calculated depending on the tractor specifications accepted on the road routes and field parcels before and after LC. Changes in carbon footprint (GgCO2) for each enterprise before and after LC are presented in Figure 3 and Figure 4. For the Fatih neighborhood, while the average carbon footprint value before LC was 7.79038 × 10⁻⁶ GgCO2, it decreased to an average of 6.16032 × 10⁻⁶ GgCO2 after LC. For the Selimiye neighborhood, while the average carbon footprint value before LC was 1.69582 × 10⁻⁵ GgCO2, it decreased to an average of 1.13369 × 10⁻⁵ GgCO2 after LC. In total, the carbon footprint value (GgCO2) decreased by 10% in the Fatih neighborhood and 33% in the Selimiye neighborhood. Changes in carbon emission values (CE) between the neighborhood center and the enterprise parcels in each enterprise before and after consolidation are given in Figure 5 and Figure 6. For the Fatih neighborhood, the carbon equivalent value before LC varied by enterprise between 0.5476 kg CO2·ha−1 and 11.2537 kg CO2·ha−1. This value varied between 0.5476 kg CO2·ha−1 and 5.0620 kg CO2·ha−1 after LC. For the Selimiye neighborhood, the carbon equivalent value before LC varied by enterprise between 0.3453 kg CO2·ha−1 and 50.0965 kg CO2·ha−1. This value varied between 0.2808 kg CO2·ha−1 and 17.3783 kg CO2·ha−1 after LC. For the Fatih neighborhood, whereas the average carbon equivalent before LC was 2.0831 kg CO2·ha−1, it decreased to 1.652 3 kg CO2·ha−1 after LC. In the Fatih neighborhood, there was a total decrease of 64.19 kg CO2·ha−1. For the Selimiye neighborhood, while the average carbon equivalent before LC was 4.5452 kg CO2·ha−1, it decreased to 3.0482 kg CO2·ha−1 after LC. In the Selimiye neighborhood, a decrease of 426.02 kg CO2·ha−1 occurred.
The change in GgCO2 emission values according to the enterprise areas is presented in Figure 7 and Figure 8. Since only the carbon footprint due to transportation between the parcels was calculated, the enterprise areas did not affect the carbon footprint.
The enterprises with the largest changes in carbon footprint value in both application areas are presented in Figure 9 and Figure 10. In the Fatih Neighborhood, while the CO2 emission value of enterprise number 55 was 0.041476 tons before LC, it decreased to 0.018894 tons after LC. For enterprise number 156, CO2 emission was 0.042005 tons before LC and 0.014479 tons after LC. In the Selimiye Neighborhood, whereas the CO2 emission value of enterprise number 89 was 0.186456 tons before LC, this value decreased to 0.039285 tons after LC. While the CO2 emission value of enterprise number 61 was 0.122521 tons before LC, this value decreased to 0.044512 tons after LC. Likewise, considering the carbon equivalent (CE) values of these enterprises, while the CE value was 11.1122 kg CO2·ha−1 for enterprise number 55 in the Fatih Neighborhood, it decreased to 5.0620 kg CO2·ha−1 after LC. In enterprise number 156, while the CE value for the enterprise was 11.2537 kg CO2·ha−1 before LC, it decreased to 3.8793 kg CO2·ha−1 after LC. For enterprise number 89 in the Selimiye Neighborhood, the carbon equivalent decreased from 49.9539 kg CO2·ha−1 before LC to 10.5249 kg CO2·ha−1 after LC. For enterprise number 61, the carbon equivalent decreased from 32.8250 kg CO2·ha−1 before LC to 11.9254 kg CO2·ha−1 after LC.
Since some parcels did not have direct access to a road before LC, farmers may have struggled to reach their own parcels through the boundaries of parcels belonging to other people. On the other hand, the use of these areas, which do not have road features, for transportation caused stress in vehicles and excessive fuel consumption. Furthermore, since the decrease in the number of parcels after LC reduces the distance between the parcels and the neighborhood center, less fuel consumption and CO2 emissions occur due to the shortening of the road and the execution of works in a single parcel. Therefore, LC decreased the carbon footprint value.

4. Discussion

After LC, the shortening of the length of the existing access roads to the parcels resulted in lower cost, shorter shipping, and shorter time to implement agricultural work [61]. Due to fragmented parcels, the lack of access to the road for some parcels, and irregular road routes before LC, there is an increase in the fuel consumption of vehicles and, accordingly, carbon footprint values and carbon emissions. In this study, the carbon footprint value and carbon equivalent decreased after LC in the vast majority of enterprises, as seen in previous studies [7,48]. However, the reduction amount differed between enterprises due to reasons such as topography, soil, and former ownership status. Due to increased transportation lengths for some enterprises, their carbon footprint values and carbon equivalent increased. This means that they obtained worse plot locations compared to the layout before the consolidation. Therefore, the road length also increased in some cases. However, in practice, the improvement in the structure of the roads used after LC also reduced the fuel consumption of vehicles. In some enterprises, the carbon footprint values were almost the same. It should not be forgotten that even if distances stay the same, the travel times have halved since the number of parcels has halved [43]. Thus, from the point of view of the landowner, this is considered a positive development since planting costs will decrease along with the travel costs.
As can be seen from the results obtained, the decrease in the number of parcels after LC, the merging of scattered parcels belonging to the same enterprise, and each parcel’s access to the road reduced the fuel consumption of each enterprise and, thus, the carbon footprint value decreased. Ref. [62] argue that the implementation of land consolidation projects which combining scattered parcels makes it possible to reduce air pollution and the greenhouse effect as less carbon dioxide emissions are released into the environment. Ref. [63] stated that during the preparation of land consolidation projects it is possible to achieve good results in protecting the environment by reducing air pollution. The implementation of LC projects in Finland has had a positive impact on the climate. The LC project carried out in Järilä resulted in a reduction in working hours in agricultural production and thus a reduction in fuel consumption in production. These actions resulted in reduced CO2 emissions to the atmosphere [64]. Ref. [46] determined in their study that land consolidation contributes especially to time and fuel savings. The fact that some parcels of landowners are not adjacent to the road increases the fuel costs for transportation to the parcels. Benefits such as facilitating transportation by providing the front of each parcel access to the road and, accordingly, reducing fuel consumption and carbon dioxide emission values are not the only ones provided with land consolidation. With these projects, parcel shapes are also improved and, thus, the use of vehicles in parcels is facilitated in agrotechnical activities. Refs. [65,66] demonstrated a strong correlation between the shape and size of these areas and higher fuel consumption efficiency, lower number of turns, and “non-operating distance”. It can be said that the average fuel consumption of tractors decreases due to reasons such as the improvement of parcel shapes and making parcels irrigable after consolidation.
The road network was completely changed after LC. The LC project eliminated all right of way, thus allowing direct access to all parcels and minimizing the number of journeys on roads and in urban areas. Along with the improvement of the infrastructure and superstructure of roads, there was also a decrease in problems such as difficulties and malfunctions in the tools and equipment used. Thus, the fuel consumption of tractors and trucks above the predicted average fuel consumption was significantly prevented. Therefore, Ref. [67] argued that land consolidation methods should be developed to overcome future challenges for the environment, especially in terms of climate change mitigation. Ref. [68] showed that improved road quality as a result of land consolidation also positively affects transport-related emissions.

5. Conclusions

In order for land consolidation projects to be successful in terms of environmental protection, effective models should be developed for the transition from multi-part and small-scale enterprises to modern enterprises with one piece or few parts with sufficient size. Therefore, the use of land banking is required in land consolidation projects. With LC projects, landscape features are improved in rural areas and negative environmental effects caused by agricultural activities are easily controlled.
Our developing world needs more food and energy every day due to rapid population growth. Providing all this food and energy leads to by-products and waste, with a certain level of adverse effects. Nowadays, the monitoring and evaluation of carbon footprint has become an extremely important process to classify these wastes and measure their effects on our world. The present study aimed to calculate the carbon footprint values of land consolidation projects, with the change due to transportation.
The study results showed that land consolidation projects reduced the carbon footprint value, which significantly affects climate change; therefore, land consolidation significantly contributed to the protection of the air quality and climate of the rural environment. Although the extent of the impact of these projects depends on the fuel density in a particular area, this impact increases with the size of the implemented project. In this study, it was concluded that the carbon footprint values resulting from agriculture decreased after LC by the reduction in planting and travel times (due to transportation) in the study areas. Based on these study results, it can be stated that the GHG reduction strategy contributed to LC projects. In light of our results, it can be concluded that LC projects can be considered a useful process in the GHG mitigation strategy. The method employed in this study can be used to make an environmental assessment in every land consolidation project. Land consolidation projects do not only provide benefits such as facilitating transportation between the neighborhood center and the enterprise parcel and reducing fuel consumption and CO2 emission values. Moreover, since improvements are made in the shapes of parcels, they also contribute to agricultural activities based on mechanization, such as the use of vehicles on the parcel, plowing the field, planting, fertilization, and irrigation. Furthermore, the change in the parcel’s shape affects both the working conditions and working hours of tractors in the parcel. In the future, a more comprehensive study will be conducted by considering changes in the parcel’s shape and including different criteria, such as soil type and road type related to the road network, in calculations.

Funding

This research received no external funding.

Institutional Review Board Statement

Not applicable.

Informed Consent Statement

Not applicable.

Data Availability Statement

The data presented in this study are available on request from the corresponding author.

Conflicts of Interest

The author declares no conflict of interest.

References

  1. Pata, U.K.; Kumar, A. The Influence of Hydropower and Coal Consumption on Greenhouse Gas Emissions: A Comparison between China and India. Water 2021, 13, 1387. [Google Scholar] [CrossRef]
  2. Duan, J.; Ren, C.; Wang, S.; Zhang, X.; Reis, S.; Xu, J.; Gu, B. Consolidation of agricultural land can contribute to agricultural sustainability in China. Nat. Food 2021, 2, 1014–1022. [Google Scholar] [CrossRef]
  3. IPCC. Climate Change 2013. In The Physical Science Basis Working Group I Contribution to the Fifth Assessment Report of the Intergovernmental Panel on Climate Change; Stocker, T.F., Qin, D., Plattner, G.K., MMB, T., Allen, S.K., Boschung, J., Nauels, A., Xia, Y., Bex, V., Midgley, P.M., Eds.; Cambridge University Press: Cambridge, UK, 2013. [Google Scholar]
  4. Prastiyo, S.E.; Irham; Hardyastuti, S.; Jamhari. How agriculture, manufacture, and urbanization induced carbon emission? The case of Indonesia. Environ. Sci. Pollut. Res. 2020, 27, 42092–42103. [Google Scholar] [CrossRef] [PubMed]
  5. FAO. Greenhouse Gas Emissions from Agriculture, Forestry and Other Land Use; FAO: Rome, Italy, 2016. [Google Scholar]
  6. FAO. The State of Food and Agriculture: Climate Change, Agriculture and Food Security; FAO: Rome, Italy, 2016. [Google Scholar]
  7. Polat, H.E.; Manavbaşı, I.D. Determining the effects of land consolidation on fuel consumption and carbon dioxide emissions in rural area. Tarım Bilim. Derg. 2012, 18, 157–165. [Google Scholar]
  8. Viesturs, D.; Kopiks, N.; Melece, L.; Zakis, I. Methodological aspects for estimation of impact of modernisation of fleet of tractors upon polluting emissions in the air. In Proceedings of the 10th International Scientific Conference, Jelgava, Latvia, 26–27 May 2011; Latvian University of Agriculture: Jelgava, Latvia; pp. 201–205. [Google Scholar]
  9. Kirmikil, M.; Arıcı, I. The role of land consolidation in the development of rural areas in irrigation areas. J. Food Agric. Environ. 2013, 11, 1150–1155. [Google Scholar]
  10. Tan, S.; Heerink, N.; Kuyvenhoven, A.; Qu, F. Impact of land fragmentation on rice producers’ technical efficiency in South-East China. NJAS—Wagening. J. Life Sci. 2010, 57, 117–123. [Google Scholar] [CrossRef] [Green Version]
  11. Di Falco, S.; Penov, I.; Aleksiev, A.; van Rensburg, T.M. Agrobiodiversity, farm profits and land fragmentation: Evidence from Bulgaria. Land Use Policy 2010, 27, 763–771. [Google Scholar] [CrossRef]
  12. Kousar, R.; Makhdum, M.S.A.; Ullah, R.; Saghir, A.; Usman, S.; Sadaf, T. Empirical investigation of impact of land fragmentation on crop productivity in Punjab, Pakistan. Sarhad J. Agric. 2020, 36, 1–374. [Google Scholar] [CrossRef] [Green Version]
  13. Lu, H.; Xie, H.; He, Y.; Wu, Z.; Zhang, X. Assessing the impacts of land fragmentation and plot size on yields and costs: A translog production model and cost function approach. Agric. Syst. 2018, 161, 81–88. [Google Scholar] [CrossRef]
  14. Teijeiro, D.; Amor, M.; Doallo, R.; Corbelle, E.; Porta, J.; Parapar, J. Land consolidation through parcel exchange among landowners using a distributed Spark-based genetic algorithm. J. Supercomput. 2022, 78, 19522–19544. [Google Scholar] [CrossRef]
  15. Balawejder, M.; Noga, K. The influence of the highway route on the development of patchwork of plots. J. Water Land Dev. 2016, 30, 3–11. [Google Scholar] [CrossRef] [Green Version]
  16. Friedlingstein, P.; Andrew, R.M.; Rogelj, J.; Peters, G.P.; Canadell, J.G.; Knutti, R.; Luderer, G.; Raupach, M.R.; Schaeffer, M.; van Vuuren, D.P.; et al. Persistent growth of CO2 emissions and implications for reaching climate targets. Nat. Geosci. 2014, 7, 709–715. [Google Scholar] [CrossRef]
  17. Han, Y.M.; Long, C.; Geng, Z.Q.; Zhang, K.Y. Carbon emission analysis and evaluation of industrial departments in China: An improved environmental DEA cross model based on information entropy. J. Environ. Manag. 2018, 205, 298–307. [Google Scholar] [CrossRef] [PubMed]
  18. Labeckas, G.; Slavinskas, S. The influence of fuel additives S0-2E on diesel engine exhaust emission. Transp. J. 2003, 8, 202–208. [Google Scholar] [CrossRef] [Green Version]
  19. Kılıç, M.Y.; Dönmez, T.; Adalı, S. Karayolu ulaşımında yakıt tüketimine bağlı karbon ayak izi değişimi: Çanakkale örneği. Gümüşhane Üniversitesi Fen Bilim. Enstitüsü Derg. 2021, 11, 943–955. [Google Scholar]
  20. Luo, W.; Timothy, D.J. An assessment of farmers’ satisfactio with land consolidation performance in China. Land Use Policy 2017, 61, 501–510. [Google Scholar] [CrossRef]
  21. Akkaya Aslan, Ş.T. Evaluation of land consolidation projects with parcel shape and dispersion. Land Use Policy 2021, 105, 105401. [Google Scholar] [CrossRef]
  22. Gonzalez, X.P.; Marey, M.F.; Alvarez, C.J. Evaluation of productive rural land patterns with joint regard to the size, shape and dispersion of plots. Agric. Syst. 2007, 92, 52–62. [Google Scholar] [CrossRef]
  23. Crecente, R.; Álvarez, C.; Fra, U. Economic, social and environmental impact of land consolidation in Galicia. Land Use Policy 2002, 19, 135–147. [Google Scholar] [CrossRef]
  24. Wu, Z.; Liu, M.; Davis, J. Land consolidation and productivity in Chinese household crop production. China Econ. Rev. 2005, 16, 28–49. [Google Scholar] [CrossRef]
  25. Kolis, K.; Hiironen, J.; Riekkinen, K.; Vitikainen, A. Forest land consolidation and its effect on climate. Land Use Policy 2017, 61, 536–542. [Google Scholar] [CrossRef]
  26. Stręk, Ż.; Noga, K. Method of Delimiting the Spatial Structure of Villages for the Purposes of Land Consolidation and Exchange. Remote Sens. 2019, 11, 1268. [Google Scholar] [CrossRef] [Green Version]
  27. Huang, Q.; Li, M.; Chen, Z.; Li, F. Land consolidation: An approach for sustainable development in rural China. AMBIO A J. Hum. Environ. 2011, 40, 93–95. [Google Scholar] [CrossRef] [PubMed] [Green Version]
  28. Long, H. Land consolidation: An indispensable way of spatial restructuring in rural China. J. Geogr. Sci. 2014, 24, 211–225. [Google Scholar] [CrossRef]
  29. Song, W.; Pijanowski, B.C. The effects of China’s cultivated land balance program on potential land productivity at a national scale. Appl. Geogr. 2014, 46, 158–170. [Google Scholar] [CrossRef]
  30. Demetriou, D. The assessment of land valuation in land consolidation schemes: Themed for a new land valuation framework. Land Use Policy 2016, 54, 487–498. [Google Scholar] [CrossRef]
  31. Zhou, Y.; Guo, L.; Liu, Y. Land consolidation boosting poverty alleviation in China: Theory and practice. Land Use Policy 2019, 82, 339–348. [Google Scholar] [CrossRef]
  32. Ertunç, E.; Muchová, Z.; Tomić, H.; Janus, J. Legal, Procedural and Social Aspects of Land Valuation in Land Consolidation: A Comparative Study for Selected Central and Eastern Europe Countries and Turkey. Land 2022, 11, 636. [Google Scholar] [CrossRef]
  33. Tezcan, A.; Büyüktaş, K.; Akkaya Aslan, Ş.T. A multi-criteria model for land valuation in the land consolidation. Land Use Policy 2020, 95, 104572. [Google Scholar] [CrossRef]
  34. Muchová, Z.; Konc, L.; Petrovič, F. Land plots valuation in land consolidation in slovakia: A need for a new approach. Int. J. Strateg. Prop. Manag. 2018, 22, 372–380. [Google Scholar] [CrossRef]
  35. Harasimowicz, S.; Bacior, S.; Gniadek, J.; Ertunç, E.; Janus, J. The impact of the variability of parameters related to transport costs and parcel shape on land reallocation results. Comput. Electron. Agric. 2021, 185, 106137. [Google Scholar] [CrossRef]
  36. Tongur, V.; Ertunç, E.; Uyan, M. Use of the Migrating Birds Optimization (MBO) Algorithm in solving land distribution problem. Land Use Policy 2020, 94, 104550. [Google Scholar] [CrossRef]
  37. Haklı, H.; Uğuz, H.; Çay, T. Genetic algorithm supported by expert system to solve land redistribution problem. Expert Syst. 2018, 35, 6. [Google Scholar] [CrossRef]
  38. Janus, J.; Ertunç, E. Towards a full automation of land consolidation projects: Fast land partitioning algorithm using the land value map. Land Use Policy 2022, 120, 106282. [Google Scholar] [CrossRef]
  39. Haklı, H.; Uğuz, H. A novel approach for automated land partitioning using genetic algorithm. Expert Syst. Appl. 2017, 82, 10–18. [Google Scholar] [CrossRef]
  40. De Vries, W.T. Social Aspects in Land Consolidation Processes. Land 2022, 11, 452. [Google Scholar] [CrossRef]
  41. Sert, A.; Alkan, R.M.; Ceylan, A.R.; Karagöz, Ö.; Vanlı, C. Social and Economic Monitoring and Evaluation of Land Consolidation Projects after Implementations. In Proceedings of the FIG 2018, İstanbul, Turkey, 6–11 May 2018. [Google Scholar]
  42. Kawasaki, K. The costs and benefits of land fragmentation of rice farms in Japan. Aust. J. Agric. Resour. Econ. 2010, 54, 509–526. [Google Scholar] [CrossRef] [Green Version]
  43. Hiironen, J.; Riekkinen, K. Agricultural impacts and profitability of land consolidations. Land Use Policy 2016, 55, 309–317. [Google Scholar] [CrossRef]
  44. Villanueva, M.P.; Colombo, S. Cost analysis of parcel fragmentation in agriculture: The case of traditional olive cultivation. Biosyst. Eng. 2017, 164, 135–146. [Google Scholar] [CrossRef]
  45. Janus, J.; Ertunç, E. The impact of differences in land fragmentation parameters on the planning, implementation, and evaluation of land consolidation projects. Case studies of Turkey and Poland. Comput. Electron. Agric. 2020, 179, 105813. [Google Scholar] [CrossRef]
  46. Bahar, S.K.; Kirmikil, M. The evaluation of agricultural landowner inputs before and after land consolidation: The Kesik Village example. Land Use Policy 2021, 109. [Google Scholar] [CrossRef]
  47. Shan, W.; Jin, X.; Yang, X.; Gu, Z.; Han, B.; Li, H.; Zhou, Y. A framework for assessing carbon effect of land consolidation with life cycle assessment: A case study in China. J. Environ. Manag. 2020, 266, 110557. [Google Scholar] [CrossRef] [PubMed]
  48. Ramírez del Palacio, O.; Hernández-Navarro, S.; Sánchez-Sastre, L.F.; Fernández-Coppel, I.A.; Pando-Fernández, V. Assessment of Land Consolidation Processes from an Environmental Approach: Considerations Related to the Type of Intervention and the Structure of Farms. Agronomy 2022, 12, 1424. [Google Scholar] [CrossRef]
  49. Zhou, Z.; Liu, D.; Sun, Y.; He, J. Predicting joint effects of multiple land consolidation strategies on ecosystem service interactions. Environ. Sci. Pollut. Res. 2022, 29, 37234–37247. [Google Scholar] [CrossRef] [PubMed]
  50. Yang, W.; Li, X.; Li, W.; Zhang, Y.; Zhang, H.; Ran, Y. Carbon effect calculation and upgrading strategy of agricultural land consolidation project in urban edge of Three Gorges Reservoir Area. Front. Chem. Sect. Green Sustain. Chem. 2022, 10, 1022644. [Google Scholar] [CrossRef]
  51. Erden, T.; Coşkun, M.Z.; İpbüker, C. Network analysis and transportation problems in GIS. Harit. Derg. 2003, 70, 17–32. [Google Scholar]
  52. Curtin, M.K. Network Analysis in Geographic Information Science: Review, Assessment, and Projections. Cartogr. Geogr. Inf. Sci. 2007, 34, 103–111. [Google Scholar] [CrossRef] [Green Version]
  53. Wiedmann, T.; Minx, J. A Definition of ‘Carbon Footprint’. In Ecological, Economics Research Trends: Chapter 1; Pertsova, C.C., Ed.; Nova Science Publishers: Hauppauge NY, USA, 2008; pp. 1–11. Available online: https://www.novapublishers.com/catalog/product_info.php?products_id=5999 (accessed on 6 October 2022).
  54. Bekiroğlu, O. Sürdürülebilir Kalkınmanın Yeni Kuralı: Karbon Ayak İzi. II; Elektrik Tesisat Ulusal Kongresi: İstanbul, Türkiye, 2011. [Google Scholar]
  55. Özçelik, A.; Özer, O.O. Çiftçilere Yapılan Kimyevi Gübre Desteği ve Tarımsal Faaliyette Kullanılan Mazot için Destekleme Ödemelerinin Değerlendirilmesi. Tarım Bilim. Derg. 2006, 13, 1–8. [Google Scholar]
  56. Reckleben, Y.; Trefflich, S.; Thomsen, H. Auswirkung der Abgasnormen auf den Kraftstoffverbrauch von Traktoren im praktischen Einsatz. Landtechnik 2013, 68, 322–326. [Google Scholar]
  57. Renius, K.T.; Geimer, M. Motoren und Getriebe bei Traktoren. Jahrb. Agrartech. 2013, 10, 1–12. [Google Scholar]
  58. Çelik, H.A. Konya Ilinde Ulaşımdan Kaynaklı Karbon Ayak izi ve Çevresel Fayda Maliyet Analizi. Master’s Thesis, Konya Teknik Üniversitesi Lisansüstü Eğitim Enstitüsü, Konya, Turkey, 2020. [Google Scholar]
  59. IPCC. Guidelines for National Greenhouse Gas Inventories. In Chapter 1—Introduction Prepared by the National Greenhouse Gas Inventories Programme; Eggleston, H.S., Buendia, L., Miwa, K., Ngara, T., Tanabe, K., Eds.; IGES: Kanagawa, Japan, 2006; Volume 2. [Google Scholar]
  60. IPCC. IPCC Guidelines for National Greenhouse Gas Inventories. Volumes 2 and 3; Houghton, J.T., Meira Filho, L.G., Lim, B., Tréanton, K., Mamaty, I., Bonduki, Y., Griggs, D.J., Callander, B.A., Eds.; Intergovernmental Panel on Climate Change (IPCC), IPCC/OECD/IEA: Paris, France, 1997; Revised 1996. [Google Scholar]
  61. Cienciała, A.; Sobura, S.; Sobolewska-Mikulska, K. Optimising Land Consolidation by Implementing UAV Technology. Sustainability 2022, 14, 4412. [Google Scholar] [CrossRef]
  62. Hiironen, J.; Niukkanen, K. Land Consolidation and Its Effect on Climate. Climate Change and Environment; FIG Working Week: Rome, Italy, 2012. [Google Scholar]
  63. Gečaitė, D.; Jankava, A. Environmental Impact of Land Consolidation. 2017. Available online: https://llufb.llu.lv/Raksti/Journal_Baltic_Surveying/2017/Journal_Baltic_SurveyingVol6_2017-38-44.pdf (accessed on 6 October 2022).
  64. Dudzińska, M.; Kocur-Bera, K. Land consolidation as the driving force behind ecological and economic development of rural areas. In Proceedings of the 9th International Conference “Environmental Engineering”, Vilnius, Lithuania, 22–23 May 2014. [Google Scholar]
  65. Lacour, S.; Burgun, C.; Perilhon, C.; Descombes, G.; Doyen, V. A model to assess tractor operational efficiency from bench test data. J. Terramechanics 2014, 54, 1–18. [Google Scholar] [CrossRef]
  66. He, P.; Li, J.; Fang, E.; de Voil, P.; Cao, G. Reducing agricultural fuel consumption by minimizing inefficiencies. J. Clean. Prod. 2019, 236, 117619. [Google Scholar] [CrossRef]
  67. Hiironen, J.; Niukkanen, K. On the structural development of arable land in Finland—How costly will it be for the climate. Land Use Policy 2014, 36, 192–198. [Google Scholar] [CrossRef]
  68. Wu, Y.; Zhou, Y.; Guo, Y.; Wang, L. The energy emission computing of land consolidation from the dual perspectives clustering method. Clust. Comput. 2017, 20, 979–987. [Google Scholar] [CrossRef]
Figure 1. Map of the study areas.
Land 12 00507 g001
Figure 2. Changes in the layout of the transport network in the study areas (before and after LC).
Land 12 00507 g002
Figure 3. Changes in the carbon footprint values in individual enterprises after land consolidation (Fatih Neighborhood).
Land 12 00507 g003
Figure 4. Changes in the carbon footprint values in individual enterprises after land consolidation (Selimiye Neighborhood).
Land 12 00507 g004
Figure 5. Changes in the carbon footprint values on individual farms as a result of land consolidation (Fatih Neighborhood).
Land 12 00507 g005
Figure 6. Changes in the carbon footprint values on individual farms as a result of land consolidation (Selimiye Neighborhood).
Land 12 00507 g006
Figure 7. Changes in carbon footprint according to enterprise areas before and after LC (Fatih Neighborhood).
Land 12 00507 g007
Figure 8. Changes in carbon footprint according to enterprise areas before and after LC (Selimiye Neighborhood).
Land 12 00507 g008
Figure 9. In the Fatih Neighborhood: (a) routes followed by the enterprises with number 55 and number 156 to reach the field parcels before land consolidation; (b) route followed by the same enterprises to reach the field parcels after land consolidation.
Land 12 00507 g009
Figure 10. In the Selimiye Neighborhood: (a) routes followed by the enterprises with number 61 and number 89 to reach the field parcels before land consolidation; (b) route followed by the same enterprises to reach the field parcels after land consolidation.
Land 12 00507 g010
Table 1. Information on the study area.
Selimiye NeighborhoodFatih Neighborhood
Size of the Project Area (ha)835.66289.08
Number of Enterprises283149
Number of Parcels before LC383137
Number of Parcels after LC292122
Consolidation Rate (%)0.240.11
Table 2. Fuel conversion factors [59].
Fuel TypeConversion Factor (TJ/kt)
Gasoline44.30
Diesel Fuel (Diesel)43.00
Fuel Oil40.4
LPG47.3
Natural gas48.0
Table 3. The fuel carbon emission factors [60].
Fuel TypeCarbon Emission Factor (t C/TJ)
Gasoline18.9
Diesel Fuel (Diesel)20.2
Fuel Oil21.2
LPG17.2
Natural gas15.3
Disclaimer/Publisher’s Note: The statements, opinions and data contained in all publications are solely those of the individual author(s) and contributor(s) and not of MDPI and/or the editor(s). MDPI and/or the editor(s) disclaim responsibility for any injury to people or property resulting from any ideas, methods, instructions or products referred to in the content.

