
Green Space Ecosystem Services and Value Evaluation of Three-Dimensional Roads for Sustainable Cities


Graduate School of Urban Studies, Hanyang University, 222 Wangsimni-ro, Seongdong-gu, Seoul 04763, Republic of Korea
*
Author to whom correspondence should be addressed.
Land 2023, 12(2), 505; https://doi.org/10.3390/land12020505
Submission received: 1 February 2023
/
Revised: 12 February 2023
/
Accepted: 15 February 2023
/
Published: 17 February 2023
(This article belongs to the Special Issue Advancing Sustainability and Ecosystem Services through Urban Green Infrastructure II)
Abstract
:The provision of green space as a result of three-dimensional roads plays a crucial role in maintaining the sustainability of the urban ecosystem. It does so by solving environmental problems and offering various ecosystem services to city residents. This study focuses on the park section of an expressway located between Bundang and Suseo in Seongnam city, South Korea, and quantifies the improvement in air quality and ecological value following the transformation of the road into green infrastructure. The goal is to determine the feasibility of sustainable green infrastructure for roads. The new park area on the road is approximately 83,000 sq. meters and there are approximately 3349 trees planted in the park. These trees can store 77.68 metric tons of carbon annually, isolate 13.21 metric tons of total carbon, remove 70.446 kg of air pollutants, avoid 112.8 cubic meters of emissions, and mitigate 31,983.90 cubic feet of emissions. The resulting economic value is approximately 874,494 dollars. Road green infrastructure conversion can be a useful solution to respond to environmental problems. To promote decision-making when developing policies, a process of pre-verification with quantified data of ecosystem services (example: air quality benefits, etc.) of trees using the i-Tree Eco program is required. In the execution stage, it is possible to understand the structure, function, and value of green spaces and prepare guidelines for tree selection, design alternatives, and evaluation as one of the management strategies for green spaces to improve the value of ecosystem services.
1. Introduction
Recently, a new urban environmental theory based on the concept of sustainable development has emerged, and in the field of urban planning and design, concepts such as green urban planning, environmentally friendly architecture, and sustainable transportation planning are being used [1,2,3].
Sustainable development of the international community has been fully implemented since the adoption of “Agenda 21” at the United Nations Conference on Environment and Development (Rio Conference) in 1992 [4], and in Korea, the “K-SDGs” were presented after the declaration of the “New Century National Environmental Vision” in 2000, and various fields have established strategies to implement greenhouse gas reduction and carbon neutrality to respond to the climate crisis [5].
According to the 2019 World Air Quality Report, published by AirVisual, a global air pollution research institute [6], Korea ranked first in the concentration of ultrafine dust pollution among member countries of the Organization for Economic Cooperation and Development (OECD). Coal power generation and the use of fossil fuels (oil) in transportation have been pointed out as the main causes of fine dust in Korea. According to the 2019 oil consumption trends compiled by the Korea National Oil Corporation, the total consumption of domestic petroleum products increased by 20% compared to 10 years ago. In particular, gasoline and diesel consumption increased as the number of registered cars increased [7].
This is because Korea has developed cities and roads from the perspective of vehicles moving in the city, rather than people living in the city, as a result of rapid economic growth. Roads within a city are a major urban infrastructure responsible for the movement of people and logistics, occupying about 20–30% of the city’s built-up area. While roads are essential infrastructure for people to live in the city, they also cause various problems such as the disruption of residential areas, traffic accidents, noise, air pollution, etc. [8].
Sustainable road infrastructure means urban roads that meet current and future transport needs while achieving financial, environmental, and social well-being [9,10,11].
In order to respond to sustainable road infrastructure, the government in Korea recently announced the “Activation of Future-Oriented Urban Construction through Three-Dimensional Utilization of Road Space” policy in February 2017 [12], and in January 2022, as part of the Second Expressway Construction Plan, proposed three-dimensional utilization of roads, such as expanding underground tunnels in some sections of the Kyeongin, Kyeongbu, and Capital Area’s First Circulation expressways, to improve the congested sections of the roads [13].
Similarly, three-dimensional utilization of road and rail facilities is actively being reviewed as a solution to urban problems, and existing transportation facilities are being relocated underground while parks are being planned on the surface [14].
In Seoul, the underground thoroughfare projects are underway on the major routes, such as the Dongbu and Seobu main roads, and discussions are taking place for underground way and upper park construction projects for the Gyeongbu Expressway [12].
Large-scale transportation infrastructure can be a great resource that can revitalize the city in situations where there is no longer available land in the city [15].
The world’s first park built on a highway, Seattle Freeway Park [16], and the regeneration case of transportation infrastructure, the Boston Big Dig Project [17], are mentioned as excellent cases for the regeneration of transportation infrastructure in Korea, and these cases are all creating new parks and green spaces in city areas facing problems such as division, noise, pollution, artificial urban landscapes, and declining quality of life caused by highways, connecting disconnected communities and creating environmental and social–cultural benefits.
Replacing transit space with parks, plazas, and other public spaces is an opportunity to improve local environmental and social benefits and promote urban regeneration [18].
Most studies of parks built on or above transportation infrastructure have been conducted from an economic impact perspective [19,20].
Tajima (2003) estimated the economic benefits of proximity to parks using a hedonic pricing model when highways were transformed into parks by the Boston Big Dig project [18].
In addition, in terms of sustainable development, Hyejoo Lee and Lyun Suh (2014) studied governance, culturalization of industrial heritage, multisensory utilization through mixed-use development, and economic effects based on the sustainable development theory of the High Line Park [21]. Chen-Xiao Ma and Fang-Le Peng (2021) studied nine sustainability-oriented benefits (time saving, traffic accident risk reduction, air and noise pollution reduction, urban barrier effect prevention, etc.) along with monetary evaluation of underground roads [22].
Now underway in Korea is the construction of green infrastructure in the context of utilizing the ground and three-dimensionalizing (undergrounding) the primary transportation network, which through road composite development is related to the establishment of green infrastructure at the urban level.
Green infrastructure refers to the concept of creating a network of physical green spaces and continuous utilization of urban recreation functions, along with human benefits from the natural ecosystem services, providing solutions to urban social issues [23].
In particular, the use of road upper and lower levels for large-scale greenways and parks that revitalize the city should be a major context for the development direction [8].
Green infrastructure offers various benefits [24], including contribution to the ecological network through biodiversity and habitat protection, along with improvement of environmental quality and ecological functions for adapting to and mitigating climate change [25].
Lovell et al. (2013) suggest plant biodiversity, food production, microclimate control, soil infiltration, carbon sequestration, visual quality, recreation, and social capital as specific ecosystem services that may be relevant in assessing urban green spaces [26]. Andersson et al. (2014) analyzed the city as a socioecological system and synthesized the literature, highlighting the importance and complexity of managing biodiversity and ecosystem services in cities, and the planning and governance of urban green infrastructure [27].
Since the launch of the UN Millennium Ecosystem Assessment Project, numerous scholars have conducted extensive research on ecosystem services and values. Among them, evaluation techniques and quantification studies from various perspectives on ecosystem services and values provide objective data [28,29,30,31,32,33].
Langemeyer et al. (2018) reviewed the value of ecosystem services from the environmental management aspect of the city and emphasized the importance of social and institutional garden characteristics as an activator of ES values [28]. Cortinovis et al. (2018) investigated the extent to which ecosystem services are included in urban planning, examining what factors activate them in urban planning and trying to understand what is still needed to improve planning decisions [29].
In a study quantifying ecosystem services and values, Lyu et al. (2018) suggest that examining the impact of rapid urbanization on ES and its relationship can provide scientifically based suggestions for the protection of ecosystem services, sustainable urban development, and urban planning based on human well-being [31]. Kim et al. (2015), Vahidi et al. (2022), and Raum et al. (2022) used the i-Tree Eco model, co-produced by the U.S. Forest Service, to study the extent to which green infrastructure, such as urban forests, vegetation ecosystems, and urban green spaces, contributes to improving the environment and ecosystem [31,32,33].
In the past, researchers have studied the use of urban vegetation as one strategy among many to reduce the impact of poor air quality [34].
According to some studies, increasing vegetation in public and private spaces can have a significant impact on air pollution [35].
The aim of this study is to verify the possibility of new green infrastructure for sustainable cities through road greening, a means of creating new green spaces for sustainable cities, by quantifying the ecosystem services provided by green spaces such as removal of air pollutants, carbon storage and isolation, leak prevention, oxygen generation, and economic value. Moreover, the study aims to provide an efficient guideline for green space creation in the policy decision-making stage of urban regeneration and planning by predicting the effects of upper parkification of in-city three-dimensional roads (transformation of green infrastructure into green infrastructure) on solving urban problems and improving quality of life.
2. Materials and Methods
2.1. Study Area
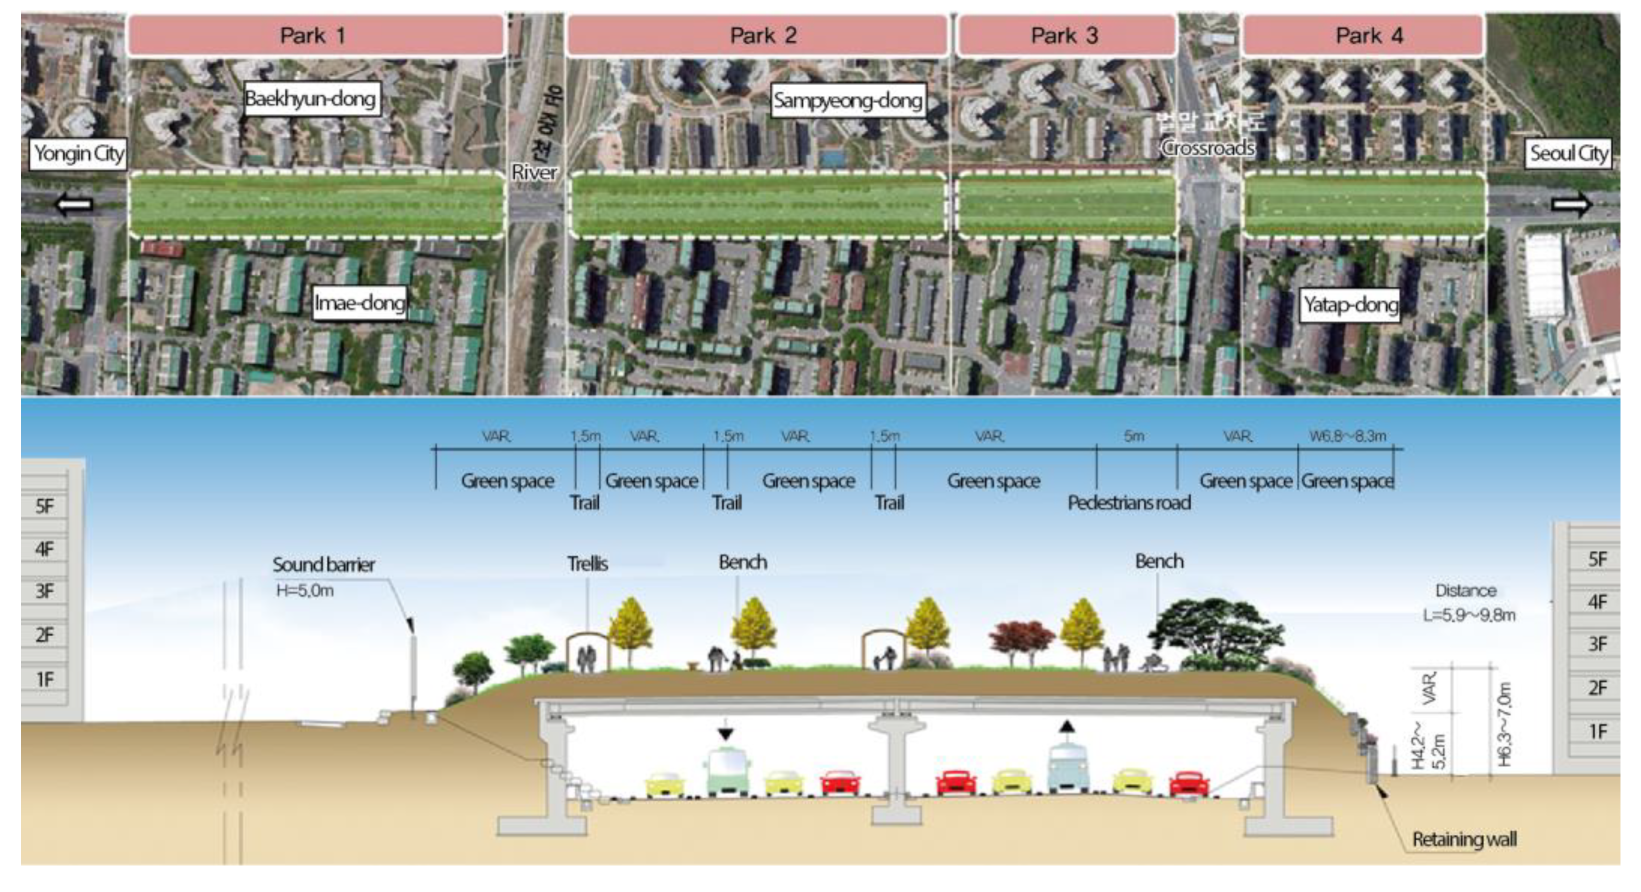
The monitoring area of this study is a section of the Bundang–Suseo road in Seongnam city, Gyeonggi-do (total length 25.34 km) that passes through Bundang-gu and Seongnam-si, some of which will be converted to an underground road due to noise damage from the surrounding area (to be completed in June 2023) through a road revitalization project initiated by a proposal from residents; it has value as a pioneering example of restoring the existing road into a three-dimensional road by making the upper part a park (Figure 1).
By installing noise-reducing facilities on the existing road and making the road three-dimensional, we aim to solve environmental problems such as traffic noise, dust, and exhaust fumes, connect the fragmented east–west green space through the upper park, create a comfortable living environment, and create new regional activation spaces through active use and participation of local residents.
This road is for exclusive use of cars, and residential and green spaces are located on both sides of the road; additionally, a stream crosses the road. The location of the measuring site, Imae-dong, is at 37.39 latitude and 127.13 longitude, with a population of 38,386 and an area of 10.75 ac. The highest monthly temperature is 29 °C and the average annual precipitation is 1300 mm (data.kma.go.kr, accessed on 18 December 2022).
The Bundang–Suseo Expressway, which connects the research site at Bundang with Pangyo New City, has been a place where residents’ complaints about traffic noise, dust, and exhaust gas have not stopped.
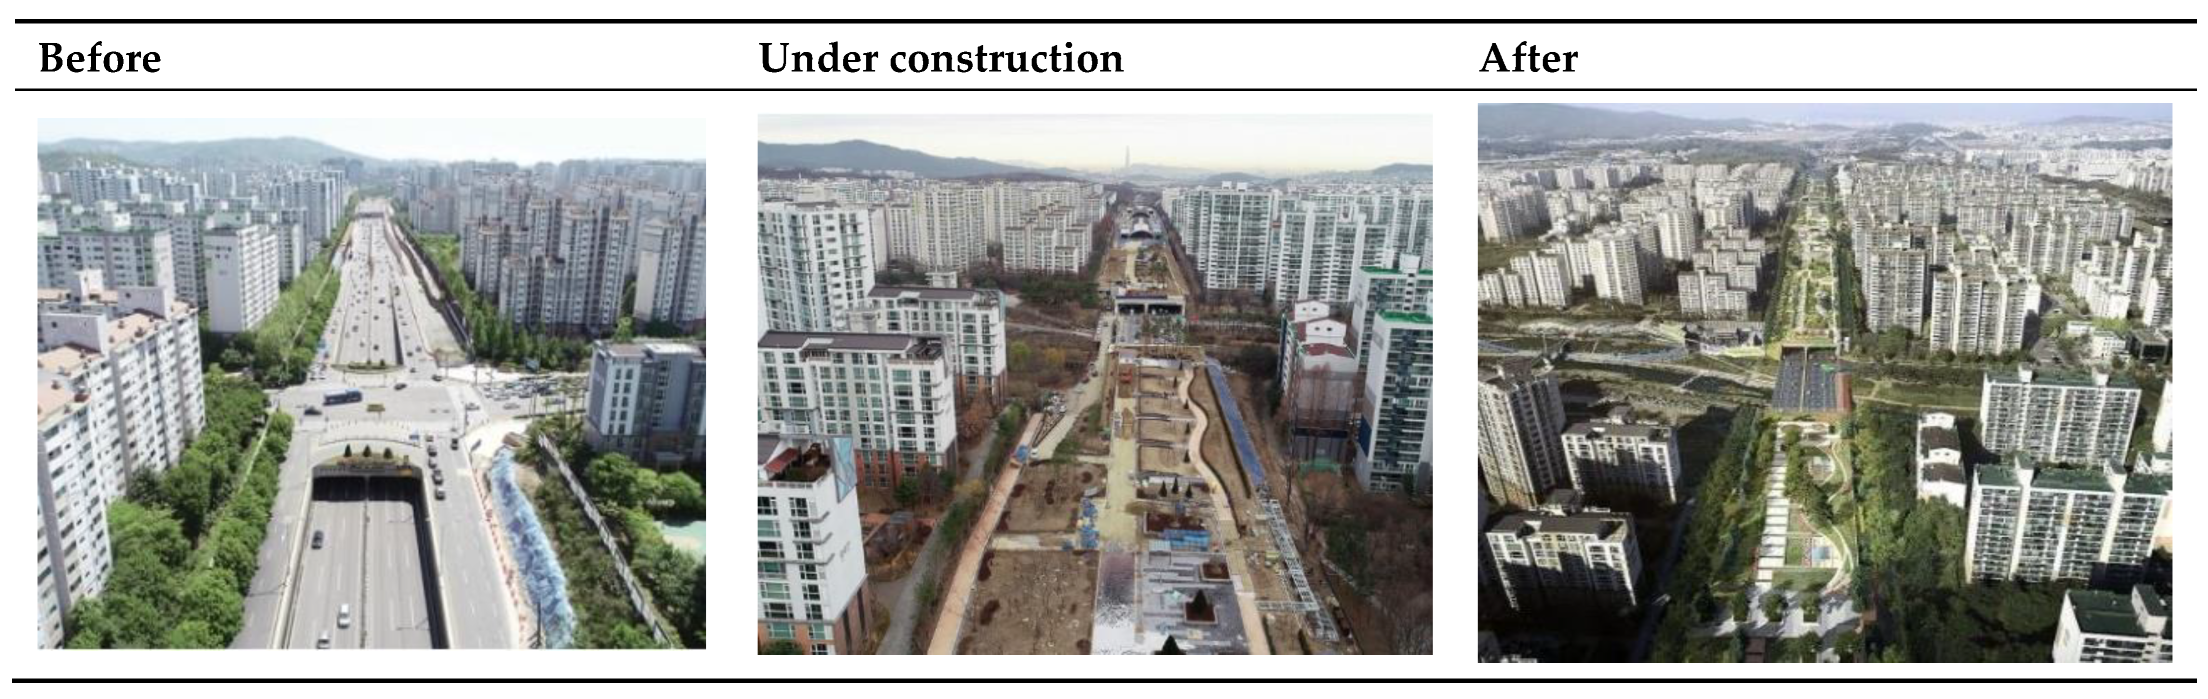
To solve these problems, a ground tunnel was installed to perfectly block road noise, and a natural urban park was created on an 83,000 m2 (L = 1.59 km) section by soil paving the top of the tunnel (Figure 2).
The goal of creating parks is to improve the greenery rate of the city through the three-dimensional recording of the gray concrete space above the Bundang–Suseo urban expressway, and to provide a healthy recreation environment through the creation of rich green spaces and open spaces.
According to the planting plan, the upper structure section was ensured to have a growing substrate more than the soil and introduced species of trees that have high viability and relatively smaller root size that does not interfere with growth, and exhibit high air purification ability and carbon absorption rate.
The standard for planting was to reduce interference with adjacent trees by considering the width of the main stem of the trees when planting large trees and applying a basic module of space, with the horizontal trees planted at 8 m intervals as the planting unit. For small trees, the planting spacing was based on the ecological characteristics of the species and set at 3 to 4 m, but adjusted appropriately according to the planting area. Shrubs and flowering trees were planted in groups to enhance the sense of greenery in the space.
2.2. i-Tree Eco V6 Modeling and Analysis
In this study, i-Tree Eco (www.itreetools.org, accessed on 18 December 2022) was used to evaluate the ecosystem services and values that can be predicted through the creation of upper parks.
i-Tree Eco is an open-access software tool developed by the U.S. Forest Service (USFS).
i-Tree Eco uses local time-specific air pollution and weather data, along with field-collected sample or inventory data, to evaluate ecosystem services such as tree species-specific structure characteristics, carbon sequestration and stock, removal of air pollutants, oxygen emission, hydrological effects, etc. [36].
The results of the i-Tree Eco model are used to understand urban green structure and ecosystem services and values, and can help with formulating urban green policies, planning, and management [37].
Air pollution removal estimates are derived from calculated hourly tree-canopy resistance for ozone along with sulfur and nitrogen dioxides based on a hybrid of the big-leaf and multilayer canopy deposition models [38,39]. Recent updates (2011) to air quality models are based on improved leaf area index simulations, weather and pollution processing and interpolation, and updated pollutant monetary data [40,41]. National median externality costs are used to calculate the value of carbon monoxide removal and particulate matter less than 10 microns and greater than 2.5 microns [42].
2.3. Data Collection and Analysis
This model was used to evaluate the ecological services and environmental value, including the reduction in air pollution caused by trees and urban green spaces, in an 83,000 m2 park construction area located on the upper section of the Bundang–Suseo Expressway over a one-year period.
The model applied average values of tree species, tree height, stem height, diameter at breast height (DBH), and other tree characteristics reflected in the design. Environmental data, such as local weather data and air pollution data, were collected and utilized for evaluation by using a local database.
Data such as land information, canopy coverage information, and vegetation information were collected through design documents and field surveys following the i-Tree Eco protocol, and 3349 trees were identified and measured for predicted data after the park construction.
Twelve categories of information on trees including species, total height, diameter at breast height (DBH), size of the trunk, and others were applied. All data were imported from Excel files of the i-Tree Eco model to Access files in order to further analyze and evaluate the structure of vegetation and related ecosystem services in the park section.
Air pollution data, including hourly concentrations of NO2, SO2, CO, O3, PM10, and PM2.5, were obtained from the National Fine Dust Information Center (www.air.go.kr, accessed on 18 December 2022), provided by the Ministry of Environment. Local weather data were obtained from the Open Data Portal of the Korean Meteorological Administration (data.kma.go.kr, accessed on 18 December 2022).
This study used air pollution and weather data from 2018.
3. Results
3.1. Tree Species Structure Characteristics
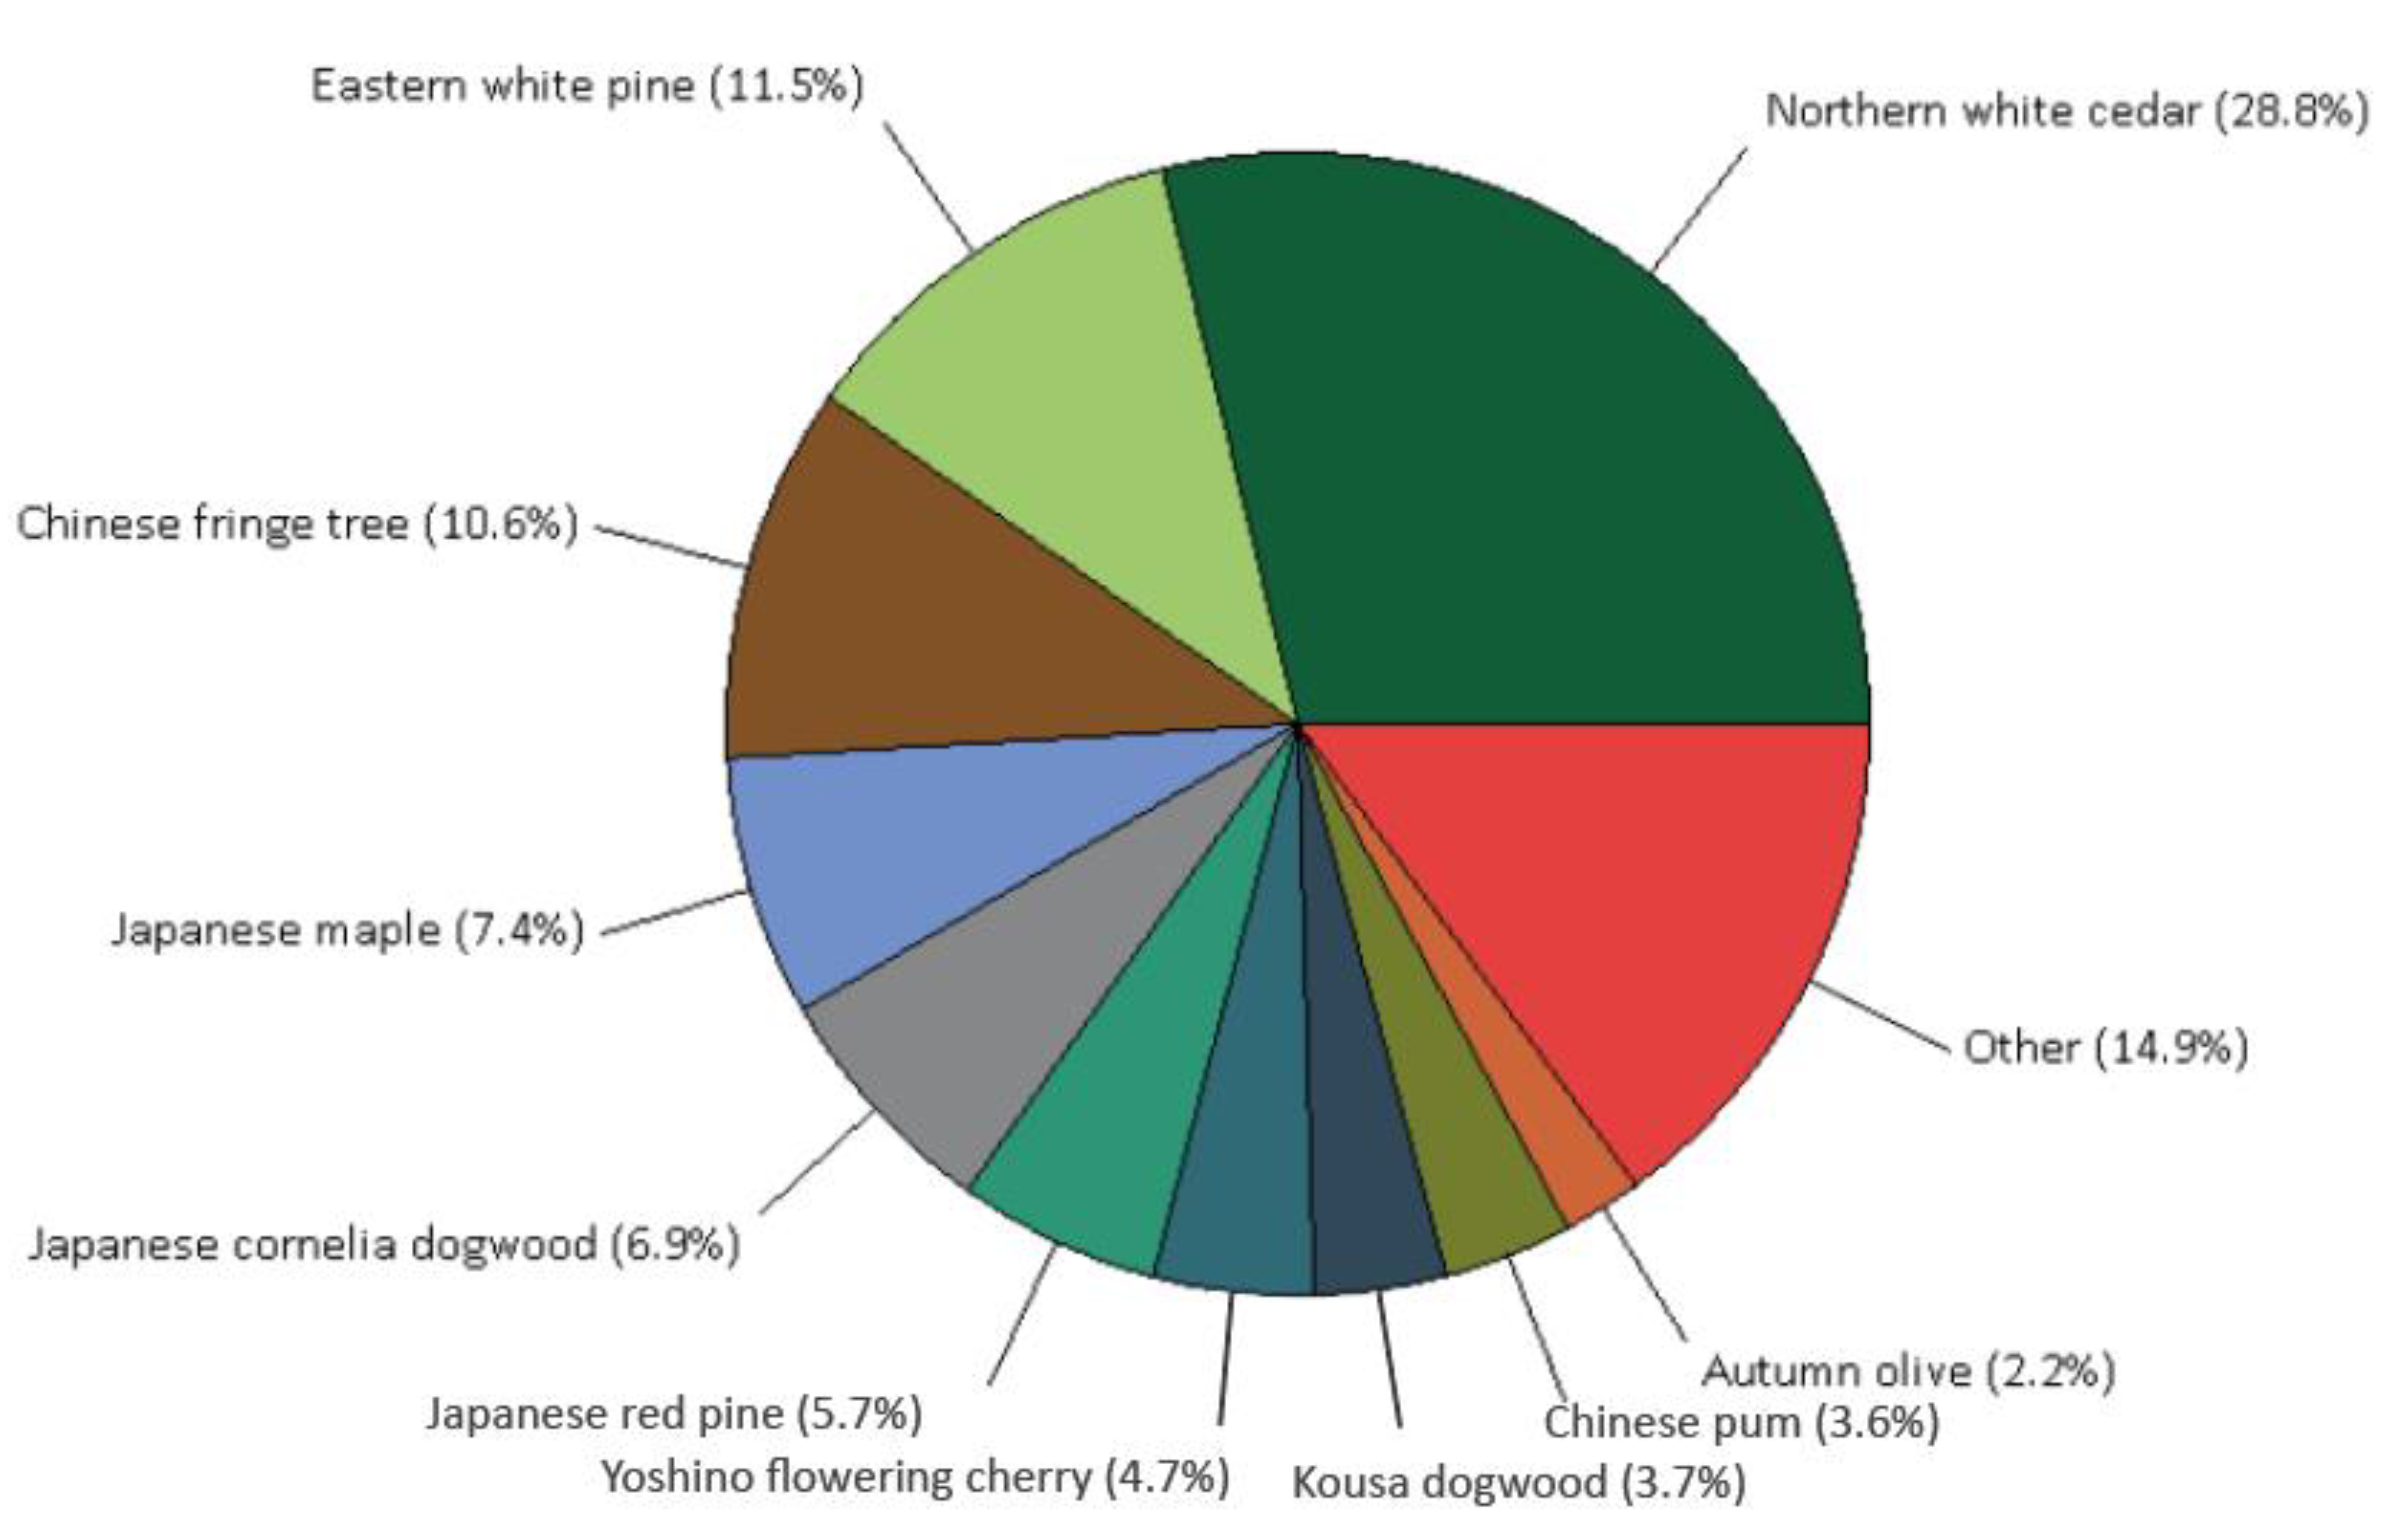
Of the 3349 trees (26 species) in the park, the 5 species with the most individuals are Northern white cedar (28.8%), Eastern white pine (11.5%), Chinese fringe tree (10.6%), Japanese maple (7.4%), and Japanese cornelia dogwood (6.9%), accounting for 65.2% of the total (Figure 3). According to the recommended species of the Forest Service, they are variously included in the categories of timber species, ornamental species, and specialized species.
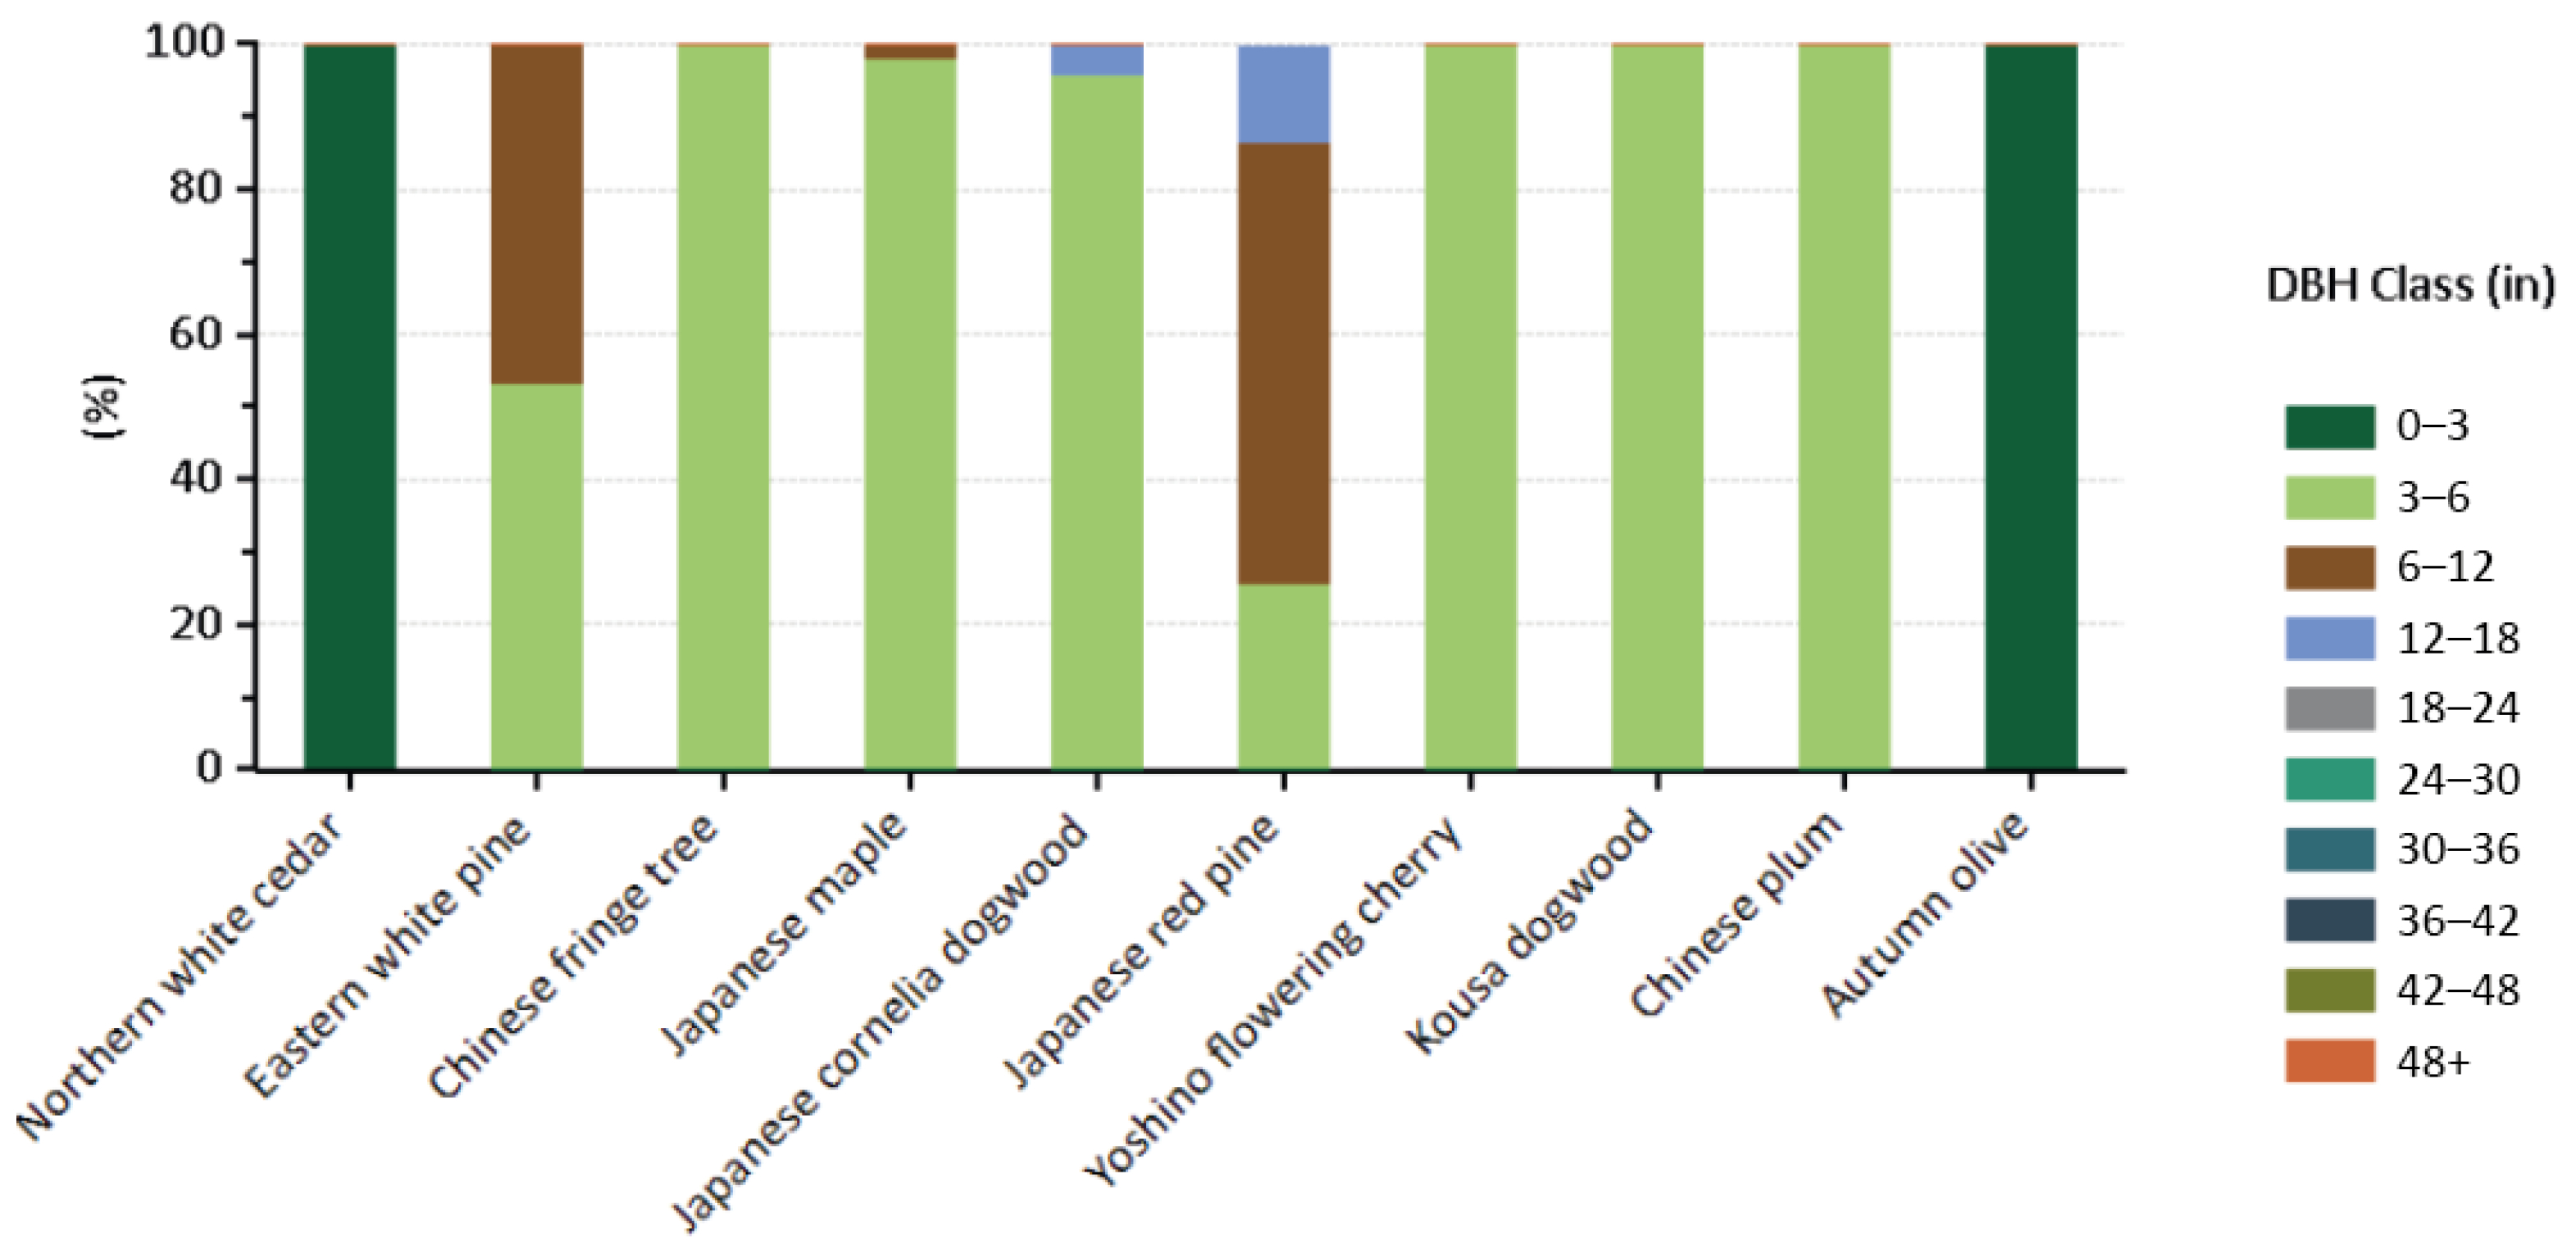
The DBH for the top 10 most commonly planted trees in the project area ranges from 3 to 18 inches, with the greatest distribution in the range 3 to 6 inches (Figure 4).
The degree of air purification by trees is directly proportional to the healthy leaf area of the plant [43]. The trees in the upper park of Bundang–Suseo are planted along the road with a density of 770 trees per 1 ha (10,000 m2)(Table 1), providing 24,325.7 m2 of leaf area Of these, the top five species in terms of leaf area are Japanese red pine (5422.8 m2), Chinese fringe tree (4394.9 m2), Eastern white pine (3023.0 m2), Japanese maple (1813.0 m2), and Northern white cedar (1428.5 m2), but they do not necessarily match the order of number of individuals based on the leaf biomass (Leaf Biomass) per individual species(Table A1).
The Importance Value (IV) is calculated from the percentage of individuals and the percentage of leaf area, and a higher value means that the species dominates the structure of trees in the park. The five species with the highest IV are Northern white cedar (34.7), Chinese fringe tree (28.7), Japanese red pine (28.0), Eastern white pine (23.9), and Japanese maple (14.8). Northern white cedar is the most widely distributed species in the park (28.8%) and also has the highest IV value (34.7), but its Leaf Biomass is relatively low at 0.303 t. On the other hand, Japanese red pine has a relatively low distribution (5.7%) compared to Northern white cedar, but produces the most leaves per individual with a Leaf Biomass of 0.576 t, resulting in an IV value of 28.0 and the third most important species (Table A1).
3.2. Analysis of Removal of Atmospheric Pollution Substances
Urban trees can affect air quality by altering the deposition and dispersion of pollutants. Dispersion occurs as air pollutants are transported by air currents, and in the process of dilution, the presence of buildings and trees can obstruct air flow and alter the dispersion pattern in the area [44].
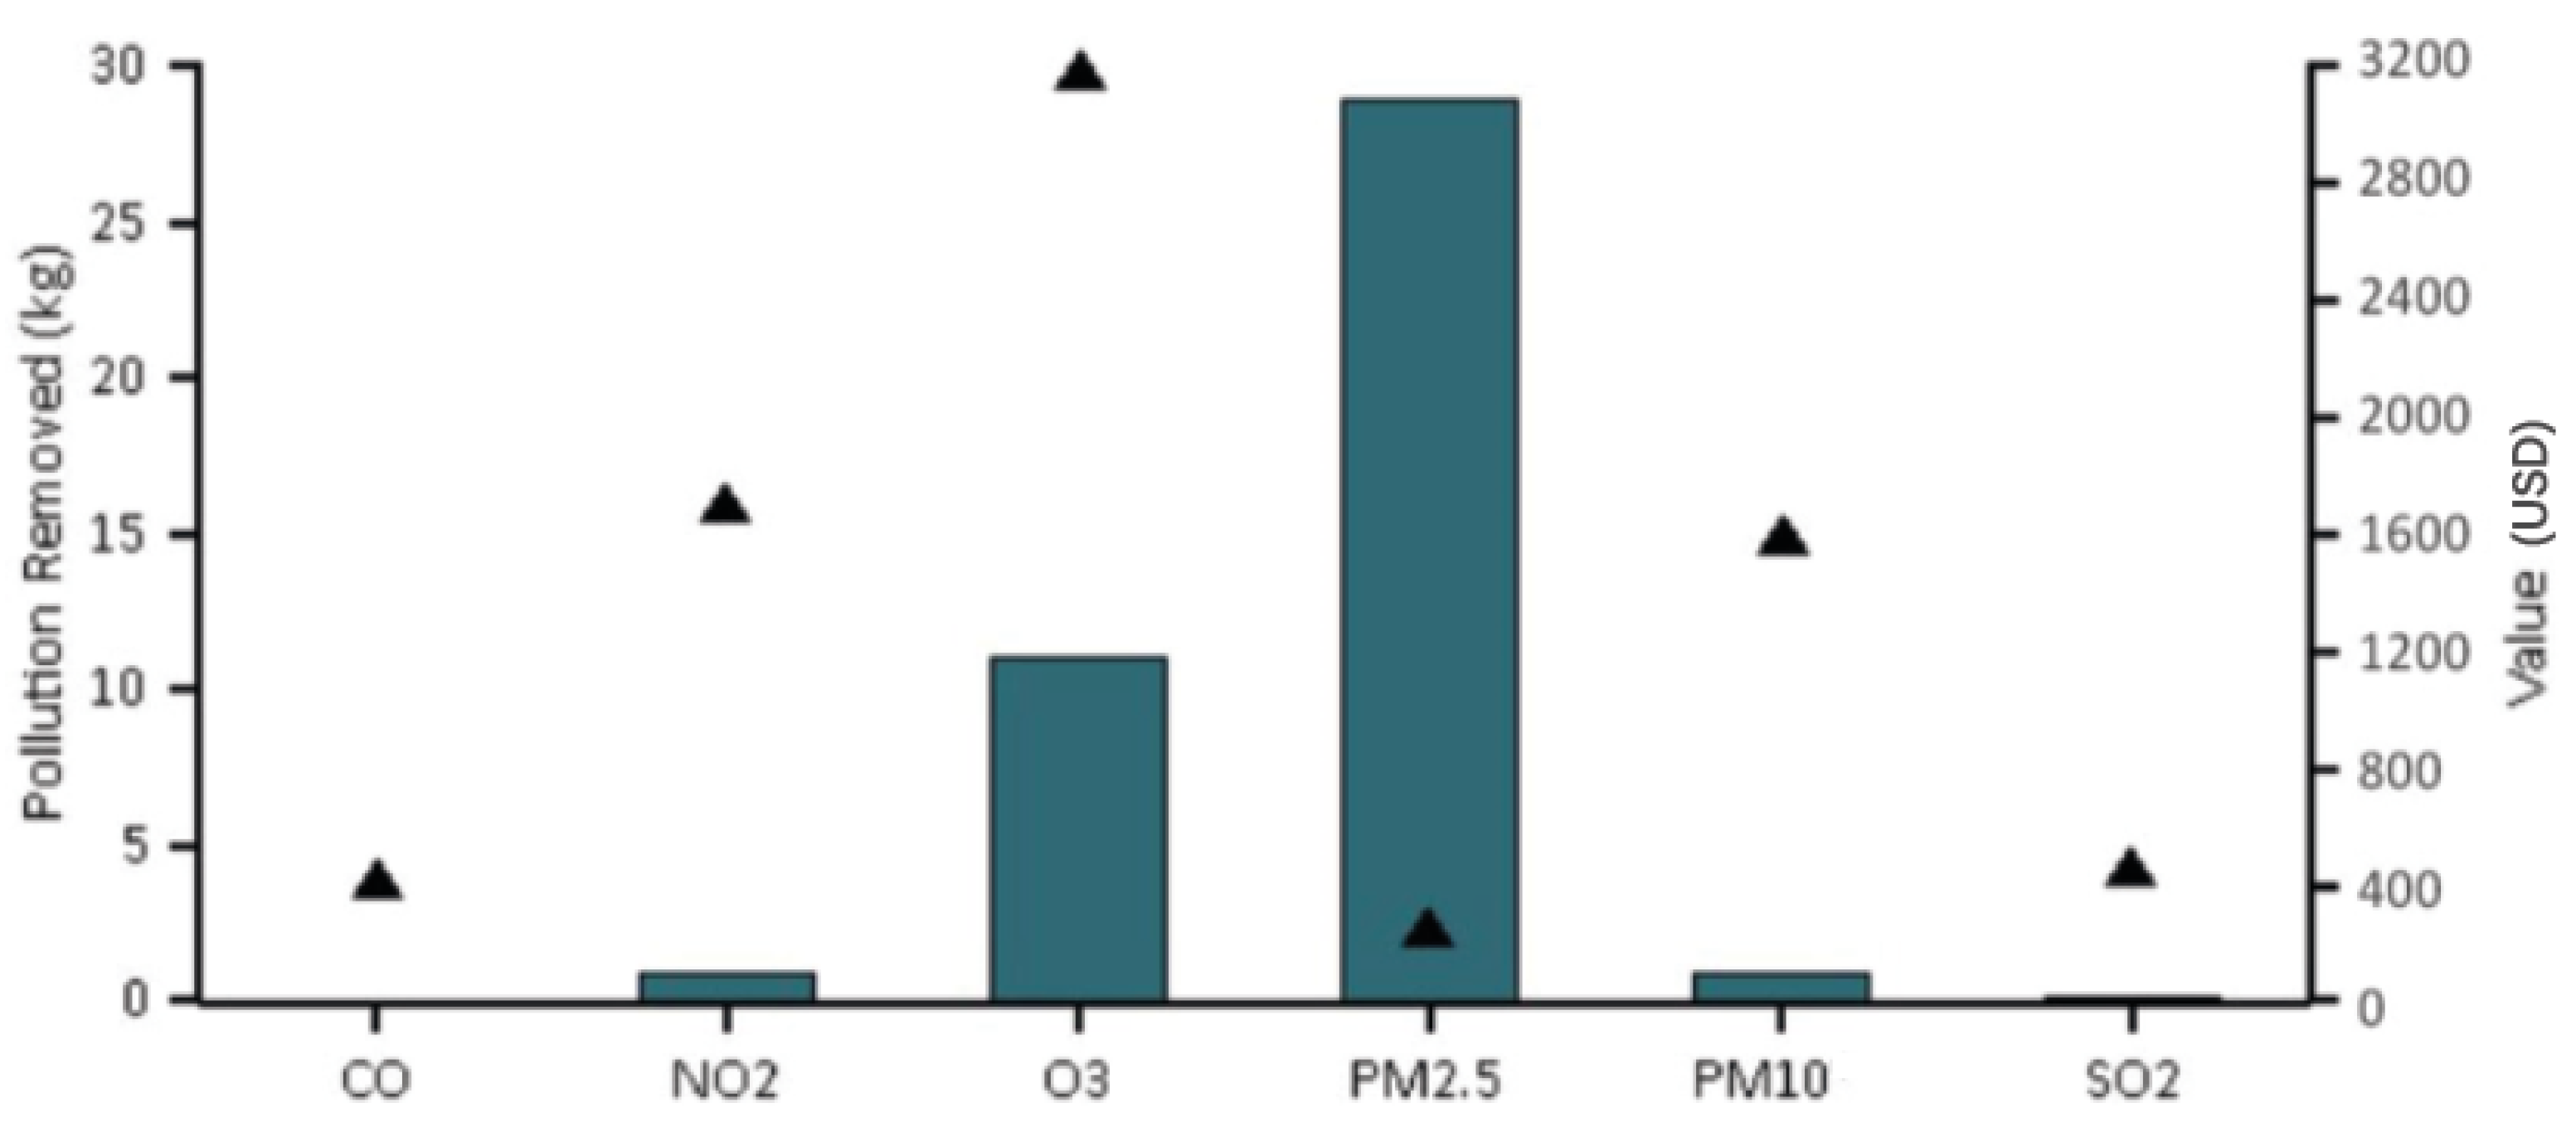
According to the i-Tree eco analysis, trees in the upper park of Bundang–Suseo can remove an average of 70.446 kg of air pollutants annually. This includes an average of 3.783 kg carbon monoxide (CO), 15.817 kg nitrogen dioxide (NO2), 29.683 kg ozone (O3), 14.757 kg PM10, 2.247 kg PM2.5, and 4.160 kg sulfur dioxide (SO2) (Table 2. When simulated, results showed that removal results in an annual economic value equivalent to USD 4521.9 and was shown to give the greatest benefit in removing fine dust and ozone (Table 2 and Figure 5).
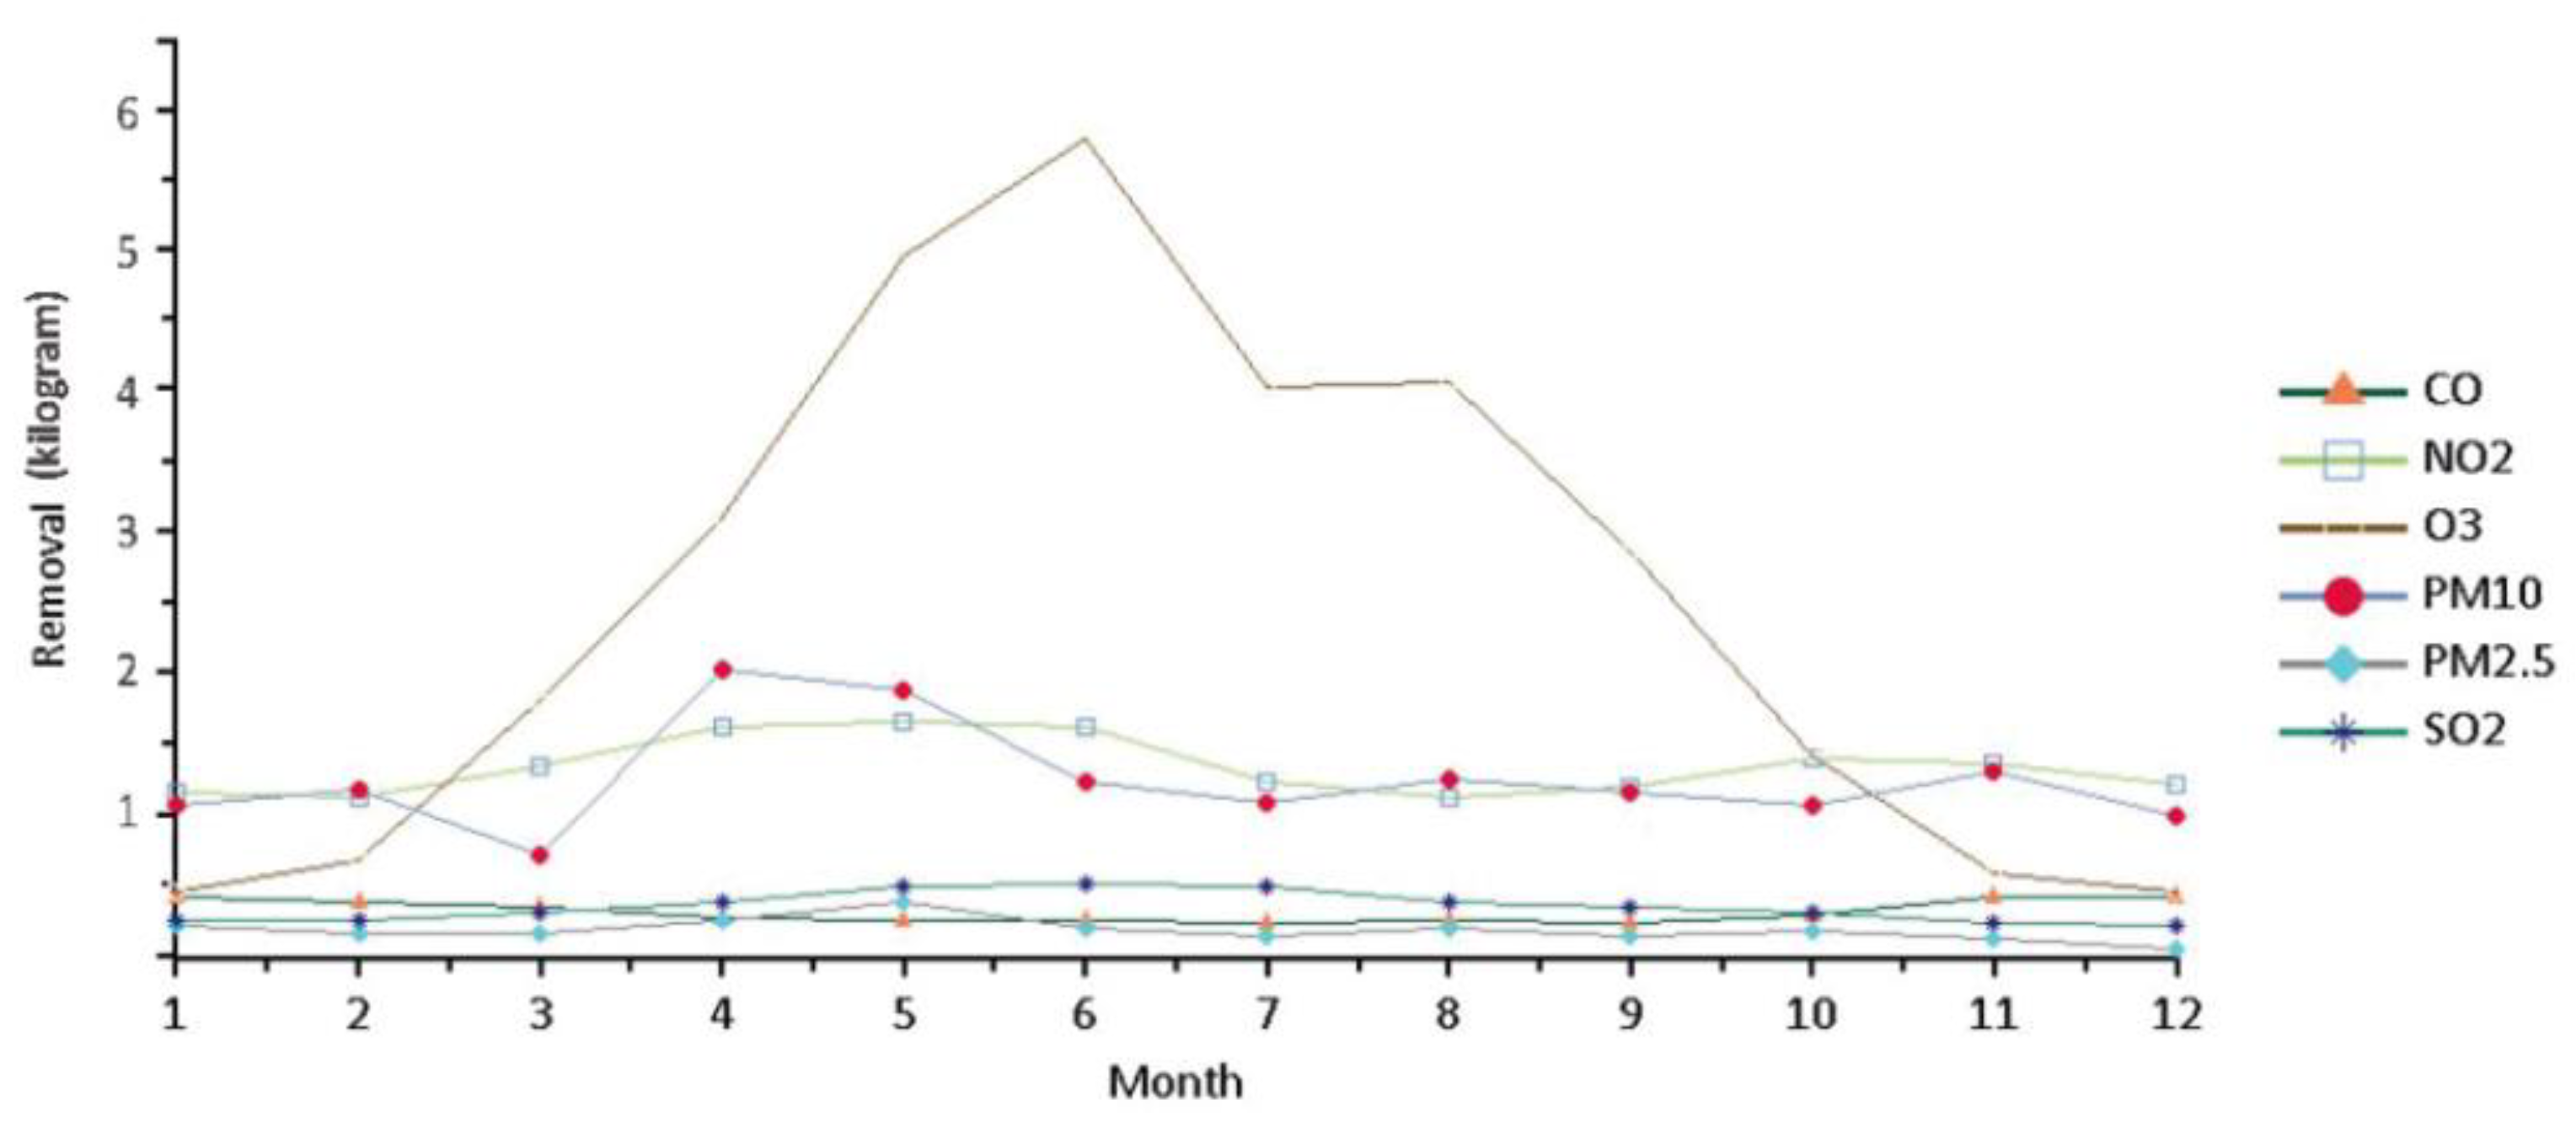
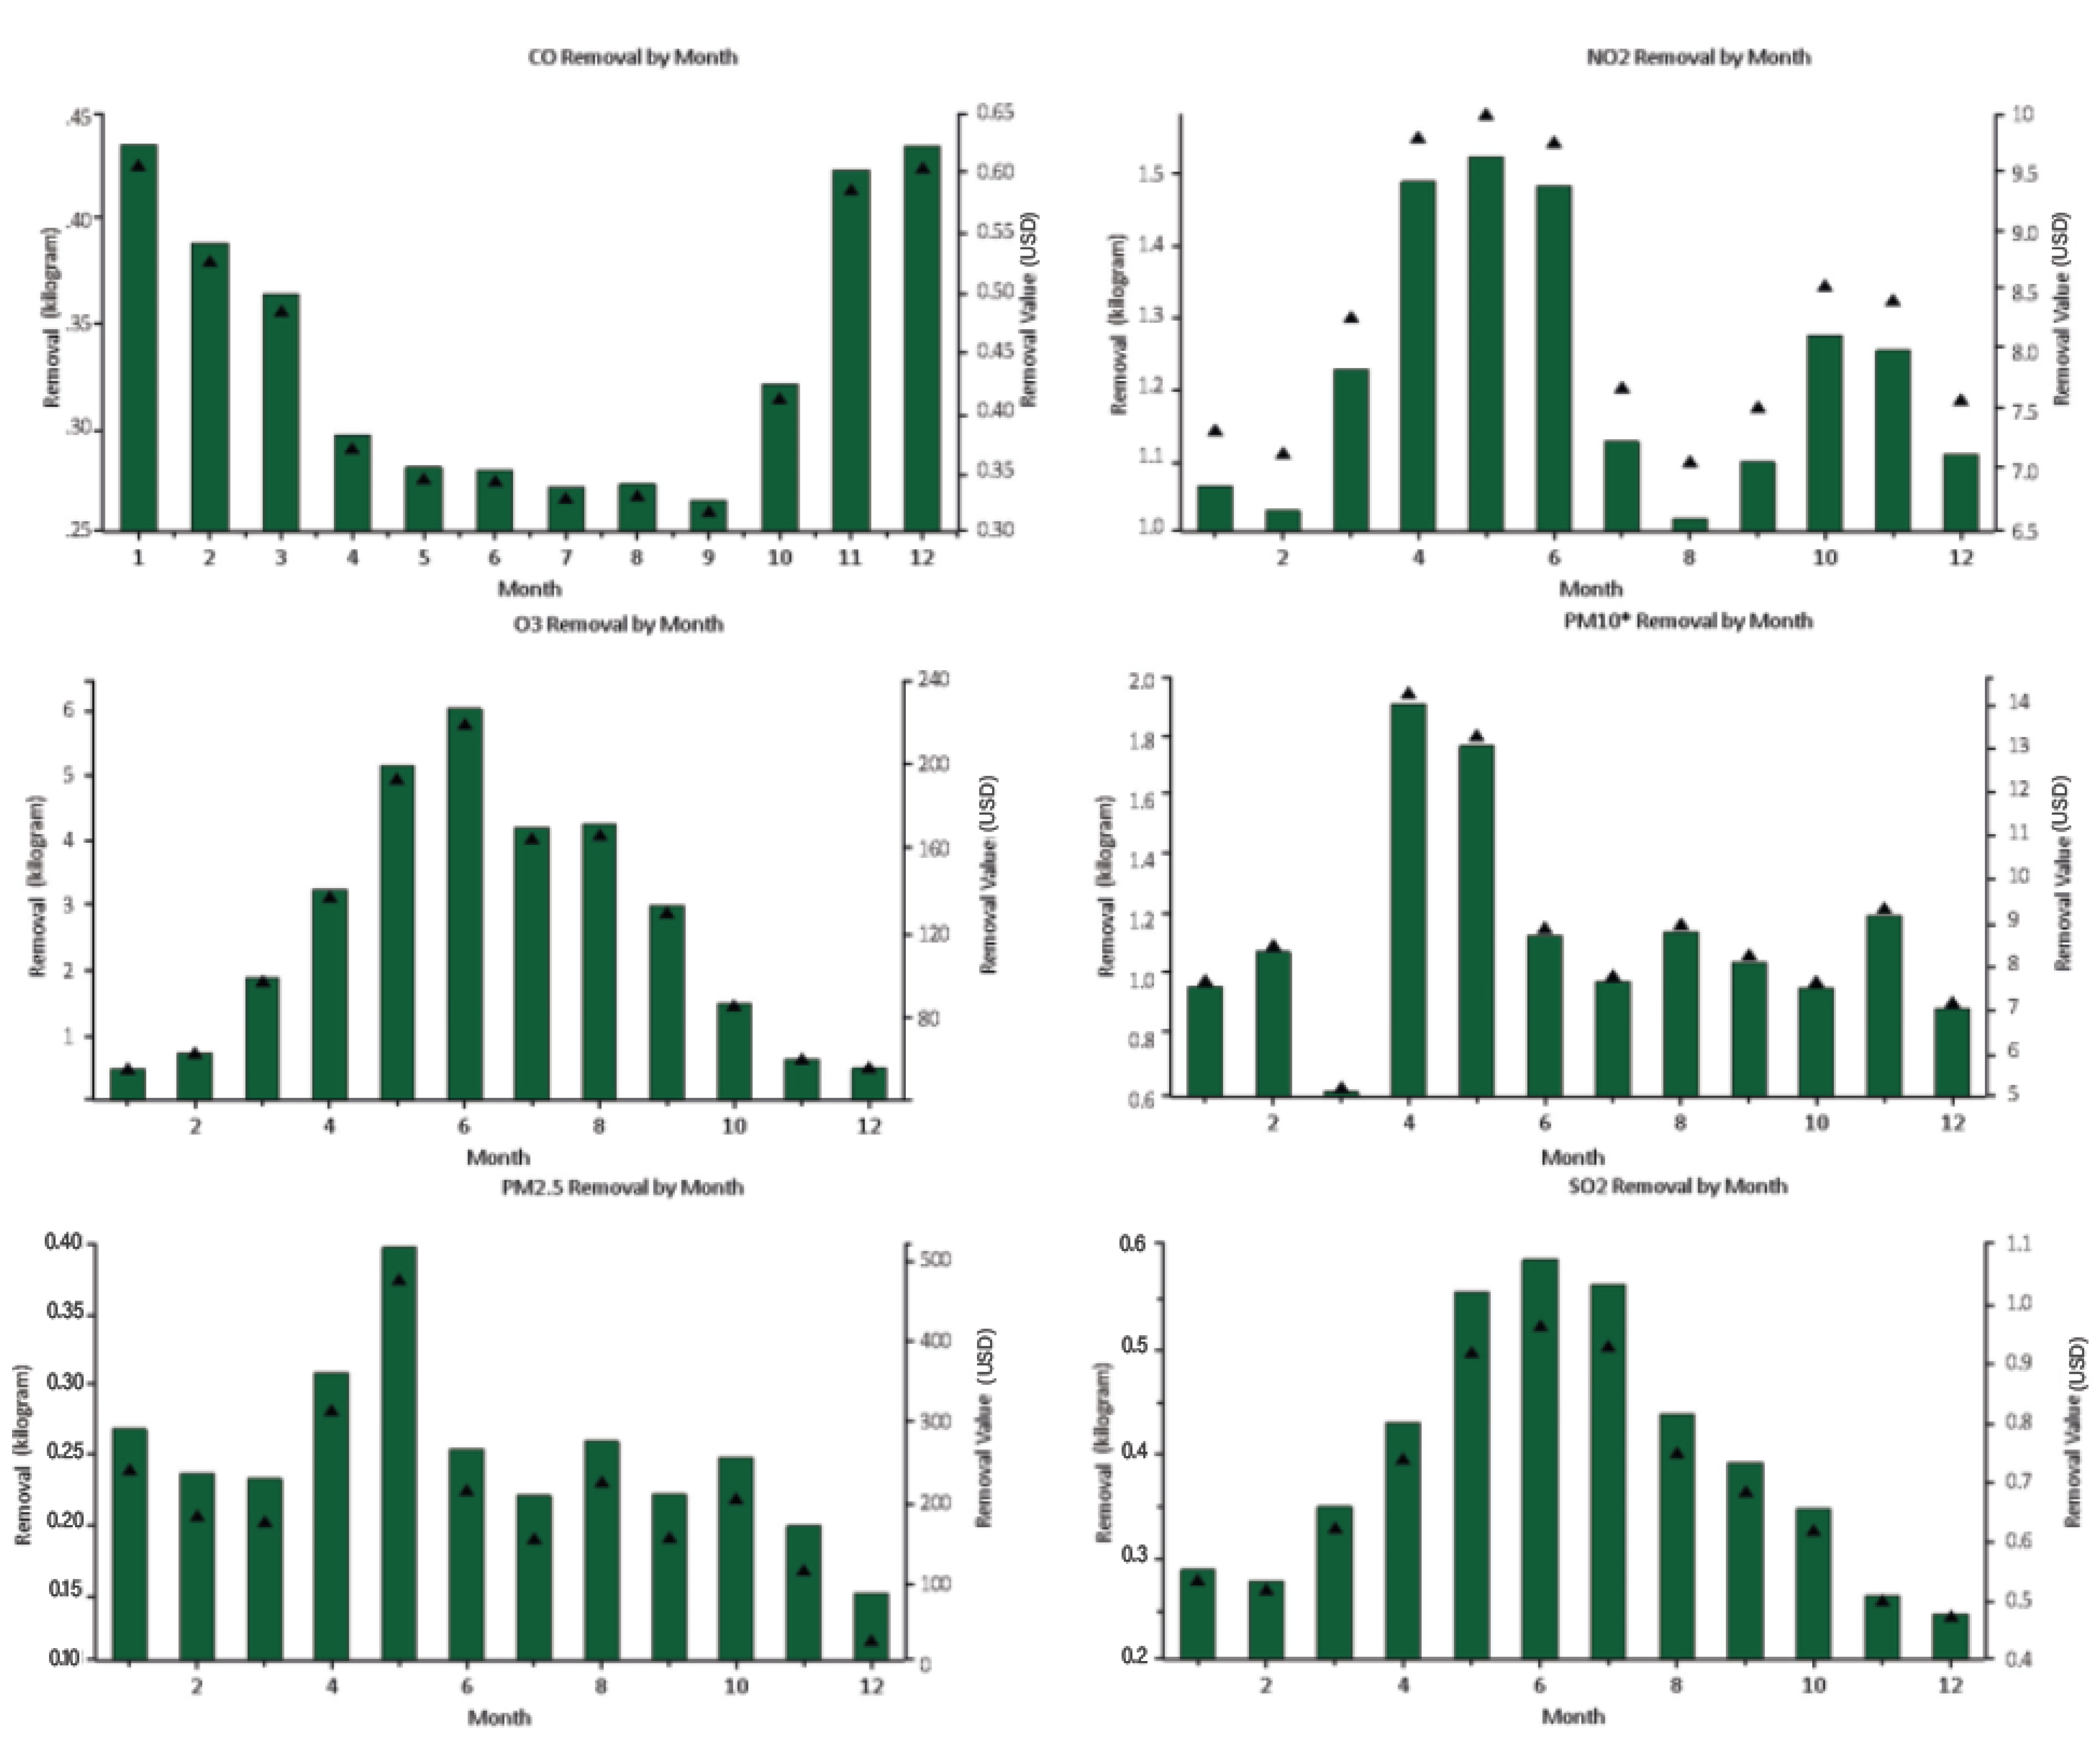
Examining monthly air pollution removal shows that the removal of ozone increases sharply with rising temperature, while fine dust and nitrogen dioxide show a slight increase in spring and early summer. However, other air pollutants did not show significant monthly variation (Figure 6 and Figure 7).
According to the statistics on air pollutant emissions provided by the National Fine Dust Information Center of the Ministry of Environment, we obtained the amount of air pollutants released from the road transport pollution source in Bundang-gu and Seongnam-si located above the upper park along the Bundang–Suseo Expressway in 2018 and calculated the reduction rate for pollutants by comparing the annual amount of pollutant removal according to the i-Tree eco simulation. In this case, ozone (O₃) was excluded as it is a secondary pollutant and difficult to estimate the emission amount.
In 2018, the annual amount of air pollutants emitted from a road traffic pollution source in Bun-dang district, Seongnam-si, was 1,233,744.2 kg of Carbon Monoxide (CO), 2,395,323.5 kg of Nitrogen Dioxide (NO₂), 46,119 kg of PM10 (fine dust), 42,429 kg of PM2.5 (ultrafine dust), and 1430 kg of Sulfur Dioxide (SO₂). Upon examining the annual reduction rate for pollutants due to the creation of an upper park, Sulfur Dioxide (SO₂) showed the greatest reduction with a rate of 0.2909%, followed by PM10 (fine dust) with a reduction rate of 0.0320%, and PM2.5 (ultrafine dust) with a rate of 0.0053% (Table 3).
3.3. Carbon and Oxygen Change Analysis
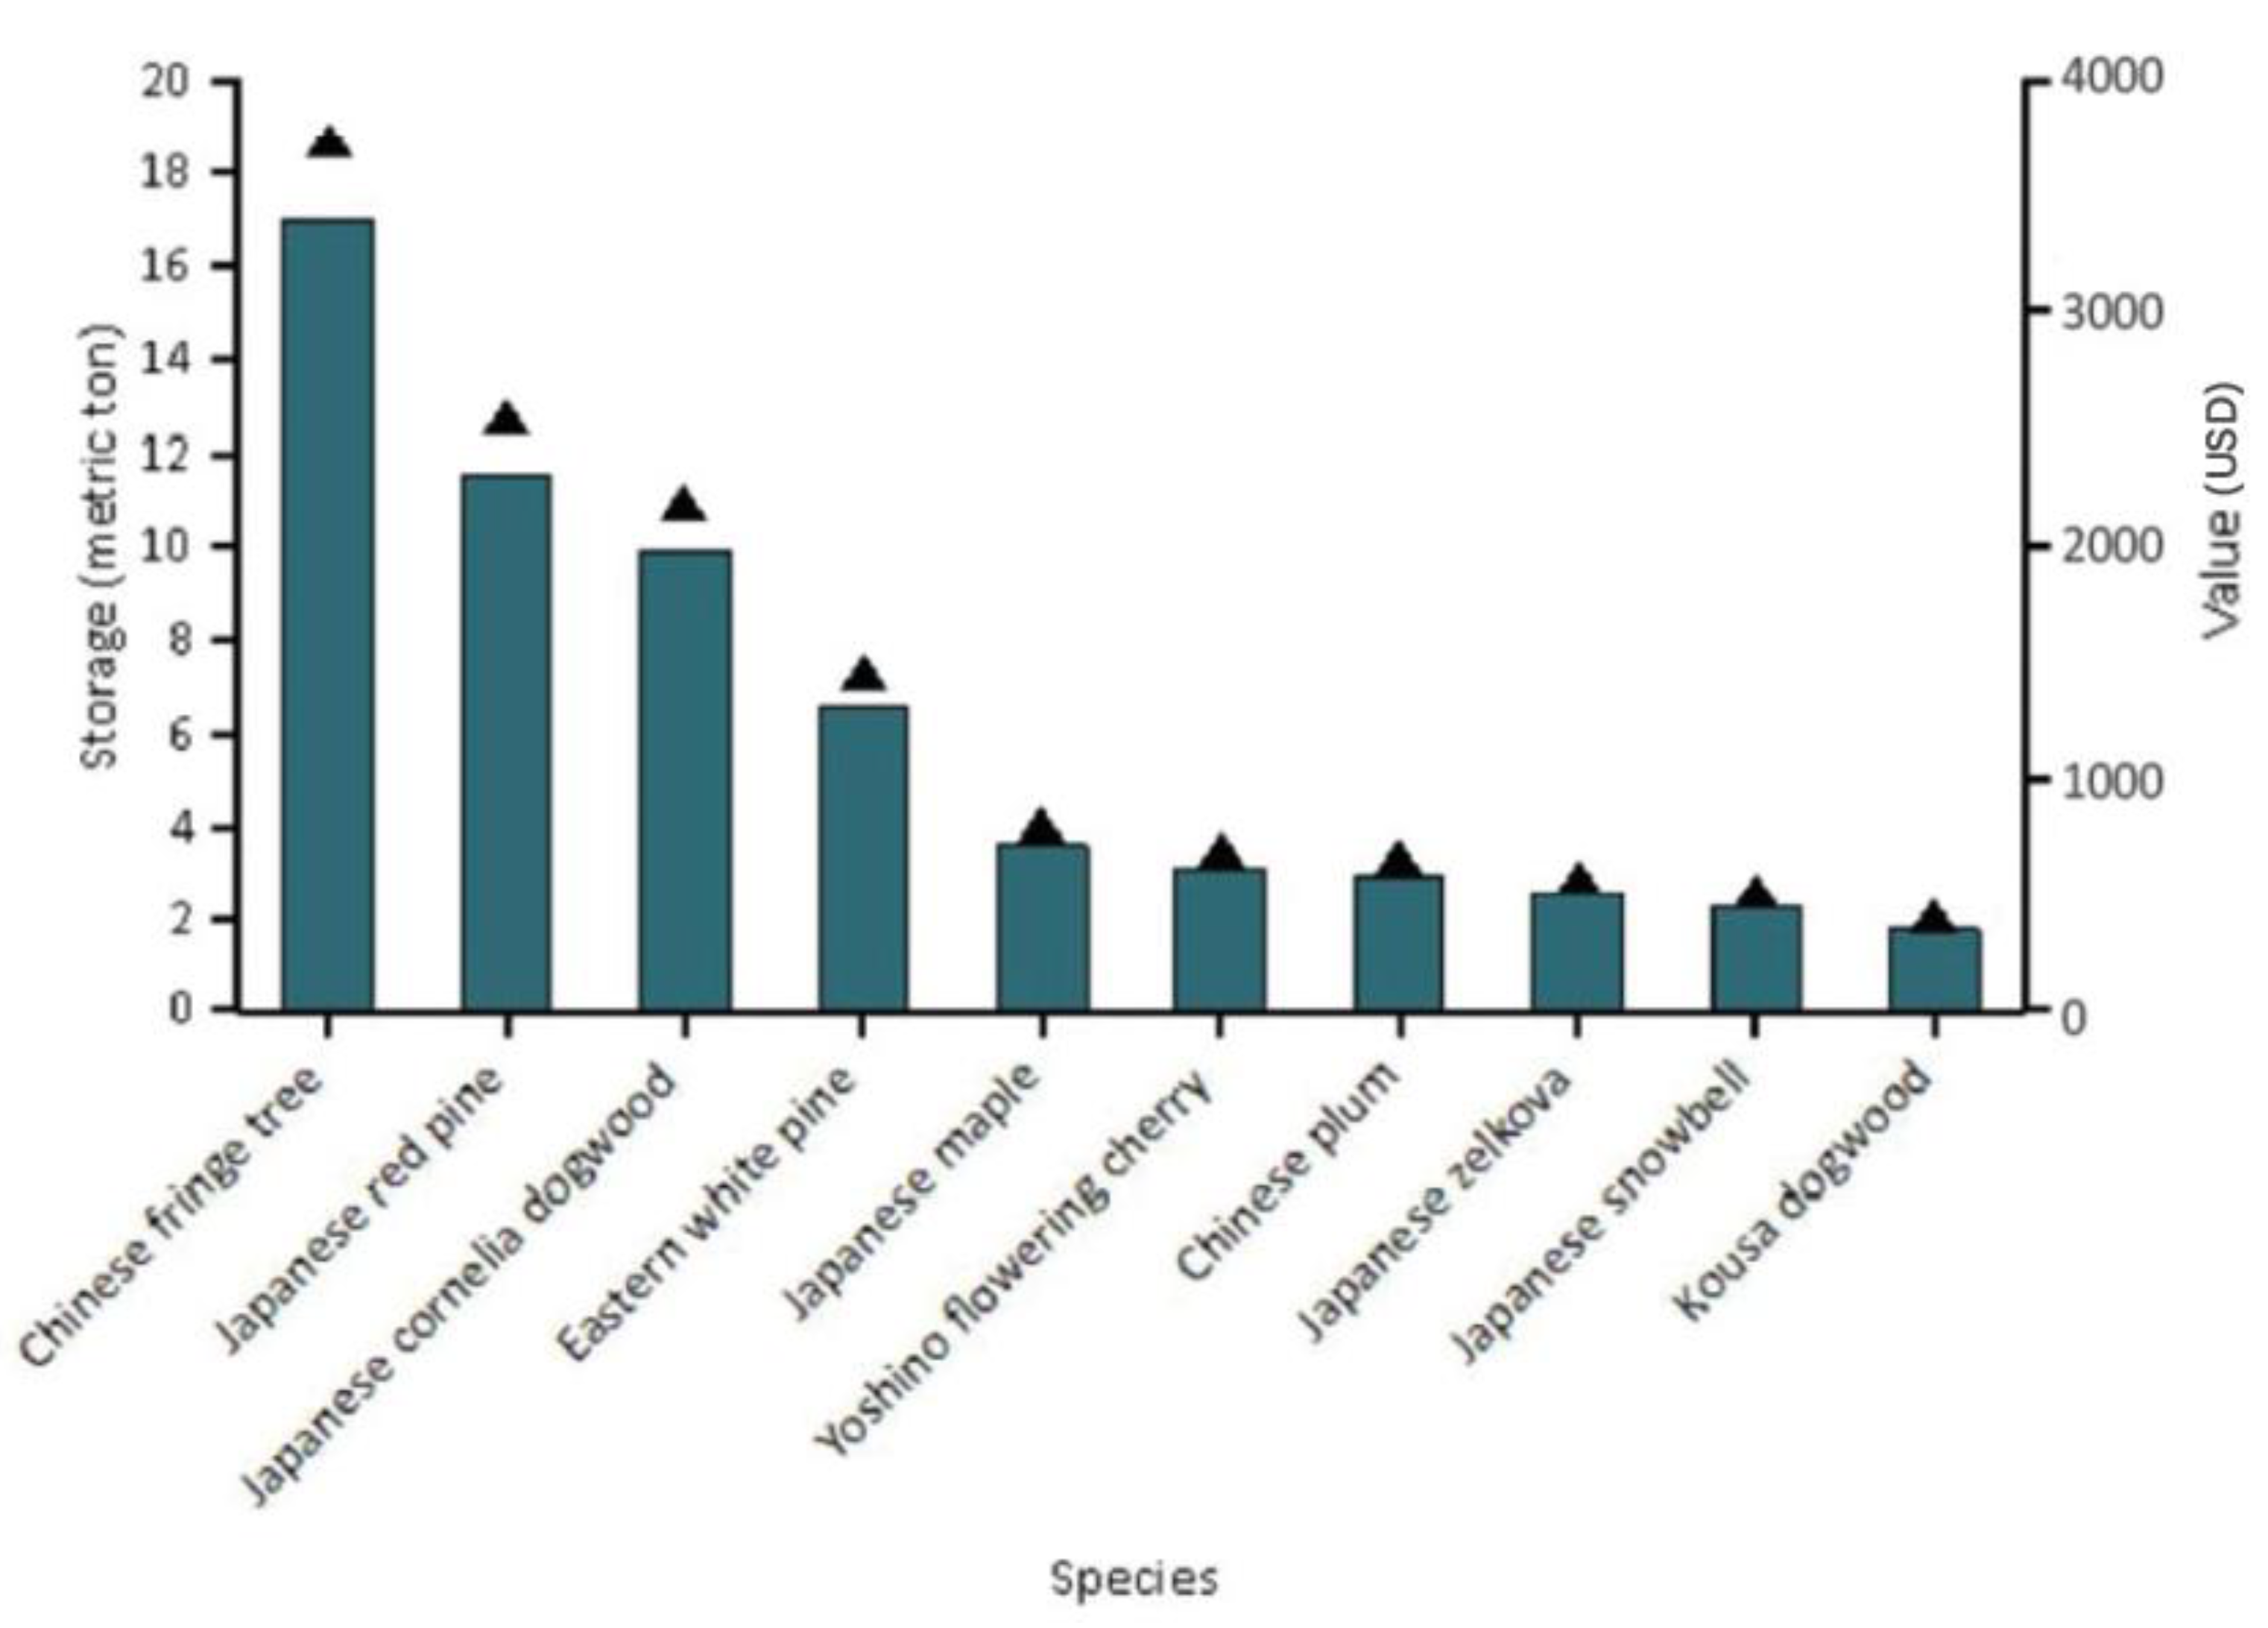
The trees in the upper park of Bundang–Suseo Expressway store a total of 85.6 tons of carbon, and the species with the most carbon storage are Chinese fringe tree (20.5 t), Japanese red pine (13.9 t), Japanese cornelia dogwood (12.0 t), Eastern white pine (7.9 t), and Japanese maple (4.4 t), in the stated order (Figure 8).
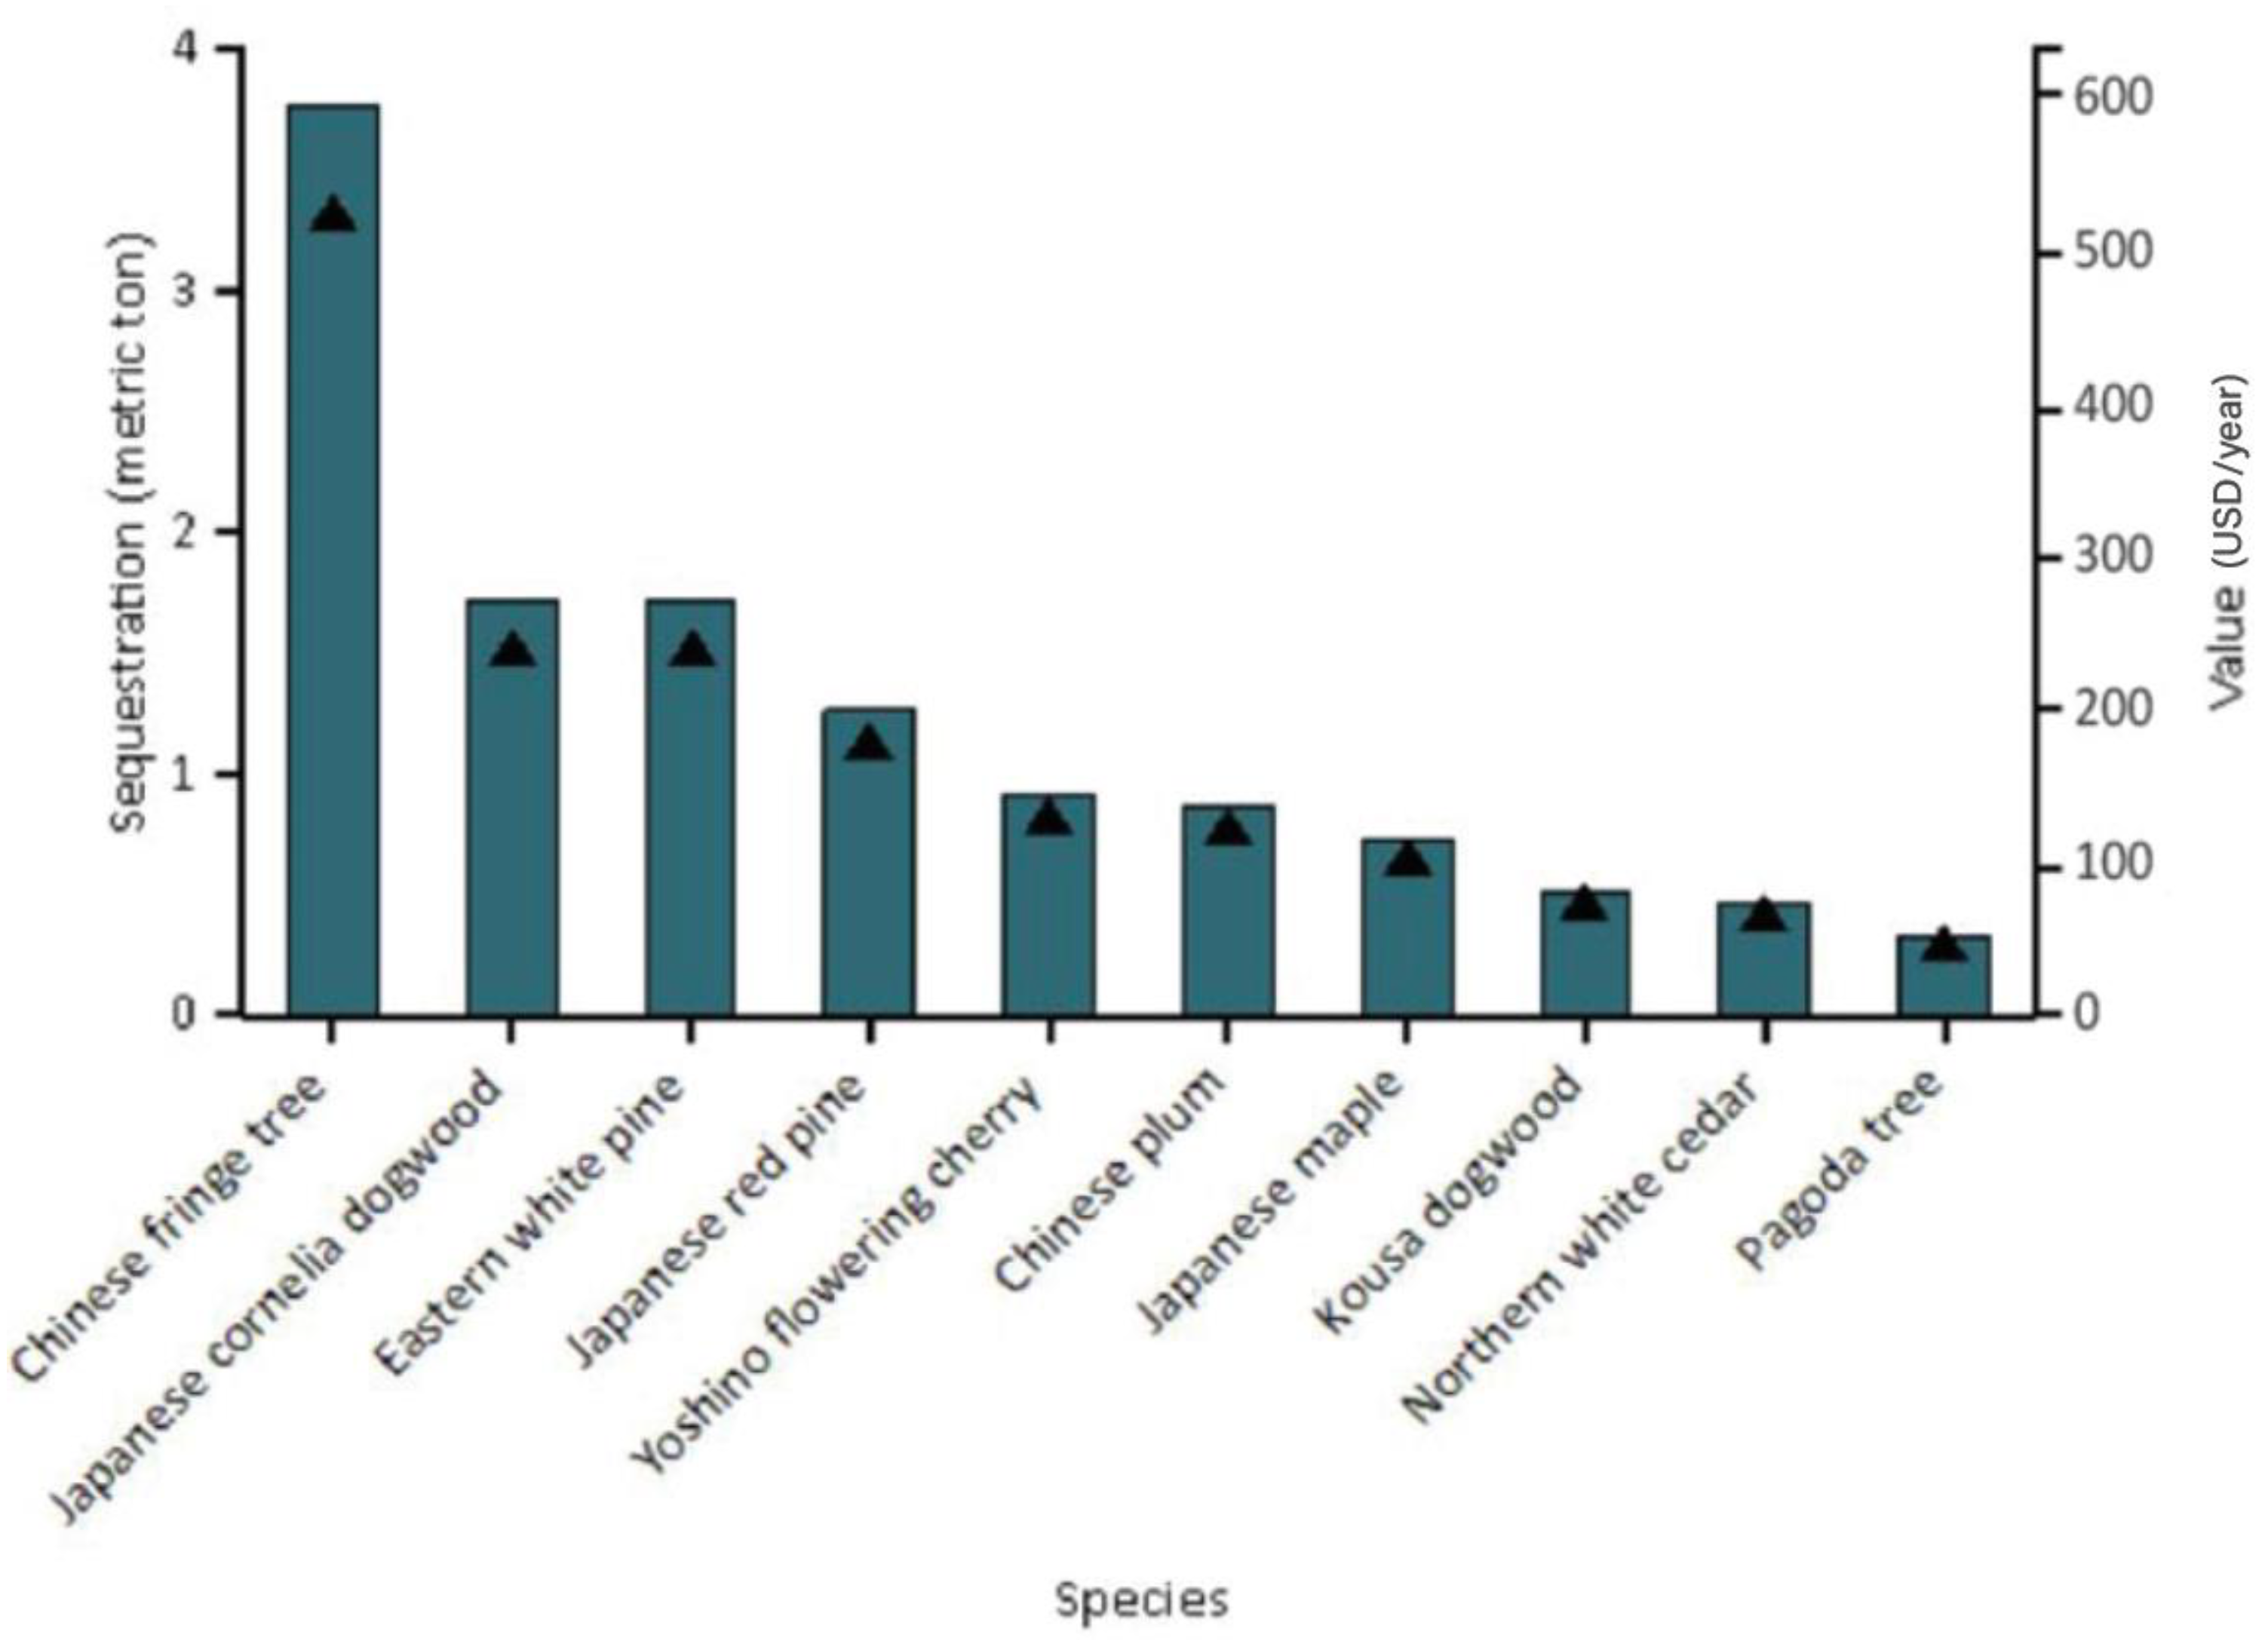
As trees grow and break down carbon, they reduce the amount of carbon in the atmosphere. The trees in the upper park isolate a total of 14.56 tons of carbon. The five species with the most carbon isolation are the same as those with the most carbon storage, although the order is different: Chinese fringe tree (3.64 t), Japanese cornelia dogwood (1.67 t), Eastern white pine (1.66 t), Japanese red pine (1.22 t), and Japanese maple (0.71 t) (Figure 9).
In order to compare the effects of different greenhouse gases, the UN’s Intergovernmental Panel on Climate Change (IPCC) defined “global warming potential” and the CO₂ equivalent (CO₂e) index, which shows the warming effect compared to CO2 for a certain amount of greenhouse gas during a certain period (usually 100 years) [45]. The CO₂e due to carbon sequestration is 314.0 ton/year and the CO₂e due to carbon isolation is 53.40 ton/year (Table 4).
The carbon sequestration and total carbon isolation values in i-Tree Eco are calculated based on the price of USD 167.7 per ton.
In this evaluation, it is estimated that the total carbon storage value for all trees will be USD 14,357.4, and the total carbon isolation value will be USD 2441.8.
Gas material oxygen constitutes 21% of the air by volume, and according to a study by Professor Yoshiya of Doshisha University in Japan, the amount of oxygen in the air is decreasing by one hundred thousandth each year, estimated through the process of investigating the circulation of trace elements using isotopes. The cause is said to be the increase in carbon dioxide (CO2) [46].
It is estimated that the trees in the upper park of the Bundang–Suseo Expressway will produce 35.26 t of oxygen per year, and this is expected to contribute to reducing carbon and global warming. The five species that produce the most oxygen are Chinese fringe tree (8.81 t), Japanese cornelia dogwood (4.03 t), Eastern white pine (4.02 t), Japanese red pine (2.96 t), and Yoshino flowering cherry (2.15 t), in that order (Table 4).
3.4. Hydrological Influence Analysis
Runoff occurs when there is a significant amount of rainfall that is not captured in tree canopies and absorbed into the soil, resulting in surface runoff. Urban trees and shrubs capture rainfall in canopies, while root systems filter and store water in soil, reducing runoff [47].
All physical components of a tree’s structure, such as leaves, branches, and bark, are essential in capturing rainfall, but only the amount held by the leaves is explained in i-Tree Eco analysis. In the analysis, the Avoided Runoff value is calculated at USD 2.28 per m3 and estimated using an annual rainfall amount of 1.29 m.
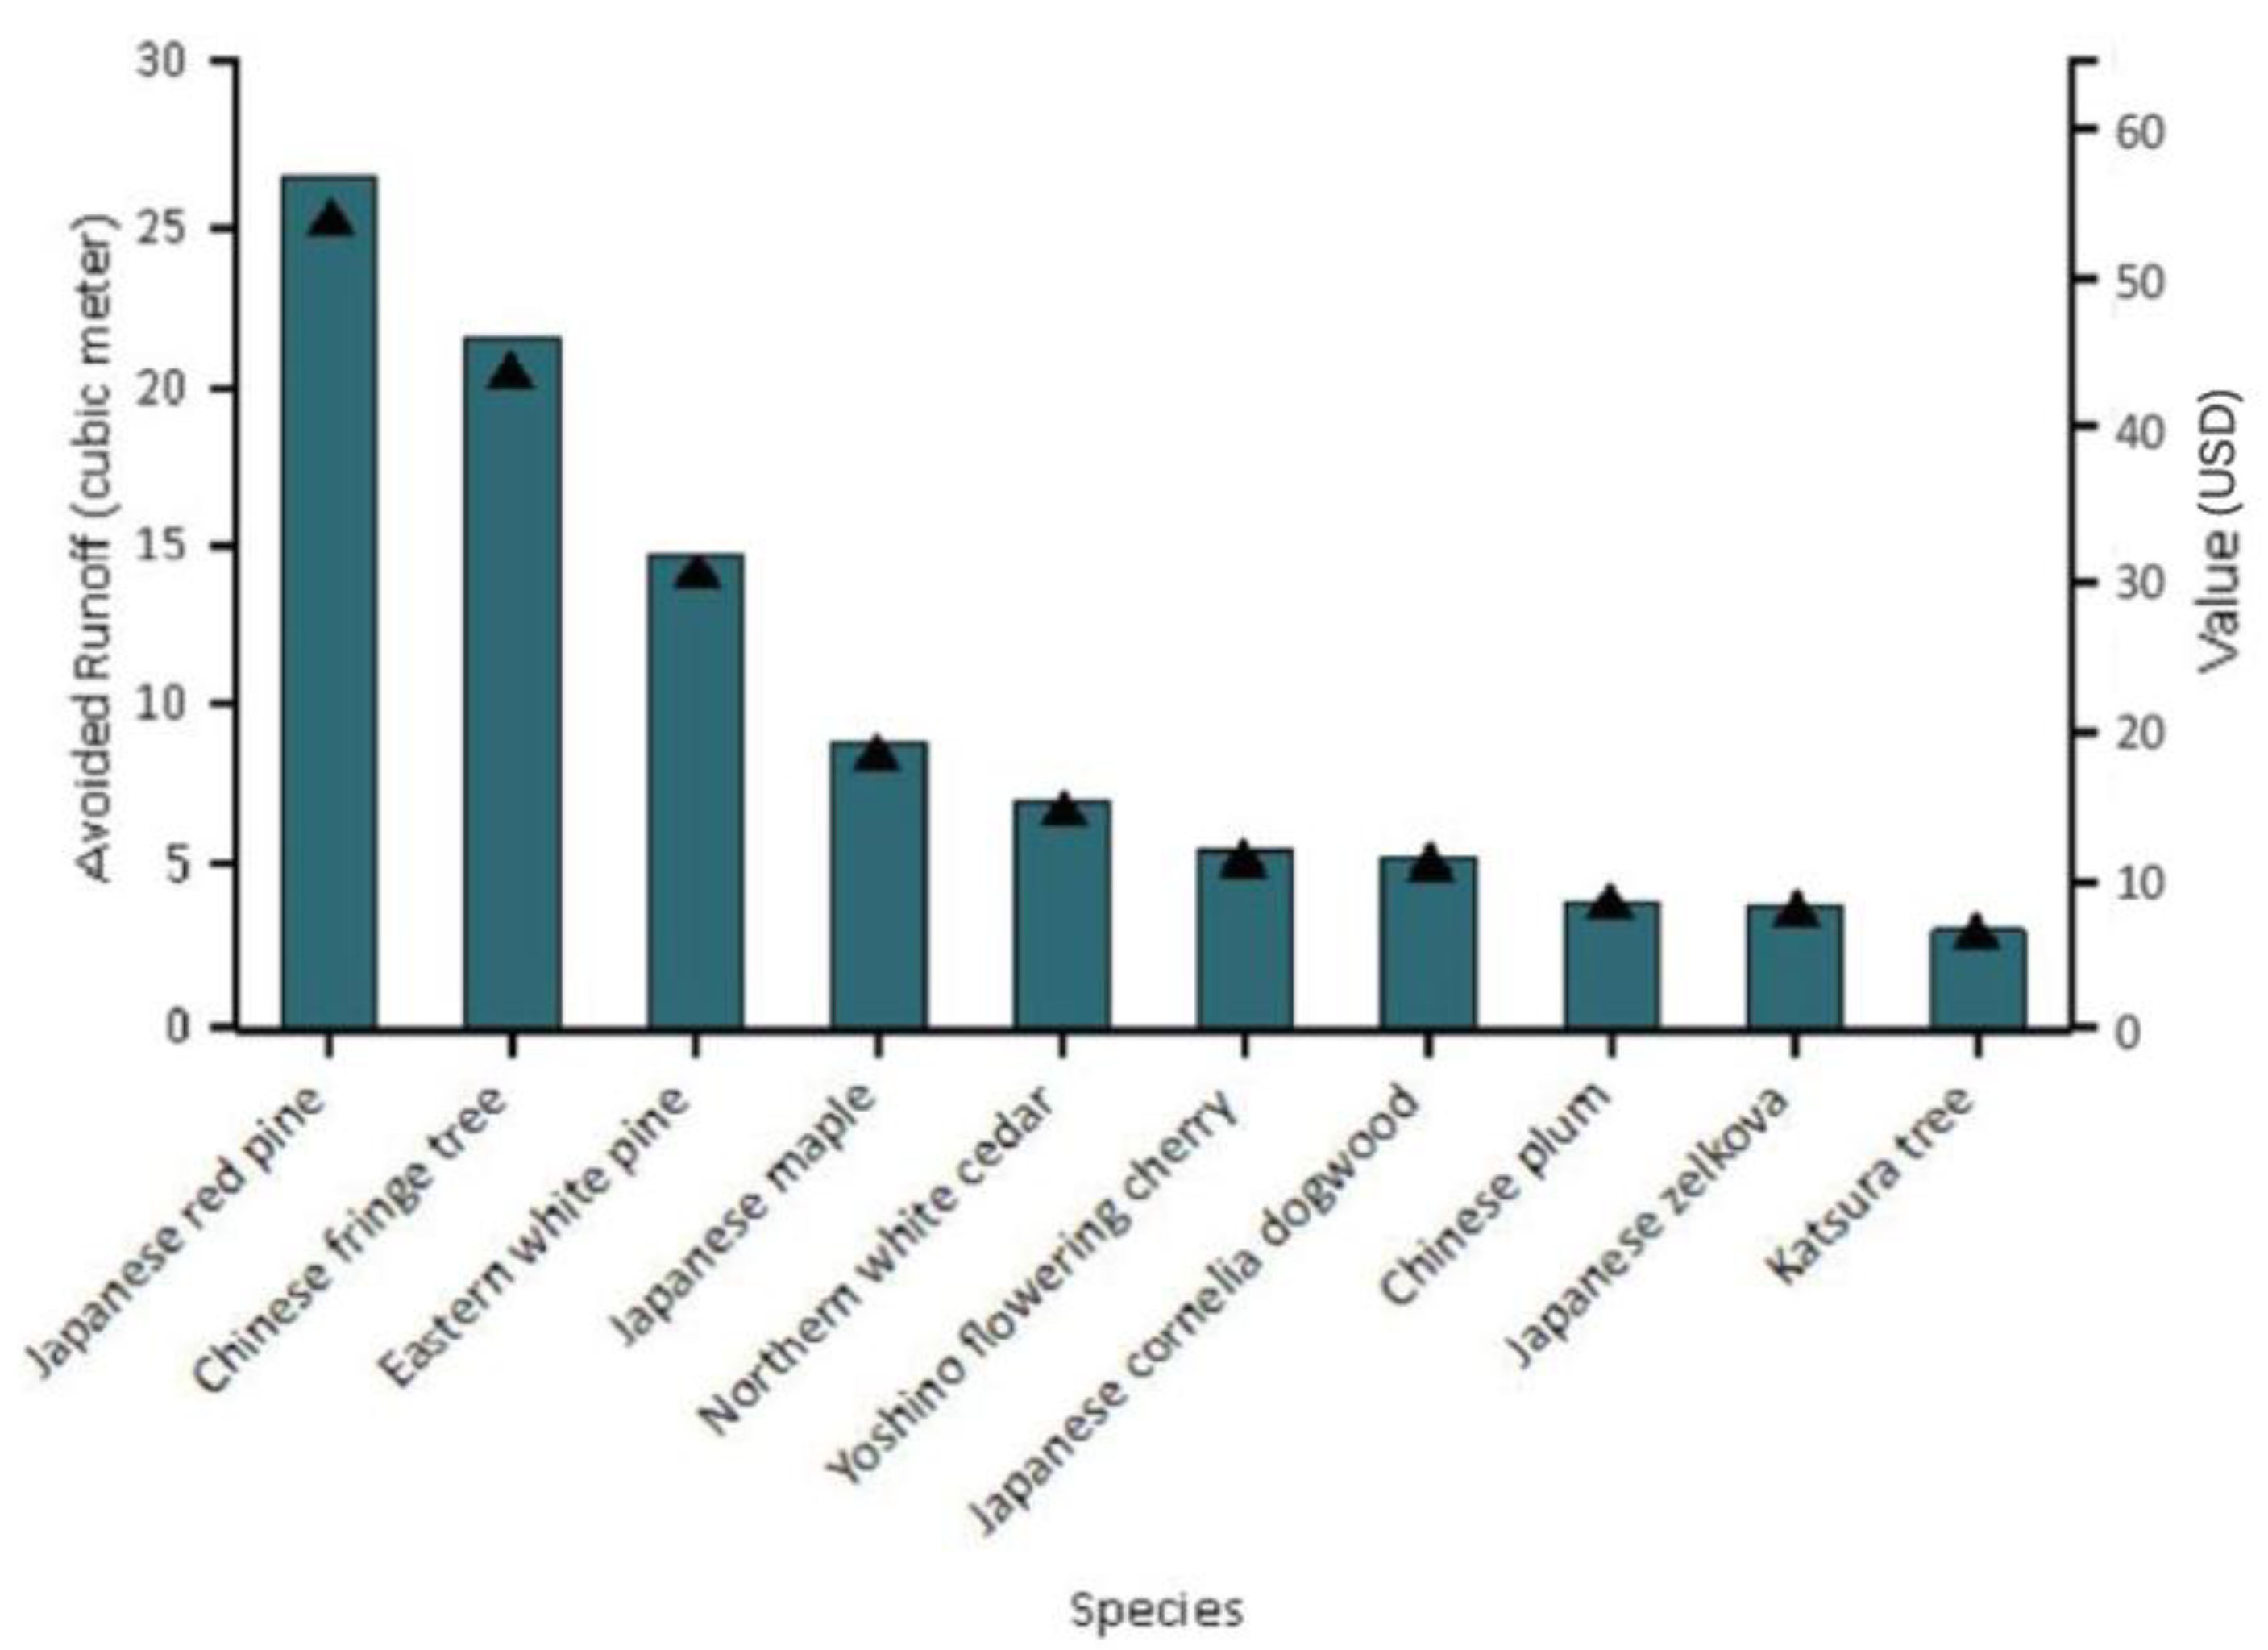
Roads are estimated to be blocked by 504.87 m3 of water annually due to trees in the upper parks, and it was shown that the road helps to mitigate 112.81 m3 of water leakage. Japanese red pine, Chinese fringe tree, and Eastern white pine are the species that have the greatest impact on water benefits, and the amount of evapotranspiration, water blocking, and water leakage reduction can be determined based on the leaf area (Table 5 and Figure 10).
3.5. Total Benefits and Economic Values of Trees
Through the creation of a park along the Bundang–Suseo Expressway, it is possible to confirm the benefits and economic production value caused by trees for Carbon Storage, Gross Carbon Sequestration, Avoided Runoff, and Pollution Removal items (Table A2). In the Carbon Storage item, an annual value of USD 14,357.4 is expected to be produced; in the Gross Carbon Sequestration item, an annual value of USD 2441.8; in the Avoided Runoff item, an annual value of USD 4521.9; and in the Pollution Removal item, an annual value of USD 4521.9 is expected to be produced.
The number of trees planted was Northern white cedar (965 trees, 28.8%), Eastern white pine (385 trees, 11.5%), Chinese fringe tree (356 trees, 10.6%), but the economic value did not match the number of trees planted.
The most commonly planted species alternately predicted in each item were Chinese fringe tree, Japanese red pine, Japanese cornelia dogwood, and Eastern white pine; however, the Northern white cedar, with the most numerous planting of 965 trees, was observed to have lower environmental and economic value.
The Replacement Value is translated to an expected local cost of USD 871,775.5 in economic value when a tree needs to be replaced with a similar tree. Calculating the Replacement Value per tree shows that the cost burden is higher in the order of Japanese zelkova, Japanese red pine, Tulip tree, and Common jujube.
The estimated benefits and economic values of the species can be used as objective evaluation data for ecological value when considering the park landscaping design, if considered at the initial stage.
3.6. Limitations of the Study
The results of the i-Tree Eco model were used to understand urban structure together with ecosystem services and values. The upper park created through the three-dimensionalization of the existing road, which is the target of this study, is limited in size compared to most models using the i-Tree Eco program, and it is at the beginning of planning and creation. However, the significance lies in the fact that it provides new green space by three-dimensionalizing the gray infrastructure facilities that were not previously available within the city, which can solve urban environmental problems such as traffic noise, dust, and air pollution. Additionally, the ecosystem services and environmental benefits provided by the new green space and the economic value that can be measured by the newly created vegetation is a useful tool, and can help estimate the structural and functional value of vegetation.
The estimate by i-Tree Eco can be used to prioritize the selection of vegetation in policy and planning stages, and can be used as objective evaluation materials.
However, the data for the upper park of the Bundang–Suseo Expressway used in this paper are based on the design values of the planned vegetation plan and the average values of the species used during the construction phase, and it is expected that differences from reality will occur due to changes in the growth and management of vegetation due to weather and data over the course of one year.
Additionally, owing to the limitations of the i-Tree Eco model, the analysis is based on the average deposition velocity of tree canopy area, leaf area index, and hourly regional air pollution data, while the model only considers the tree-side-area properties based on the individual characteristics of tree species and does not take into account the characteristics of individual tree species.
4. Discussion
4.1. Overall Analysis of Results
The results of applying the i-Tree Eco model to 3349 trees (26 species) located in the Bundang–Suseo Expressway upper park were analyzed.
The analysis included tree species structure characteristics, air pollution removal, carbon and oxygen change amounts, hydrological impacts, and the benefits and economic values of trees.
In the analysis of tree species structure characteristics, Importance Values (IV) were calculated based on tree species, DBH range, leaf area, and leaf biomass. It was found that leaf area and number of individuals played an important role in the IV value.
In the analysis of air pollution removal, the effects on regional air quality were evaluated based on the removal of CO, NO₂, O₃, PM10, PM2.5, and SO₂, and it was found that SO₂, PM10, PM2.5 showed a significant decrease in removal effects.
In the analysis of carbon and oxygen changes, the species of trees contributing to global warming mitigation can be confirmed through the storage and isolation of carbon and the production of oxygen. In the analysis of hydrological impact, the effects on evapotranspiration, precipitation interception, and runoff interception can be calculated based on the surface area of species and number of individuals.
In the analysis of benefits and economic value from trees, the benefits and values for carbon storage and isolation, prevention of precipitation runoff, and removal of air pollutants can be compared by species in terms of economic value through estimated Replacement Value if they were to be replaced by similar trees.
Through this analysis, it was found that the use of the i-Tree Eco model can not only allow for the quantitative analysis of ecological effects on parks or urban forests, but can also be used as an indicator for determining environmentally and economically favorable species for planning and management in the early stages of development.
4.2. Differentiation of Research
Attempts to quantify the value of ecological services using the i-Tree Eco model mainly focus on research concerning the types of green spaces in cities where vegetation is created and the space of green areas. However, this study predicts ecological services and values for undeveloped planned land where roads are converted into green areas, and it is differentiated in helping to determine the value of policymakers and managers when planning and designing urban green infrastructure (Table 6).
4.3. Reliability and Validity
For road construction projects in Korea, the estimated benefit of parks (non-market goods) is limited to the contingent valuation method (contingent valuation method: survey and analysis of the relationship between awareness and satisfaction of park green spaces, usage behavior, social capital, individual characteristics, and payment willingness to secure objective reliability of external effects). It is difficult to quantify the benefits of parks and ecosystem services. The main advantage of using the i-Tree Eco model is to estimate the functions of urban forests based on locally measured site data and reviewed literature [48].
However, there are limitations to the i-Tree Eco model. Accurate field data collection is necessary for estimating ecosystem functions.
Moreover, to predict and increase the effects of ecosystem services in newly created green spaces, the average growth rate of vegetation can be estimated based on its development, and it is necessary to continuously monitor and maintain vegetation through time to understand how it will change in the future.
4.4. Implications
Roads that occupy 20–30% of the city area are essential for transportation but contribute to the degradation of urban environment, such as disruption of the green network, traffic noise, dust, and air pollution, leading to a decrease in quality of life.
According to the i-Tree Eco model analysis, it is necessary to improve the reduction in air pollution by densely planting species with broad and rough leaves around roads to form a multilayer vegetation structure. Based on the functional value of the structure of trees, it is important to implement carbon neutrality by prioritizing species with high economic value and high carbon storage capacity relative to carbon isolation and response to climate change. Policy incentives for sustained management and preservation of green infrastructure as a valuable asset for carbon neutrality are necessary.
The development of green infrastructure through use of a three-dimensional road in a city can create new possibilities for the city, such as increasing absorption of rainwater, improving aesthetic scenery, and mitigating urban flooding and water leaks caused by increased impermeable surface area in the city due to increased urbanization.
From the analysis results of the i-Tree Eco model, it can be seen that greening according to three-dimensionalization of roads has sustainable economic asset values in terms of carbon storage and sequestration, prevention of runoff from precipitation, and removal of air pollutants.
In addition, by connecting cities disconnected by roads with greenways, the effect of improving the quality of life (culture, emotion, health, etc.) of city residents can be expected through conversion to a pedestrian-friendly city.
The three-dimensional road in a city is a solution that can provide new green infrastructure, especially in cities where there is no more available land. In the future, Korea should strive to contribute to sustainable cities by not only regenerating existing roads, but also constructing green infrastructure in new road development through three-dimensional roads.
5. Conclusions
5.1. Research Results
Some sections of the Bundang–Suseo Expressway, which is the study target area, were three-dimensionalized to solve environmental problems such as traffic noise, dust, and air pollution in response to the demand of the residents, and 3349 trees were planted in the upper park. These trees can store an estimated 85.62 t of carbon annually and sequester 14.57 t of total carbon, remove 70.446 kg of air pollution substances, and alleviate 112.81 m3 of leakage. The economic value of this amounts to approximately 871,775 dollars.
According to Nowak (1995), there are four main ways in which urban trees can impact air quality: temperature decrease and other microclimate effects, removal of air pollutants, emission of volatile organic compounds (VOCs), and maintenance emissions from trees [49]. To improve air quality, species with low VOC emissions, large and long-lived trees, species with low maintenance needs, and deciduous species that remove fine dust in all seasons are advantageous. In this study, we were able to verify the species that contribute to the storage and isolation of carbon, remove air pollutants, mitigate emissions, and reduce the economic costs required for species replacement. In future, when changes such as the replacement or addition of vegetation for park maintenance are made, these species may serve as reference indicators for species selection.
5.2. Future Suggestions
The road green infrastructure conversion, which is a means to solve traffic noise, dust, and smoke generated by cars on the road, can be a useful solution for responding to climate change and environmental problems, including air quality benefits.
Ecosystem services (example: air quality benefits, etc.) of trees created in new green spaces can be verified in advance with quantified data using the i-Tree Eco program, thereby securing project feasibility and facilitating decision-making by policymakers.
Understanding the structure, function, and value of green space can facilitate management decisions that improve human health and environmental quality.
As with urban forest management strategy [14] to improve air quality on roads, it can help improve ecosystem service value for sustainable cities by providing design alternatives such as selecting the largest, longest-lived, and least-maintained trees, increasing the number of healthy trees to decontaminate, and maximizing VOC low-emission trees.
Author Contributions
Conceptualization, E.L. and G.K.; methodology, E.L. and G.K.; software, E.L. and G.K.; data curation, E.L.; writing—original draft preparation, E.L. and G.K.; writing—review and editing, E.L. and G.K.; visualization, E.L.; supervision, G.K.; project administration, G.K. All authors have read and agreed to the published version of the manuscript.
Funding
This research received no external funding.
Data Availability Statement
The data presented in this study are available on request from the corresponding author.
Conflicts of Interest
The authors declare no conflict of interest.
Appendix A

Table A1.
Structure summary by species and importance values by species.
| Species | Number of Trees | Percent Population | Leaf Area (m2) | Percent Leaf Area | Leaf Biomass (ton) | Importance Value |
|---|---|---|---|---|---|---|
| Northern white cedar | 965 | 28.8 | 1428.5 | 5.9 | 0.303 | 34.7 |
| Eastern white pine | 385 | 11.5 | 3023.0 | 12.4 | 0.214 | 23.9 |
| Chinese fringe tree | 356 | 10.6 | 4394.9 | 18.1 | 0.376 | 28.7 |
| Japanese maple | 247 | 7.4 | 1813.0 | 7.5 | 0.112 | 14.8 |
| Japanese cornelia dogwood | 230 | 6.9 | 1076.5 | 4.4 | 0.073 | 11.3 |
| Japanese red pine | 192 | 5.7 | 5422.8 | 22.3 | 0.576 | 28.0 |
| Yoshino flowering cherry | 152 | 4.5 | 1112.9 | 4.6 | 0.095 | 9.1 |
| Kousa dogwood | 125 | 3.7 | 542.3 | 2.2 | 0.037 | 6.0 |
| Chinese plum | 122 | 3.6 | 817.5 | 3.4 | 0.070 | 7.0 |
| Autumn olive | 75 | 2.2 | 97.1 | 0.4 | 0.006 | 2.6 |
| Japanese yew | 57 | 1.7 | 453.2 | 1.9 | 0.061 | 3.6 |
| Katsura tree | 51 | 1.5 | 631.3 | 2.6 | 0.034 | 4.1 |
| Apricot | 40 | 1.2 | 198.3 | 0.8 | 0.017 | 2.0 |
| Giant Dogwood | 37 | 1.1 | 206.4 | 0.8 | 0.014 | 2.0 |
| Elm spp. | 37 | 1.1 | 339.9 | 1.4 | 0.026 | 2.5 |
| Ginkgo | 36 | 1.1 | 255.0 | 1.0 | 0.027 | 2.1 |
| Pagoda tree | 34 | 1.0 | 404.7 | 1.7 | 0.038 | 2.7 |
| Three-flower maple | 32 | 1.0 | 271.1 | 1.1 | 0.017 | 2.1 |
| Japanese zelkova | 31 | 0.9 | 785.1 | 3.2 | 0.056 | 4.2 |
| Japanese snowbell | 30 | 0.9 | 250.9 | 1.0 | 0.019 | 1.9 |
| Hall crabapple | 28 | 0.8 | 141.6 | 0.6 | 0.013 | 1.4 |
| Chinese-quince | 22 | 0.7 | 117.4 | 0.5 | 0.010 | 1.1 |
| Tulip tree | 19 | 0.6 | 250.9 | 1.0 | 0.016 | 1.6 |
| Korean mountain ash | 16 | 0.5 | 80.9 | 0.3 | 0.007 | 0.8 |
| Peach | 15 | 0.4 | 109.3 | 0.4 | 0.009 | 0.9 |
| Common jujube | 15 | 0.4 | 101.2 | 0.4 | 0.005 | 0.9 |
| Study Area | 3349 | 100 | 24,325.7 | 100 | 2.230 | - |
Table A2.
Benefits summary of trees by species.
| Species | Number of Trees | Carbon Storage | Gross Carbon Sequestration | Avoided Runoff | Pollution Removal | Replacement Value | Replacement Value per Tree | ||||
|---|---|---|---|---|---|---|---|---|---|---|---|
| (ton) | (USD) | (ton/year) | (USD/year) | (m3/year) | (USD/year) | (ton/year) | (USD/year) | (USD) | (USD) | ||
| Japanese maple | 247 | 4.38 | 734.4 | 0.71 | 118.6 | 8.41 | 19.2 | 0.01 | 337.0 | 52,039.7 | 210.7 |
| Three-flower maple | 32 | 1.08 | 181.7 | 0.19 | 32.3 | 1.26 | 2.9 | 0.00 | 50.6 | 5655.1 | 176.7 |
| Katsura tree | 51 | 0.92 | 154.6 | 0.18 | 29.4 | 2.93 | 6.7 | 0.00 | 117.4 | 23,760.5 | 465.9 |
| Chinese fringe tree | 356 | 20.52 | 3441.2 | 3.64 | 610.0 | 20.39 | 46.5 | 0.01 | 817.1 | 159,368.2 | 447.7 |
| Giant Dogwood | 37 | 0.34 | 57.3 | 0.16 | 26.1 | 0.96 | 2.2 | 0.00 | 38.4 | 3932.5 | 106.3 |
| Kousa dogwood | 125 | 2.14 | 358.6 | 0.50 | 83.1 | 2.51 | 5.7 | 0.00 | 100.8 | 13,285.4 | 106.3 |
| Japanese cornelia dogwood | 230 | 11.97 | 2007.3 | 1.67 | 279.3 | 4.98 | 11.4 | 0.00 | 199.8 | 49,539.0 | 215.4 |
| Autumn olive | 75 | 0.19 | 32.7 | 0.17 | 28.4 | 0.46 | 1.0 | 0.00 | 18.4 | 3346.7 | 44.6 |
| Ginkgo | 36 | 0.19 | 32.5 | 0.04 | 6.5 | 1.18 | 2.7 | 0.00 | 47.2 | 7785.3 | 216.3 |
| Tulip tree | 19 | 0.64 | 107.4 | 0.15 | 25.9 | 1.16 | 2.7 | 0.00 | 46.6 | 9673.8 | 509.1 |
| Hall crabapple | 28 | 0.27 | 45.8 | 0.10 | 16.6 | 0.66 | 1.5 | 0.00 | 26.4 | 2975.9 | 106.3 |
| Japanese red pine | 192 | 13.93 | 2336.2 | 1.22 | 205.4 | 25.15 | 57.3 | 0.02 | 1008.2 | 164,135.7 | 854.9 |
| Eastern white pine | 385 | 7.92 | 1327.5 | 1.66 | 278.7 | 14.02 | 31.9 | 0.01 | 561.8 | 157,748.9 | 409.7 |
| Apricot | 40 | 0.63 | 105.7 | 0.23 | 38.1 | 0.92 | 2.1 | 0.00 | 36.8 | 3321.7 | 83.0 |
| Peach | 15 | 0.57 | 95.7 | 0.16 | 27.0 | 0.50 | 1.1 | 0.00 | 20.1 | 4374.3 | 291.6 |
| Chinese plum | 122 | 3.56 | 596.3 | 0.84 | 140.7 | 3.80 | 8.7 | 0.00 | 152.2 | 26,551.3 | 217.6 |
| Yoshino flowering cherry | 152 | 3.76 | 630.6 | 0.89 | 148.9 | 5.16 | 11.8 | 0.01 | 207.0 | 32,963.6 | 216.9 |
| Chinese-quince | 22 | 0.61 | 101.8 | 0.12 | 19.7 | 0.55 | 1.2 | 0.00 | 21.9 | 3653.5 | 166.1 |
| Korean mountain ash | 16 | 0.26 | 42.9 | 0.09 | 15.5 | 0.37 | 0.8 | 0.00 | 14.7 | 1700.5 | 106.3 |
| Japanese snowbell | 30 | 2.75 | 461.6 | 0.22 | 36.6 | 1.17 | 2.7 | 0.00 | 46.8 | 14,445.8 | 481.5 |
| Pagoda tree | 34 | 1.79 | 299.8 | 0.31 | 52.2 | 1.87 | 4.3 | 0.00 | 74.9 | 16,712.7 | 491.5 |
| Japanese yew | 57 | 2.01 | 336.6 | 0.20 | 34.2 | 2.11 | 4.8 | 0.00 | 84.4 | 26,307.3 | 461.5 |
| Northern white cedar | 965 | 0.29 | 49.5 | 0.45 | 75.6 | 6.62 | 15.1 | 0.01 | 265.3 | 40,654.4 | 42.1 |
| Elm spp. | 37 | 0.99 | 165.4 | 0.27 | 46.1 | 1.58 | 3.6 | 0.00 | 63.2 | 5701.1 | 154.1 |
| Japanese zelkova | 31 | 3.08 | 515.6 | 0.25 | 41.8 | 3.64 | 8.3 | 0.00 | 146.0 | 34,769.4 | 1121.6 |
| Common jujube | 15 | 0.83 | 138.7 | 0.15 | 24.8 | 0.47 | 1.1 | 0.00 | 19.0 | 7373.2 | 491.5 |
| Total | 3349 | 85.62 | 14,357.4 | 14.57 | 2441.8 | 112.81 | 257.1 | 0.07 | 4521.9 | 871,775.5 | 260.3 |
References
- Choi, B.D.; Hong, I.O.; Kang, H.S.; Ahn, Y.J. Sustainable Development and New Urbanization: A Conceptual Consideration. J. Korean Geogr. Soc. 2004, 39, 70–87. [Google Scholar]
- Park, J.C.; Kim, J.Y. Urban Planning Measurements in Pursuit of a Low-carbon Green City—Case Analyses of Basic Planning Elements and Spatial Urban Structures in Korea and Japan. J. Korean Reg. Dev. Assoc. 2010, 22, 17–51. [Google Scholar]
- Jin, J.W. Promoting Policy of the Green modes as a Sustainable Transportation System in Korea (Green modes promoting movement in Korea: Backgrounds, processing, prospect). J. KST 2000, 18, 63–72. [Google Scholar]
- Chung, Y.K.; Chang, M.S. Conception and Argumentation of Sustainable Development. Korean East-West Econ. Stud. 2007, 19, 143–164. [Google Scholar]
- National Sustainable Development Goals (K-SDGs). Available online: http://ncsd.go.kr/ksdgs (accessed on 5 October 2022).
- World Air Quality Report. Available online: https://www.iqair.com/ko/world-most-polluted-countries (accessed on 5 November 2022).
- Greenpeace Newspaper Korea, the Worst Country for Ultrafine Dust among OECD Member Countries. 25 February 2020. Available online: https://www.greenpeace.org/korea/press/12092/korean-fine-dust-airvisual (accessed on 5 November 2022).
- Ji, J.S. Significance and Expectations of the Beginning of the Road Convergence Development Era. Issue Anal. 2017, 281, 1–25. [Google Scholar]
- Addanki, S.C.; Venkataraman, H. Greening the economy: A review of urban sustainability measures for developing new cities. Sustain. Cities Soc. 2017, 32, 1–8. [Google Scholar] [CrossRef]
- Kenneth, G.; Shalizi, Z. Sustainable Transport: Priorities for Policy Reform; World Bank: Washington, DC, USA, 1996. [Google Scholar]
- Mattinzioli, T.; Sol-Sánchez, M.; Martínez, G.; Rubio-Gámez, M. A critical review of roadway sustainable rating systems. Sustain. Cities Soc. 2020, 63, 102447. [Google Scholar] [CrossRef]
- Ministry of Land, Infrastructure and Transport. Available online: http://www.molit.go.kr/USR/NEWS/m_71/dtl.jsp?lcmspage=1&id=95078869 (accessed on 5 November 2022).
- Ministry of Land, Infrastructure and Transport. Available online: http://www.molit.go.kr/USR/NEWS/m_71/dtl.jsp?lcmspage=1&id=95086492 (accessed on 5 November 2022).
- Shim, J.S. How Roads and Railroads Become Parks; WP 22-13; Korea Research Institute for Human Settlements President (KRIHS): Sejong, Republic of Korea, 2022; pp. 5–8. [Google Scholar]
- Sim, J.; Bohannon, C.L.; Miller, P. What park visitors survey tells us: Comparing three elevated parks—The high line, 606, and high bridge. Sustainability 2019, 12, 121. [Google Scholar] [CrossRef] [Green Version]
- Seattle Parks and Recreation. Available online: https://www.seattle.gov/parks/find/parks/freeway-park (accessed on 5 October 2022).
- The Big Dig: Project Background. Available online: https://www.mass.gov/info-details/the-big-dig-project-background (accessed on 5 October 2022).
- Tajima, K. New Estimates of the Demand for Urban Green Space: Implications for Valuing the Environmental Benefits of Boston’s Big Dig Project. J. Urban Aff. 2003, 25, 641–655. [Google Scholar] [CrossRef]
- Kang, C.D.; Cervero, R. From elevated freeway to urban greenway: Land value impacts of the CGC project in Seoul, Korea. Urban Stud. 2009, 46, 2771–2794. [Google Scholar] [CrossRef]
- Lee, J.; Sohn, K. Identifying the impact on land prices of replacing at-grade or elevated railways with underground subways in the Seoul metropolitan area. Urban Stud. 2013, 51, 44–62. [Google Scholar] [CrossRef]
- Lee, H.J.; Suh, L. A Study on the Sustainable Development through Urban Regeneration of the Line Park in New York. J. Sustain. Res. 2014, 5, 1–21. [Google Scholar]
- Ma, C.-X.; Peng, F.-L. Monetary evaluation method of comprehensive benefits of complex underground roads for motor vehicles orienting urban sustainable development. Sustain. Cities Soc. 2020, 65, 102569. [Google Scholar] [CrossRef]
- Allen, W.L. Environmental reviews and case studies: Advancing green infrastructure at all scales: From landscape to site. Environ. Pract. 2012, 14, 17–25. [Google Scholar] [CrossRef]
- Mell, I.C. Can green infrastructure promote urban sustainability? In Proceedings of the Institution of Civil Engineers-Engineering Sustainability; Thomas Telford Ltd.: London, UK, 2009; Volume 162, pp. 23–34. [Google Scholar]
- Low Impact Development (LID) Center. Low Impact Development Manual for Southern California: Technical Guidance and Site Planning Strategies; Low Impact Development (LID) Center: Beltsville, MD, USA, 2010. [Google Scholar]
- Lovell, S.T.; Taylor, J.R. Supplying urban ecosystem services through multifunctional green infrastructure in the United States. Landsc. Ecol. 2013, 28, 1447–1463. [Google Scholar] [CrossRef]
- Andersson, E.; Barthel, S.; Borgström, S.; Colding, J.; Elmqvist, T.; Folke, C.; Gren, Å. Reconnecting Cities to the Biosphere: Stewardship of Green Infrastructure and Urban Ecosystem Services. Ambio 2014, 43, 445–453. [Google Scholar] [CrossRef] [PubMed] [Green Version]
- Langemeyer, J.; Camps-Calvet, M.; Calvet-Mir, L.; Barthel, S.; Gómez-Baggethun, E. Stewardship of urban ecosystem services: Understanding the value(s) of urban gardens in Barcelona. Landsc. Urban Plan. 2018, 170, 79–89. [Google Scholar] [CrossRef] [Green Version]
- Cortinovis, C.; Geneletti, D. Ecosystem services in urban plans: What is there, and what is still needed for better decisions. Land Use Policy 2018, 70, 298–312. [Google Scholar] [CrossRef]
- Lyu, R.F.; Zhang, J.M.; Xu, M.Q.; Li, J.J. Impacts of urbanization on ecosystem services and their temporal relations: A case study in Northern Ningxia, China. Land Use Policy 2018, 77, 163–173. [Google Scholar] [CrossRef]
- Kim, G.; Miller, P.A.; Nowak, D.J. Assessing urban vacant land ecosystem services: Urban vacant land as green infrastructure in the City of Roanoke, Virginia. Urban For. Urban Green. 2015, 14, 519–526. [Google Scholar] [CrossRef]
- Vahidi, H.; Ramezani Mehrian, M.; Jalayer, A.; Esfahani Zadeh, M.; Ali Hosseini, A. Evaluating the Value of Vegetation Ecosystem Services in District 16 of Tehran Municipality using the i-Tree Model. Environ. Energy Econ. Res. 2023, 7, 1–17. [Google Scholar]
- Raum, S.; Hand, K.; Hall, C.; Edwards, D.; O’Brien, L.; Doick, K. Achieving impact from ecosystem assessment and valuation of urban greenspace: The case of i-Tree Eco in Great Britain. Landsc. Urban Plan. 2019, 190, 103590. [Google Scholar] [CrossRef]
- Nowak, D.J.; Carne, D.E.; Stevens, J.C. Air pollution removal by urban trees and shrubs in the United States. Urban For. Urban Green 2006, 4, 115–123. [Google Scholar] [CrossRef]
- Jayasooriya, V.M.; Ng, A.W.M.; Muthukumaran, S.; Perera, B.J.C. Green infrastructure practices for improvement of urban air quality. Urban For. Urban Green. 2017, 21, 34–47. [Google Scholar] [CrossRef]
- i-Tree. Available online: https://www.itreetools.org/documents/275/EcoV6_UsersManual.2021.09.22.pdf (accessed on 11 October 2022).
- Nowak, D.; Hoehn, R.; Crane, D.; Weller, L.; Davila, A. Assessing Urban Forest Effects and Values, Los Angeles’ Urban Forest; Resour. Bull. NRS-47; US Department of Agriculture, Forest Service, Northern Research Station: Newtown Square, PA, USA, 2011; p. 30.
- Baldocchi, D. A multi-layer model for estimating sulfur dioxide deposition to a deciduous oak forest canopy. Atmos. Environ. 1988, 22, 869–884. [Google Scholar] [CrossRef]
- Baldocchi, D.D.; Hicks, B.B.; Camara, P. A canopy stomatal resistance model for gaseous deposition to vegetated surfaces. Atmos. Environ. 1987, 21, 91–101. [Google Scholar] [CrossRef]
- Hirabayashi, S. Urban Forest Effects-Dry Deposition (UFORE-D) Model Enhancements. 2011. Available online: http://www.itreetools.org/eco/resources/UFORE-Denhancements.pdf (accessed on 25 September 2022).
- Hirabayashi, S.; Kroll, C.N.; Nowak, D.J. Component-based development and sensitivity analyses of an air pollutant dry deposition model. Environ. Model. Softw. 2011, 26, 804–816. [Google Scholar] [CrossRef]
- Murray, F.J.; Marsh, L.; Bradford, P.A. New York State Energy Plan, Vol. II: Issue Reports; New York State Energy Office: Albany, NY, USA, 1994. [Google Scholar]
- Von Arx, G.; Pannatier, E.G.; Thimonier, A.; Rebetez, M. Microclimate in forests with varying leaf area index and soil moisture: Potential implications for seedling establishment in a changing climate. J. Ecol. 2013, 101, 1201–1213. [Google Scholar] [CrossRef]
- Riondato, E.; Pilla, F.; Basu, A.S.; Basu, B. Investigating the effect of trees on urban quality in Dublin by combining air monitoring with i-Tree Eco model. Sustain. Cities Soc. 2020, 61, 102356. [Google Scholar] [CrossRef]
- IPCC. Available online: https://www.ipcc.ch/report/revised-1996-ipcc-guidelines-for-national-greenhouse-gas-inventories/ (accessed on 26 September 2002).
- Kim, T.W. A Study on the Measurement of Atmospheric Oxygen Concentration. Master’s Thesis, Ulsan University, Ulsan, Republic of Korea, 2002. [Google Scholar]
- i-Tree. Available online: https://www.itreetools.org/documents/61/iTree_Eco_Precipitation_Interception_Model_Descriptions.pdf (accessed on 12 October 2022).
- Nowak, D.J.; Crane, D.E.; Stevens, J.C.; Hoehn, R.E.; Walton, J.T.; Bond, J. A Ground-Based Method of Assessing Urban Forest Structure and Ecosystem Services. Arboric. Urban For. 2008, 34, 347–358. [Google Scholar] [CrossRef]
- Nowak, D.J. Trees pollute? A “TREE” explains it all. In Proceedings of the 7th National Urban Forestry Conference; American Forests: Washington, DC, USA; 1995. [Google Scholar]
Figure 1.
Expressway between Bundang and Suseo (Google Map), upper park area, and cross-section of standards.
Figure 1.
Expressway between Bundang and Suseo (Google Map), upper park area, and cross-section of standards.

Figure 2.
Bundang–Suseo Expressway upper park development process.

Figure 3.
Population summary by species.

Figure 4.
Species distribution by DBH class (top 10 most populated species in the project area).

Figure 5.
Annual pollution removal and value by tree. Triangle represent Removal.

Figure 6.
Pollution removal by trees and shrubs—monthly removal.

Figure 7.
Pollution removal by trees and shrubs—monthly removal. Triangle represent Removal.

Figure 8.
Estimated carbon storage and values for tree species with greatest storage. Triangle represent Removal.
Figure 8.
Estimated carbon storage and values for tree species with greatest storage. Triangle represent Removal.

Figure 9.
Estimated annual gross carbon sequestration and values for tree species with the greatest sequestration. Triangle represent Removal.
Figure 9.
Estimated annual gross carbon sequestration and values for tree species with the greatest sequestration. Triangle represent Removal.

Figure 10.
Avoided runoff and value for species with greatest overall impact on runoff. Triangle represent Removal.
Figure 10.
Avoided runoff and value for species with greatest overall impact on runoff. Triangle represent Removal.

Table 1.
Population summary by stratum per unit area.
| Stratum | Number of Trees | Tree Density (number/ha) |
|---|---|---|
| Park 1 | 572 | 381 |
| Park 2~3 | 2077 | 1039 |
| Park 4 | 700 | 824 |
| Study Area | 3349 | 770 |
Table 2.
Pollution removal and value by trees and shrubs—annual removal.
| Pollutant | Removal (kg/year) | Value (USD/year) | ||||
|---|---|---|---|---|---|---|
| Mean | Max | Min | Mean | Max | Min | |
| CO | 3.783 | 12.312 | 2.156 | 5.6 | 20.1 | 4.3 |
| NO₂ | 15.817 | 42.561 | 11.312 | 94.6 | 254.5 | 67.6 |
| O₃ | 29.683 | 69.971 | 10.751 | 1188.1 | 2800.6 | 430.3 |
| PM10 | 14.757 | 23.057 | 5.764 | 103.8 | 162.1 | 40.5 |
| PM2.5 | 2.247 | 4.181 | 0.307 | 3120.9 | 5808.5 | 426.6 |
| SO₂ | 4.160 | 14.501 | 2.862 | 9.1 | 31.6 | 6.2 |
| SUM | 70.446 | 154.272 | 30.996 | 4521.9 | 9057.2 | 971.3 |
Table 3.
Pollutant reduction rate (based on pollutant emissions from road transport pollutants in Bundang-gu in 2018).
Table 3.
Pollutant reduction rate (based on pollutant emissions from road transport pollutants in Bundang-gu in 2018).
| Category | CO | NO2 | PM10 * | PM2.5 | SO2 |
|---|---|---|---|---|---|
| Pollutant emissions amount (kg/year) * | 1,233,744.2 | 2,395,323.5 | 46,119.0 | 42,429.0 | 1430.0 |
| Pollutant Removal amount (kg/year) ** | 3.8 | 15.8 | 14.8 | 2.2 | 4.2 |
| Pollutant reduction rate (%) | 0.0003 | 0.0007 | 0.0320 | 0.0053 | 0.2909 |
* Annual air pollutant emissions from road transport pollutants in Bundang-gu, Seongnam, in 2018 (Ministry of Environment). ** Annual air pollutant removal in the upper park (i-Tree Eco analysis estimate).
Table 4.
Carbon storage and carbon sequestration of trees by species.
| Species | Carbon Storage | Carbon Storage CO₂ Equivalent | Gross Carbon Sequestration | Carbon Sequestration CO₂ Equivalent | Oxygen Production |
|---|---|---|---|---|---|
| (ton) | (ton/year) | (ton/year) | (ton/year) | (ton/year) | |
| Japanese maple | 4.4 | 16.1 | 0.71 | 2.59 | 1.71 |
| Three-flower maple | 1.1 | 4.0 | 0.19 | 0.71 | 0.47 |
| Katsura tree | 0.9 | 3.4 | 0.18 | 0.64 | 0.43 |
| Chinese fringe tree | 20.5 | 75.3 | 3.64 | 13.34 | 8.81 |
| Giant Dogwood | 0.3 | 1.3 | 0.16 | 0.57 | 0.38 |
| Kousa dogwood | 2.1 | 7.8 | 0.50 | 1.82 | 1.20 |
| Japanese cornelia dogwood | 12.0 | 43.9 | 1.67 | 6.11 | 4.03 |
| Autumn olive | 0.2 | 0.7 | 0.17 | 0.62 | 0.41 |
| Ginkgo | 0.2 | 0.7 | 0.04 | 0.14 | 0.09 |
| Tulip tree | 0.6 | 2.3 | 0.15 | 0.57 | 0.37 |
| Hall crabapple | 0.3 | 1.0 | 0.10 | 0.36 | 0.24 |
| Japanese red pine | 13.9 | 51.1 | 1.22 | 4.49 | 2.96 |
| Eastern white pine | 7.9 | 29.0 | 1.66 | 6.10 | 4.02 |
| Apricot | 0.6 | 2.3 | 0.23 | 0.83 | 0.55 |
| Peach | 0.6 | 2.1 | 0.16 | 0.59 | 0.39 |
| Chinese plum | 3.6 | 13.0 | 0.84 | 3.08 | 2.03 |
| Yoshino flowering cherry | 3.8 | 13.8 | 0.89 | 3.26 | 2.15 |
| Chinese-quince | 0.6 | 2.2 | 0.12 | 0.43 | 0.28 |
| Korean mountain ash | 0.3 | 0.9 | 0.09 | 0.34 | 0.22 |
| Japanese snowbell | 2.8 | 10.1 | 0.22 | 0.80 | 0.53 |
| Pagoda tree | 1.8 | 6.6 | 0.31 | 1.14 | 0.75 |
| Japanese yew | 2.0 | 7.4 | 0.20 | 0.75 | 0.49 |
| Northern white cedar | 0.3 | 1.1 | 0.45 | 1.65 | 1.10 |
| Elm spp. | 1.0 | 3.6 | 0.27 | 1.01 | 0.67 |
| Japanese zelkova | 3.1 | 11.3 | 0.25 | 0.91 | 0.60 |
| Common jujube | 0.8 | 3.0 | 0.15 | 0.54 | 0.36 |
| Total | 85.6 | 314.0 | 14.56 | 53.40 | 35.26 |
Table 5.
Hydrological effects of trees by species.
| Species | Trees | Leaf Area | Potential Evapotranspiration | Evaporation | Transpiration | Water Intercepted | Avoided Runoff | Avoided Runoff Value |
|---|---|---|---|---|---|---|---|---|
| Number | (m2) | (m3/year) | (m3/year) | (m3/year) | (m3/year) | (m3/year) | (USD/year) | |
| Japanese red pine | 192 | 5422.79 | 681.68 | 112.56 | 296.95 | 112.57 | 25.15 | 57.3 |
| Chinese fringe tree | 356 | 4411.07 | 552.46 | 91.22 | 240.66 | 91.23 | 20.39 | 46.5 |
| Eastern white pine | 385 | 3035.14 | 379.83 | 62.72 | 165.46 | 62.72 | 14.02 | 31.9 |
| Japanese maple | 247 | 1821.09 | 227.82 | 37.62 | 99.24 | 37.62 | 8.41 | 19.2 |
| Northern white cedar | 965 | 1416.40 | 179.36 | 29.62 | 78.14 | 29.62 | 6.62 | 15.1 |
| Yoshino flowering cherry | 152 | 1133.12 | 139.93 | 23.10 | 60.95 | 23.11 | 5.16 | 11.8 |
| Japanese cornelia dogwood | 230 | 1092.65 | 135.06 | 22.30 | 58.83 | 22.30 | 4.98 | 11.4 |
| Chinese plum | 122 | 809.37 | 102.93 | 17.00 | 44.84 | 17.00 | 3.80 | 8.7 |
| Japanese zelkova | 31 | 768.90 | 98.73 | 16.30 | 43.01 | 16.30 | 3.64 | 8.3 |
| Katsura tree | 51 | 647.50 | 79.39 | 13.11 | 34.58 | 13.11 | 2.93 | 6.7 |
| Kousa dogwood | 125 | 526.09 | 68.15 | 11.25 | 29.69 | 11.25 | 2.51 | 5.7 |
| Japanese yew | 57 | 445.15 | 57.09 | 9.43 | 24.87 | 9.43 | 2.11 | 4.8 |
| Pagoda tree | 34 | 404.69 | 50.63 | 8.36 | 22.05 | 8.36 | 1.87 | 4.3 |
| Elm spp. | 37 | 323.75 | 42.73 | 7.06 | 18.61 | 7.06 | 1.58 | 3.6 |
| Three-flower maple | 32 | 283.28 | 34.20 | 5.65 | 14.90 | 5.65 | 1.26 | 2.9 |
| Ginkgo | 36 | 242.81 | 31.90 | 5.27 | 13.89 | 5.27 | 1.18 | 2.7 |
| Japanese snowbell | 30 | 242.81 | 31.61 | 5.22 | 13.77 | 5.22 | 1.17 | 2.7 |
| Tulip tree | 19 | 242.81 | 31.52 | 5.20 | 13.73 | 5.20 | 1.16 | 2.7 |
| Giant Dogwood | 37 | 202.34 | 25.98 | 4.29 | 11.32 | 4.29 | 0.96 | 2.2 |
| Apricot | 40 | 202.34 | 24.88 | 4.11 | 10.84 | 4.11 | 0.92 | 2.1 |
| Hall crabapple | 28 | 161.87 | 17.84 | 2.95 | 7.77 | 2.95 | 0.66 | 1.5 |
| Chinese-quince | 22 | 121.41 | 14.83 | 2.45 | 6.46 | 2.45 | 0.55 | 1.2 |
| Peach | 15 | 121.41 | 13.57 | 2.24 | 5.91 | 2.24 | 0.50 | 1.1 |
| Common jujube | 15 | 121.41 | 12.86 | 2.12 | 5.60 | 2.12 | 0.47 | 1.1 |
| Autumn olive | 75 | 80.94 | 12.42 | 2.05 | 5.41 | 2.05 | 0.46 | 1.0 |
| Korean mountain ash | 16 | 80.94 | 9.97 | 1.65 | 4.34 | 1.65 | 0.37 | 0.8 |
| Total | 3349 | 24,362.08 | 3057.34 | 504.84 | 1331.85 | 504.87 | 112.81 | 257.1 |
Table 6.
Comparison of similar studies using the i-Tree Eco model.
| Category | Purpose | Subject | Method | |
|---|---|---|---|---|
| similar studies | Kim et al. (2015) [21] | How urban open spaces function as green infrastructure that provides ecosystem services and value to society | Green infrastructure of vacant land in the city of Roanoke, Virginia | Quantification of ecosystem function and economic value: air pollution removal, carbon sequestration and storage, energy-saving, and the structural value of trees on vacant land |
| Vahidi et al. (2022) [22] | Analysis of the potential effect of urban trees for eliminating air pollutants and examining their ecosystem services | Public green areas and street tree resources in D16 of Tehran Municipality | Observing and estimating the trend of air quality: studying and modeling the removal of air pollutants by vegetation, mainly native and non-native trees, and plants | |
| Song et al. (2022) [23] | Explores the role of urban green spaces in providing ecosystem services and values and ways to maximize ecosystem services | Four types of urban green spaces in Luohe, China | Assessment of vegetation structure and various ecosystem services, including air quality improvement, rainfall interception, carbon storage, and sequestration, provided by four types of urban green spaces | |
| this study | Demonstration of environmental and economic value according to conversion of gray infrastructure (road) to green infrastructure | Park section of an expressway located between Bundang and Suseo in Seongnam city, South Korea | Modeling using park planning data (completed in June 2023): quantitative analysis of tree structure characteristics, air pollutant removal, carbon and oxygen change, hydrological impact, and economic value | |
Disclaimer/Publisher’s Note: The statements, opinions and data contained in all publications are solely those of the individual author(s) and contributor(s) and not of MDPI and/or the editor(s). MDPI and/or the editor(s) disclaim responsibility for any injury to people or property resulting from any ideas, methods, instructions or products referred to in the content. |
© 2023 by the authors. Licensee MDPI, Basel, Switzerland. This article is an open access article distributed under the terms and conditions of the Creative Commons Attribution (CC BY) license (https://creativecommons.org/licenses/by/4.0/).
Share and Cite
MDPI and ACS Style
Lee, E.; Kim, G. Green Space Ecosystem Services and Value Evaluation of Three-Dimensional Roads for Sustainable Cities. Land 2023, 12, 505. https://doi.org/10.3390/land12020505
AMA Style
Lee E, Kim G. Green Space Ecosystem Services and Value Evaluation of Three-Dimensional Roads for Sustainable Cities. Land. 2023; 12(2):505. https://doi.org/10.3390/land12020505
Chicago/Turabian StyleLee, Eunjoung, and Gunwoo Kim. 2023. "Green Space Ecosystem Services and Value Evaluation of Three-Dimensional Roads for Sustainable Cities" Land 12, no. 2: 505. https://doi.org/10.3390/land12020505
Note that from the first issue of 2016, this journal uses article numbers instead of page numbers. See further details here.