
Mapping and Monitoring Spatio-Temporal Patterns of Rainfed Agriculture Lands of North Darfur State, Sudan, Using Earth Observation Data


1
Faculty of Science, School of Geography, Archaeology and Environmental Studies, University of the Witwatersrand, Johannesburg 2050, South Africa
2
Department of Geology and Environmental Geosciences, College of Charleston, Charleston, SC 29424, USA
*
Author to whom correspondence should be addressed.
Land 2023, 12(2), 307; https://doi.org/10.3390/land12020307
Submission received: 21 December 2022
/
Revised: 15 January 2023
/
Accepted: 17 January 2023
/
Published: 22 January 2023
(This article belongs to the Section Land – Observation and Monitoring)
Abstract
:Rainfed agriculture in Northern Darfur is influenced by erratic seasonal and decadal rainfall patterns and frequent droughts. Understanding the spatio-temporal variation in rainfed agriculture is crucial for promoting food security, socio-economic stability and protecting the vulnerable ecosystem. This study aimed to investigate the spatio-temporal dynamics of rainfed agriculture in North Darfur State from 1984–2019 using multitemporal Landsat observation data. Using the random forest technique, the multitemporal images were classified into common land use/land cover classes and rainfed agriculture on goz (sandy) and wadi (seasonal river) lands. Overall accuracies were assessed using a confusion matrix. Overall accuracies were assessed using a confusion matrix has ranging between 94.7% and 96.9%, while the kappa statistics were greater than 0.90. The results showed that the high spatial variability in goz land used for rainfed agriculture increased of (889,622.46 ha) over 1994–1999, while it decreased (658,568.61 ha) over 2004–2009 south of the 232.9 mm isohyet. Rainfed cultivation of wadi lands expanded significantly of (580,515.03 ha) over 2014–2019 and decreased (182,701.8 ha) over 1994–1999, especially in the 362.8–477.2 mm isohyets (beyond the climate-adapted 500 mm isohyet agronomic dry limit). These spatial trends need further investigation as they may exacerbate both regional land degradation and disputes among farmers over scarce wadi lands. This study provides essential spatial data which are lacking owing to ongoing conflicts; this can help decision-makers formulate sustainable land use monitoring systems.
1. Introduction
Rainfed agriculture plays an essential role in food security in most regions worldwide [1]. Around 75–82% of the total cropland areas in the world are under rainfed agriculture [1,2,3]. This crucial sector of agriculture usually depends on the physical environment and, most importantly, the variability and distribution of rainfall. Therefore, rainfed farming is vulnerable to climate-related hazards, and the crop yield is unreliable and difficult to predict [4,5]. Sudan in north-eastern Africa is among the sub-Saharan African countries that depend on rainfed agriculture. More than 90% of cultivated land comprises rainfed farming, accounting for one-third of the GDP [6,7]. The rainfed agriculture subsector essentially encompasses private mechanised farming distributed to the east and west of the Nile River banks and its tributaries. Unfortunately, these parts are characterised by environmental and socio-economic hazards, such as frequent droughts; unpredictable, low, poorly distributed, and highly variable monthly/seasonal rainfall; population pressures; social change; deforestation; soil erosion; salinisation; and water depletion.
For example, Darfur, a semi-arid region in western Sudan, witnessed three droughts between 1950 and 1990. The drought was mild in the mid-1960s but relatively severe between 1972 and 1975. The region then experienced catastrophic drought conditions between 1982 and 1984 when average rainfall was reduced by 50% or more in many areas [8,9]. Hence, Darfur has been described as a hotspot of land and environmental degradation, experiencing among the most prominent natural threats in the region. Despite the high rainfall variability and persistent drought, rainfed agriculture and livestock are the primary sources of livelihood for 80–90% of the population of the Darfur region [6,10]. This crucial agriculture sector usually depends on the physical environment and, most importantly, the amount and distribution of rainfall. Therefore, rainfed agriculture is vulnerable to climate-related hazards, including variability, and the crop yield is thus unreliable and difficult to predict. Persistent drought and associated impacts on rainfed agricultural practices contribute to regional, social, and/or political instability [11,12,13,14,15].
Rainfed agriculture in North Darfur State lies between the 250 mm and 600 mm isohyets. The region is characterised by rainfall variability both in time and space, coupled with high maximum temperatures and significant temperature differences between day and night, in addition to strong winds and low humidity. This complex climate condition is reflected in an increased vapour pressure deficit with implications for water use efficiency, transpiration, and evaporation. Therefore, the rainfed agriculture system is largely a function of climate and cultural practices, with more emphasis on climatic variables.
There are two farming systems in North Darfur State. The first and most widespread is rainfed cultivation by smallholder farmers, mostly of bulrush millet and secondary cash crops, including groundnuts and sesame on goz (sandy) soils. This type of farming system starts with the removal of the sparse trees and grassland covering the land to be cultivated, then seeds are planted traditionally by hand, using a hoe, or digging stick, shortly after the first rains. Farmers weed the fields assiduously until the harvesting season between September to December to maintain the soil moisture and allow the crops to flourish. Owing to increases in the population, sandy soils are repeatedly farmed without fallow periods, and cultivation has expanded into less fertile and ecologically vulnerable areas. This is ultimately destroying the vulnerable ecological system and vegetation cover in the region. Furthermore, due to the high spatial and temporal rainfall variability, farmers prepare their fields and plant in advance in different areas near their homesteads and hope for rain [9,16]. The vegetation removal from goz soils has intensified soil erosion and further deteriorated soil fertility, resulting in low land productivity and crop yields. Therefore, farmers have been forced to cultivate larger areas and extend into the rangeland and ecologically vulnerable areas. This has resulted in environmental degradation and has fomented local tensions between pastoralist groups and the farming communities [6,17,18].
The second farming system is practised in the clay soils located along alluvial and seasonal valleys (known as wadis) originating in the Jebel Marra volcanic massif and the surrounding Basement Complex hills. This farming system combines rainfed, flood retreat and small-scale irrigation, using either hand or diesel-powered pumps. The wadi soils are relatively rich in alluvial loam and are more productive than farming on the goz; they are therefore used for growing tobacco and vegetables [19,20]. Understanding the spatio-temporal dynamic of rainfed agriculture and its determining climatic factors in the study area can play a key role in promoting food security and socio-political stability, as well as in protecting and restoring ecosystem services [21,22,23]. The lack of availability of spatial data for monitoring trends in rainfed agriculture is not only a threat to food security but also an impediment to understanding the study area’s environment, climatic hazards, and socio-economic dynamics. Owing to political instability in some parts of the study area, traditional approaches to agricultural monitoring, such as expert scouting estimates, crop cut information, field assessment, and surveys, pose extreme danger to field teams, in addition to significant financial costs [24,25]. Nowadays, most of these events can be predicted, and data and tools can provide early warning and impact assessment; this underscores the importance of timely and accurate production forecasts and near-real-time agricultural monitoring [24,25]. Satellite remote sensing offers useful analysis tools in several technical–scientific fields and has been used widely worldwide, for monitoring the changes that occur to the environment and the identification of their magnitude at different spatio-temporal resolutions [26,27,28]. In addition, satellite remote sensing is crucial in monitoring rainfed agriculture since its data have continuous spatial coverage, are freely accessible, and can be acquired at high temporal resolutions. This is particularly relevant in areas where ground data are insufficient, lacking, or unsafe to obtain [29,30,31,32]. Therefore, various types of remotely sensed data have been used to map and monitor rainfed agriculture, such as Moderate-resolution Imaging Spectroradiometer (MODIS), used to map rainfed wheat [33], SPOT-VEGETATION, with high spatial resolution, Sentinel 1 and 2, and Landsat [25,32,34]. Since 1972, Landsat has been freely available [29]. The launch of medium-resolution Landsat sensors has offered unprecedented opportunities to study the change in agricultural lands at higher spatial resolutions.
This study aimed to map and monitor the spatio-temporal patterns of rainfed agriculture and other common land use and land cover types (LULC) in North Darfur State from 1984 to 2019 using RF supervised classifier and multi-temporal Landsat data. The specific objectives were: (a) to quantify the transformation of rainfed agricultural land for significant land cover classes using change detection, and (b) to identify and detect spatio-temporal trends in changes in LULC, particularly for rainfed agriculture lands in North Darfur State. The outcomes of this study are essential for decision-makers to adopt suitable strategies for sustainable agricultural land use management and planning.
2. Materials and Methods
2.1. Study Area
The North Darfur State is located in north-western Sudan, covering an area of about 30 million hectares, occupies more than half of the Darfur region. The state consists of twelve districts, that is, El Malha, Mellit, and Kutum in the north, Kuma and Umm Kaddada in the east, Dar El Salam, El Tawiesha, and Al Liat in the south. Kabkabiya, Saraf Omra, and EL Siseaf are in the west, while Al Fashir, the state’s capital city, is placed centrally (Figure 1) [18].
North Darfur extends between 12° N and 16° N, and 22° E and 27° E and supports typical Sahelian vegetation. The highest point is Marrah mountain (3042 m above sea level) [9]. The area is characterised by hot, arid and semi-arid climatic conditions. The rainfall pattern is mono-modal, falling in the summer (i.e., from May to October) with an average annual rainfall ranging from 152 mm per annum in the north to 530 mm per annum in the south. About 85% of the rainfall occurs in July and August. The average maximum and minimum temperatures are 42 °C and 11 °C, respectively [18]. Rainfed agriculture is the main economic activity for 85% of the population in the area. Millet and groundnuts are grown mainly in goz lands, while tomato, onion, and okra are grown in wadi lands. These crops are significant sources of food security, and their productivity depends on land fertility and rainfall occurrence [35].
According to the recent National Census of Sudan conducted in 2008, the population of North Darfur is approximately 1.7 million compared with 1.1 million in the 1984 census. The population density was estimated to be 9.1 persons per km2 [36].
2.2. Remote Sensing Data Acquisition and Pre-Processing
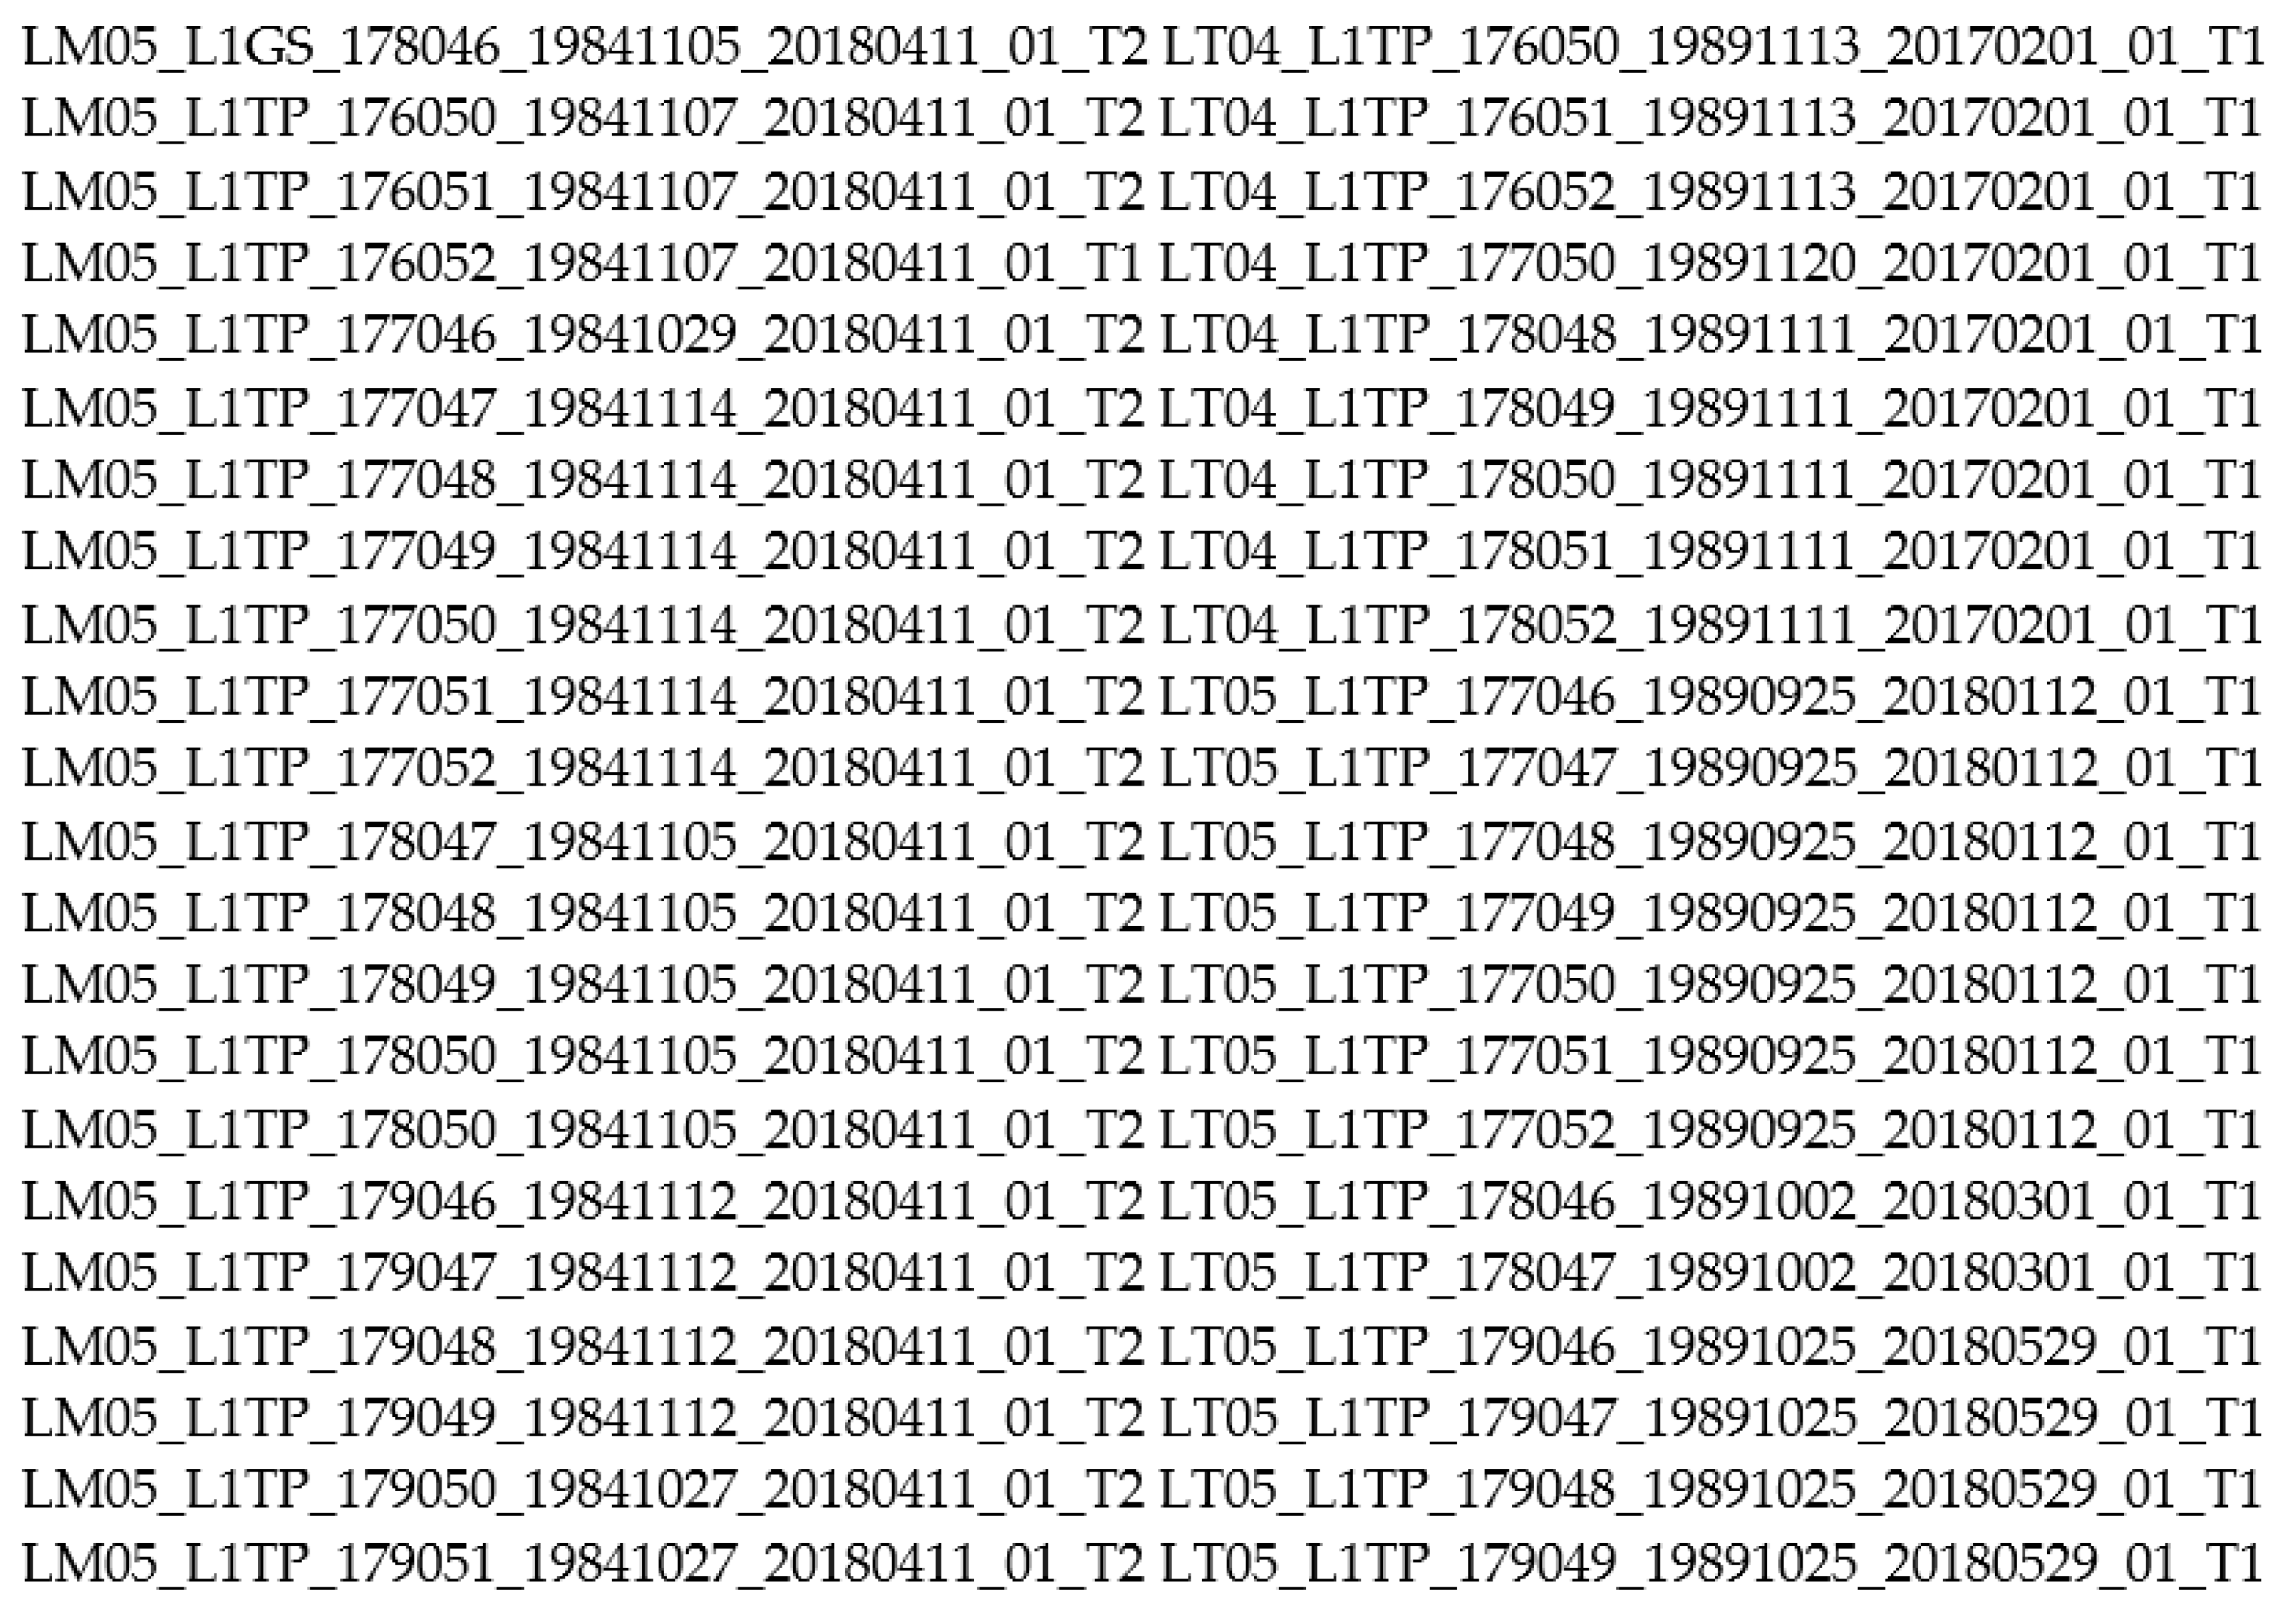
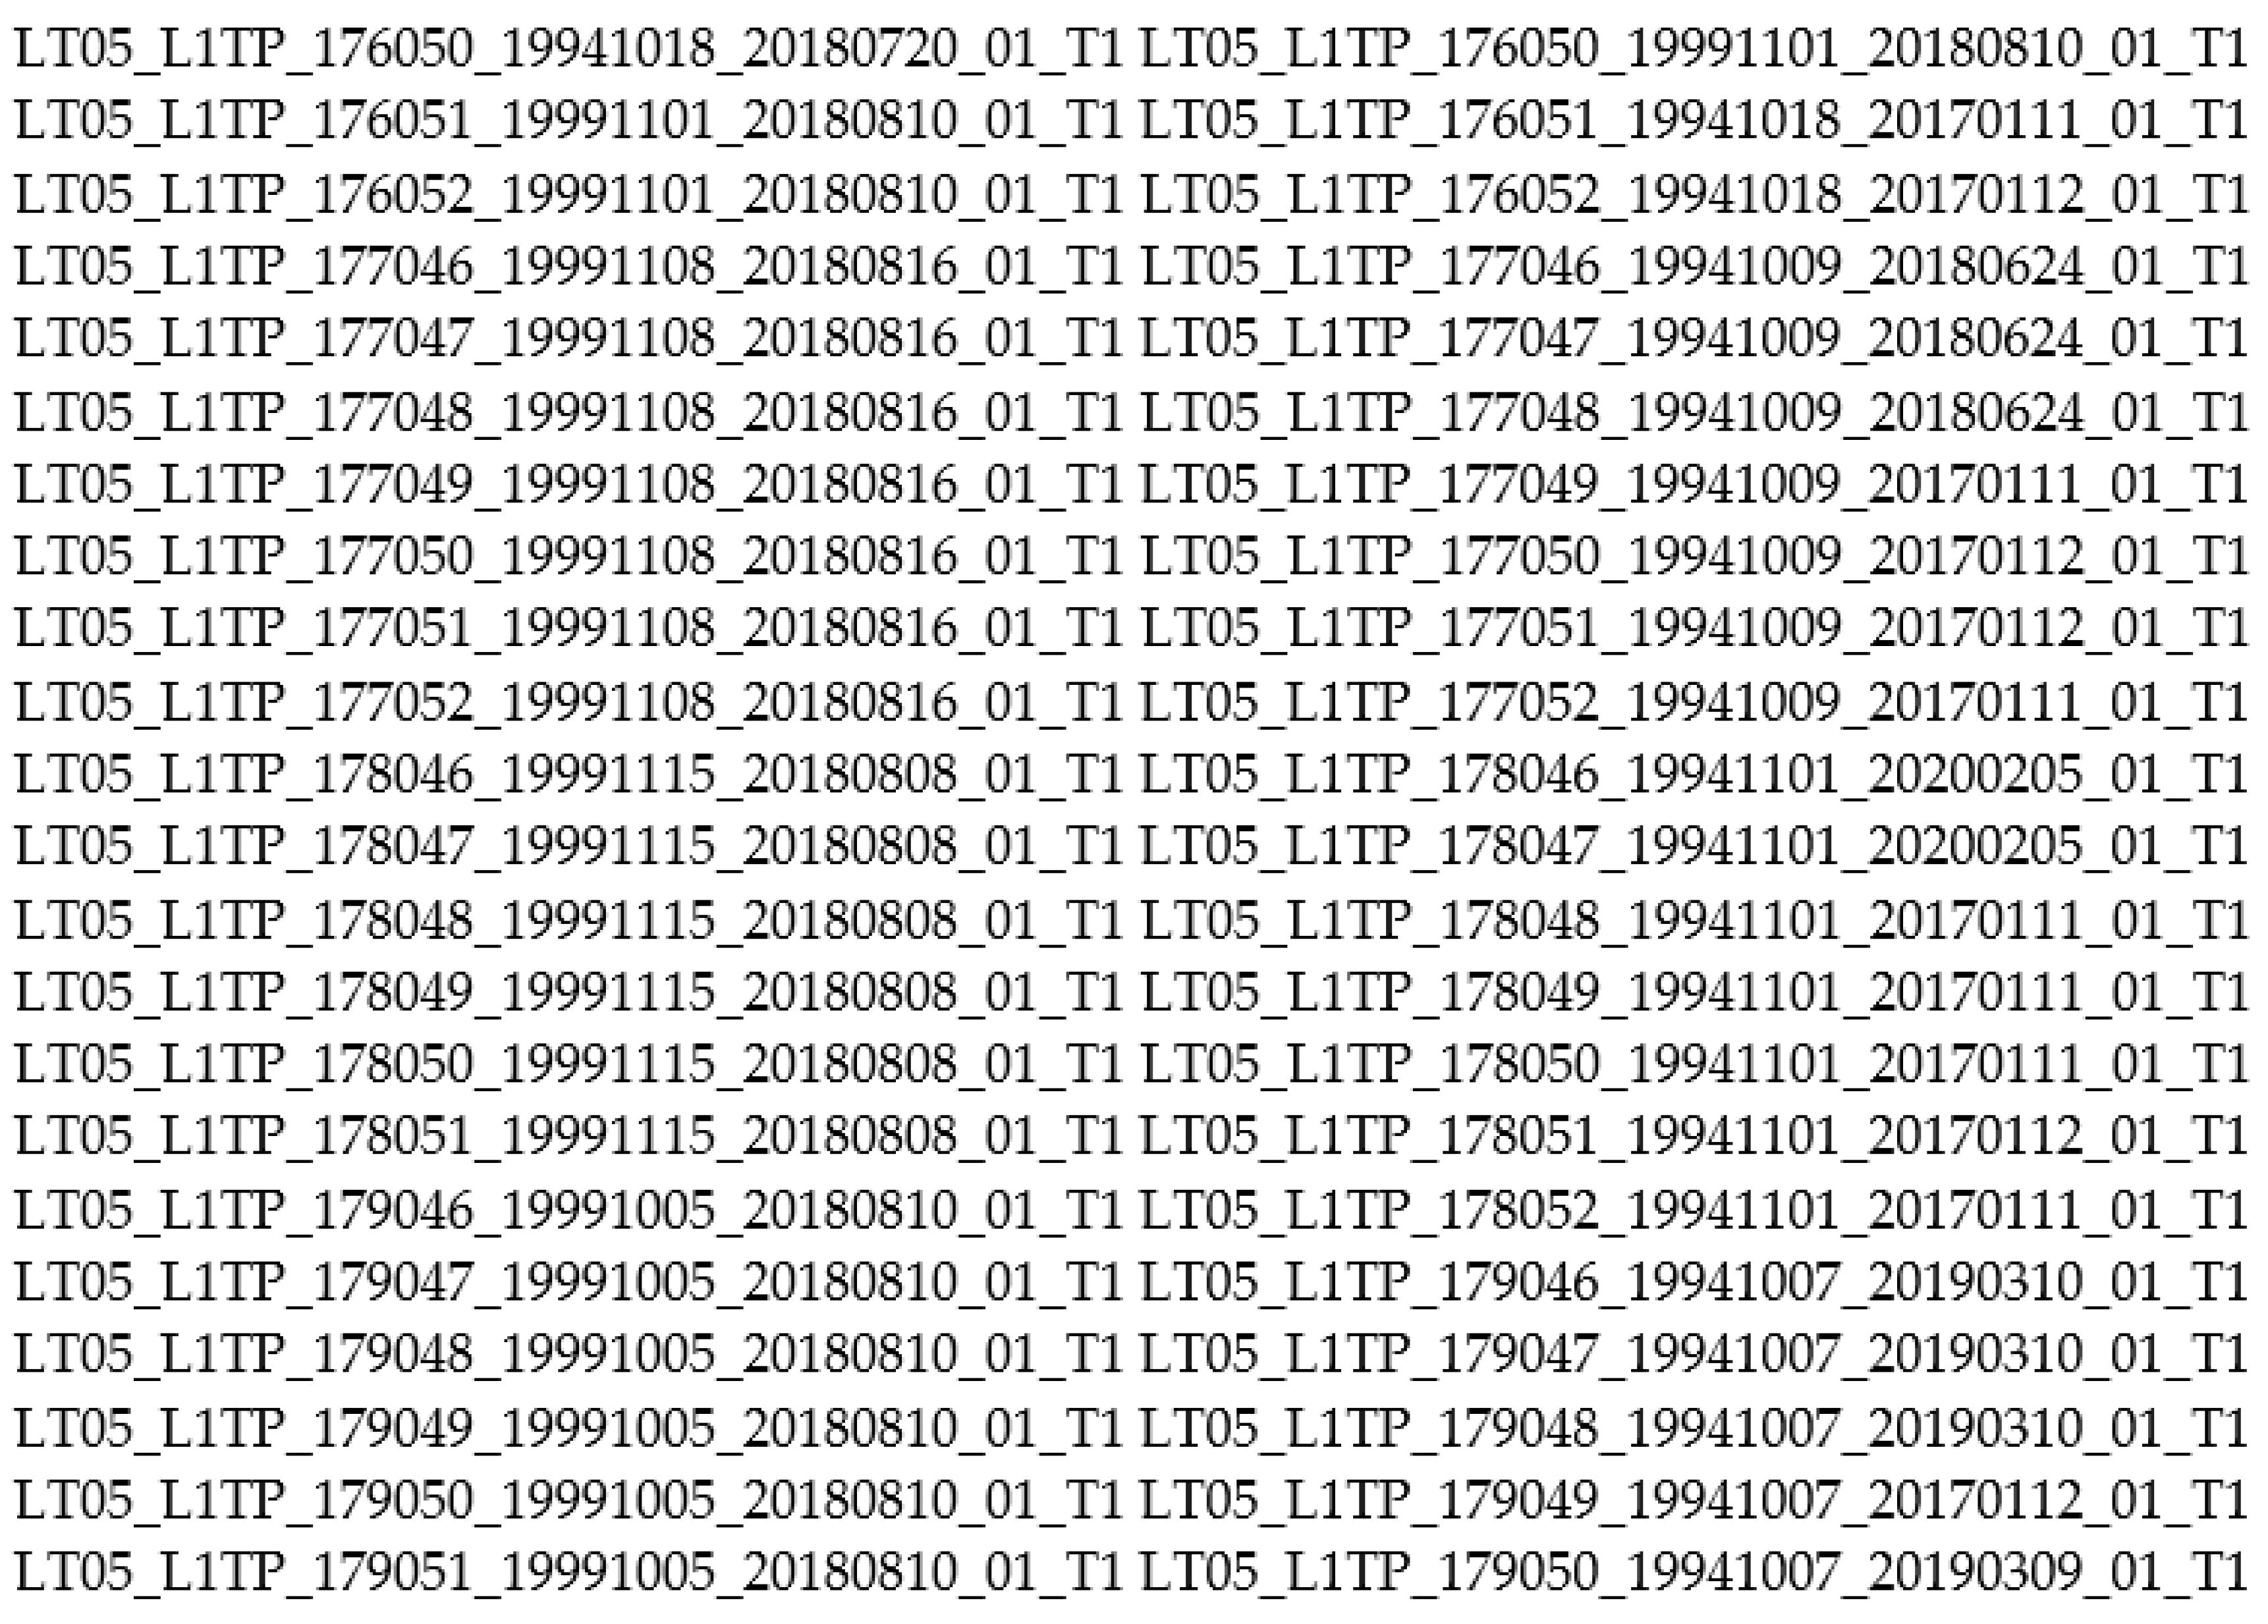
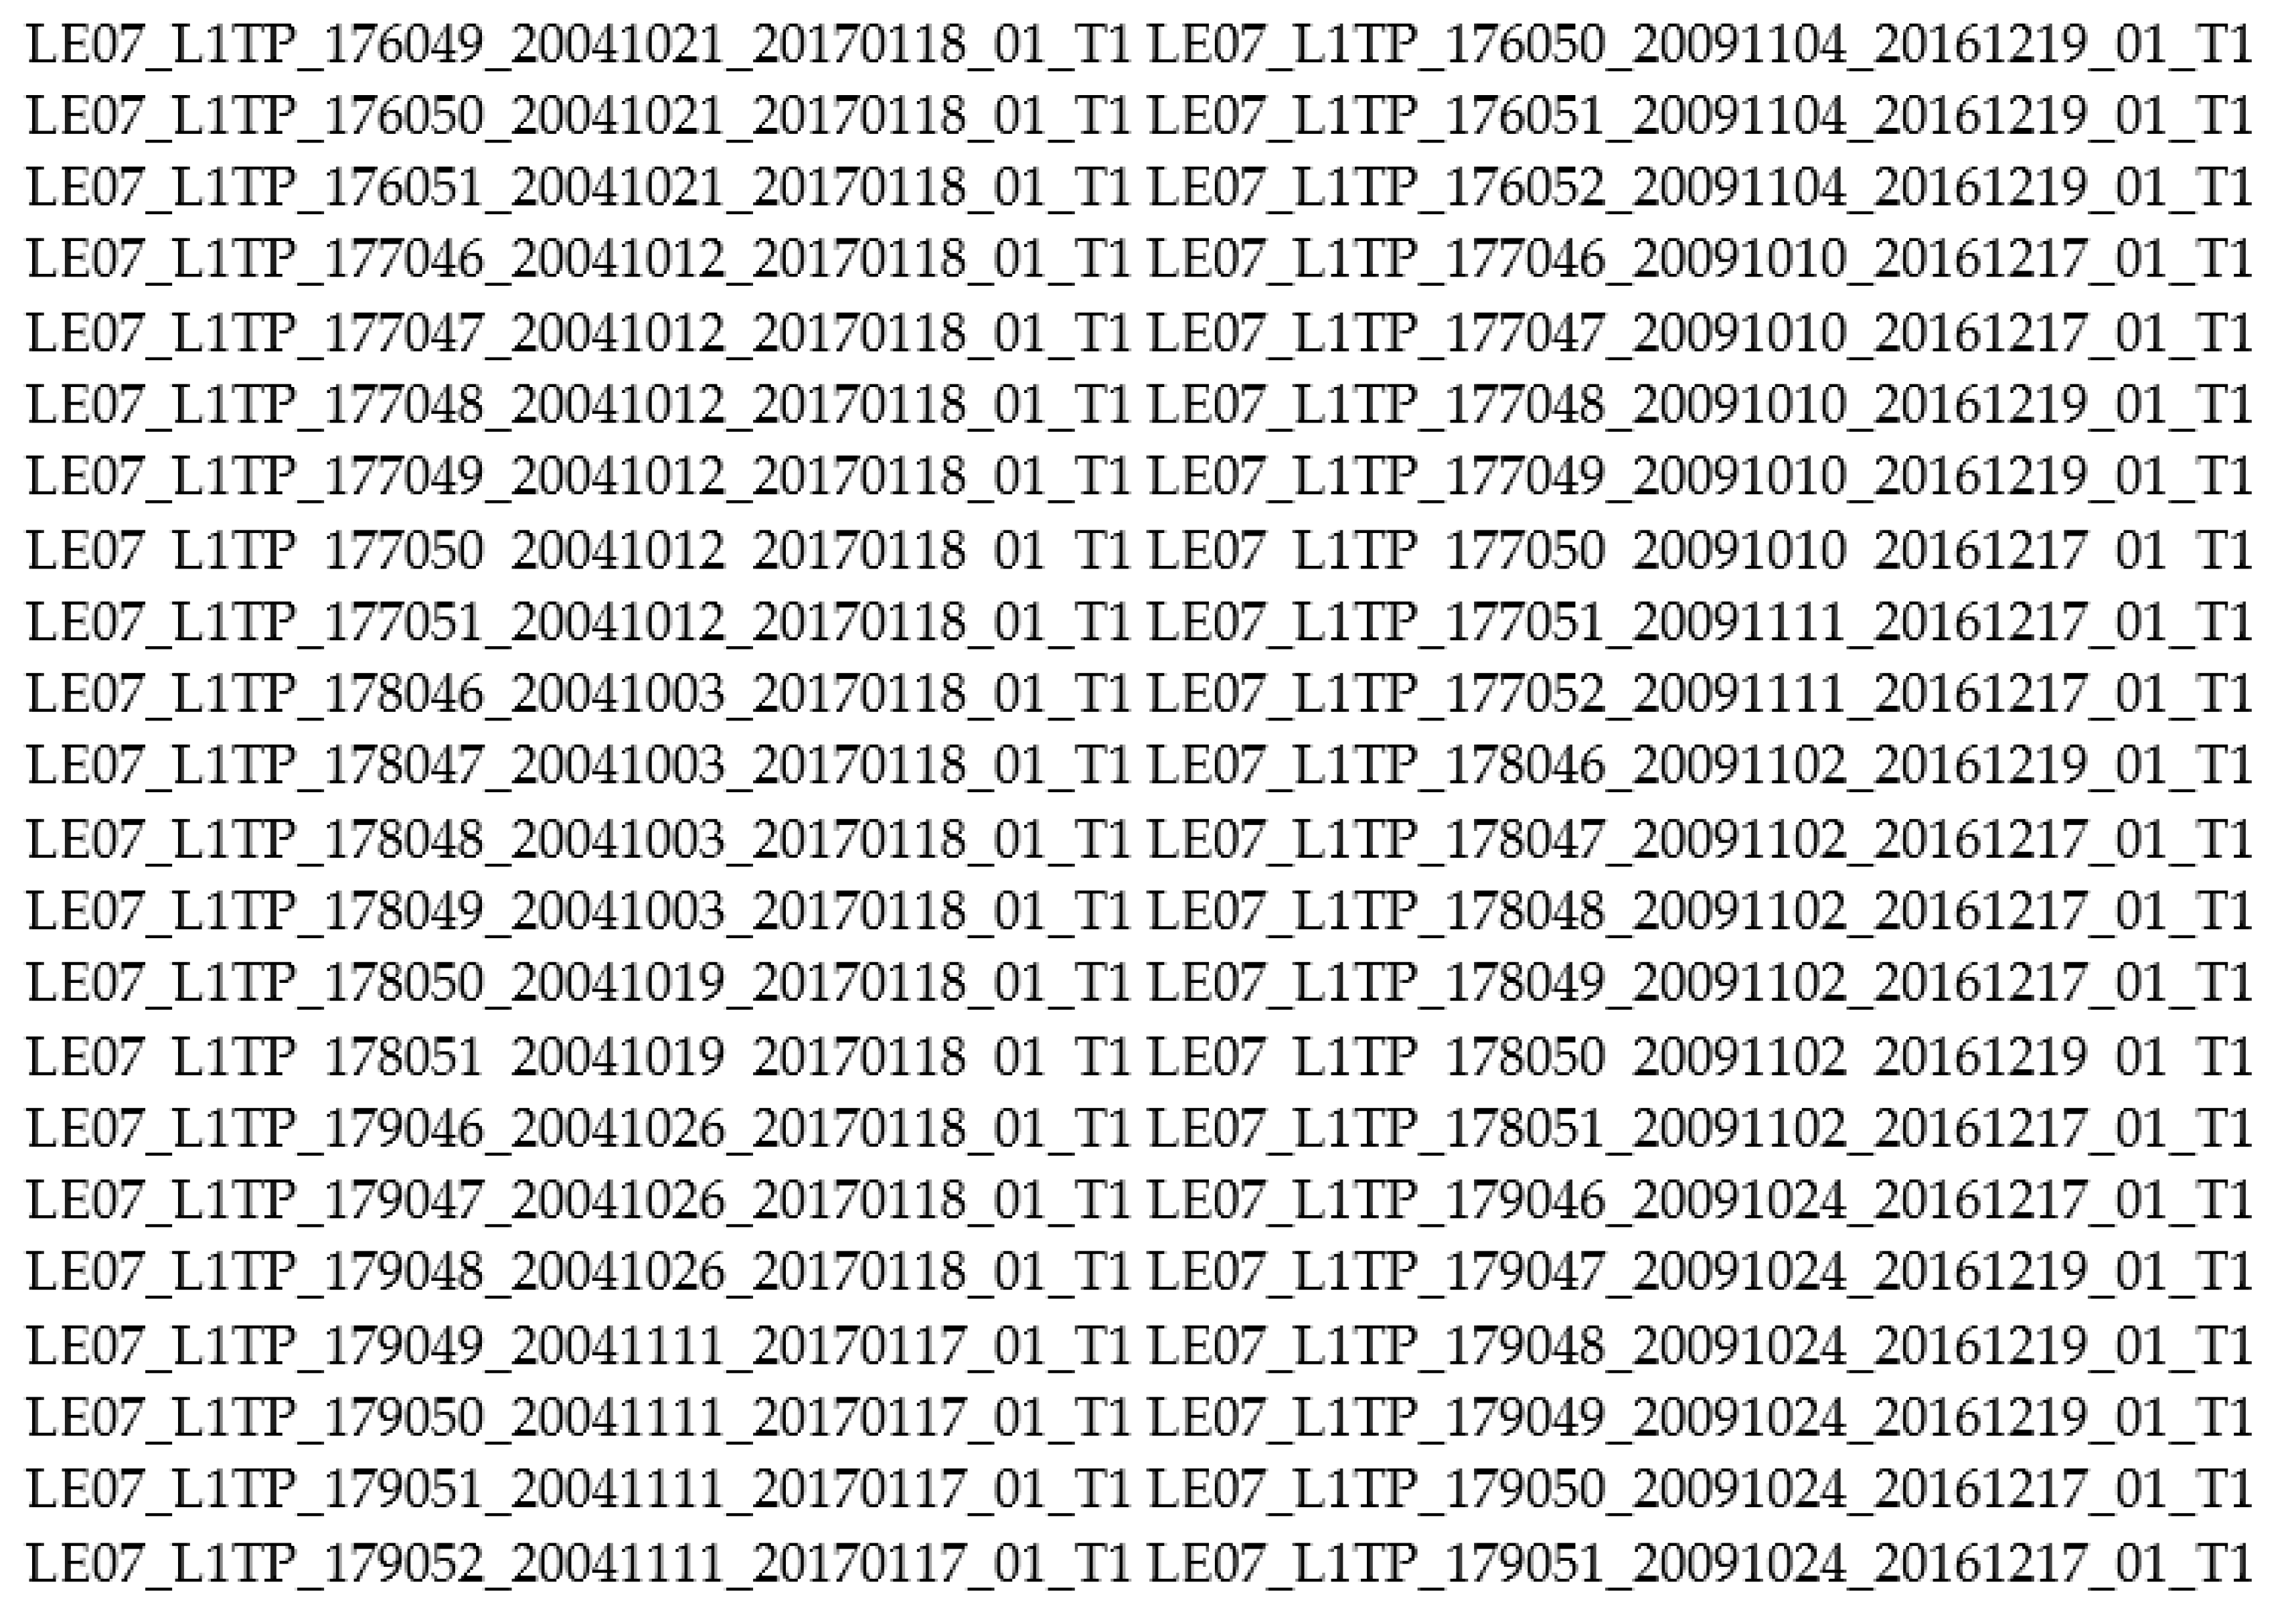
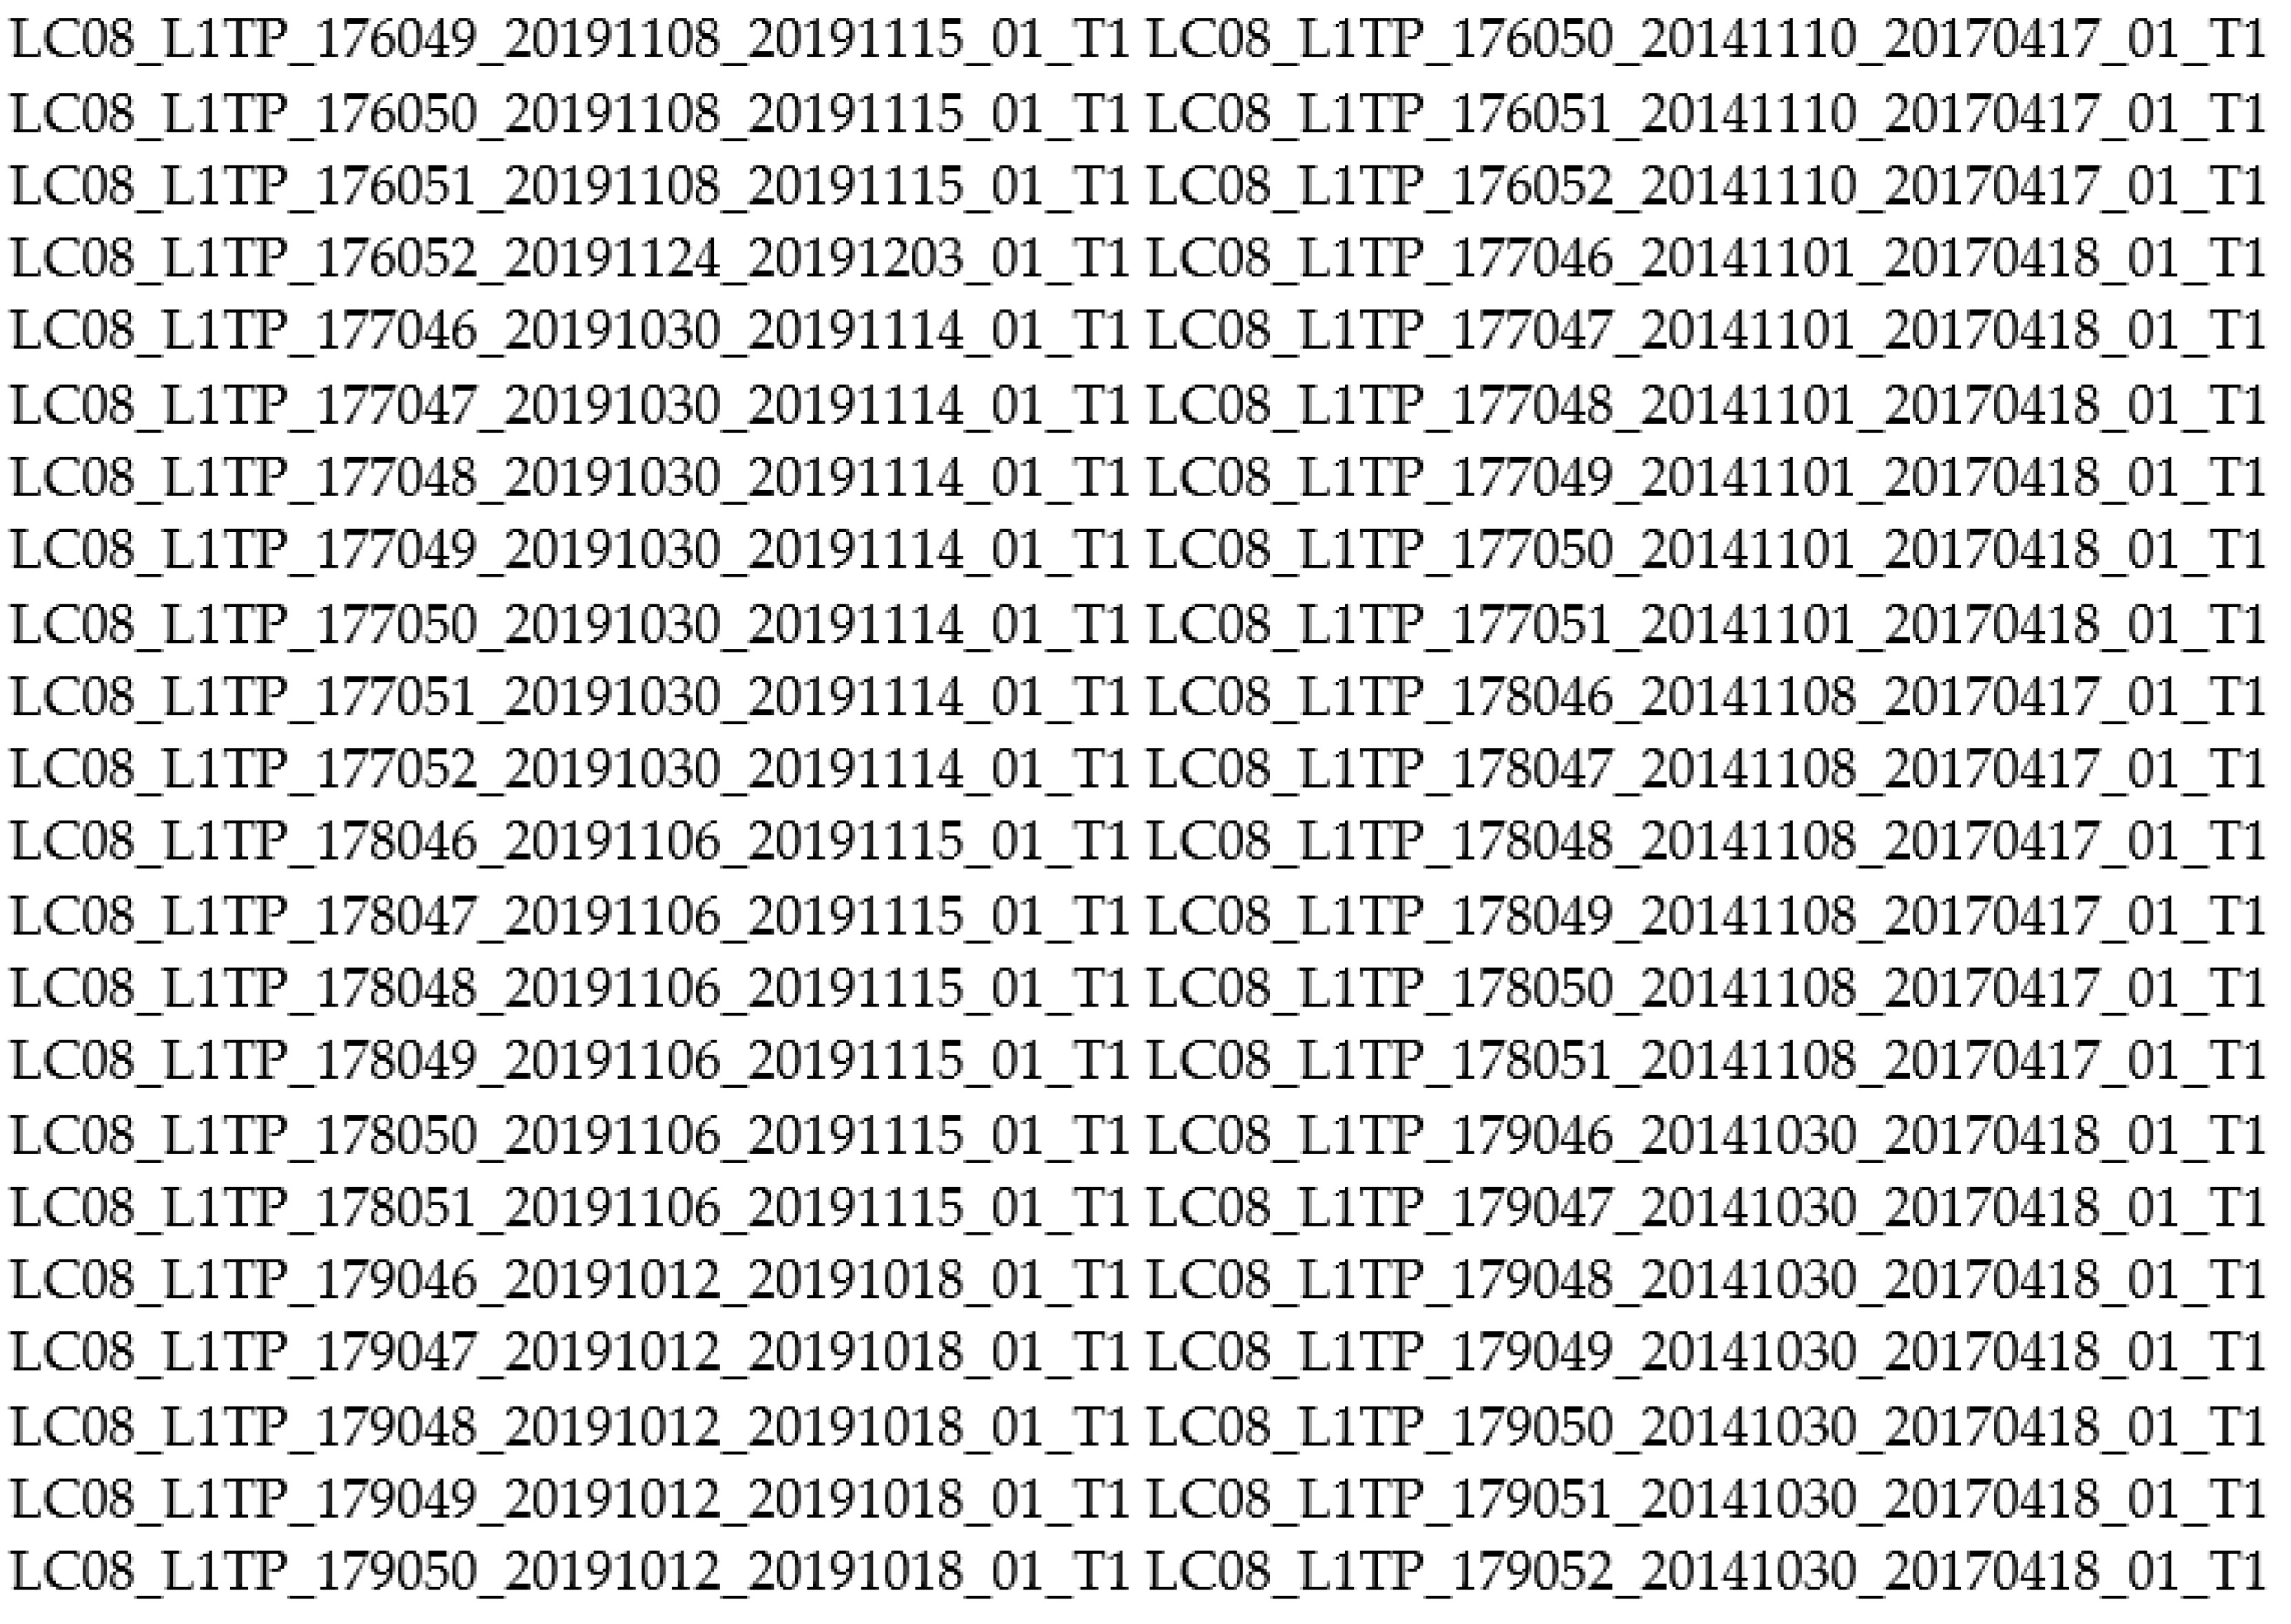
The image acquisition date was selected based on the availability of satellite imagery and the rainfed agriculture growing season. In all, 176 scenes were used corresponding to four main sensors, that is, Landsat Multispectral Scanner (MSS) at 60 m resolution acquired in 1984; Landsat Thematic Mapper (TM) at 30 m resolution acquired in 1989, 1994, and 1999; Landsat Enhanced Thematic Mapper Plus (ETM+) at 30 m resolution acquired in 2004 and 2009; and Landsat Operational Landsat Imageries (OLI) at 30 m resolution acquired in 2014 and 2019. All images for October and November, under cloud-free conditions, were obtained from the United States Geology Survey Earth Explorer Website (https://earthexporer.usgs.gov/) accessed on 9 February 2020 (Scenes ID data see in Appendix A, Appendix B, Appendix C and Appendix D).
In this study, all images were radiometrically and geometrically corrected using the FLAASH module in ENVI® software, Version 5.1. FLAASH tool 5.1 was developed by ENVI 5.1 Tool. FLAASH atmospheric correction is used to solve atmospheric disturbance problems. To standardise the spatial resolution of the Landsat data, Landsat Multispectral Scanner (MSS) images for 1984 were resampled to 30 m spatial resolution using the nearest neighbour method [37]. In addition, the 22 scenes of each year were mosaicked into a new raster image, and then the area of interest was a subset based on rainfed agriculture that took place in the study area. Finally, all Landsat imageries used in this study were projected into the Universal Transverse Projection system zone 35N and datum of World Geodetic System 84 (WGS84) using ArcMap10.5 software and ERDAS Imagine 2020 software.
2.3. Reference Data
The reference data were derived from satellite images and Google Earth; the latter is very helpful in providing ground truth data when fieldwork cannot be performed, and the features on satellite images are unclear [38]. The six most common land use and land cover classes (LULC) were identified in the study area. These are bare soil, pastureland, and rainfed agriculture on goz land, sand dunes, woody vegetation and rainfed agriculture on wadi land, the typical image of each land use classes as shown in (Table 1). The reference data were digitised for each LULC class on the multi-temporal images. The number of training points varies based on class size and visibility. We used Google Earth to verify the classes visually. The reference data were then divided into 30% for the testing data set and 70% for the training data set.
2.4. Classification of Images
This study used a random forest (RF) machine learning algorithm developed on ERDAS Imagine 2020 software to classify the six LULC classes on the multitemporal Landsat images. RF employs a bagging (bootstrap aggregation) operation where several trees (ntree) are constructed based on a random subset of samples derived from the training data. Each tree is independently grown to maximum size based on a bootstrap sample from the training dataset without pruning. Each node is split using the best among a subset of input variables (mtry) [39]. The multiple classification trees then vote by plurality on the correct classification. In addition, at each node, variables are randomly selected from all predictor variables, and one of them are chosen as the splitting criteria. When the bootstrap sample set is drawn by sampling with a replacement for each tree in the forest building process, about one third of the original instances are left out [40]. This set of instances is called OOB (out-of-bag) data [39]. Each tree has its own OOB data set, which is used for error estimation of individual trees in the forest, and by averaging the OOB error rates from all trees, the random forest algorithm gives an error rate called the OOB classification error for each input variable. RF was selected for this study owing to its reliability. It requires limited parameters to be optimised and obtains classification results rapidly [41]. A critical feature of the RF approach is the ability to rank predictors according to an internal measure of variable importance [42].
The two parameters (Ntree and Mtry) were optimised to improve the accuracy of the LULC classification using a grid search and a 10-fold cross-validation method. The default number of trees (ntree) is 500, while the default number of variables (mtry) is the square root of the total number of spectral bands used in the study √P [34]. The grid search values for the ntree were set to vary between 500 to 10,000, with an interval of 1000, while the grid search value for the mtry parameter was two. For more information on random forest classifier, see the Ref. [39].
2.5. Change Detection
In remote sensing, change detection is the process of identifying changes/differences in geographical surface phenomena by comparing scenes of the same location acquired at different times [43]. A variety of change detection algorithms have been developed in the last few years, such as matrix comparison, principal component analysis, post-classification comparison, and image differencing [44].
In this study, the image differencing change detection method was used to map LULC change in hectares in North Darfur State for the years 1984–1989, 1994–1999, 2004–2009 and 2014–2019. Transition statistics were generated by the image differencing method. For more information on transition statistics, see the Refs. [44,45].
2.6. Accuracy Assessment
An error matrix is the most common technique used to represent the classification accuracy of data. In this study, 70% of the dataset was used to train the classification model, and 30% of the dataset was used to develop the confusion matrix for the accuracy assessment. The confusion matrix was then used to calculate the overall user’s and producer’s accuracies and the kappa coefficient. The kappa coefficient was computed with Equation (1), given as:
where N is the total number of observed pixels, r is the number of rows; Xi is the number of observations in row I and column i, Xi+ and X + i, are the marginal totals of row and column [37,46].
3. Results
3.1. Spatial Distribution of Rainfed Agriculture and Other Land Cover Classes
The rainfed agriculture and common land cover classification maps were obtained using multi-temporal analysis of Landsat imageries using RF classification.
Figure 2 and Table 2 show the spatial distribution of rainfed agriculture and other LULC classes for 1984, 1989, 1994 and 1999. The 1984 classified map shows that the most dominant class, sand dunes, covered 48.8% (15,491,287.71 ha) of the study area, followed by pastureland at 19.19% (6,087,037.68 ha), and rainfed agriculture on goz land 12.6% (3,997,107.09 ha), whereas woody vegetation took up 10.2% (3,255,871.68 ha). Rainfed agriculture on wadi land covered only 6.5% (2,063,802.42 ha), while 2.6% (829,963.35 ha) of the area was covered by bare soil. The 1989 LULC map shows that about 47.2% (15,001,726.86 ha) of the area for that year was covered by sand dunes, followed by pastureland at 16.75% (5,316,714.45 ha), with rainfed agriculture on goz land at 12.99% (4,120,391.79 ha) and mostly in the vicinity of villages. The analysis also indicated that 9.95% (3,155,611.14 ha) of the study area was covered by woody vegetation. An area of 3,038,405.4 ha (9.58%) of North Darfur State was occupied by rainfed agriculture on wadi land, and bare soil covered 3.44% (1,092,219.57 ha) of the area.
The 1994 LULC map of North Darfur State shows that 55.43% (17,586,085.59 ha) of the area was under sand dunes, 13.33% (4,230,389.88 ha) was under pastureland and 12.35% (3,919,095.54 ha) of the area was covered by rainfed agriculture on goz land. However, the area of woody vegetation accounted for 8.86% (2,809,914.39 ha). Rainfed agriculture on wadi land occupied 8.14% (2,582,809.29 ha), and the proportion with bare soil was 1.88% (596,770.74 ha). The results for the 1999 classified map indicate that the dominant class of land cover was sand dunes covering 58.49% (18,438,988.41 ha), followed by rainfed agriculture in goz land estimated at 15.25% (4,808,718.01 ha), and pastureland estimated at 10.04% (3,165,771.51 ha). Rainfed agriculture on wadi land covered 7.61% (2,400,107.49 ha), and woody vegetation covered 6.83% (2,155,598.64), while the bare soil accounted for 1.76% (554,768.19 ha).
Figure 3 and Table 2 show the spatial distribution of rainfed agriculture and other LULC classes between 2004, 2009, 2014 and 2019.
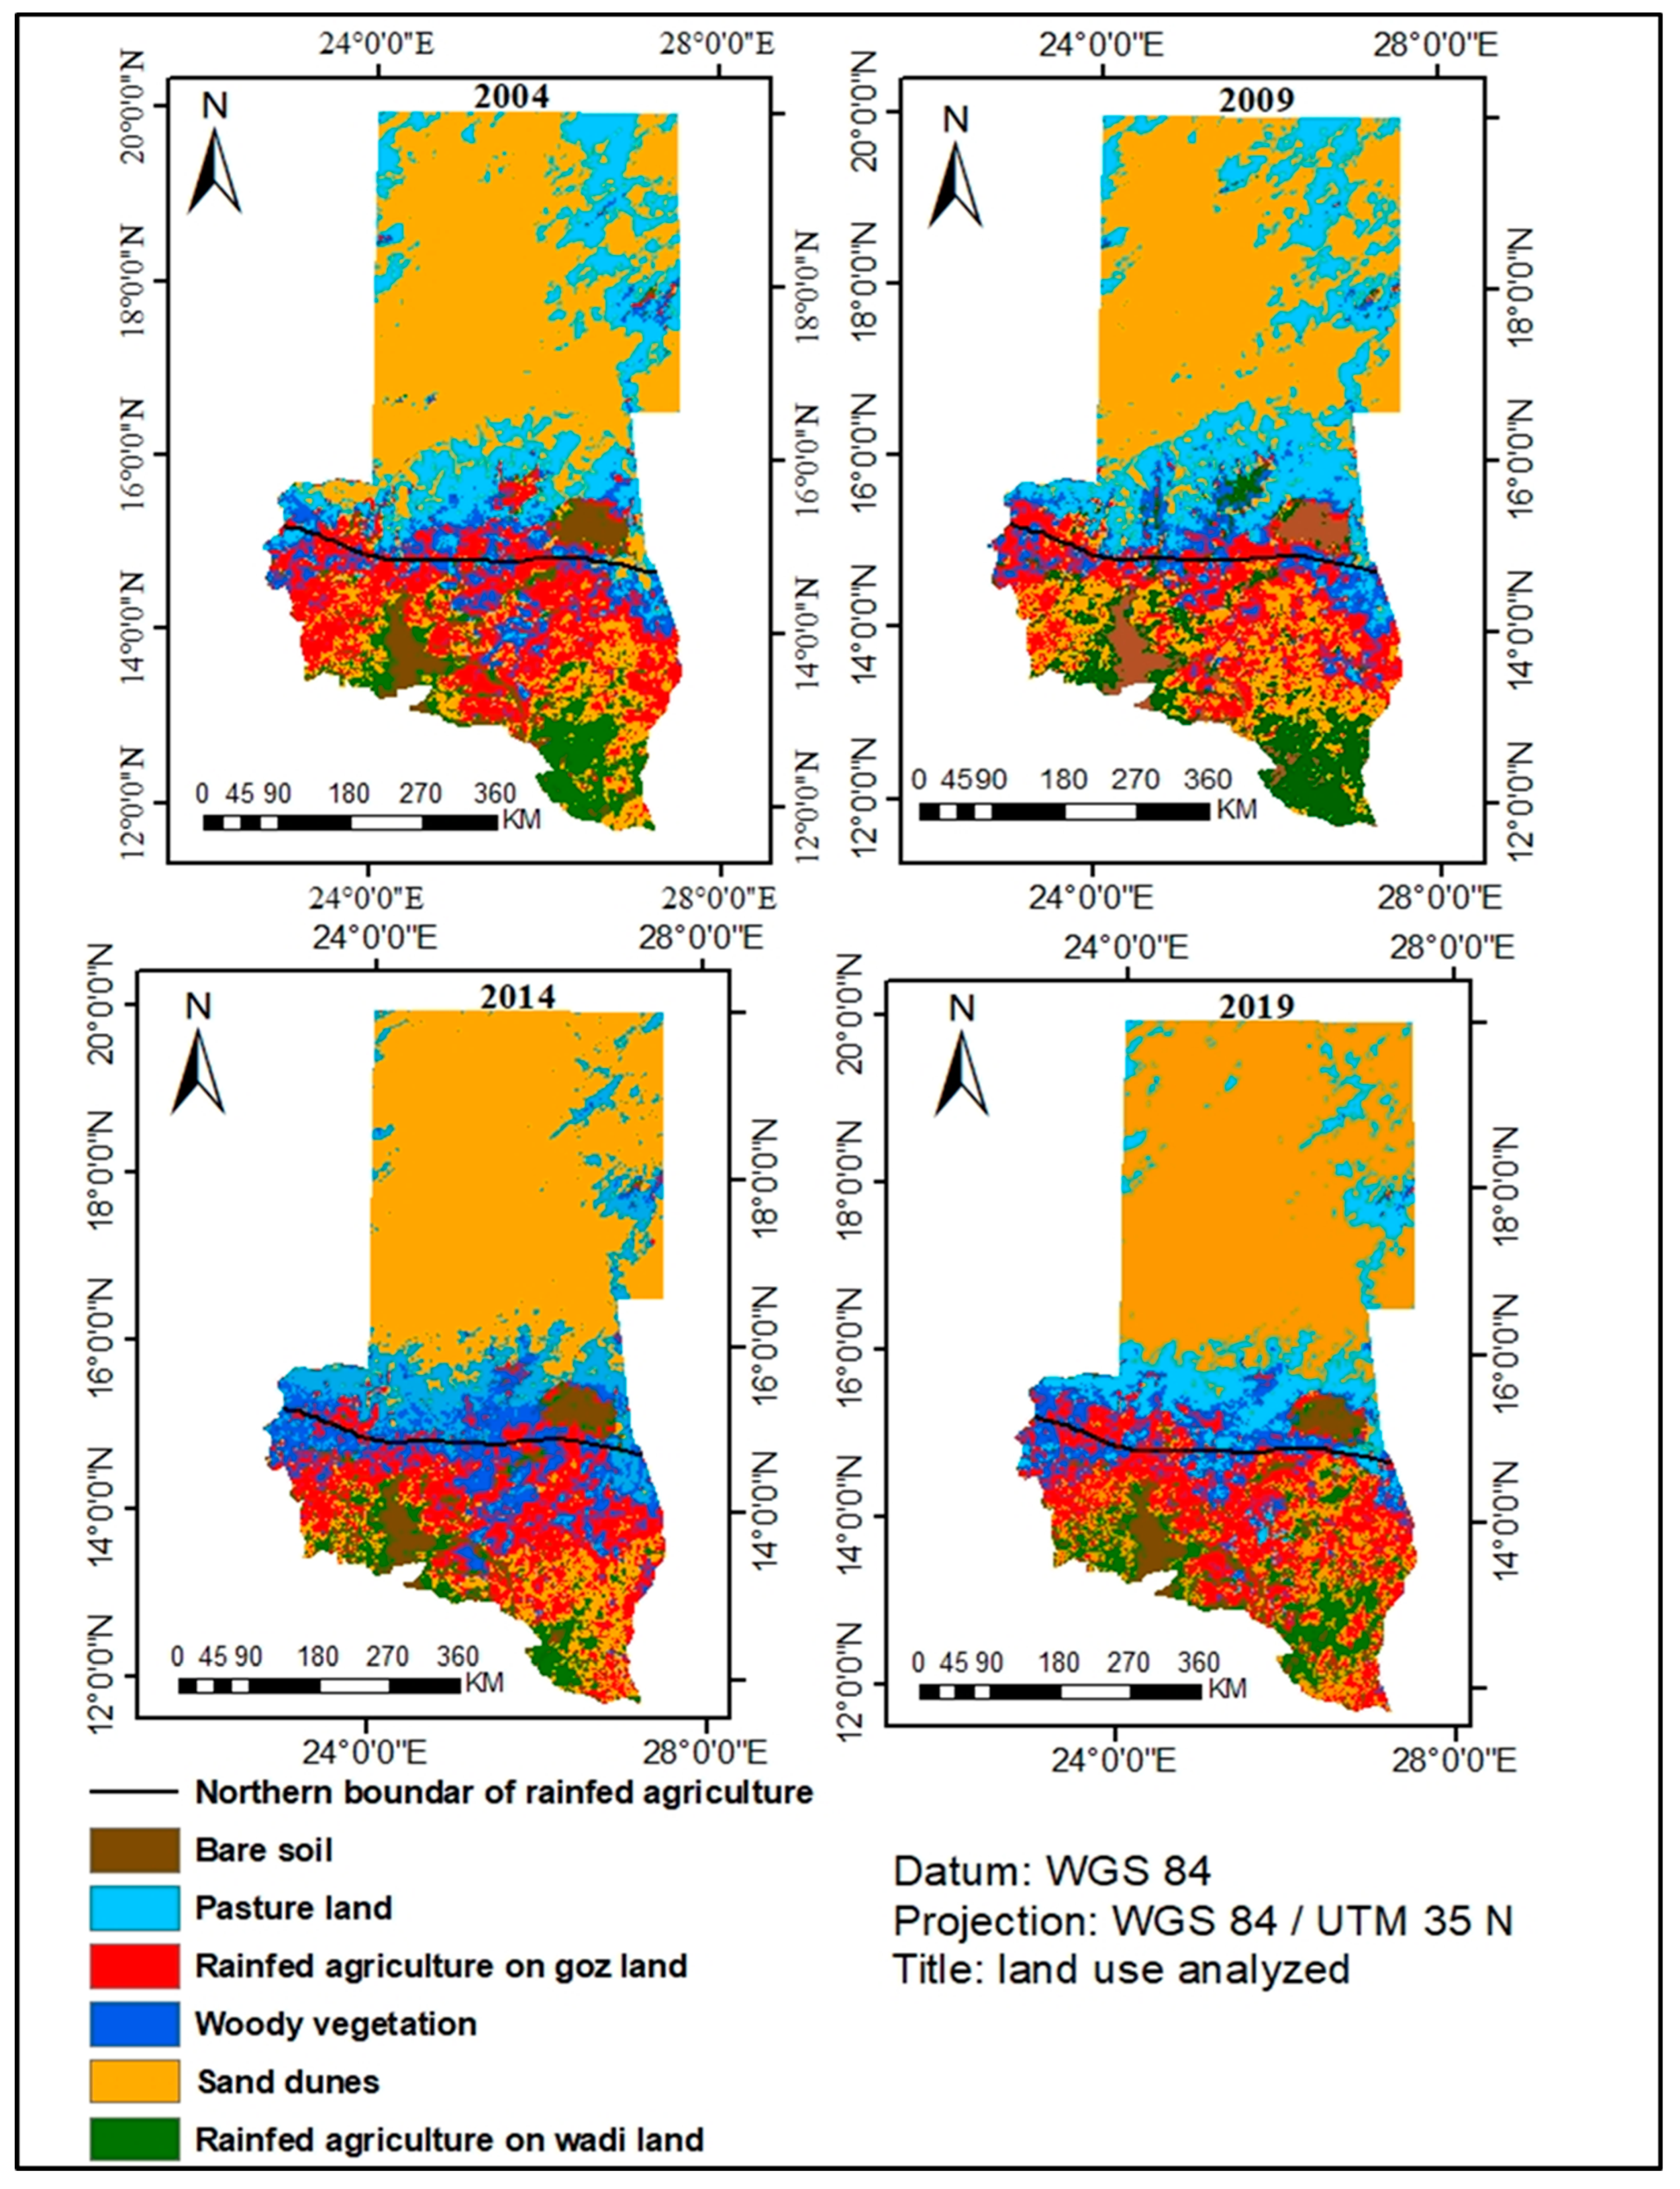
The 2004 classified map shows that the sand dunes covered 49.10% (15,579,090.63 ha) of the study area, followed by pastureland at 17.56% (5,572,342.98 ha). Rainfed agriculture on goz land covered 12.88% (4,085,995.14 ha), woody vegetation was 8.15% (2,586,354.75 ha), and coverage by rainfed agriculture on wadi land was 8.99% (2,852,367.39 ha), with bare soil taking up 3.3% (1,048,919.04 ha) of the area.
The 2009 classified map shows that 47.69% (15,128,433.0 ha) of the area was under sand dunes, 19.15% (6,075,850.59 ha) under pastureland, and 10.8% (3,427,426.53 ha) of the area was under rainfed agriculture in goz land, and woody vegetation occupied 7.87% (2,497,371.93 ha). Further, 10.49% (3,327,608.88 ha) of North Darfur State was under rainfed agriculture on wadi land, and bare soil covered 4% (1,268,379 ha). In 2014, the classified map of North Darfur State shows that sand dunes covered 53.90% (17,098,441.11 ha), followed by pastureland at 13.03% (4,135,044.24 ha), while rainfed agriculture on goz land accounted for 12.46% (3,952,211.58 ha) of the area. Woody vegetation covered 10.96% (3,478,485.15 ha), and rainfed agriculture on wadi land occupied 6.56% (2,082,289.68 ha). The bare soil took up at least 3.09% (978,837.93 ha) of the study area.
The 2019 classified map shows that around 54.09% (17,161,364.97 ha) of North Darfur State was covered by sand dunes, followed by pastureland, which was estimated at 13.13% (4,164,688.62 ha). In contrast, rainfed agriculture on goz land covered 12.34% (3,917,382.48 ha), and woody vegetation took up 8.58% (2,722,680.9 ha) of the area. Map shows the rainfed agriculture on wadi land covered 8.39% (2,662,804.71 ha), and bare soil comprised 3.46% (1,096,148.25 ha) of the area.
3.2. Accuracy Assessment
The classification accuracies were calculated using a confusion matrix and the test dataset (30%). The results are shown in Figure 4. The overall classification accuracies ranged from 94% to 97%, and the kappa statistics ranged from 0.96 to 0.93. Notably, the 1994 image classification had the highest overall accuracy of 96.9 and a Kappa statistics value of 0.96%. The classification accuracy for the 2009 image was relatively lower, with an overall accuracy of 94.7 and a Kappa statistics value of 0.94% compared to other classified images.
Table 3 Shows the producer’s accuracies (PA) and user’s accuracies (UA) for rainfed agriculture on goz land, rainfed agriculture on wadi land and other LULC in the study area.
The confusion matrix developed from the test dataset (30%) was also used to calculate the user accuracies (UA) and producer accuracies (PA) to provide insight into the possibility of mapping rainfed agriculture and other LULC classes in the study area. Rainfed agriculture’s user range from 89.7% to 98.2%, and producer accuracies range from 87.9% to 98.3%. All land cover classes produced over 89% user’s accuracies (UA). It is worth noting that the highest UA achieved was for rainfed agriculture on wadi land (RW) at 98.2% in 1994 and sand dunes (SD) at 97.8% in 2004 as compared to the other land cover classes. This is compared to the lowest UA achieved for bare soil (BS) at 89.7% in 2019. Similarly, all land use-land cover classes achieved over 85% producer’s accuracies (PA). The highest PA was recorded for sand dunes (SD) at 98.1% in 2004 and for rainfed agriculture on wadi land (RW) at 98.3% in 1994. The lowest PA achieved for pasture land (PL) at 87.9% in 1984 (Table 3).
3.3. Spatio-Temporal Trends of the Rainfed Agriculture and Other Land Cover Classes
The classification results were compared to determine the magnitude of changes in rainfed agricultural land use and other LULC classes (Figure 5). The Figure indicates that there have been significant changes and transitions among various land use/cover classes over the last four decades (1984 to 2019). The main changes and transitions can be seen among agricultural land types and vegetation cover.
3.3.1. Trends in Rainfed Agriculture and Other Land Cover Classes from 1984 to 1989
In this period, rainfed agriculture on goz land maintained 159,112.00 ha of its initial area, and expanded by 123,284.7 ha into new areas between 1984 and 1989, by gained 418.7 ha from sand dunes, 279.9 ha from woody vegetation, and 61,651.4 ha from rainfed agriculture on wadi land. Rainfed agriculture on wadi land maintained 117,497.7 ha of the initial area and increased by an area of 974,602.98 ha because it gained 283.03 ha from woody vegetation, 2872.98 ha from pastureland, and 1445.50 ha from sand dunes (Figure 5 and Table 4.)
It is also interesting to note that the bare soil maintained 15,046.8 ha of its initial area and expanded to 262,256.22 ha, while gaining 29.81 ha from pastureland. It further gained 122.23 ha from rainfed agriculture on goz land and 486.23 ha from woody vegetation. Meanwhile, pastureland maintained 208,773.2 ha of its initial area but decreased by 770,323.23 ha during these five years, whereas 29.8 ha changed into bare soil, and 2872.9 ha was converted into rainfed agriculture on wadi land. A further 5.13 ha changed from pastureland into woody vegetation (Figure 5 and Table 4.)
3.3.2. Trends in Rainfed Agriculture and Other Land Cover Classes from 1994 to 1999
The rainfed agriculture on goz land retained 88,305.13 ha of its initial area and increased 889,622.46 ha via 158.7 from transformation of bare soil, 3098.0 ha from pastureland, 663.6 ha from sand dunes, and 37,301.7 ha from rainfed agriculture on wadi land. However, the rainfed agriculture on wadi land maintained 72,346.17 ha of the initial cover area but decreased around by 182,701.8 ha (with 1060.0 ha lost to bare soil, 37,301.0 ha into rainfed agriculture on goz land and 694.1 ha to sand dunes (Figure 5 and Table 5).
During this period, bare soil maintained 18,385.5 ha and decreased by 42,002.55 ha, with 21.2 ha changed to pastureland and 158.7 ha transformed into rainfed agriculture on goz land. There was further a loss of 5591.4 ha to sand dunes. Pastureland maintained 52,827.9 ha of the initial classification and decreased by an area of 1,064,618.37 ha (with 2133.99 ha changed into sand dunes, 118.48 ha transformed into bare soil, and 3098 ha on goz land becoming rainfed agricultural land, and a further 910.37 ha transformed into woody vegetation (Figure 5 and Table 5).
3.3.3. Trends in Rainfed Agriculture and Other Land Cover Classes from 2004 to 2009
This period shows a significant decline of the rainfed agriculture on goz land (658,568.61 ha) and maintaining just 131,389.00 ha of its initial state. This decline was the result of 868.71 ha lost to woody vegetation, 21,091.70 ha transformed into rainfed agriculture on wadi land, and 63,336.03 ha becoming pastureland, while rainfed agriculture on wadi land maintained 72,582.91 ha while also showing an increment of 475,241.49 ha. This increment was by 1489.39 ha gained from pastureland, 21,091.70 ha gained from rainfed agriculture on goz land and 14,348.10 ha gained from woody vegetation (Figure 5 and Table 6).
Bare soil maintained 17,032.80 ha but also increased by 219,459.96 ha gained by 10.40 h from pastureland, 320.57 ha from rainfed agriculture on wadi land and 6807.70 ha from woody vegetation. In contrast, pastureland maintained 31,568.5 ha of its initial state while increasing by 503,507.61 ha (resulting from gains of 63,336.03 ha from rainfed agriculture on goz land and 140.052 ha from woody vegetation (Figure 5 and Table 6).
3.3.4. Trends of Rainfed Agriculture and Other Land Cover Classes from 2014 to 2019
The rainfed agriculture on goz land maintained 91,644.91 ha of the initial area, and decreased by 34,829.1 ha. This reduction resulted from a loss of 485.17 ha to bare soil, 1625.43 ha to woody vegetation, 1222.68 ha to sand dunes and 16,800.80 ha transformed into rainfed agriculture on wadi land. The rainfed agriculture on wadi land maintained 79,704.27 ha and showed an increment of 580,515.03 ha (resulting from 2247.70 ha gained from bare soil, 1779.92 ha from pastureland and 716.4 ha from sand dunes) (Figure 5 and Table 7).
The bare soil maintained 22,383.1 ha of its initial area and expanded by 117,310.32 ha (84.61 ha from pastureland, 485.17 ha from rainfed agriculture on goz land, and 9172.8 ha from sand dunes). Similarly, the pastureland maintained 25,370.4 ha of its initial area and extended by 29,644.38 ha (17,985.62 ha from rainfed agriculture on goz land, 160.18 ha from woody vegetation, 7579.45 ha from sand dunes, and 160.18 ha from woody vegetation) (Figure 5 and Table 7).
The general trends of rainfed agriculture from 1984 to 2019 are summarised in Figure 6. Variability in the rainfall results in variability in total areas of rainfed agriculture in both wadi and goz land, although this is especially high in wadi lands.
4. Discussion
This research was attempted to map and monitor the patterns of rainfed agriculture in North Darfur State over the last 35 years using a RF supervised classifier algorithm and multitemporal Landsat images. This is critically important in providing up-to-date spatial data about the agricultural lands and crops estimated for food security management as shown in Figure 2 and Figure 3, clearly show land cover classes, which include both rainfed agriculture lands and common land cover classes. The lack of spatial data infrastructure at all levels of government in the Darfur States has been reported as a major barrier to quick access to data availability and sharing for effective management [25]. The States usually conduct two traditional field-based surveys to estimate the croplands (commonly millet). These two surveys run through informal interviews with the farmers after planting and post-harvesting. Owing to poor accessibility, civil war, and time-consuming interview methods, the field survey approach is ordinarily incomplete and unreliable. Despite, this study shows the potential of earth observation techniques in mapping and monitoring rainfed agriculture in a hot civil war area. Despite the challenge of the rainfed agriculture spectral signature due to the small scale of the farms, low crop density, and open canopies, the study obtained high overall accuracies ranging between 94.7% and 96.9%. The accuracies achieved are comparable to previous studies conducted in the similar landscape, such as those by Ibrahim et al., [47] investigating the LULC changes over four decades in Ghubaysh area, Sudan. Their study achieved overall accuracies ranging from 89.6 to 98.2%. Furthermore, high overall accuracies from 86% to 96% were reported by Biro, et al. [48] in mapping LULC changes in the Northern part of the Gadarif region, Sudan. More specifically, the user’s and the producer’s accuracies obtained in this study for rainfed agriculture compare favourably with another study in a semi-arid environment in the Niger Delta Region [49].
Results of this study revealed that, the rainfed agriculture on goz and wadi lands in North Darfur State underwent significant changes as shown in Figure 2 and Figure 3, and Table 2. These changes have varied over time, space, magnitude, and other land use land cover classes. The changes in agricultural land use can be attributed to population growth and climate change, specifically rainfall spatial and temporal variability. Studies have shown that the Sahel zone, in general, is overpopulated, even though the average population density in the Sahel zone is less than 10 inhabitants per square kilometre [16]. This is owing to two reasons; first, the population is concentrated in regions where the drinking water supply is secured. Second, soil productivity is comparatively low. To compensate for lower yields resulting from high spatial and temporal variability in the rainfall and the loss of soil productivity, the farmers tend to cultivate a larger area falling in different locations to better meet their respective families’ food security needs. This practice helps ensure that some fields get sufficient rainfall, even if others do not receive any rain owing to the variability. Similarly, in polygamous households, different wives would be responsible for cultivating different plots located far from each other as a risk-spreading strategy [50]. This was confirmed by Osman [19], who in their 2014 paper observed there had been an expansion in rainfed agricultural land use in North Darfur State since the 1960s.
The findings of this study reveal that rainfed agriculture on wadi land (RW) has shown ongoing expansion since 1994. In particular, from 2004 to 2009, the extent and location of rainfed agriculture on wadi and goz lands changed significantly. There was increased a 475,241.49 ha in wadi land and declined 658,568.61 ha in goz land, as shown in Figure 5. This is confirms with Osman [14], and who stated that the land tenure system and rainfall variability have greatly affected rainfed agriculture in North Darfur State. This could be attributed to a decline in soil fertility in goz land from over-cultivation, desertification and the expansion of sand dunes [13]. The over-cultivation can also be seen throughout the multitemporal images in the surroundings of settlements, where the soil is also exhausted, and there is a concentration of desertification phenomena. The farmers have long realised the importance of the fertile alluvial soil in the wadi lands for cultivating vegetables and snuff tobacco to compensate for the yield reduction in the goz lands. Thus the noticeable expansion from 1994 in rainfed agriculture on wadi land (as observed in this study) is hardly surprising. Of concern, however, is that only a few farmers have access to the fertile wadi lands; many studies have indicated that the limited access to fertile soil, such as the wadi bed land, contributes significantly to the current conflict in North Darfur [19,51].
Local communities have adopted different strategies to cope with the current deterioration in the productivity and the profitability of rainfed agriculture in the goz lands. For example, farmers have intensified cultivation to compensate for lower yields. This can be seen in the study area in the extremely widespread cultivation that extends beyond the climatically adapted agronomic dry limit where the average rainfall is less than 500 mm [9]. Rainfed cultivation in inappropriate areas has led to cumulatively impoverishing the environment. Prior to cultivation, the farmers aggressively clear the land of vegetation; they furthermore reduce the fallow period. Losing vegetation over ever-larger ecologically vulnerable areas makes the sandy soil more susceptible to wind erosion and dune movement toward the northern part of the region [8]. The spread of the dune fields can be seen in the classified images for the study years, particularly 2014 and 2019 (Figure 3). Many studies have therefore concluded that rainfed cultivation is potentially the main factor contributing to desertification in Darfur [13,50]. With the intensive current rainfed cultivation and the scarcity of unused arable land, it remains unclear how the region will be able to increase its agricultural production and thus keep pace with population growth.
We have seen expansion of rainfed cultivation in the southern part owing to the relatively high rainfall. Therefore, since the early 1970s, there has been some population movement from North Darfur to South Darfur. However, the acute drought periods experienced most intensely in the area, during years including 1983, 1985 and 1994 have greatly accelerated the population movement into Northern Darfur from South Darfur. The massive “agro-migrant” and occupation of lands in Northern Darfur have escalated the overall conflict and the emergence of extreme dilemmas in the socio-political landscape, which are proving difficult to engage in a sustainable peace process.
Although the study provides a basis for constructing reliable spatial information on rainfed agriculture and other land cover patterns, it also has some limitations. Some concerns should be addressed when the proposed method is used in real-world applications. The reference data used to classify and validate the histological images need to be strengthened by some more ground data. The ground and higher spatial resolution data, such as Sentinel-2, would better enhance the rainfed agriculture mapping to the crop type level in the sand dune and goz lands.
5. Conclusions
Understanding the spatio-temporal dynamics of rainfed agriculture in the North Darfur region is particularly crucial, but it is also challenging. This study aims to test the ability of the earth observation data to assess the trends of rainfed agriculture lands and other common LULC types in the North Darfur region. The results show that Landsat images are promising in monitoring the spatio-temporal patterns of rainfed agriculture in both the goz and wadi areas and other land cover classes, with overall accuracies ranging from 94% to 97% and the kappa statistics ranging from 0.93 to 0.96.
The rainfed agriculture patterns are characterised by high spatial and temporal variability. The cultivation areas have been extended beyond the climate-adapted agronomic dry limit of less than 500 mm of average rainfall to compensate for lower yields. Such widespread cultivation in ecologically vulnerable areas may contribute to land degradation. This study also showed that since 1994, the rainfed agriculture on wadi land has significantly extended. Unfortunately, the wadi lands are very limited, which may foment disputes between local communities. Our work sheds some light on the spatio-temporal pattern of rainfed agriculture in the Northern Darfur State, where spatial data on environmental and socio-economic activities are lacking owing to ongoing conflicts.
Further studies may need to be conducted to better understand the factors that drive the spatial distribution of rainfed agriculture and their environmental impacts. This could contribute to the development of effective strategies for sustainable agricultural land use.
Author Contributions
Conceptualisation, M.B.A. and E.A.; methodology, M.B.A. and E.A.; software, M.B.A., E.A. and K.A.A.; validation, M.B.A.; formal analysis, M.B.A.; investigation, M.B.A.; writing—original draft preparation, M.B.A.; writing—review and editing, M.B.A., E.A. and K.A.A.; visualisation, M.B.A., E.A. and K.A.A.; supervision, E.A. and K.A.A. All authors have read and agreed to the published version of the manuscript.
Funding
This research received no external funding.
Data Availability Statement
The data can be made available upon request.
Acknowledgments
We would like to acknowledge the support of the Mistry of Agriculture and Irrigation of North Darfur State for providing us with total areas cultivated and climate data. The authors would like to show great appreciation to four anonymous reviewers and the editor for their valuable comments and suggestions.
Conflicts of Interest
The authors declare no conflict of interest.
Appendix A. Scenes ID Data 1984 Scenes ID Data 1989
Appendix B. Scenes ID Data 1994 Scenes ID Data 1999
Appendix C. Scenes ID Data 2004 Scenes ID Data 2009
Appendix D. Scenes ID Data 2014 Scenes ID Data 2019
References
- Elagib, N.A.; Khalifa, M.; Rahma, A.E.; Babker, Z.; Gamaledin, S.I. Performance of major mechanized rainfed agricultural production in Sudan: Sorghum vulnerability and resilience to climate since 1970. Agric. For. Meteorol. 2019, 276, 107640. [Google Scholar] [CrossRef]
- Bradford, J.B.; Schlaepfer, D.R.; Lauenroth, W.K.; Yackulic, C.B.; Duniway, M.; Hall, S.; Jia, G.; Jamiyansharav, K.; Munson, S.M.; Wilson, S.D. Future soil moisture and temperature extremes imply expanding suitability for rainfed agriculture in temperate drylands. Sci. Rep. 2017, 7, 12923. [Google Scholar] [CrossRef] [PubMed] [Green Version]
- Laux, P.; Jäckel, G.; Tingem, R.M.; Kunstmann, H. Impact of climate change on agricultural productivity under rainfed conditions in Cameroon—A method to improve attainable crop yields by planting date adaptations. Agric. For. Meteorol. 2010, 150, 1258–1271. [Google Scholar] [CrossRef]
- Sohoulande, C.D.; Stone, K.; Szogi, A.; Bauer, P. An investigation of seasonal precipitation patterns for rainfed agriculture in the Southeastern region of the United States. Agric. Water Manag. 2019, 223, 105728. [Google Scholar] [CrossRef]
- Rockström, J.; Karlberg, L.; Wani, S.P.; Barron, J.; Hatibu, N.; Oweis, T.; Bruggeman, A.; Farahani, J.; Qiang, Z. Managing water in rainfed agriculture—The need for a paradigm shift. Agric. Water Manag. 2010, 97, 543–550. [Google Scholar] [CrossRef] [Green Version]
- Siddig, K.; Stepanyan, D.; Wiebelt, M.; Grethe, H.; Zhu, T. Climate change and agriculture in the Sudan: Impact pathways beyond changes in mean rainfall and temperature. Ecol. Econ. 2020, 169, 106566. [Google Scholar] [CrossRef] [Green Version]
- Siddig, K.; Elagra, S.; Grethe, H.; Mubarak, A. A Post-Separation Social Accounting Matrix for the Sudan; Intl Food Policy Res Inst: Washington, DC, USA, 2018; Volume 8. [Google Scholar]
- Fuller, T.D. Resettlement as a desertification control measure: A case study in Darfur Region, Sudan—Part I: Review of the problem. Agric. Adm. Ext. 1987, 25, 215–234. [Google Scholar] [CrossRef]
- Ibrahim, F.N. Ecological Imbalance in the Republic of the Sudan: With Reference to Desertification in Darfur; Bayreuth Verlagsgesellschaft: Bayreuth, Germany, 1984. [Google Scholar]
- Osman, A.M.K.; Young, H.; Houser, R.F.; Coates, J.C. Agricultural change, land, and violence in protracted political crisis. In An Examination of Darfur. Oxfam America Research Backgrounder Series; Oxfam America: Boston, MA, USA, 2013. [Google Scholar]
- Osman, A.K. Community based seed supply in Sudan. Leisa-Leusden 2007, 23, 18. [Google Scholar]
- Abdelaziz, H.H.; Abdalla, A.A.; AbdelLatif, M.A. Optimizing the Cropping Pattern in North Darfur State, Sudan: A Study of Dar Elslam District. J. Appl. Sci. Res. 2010, 6, 156–164. [Google Scholar]
- Ali, E.-A.D.M.; Mohamedain, M.S. Assessment of Desertification at Umm Bayada Basin (Al Maleha Locality North Darfur State-Sudan). Int. J. Curr. Microbiol. App. Sci. 2016, 5, 94–108. [Google Scholar] [CrossRef] [Green Version]
- Osman, A. Agricultural Change, Land and Violence: An Examination of the Region of Darfur, Sudan. Ph.D. Dissertation, Tufts University, Boston MA, USA, 2012. [Google Scholar]
- Brauch, H.G. Desertification–a new security challenge for the Mediterranean? Policy agenda for recognising and coping with fatal outcomes of global environmental change and potentially violent societal consequences. In Desertification in the Mediterranean Region. A Security Issue; Springer: Berlin/Heidelberg, Germany, 2006; pp. 11–85. [Google Scholar]
- Ibrahim, F. Anthropogenic causes of desertification in Western Sudan. GeoJournal 1978, 2, 243–254. [Google Scholar] [CrossRef]
- Mohammed, A.J.; Inoue, M. Forest-dependent communities’ livelihood in decentralized forest governance policy epoch: Case study from West Shoa zone, Ethiopia. J. Nat. Resour. Policy Res. 2013, 5, 49–66. [Google Scholar] [CrossRef]
- Mohmmed, A.; Zhang, K.; Kabenge, M.; Keesstra, S.; Cerdà, A.; Reuben, M.; Elbashier, M.M.; Dalson, T.; Ali, A.A. Analysis of drought and vulnerability in the North Darfur region of Sudan. Land Degrad. Dev. 2018, 29, 4424–4438. [Google Scholar] [CrossRef]
- Osman, A.M.K.; Cohen, M.J. We No Longer Share the Land: Agricultural Change, Land, and Violence in Darfur; Oxfam International: Oxford, UK, 2014. [Google Scholar]
- Young, H.; Osman, A.M.; Aklilu, Y.; Dale, R.; Badri, B.; Fuddle, A. Darfur 2005 Livelihoods Under Siege; Feinstien International Famine Center, Tufts University: Medford, OR, USA, 2005; Volume 130. [Google Scholar]
- De Marinis, P.; De Petris, S.; Sarvia, F.; Manfron, G.; Momo, E.J.; Orusa, T.; Corvino, G.; Sali, G.; Borgogno, E.M. Supporting Pro-Poor Reforms of Agricultural Systems in Eastern DRC (Africa) with Remotely Sensed Data: A Possible Contribution of Spatial Entropy to Interpret Land Management Practices. Land 2021, 10, 1368. [Google Scholar] [CrossRef]
- Thyagharajan, K.; Vignesh, T. Soft computing techniques for land use and land cover monitoring with multispectral remote sensing images: A review. Arch. Comput. Methods Eng. 2019, 26, 275–301. [Google Scholar] [CrossRef]
- Elagib, N.A.; Al Zayed, I.S.; Saad, S.A.G.; Mahmood, M.I.; Basheer, M.; Fink, A.H. Debilitating floods in the Sahel are becoming frequent. J. Hydrol. 2021, 599, 126362. [Google Scholar] [CrossRef]
- Sahajpal, R.; Fontana, L.; Lafluf, P.; Leale, G.; Puricelli, E.; O’Neill, D.; Hosseini, M.; Varela, M.; Reshef, I. Using machine-learning models for field-scale crop yield and condition modeling in Argentina. In Proceedings of the XII Congreso de AgroInformática (CAI 2020)-JAIIO 49, Modalidad Virtual, Buenos Aires, Argentina, 10–14 August 2020. [Google Scholar]
- Nakalembe, C.; Becker-Reshef, I.; Bonifacio, R.; Hu, G.; Humber, M.L.; Justice, C.J.; Keniston, J.; Mwangi, K.; Rembold, F.; Shukla, S. A review of satellite-based global agricultural monitoring systems available for Africa. Glob. Food Secur. 2021, 29, 100543. [Google Scholar] [CrossRef]
- Orusa, T.; Orusa, R.; Viani, A.; Carella, E.; Borgogno Mondino, E. Geomatics and EO data to support wildlife diseases assessment at landscape level: A pilot experience to map infectious keratoconjunctivitis in chamois and phenological trends in Aosta Valley (NW Italy). Remote Sens. 2020, 12, 3542. [Google Scholar] [CrossRef]
- Carella, E.; Orusa, T.; Viani, A.; Meloni, D.; Borgogno-Mondino, E.; Orusa, R. An Integrated, Tentative Remote-Sensing Approach Based on NDVI Entropy to Model Canine Distemper Virus in Wildlife and to Prompt Science-Based Management Policies. Animals 2022, 12, 1049. [Google Scholar] [CrossRef] [PubMed]
- Orusa, T.; Borgogno Mondino, E. Exploring Short-term climate change effects on rangelands and broad-leaved forests by free satellite data in Aosta Valley (Northwest Italy). Climate 2021, 9, 47. [Google Scholar] [CrossRef]
- Schaefer, M.; Thinh, N.X. Evaluation of land cover change and agricultural protection sites: A GIS and remote sensing approach for Ho chi minh city, vietnam. Heliyon 2019, 5, e01773. [Google Scholar] [CrossRef] [Green Version]
- Melaas, E.K.; Friedl, M.A.; Zhu, Z. Detecting interannual variation in deciduous broadleaf forest phenology using Landsat TM/ETM+ data. Remote Sens. Environ. 2013, 132, 176–185. [Google Scholar] [CrossRef]
- Yang, X.; Mustard, J.F.; Tang, J.; Xu, H. Regional-scale phenology modeling based on meteorological records and remote sensing observations. J. Geophys. Res. Biogeosci. 2012, 117, 18. [Google Scholar] [CrossRef]
- Rembold, F.; Meroni, M.; Urbano, F.; Csak, G.; Kerdiles, H.; Perez-Hoyos, A.; Lemoine, G.; Leo, O.; Negre, T. ASAP: A new global early warning system to detect anomaly hot spots of agricultural production for food security analysis. Agric. Syst. 2019, 168, 247–257. [Google Scholar] [CrossRef] [PubMed]
- Sabzchi-Dehkharghani, H.; Nazemi, A.H.; Sadraddini, A.A.; Majnooni-Heris, A.; Biswas, A. Recognition of different yield potentials among rain-fed wheat fields before harvest using remote sensing. Agric. Water Manag. 2021, 245, 106611. [Google Scholar] [CrossRef]
- Colombo, R.; Busetto, L.; Meroni, M.; Rossini, M.; Panigada, C. Optical Remote Sensing of Vegetation Water Content; CRC Press: Boca Raton, FL, USA, 2011. [Google Scholar]
- Fadul, A.A. Natural resources management for sustainable peace in Darfur. In Proceedings of the Environmental Degradation as a Cause of Conflict in Darfur, Conference Proceedings, Khartoum, Sudan, 27 December 2004; pp. 33–46. [Google Scholar]
- Ali Ahmed, A. The Fifth Population Census in Sudan: A Census with a Full Coverage and a High Accuracy; Neelain University: Khartoum, Sudan, 2008. [Google Scholar]
- Lossou, E.; Owusu-Prempeh, N.; Agyemang, G. Monitoring Land Cover changes in the tropical high forests using multi-temporal remote sensing and spatial analysis techniques. Remote Sens. Appl. Soc. Environ. 2019, 16, 100264. [Google Scholar] [CrossRef]
- Levi, P. Digitising the past: The beginning of a new future at the Royal Tropical Institute of The Netherlands. Program 2010, 44, 39–47. [Google Scholar] [CrossRef]
- Breiman, L. Random forests. Mach. Learn. 2001, 45, 5–32. [Google Scholar] [CrossRef] [Green Version]
- Tsoumakas, G.; Partalas, I.; Vlahavas, I. An ensemble pruning primer. In Applications of Supervised and Unsupervised Ensemble Methods; Springer: Berlin/Heidelberg, Germany, 2009; pp. 1–13. [Google Scholar]
- Puissant, A.; Rougier, S.; Stumpf, A. Object-oriented mapping of urban trees using Random Forest classifiers. Int. J. Appl. Earth Obs. Geoinf. 2014, 26, 235–245. [Google Scholar] [CrossRef]
- Verikas, A.; Gelzinis, A.; Bacauskiene, M. Mining data with random forests: A survey and results of new tests. Pattern Recognit. 2011, 44, 330–349. [Google Scholar] [CrossRef]
- Singh, A. Review article digital change detection techniques using remotely-sensed data. Int. J. Remote Sens. 1989, 10, 989–1003. [Google Scholar] [CrossRef] [Green Version]
- Kumar, S.; Jain, K. A Multi-Temporal Landsat Data Analysis for Land-use/Land-cover Change in Haridwar Region using Remote Sensing Techniques. Procedia Comput. Sci. 2020, 171, 1184–1193. [Google Scholar] [CrossRef]
- Islam, K.; Jashimuddin, M.; Nath, B.; Nath, T.K. Land use classification and change detection by using multi-temporal remotely sensed imagery: The case of Chunati wildlife sanctuary, Bangladesh. Egypt. J. Remote Sens. Space Sci. 2018, 21, 37–47. [Google Scholar] [CrossRef]
- Congalton, R.G. A review of assessing the accuracy of classifications of remotely sensed data. Remote Sens. Environ. 1991, 37, 35–46. [Google Scholar] [CrossRef]
- Ibrahim, H.H.; Elfaig, A.H.; Mokhtar, J.; Egemi, O.; Abdelkreim, M. Land Use/Land Cover Change Detection In Semi-Arid Lands: A Study From Sudan-Ghubaysh Area: A GIS And Remote Sensing Perspective. Int. J. Sci. Technol. Res. 2015, 4, 124–131. [Google Scholar]
- Biro, K.; Pradhan, B.; Buchroithner, M.; Makeschin, F. Land use/land cover change analysis and its impact on soil properties in the northern part of Gadarif region, Sudan. Land Degrad. Dev. 2013, 24, 90–102. [Google Scholar] [CrossRef]
- Nababa, I.I.; Symeonakis, E.; Koukoulas, S.; Higginbottom, T.P.; Cavan, G.; Marsden, S. Land cover dynamics and mangrove degradation in the Niger Delta region. Remote Sens. 2020, 12, 3619. [Google Scholar] [CrossRef]
- Ibrahim, F.N. The role of women peasants in the process of desertification in Western Sudan. GeoJournal 1982, 6, 25–30. [Google Scholar] [CrossRef]
- Abdul-Jalil, M.; Unruh, J.D. Land rights under stress in Darfur: A volatile dynamic of the conflict. War Soc. 2013, 32, 156–181. [Google Scholar] [CrossRef]
Figure 1.
Location of the study area with spatial distribution of the samples in Landsat-8 image 2019. The northern boundary for rainfed agriculture was identified in 1984 using field observation.
Figure 1.
Location of the study area with spatial distribution of the samples in Landsat-8 image 2019. The northern boundary for rainfed agriculture was identified in 1984 using field observation.

Figure 2.
Spatial distribution of the rainfed agriculture and other LULC classes in 1984, 1989, 1994 and 1999. The classification was obtained using Landsat-5 MSS, Landsat-5TM, and random forest classifier.
Figure 2.
Spatial distribution of the rainfed agriculture and other LULC classes in 1984, 1989, 1994 and 1999. The classification was obtained using Landsat-5 MSS, Landsat-5TM, and random forest classifier.
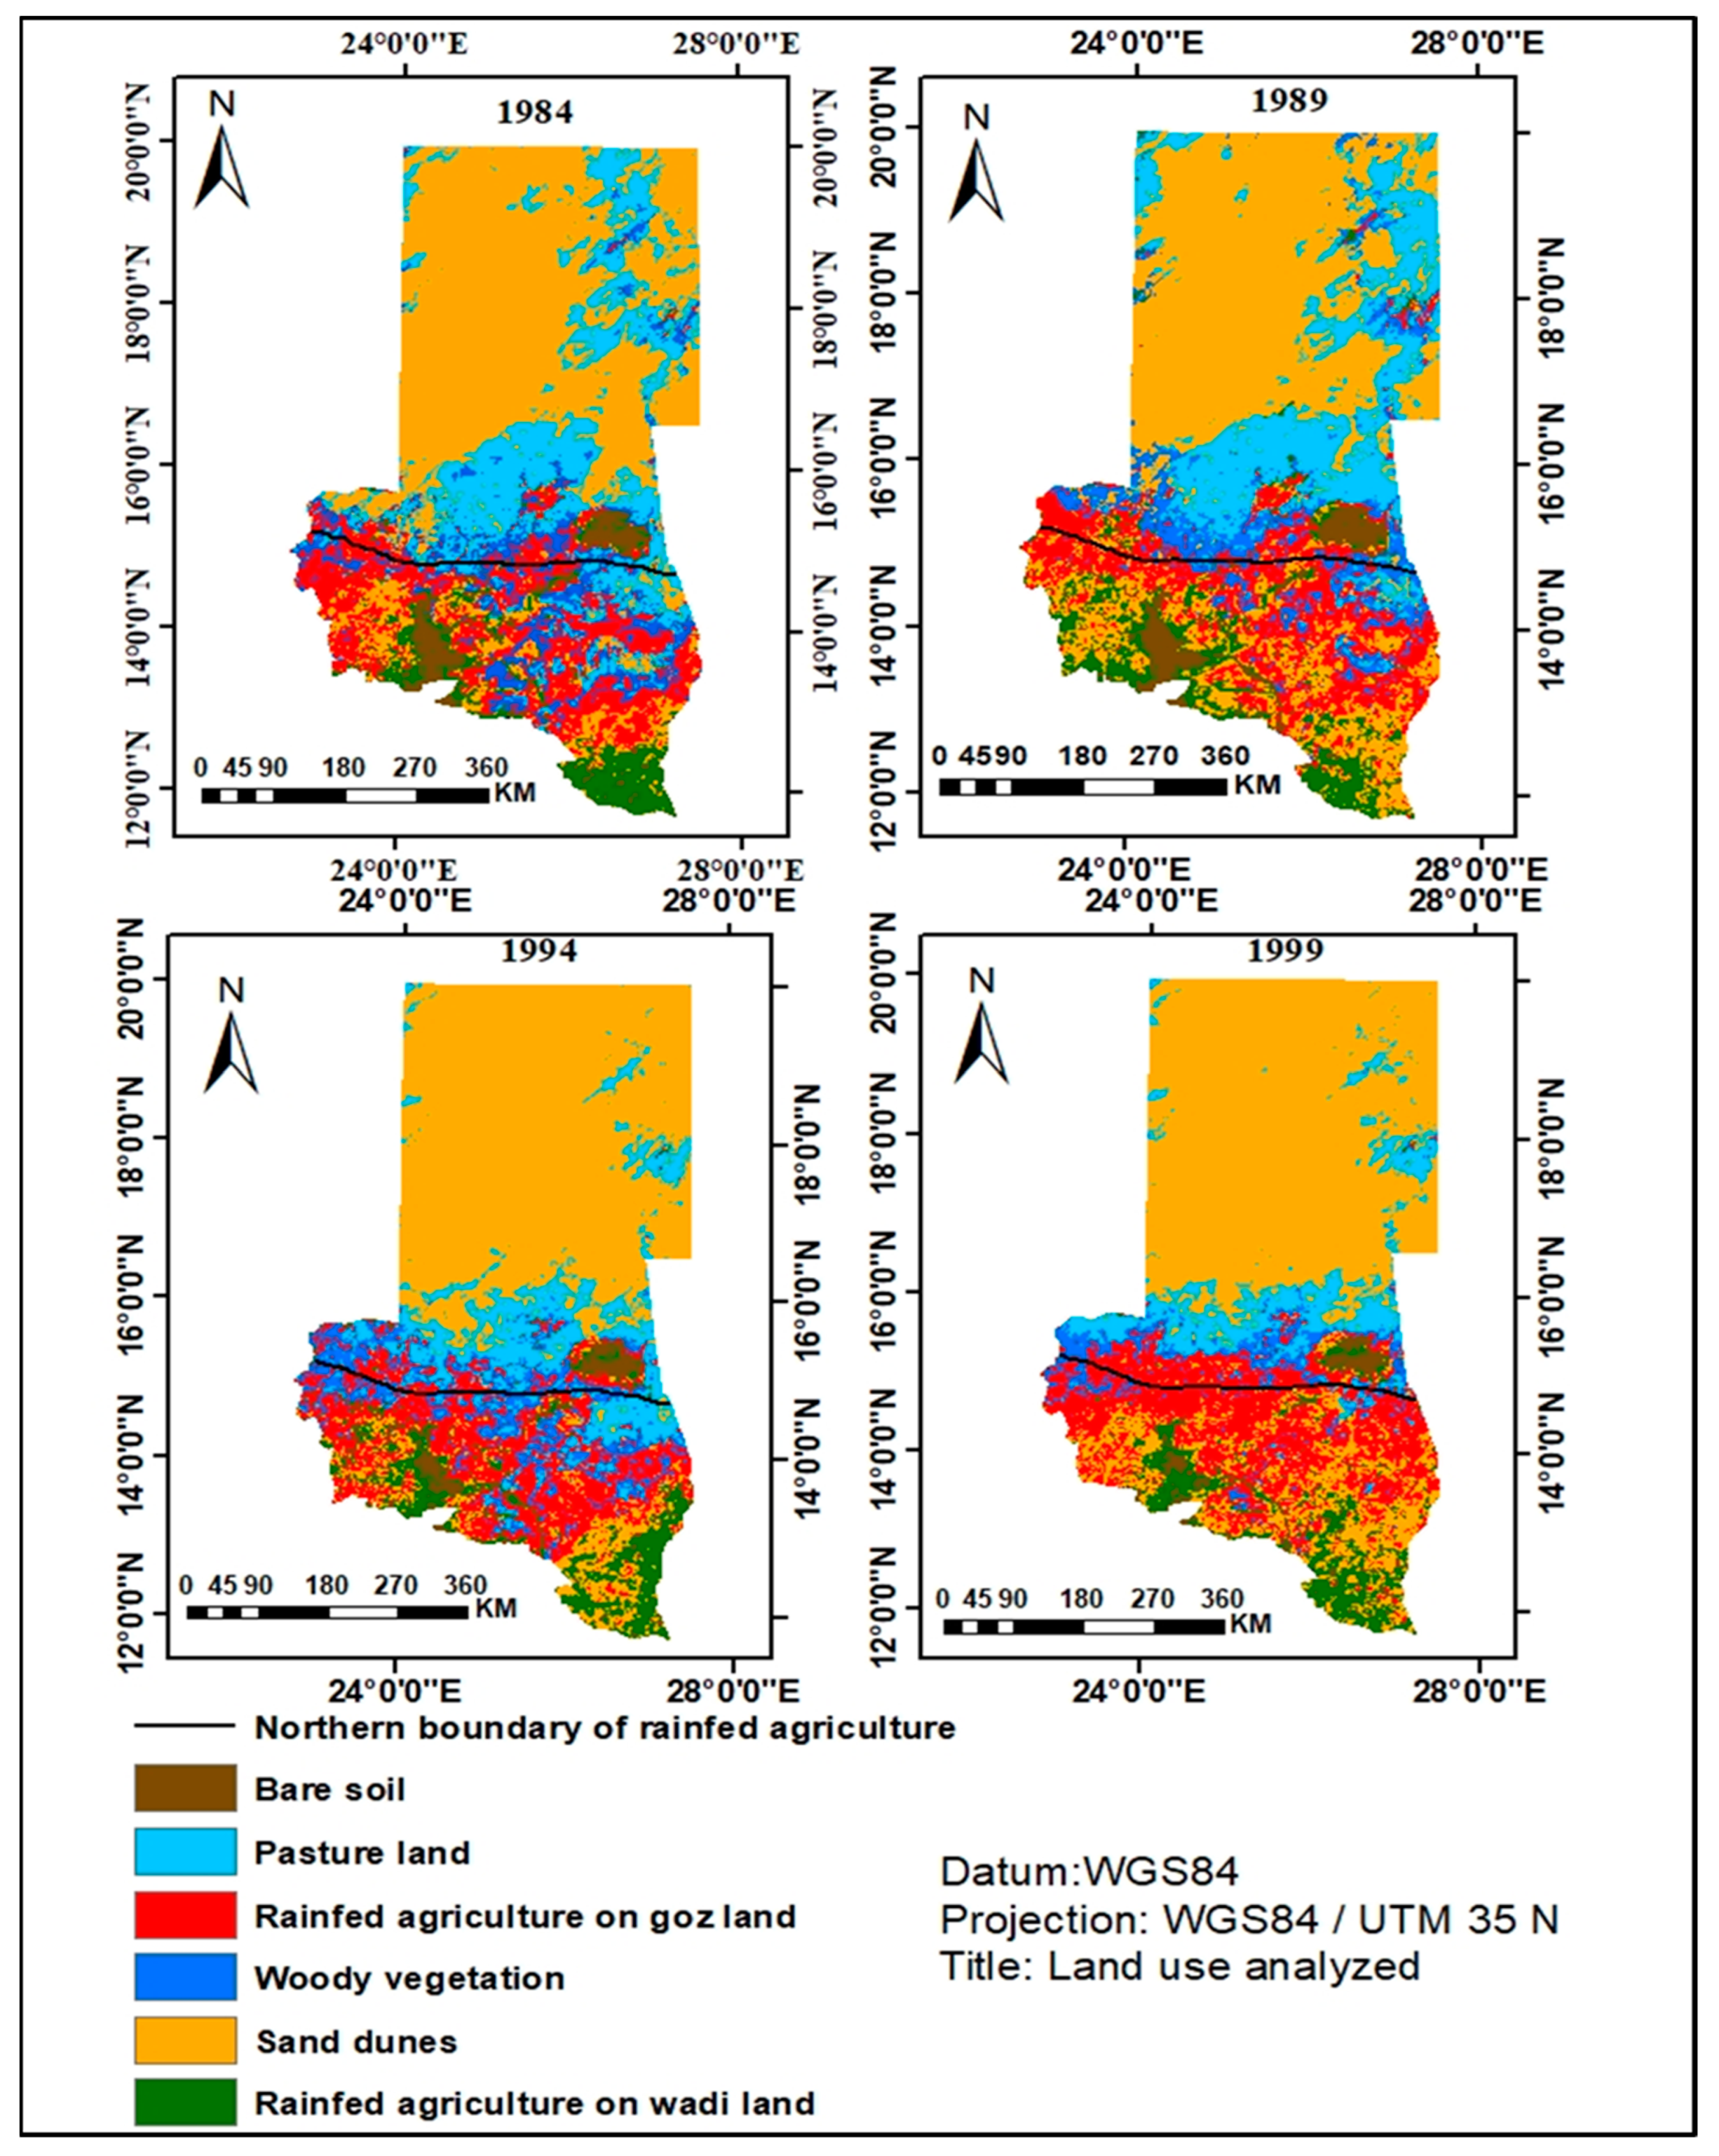
Figure 3.
Spatial distribution of the rainfed agriculture and other LULC classes in 2004–2009 and 2014–2019. The classification was obtained using Landsat-7 ETM+, Landsat-8 OLI, and random forest classifier.
Figure 3.
Spatial distribution of the rainfed agriculture and other LULC classes in 2004–2009 and 2014–2019. The classification was obtained using Landsat-7 ETM+, Landsat-8 OLI, and random forest classifier.

Figure 4.
The overall accuracy and kappa coefficient achieved by random forest classifier for mapping rainfed agriculture and other LULC classes for the period between 1984 and 2019 with a five-year interval.
Figure 4.
The overall accuracy and kappa coefficient achieved by random forest classifier for mapping rainfed agriculture and other LULC classes for the period between 1984 and 2019 with a five-year interval.

Figure 5.
The magnitude of change for rainfed agriculture lands and other LULC types (BS = bare soil, PL = pastureland, RG = rainfed agriculture on goz land, SD = sand dunes, WV = woody vegetation, RW = rainfed agriculture on wadi land) of North Darfur from 2019–1984.
Figure 5.
The magnitude of change for rainfed agriculture lands and other LULC types (BS = bare soil, PL = pastureland, RG = rainfed agriculture on goz land, SD = sand dunes, WV = woody vegetation, RW = rainfed agriculture on wadi land) of North Darfur from 2019–1984.
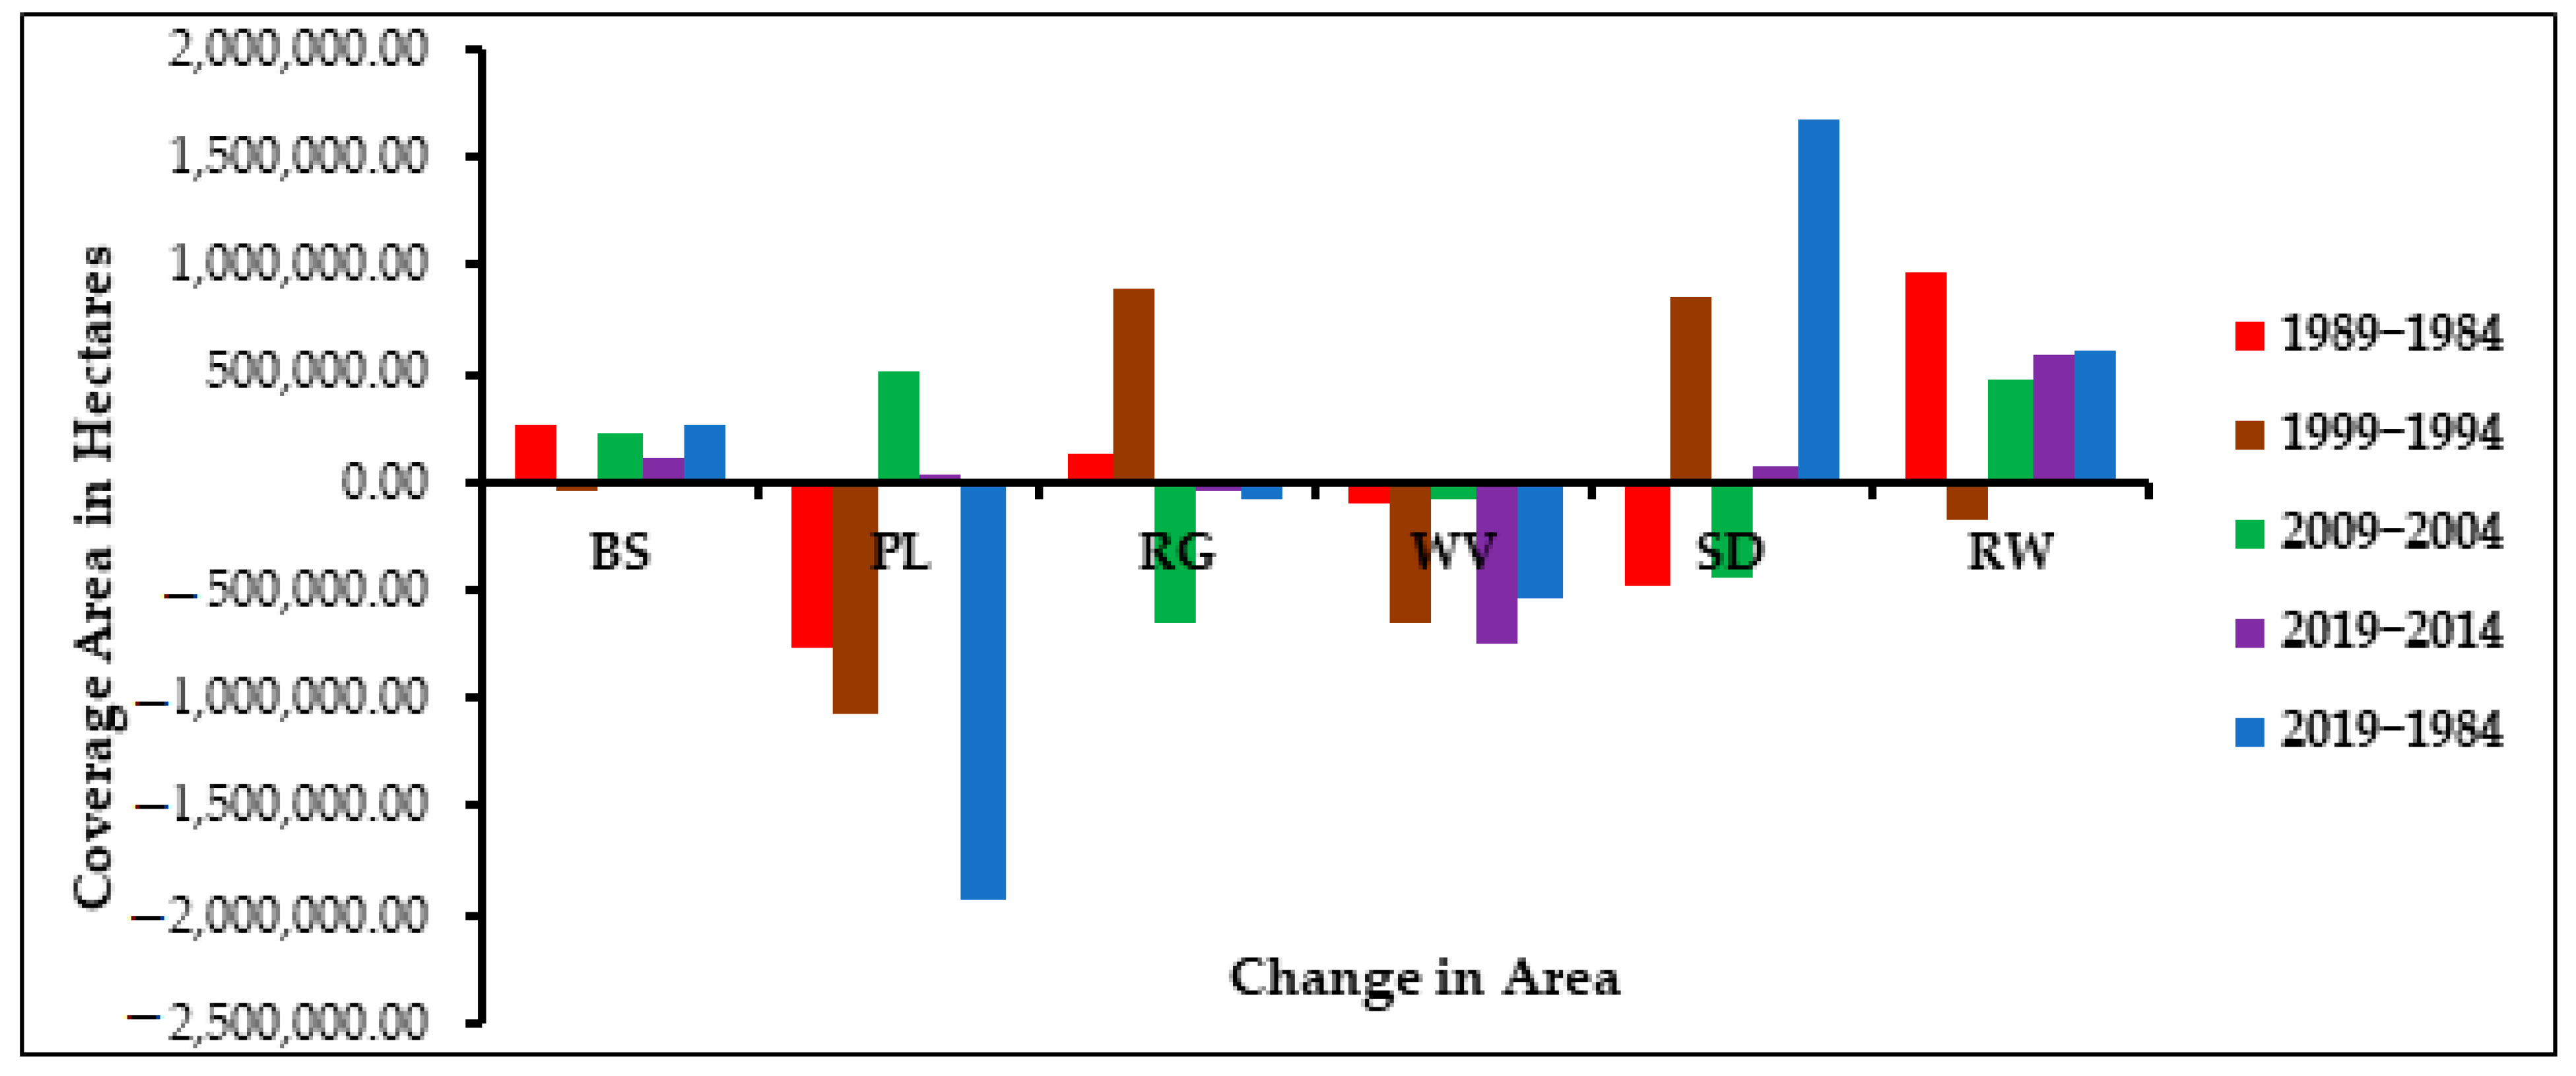
Figure 6.
Compare area coverage by rainfed agriculture on goz land (RG) and on wadi lands (RW) and mean annual rainfall from 1984 to 2019.
Figure 6.
Compare area coverage by rainfed agriculture on goz land (RG) and on wadi lands (RW) and mean annual rainfall from 1984 to 2019.


Table 1.
Description of the land use and land cover (LULC) classes in the study area.
| No. | Class Name | Typical Image of Land Use Class | Description |
|---|---|---|---|
| 1 | Bare soil |  | Wasteland and fallow lands with rocks and gravel. Bare soil is situated in mountainous terrain in the west and some north part of the study area. |
| 2 | Pastureland |  | Vast areas are covered with grassland and shrub used for grazing livestock. |
| 3 | Rainfed agriculture on goz land |  | Goz areas comprise undulating sandy accumulations of old and stabilised dune belts used for farming millet, sorghum and groundnut. |
| 4 | Sand dunes | 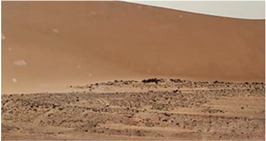 | Areas covered with large masses of shifting sand and un-vegetated old dunes with low levels of organic matter and nitrogen. They occupy most parts of the study area. |
| 5 | Woody vegetation | 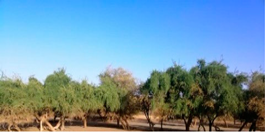 | Areas covered with woody vegetation, mostly Acacia tree species. |
| 6 | Rainfed agriculture on wadi land |  | Wadi areas are generally wetter areas for growing vegetables (on clay soils) and tobacco (on alluvial soils). |
Typical images were taken during the field survey to the study area in August 2020.
Table 2.
Area coverage in hectares of rainfed agriculture and other LULC classes for the period between 1984 and 2019.
Table 2.
Area coverage in hectares of rainfed agriculture and other LULC classes for the period between 1984 and 2019.
| Class | 1984 Area (ha) | 1989 Area (ha) | 1994 Area (ha) | 1999 Area (ha) | 2004 Area (ha) | 2009 Area (ha) | 2014 Area (ha) | 2019 Area (ha) |
|---|---|---|---|---|---|---|---|---|
| BS | 829,963.35 | 1,092,219.57 | 596,770.74 | 554,768.19 | 1,048,919.04 | 1,268,379.0 | 978,837.93 | 1,096,148.25 |
| PL | 6,087,037.68 | 5,316,714.45 | 4,230,389.88 | 3,165,771.51 | 5,572,342.98 | 6,075,850.59 | 4,135,044.24 | 4,164,688.62 |
| RG | 3,997,107.09 | 4,120,391.79 | 3,919,095.54 | 4,808,718.01 | 4,085,995.14 | 3,427,426.53 | 3,952,211.58 | 3,917,382.48 |
| SD | 15,491,287.71 | 15,001,726.86 | 17,586,085.59 | 18,438,988.41 | 15,579,090.63 | 15,128,433.0 | 17,098,441.11 | 17,161,364.97 |
| WV | 3,255,871.68 | 3,155,611.14 | 2,809,914.39 | 2,155,598.64 | 2,586,354.75 | 2,497,371.93 | 3,478,485.15 | 2,722,680.9 |
| RW | 2,063,802.42 | 3,038,405.4 | 2,582,809.29 | 2,400,107.49 | 2,852,367.39 | 3,327,608.88 | 2,082,289.68 | 2,662,804.71 |
NOTE: BS = bare soil, PL = pastureland, RG = rainfed agriculture on goz land, SD = sand dunes, WV = woody vegetation, RW = rainfed wadi land.
Table 3.
User and producer accuracies for mapping rainfed agriculture and other LULC classes for the period between 1984 and 2019 in five-year intervals. The accuracies were calculated using the test dataset (30%) and the confusion matrix.
Table 3.
User and producer accuracies for mapping rainfed agriculture and other LULC classes for the period between 1984 and 2019 in five-year intervals. The accuracies were calculated using the test dataset (30%) and the confusion matrix.
| Years\Accuracy Types | BS | PL | RG | SD | WV | RW |
|---|---|---|---|---|---|---|
| 1984 Producer | 95.7 | 87.9 | 96.2 | 96.6 | 95.7 | 96.0 |
| 1984 User | 93.1 | 90.1 | 95.8 | 95.9 | 95.3 | 97.2 |
| 1989 Producer | 92.7 | 94.5 | 96.9 | 95.8 | 95.4 | 95.9 |
| 1989 User | 91.6 | 96.5 | 96.5 | 95.8 | 96.3 | 94.4 |
| 1994 Producer | 96.4 | 97.6 | 95.8 | 96.1 | 97.4 | 98.3 |
| 1994 User | 97.4 | 96.7 | 96.7 | 96.5 | 93.8 | 98.2 |
| 1999 Producer | 93.8 | 90.5 | 95.1 | 98.1 | 92.4 | 95.8 |
| 1999 User | 92.4 | 93.7 | 95.5 | 96.8 | 95.5 | 94.9 |
| 2004 Producer | 94.7 | 96.1 | 97.2 | 98.1 | 92.1 | 96.2 |
| 2004 User | 97.4 | 95 | 96.3 | 97.8 | 92.3 | 97.4 |
| 2009 Producer | 89.5 | 92.8 | 94.7 | 98.2 | 96.3 | 93.2 |
| 2009 User | 92.3 | 94.8 | 95.4 | 95.6 | 94.1 | 95.8 |
| 2014 Producer | 93.7 | 96.3 | 95.1 | 97.7 | 94.4 | 95.6 |
| 2014 User | 97.2 | 95.9 | 95.8 | 94.9 | 91.7 | 96.9 |
| 2019 Producer | 94.6 | 96.8 | 95.1 | 98.5 | 93.6 | 92.7 |
| 2019 User | 89.7 | 95.2 | 95.9 | 94.9 | 96.4 | 96.2 |
NOTE: BS = bare soil, PL = pasture land, RG = rainfed agriculture on goz land, SD = sand dunes, WV = woody vegetation, RW = rainfed agriculture on wadi land.
Table 4.
Change matrix of the rainfed agriculture and other LULC types in hectares of North Darfur State from 1984 to 1989. The bold values in the change matrix indicate unchanged land types between the initial and final years.
Table 4.
Change matrix of the rainfed agriculture and other LULC types in hectares of North Darfur State from 1984 to 1989. The bold values in the change matrix indicate unchanged land types between the initial and final years.
| INITIAL STATE 1984 | ||||||||
|---|---|---|---|---|---|---|---|---|
| BS | PL | RG | SD | WV | RW | Total | ||
| FINAL STATE 1989 | BS | 15,046.80 | 29.81 | 122.23 | 804.90 | 486.23 | 1507.02 | 17,996.98 |
| PL | 72.1 | 208,773.20 | 85,505.09 | 11,589.50 | 13.00 | 15,124.68 | 321,077.57 | |
| RG | 95.43 | 41,758.94 | 159,112.00 | 418.70 | 279.97 | 61,651.45 | 263,316.5 | |
| SD | 1297.30 | 43,977.31 | 32,404.27 | 48,065.40 | 31.28 | 3772.72 | 129,520.1 | |
| WV | 1111.82 | 5.13 | 53.80 | 351.31 | 171.40 | 497.412 | 2190.873 | |
| RW | 979.22 | 2872.98 | 41,783.83 | 1445.50 | 283.03 | 117,497.70 | 164,862.3 | |
| Total | 18,537.77 | 297,417.40 | 318,981.20 | 62,675.31 | 1236.761 | 200,051.00 | 898,899.4 | |
| Image difference | −48.88 | 23,595.31 | −55,664.73 | 68,134.91 | 603.15 | −36,619.76 | ||
NOTE: BS = bare soil, PL = pastureland, RG = rainfed agriculture on goz land, SD = sand dunes, WV = woody vegetation, RW = rainfed agriculture on wadi land.
Table 5.
Change matrix of the rainfed agriculture and other LULC types of North Darfur State in hectares from 1994 to 1999. The bold values in the change matrix indicate unchanged land types between the initial and final years.
Table 5.
Change matrix of the rainfed agriculture and other LULC types of North Darfur State in hectares from 1994 to 1999. The bold values in the change matrix indicate unchanged land types between the initial and final years.
| INITIAL STATE 1994 | ||||||||
|---|---|---|---|---|---|---|---|---|
| BS | PL | RG | SD | WV | RW | Total | ||
| FINAL STATE 1999 | BS | 18,385.5 | 118.48 | 570.41 | 9165.10 | 3986.31 | 1060.09 | 33,285.89 |
| PL | 21.22 | 52,827.90 | 16,730.92 | 9785.05 | 352.81 | 3090.45 | 82,808.35 | |
| RG | 158.71 | 3098.00 | 88,305.13 | 663.55 | 4034.80 | 37,301.67 | 161,443.90 | |
| SD | 5591.4 | 2133.99 | 393.12 | 5517.13 | 231.90 | 694.10 | 14,561.64 | |
| WV | 6854.67 | 910.37 | 2147.27 | 632.94 | 30,085.10 | 17,869.56 | 58,499.91 | |
| RW | 1845.35 | 5410.52 | 41,580.27 | 1069.50 | 19,959.00 | 72,346.17 | 142,210.80 | |
| Total | 32,856.85 | 92,381.26 | 149,727.10 | 26,833.27 | 58,649.92 | 132,362.00 | 475,637.67 | |
| Image difference | 429.04 | −9572.91 | 11,716.74 | −12,271.60 | −150.01 | 9848.77 | ||
NOTE: BS = bare soil, PL = pastureland, RG = rainfed agriculture on goz land, SD = sand dunes, WV = woody vegetation, RW = rainfed wadi land.
Table 6.
Change matrix of the rainfed agriculture and other LULC types of North Darfur State in hectares from 2004 to 2009. The bold values in the change matrix indicate unchanged land types between the initial and final years.
Table 6.
Change matrix of the rainfed agriculture and other LULC types of North Darfur State in hectares from 2004 to 2009. The bold values in the change matrix indicate unchanged land types between the initial and final years.
| INITIAL STATE 2004 | ||||||||
|---|---|---|---|---|---|---|---|---|
| BS | PL | RG | SD | WV | RW | Total | ||
| FINAL STATE 2009 | BS | 17,032.80 | 10.40 | 24.312 | 91,873.10 | 6807.70 | 320.57 | 116,068.9 |
| PL | 13.05 | 141,499.50 | 63,336.03 | 5872.80 | 140.052 | 5328.17 | 216,189.6 | |
| RG | 431.25 | 25,311.30 | 131,389.00 | 2011.46 | 1449.68 | 44,494.65 | 204,699.2 | |
| SD | 192.10 | 42,262.14 | 3720.20 | 41,957.00 | 907.90 | 210.88 | 89,250.2 | |
| WV | 4004.68 | 715.02 | 868.71 | 7561.90 | 31,568.50 | 9117.55 | 53,192.8 | |
| RW | 1489.39 | 1469.56 | 21,091.70 | 1754.07 | 14,348.10 | 72,582.91 | 112,735.7 | |
| Total | 22,775.15 | 210,624.4 | 220,430.0 | 151,030.3 | 55,221.93 | 132,054.7 | 792,136.5 | |
| Image difference | 93,293.73 | 5565.20 | −15,730.7 | −61,780.1 | −2029.08 | −19,319.0 | ||
NOTE: BS = bare soil, PL = pasture land, RG = rainfed agriculture on goz land, SD = sand dunes, WV = woody vegetation, RW = rainfed agriculture on wadi land.
Table 7.
Change matrix of the rainfed agriculture and other LULC types of North Darfur State in hectares from 2014 to 2019. The bold values in the change matrix indicate unchanged land types between the initial and final years.
Table 7.
Change matrix of the rainfed agriculture and other LULC types of North Darfur State in hectares from 2014 to 2019. The bold values in the change matrix indicate unchanged land types between the initial and final years.
| INITIAL STATE 2014 | ||||||||
|---|---|---|---|---|---|---|---|---|
| BS | PL | RG | SD | WV | RW | Total | ||
| FINAL STATE 2019 | BS | 22,383.1 | 84.61 | 485.17 | 9172.8 | 3810.49 | 685.50 | 36,621.67 |
| PL | 88.8 | 25,370.4 | 17,985.62 | 7579.45 | 160.18 | 110.1 | 51,294.55 | |
| RG | 99.28 | 17,951.2 | 91,644.91 | 686.31 | 3627.22 | 39,411.50 | 15,3420.4 | |
| SD | 187.14 | 4890.45 | 1222.68 | 14,668.8 | 42.2 | 101.50 | 21,112.77 | |
| WV | 1027.6 | 295.69 | 1625.43 | 2071.4 | 47,767.8 | 11,759.44 | 64,547.36 | |
| RW | 2247.70 | 1779.92 | 16,800.80 | 716.4 | 34,313.0 | 79,704.27 | 135,562.1 | |
| Total | 26,033.62 | 50,372.27 | 129,764.6 | 34,895.16 | 89,720.89 | 131,772.3 | 462,558.9 | |
| Image difference | 10,588.05 | 922.28 | 23,655.81 | −13,782.4 | −25,173.5 | 3789.78 | ||
NOTE: BS = bare soil, PL = pastureland, RG = rainfed agriculture on goz land, SD = sand dunes, WV = woody vegetation, RW = rainfed agriculture on wadi land.
Disclaimer/Publisher’s Note: The statements, opinions and data contained in all publications are solely those of the individual author(s) and contributor(s) and not of MDPI and/or the editor(s). MDPI and/or the editor(s) disclaim responsibility for any injury to people or property resulting from any ideas, methods, instructions or products referred to in the content. |
© 2023 by the authors. Licensee MDPI, Basel, Switzerland. This article is an open access article distributed under the terms and conditions of the Creative Commons Attribution (CC BY) license (https://creativecommons.org/licenses/by/4.0/).
Share and Cite
MDPI and ACS Style
Altoom, M.B.; Adam, E.; Ali, K.A. Mapping and Monitoring Spatio-Temporal Patterns of Rainfed Agriculture Lands of North Darfur State, Sudan, Using Earth Observation Data. Land 2023, 12, 307. https://doi.org/10.3390/land12020307
AMA Style
Altoom MB, Adam E, Ali KA. Mapping and Monitoring Spatio-Temporal Patterns of Rainfed Agriculture Lands of North Darfur State, Sudan, Using Earth Observation Data. Land. 2023; 12(2):307. https://doi.org/10.3390/land12020307
Chicago/Turabian StyleAltoom, Mohammed B., Elhadi Adam, and Khalid Adem Ali. 2023. "Mapping and Monitoring Spatio-Temporal Patterns of Rainfed Agriculture Lands of North Darfur State, Sudan, Using Earth Observation Data" Land 12, no. 2: 307. https://doi.org/10.3390/land12020307
Note that from the first issue of 2016, this journal uses article numbers instead of page numbers. See further details here.