
Spatial–Temporal Evolution and Correlation Analysis of Human Activity Intensity and Resource Carrying Capacity in the Region around Poyang Lake, China, from 2010 to 2020

Abstract
:1. Introduction
2. Study Area and Data Source
2.1. Study Area
2.2. Data Source
3. Research Methodology
3.1. HAI Model
3.2. RCC Mode
3.3. Bivariate Spatial Autocorrelation Analysis
4. Results and Analysis
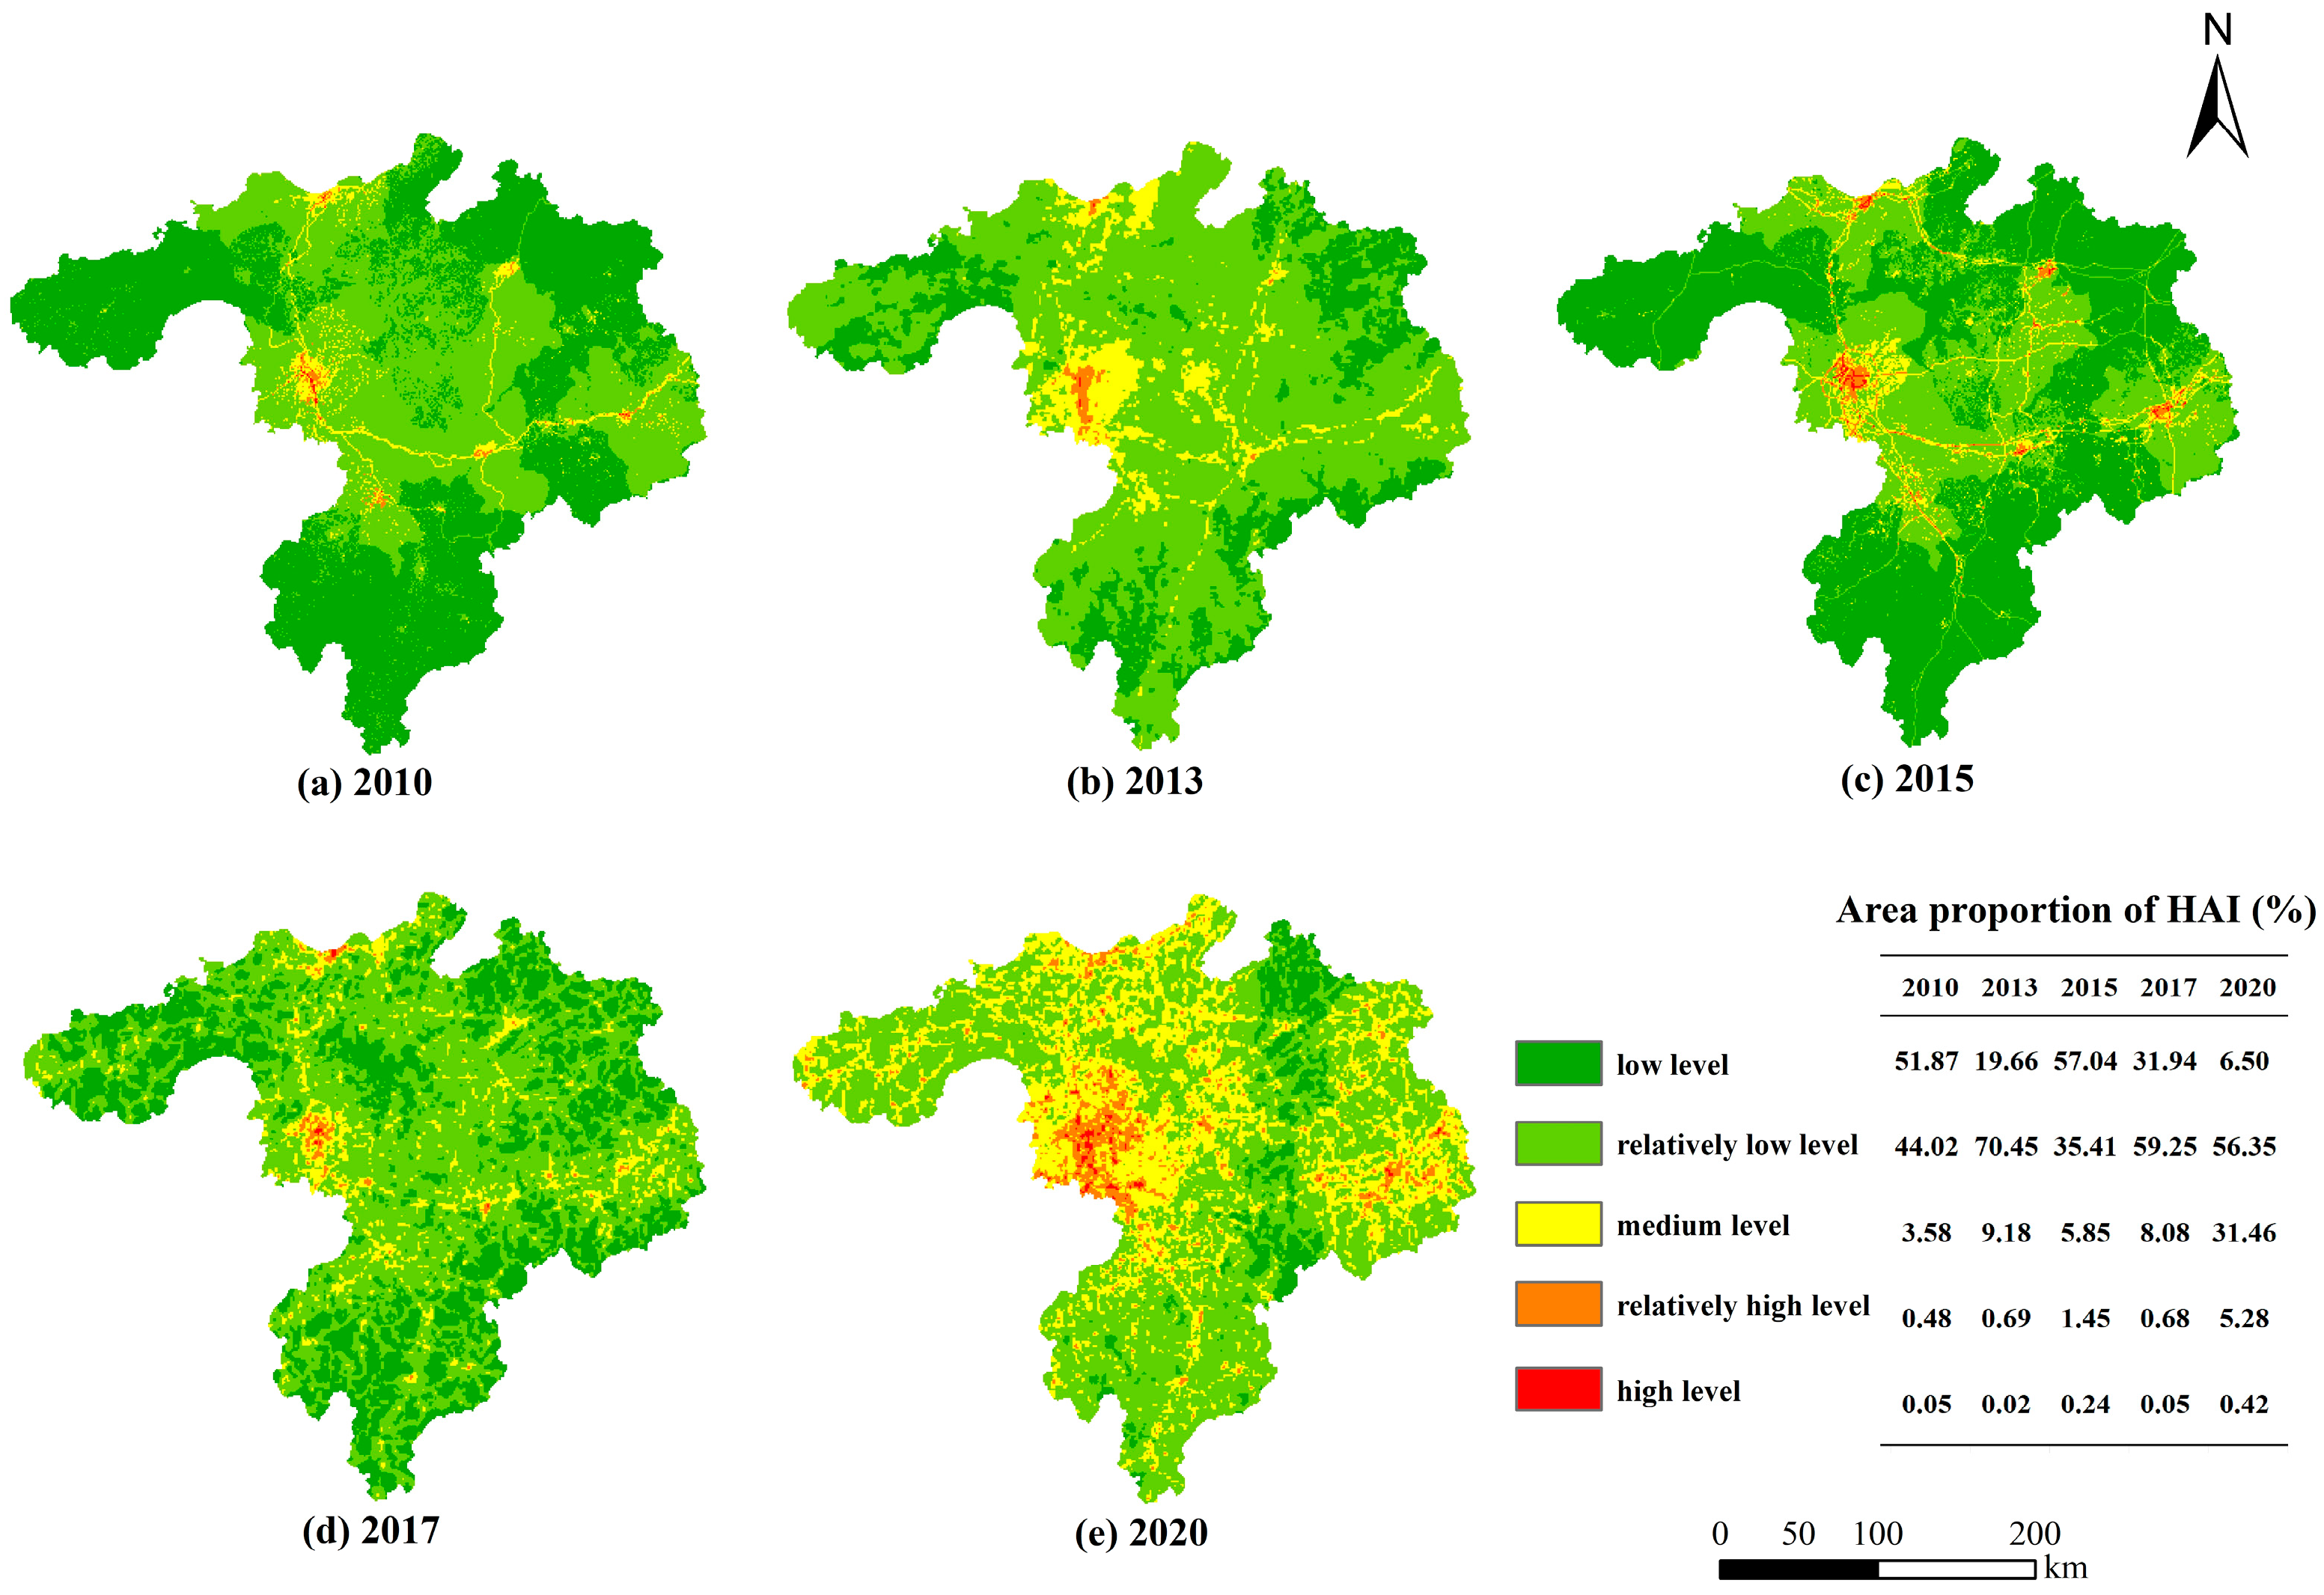
4.1. Analysis of Spatiotemporal Variations in HAI
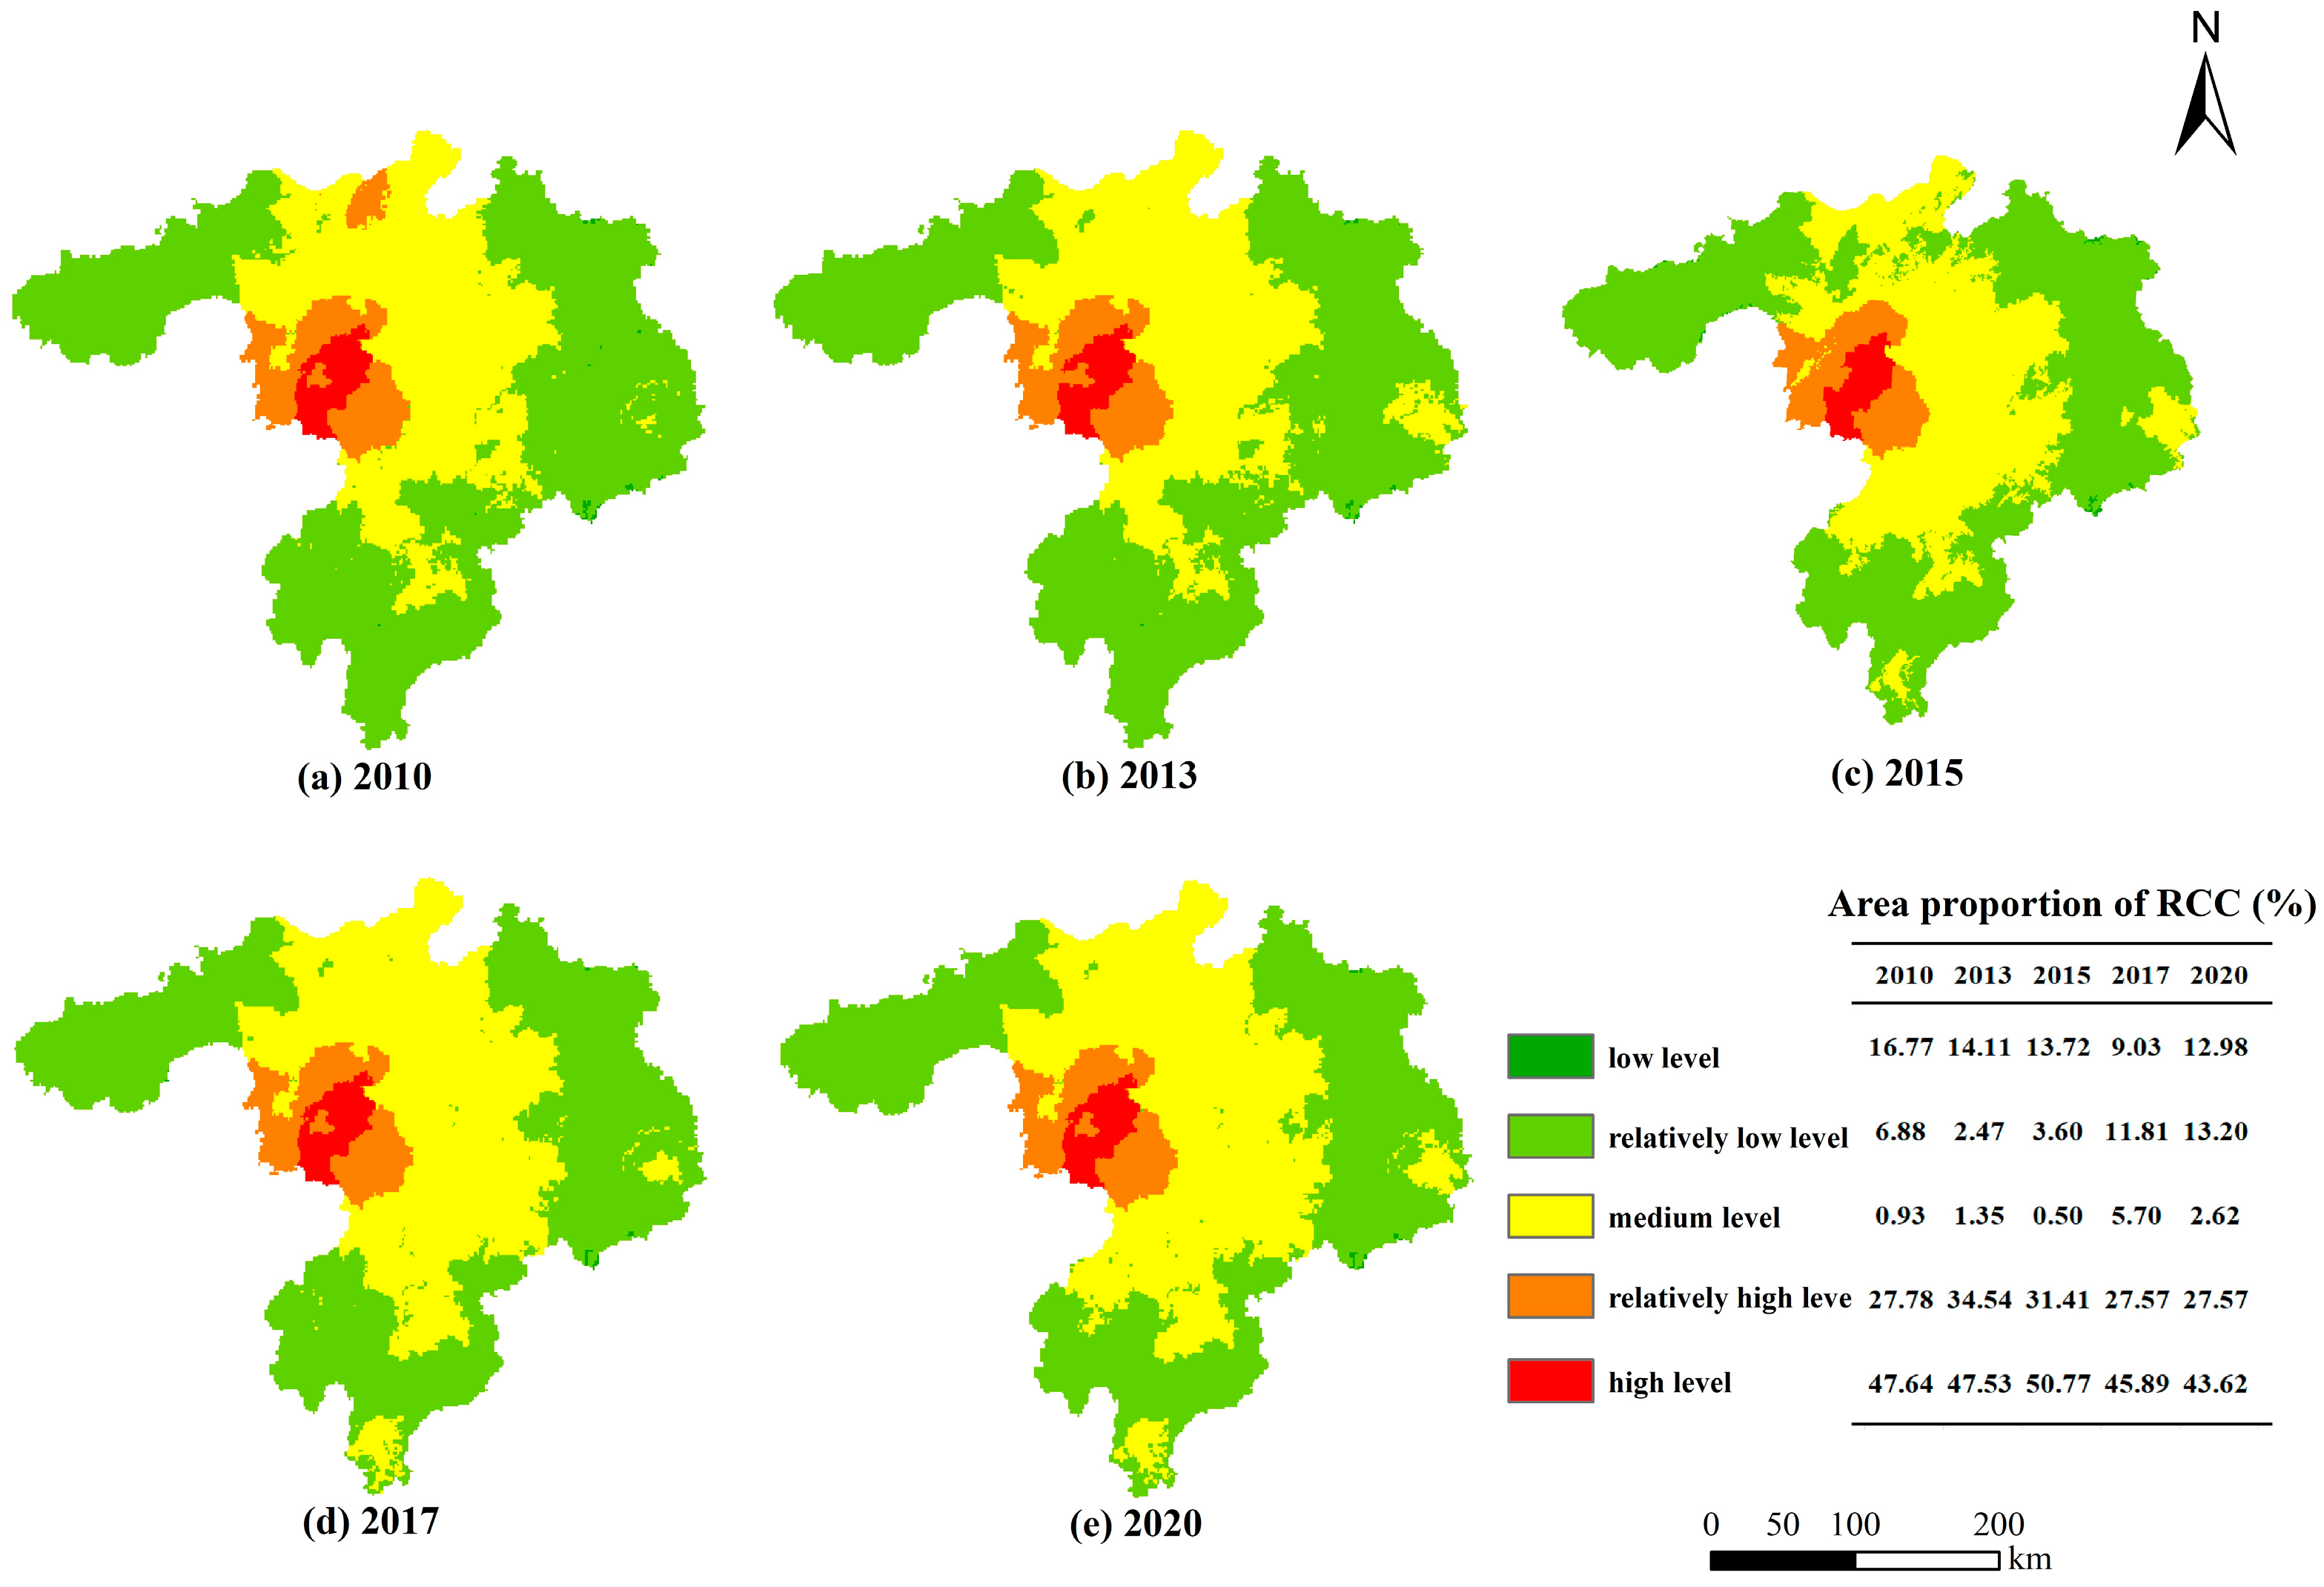
4.2. Analysis of Spatiotemporal Variations in RCC
4.3. The Correlation between HAI and RCC
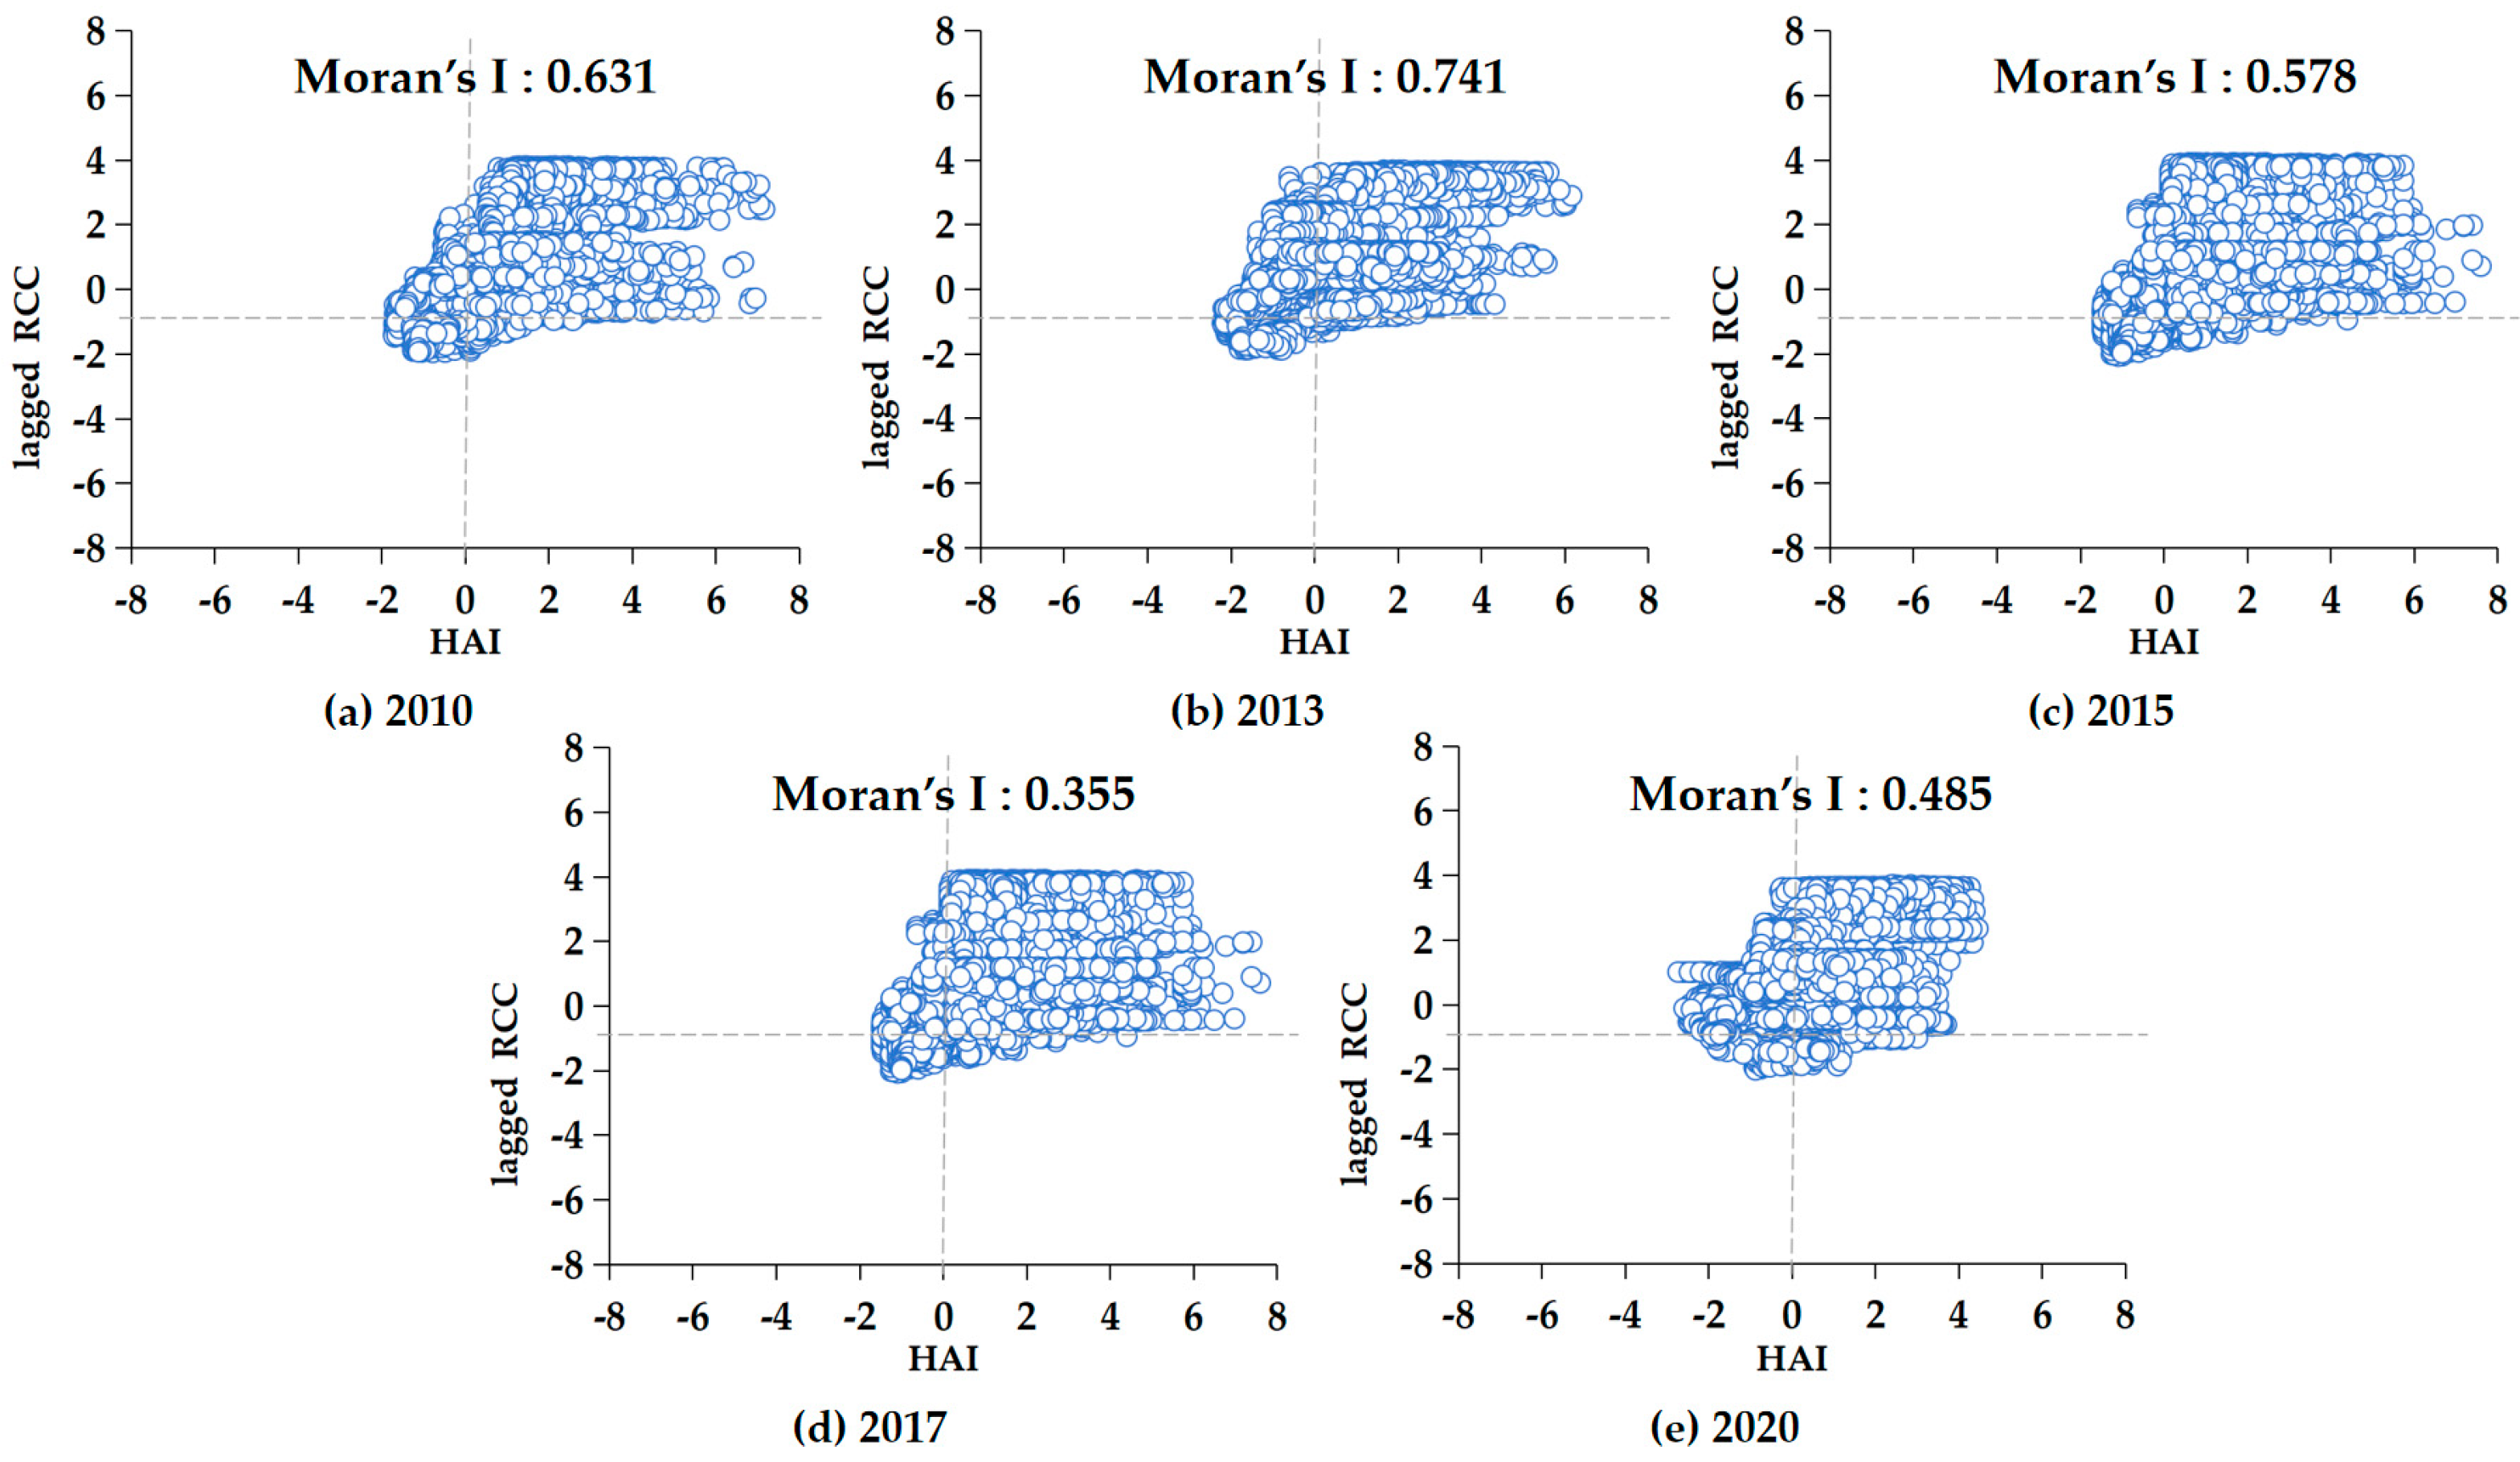
4.3.1. Spatial Correlation
4.3.2. Temporal Correlation
4.3.3. Mutual Influence
5. Conclusions and Discussion
5.1. Conclusions
- (1)
- From 2010 to 2020, there was a significant increase in the HAI in the Poyang Lake area, showing a trend of continuous growth year by year.
- (2)
- During the period of 2010 to 2020, there was no significant change observed in the RCC in the Poyang Lake area, and there was no indications of environmental degradation due to excessive resource consumption.
- (3)
- There is a certain positive correlation between the HAI and the RCC for both spatial and temporal dimensions. Spatially, there was a positive spatial correlation between the two, with variations in their correlation. Temporally, under different levels of HAI, the RCC primarily showed stability and growth. The influence of the HAI on the RCC varied across different levels and time periods.
- (4)
- There is an interactive relationship between the HAI and the RCC. The inherent resource conditions of a region determine its carrying capacity limit. However, factors such as element flow and resource intensification resulting from human activities positively influence the carrying capacity of the resource and environmental units to some extent. In this study area, the primary aspect is the efficient utilization of resources by each assessment unit, and inter-regional element flow is not pronounced.
5.2. Discussion
Author Contributions
Funding
Data Availability Statement
Conflicts of Interest
References
- Mao, H.Y.; Yu, D.L. A Study on the Quantitative Research of Regional Carrying Capacity. Adv. Earth Sci. 2001, 16, 549–555. [Google Scholar] [CrossRef]
- Tian, Y.N.; Wang, H.Q.; Hou, Z.Q. Devoloping Resources Environmental Carrying Capacity Indicator System Based on Resource Environmental Problem Identification. Adv. Mater. Res. 2011, 356–360, 734–737. [Google Scholar] [CrossRef]
- Lu, Y.L.; Xu, S.S.; Shen, L. Spatial and Temporal Differences of Resource and Environmental Carrying Capacity in Henan Province. J. Arid. Land Resour. Environ. 2019, 33, 16–21. [Google Scholar] [CrossRef]
- Malthus, T.R.; Winch, D. An Essay on the Principle of Population; Cambridge University Press: Cambridge, UK, 1992. [Google Scholar]
- Liu, W.Z.; Zhu, J. Research Progress of Resources and Environmental Carrying Capacity: From the Perspective of the Comprehensive Study of Geography. China Popul. Resour. Environ. 2017, 27, 75–86. [Google Scholar] [CrossRef]
- Sun, Y.S.; Tong, L.J. Comprehensive Evaluation of Resources and Environment Carrying Capacity in Restricted Development Zone of Jilin Province. J. Nat. Resour. 2021, 36, 634. [Google Scholar] [CrossRef]
- Zhang, X.G.; Luo, Y. Research on Evaluation System of Environment and Resource Carrying Capacity—Taking Chang-Zhu-Tan City Agglomeration for Example. J. Xiangtan Univ. Philos. Soc. Sci. 2013, 37, 25–27+95. [Google Scholar] [CrossRef]
- Zhang, R.T.; Zhang, X.L.; Yin, P. Spatial-temporal Differentiation and Driving Factors Identification of Urban Land Resources Carrying Capacity in the Yangtze River Economic Belt. Econ. Geogr. 2022, 42, 185–192. [Google Scholar] [CrossRef]
- Ran, Q.Z.; Liao, H.P.; Hong, H.K. Spatial and Temporal Characteristics of Water Resources Carrying Capacity and Carrying State in Chongqing. J. Southwest Univ. 2022, 44, 169–183. [Google Scholar] [CrossRef]
- Zhang, C.; Yang, Y.Z.; Feng, Z.M.; Lang, T.T.; Liu, Y. Spatio-temporal Patterns of the Land Carrying Capacity in the Belt and Road Region Based on Human-cereals Relationship. J. Nat. Resour. 2022, 37, 616–626. [Google Scholar] [CrossRef]
- Zhao, Z.Y.; Li, W.C.; Wang, X.; Cui, T.T.; Cheng, Z.H.; Wang, S. Study on Water Resources Carrying Capacity in Ningxia Based on Principal Component Analysis and Factor Analysis. J. China Hydrol. 2017, 37, 64–72. Available online: http://sw.allmaga.net/sw/article/abstract/20170212?st=search (accessed on 1 December 2023).
- Li, C. Modelling the Comprehensive Carrying Capacity of Land Based on the Social Person Assumption. Ph.D. Thesis, Zhejiang University, Hangzhou, China, 2016. Available online: https://kns.cnki.net/KCMS/detail/detail.aspx?dbname=CDFDLAST2017&filename=1017258250.nh (accessed on 1 December 2023).
- Ren, S.D.; Fu, Q.; Wang, K. Regional Agricultural Water and Soil Resources Carrying Capacity Based on Macro-Micro Scale in Sanjiang Plain. Trans. Chin. Soc. Agric. Eng. 2011, 27, 8–14. [Google Scholar] [CrossRef]
- Xu, Y.Q. Evaluation of Ecological Carrying Capacity based on Ecological Footprint Model in Beijing. Resour. Sci. 2007, 29, 37–42. [Google Scholar] [CrossRef]
- Lei, X.P.; Qiu, G.H. Empirical Study about the Carrying Capacity Evaluation of Regional Resources and Environment Based on Entropy-Weight TOPSIS Model. Acta Sci. Circumstantiae 2016, 36, 314–323. [Google Scholar] [CrossRef]
- Niu, F.Q.; Sun, D.Q. Modelling the Sustainability of China’s Growth Based on the Resource and Environmental Carrying Capacity. Acta Geogr. Sin. 2019, 74, 2604–2613. [Google Scholar] [CrossRef]
- Chen, X.P.; Fang, K.; Peng, J.; Liu, A.Y. New Insights into Assessing the Carrying Capacity of Resources and the Environment: The Origin, Development and Prospects of the Planetary Boundaries Framework. J. Nat. Resour. 2020, 35, 513–531. [Google Scholar] [CrossRef]
- Zhang, M.X.; Wu, C.F.; Li, G.Y.; Si, H.K. Re-Recognition of Resource and Environmental Carrying Capacity Evaluation: From the Perspective of Resource Conservation and Intensive Utilization. China Land Sci. 2020, 34, 98–106. [Google Scholar] [CrossRef]
- Pi, G.N.; He, Z.H.; You, M.; Zhang, L.; Yang, M.K. Effects of Climate Change and Human Activities on Vegetation Change in Guizhou Province from 2001 to 2020. J. Soil Water Conserv. 2022, 36, 160–167. [Google Scholar] [CrossRef]
- Liu, X.M.; Wang, C.; Xiao, R.L.; Fu, Z.; Lv, N.; Yuan, J.F.; Hou, P. Characteristics of Human Disturbance and the Spatio-temporal Changes of Important Ecological Protection Areas in China. Sci. Geogr. Sin. 2022, 42, 1082–1090. [Google Scholar] [CrossRef]
- Huang, M.Q.; Li, B.Y.; Li, M.Z.; Chen, S.; Zeng, C.C.; Zhang, B.; Xia, C.H. Coupling Response of Human Activity Intensity and Landscape Pattern in the Three Gorges Reservoir Area. Acta Ecol. Sin. 2022, 42, 3959–3973. [Google Scholar] [CrossRef]
- Liu, H.H. Comprehensive Evaluation of Water Resources Carrying Capacity in the Yangtze River Economic Belt based on Entropy Weight TOPSIS-coupling Coordination Degree-grey Correlation Degree. Eng. J. Wuhan Univ. 2023, 56, 532–541. [Google Scholar] [CrossRef]
- Xie, M.M.; Zhang, C.F.; Zhang, J.Y.; Wang, G.Q.; Jin, J.L.; Liu, C.S.; He, R.M.; Bao, Z.X. Projection of Future Water Resources Carrying Capacity in the Huang-Huai-Hai River Basin under the Impacts of Climate Change and Human Activities. Water 2022, 14, 2006. [Google Scholar] [CrossRef]
- Xu, Y.; Wang, L.J.; Yang, H. Evaluation Method and Empirical Application of Human Activity Suitability of Land Resources in Qinghai-Tibet Plateau. J. Geogr. Sci. 2023, 33, 1397–1418. [Google Scholar] [CrossRef]
- He, Z.J.; Cheng, J.H.; Liu, Y.J.; Zhang, Y.J. Impacts of Land Use and Climate Change on Ecosystem Regulating Services in the Qinghai-Xizang (Tibet) Plateau from 1990 to 2020. J. Glaciol. Geocryol. 2023, 45, 1616–1628. [Google Scholar] [CrossRef]
- Zhao, X.J.; Wang, J.; Su, J.D. Evaluation on the Conservation Efficiency of Natural Reserves for Rare and Endangered Wild Plants. China Environ. Sci. 2023, 43, 5412–5421. [Google Scholar] [CrossRef]
- Wang, D.R.; Xue, S.B. The Impact of Population Density on Ecosystem in China—Based on the Two-way Fixed Effects Model. J. Hebei GEO Univ. 2022, 45, 97–103. [Google Scholar] [CrossRef]
- Venter, O.; Sanderson, E.W.; Magrach, A.; Allan, J.R.; Beher, J.; Jones, K.R.; Possingham, H.P.; Laurance, W.F.; Wood, P.; Fekete, B.M.; et al. Global Terrestrial Human Footprint Maps for 1993 and 2009. Sci. Data 2016, 3, 160067. [Google Scholar] [CrossRef] [PubMed]
- Hu, Z.B.; He, X.Y.; Li, Y.H.; Zhu, J.J.; Li, X.Y. Human Activity Intensity and Its Spatial Distribution Pattern in Upper Reach of Minjiang River. Chin. J. Ecol. 2007, 26, 539–543. [Google Scholar]
- Xi, H.Y.; Wang, S.R.; Zheng, B.H.; Liu, Z.G.; Yang, C.Q.; Feng, M.L.; Zhang, L. Ecological Security Evolvement in Poyang Lake Influenced by Basin Human Activity. Res. Environ. Sci. 2014, 27, 398–405. [Google Scholar] [CrossRef]
- Yi, D.; Zhao, X.M.; Guo, X.; Jiang, Y.F.; Wang, C.L.; Lai, X.H.; Huang, X.Y.; Chen, L. Evaluation of Carrying Capacity and Spatial Pattern Matching on Urban-rural Construction Land in the Poyang Lake Urban Agglomeration, China. Chin. J. Appl. Ecol. 2019, 30, 627–636. [Google Scholar] [CrossRef]
- Jiang, W.S.; Kong, F.B. Countermeasures for Water and Soil Erosion and Forest Ecosystem Management in Poyang Lake Watersheds. For. Resour. Manag. 2003, 6, 36–40. [Google Scholar] [CrossRef]
- Li, J.H.; Gao, M.X. Spatiotemporal Evolution and Correlation Analysis of Ecosystem Service Values and Ecological Risk in Binzhou. Acta Ecol. Sin. 2019, 39, 7815–7828. [Google Scholar] [CrossRef]
- Huang, M.T. Evaluation of Resources and Environmental Carrying Capacity of the Region around Poyang Lake Considering Human Activitie. Master’s Thesis, East China Institute of Technology, Nanchang, China, 2020. Available online: https://kns.cnki.net/KCMS/detail/detail.aspx?dbname=CMFD202201&filename=1020361853.nh (accessed on 1 December 2023).
- Xu, Y.; Zhou, H.Q.; Dou, S.Q.; Guo, Z.D.; Wu, J.F.; Zheng, Z.W. Spatiotemporal Characteristics of Vegetation Net Primary Productivity in Yangtze River Basin Based on ZGS and Thornthwaite Memorial Models. Bull. Soil Water Conserv. 2022, 42, 225–232. [Google Scholar] [CrossRef]
- Li, L.; Zhu, L.Q.; Zhu, W.B.; Xu, S.B.; Li, Y.H.; Ma, H. The Correlation Between Ecosystem Service Value and Human Activity Intensity and Its Trade-Offs-Take Qihe River Basin for Example. China Environ. Sci. 2020, 40, 365–374. [Google Scholar] [CrossRef]
- Anselin, L.; Syabri, I.; Smirnov, O. Visualizing Multivariate Spatial Correlation with Dynamically Linked Windows. In New Tools for Spatial Data Analysis: Proceedings of the Specialist Meeting; Anselin, L., Rey, S., Eds.; Center for Spatially Integrated Social Science (CSISS), University of California: Santa Barbara, CA, USA, 2022. [Google Scholar]
- Zhang, S.L.; Zhang, K. Comparison between General Moran’s Index and Getis-Ord General G of Spatial Autocorrelation. Acta Entiarum Nat. Univ. Sunyatseni 2007, 46, 93–97. [Google Scholar] [CrossRef]
- Shen, T.; Li, F.X.; Chen, Z.J. Evaluation and Spatial Correlation Analysis of Urban Vitality Based on Muti-source Data: A Case of Changzhou, China. Resour. Environ. Yangtze Basin 2022, 31, 1006–1015. [Google Scholar] [CrossRef]
- Yang, Q.Q.; Xu, G.L.; Li, A.J.; Liu, Y.T.; Hu, C.S. Evaluation and Trade-off of Ecosystem Services in the Qingyijiang River Basin. Acta Ecol. Sin. 2021, 41, 9315–9327. [Google Scholar] [CrossRef]
- Announcement on the Planning of Ecological Urban Agglomeration around Poyang Lake (2015–2030) and the Planning of Nanchang Metropolitan Area (2015–2030). Available online: http://www.jiangxi.gov.cn/art/2016/8/8/art_5141_266068.html (accessed on 10 August 2016).


| Objective | Evaluation Indicators | Weight | Specific Indicators | Indicator Description |
|---|---|---|---|---|
| HAI | Land-use types (HAI1) | 0.25 | Built-up land | The value of HAI1 in built-up land area is 0.4. |
| Arable land | The value of HAI1 in cultivated land area is 0.4. | |||
| Aquaculture land | The value of HAI1 in aquaculture land area is 0.4. | |||
| Other land-use types | The value of HAI1 in the area related to other land-use types is 0. | |||
| Traffic data (HAI2) | 0.25 | Roadway | Within 500 m on both sides of a highway (including provincial roads and expressways), the value of HAI2 is 0.8. | |
| Railway | Within 500 m on both sides of the railway, the value of HAI2 is 0.8. | |||
| Economic data (HAI3) | 0.25 | GDP | The value of HAI3 is determined through continuous assignment within the interval of 0.1–1, using the natural breakpoint grading method. | |
| Population data (HAI4) | 0.25 | Population density | When the population density is greater than 1000 km2/people, the value of HAI4 is 1. When the population density is less than 1000 km2/people, the value of HAI4 is calculated as 0.3333 × log (population density + 1). |
| Objective | Evaluation Indicators | Weight | Calculation Method | Indicator Description |
|---|---|---|---|---|
| RCC | Land-use intensity (RCC1) | 0.448 | Available-land area/total-land area | Land meeting the criteria of a slope less than 15 degrees, elevation below 1000 m, and soil texture classified as clayey loam is defined as usable land. |
| Water-use intensity (RCC2) | 0.218 | The total scale of domestic and industrial water use/total scale of water resources | The actual water resource utilization is equal to the sum of residential water use, urban public water use, industrial water use, environmental water use, and agricultural water use. The total water resources equal the sum of surface water resources and groundwater resources minus redundancy. | |
| Forest coverage rate (RCC3) | 0.117 | Forest area/total-land area | The forest coverage rate is a crucial indicator reflecting the resources of an ecosystem in a given area. It enhances ecosystem functions, such as water conservation, regulation of runoff, soil retention, and water quality protection. It serves as a significant indicator for assessing RCC. | |
| Climatic potential productivity (RCC4) | 0.217 | Thornthwaite memorial model [35] | The calculation of this indicator involves annual average evapotranspiration, mean evaporation, annual precipitation, and annual average temperature. |
| HAI Level at the Beginning of the Period | The Number of Assessment Units Where RCC Levels Have Changed. | ||||||||||||||
|---|---|---|---|---|---|---|---|---|---|---|---|---|---|---|---|
| 2010–2013 | 2013–2015 | 2015–2017 | 2017–2020 | Total | |||||||||||
| Increase | No change | Decrease | Increase | No change | Decrease | Increase | No change | Decrease | Increase | No change | Decrease | Increase | No change | Decrease | |
| high level | 2 | 29 | 0 | 0 | 6 | 9 | 78 | 86 | 10 | 0 | 43 | 0 | 80 | 164 | 19 |
| relatively high level | 60 | 244 | 23 | 22 | 334 | 180 | 308 | 707 | 61 | 30 | 490 | 6 | 420 | 1775 | 270 |
| medium level | 357 | 1950 | 110 | 682 | 4693 | 1759 | 552 | 3660 | 236 | 441 | 5699 | 117 | 2032 | 16,002 | 2222 |
| relatively low level | 3168 | 29,712 | 1463 | 6120 | 40,641 | 7895 | 4774 | 20,899 | 1859 | 2832 | 42,345 | 766 | 16,894 | 133,597 | 11,983 |
| low level | 808 | 38,046 | 1988 | 1069 | 11,611 | 2939 | 8336 | 34,759 | 1635 | 1699 | 23,032 | 460 | 11,912 | 107,448 | 7022 |
| Categories of LISA Clustering for HAI. | Categories of LISA Clustering for RCC. | |||||||||||||||||||
|---|---|---|---|---|---|---|---|---|---|---|---|---|---|---|---|---|---|---|---|---|
| 2010 | 2013 | 2015 | 2017 | 2020 | ||||||||||||||||
| HH | LL | LH | HL | HH | LL | LH | HL | HH | LL | LH | HL | HH | LL | LH | HL | HH | LL | LH | HL | |
| HH | 9328 | 993 | 6 | - | 9392 | 225 | 2 | - | 6756 | 231 | - | - | 4430 | 3551 | 2 | - | 7797 | 3828 | 6 | - |
| LL | 12 | 16,875 | - | 2 | 286 | 20,786 | - | 1 | - | 20,263 | - | - | 1377 | 13,172 | - | 3 | 649 | 10,490 | - | 4 |
| LH | 8 | 5 | - | - | 6 | 2 | - | - | 15 | 61 | - | - | 5 | 15 | - | - | 1 | 3 | - | - |
| HL | 1 | 100 | - | - | - | 16 | - | - | - | 298 | - | - | 1 | 32 | - | - | 1 | 4 | - | - |
Disclaimer/Publisher’s Note: The statements, opinions and data contained in all publications are solely those of the individual author(s) and contributor(s) and not of MDPI and/or the editor(s). MDPI and/or the editor(s) disclaim responsibility for any injury to people or property resulting from any ideas, methods, instructions or products referred to in the content. |
© 2023 by the authors. Licensee MDPI, Basel, Switzerland. This article is an open access article distributed under the terms and conditions of the Creative Commons Attribution (CC BY) license (https://creativecommons.org/licenses/by/4.0/).
Share and Cite
Tan, Y.; Hu, N.; Huang, M.; Xiao, Y.; Shan, J.; Li, D. Spatial–Temporal Evolution and Correlation Analysis of Human Activity Intensity and Resource Carrying Capacity in the Region around Poyang Lake, China, from 2010 to 2020. Land 2023, 12, 2139. https://doi.org/10.3390/land12122139
Tan Y, Hu N, Huang M, Xiao Y, Shan J, Li D. Spatial–Temporal Evolution and Correlation Analysis of Human Activity Intensity and Resource Carrying Capacity in the Region around Poyang Lake, China, from 2010 to 2020. Land. 2023; 12(12):2139. https://doi.org/10.3390/land12122139
Chicago/Turabian StyleTan, Yongbin, Nan Hu, Minting Huang, Yuting Xiao, Jie Shan, and Dajun Li. 2023. "Spatial–Temporal Evolution and Correlation Analysis of Human Activity Intensity and Resource Carrying Capacity in the Region around Poyang Lake, China, from 2010 to 2020" Land 12, no. 12: 2139. https://doi.org/10.3390/land12122139