Article

Spatiotemporal Changes of Terrestrial Carbon Storage in Rapidly Urbanizing Areas and Their Influencing Factors: A Case Study of Wuhan, China

1
School of Public Administration, China University of Geosciences, Wuhan 430074, China
2
Key Laboratory of Law and Government, Ministry of Natural Resources of China, Wuhan 430074, China
*
Author to whom correspondence should be addressed.
Land 2023, 12(12), 2134; https://doi.org/10.3390/land12122134
Submission received: 4 October 2023 / Revised: 29 November 2023 / Accepted: 30 November 2023 / Published: 4 December 2023

Abstract

:
Terrestrial carbon storage plays a vital role in limiting global climate change and achieving regional carbon neutrality. However, intensive human activities and rapid urbanization have led to a rapid decline in carbon storage. Understanding what causes carbon storage to decline and how this happens is important for the scientific regulation of urbanization and safeguarding of urban ecological security. This study takes Wuhan as an example and analyzes the quantity, structure, and spatial patterns of urban land-use changes in the context of human activities and natural conditions, and applies correlation methods to identify general relationships between influencing factors and carbon storage. The results of the study are as follows: over the 30-year period studied, the area devoted to construction land increased by 757 km2 and the carbon storage decreased by 7.68 × 10⁶ t. Outside Wuhan’s Third Ring Road, there was a significant increase in the carbon storage, but in the areas where construction increased, there was a reduction in carbon storage. Carbon storage in the remote suburbs was significantly higher than in the city center, and the distribution pattern was characterized by significant spatial heterogeneity. Our analysis revealed that human economic and social activities have affected Wuhan’s ecosystem carbon storage to a significant extent. Policymakers should focus on industrial optimization, strictly control the red line of ecological protection, and ultimately achieve high-quality urban development.

1. Introduction

The continuous increases in global temperature that we are currently experiencing can have serious negative impacts on the environment and human society [1,2], and carbon emissions are one of the most important causes of global warming [3]. The changing uses of land for human activities (land-use change) have become the second largest source of emissions after energy consumption [4,5]; this is due to rapid urbanization and industrialization [6]. Carbon storage in land ecosystems plays an important role in the global carbon cycle and is considered to be one of the main ways of regulating greenhouse warming [7,8]. Changes in ecological land—which is the main store of carbon—with respect to aspects such as vegetation biomass can greatly affect vegetation carbon storage and soil organic carbon [9]. Global economic expansion has led to an undeniable trend toward the expansion of urban construction land since the early 20th century [10]. The transition from ecological land to urban construction land has played a particularly significant role in the rapid decrease in carbon storage [11]. Moreover, human activities mainly take place on construction land, meaning that land of this type tends to have higher energy consumption and to produce more carbon emissions than other land types [12]. Therefore, a scientific evaluation of the effect of land-use transformations on carbon storage during swift urbanization will enhance our comprehension of the variations in carbon storage in urban ecosystems. This is of considerable importance for the preservation and sustainable growth of urban ecosystems.
Current research on land-use and cover change (LUCC) is no longer limited to a single land use/cover, and the theory of LUCC processes and drivers—as well as their quantitative study—has become a hot issue in the world. Previous studies have established that the increased intensity of human activities has caused rapid changes in land-use patterns. By the beginning of the twenty-first century, it had become clear that urbanization was having a significant impact on regional ecology, and the impact of urbanization on terrestrial ecosystems began to receive extensive attention from scholars [13,14]. At the same time, terrestrial carbon storages have also become a relatively popular research topic [15,16]. Carbon storage in terrestrial ecosystems mainly includes biomass (e.g., forests, dead wood litter, and soil organic carbon), and its specific measurements have been carried out by scholars through remote sensing technology, field surveys, and other methods [17,18,19,20]. Recent research has examined ecosystems from both one-dimensional and multi-dimensional viewpoints to ascertain the effect of land-use alteration on carbon storage in terrestrial ecosystems on a worldwide, national, and regional basis. These studies indicate that deforestation in tropical regions is the primary reason for the decrease in carbon storage on a global scale [21,22,23]. At the national and regional levels, urban sprawl is the dominant factor influencing land-use change; its impact on regional carbon storage [10,24] leads directly to the loss of terrestrial carbon storage. Other studies have started investigating the integration of land-use alteration models and carbon storage evaluation models to forecast the impacts of upcoming land use on carbon storage from various vantage points [25,26,27] while using the models to set up future land-use-change scenarios and simulate spatial patterns of future carbon storage [6,27], but research on terrestrial ecosystems in urban areas is still insufficient, especially with respect to their impact mechanisms. The ability to manage land-use carbon mechanisms in a way that maximizes their limits is necessary to maintain urban ecosystems during long-term urban development. Previous studies have shown that the main reason for the impact of urbanization on carbon storage is the magnitude of the interconversion between land-use types [28,29]. The process of urbanization includes an increase in per capita GDP, the migration of the rural population to urban areas, and a shift in people’s lifestyles and consumption levels, each of which potentially contributes to a change in carbon storage.
Little research has been conducted on the mechanism through which land-use modification affects terrestrial carbon storage from an urbanization viewpoint. Particularly in cities where the population exerts great pressure on land, the amount, type, and spatial distribution patterns of land use have been fundamentally altered. At the same time, the rapid development of cities has led to the rapid transformation of ecological lands—such as basic agricultural land—into non-agricultural land, and carbon storage in areas devoted to different land-use types has also changed. In essence, increasing ecological land use and limiting the expansion of land used for urban construction are effective ways to increase carbon storage [30]. China is currently undergoing rapid urbanization [31], and the International Energy Agency reports that China is consistently ranked as the world’s top greenhouse gas emitter. Therefore, amid the significant pressure to reduce carbon emissions globally and respond to climate change, analyzing the factors that influence carbon storage’s spatial and temporal patterns during rapid urbanization is an urgent task.
In Wuhan, a mega-city in a rapidly developing country, the government has responded to the goal of ecological protection by restoring degraded wetlands, croplands, woodlands, and other landscapes to protect carbon storage. This research aims to investigate the spatial patterns of land-use change in Wuhan considering the impact of rapid urbanization. Additionally, it aims to evaluate the influencing mechanism of land-use change on changes in terrestrial carbon storage. This study has four main objectives: (1) to present an objective assessment of the extent of land-use and carbon storage transformation in Wuhan between 1990 to 2020; (2) to examine the spatial patterns that arise during changes in carbon storage, and to evaluate how urban expansion impacts carbon storage; (3) to establish relevant analytical models to analyze the mechanism through which the process of urbanization results in carbon storage changes; and (4) to explore the impacts of socioeconomics, spatial structure, and the natural environment on the carbon storages of Wuhan’s ecosystems from the perspective of rapid urbanization, and put forward policy recommendations. In this way, this study aims to provide valuable scientific guidance for the realization of sustainable urban development.

2. Theoretical Framework

During rapid urbanization, human activities alter the carbon cycle of terrestrial ecosystems through changes to the land cover and socioeconomic activities [6]. Relevant studies have shown that from the beginning of the Second Industrial Revolution to the end of the 20th century, 30% of total global carbon emissions from human activities were caused by land-use changes [32]. Therefore, urban land planning is considered an important policy tool to help realize the dual-carbon goal and can be regarded as an effective point of focus to reduce carbon emissions from land use and mitigate global climate change [33]. Land is the main carrier of urban spatial planning, as it is associated with both the natural ecological system and the socioeconomic system [34].
As the natural spatial carrier of carbon storage in terrestrial ecosystems, land-use type changes have the most obvious influence on natural carbon processes (e.g., afforestation, returning farmland to forests, and crop fertilization), which change the vegetation’s carbon storage. Furthermore, alterations to soil conditions can impact the rate of decomposition for soil organic carbon, ultimately influencing soil carbon storage [9,35]. One of the most significant land-use changes is the occupation of ecological land by construction sites, which impacts carbon storage by reducing arable land and causing deforestation [33]. Although rapid socioeconomic development, accelerating urbanization, and changes in socioeconomic systems drive land-use changes and indirectly cause changes in carbon storage, these effects can be offset by tapping land-use potential [36], improving land-use efficiency in old urban areas [37], delineating urban growth boundaries [38], and coordinating economic development with ecological protection [39]. To realize the ecologically friendly development of cities and human beings, it is necessary to take corresponding measures at the micro level, such as the restoration of wetlands, installation of permanent greening, and establishment of an ecological protection “red line”. At the macro level, by optimizing the scale, structure, mode, and intensity of urban space, we can change the allocation of the economy and of resources to make urban development more compact and efficient, thus reducing the development of ecological land [40,41] and ultimately realizing the high-quality development of the city. Based on the above considerations, the theoretical framework for the development of carbon storage impacts is shown in Figure 1.
Increasing carbon storage in terrestrial ecosystems is a highly viable, cost-effective, and eco-friendly approach to tackling the greenhouse effect and adapting to the consequences of global climate change [7,8]. Therefore, land-use changes during rapid urbanization have become a current research hotspot, and the impacts of urban expansion on carbon storage have gradually gained further attention. Studies have shown that initial urbanization has a distinctive carbon source effect [11,42] that leads to a significant loss of carbon storage.

3. Materials and Methods

3.1. Study Area

The study area is Wuhan (Figure 2), which is located in the eastern part of the Jianghan Plain and has a subtropical monsoon climate, with maximum temperatures in summer reaching more than 40 °C. It is famous as a “furnace city” in China and is also known for its vast rivers and lakes, earning it the title “City of Wetlands”. The city has a total area of 8569 square kilometers, making it one of China’s largest cities. Wuhan has seen a rapid expansion of its scale of urbanization since 1980, and the city center has been expanding, with a resident population of 12.33 million people by the end of 2020 and an annual GDP of RMB 1.56 trillion. The rapid expansion of construction land and reduction in ecological land, as a result of intensive human activities and policies, represent considerable obstacles to the preservation and effective utilization of urban ecosystems.

3.2. Data and Processing

The remote sensing image data used in this study are from 1990, 1995, 2000, 2005, 2010, 2015, and 2020, totaling seven periods of remote sensing image data from the Resource and Environment Science Data Center of the Chinese Academy of Sciences [43]. Referring to the current land-use types as revised by the Ministry of Land and Resources (MLR) in 2017 [44], the information was extracted using supervised types and human–computer interactive interpretation, and the land-use types were classified into seven major categories with a spatial resolution of 30 m: cropland, forest land, grassland, construction land, watersheds, wetlands, and unutilized land. Socioeconomic data, such as historical GDP per capita, the proportion of secondary and tertiary industries, the urbanization rate, and the disposable income of the urban population, were obtained from the China Urban Statistical Yearbook and the Wuhan Municipal Statistical Yearbook.
The carbon density data used in this study came from a carbon density dataset for Chinese terrestrial ecosystems. To cover as much of the study area as possible, Hubei Province and areas with the same climatic conditions were prioritized, and multiple samples were selected. The final carbon density was determined by averaging the carbon density values for each land-use type across all samples. Dead organic carbon density and other values were sourced primarily from previous studies [45,46,47,48]. The specific carbon density data are shown in Table 1.
Figure 2. Location of Wuhan in China. (a) Wuhan’s location in China, (b) Wuhan’s administrative areas, (c) elevation change, and (d) land-use types in 2020.
Land 12 02134 g002

3.3. Rates of Land-Use Change

This indicator describes the rate of change for a particular type of site and is calculated using the following formula [49]:
K i = U i b U i a U i a × 1 t × 100 %
where K i represents the index of the speed of land-use change, and U i a and U i b represent the area of the first and last periods of the study period for the land-use type, respectively; t is the study interval. When the unit of t is year, K i denotes the annual rate of change.
where K i is the rate of change of a certain type of site, U i a and U i b are the area at the beginning and the end of the site type, respectively; t is the length of the study, and K i corresponds to the annual rate of change when its unit is the year.

3.4. Terrestrial Carbon Storage Assessment Based on InVEST Modeling

The carbon storage calculations in this study utilized the Carbon module of the InVEST model. This module combines aboveground carbon density, belowground carbon density, soil organic carbon density, and dead organic carbon density to calculate the total carbon density for each land-use type. In this model, the total carbon density of the different land classes is treated as constant [50]. The formula is as follows:
C i = C i _ a b o v e + C i _ b e l o w + C i _ s o i l + C i _ d e a d
C i _ t o t a l = C i × A i
where C i denotes the total carbon density of the land category i ; C i _ a b o v e , C i _ b e l o w , C i _ s o i l , and C i _ d e a d are aboveground carbon density, belowground carbon density, soil organic carbon density, and dead organic carbon density for land class i , respectively; and C i _ t o t a l is the total carbon storage in land category i . A i is the area of land category i .

3.5. Pearson’s Correlation Coefficient

Pearson’s correlation coefficient was applied to investigate the relationships between carbon storage and population urbanization, land urbanization, economic urbanization and natural factors in Wuhan [51], respectively, with the following formula:
Q x y = h = 1 k x h x ¯ y h y ¯ h = 1 k x h x ¯ 2 h = 1 k y h y ¯ 2
where Q x y is the correlation coefficient between variables x , y ; x ¯ and y ¯ are the carbon storage and socioeconomic statistics, respectively, for the low- h year; and x ¯ and y ¯ denote the average value of carbon storage and the average value of socioeconomic statistics for the corresponding year, respectively.

4. Results

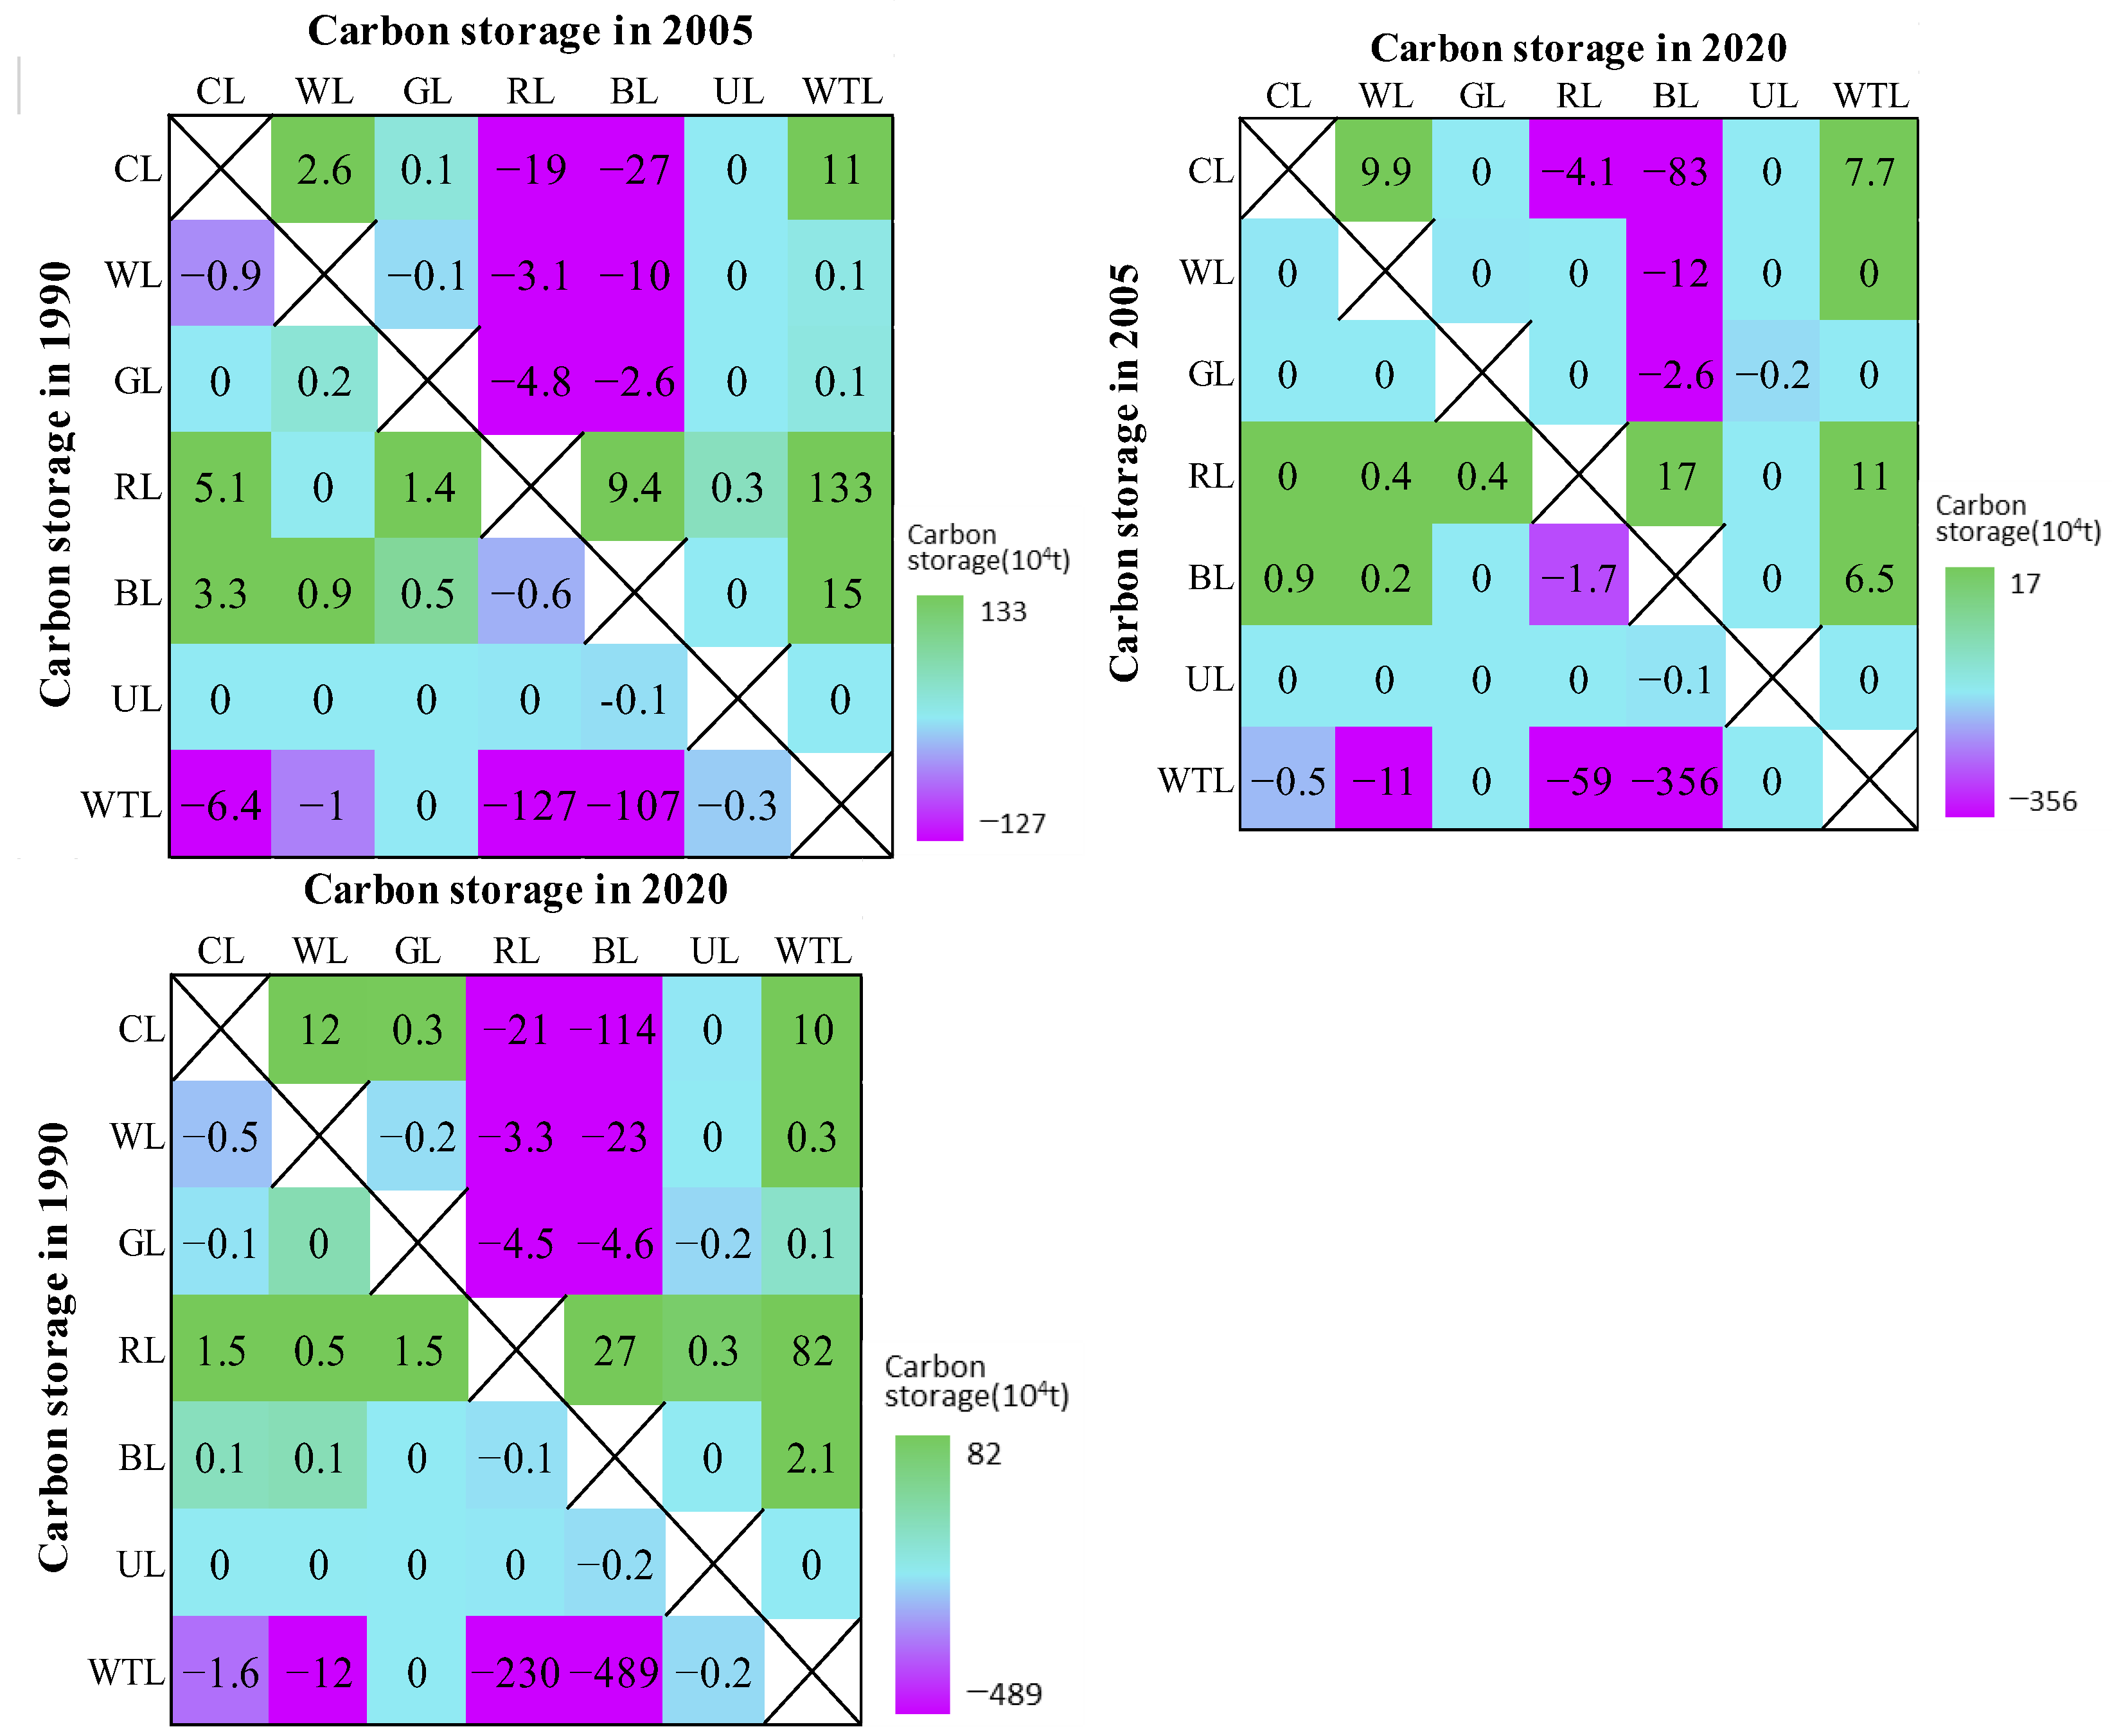
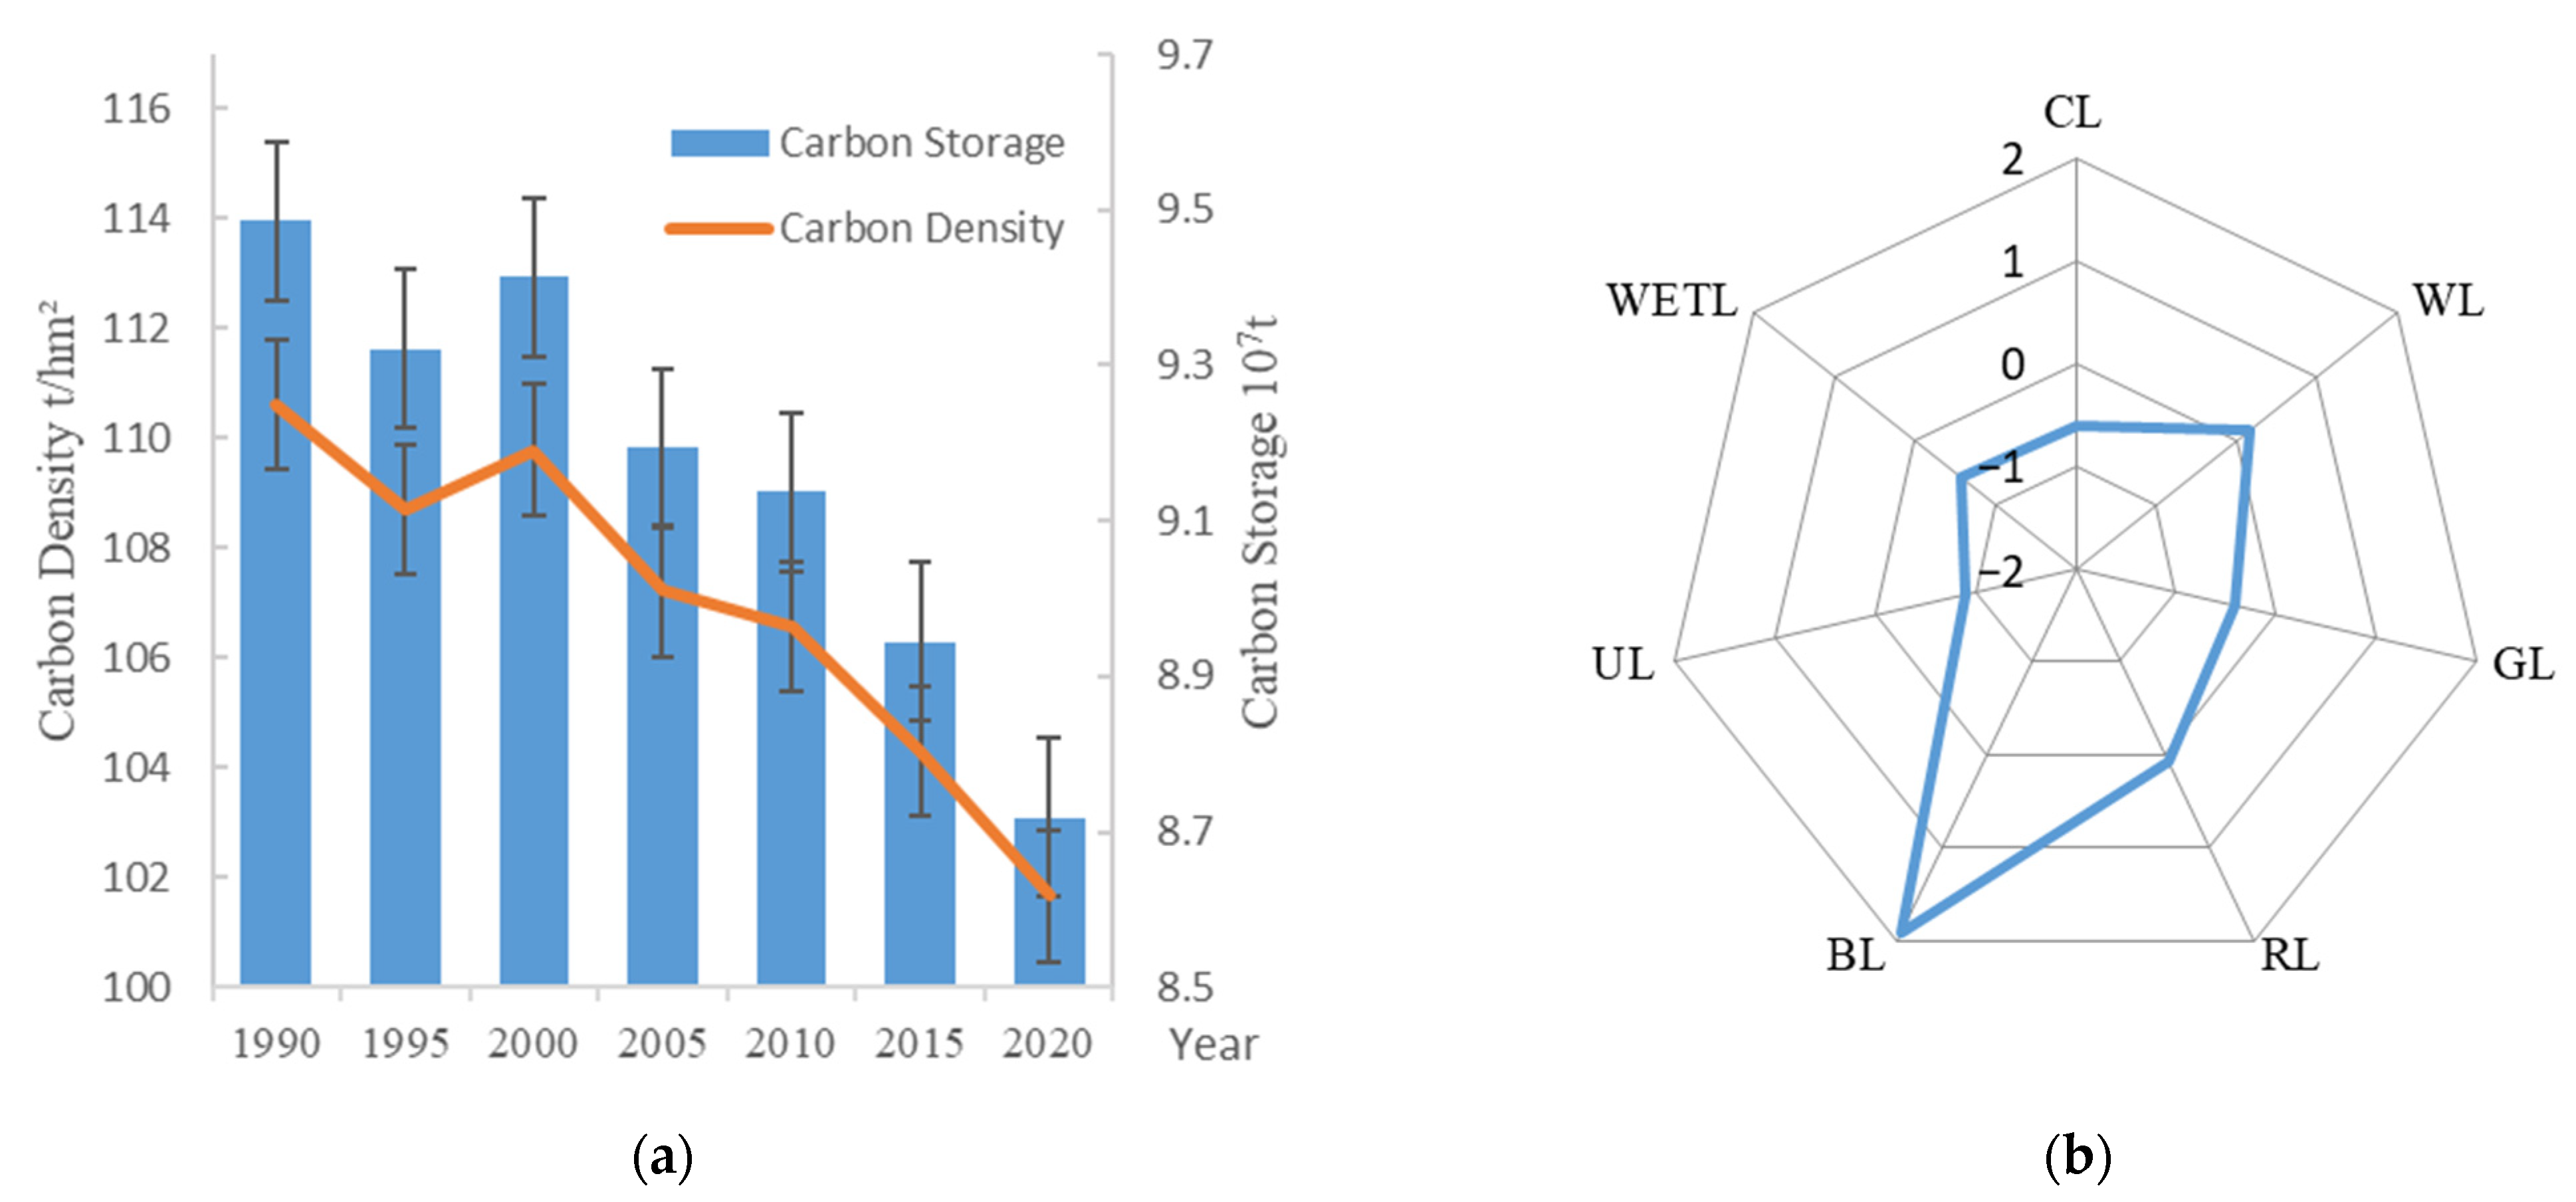
4.1. Characterization of Land-Use Change and Carbon Storage Changes

We used GIS 10.8 software to generate a distribution map of remotely sensed land-use types and to derive land-use transfer matrices for different time periods in order to provide a quantitative analysis of land-use transformation. Land-use changes in Wuhan City over the 30 years show different trends. Figure 3 shows that during the period of 1990–2005, the expansion of construction land’s area mainly dominated, with a new increase of about 87.7 km2, followed by the area of new water area, of which the area of water area converted to wetland is the largest, with 87.62 km2; the area of conversion to construction land reached 31.93 km2, and the conversion of arable land to construction land also reached 55.6 km2 during this period. The conversion of wetlands to built-up land reached 290.03 km2 in the period of 2005–2020, followed by the conversion of cropland to built-up land. As of 2020, the main ecological land in Wuhan is wetlands, accounting for about 35.96% of the entire urban land area, followed by cultivated land, accounting for about 19.08% of the total area. During these 30 years, due to the rapid development of Wuhan, the new land in the whole city was mainly dominated by construction land, in which large areas of wetlands and arable land were reduced. Wuhan, also known as the City of Wetlands, is a representative example of lake wetlands in the middle and lower reaches of the Yangtze River and the same latitude region of the world. The significant loss of wetlands poses a challenge to the city’s ecological environment. Protecting the balance between high-quality wetlands and promoting economic development in the region is of the utmost importance.
Overall, ecological land in Wuhan was mainly dominated by wetlands and woodlands from 1990 to 2020, and with the rapid advancement of urbanization, ecological land showed a gradual downward trend in terms of space and quantity. In 1990, the total ecological land area was 8015.65 km2, of which 45.05% was wetlands and 24.12% was cultivated land. By 2020, the ecological land in the study area had decreased to 7258.34 km2, with a decrease in the wetlands area of 528.42 km2. In terms of the transfer contribution rate shown in Figure 4, the most significant factor behind the decline of carbon storage between 1990 and 2005 was the transition of wetlands to watersheds, which resulted in a loss of 1.27 × 10⁶ t of carbon storage. This was closely followed by the transition of wetlands to built-up land, resulting in a loss of 1.08 × 10⁶ t of carbon storage. The main factor for the increase in carbon storage during this period was an increase of 1.33 × 10⁶ t in the conversion of waters to wetlands, and the conversion of urban waters to wetlands was the main reason for the increase in carbon storage.
The total carbon storage in Wuhan was 94.86 × 10⁶ t and 87.18 × 10⁶ t in 1990 and 2020, respectively, and the average carbon density was 110.63 t/hm2 and 101.67 t/hm2, respectively. This marked a decrease in the total carbon storage of 7.68 × 10⁶ t and a decrease in the average carbon density of 8.95 hm2 over the 30-year period, during which construction land in the city expanded by 759.89 km2 (Figure 5). The conversion between wetlands, woodlands, and other ecological land was the most important reason for the decrease in carbon storage and carbon density. Both carbon storage and carbon density declined relatively slowly from 2005 to 2010 (by about 0.56 × 10⁶ t and 0.65 t/hm2, respectively), and the downward trend widened significantly over the following five years. As shown by the radar chart, the absolute values of the rate of change of single land use during the period of 1990–2020 were, in descending order, constructed land, unused land, wetlands, cropland, grassland, forest land, and water, among which the values for forest land, water, and constructed land were positive, indicating that the area of their land use increased rapidly and changed drastically during the period of the study. Meanwhile, the other land-use categories were negative, especially unused land and wetlands, which saw the greatest decreases in terms of area.

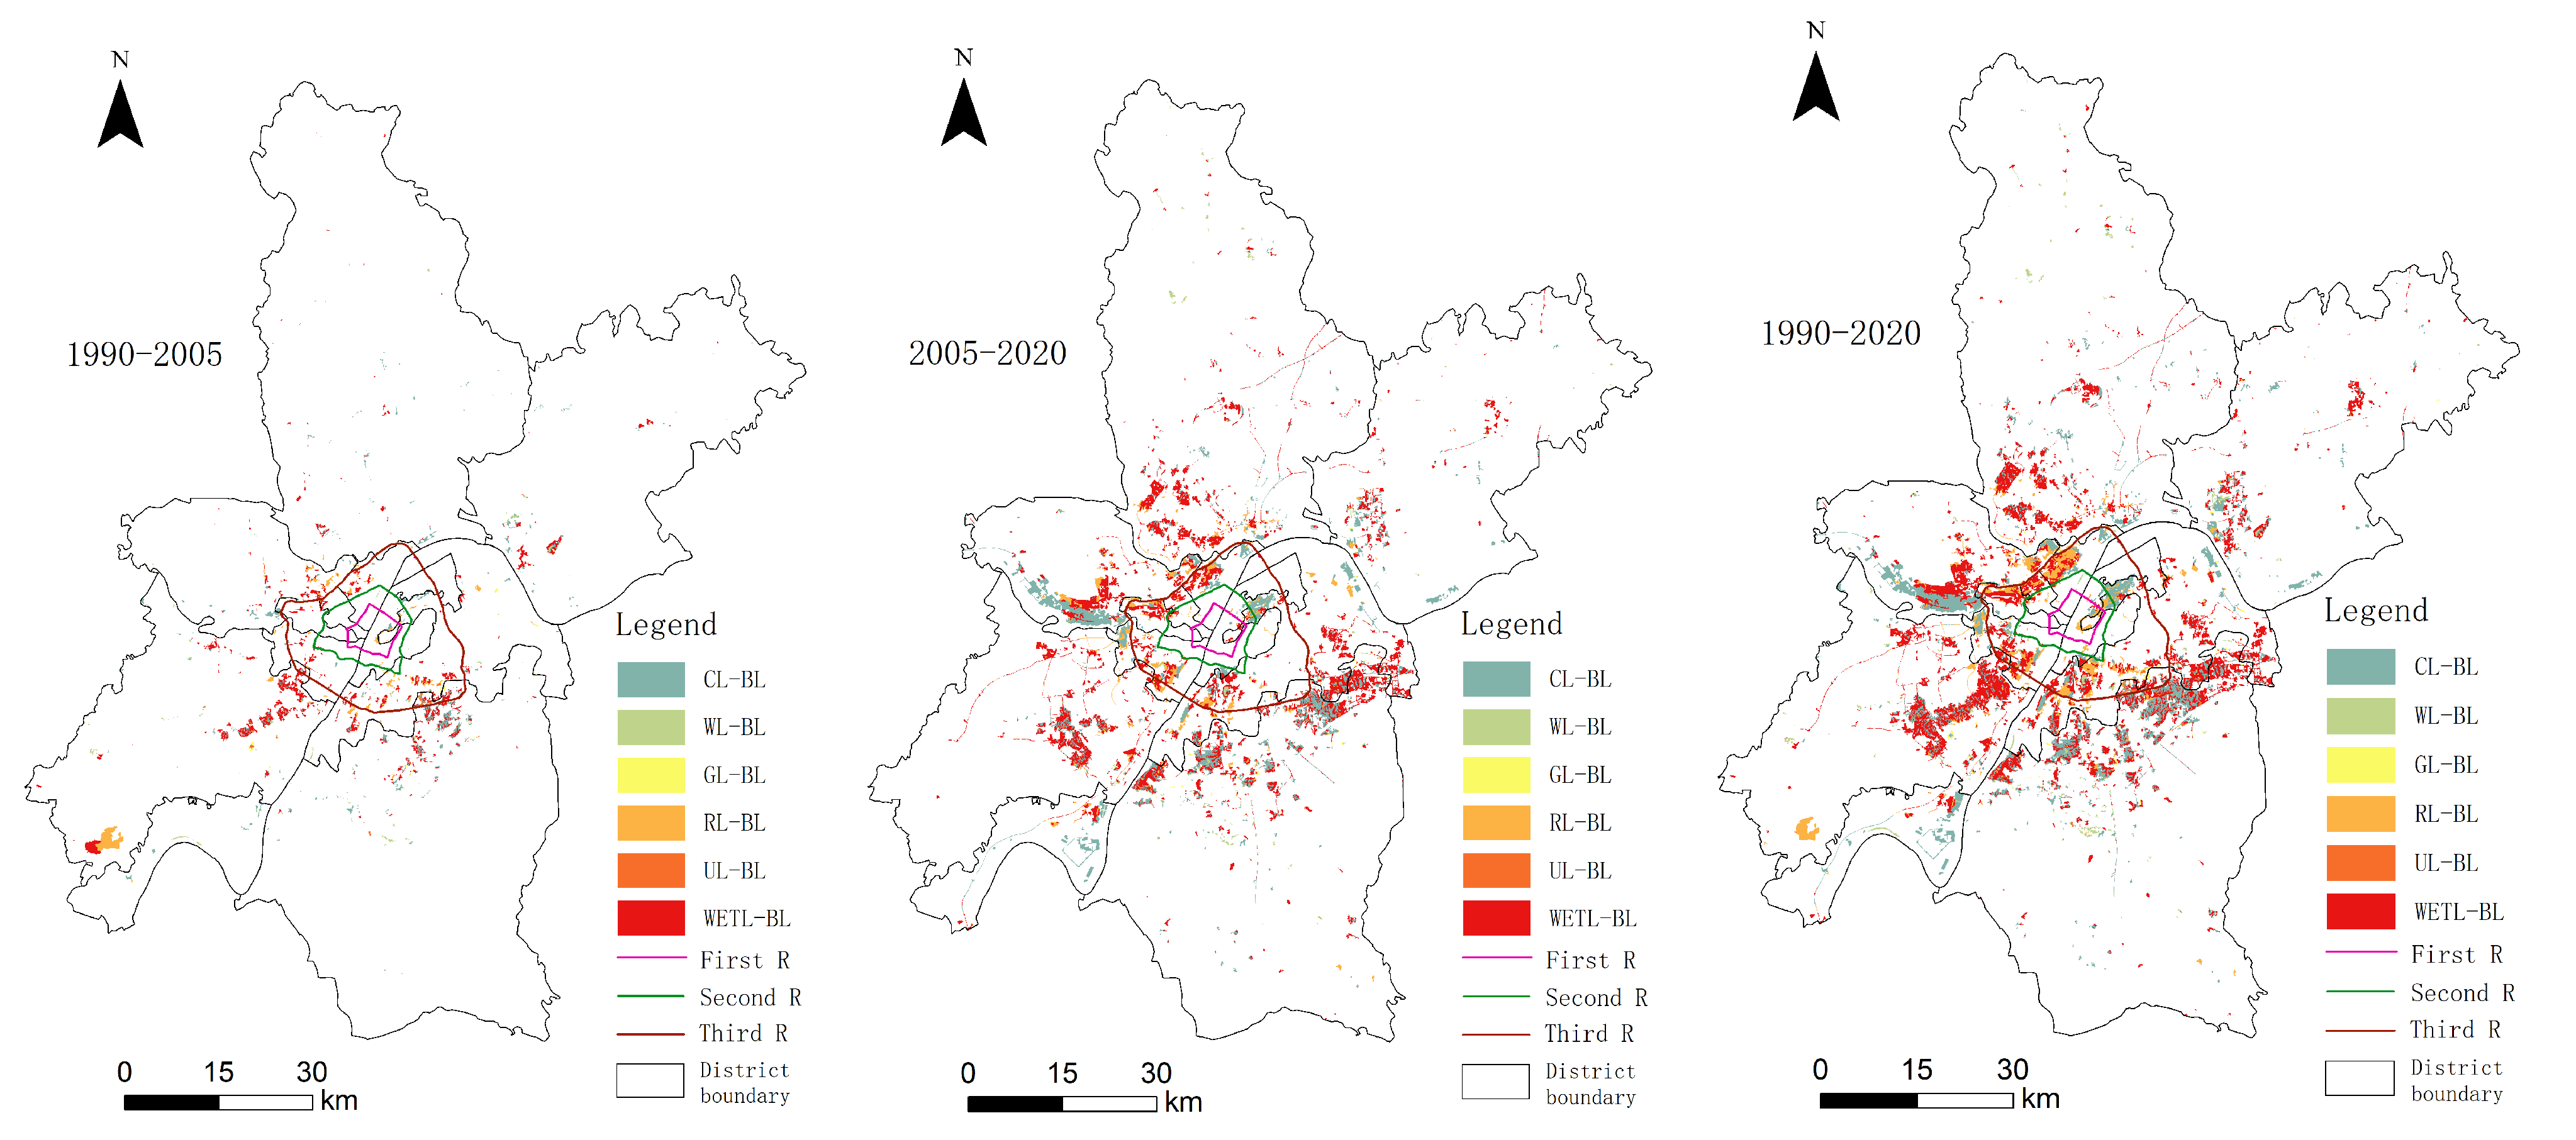
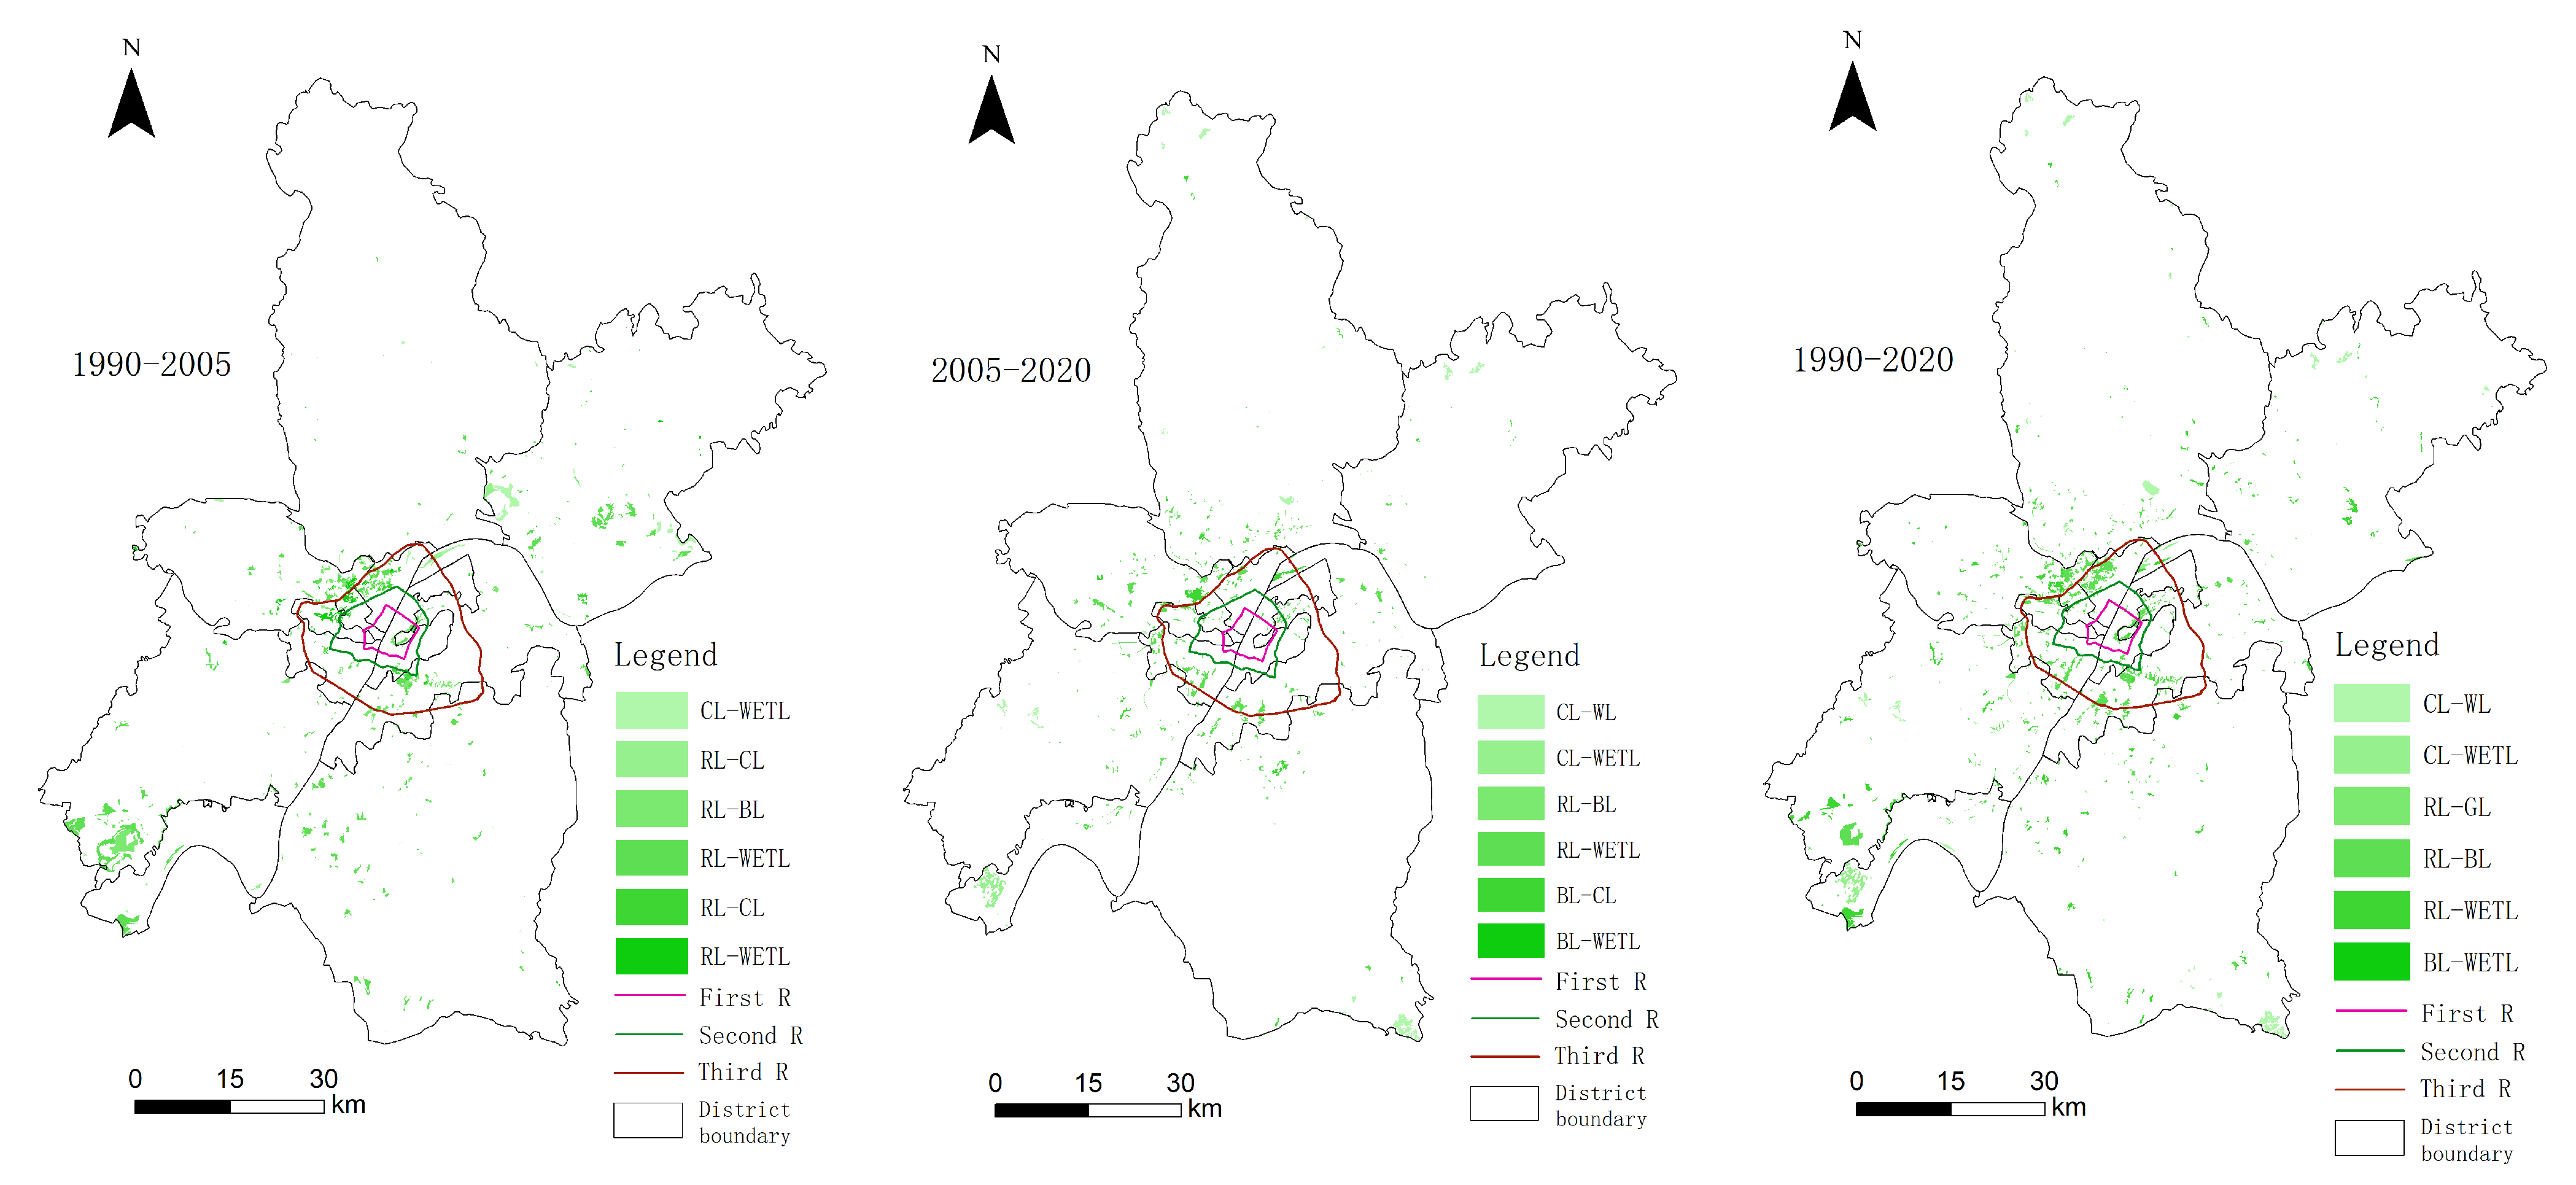
4.2. Spatial Analysis of Construction Land Expansion and Carbon Storage

Studies show that only 1% of the Earth’s surface is devoted to urban construction land, but that this area accounts for 76% of coal consumption [52]. Land-use change has become the dominant form of land transfer with the rapid pace of urbanization and industrialization, converting a significant amount of ecological land into construction land. This transfer occurs after the process of economic development and urbanization, resulting in significant declines in terrestrial carbon storage and increases in human carbon emissions. Therefore, it is particularly important to pay attention to the expansion of areas devoted to construction land.
The spatial pattern of the increase in the area dedicated to construction land over the 30-year period is shown in Figure 6. During the study period, the use of urban construction land changed drastically, and due to the accelerated process of urbanization, the area of construction land increased by about 757.31 km2, mainly by expanding outward from the center of Wuhan, and the increased area was mainly distributed in the western and southwestern parts of Wuhan City. The results show that from 1990 to 2020, Wuhan’s construction land expansion was characterized as follows:
Wuhan’s urbanization rate increased from 55.9% in 1990 to 84.31% in 2020, and the trend of converting former agricultural land to construction land near the city center is very obvious, particularly in the peripheral area near the Third Ring Road. From 1990 to 2005, construction land increased by 168.94 km2, mainly in the junction of Jiangxia District and Hongshan District, the eastern part of East and West Lake District, and the eastern part of Caidian District. From 2005 to 2020, the area of land dedicated to construction increased by 522.36 km2. The majority of the increased area was in the eastern part of Hongshan District, the southern areas of East and West Lake District, and the central parts of Caidian District and other regions.
The areas in which the ecological land carbon storage increased were mainly within the Third Ring Road and some areas in the south (see Figure 7). To maintain the stability of the ecosystem, especially in the center of Wuhan outside the Third Ring Road area, a large area of wetland waters was built up. In the zone of positive ecological evolution of carbon storage, the conversion of waters to wetlands was the main reason for the increase in carbon storage. From 1990 to 2020, 53.97 km2 of waters were converted to wetlands, with a conversion ratio of 67.6%, and 20.6 km2 of cropland were converted to forest land, with a conversion ratio of 30.2%. However, from the point of view of the increase in carbon storage areas, this was mainly seen in the conversion of waters into wetlands, where there was an increase of 3978.4 tons. The increase in the wetlands area due to the influence of topographic conditions and other factors was mainly seen in the eastern part of East and West Lakes and sporadically in the western part of Jiangxia District and other areas. Spatially, it is evident that during the 1990–2005 period, the increase in carbon storage mainly occurred in the vicinity of the Third Ring Road, while during the 2005–2020 period, in addition to part of the Third Ring Road, the increase in carbon storage was distributed across the southwestern part of Hannan District, the southeastern part of Jiangxia District, and other areas.
There was a large loss of terrestrial carbon storage due to the impact of urbanization, with a large amount of ecological land being transformed into construction land (see Figure 8). From a spatial point of view, this trend was mainly concentrated in the expansion beyond the Third Ring Road, the southern part of Hongshan District in the northern part of Jiangxia District, the southern part of East and West Lake District, and other areas that saw a large amount of carbon storage reduction. Wuhan is known as the City of Wetlands; so, to protect the quality of the city’s ecological environment, a large number of watershed wetland area restorations were carried out that greatly improved the city’s environmental quality. However, the wetlands ecological land—which serves a major carbon storage function—was converted into a large number of watersheds, and this was accompanied by the loss of a large number of paddy fields. Therefore, it is crucial to focus on safeguarding the ecological quality of the city’s environment and enhancing measures to control any losses in the paddy fields.
The total terrestrial carbon storage in Wuhan was 94.86 × 10⁶ t in 1990 and 87.18 × 10⁶ t in 2020. From 1990 to 2020, with the exception of the increase in the water area, ecosystem land showed a decreasing trend, with less land dedicated to urban wetlands, forest cover, etc. Wuhan’s carbon storage shows significant spatial heterogeneity, with suburbs storing most carbon, while central areas of Wuhan’s 3rd Ring Road store less carbon. Figure 9 shows the differences in carbon storage in the urban centers and suburbs during urbanization in the study area in 1990, 2005, and 2020, respectively. The figure highlights that the regions with considerable carbon storage were predominantly situated in the northwest of the study area—which has a relatively high elevation, high vegetation cover—and are mainly located in Huangpi District, Xinzhou District, the central part of Jiangxia District, and the western part of Caidian District, which are located in the suburbs of Wuhan and have a relatively low degree of urbanization and where the main types of land use are forest and grassland. The highest carbon density value was 166.35 t/hm2. The regions exhibiting minimal carbon storage were largely situated in the central urban area of Wuhan City, characterized by a significant degree of urbanization and land-use types predominantly consisting of construction land and arable land. Areas with high carbon storage show a clear downward trend due to the greater influence of human activities.

4.3. Correlation Analysis of Terrestrial Carbon Storage

This paper also systematically assesses the correlation between carbon storage and the factors affecting them in the context of urbanization. The size of the correlation with carbon storage was determined in terms of four main aspects: population urbanization, land urbanization, economic urbanization, and natural factors. In Table 2, for population urbanization, we chose the urbanization rate to express the proportion of the urban population; land urbanization to express the proportion of the built-up urban area; and the proportion of land used for industrial and mining construction. For economic urbanization, we chose the ratio of secondary and tertiary industries, GDP per capita, etc. For natural factors, we chose the average annual temperature and the average annual precipitation. The results show that the disposable income of the urban population is significantly negatively correlated with carbon storage levels (the Pearson correlation coefficient is 0.964, passing the 0.01 level of significance), the proportion of land used for industrial and mining construction is significantly negatively correlated with carbon storage levels (Pearson correlation coefficient is 0.952, passing the 0.05 level of significance), the GDP per capita is significantly negatively correlated with carbon storage levels (Pearson correlation coefficient is 0.95, passing the 0.05 level of significance), and the urbanization rate, proportion of tertiary industry, and average annual precipitation are significant at the 0.05 level. The results show that there is a strong correlation between anthropogenic economic development and carbon storage. Analyzing the reasons for this, it can be concluded that the rapid development of urban industries and the rapid increase in the population’s income levels have accelerated the consumption of material goods and increased investment in the construction of the city, which has destroyed the ecosystem and led to a large amount of carbon storage loss.
Ignoring the influence of human activities, climate change is the principal element that impacts the dimensions of aquatic and marshy regions. The source of water in these areas is predominantly from precipitation. An augmentation in atmospheric precipitation contributes significantly to the expansion of lake areas. From another perspective, increases in atmospheric temperature are the primary reason for the rapid evaporation of water, and when the temperature is high, the rate of emanation increases, leading to a decrease in the area of Wuhan’s lakes [53]. Analyses of the results show that temperature changes are not strongly correlated with carbon storage. This is due to the fact that among the land-use types, there is less carbon storage stored by the watersheds, and the year-on-year difference in the average temperature change is not obvious. Meanwhile, the average precipitation increases from year to year; so, there is not a great deal driving changes in carbon storage due to the influencing factor of air temperature. Human activities have had a profound impact on Wuhan’s ecological land area, particularly due to the rapid development of industry and the expansion of construction. Such high-intensity operations continue to diminish ecological land, as evidenced by Wuhan’s urbanization rate, which increased from 55% in 1990 to 84.3% in 2020. As Wuhan’s economy and urbanization continue to develop at an accelerated rate, the corresponding urban ecological land continues to diminish.

5. Discussion

5.1. Impacts of Changes in Land Use and Carbon Storage

Since 1978, China’s urbanization process has undergone a rapid transformation, and the impacts on urban land and its ecology have continued to increase as urbanization and human living standards have gradually improved [34,54,55]. As land is a basic human production factor in the process of urbanization and industrialization, the regional land-use structure not only affects the economic structure and industrial layout but is also directly related to carbon changes [32,56]. To promote environmentally friendly development, it is essential to address significant ecological issues, enhance the safeguarding of ecosystems, revamp regulatory frameworks for ecology and environmental protection, and implement a diversified market-led system of ecological compensation [57,58,59]. With various ecological objectives for development and protection in different parts of the city, resolving this issue is crucial to ensure low-carbon operations and to attain regional equity and sustainable development. Effective incentives to alleviate the tension between economic progress and environmental conservation need to be implemented [33,60,61].
The results of this study show that the conversion of ecological land to built-up land is the most dominant type of conversion. In terms of carbon storage transfer contributions, the conversion of wetlands to watersheds is the largest contributor to carbon storage depletion, and these results are influenced by a combination of government initiatives, increases in socioeconomic levels, and ecological protection [62,63,64]. This study also analyzes the spatial distribution of urban construction land in the region, as well as the influence of natural conditions and anthropogenic activities. Combining time and space, this study also analyzes the spatial distribution of urban construction land in the region, as well as the positive and negative regional characteristics of carbon storage and the magnitude of the impact of natural conditions and anthropogenic activities on carbon storage as a theoretical basis for exploring their intrinsic influences. The expansion of construction land for socioeconomic development in Wuhan is a direct driver of terrestrial carbon storage. Especially in faster-developing cities, a large amount of ecological land is transferred out, and through the implementation of the wetland protection policy in Wuhan, the wetland watershed area has increased in recent years, and ecological land has been protected to some extent. These results are basically in line with what was promised [65]. In addition, due to continuous improvement in human living standards and accelerated demand for materials, policymakers continue to optimize the urban structure, which indirectly leads to the decline in ecosystem carbon storage. There are also quite a few studies focusing on the combination of carbon storage and predictive land-use change models, which simulate future land-use trends by setting future scenarios but do not carry out a more detailed analysis of its influencing factors [25,26,66,67]. In an attempt to compensate for this deficiency, this study focuses on analyzing the intrinsic influences on carbon storage.
The results show that during the period from 1990 to 2005, there was an increase of 87.7 km2 in developed land, which rose to 535.4 km2 during the 2005 to 2020 period. The majority of this encroachment on land came from ecological land, which serves as the primary means of storing carbon. From the viewpoint of carbon storage loss, the conversion of wetlands to waters from 1990 to 2005 was the main reason for the decline in carbon storage, with a loss of 1.27 × 10⁶ t, followed by the occupation of wetlands by construction land, which resulted in a loss of 1.08 × 10⁶ t, and from the perspective of increasing carbon storage, the transformation of a vast expanse of water into wetlands was the primary factor that led to a rise in carbon storage, by approximately 1.34 × 10⁶ t. However, by the 2005–2020 period, wetlands occupied by construction land caused the loss of carbon storage to reach 3.56 × 10⁶ t, which was the biggest factor in the decrease in carbon storage. Carbon storage in Wuhan declined by an average of 0.19 × 10⁶ t per year between 1990 and 2005, and by an average of 0.31 × 10⁶ t per year between 2005 and 2020. The results regarding carbon storage in this study are not too far from those in a previous study [68]. The scale of investment in urban land development has increased over the past 30 years, especially as land values in old urban areas continue to rise. Coupled with restrictions on the space available for development, development and building have tended to be on sites that have lower ecological land value. Urban wetlands play a series of important ecological functions, such as habitat support, climate regulation, and water conservation, and as the wetlands land-use type accounts for the largest proportion of terrestrial ecological carbon storage, the occupation of wetlands raises the risk of loss and degradation of carbon storage. The urbanization rate increased from 55% to 84.31% over the study period, and the increase in urbanization also seriously affected the quantity and quality of ecological land. Therefore, in the future, it is important to consider sustainable development that strikes a balance between the economy and the environment. With deepening urbanization and rising economic standards, it is necessary to pay attention to using ecological resources rationally, preserving ecological area and quality, and promoting metropolitan development with more scientific and effective planning and implementation features.

5.2. Causes of the Regional Distribution of Carbon Storage

Wuhan is known as the City of Wetlands, and since the end of the 20th century, due to the high development value of the city’s lakeshore wetlands area and the high profitability of the industry, it has become a strip of land competed for by major developers, resulting in major losses of carbon storage. Other studies have discussed and analyzed the same results [6]. The leaders of the International Convention on Wetlands have restated the Wuhan Declaration to demonstrate once again the importance of healthy ecosystems for climate security, biodiversity conservation, and the harmonious development of humankind. The urban built-up land area increased by about 757.31 km2 during the study period, with the expansion area mainly spreading outward around the city center. The area of increase in terrestrial carbon storage is mainly distributed around the Third Ring Road in Wuhan. In response to the relevant policies to protect wetlands and meet the needs of urban development, large areas of forests and wetlands outside the Third Ring Road have been protected as a matter of priority. In terms of carbon storage loss, the occupation of other ecological land by construction land is the most direct factor. From a spatial point of view, the loss areas are mainly in the central and southwestern regions of Wuhan, with some paddy fields transformed into large lake waters and construction land. The spatial distribution of carbon storage within urban areas exhibits marked heterogeneity. Carbon storage is highest in areas located outside the city center, whereas the center itself has the lowest level of carbon storage. A substantial proportion of ecological land in the center has undergone conversion to commercial and residential usage, and a dearth of tree cover accounts for the scanty carbon storage in this location.

5.3. Policy Implications

In 2017, Wuhan issued a carbon peaking plan to reduce urban carbon emissions and increase carbon sinks by optimizing the layout of urban ecosystems and ensuring the completion of the implementation of ecological restoration projects in the national territory space. The decline in ecological land area during rapid urbanization is the most direct factor affecting terrestrial carbon storage [69,70]. To this end, the negative ecological impacts of urban expansion should be taken into account, as well as the need for urban economic development. The following recommendations are made at the macro and micro levels: (1) Future urban planning should harmonize economic development and ecological protection as the core of urban development so as to control the scale of expansion of Wuhan’s urban construction land, improve the efficiency of land use within the main urban area, and reduce the growth rate of the city’s impervious surface while at the same time improving the balance of the city’s ecosystem. (2) This study shows that Wuhan’s wetlands are its most important carbon reservoir; so, policymakers should protect the proportion of ecological land; set up permanent green belts; strictly abide by the red line of land use, such as by protecting paddy fields, to limit the downward trend in carbon storage brought by rapid urbanization; protect the wetlands; and reduce encroachment on ecological land use in the process of development. (3) The government should improve land-use management policies in the urban ecosystem in a timely manner, for example, by improving the land-use efficiency of old urban areas through measures such as the renovation of old cities, optimizing the land-use structure, and building low-carbon cities.

6. Conclusions

Terrestrial carbon storage is one of the important ways to combat climate change and plays an increasingly important role in the carbon neutralization process. However, due to the acceleration of human economic activities, construction land has taken up a large amount of ecological land, resulting in a rapid declining trend in carbon storage. The transfer matrix identifies the main types of land-use conversion during the study period and the magnitude of the impact of land-use conversion on carbon storage. Spatial visualization was used to identify the areas of carbon storage increases and decreases, as well as the spatiotemporal characteristics of carbon storage in Wuhan City. The correlation analysis method was used to study the correlation of natural and anthropogenic processes on carbon storage changes during the process of urbanization. The results of the study show the following:
As a result of human activities, multiple changes in land-use types have occurred in Wuhan, with wetlands and cropland decreasing by 528.42 km2 and 297.28 km2, respectively, and construction land, watersheds, and forests increasing by 757.311 km2, 35.23 km2, and 43.54 km2, respectively, over the past 30 years, with most of the expansion of construction land occupying cropland and wetlands. Among them, wetlands accounted for the largest proportion of ecological land, and the overall ecological land in Wuhan fell by 725.8 km2 by 2020. It was found that the conversion of wetlands to watersheds was the largest cause of carbon storage loss among carbon storage conversions, and the conversion of wetlands to construction land was the second-largest cause, and it is not difficult to see from the results that the area of wetlands in Wuhan City directly affects the magnitude of the carbon storage. Wuhan’s urbanization level has increased rapidly in recent decades, and at the same time, the encroachment of a large amount of construction land on ecological land has accelerated the process of urbanization and industrialization. The encroachment of ecological land by construction land is the main reason for the reduction in carbon storage, and spatially shows the expansion of construction land from the center of Wuhan to the outside. The areas that saw a positive evolution in terms of carbon storage were mainly in the outer part of Wuhan’s Third Ring Road and the southern part of Wuhan City, and the areas that saw a negative evolution area were highly similar to the area of construction land expansion. Overall, there is a clear spatial heterogeneity in the distribution of urban carbon storage: the carbon storage increases as the distance from the city center increases, and decreases as the distance from the center decreases. Carbon storage in the urban ecosystems has undergone drastic changes, and this study shows that the overall carbon storage declined year by year from 1990 to 2020, and in 2020, the carbon storage in Wuhan was 87.18 × 10⁶ t and the carbon density was 101.67 t/hm2, which declined by 7.68 × 10⁶ t and 8.95 t/hm2, respectively, during the study period, and the carbon storage mainly decreased in the low-altitude areas. The absolute value of the rate of change in land use was largest for construction land (1.92), followed by unutilized land (−0.91). The analysis of the correlation the carbon storage shows that the disposable income of the urban population, the proportion of industrial and mining land, and the GDP per capita pass the significance test and that they are strongly correlated with carbon storage. In terms of natural factors, the analysis reveals that precipitation is also highly correlated with carbon storage. The results further verify that the change in the carbon storage in Wuhan was influenced by both socioeconomic and natural factors. Appropriately controlling the expansion of construction land in low-altitude areas, strengthening the protection of wetlands and other ecological land, focusing on industrial optimization, and enhancing the efficiency of land use are some of this study’s recommendations.
It is worth noting that the time span of this study is relatively short and that its conclusions can only represent the distribution and spatial characteristics of carbon storage in Wuhan City in the short term, mainly considering vertical carbon fluxes and neglecting horizontal fluxes, such as the type and age of forests and the density of different grasslands. It has been shown that the expansion of the urban land area has disrupted the original carbon balance and that the ecological land around the city has changed over time. Due to the rapid development of internal structural changes in the city, the resulting carbon density also declined over time. The carbon density coefficients used in this study came from previous research, and this study did not carry out field-related inspections or testing. Therefore, it is certainly possible that there are corresponding calculation errors. In the future, research related to the field-related measurement of carbon density can be carried out to calculate the results more accurately. Finally, the findings of this study should be of great reference significance in helping rapidly urbanizing areas formulate regional land-use policies, delineate ecological red lines, and improve the inner-city ecological environment to achieve regional carbon neutrality. The next stage should be to provide a useful tool for the comprehensive evaluation of carbon emissions and carbon sinks to realize high-quality urban development.

Author Contributions

Writing—original draft, S.X.; Writing—review & editing, S.Y. Investigation, H.S.; Data curation, Y.W. All authors have read and agreed to the published version of the manuscript.

Funding

This research was funded by National Natural Science Foundation of China (NSFC) grant No. 41801189.

Data Availability Statement

The data set is provided by Data Center for Resources and Environmental Sciences, Chinese Academy of Sciences (RESDC) (http://www.resdc.cn). Readers who need the China Ecosystem Carbon Density Dataset can access it on the China Ecosystem Observation Research Network (CERN) Data Resource Service website (http://cnern.org.cn/).

Conflicts of Interest

The authors declare no conflict of interest.

References

  1. Agnolucci, P.; Rapti, C.; Alexander, P.; De Lipsis, V.; Holland, R.A.; Eigenbrod, F.; Ekins, P. Impacts of rising temperatures and farm management practices on global yields of 18 crops. Nat. Food 2020, 1, 562–571. [Google Scholar] [CrossRef] [PubMed]
  2. Solomon, S.; Plattner, G.K.; Knutti, R.; Friedlingstein, P. Irreversible climate change due to carbon dioxide emissions. Proc. Natl. Acad. Sci. USA 2009, 106, 1704–1709. [Google Scholar] [CrossRef] [PubMed]
  3. IPCC. Intergovernmental Panel on Climate Change; IPCC Secretariat: Geneva, Switzerland, 2021. [Google Scholar]
  4. Li, J.S.; Guo, X.M.; Chuai, X.W.; Xie, F.J.; Yang, F.; Gao, R.Y.; Ji, X.P. Reexamine China’s terrestrial ecosystem carbon balance under land use-type and climate change. Land Use Policy 2021, 102, 105275. [Google Scholar] [CrossRef]
  5. Houghton, R.A.; House, J.I.; Pongratz, J.; van der Werf, G.R.; DeFries, R.S.; Hansen, M.C.; Le Quéré, C.; Ramankutty, N. Carbon emissions from land use and land-cover change. Biogeosciences 2012, 9, 5125–5142. [Google Scholar] [CrossRef]
  6. He, C.Y.; Zhang, D.; Huang, Q.X.; Zhao, Y.Y. Assessing the potential impacts of urban expansion on regional carbon storage by linking the LUSD-urban and InVEST models. Environ. Model. Softw. 2016, 75, 44–58. [Google Scholar] [CrossRef]
  7. Piao, S.L.; Fang, J.Y.; Ciais, P.; Peylin, P.; Huang, Y.; Sitch, S.; Wang, T. The carbon balance of terrestrial ecosystems in China. Nature 2009, 458, 1009–1013. [Google Scholar] [CrossRef]
  8. Schimel, D.S.; House, J.I.; Hibbard, K.A.; Bousquet, P.; Ciais, P.; Peylin, P.; Braswell, B.H.; Apps, M.J.; Baker, D.; Bondeau, A.; et al. Recent patterns and mechanisms of carbon exchange by terrestrial ecosystems. Nature 2001, 414, 169–172. [Google Scholar] [CrossRef] [PubMed]
  9. Fang, H.Y.; Ji, B.Y.; Deng, X.; Ying, J.Y.; Zhou, G.M.; Shi, Y.J.; Xu, L.; Tao, J.X.; Zhou, Y.F.; Li, C.; et al. Effects of topographic factors and aboveground vegetation carbon stocks on soil organic carbon in Moso bamboo forests. Plant Soil 2018, 433, 363–376. [Google Scholar] [CrossRef]
  10. Privitera, R.; Palermo, V.; Martinico, F.; Fichera, A.; La Rosa, D. Towards lower carbon cities: Urban morphology contribution in climate change adaptation strategies. Eur. Plan. Stud. 2018, 26, 812–837. [Google Scholar] [CrossRef]
  11. Feng, Y.J.; Chen, S.R.; Tong, X.H.; Lei, Z.K.; Gao, C.; Wang, J.F. Modeling changes in China’s 2000-2030 carbon stock caused by land use change. J. Clean. Prod. 2020, 252, 119659. [Google Scholar] [CrossRef]
  12. Chuai, X.W.; Huang, X.J.; Wang, W.J.; Zhao, R.Q.; Zhang, M.; Wu, C.Y. Land use, total carbon emission’s change and low carbon land management in Coastal Jiangsu, China. J. Clean. Prod. 2015, 103, 77–86. [Google Scholar] [CrossRef]
  13. Pickett, S.T.; Cadenasso, M.L.; Grove, J.M.; Nilon, C.H.; Pouyat, R.V.; Zipperer, W.C.; Costanza, R. Urban ecological systems: Linking terrestrial ecological, physical, and socioeconomic components of metropolitan areas. Annu. Rev. Ecol. Syst. 2001, 32, 127–157. [Google Scholar] [CrossRef]
  14. Collins, J.P.; Kinzig, A.; Grimm, N.B.; Fagan, W.F.; Hope, D.; Wu, J.; Borer, E.T. A New Urban Ecology Modeling human communities as integral parts of ecosystems poses special problems for the development and testing of ecological theory. Am. Sci. 2000, 88, 416–425. [Google Scholar] [CrossRef]
  15. Chave, J.; Rejou-Mechain, M.; Burquez, A.; Chidumayo, E.; Colgan, M.S.; Delitti, W.B.; Duque, A.; Eid, T.; Fearnside, P.M.; Goodman, R.C.; et al. Improved allometric models to estimate the aboveground biomass of tropical trees. Glob. Change Biol. 2014, 20, 3177–3190. [Google Scholar] [CrossRef] [PubMed]
  16. Davidson, E.A.; Janssens, I.A. Temperature sensitivity of soil carbon decomposition and feedbacks to climate change. Nature 2006, 440, 165–173. [Google Scholar] [CrossRef]
  17. Hutyra, L.R.; Yoon, B.; Hepinstall-Cymerman, J.; Alberti, M. Carbon consequences of land cover change and expansion of urban lands: A case study in the Seattle metropolitan region. Landsc. Urban Plan. 2011, 103, 83–93. [Google Scholar] [CrossRef]
  18. Picchio, R.; Tavankar, F.; Rafie, H.; Kivi, A.R.; Jourgholami, M.; Lo Monaco, A. Carbon Storage in Biomass and Soil after Mountain Landscape Restoration: Pinus nigra and Picea abies Plantations in the Hyrcanian Region. Land 2022, 11, 422. [Google Scholar] [CrossRef]
  19. Ren, Y.; Wei, X.; Wei, X.H.; Pan, J.Z.; Xie, P.P.; Song, X.D.; Peng, D.; Zhao, J.Z. Relationship between vegetation carbon storage and urbanization: A case study of Xiamen, China. For. Ecol. Manag. 2011, 261, 1214–1223. [Google Scholar] [CrossRef]
  20. Meng, Y.C.; Gou, R.K.; Bai, J.K.; Moreno-Mateos, D.; Davis, C.C.; Wan, L.M.; Song, S.S.; Zhang, H.S.; Zhu, X.S.; Lin, G.H. Spatial patterns and driving factors of carbon stocks in mangrove forests on Hainan Island, China. Glob. Ecol. Biogeogr. 2022, 31, 1692–1706. [Google Scholar] [CrossRef]
  21. Houghton, R.A. Carbon emissions and the drivers of deforestation and forest degradation in the tropics. Curr. Opin. Environ. Sustain. 2012, 4, 597–603. [Google Scholar] [CrossRef]
  22. Ramankutty, N.; Gibbs, H.K.; Achard, F.; Defriess, R.; Foley, J.A.; Houghton, R.A. Challenges to estimating carbon emissions from tropical deforestation. Glob. Change Biol. 2007, 13, 51–66. [Google Scholar] [CrossRef]
  23. Baccini, A.; Goetz, S.J.; Walker, W.S.; Laporte, N.T.; Sun, M.; Sulla-Menashe, D.; Hackler, J.; Beck, P.S.A.; Dubayah, R.; Friedl, M.A.; et al. Estimated carbon dioxide emissions from tropical deforestation improved by carbon-density maps. Nat. Clim. Change 2012, 2, 182–185. [Google Scholar] [CrossRef]
  24. Chen, Y.; Yue, W.Z.; Liu, X.; Zhang, L.L.; Chen, Y.A. Multi-Scenario Simulation for the Consequence of Urban Expansion on Carbon Storage: A Comparative Study in Central Asian Republics. Land 2021, 10, 608. [Google Scholar] [CrossRef]
  25. Jiang, W.G.; Deng, Y.; Tang, Z.H.; Lei, X.; Chen, Z. Modelling the potential impacts of urban ecosystem changes on carbon storage under different scenarios by linking the CLUE-S and the InVEST models. Ecol. Model. 2017, 345, 30–40. [Google Scholar] [CrossRef]
  26. Liu, Q.; Yang, D.D.; Cao, L.; Anderson, B. Assessment and Prediction of Carbon Storage Based on Land Use/Land Cover Dynamics in the Tropics: A Case Study of Hainan Island, China. Land 2022, 11, 244. [Google Scholar] [CrossRef]
  27. Liu, K.; Zhang, C.Z.; Zhang, H.; Xu, H.; Xia, W. Spatiotemporal Variation and Dynamic Simulation of Ecosystem Carbon Storage in the Loess Plateau Based on PLUS and InVEST Models. Land 2023, 12, 1065. [Google Scholar] [CrossRef]
  28. Dixon, R.K.; Brown, S.; Houghton, R.A.; Solomon, A.M.; Trexler, M.C.; Wisniewski, J. Carbon pools and flux of global forest ecosystems. Science 1994, 263, 185–190. [Google Scholar] [CrossRef]
  29. Schimel, D.S. Terrestrial ecosystems and the carbon-cycle. Glob. Change Biol. 1995, 1, 77–91. [Google Scholar] [CrossRef]
  30. Girmay, G.; Singh, B.R.; Mitiku, H.; Borresen, T.; Lal, R. Carbon stocks in Ethiopian soils in relation to land use and soil management. Land Degrad. Dev. 2008, 19, 351–367. [Google Scholar] [CrossRef]
  31. Jiang, Z.; Lin, B. China’s energy demand and its characteristics in the industrialization and urbanization process. Energy Policy 2012, 49, 608–615. [Google Scholar] [CrossRef]
  32. Houghton, R.A.; Hackler, J.L. Emissions of carbon from forestry and land-use change in tropical Asia. Glob. Change Biol. 1999, 5, 481–492. [Google Scholar] [CrossRef]
  33. Wang, S.H.; Huang, S.L.; Huang, P.J. Can spatial planning really mitigate carbon dioxide emissions in urban areas? A case study in Taipei, Taiwan. Landsc. Urban Plan. 2018, 169, 22–36. [Google Scholar] [CrossRef]
  34. Chen, R.; Chen, Y.; Lyulyov, O.; Pimonenko, T. Interplay of Urbanization and Ecological Environment: Coordinated Development and Drivers. Land 2023, 12, 1459. [Google Scholar] [CrossRef]
  35. Fornara, D.; Olave, R.; Higgins, A. Evidence of low response of soil carbon stocks to grassland intensification. Agric. Ecosyst. Environ. 2020, 287, 106705. [Google Scholar] [CrossRef]
  36. Wei, Y.D.; Ye, X.Y. Urbanization, urban land expansion and environmental change in China. Stoch. Environ. Res. Risk Assess. 2014, 28, 757–765. [Google Scholar] [CrossRef]
  37. Zou, H.; Duan, X.J.; Jin, T.T. Urban Chemical Industrial Cluster Area Restructuring and Determinants: A Case Study of a Typical Old Chemical Industry Area Along the Yangtze River, China. Chin. Geogr. Sci. 2022, 32, 237–250. [Google Scholar] [CrossRef]
  38. Feng, X.H.; Xiu, C.L.; Bai, L.M.; Zhong, Y.X.; Wei, Y. Comprehensive evaluation of urban resilience based on the perspective of landscape pattern: A case study of Shenyang city. Cities 2020, 104, 102722. [Google Scholar] [CrossRef]
  39. Zou, N.; Wang, C.; Wang, S.Y.; Li, Y.Y. Impact of ecological conservation policies on land use and carbon stock in megacities at different stages of development. Heliyon 2023, 9, E18814. [Google Scholar] [CrossRef]
  40. Zhang, Y.; Liu, Y.F.; Wang, Y.H.; Liu, D.F.; Xia, C.; Wang, Z.Y.; Wang, H.F.; Liu, Y.L. Urban expansion simulation towards low-carbon development: A case study of Wuhan, China. Sustain. Cities Soc. 2020, 63, 102455. [Google Scholar] [CrossRef]
  41. Wang, F.; Fan, W.N.; Liu, J.; Wang, G.; Chai, W. The effect of urbanization and spatial agglomeration on carbon emissions in urban agglomeration. Environ. Sci. Pollut. Res. 2020, 27, 24329–24341. [Google Scholar] [CrossRef]
  42. Liu, X.P.; Wang, S.J.; Wu, P.J.; Feng, K.S.; Hubacek, K.; Li, X.; Sun, L.X. Impacts of Urban Expansion on Terrestrial Carbon Storage in China. Environ. Sci. Technol. 2019, 53, 6834–6844. [Google Scholar] [CrossRef]
  43. Xu, X.L.; Liu, J.Y.; Zhang, S.W.; Li, R.D.; Yan, C.Z.; Wu, S.X. Remote Sensing Dataset for Land Cover Detection for Multi-period Land Use in China(CNLUCC). Data Regist. Publ. Syst. Resour. Environ. Sci. Data Cent. Chin. Acad. Sci. (CAS) 2018, 90–108. [Google Scholar] [CrossRef]
  44. GB/T 21010-2017; Current Land Use Classification. National Standards of People’s Republic of China: Beijing, China, 2017.
  45. Zhang, C.; Tian, H.Q.; Chen, G.S.; Chappelka, A.; Xu, X.F.; Ren, W.; Hui, D.F.; Liu, M.L.; Lu, C.Q.; Pan, S.F.; et al. Impacts of urbanization on carbon balance in terrestrial ecosystems of the Southern United States. Environ. Pollut. 2012, 164, 89–101. [Google Scholar] [CrossRef]
  46. Batjes, N.H. Total carbon and nitrogen in the soils of the world. Eur. J. Soil Sci. 2014, 65, 10–21. [Google Scholar] [CrossRef]
  47. Xu, L.; He, N.P.; Yu, G.R. 2010s China Terrestrial Ecosystem Carbon Density Dataset. Chin. Sci. Data 2019, 4. [Google Scholar] [CrossRef]
  48. Tang, L.P.; Ke, X.L.; Zhou, T.; Zheng, W.W.; Wang, L.Y. Impacts of cropland expansion on carbon storage: A case study in Hubei, China. J. Environ. Manag. 2020, 265, 110515. [Google Scholar] [CrossRef]
  49. Houssoukpèvi, I.A.; le Maire, G.; Aholoukpè, H.N.S.; Fassinou, D.J.M.; Amadji, G.L.; Chapuis-Lardy, L.; Chevallier, T. Effect of land use change on carbon stocks in an agricultural region of southern Benin. Land Degrad. Dev. 2023, 34, 1447–1463. [Google Scholar] [CrossRef]
  50. Gao, R.Y.; Chuai, X.W.; Ge, J.F.; Wen, J.Q.; Zhao, R.Q.; Zuo, T.H. An integrated tele-coupling analysis for requisition-compensation balance and its influence on carbon storage in China. Land Use Policy 2022, 116, 106057. [Google Scholar] [CrossRef]
  51. Zhang, J.; Li, S.N.; Lin, N.F.; Lin, Y.; Yuan, S.F.; Zhang, L.; Zhu, J.X.; Wang, K.; Gan, M.Y.; Zhu, C.M. Spatial identification and trade-off analysis of land use functions improve spatial zoning management in rapid urbanized areas, China. Land Use Policy 2022, 116, 106058. [Google Scholar] [CrossRef]
  52. Li, Y.-N.; Cai, M.; Wu, K.; Wei, J. Decoupling analysis of carbon emission from construction land in Shanghai. J. Clean. Prod. 2019, 210, 25–34. [Google Scholar] [CrossRef]
  53. Ma, J.W.; Huang, S.F.; Xu, Z.N. Remote Sensing-Based Dynamic Monitoring and Analysis of Lake Watershed Area in Wuhan City from 1973-2015. J. Water Resour. 2017, 48, 903–913. [Google Scholar] [CrossRef]
  54. Wang, Y.L.; Liang, D.D.; Wang, J.; Zhang, Y.J.; Chen, F.; Ma, X.Y. An analysis of regional carbon stock response under land use structure change and multi-scenario prediction, a case study of Hefei, China. Ecol. Indic. 2023, 151, 110293. [Google Scholar] [CrossRef]
  55. Wang, Y.; Li, X.M.; Zhang, F.; Wang, W.W.; Xiao, R.B. Effects of rapid urbanization on ecological functional vulnerability of the land system in Wuhan, China: A flow and stock perspective. J. Clean. Prod. 2020, 248, 119284. [Google Scholar] [CrossRef]
  56. Xu, Q.; Yang, R.; Dong, Y.X.; Liu, Y.X.; Qiu, L.R. The influence of rapid urbanization and land use changes on terrestrial carbon sources/sinks in Guangzhou, China. Ecol. Indic. 2016, 70, 304–316. [Google Scholar] [CrossRef]
  57. Yang, Y.; Zhang, Y.Y.; Yang, H.; Yang, F.Y. Horizontal ecological compensation as a tool for sustainable development of urban agglomerations: Exploration of the realization mechanism of Guanzhong Plain urban agglomeration in China. Environ. Sci. Policy 2022, 137, 301–313. [Google Scholar] [CrossRef]
  58. Deng, Y.; Sarkar, A.; Yu, C.; Lu, Q.; Zhao, M.J.; Das, J.C. Ecological compensation of grain trade within urban, rural areas and provinces in China: A prospect of a carbon transfer mechanism. Environ. Dev. Sustain. 2021, 23, 16688–16712. [Google Scholar] [CrossRef]
  59. Muñiz, I.; Calatayud, D.; Dobaño, R. The compensation hypothesis in Barcelona measured through the ecological footprint of mobility and housing. Landsc. Urban Plan. 2013, 113, 113–119. [Google Scholar] [CrossRef]
  60. Liu, S.W.; Zhang, P.Y.; Wang, Z.Y.; Liu, W.X.; Tan, J.T. Measuring the sustainable urbanization potential of cities in Northeast China. J. Geogr. Sci. 2016, 26, 549–567. [Google Scholar] [CrossRef]
  61. Shen, L.Y.; Peng, Y.; Zhang, X.L.; Wu, Y.Z. An alternative model for evaluating sustainable urbanization. Cities 2012, 29, 32–39. [Google Scholar] [CrossRef]
  62. Sun, J.F.; Zhang, Y.; Qin, W.S.; Chai, G.Q. Estimation and Simulation of Forest Carbon Stock in Northeast China Forestry Based on Future Climate Change and LUCC. Remote Sens. 2022, 14, 3653. [Google Scholar] [CrossRef]
  63. Wang, Y.N.; Chang, Q.; Li, X.Y. Promoting sustainable carbon sequestration of plants in urban greenspace by planting design: A case study in parks of Beijing. Urban For. Urban Green. 2021, 64, 127291. [Google Scholar] [CrossRef]
  64. Conant, R.T.; Cerri, C.E.P.; Osborne, B.B.; Paustian, K. Grassland management impacts on soil carbon stocks: A new synthesis. Ecol. Appl. 2017, 27, 662–668. [Google Scholar] [CrossRef]
  65. Xu, Y.M.; Xie, Y.J.; Wu, X.D.; Xie, Y.T.; Zhang, T.Y.; Zou, Z.X.; Zhang, R.T.; Zhang, Z.Q. Evaluating temporal-spatial variations of wetland ecosystem service value in China during 1990–2020 from the donor side based on cosmic exergy. J. Clean. Prod. 2023, 414, 137485. [Google Scholar] [CrossRef]
  66. Gomes, L.C.; Faria, R.M.; de Souza, E.; Veloso, G.V.; Schaefer, C.; Fernandes, E.I. Modelling and mapping soil organic carbon stocks in Brazil. Geoderma 2019, 340, 337–350. [Google Scholar] [CrossRef]
  67. Mitran, T.; Mishra, U.; Lal, R.; Ravisankar, T.; Sreenivas, K. Spatial distribution of soil carbon stocks in a semi-arid region of India. Geoderma Reg. 2018, 15, e00192. [Google Scholar] [CrossRef]
  68. Wang, Z.; Zeng, J.; Chen, W.X. Impact of urban expansion on carbon storage under multi-scenario simulations in Wuhan, China. Environ. Sci. Pollut. Res. 2022, 29, 45507–45526. [Google Scholar] [CrossRef]
  69. Tao, Y.; Li, F.; Liu, X.S.; Zhao, D.; Sun, X.; Xu, L.F. Variation in ecosystem services across an urbanization gradient: A study of terrestrial carbon stocks from Changzhou, China. Ecol. Model. 2015, 318, 210–216. [Google Scholar] [CrossRef]
  70. Eigenbrod, F.; Bell, V.A.; Davies, H.N.; Heinemeyer, A.; Armsworth, P.R.; Gaston, K.J. The impact of projected increases in urbanization on ecosystem services. Proc. R. Soc. B Biol. Sci. 2011, 278, 3201–3208. [Google Scholar] [CrossRef]
Figure 1. Theoretical framework for factors influencing carbon storage.
Land 12 02134 g001
Figure 3. Changes in different land-use types in Wuhan, 1990–2020.
Land 12 02134 g003
Figure 4. Direct conversion of carbon storage in different land-use types in Wuhan from 1990 to 2020.
Land 12 02134 g004
Figure 5. Changes in carbon storage and carbon density and rates of land-use change in Wuhan, 1990–2020. (a) Carbon storage and carbon intensity. (b) Rates of land-use change.
Land 12 02134 g005
Figure 6. Land-use changes in regions with expansion of construction land over the 1990–2020 period.
Land 12 02134 g006
Figure 7. Land-use change in areas of positive carbon storage evolution over the 1990–2020 period.
Land 12 02134 g007
Figure 8. Land-use change in areas of negative carbon storage evolution over the 1990–2020 period.
Land 12 02134 g008
Figure 9. Spatial distribution of carbon storage in Wuhan over the 1990–2020 period.
Land 12 02134 g009
Table 1. Carbon density of each land use/cover in Wuhan (t/hm2).
LULC TypesCodeAboveground CarbonBelowground CarbonSoil Organic CarbonDead Organic Matter Carbon
CroplandCL6.10.685.250
WoodlandWL29.256.151103.282.78
GrasslandGL14.2917.1587.057.28
WaterRL0014.10
Construction LandBL7.611.5234.330
Unused LandUL10.362.0734.420.96
WetlandWETL7.134.51150.723.98
Note: CL: Cropland; WL: Woodland; GL: Grassland; RL: Water; BL: Construction; UL: Unused Land; WETL: Wetland Land; The figures for carbon storage per unit area of each LULC type were obtained from the following studies: cultivated land [46,48], forest land [45,47], grassland [46,47], waters [45,47], construction land [45,47], unused land [45], and wetlands [47].
Table 2. Correlation between carbon storage and influencing factors.
Pearson CorrelationSig. Bobtail
Urbanization rate−0.927 *0.024
Proportion of urban built-up area0.5930.292
Proportion of land used for industrial and mining construction−0.952 *0.013
Proportion of secondary industry0.7480.146
Proportion of tertiary industry−0.912 *0.031
GDP per capita−0.950 *0.013
Disposable income of the urban population−0.964 **0.008
Average annual temperature0.6390.246
Average annual precipitation−0.907 *0.033
* Means through 0.05 levels (bilateral) test. ** Means through 0.01 levels (bilateral) test.
Disclaimer/Publisher’s Note: The statements, opinions and data contained in all publications are solely those of the individual author(s) and contributor(s) and not of MDPI and/or the editor(s). MDPI and/or the editor(s) disclaim responsibility for any injury to people or property resulting from any ideas, methods, instructions or products referred to in the content.

