Article

Urban Resilience and Its Links to City Size: Evidence from the Yangtze River Economic Belt in China

1
Institutes of Science and Development, Chinese Academy of Sciences, Beijing 100190, China
2
Department of Land Resource Management, School of Public Administration, Hohai University, Nanjing 211100, China
3
Key Laboratory of Watershed Geographic Sciences, Nanjing Institute of Geography and Limnology, Chinese Academy of Sciences, Nanjing 210008, China
4
School of Public Administration, Nanjing University of Finance & Economics, Nanjing 210023, China
*
Author to whom correspondence should be addressed.
Land 2023, 12(12), 2131; https://doi.org/10.3390/land12122131
Submission received: 19 October 2023 / Revised: 20 November 2023 / Accepted: 30 November 2023 / Published: 2 December 2023

Abstract

:
Understanding the relationship between city size and resilience is crucial for informed decisions on preparedness and interventions in building resilient cities. This study addresses this issue by dividing urban resilience into four components: stability, redundancy, resourcefulness, and connectivity. Using the above evaluation framework, we assessed the spatial–temporal variations in the relationship between city size and resilience in the Yangtze River Economic Belt from 2005 to 2020. The findings shows that, overall, resilience increased in the cities, with larger populations and spatial scales showing greater resilience, but both megacities and small cities experienced a decline in resilience. In terms of the four components of resilience, most of the region’s cities have roughly equal connectivity and stability, but redundancy and resourcefulness vary by city size and location. Specifically, downstream and larger cities demonstrated better crisis resolution and innovation. The dominant coupling coordination states showed antagonism between population and resilience. Upstream areas experienced a mismatch between “low resilience” and “large population”, while a moderate coordination existed between spatial scale and resilience. Further, it was found that factors hindering urban resilience varied according to city size. Cities with a population of <3 million faced low connectivity and limited transformation capacity. Those with a population of 3–5 million had moderate connectivity limitations, while cities with a population >5 million faced energy and aging population challenges. This study contributes to urban resilience discourse by providing a conceptual understanding and empirical analysis of the impact of city size on resilience.

1. Introduction

The process of rapid urbanization and accelerated globalization has led to a society that is more uncertain, unpredictable, and fraught with danger [1]. Cities, as centers of concentrations of human activity, have become focal points for the creation, transmission, and exposure to various risks. These risks include natural disasters such as floods, bushfires, and droughts, as well as human-made threats like terrorist attacks and financial crises. Additionally, there are cumulative risks such as environmental pollution, food crises, and biodiversity decline [2]. The COVID-19 pandemic has further highlighted the vulnerability of cities to these risks [3,4,5]. Therefore, making cities into areas that are resistant to the above risks has become an urgent concern [6,7].
Given that no city can completely shield itself from unforeseen risks or disasters, urban planners must consider how to navigate these complex problems, rather than isolating risk areas from the rest of the city [8]. As a result, there is a growing recognition of conceptual frameworks and initiatives aimed at enhancing urban resilience through city-scale interventions and other methods [7,9]. However, these approaches remain a topic of debate. For instance, the impact of city size on urban resilience has sparked renewed discussions, especially in light of the COVID-19 pandemic, which disproportionately affected larger cities. Some proponents argue that smaller cities are less vulnerable and easier to manage in terms of risks [10,11,12]. Conversely, others contend that larger cities are more resilient due to the greater availability of resources and redundancy [13,14,15]. Additionally, studies examining the relationship between city size and COVID-19 prevention and control obtained inconclusive results [16,17]. In summary, there is currently no consensus on the optimal size of a city in terms of urban resilience. However, it is widely agreed that rapid urbanization inherently brings higher risks [18,19]. The fact that over 90 percent of new urban residents will be concentrated in vulnerable yet rapidly expanding cities in developing countries in Asia and Africa further exacerbates the challenges faced by these cities [20]. Therefore, it is crucial for cities to understand the relationship between city size and urban resilience in order to determine their level of preparedness and intervention in response to various risks. This understanding should be prioritized.
Drawing on the existing literature, we propose a new analytical framework to understand urban resilience and explore its relationship with city size. We aim to enhance our understanding of urban resilience by examining cities with similar construction experiences and then exploring the way to achieve the optimal combination of city size and urban resilience. This study empirically analyzes the relationship between city size and urban resilience, using cross-sectional data from 126 cities in the Yangtze River Economic Belt (YREB) in China from 2005 to 2020, while also considering spatial–temporal heterogeneity. The possible marginal contributions of this study include the following: We define urban resilience as the capacity of cities to provide, access, and create resources for survival and production, proposed to enable city dwellers to adapt/live and development under any circumstances. Based on this conception, a framework for evaluating urban resilience was established to understand the advantages and disadvantages of urban resilience. Furthermore, we examine the relationship between city size and urban resilience within the framework of sustainable development, considering factors like institutional arrangements, socio-economic conditions, and natural environments. These findings can inform policymakers and planners in their efforts to promote urban development. To achieve representative results, we focus on vulnerable, rapidly expanding cities along the Yangtze River in China and construct a comprehensive dataset of 45 indicators for 126 cities over a four-year period. The remainder of the study is structured as follows. Section 2 is the framework for understanding resilience in urban discourse. Section 3 describes the research area, data sources, and empirical methodology. Section 4 analyzes the research results, and Section 5 contains the summary and discussion.

2. Conceptual Framework

2.1. Urban Resilience

Since the term “urban resilience” was first used in urban planning, academics and practitioners have expanded their comprehension of the concept, identifying dozens of characteristics such as rapid stability, diversity, adaptability, redundancy, autonomy, multifunctionality, collaboration, multi-scale network connectivity, and the ability to learn and transform [6,21,22,23]. The idea of resilience has grown commonplace in urban settings. However, rising richness has clouded the purpose of urban resilience, and made benchmarking and measurements problematic [24]. Nonetheless, cities urgently require a baseline and a uniform framework for quantifying, comparing, and tracking a particular territory in order to assist cities in increasing their capability for planning, responding to and recovering from catastrophes, and quickly learning. This is especially true in the development of nations’ fast-expanding but fragile cities [25,26,27]. A clear, explicit, and quantifiable aim is obviously required for a viable urban resilience program. The two most important goals of urban resilience are to adapt to uncertain changes and to protect residents and enable them to adapt/live and grow in the face of any type of risks, such as chronic stress and natural disasters [7,21,23,28]. Furthermore, given the devastating disruptions to basic human survival and production caused by the COVID-19 pandemic, such as disrupted supply chains and logistics, intensified famine, declining tourism, and high unemployment, this study contends that incorporating urban resilience into urban planning practices at the city level should focus more on the ability and potential of cities and their residents to access the resources required to sustain life and grow undeterred. These capacities and potentials may be accessible by the city itself or obtainable from other sources, or they may be already available or predicted to be generated. As a result, among the various qualities of urban resilience, this study relies on Bruneau et al.’s 4Rs of community resilience [29], which include robustness, rapidity, redundancy, and resourcefulness. These emphasize redundancy, resourcefulness, and connectivity, as well as the urban resilience systems that comprise them (Figure 1).
These qualities can be defined as follows: (1) Stability: the ability of all city components, including the government, markets, society, individuals, and other dimensions and levels, to prepare for or maintain sustain regular city operation in the case of an initial crisis. This is the foundation of the city. (2) Redundancy: the capacity of a city’s alternative resources to keep its original system functions running even if some of them are lost or disturbed during a crisis. This is the city’s alternate crisis response. (3) Resourcefulness: a city’s backup ability to adapt to current or future changes, expressing a city’s potential to reform systems that restrict its current or future adaptive capacity. (4) Connectivity: a city’s multi-scale networked connectivity, stressing the potential for cities to become more resilient through external collaborative networks in the context of a globally networked society, which may also include hazards such as risk chain reactions. This article focused on the favorable impact of the availability of external assistance.

2.2. Relationship between Urban Resilience and City Size

Economic conditions, ecology, infrastructure, emergency response, and resource allocation are widely regarded as the most powerful influencing factors in urban resilience [30], whereas city size is an important determinant of socio-economic and infrastructural strength, as well as knowledge production activities [31,32]. As a result, metropolitan scale and resilience are closely intertwined. Indeed, some studies have focused on the economic resilience channel [10,13], while more recent studies have suggested that size differences significantly affect the likelihood of cities experiencing risk and their ability to recover from disasters from a public health emergency perspective [33], but provide only inconclusive results. The empirical evidence for the association between city size and urban resilience is ambiguous [17,34]. For instance, during abrupt situations, large cities are more likely to experience higher rates of material and human and fatalities. However, they are more likely to be backed by external collaborative and have a wider range and volume of resources accessible during a crisis [13,33]. In contrast, small and medium-sized cities may have higher levels of social engagement and volunteerism in response to social capital crises [10]. However, due to insufficient planning and response, particularly in the event of pandemics, small cities are likely to take longer to recover from unforeseen threats [35]. The preceding research on the relationship between city size and urban resilience varies depending on the area, viewpoint, and chronology (such as before and after the epidemic’s outbreak); however, the majority of studies find a significant correlation. While numerous studies have offered a variety of analytical vantage points to investigate the connection between city size and urban resilience, they frequently ignored spatial attributes and rarely considered integrated urban systems when applying spatial-scale landscape resilience [27]. Based on a land-expansion approach, Du et al. [27] examined the dynamic link between city size and the social, economic, and environmental components of urban resilience in Tianjin, China, and validated the crucial effect of urban spatial expansion on resilience. More investigations, meanwhile, still did not integrate the two into a unified framework.

3. Materials and Methods

3.1. Study Area

The YREB spans the three major regions of east, central, and west China, covering 126 cities (see Appendix A Table A1), including 11 central cities such as Shanghai, Nanjing, Hangzhou, Hefei, Wuhan, Changsha, Nanchang, Chongqing, Chengdu, Guiyang, and Kunming. It covers 21.4% of the country (Figure 2). In 2020, YREB carried 42.9% of China’s population, contributed 46.5% of its GDP, and harbored 7 of China’s top 10 economic cities. Moreover, it accounted for 43.17% of the country’s social freight turnover and 69.52% of its total exports. In other words, YREB’s economy and population have contributed half of the total. On the other hand, the upper reaches of the YREB are under constant threat from earthquakes, landslides, and mudslides. Meanwhile, the cities in the middle and lower reaches are constantly challenged by heavy rains, floods, environmental pollution, and ecological damage. It is in a tense relationship with nature. Therefore, it is crucial to explore the interaction between scale and urban resilience and discuss how to balance benefits and safety in the YREB.

3.2. Data Sources

The data used in this study were from several sources. The statistical data were mainly from the China Urban Statistical Yearbook, the China Urban and Rural Construction Statistical Yearbook, the China Energy Statistical Yearbook, the Civil Aviation from Statistics, the statistical bulletins on national economic and social development, and authoritative industry reports of cities for the years 2005–2021. As energy production and consumption in China are allocated at the provincial level that data for individual cities was not available, the energy-related proportion data used in this study were provincial averages. In addition, missing raw data mainly occurred in 2020. As 2017 is the last year in which a few indicators were published, we referred to the existing literature [5] and used the average annual growth rates up to 2017 for our calculations. For sporadic missing data, we used the conditional mean method or data from neighboring years to supplement them. For geospatial data, the 2005–2020 population raster with a resolution of 1 km was obtained from the publicly available LandScan Global Population Database (Oak Ridge National Laboratory, TN, USA, https://landscan.ornl.gov/, accessed on 20 July 2022). The spatial extent of the YREB was extracted from the global 30-m impervious surface dynamic dataset provided by Zhang et al. [36]. In addition, each city’s 1:1 million basic geographic data and administrative boundary data were obtained from the National Geomatics Center of China.

3.3. Methods

3.3.1. Assessment of Urban Resilience

From disasters such as earthquakes, floods, and sea level rise [37,38] to a combination of natural, socio-economic, and political factors [39,40], academics and practitioners have developed many frameworks for evaluating resilient cities. However, there is no uniform methodology for measuring urban resilience, and the increasing diversity of perspectives and indicators has reduced the usefulness of urban resilience [23]. In China, four cities are participating in the prestigious “100 Resilient Cities” project. However, there are concerns that country-specific differences in indicators may make it challenging to advance applications and empirical research [41]. Therefore, it is crucial to develop a resilience framework adapted to the Chinese context and regional characteristics.
The evaluation framework constructed in the literature provides an important channel for indicator selection in this study. This research mainly referred to the urban resilience indicators and sustainable urban development indicators involved in empirical studies in China [2,42,43], and establishes a system of urban resilience evaluation indicators including stability, redundancy, resourcefulness, and connectivity. Among them, stability refers to the ability of a city to solve problems and ensure basic urban functions in times of crisis under extreme stress, such as the availability of adequate local health care resources in the event of COVID-19, which is a measure of stability. For this measure, twelve indicators were selected. Redundancy is the additional capacity that a city has to replace part of its system and alleviate the crisis when disabled, such as providing air transport when ground transport is paralyzed by an earthquake or flood or the ability of non-fossil-fuel power generation to replace fossil fuels. Eleven indicators were selected to measure redundancy. Resourcefulness is seen as an implicit vehicle to support the functioning and upgrading of urban systems, focusing on the potential of cities to recover from risky shocks and learn from experience to prepare for the next similar crisis from innovative and transformative perspectives, as measured by 11 innovation-related indicators in this study. Connectivity focuses on the potential for cities to communicate with the outside world for help in times of crisis, and 11 indicators were selected from communication, location, social, and economic perspectives (Table 1).
In order to eliminate the interference of magnitude, order of magnitude, and positive and negative directions on the results, we standardized the raw data using the following formula. If the indicator contributes positively to urban resilience, then the standardization is as follows:
positive :   X i j = ( X i j min i X j ) / ( max i X j min i X j )
Otherwise, if the indicator has a negative contribution to urban resilience, the standardization is as follows:
negative :   X i j = ( max i X j X i j ) / ( max i X j min i X j )
  X i j and X i j denote the j indicator value and the standardized value in year i, respectively. max i X j and min i X j denote the maximum and minimum values of indicator j in year i, respectively.
Considering the high subjectivity of weights obtained by methods such as AHP, this study adopted the categorical alignment polygon illustration method [44] to measure urban resilience, which does not require the assignment of weights to secondary indicators. Its basic principle is assuming that there is a total of N secondary indicators processed by the min–max standardization method; a central N polygon is formed with the upper limit 1 of the standardized secondary indicators as the radius, and the standardized values of each secondary indicator are connected to form an irregular N polygon, which, according to the multidimensional multiplication principle, forms a total of (N − 1)!/2 irregular N polygons. The value of a particular primary indicator is (N − 1)!/2, the ratio of the mean value of the area of the irregular N polygon to the area of the central N polygon, whose formula is shown in (3). This method uses the area ratio to show the index of a particular primary indicator, thus reducing the impact of the traditional weight assignment on the results.
U R k = i < j i , j ( X i k + 1 ) X j k + 1 N ( N 1 )
In the formula, URk denotes the value of the kth dimension of urban resilience. N denotes the number of indicators in the kth dimension. Xik and Xjk are the normalized values of the secondary indicators in the kth dimension of urban resilience, respectively. Based on this, in order to find the key factors directly affecting the improvement in urban resilience, we introduced the obstacle degree model, which is widely applied in the fields of ecological security, environmental security, and resource security [45], to find impact factors. Since no secondary indicator weights are set in this study, we similarly disregarded the interference of weights on the calculation of obstacle degrees, which is calculated as follows:
O i k = ( 1 X i ω ) / i = 1 n ( 1 X i ω )
where O i k represents the obstacle degree of the i th indicator in the year ω .

3.3.2. Calculation of City Size

Population size is the most direct and vital indicator characterizing the city size. Therefore, this study employed the urban resident population in urban areas to represent Urban Population Size (SUP). Moreover, the population does not reflect the spatial expansion of the city size, while the urban impervious surface is an important indicator of urban spatial expansion [46]. Therefore, this study drew on the existing literature to extract impervious surface data of the study area by spatially matching them with the city’s administrative boundary and assigning the LandScan population information to the impervious surface layer. With reference to the existing literature [47] and the Chinese urban–rural classification standard set by the Chinese authorities, we define human settlements with a population density ≥ 1500 as urban physical territory, which is called the coefficient of city size (CCS). The formula is as follows:
C C S θ = I S θ / S θ
C C S θ is the city size coefficient of the θth city in the urban agglomeration. I S θ denotes the impervious surface area of the θth city. S θ denotes the area of the administrative district of the θth city.

3.3.3. Coupling Coordination Degree Model

In rapid expansion, city size is linked to urban resilience through governance, socioeconomic, and infrastructural aspects, which may manifest as mutually reinforcing or constraining. This study adopted the coupling coordination degree model (CCDM), providing feedback on the extent to which two or more systems can contribute to or be antagonistic to each other [48]. This is used to reveal the dynamic trends in the coupling of city size and urban resilience. The formula is as follows:
C = f X 1 · f X 2 · f X 3 · f X 4 · g y f X 1 + f X 2 + f X 3 + f X 4 + g y 5 5 1 5 ,   D = C · T
T = α 1 f X 1 · α 2 f X 2 · α 3 f X 3 · α 4 f X 4 + β g y
α 1 + α 2 + α 3 + α 4 + β = 1
Among them, T is the coupling degree, taking values in the range [0, 1], reflecting the degree of interaction between city size and resilience. When the value of C is closer to 1, the association between the two is stronger. f X 1 , f X 2 , f X 3 , f X 4 reflect the urban resilience, i.e., stability, redundancy, resourcefulness, and connectivity, respectively. D is the coupling coordination degree (CCD), which reflects the degree of benign coupling between city size and resilience interaction, i.e., the degree of consistency of the development process and the matching of development level. α 1 , α 2 , α 3 , α 4 , β represent the contributions of stability, redundancy, resourcefulness, connectivity and city size, respectively. With reference to the existing literature [49], all these parameters are determined as 1/5, and the CCD is classified as a coordination state (0.80 ≤ CCD < 1.0), a moderate coordination state (0.6 ≤ CCD < 0.80), a mild-conflict state (0.50 ≤ CCD < 0.60), an antagonistic state (0.20 ≤ CCD < 0.50), and disorder state (0 ≤ CCD < 0.20).

4. Results

4.1. Analysis of Urban Resilience and Obstacle Factors

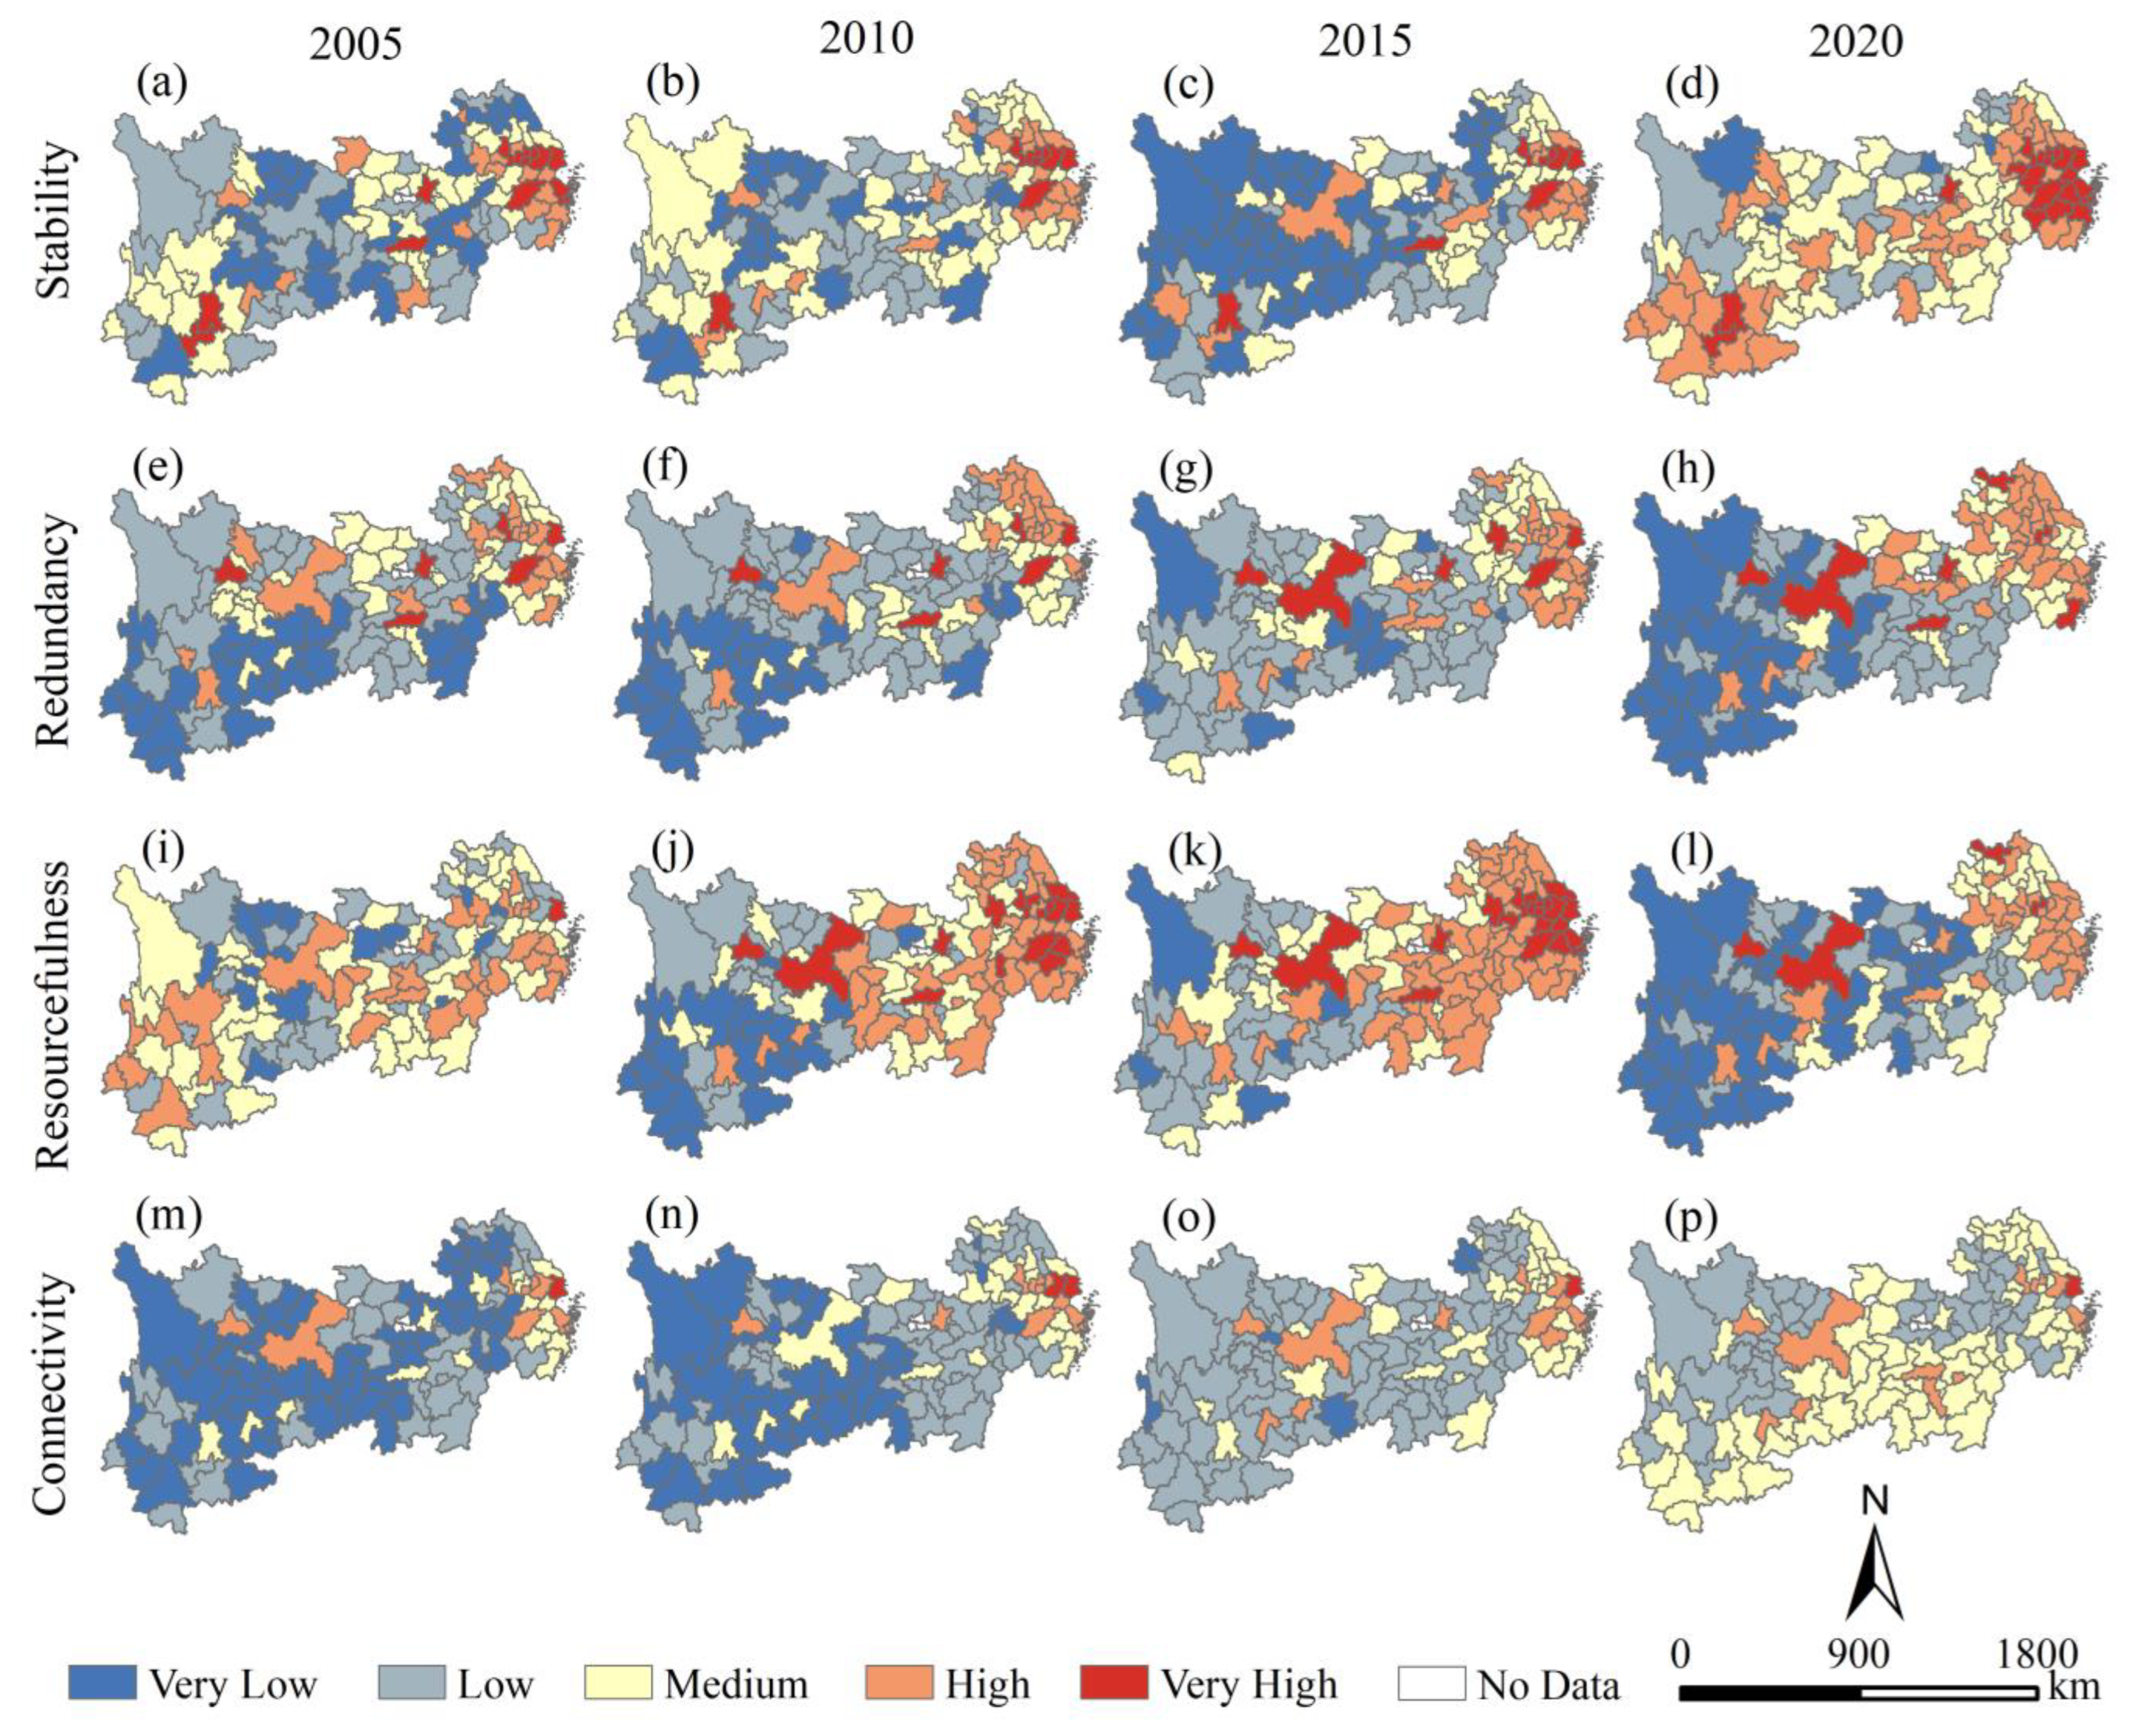
4.1.1. Spatial–Temporal Differentiation of Urban Resilience in YREB

We calculated the four dimensions of urban resilience for each city in the YREB from 2005 to 2020 and classified them into five levels using natural breaks (Figure 3). Overall, stability, redundancy, resourcefulness, and connectivity in the YREB were generally characterized as “high in the east and low in the west” from 2005 to 2020. However, significant differences existed regarding the performance of different dimensions of urban resilience across time and space.
The stability of more than 75% of cities increased in a spiral between 2005 and 2020, generally rising to a higher level. Meanwhile, the gap between East and West gradually narrowed. Medium stability replaced low stability as the dominant feature in the upstream and midstream regions, while high stability was the prominent feature in the downstream region. It is noteworthy that the stability of Shanghai, Wuhan, Nanchang, Changsha, Chengdu, and Guiyang declined despite the high level.
In terms of redundancy, from 2005 to 2020, half of the cities in the YREB fluctuated upward, and the other half reversed, while the original east–west gap became increasingly apparent. Among them, low redundancy was the most prominent feature in the upstream region. The vast majority of cities there showed a declining trend, with only central cities such as Kunming, Guiyang, Chengdu, and Chongqing showing high redundancy. In contrast, although still characterized by low redundancy, the midstream region witnessed a rise in its redundancy. The downstream region featured a high redundancy. However, central cities with high redundancy, such as Shanghai, Hangzhou, Nanjing, and Hefei, showed a decreasing trend.
In terms of resourcefulness, from 2005 to 2020, about 60% of cities (mainly in the upstream and midstream regions) in the YREB fluctuated downward, and the other reversed (mainly in the downstream region). This continuous change broke the original equilibrium and resulted in a clear east–west gap. Low resourcefulness was a distinctive feature of the upstream region, with central cities such as Kunming, Guiyang, Chengdu, and Chongqing showing high resourcefulness. The dominance of the low-resourcefulness city cluster in the midstream region was also evident. By 2020, only three central cities, namely Wuhan, Changsha, and Nanchang, demonstrated high resourcefulness. In contrast, the city clusters with high resourcefulness increased significantly, and most cities showed an upward trend in resourcefulness.
The connectivity of cities in the YREB was almost entirely improved but still at a low to medium level from 2005 to 2020, with no significant change in the east–west gap, mainly characterized by individual differences. Medium to low connectivity still characterized the upper Yangtze River region, with only a few central cities reaching high connectivity. In the midstream region, medium connectivity replaced low connectivity, with very few cities reaching high connectivity. The situation in the downstream region was similar to that in the midstream, except for the relatively high number of cities with high connectivity.

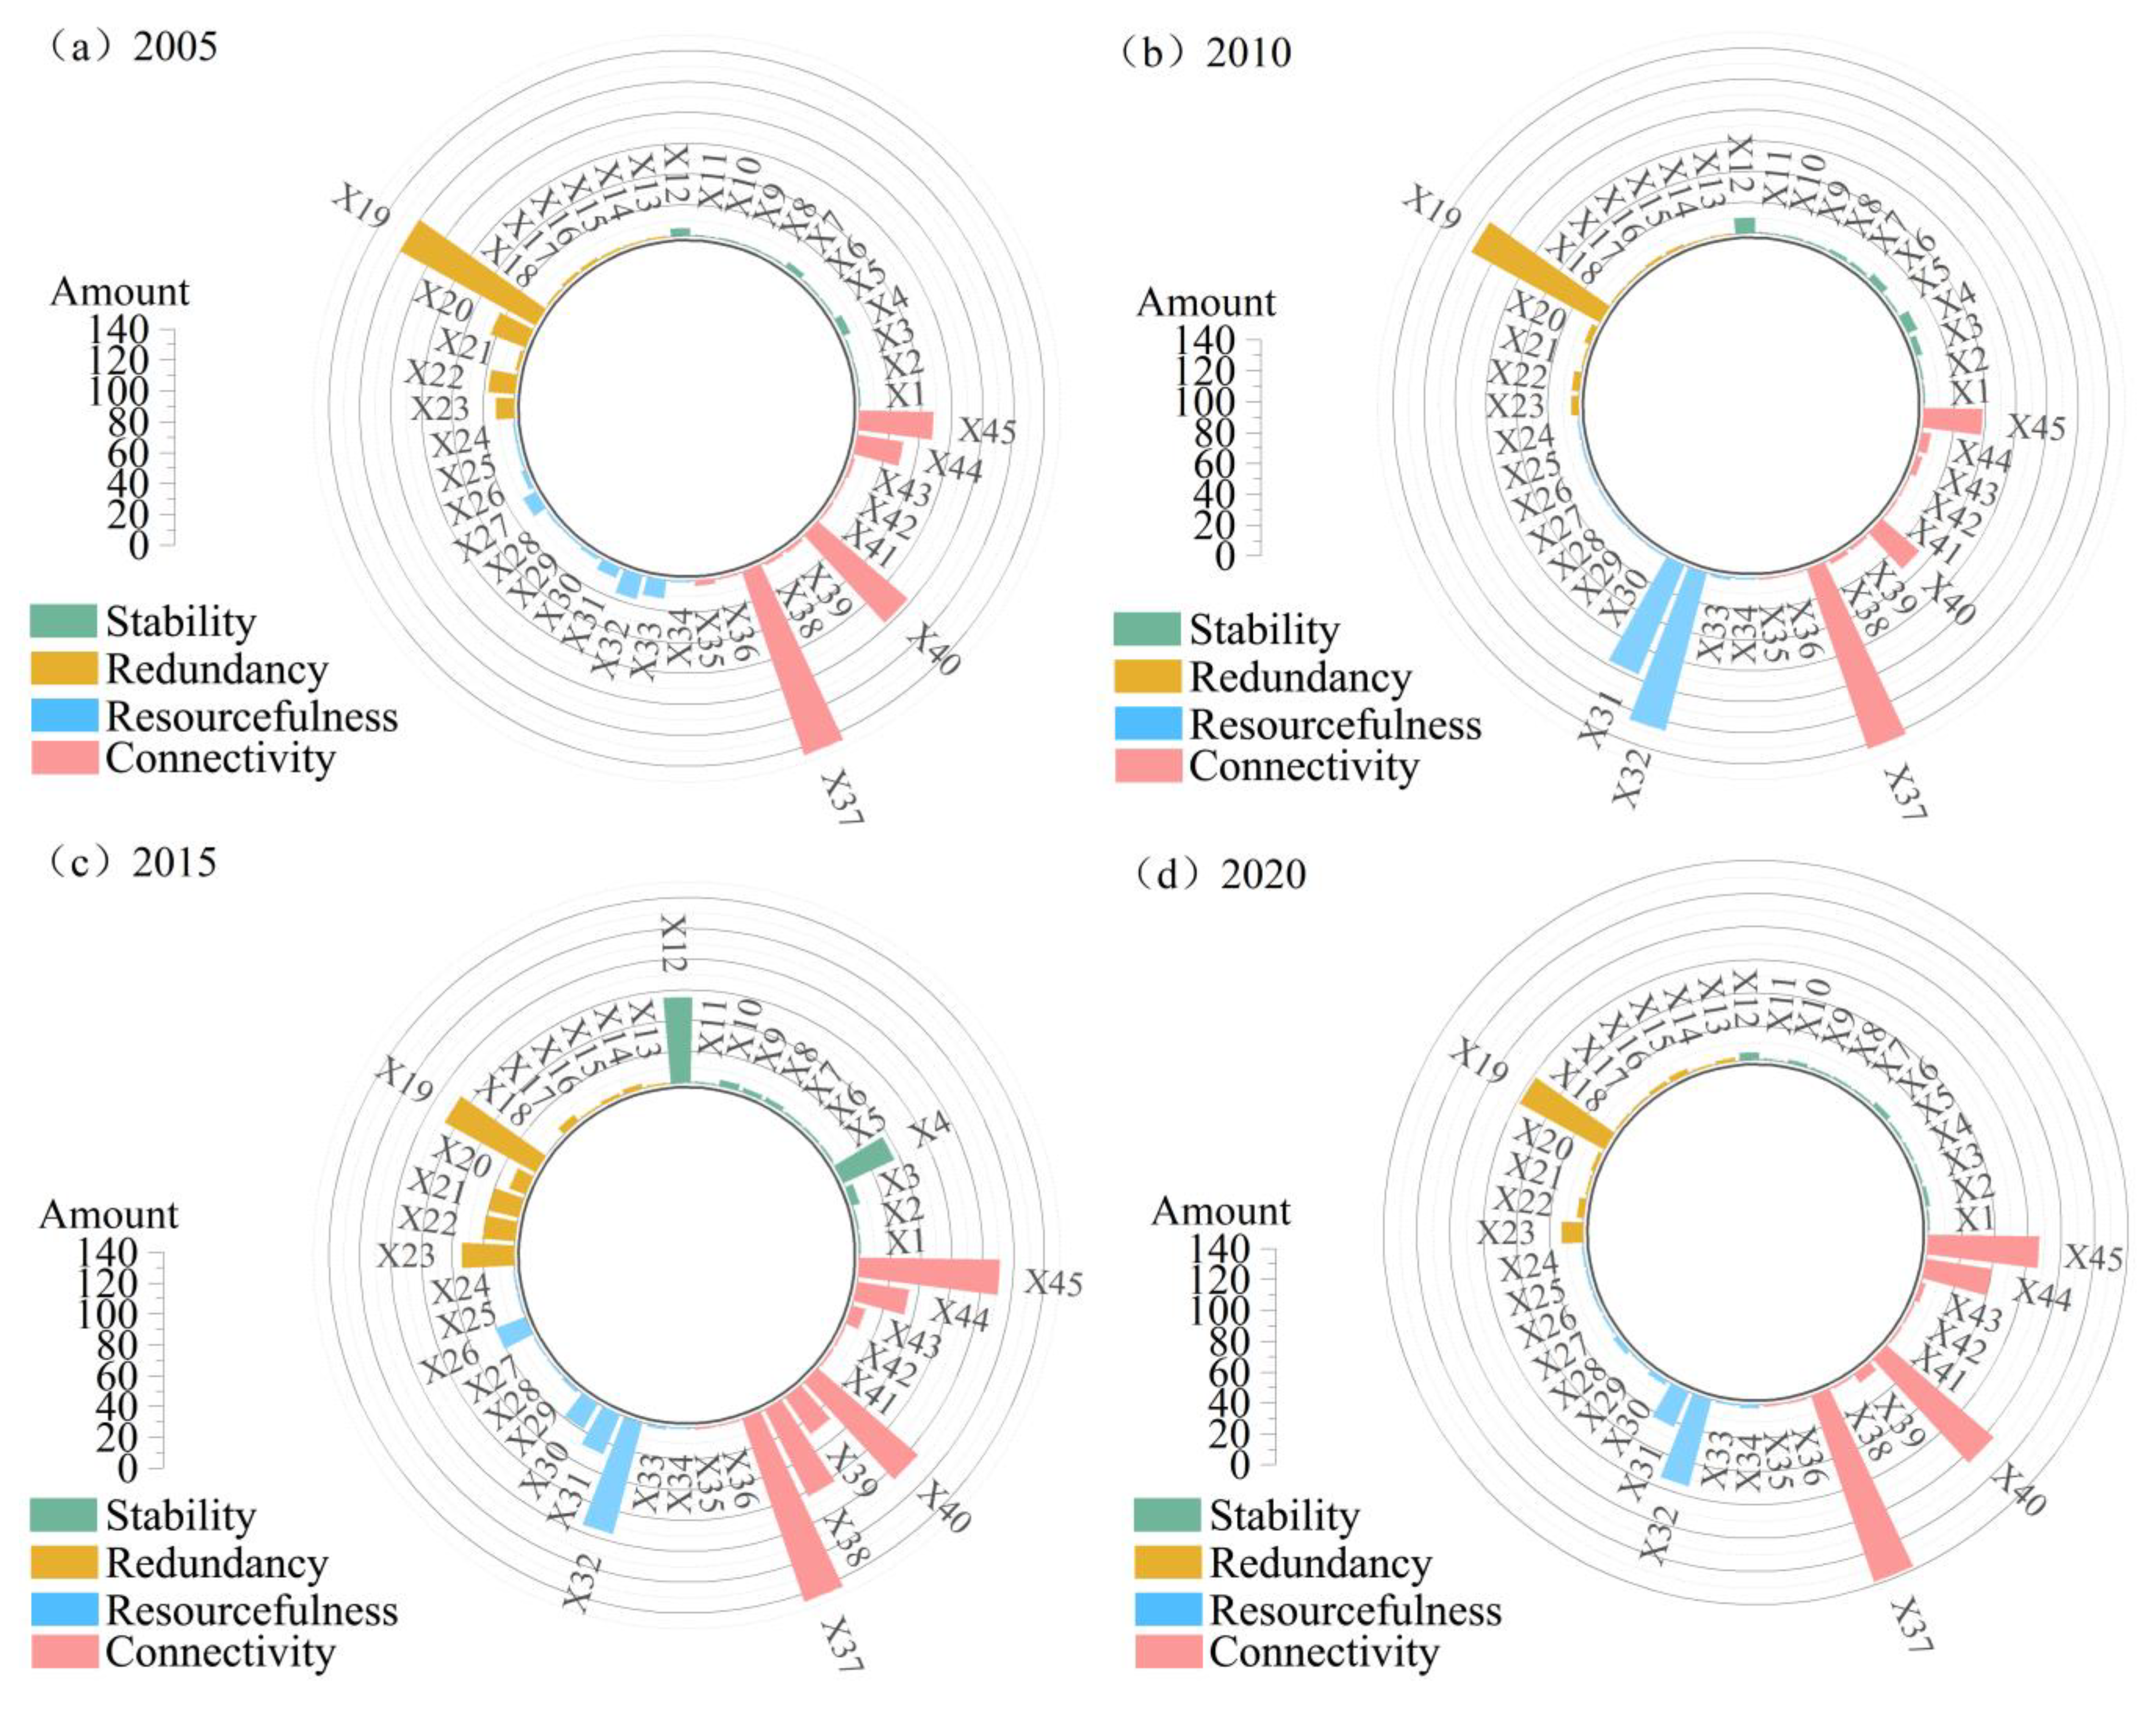
4.1.2. Obstacle Factors of Urban Resilience

In order to further analyze the obstacle factors affecting the resilience of cities in the YREB, we measured the obstacle degree of 45 secondary indicators in the indicator layer. Due to the large number of indicators, we filtered out the most influential obstacle factors (top 10%) on urban resilience for statistics (Figure 4). Firstly, we found that the volume of domestic air routes (X19), the number of invention patents granted per 10,000 (X32), the number of headquarters of Fortune 500 companies in the city (X37), international tourism revenue (X40), and the number of contracts signed by foreign-invested enterprises (X45) could be listed as the most influential common obstacle factors in the YREB from 2005 to 2020. Therefore, it can be concluded that most cities in the YREB had obvious deficiencies in air transportation construction, science and technology innovation, and connectivity in the three major areas of location, society, and the economy compared to other areas. Secondly, the importance of the above-mentioned obstacle factors in different study periods varied with socio-economic development. For example, the coverage of the number of headquarters of the Fortune 500 companies (X37), which was firmly the top priority, decreased from 2005 to 2020, which had a hindering effect on the resilience of some cities in the downstream area, which gradually diminished, indicating that the locational importance was enhanced. Thirdly, the coverage of two obstacle factors, the number of domestic air routes (X19) and the number of invention patents granted per 10,000 (X32), decreased significantly, from 80% and above in 2010 to around 40%, indirectly indicating that the air transport industry and the science and technology innovation capacity of the YREB substantially improved during the study period. However, when the coverage of these two factors in most of the upstream cities diminished, their resistance to urban resilience remained very evident in the upstream and midstream areas of the Yangtze River. Fourth, international tourism revenue (X40) was essentially an obstacle factor for more than 60% of cities in the YREB (except in 2010). This might be related to the fact that the YREB is the region with the most considerable contribution to tourism development in China, yet has significant internal differences. For example, this was not a major obstacle for the vast majority of cities in Yunnan Province (part of the upper Yangtze River region) with affluent tourism resources. Fifthly, the number of contracts signed by foreign-invested enterprises (X45) only became an obstacle affecting more than half of the YREB cities after 2015. This might be related to the balanced yet widening locally differentiated economic openness in the YREB.

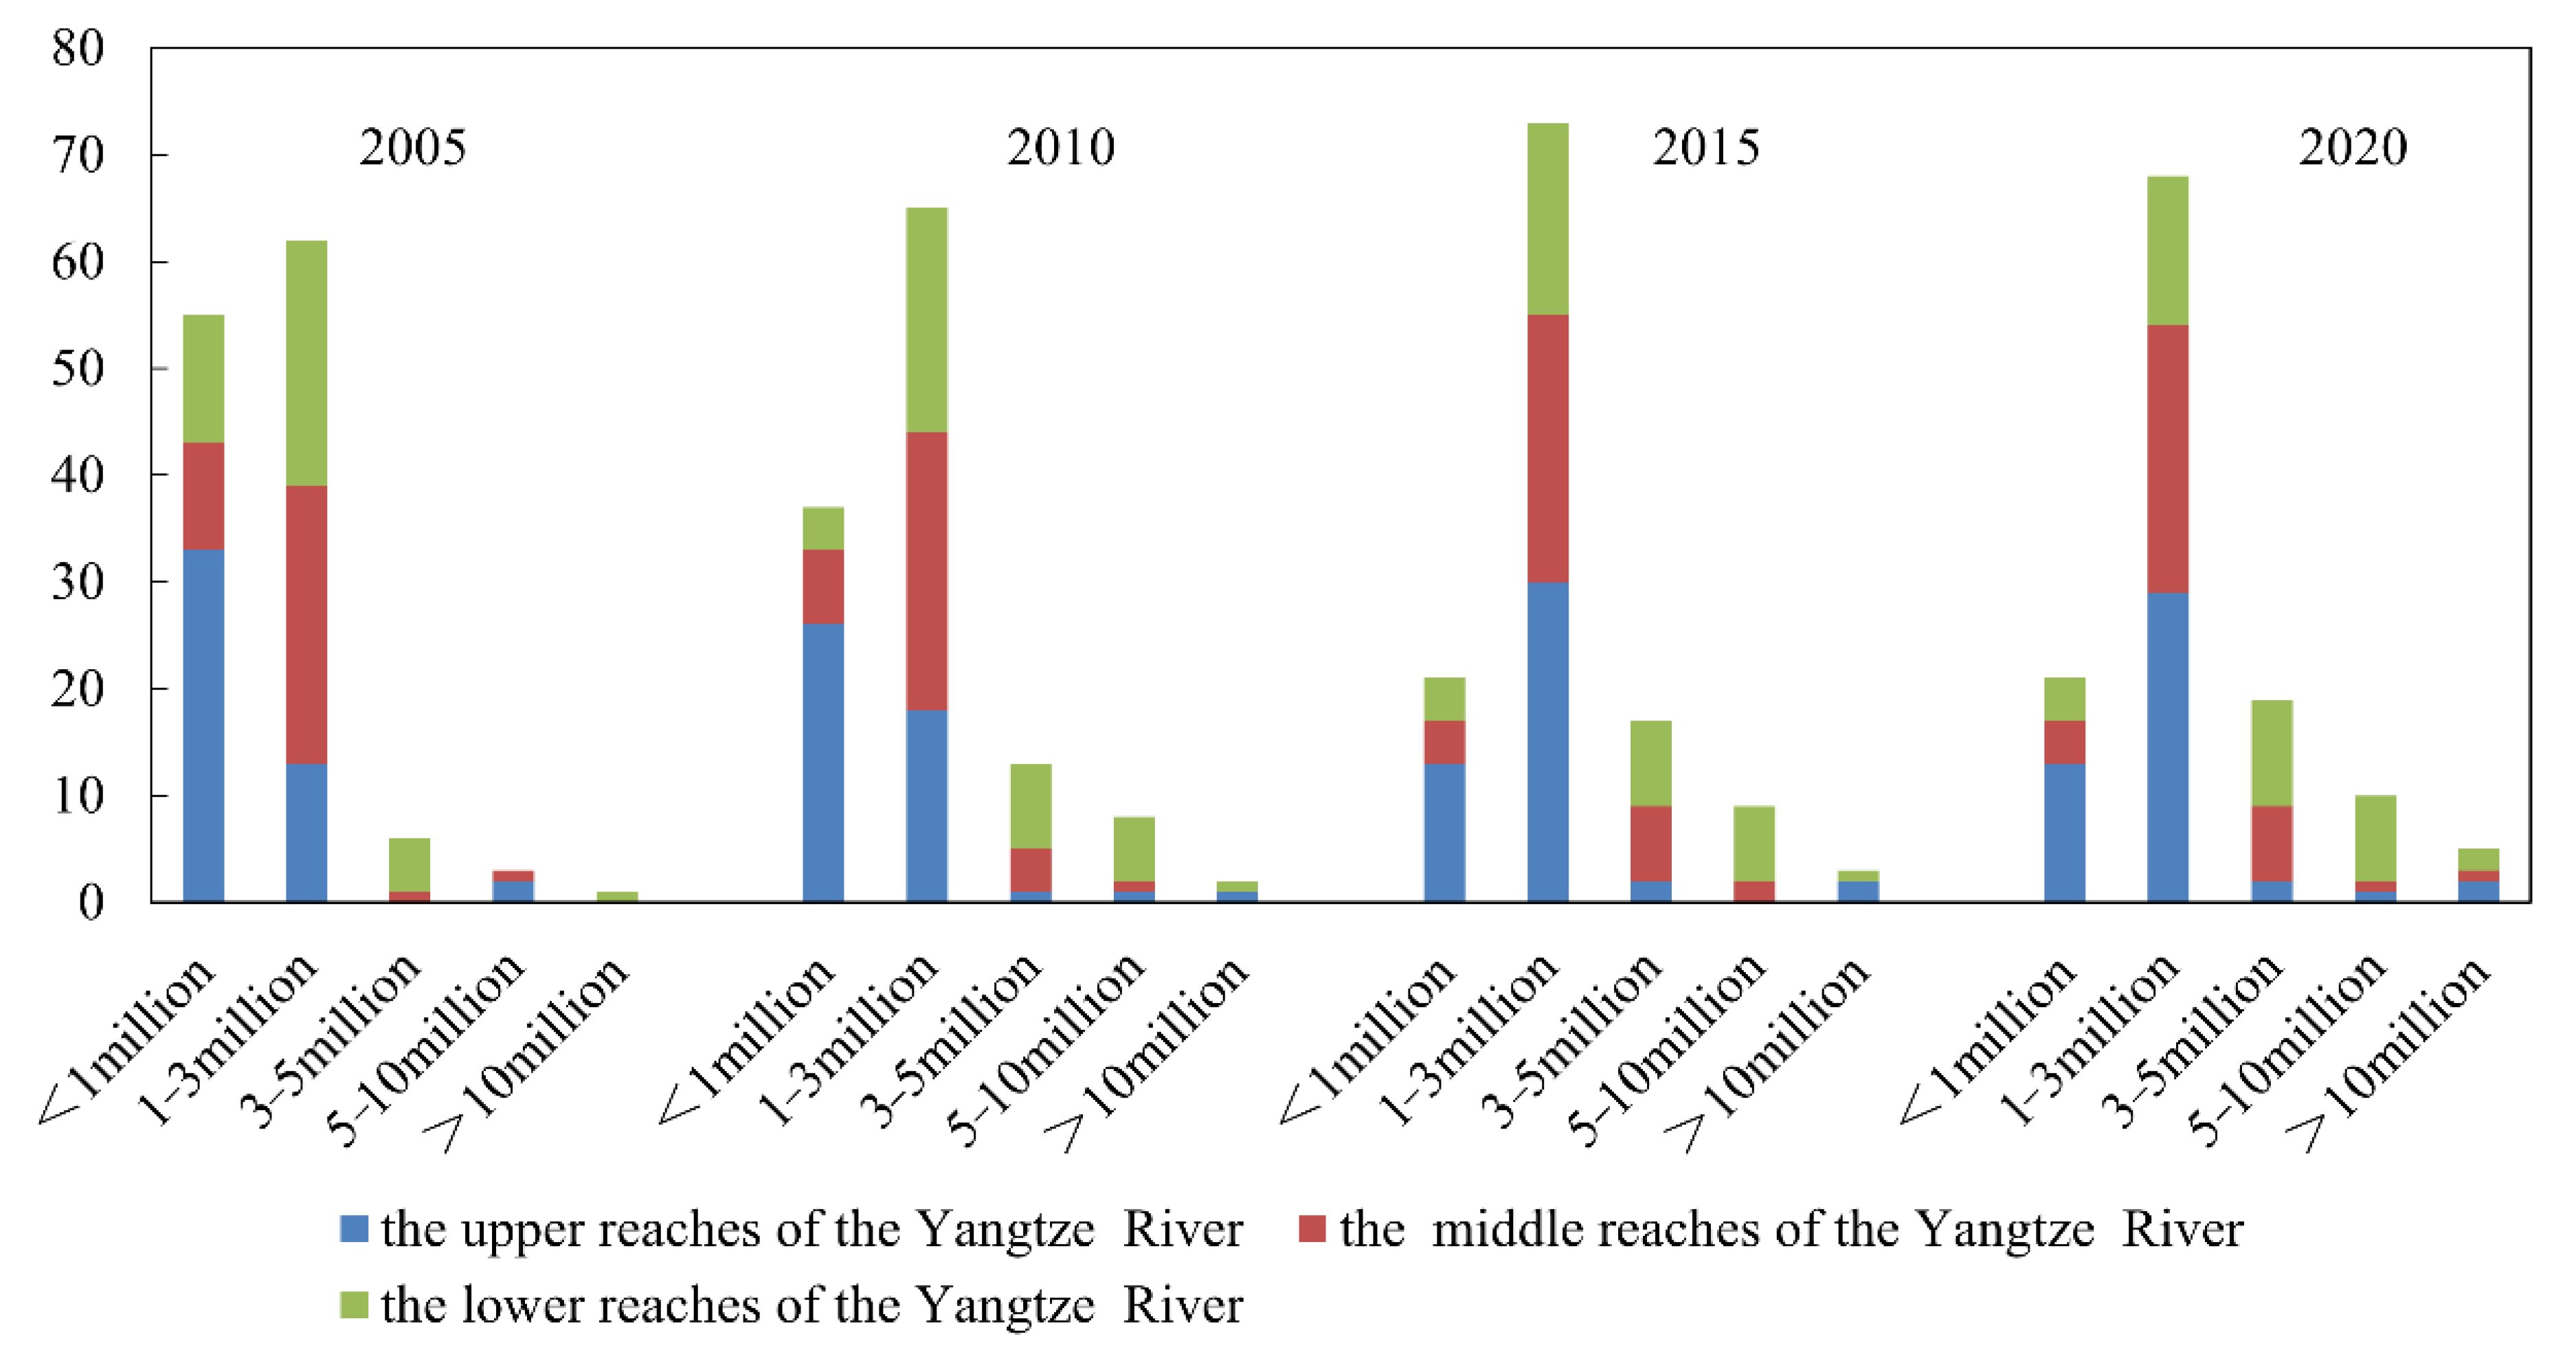
4.2. Variation in City Size from 2005 to 2020

We counted the spatial and temporal changes in the SUP distribution of the YREB, and the results are shown in Figure 5. Overall, almost all cities in the YREB showed a significant expansion in population size, with 1–3 million being the most prominent class in the YREB. However, the polarization in the distribution of population classes gradually decreased. Secondly, in terms of the SUP distribution, the upper and middle reaches of the Yangtze River witnessed significant polarization. From 2005 to 2020, except for the central cities, the vast majority had a population of no more than 3 million. The population of the downstream cities was mainly below 3 million in 2005. By 2020, the downstream region harbored a few small cities (<1 million) and megacities (>10 million), while the number of other size classes was evenly distributed. Third, in terms of overall inter-regional divergence, from 2005 to 2020, cities with an SUP below 1 million were still concentrated in the upper reaches, while the concentration of the 1–3 million population size shifted from the middle and lower reaches to the upper and middle reaches. Cities with a 3–5 million population were mainly located in the middle and lower reaches, and large cities with a population of 5 million and above were highly concentrated in the downstream areas.
As shown in Figure 6, the spatial and temporal differences in the city size coefficients of cities in the YREB are significant. On the one hand, the city size coefficients in the upper reaches of the Yangtze River were generally low, while those in the middle and lower reaches reversed. This showed a clear pattern of “high in the east and low in the west”. Specifically, from 2005 to 2020, the city size coefficients of cities in the upper reaches of the Yangtze River tended to converge, most of which concentrated in the 0–0.01 range, except for a few major central cities. Accordingly, the middle reaches experienced a process of changing from dispersion to centralization, with coefficients ranging from 0.01 to 0.05. Meanwhile, the lower reaches underwent a process of changing from centralization to dispersion, with coefficients ranging from 0.01 to 0.12. On the other hand, the urban space of the YREB was in the expansion stage during the whole study period. The upstream area expanded slowly, while the midstream and downstream areas expanded faster, showing a trend of “fast in the east and slow in the west”. However, the spatial scale of most cities in the YREB is small in general. By 2020, the city size coefficient of nearly 90% of cities was less than 0.1.

4.3. Coupling Coordination Degree Analysis

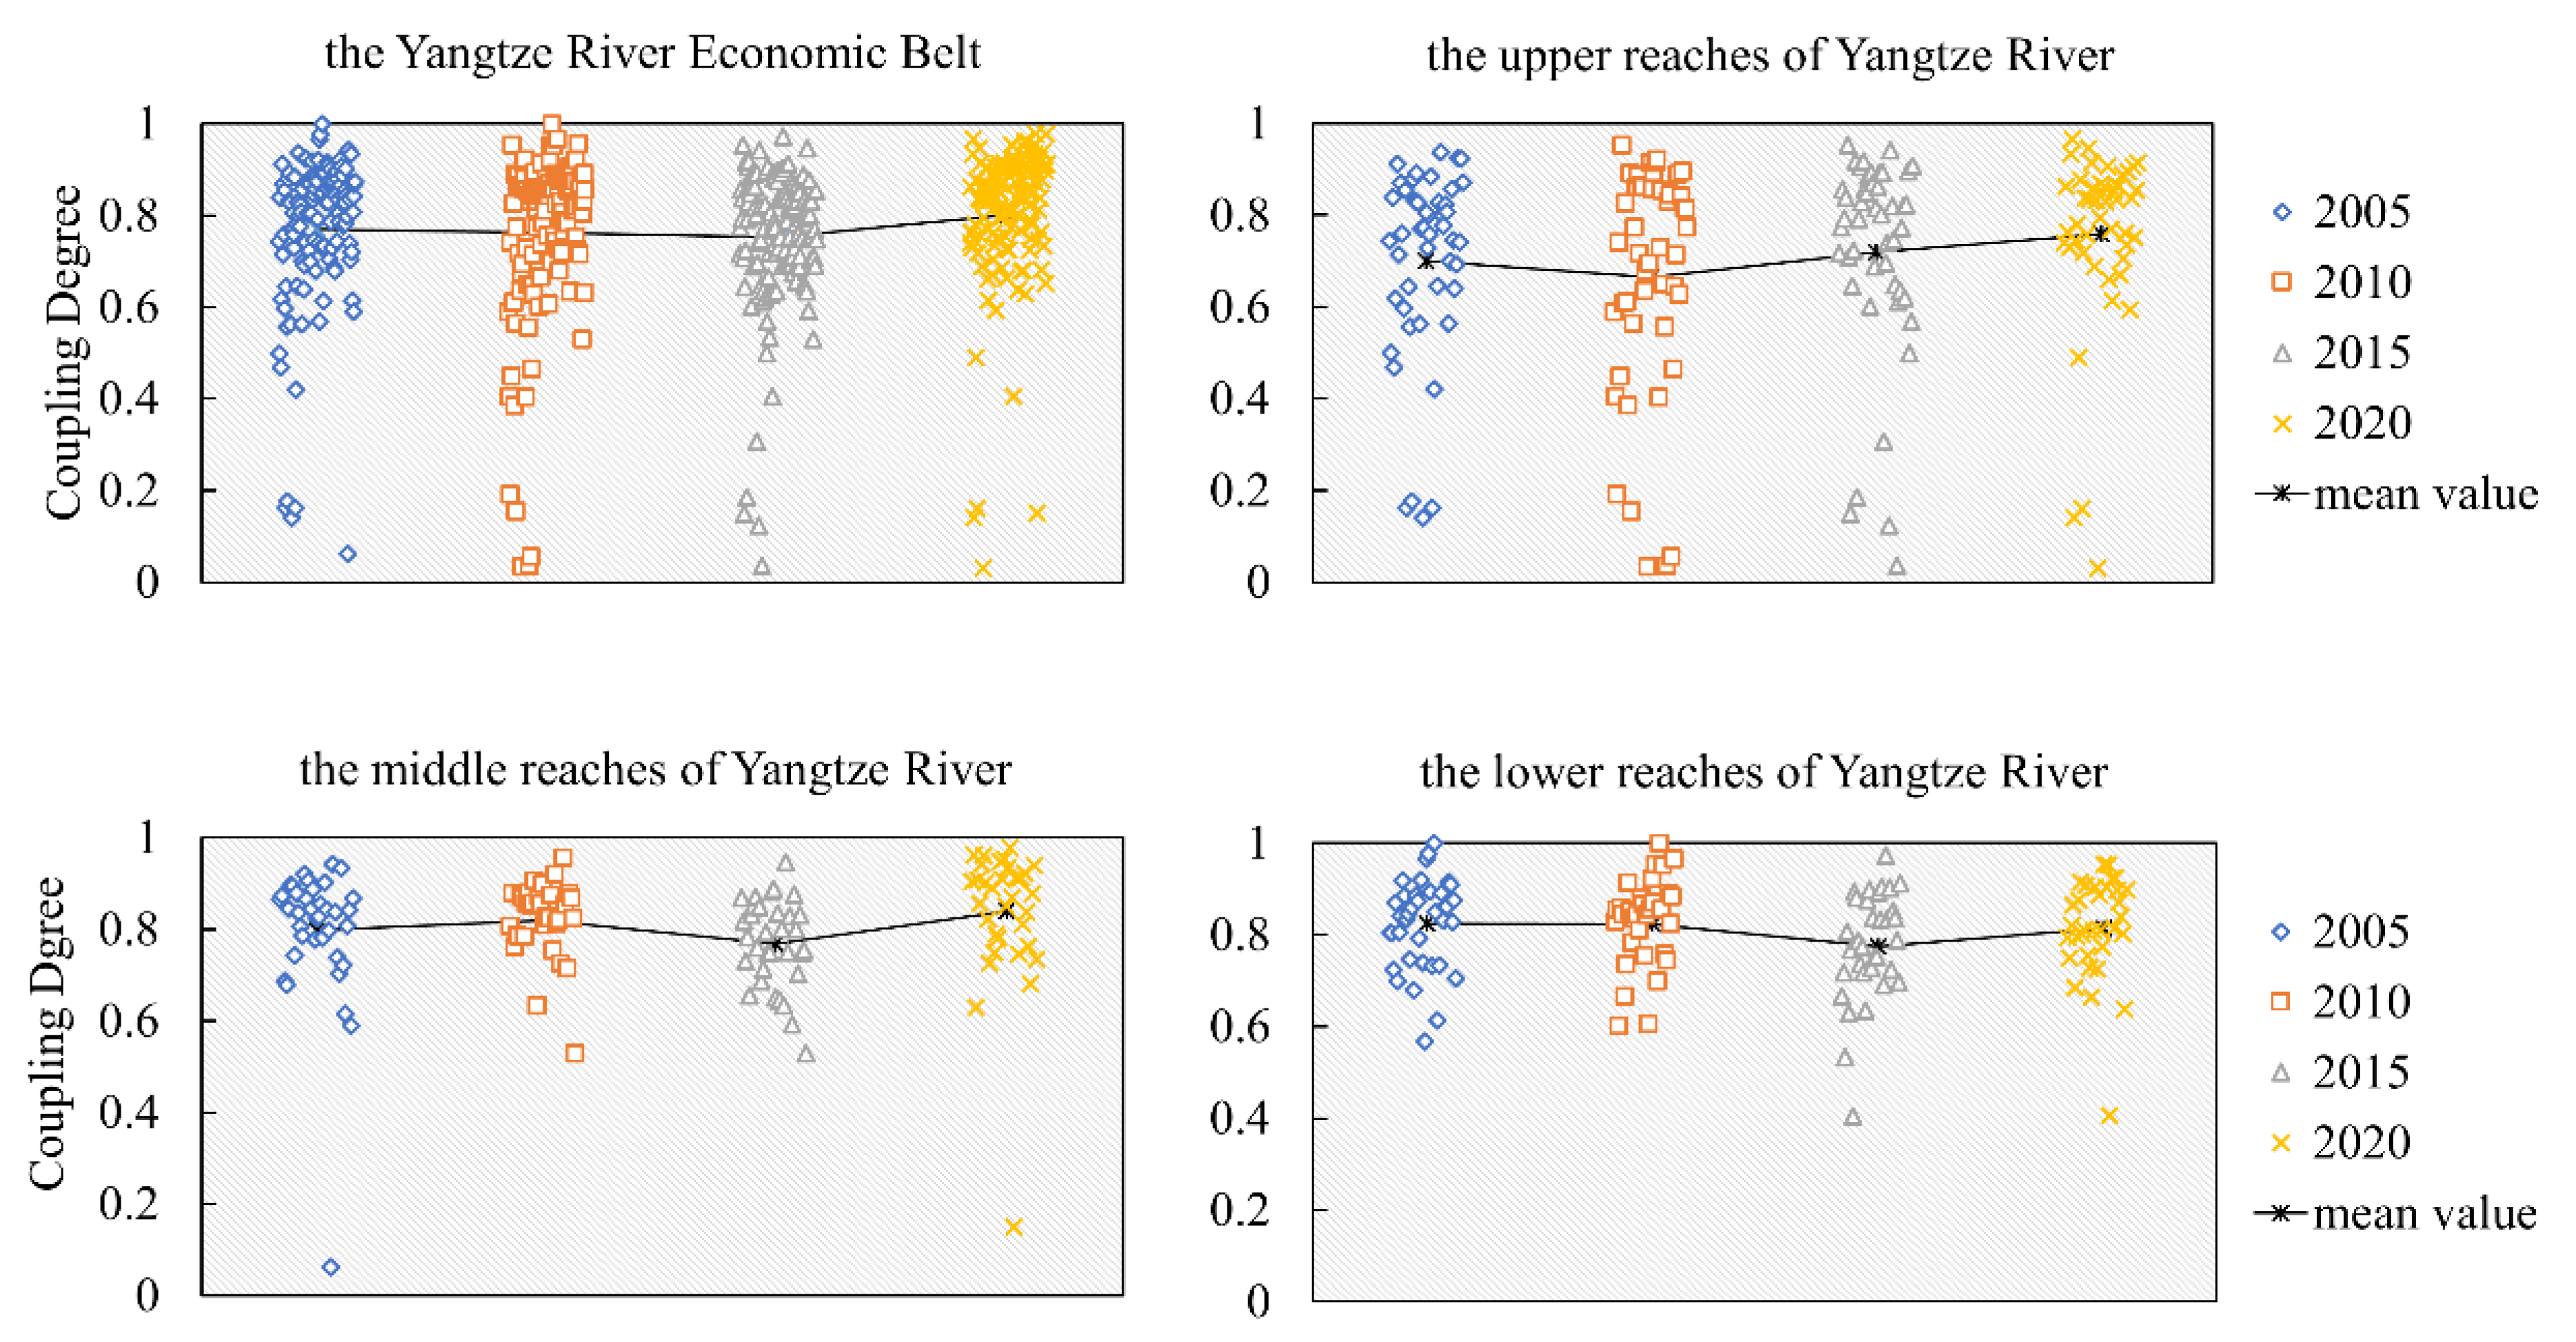
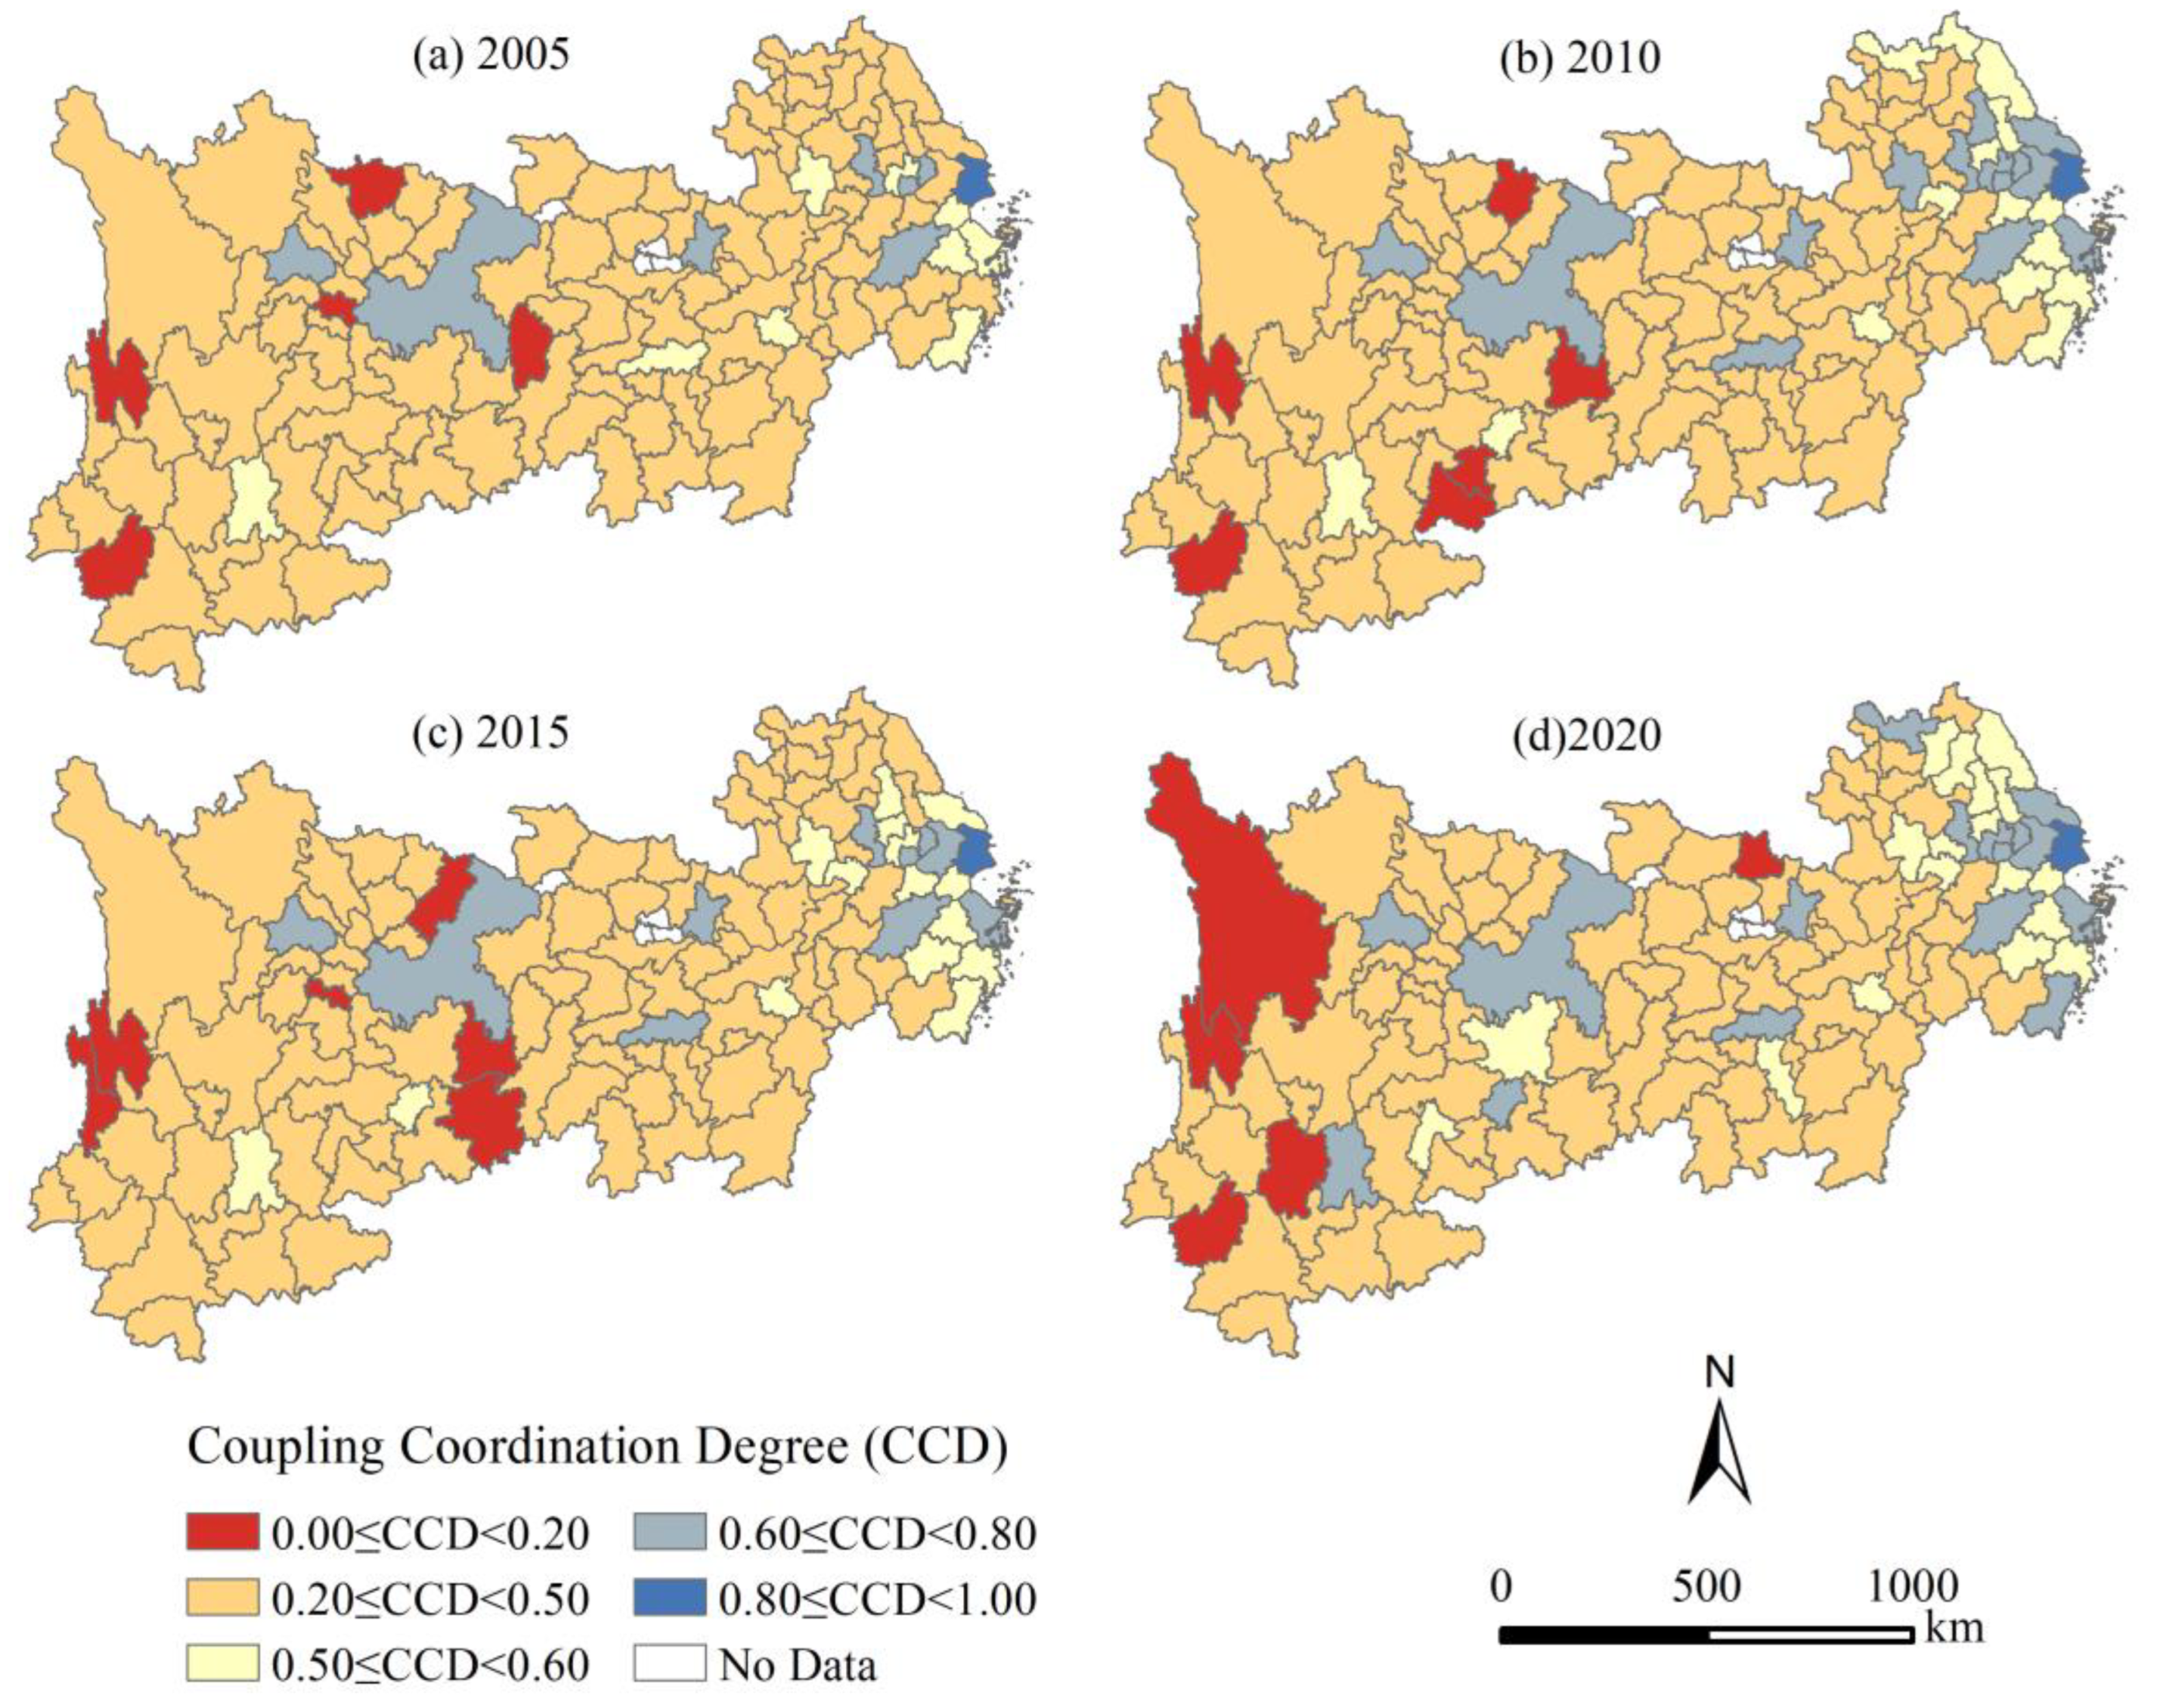
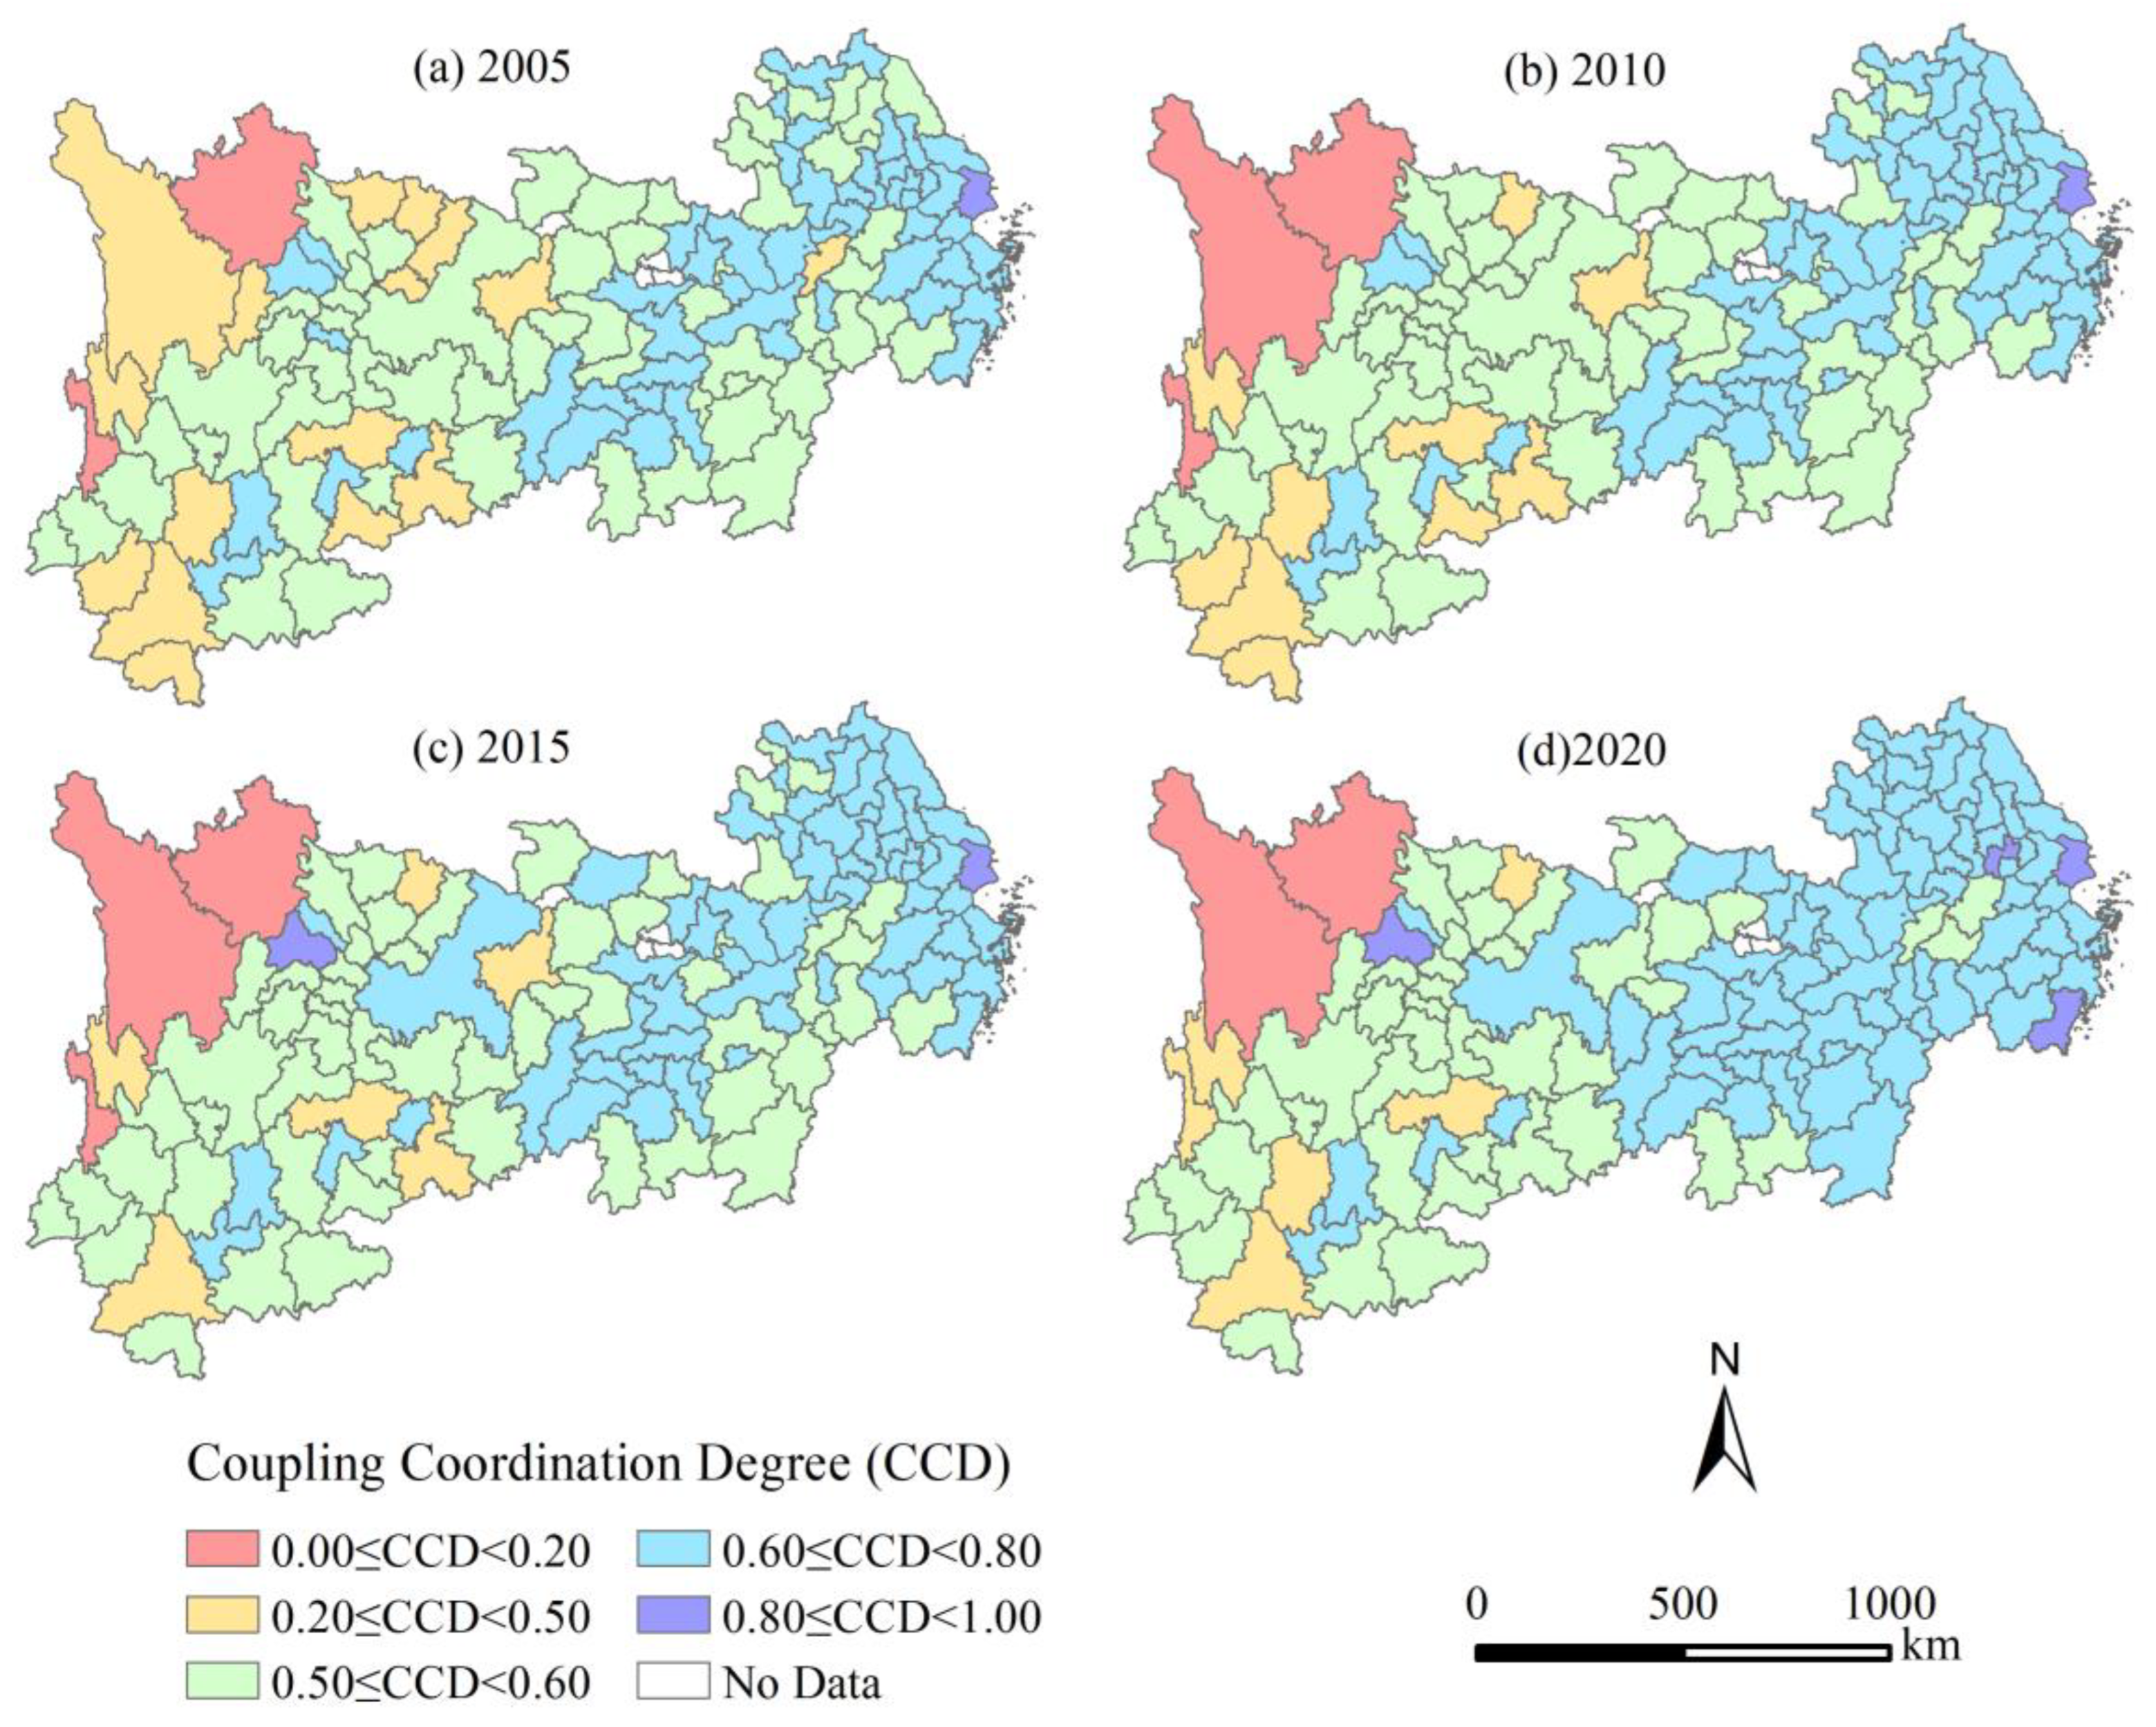
4.3.1. Coupling Degree between City Size and Urban Resilience

The degree of interaction between SUP, spatial scale, and urban resilience in the YREB is shown in Figure 7 and Figure 8, respectively. Figure 7 shows that, from 2005 to 2020, there was a strong interaction between SUP and urban resilience in the YREB and its three subregions, with the mean value of coupling degree of the downstream region ≈ the midstream region > the upstream region > 0.7. However, the coupling degree of the three sub-regions significantly varied. The coupling degree of the midstream and downstream regions was higher, while the upstream region had significant internal variations. Figure 8 shows that the interaction between CCS and resilience in the YREB and its three subregions increased varyingly. In other words, compared with the other two subregions, the association between CCS and resilience in the upstream region was weaker.

4.3.2. Coupling Degree between City Size and Urban Resilience

To reveal the degree of consistency and match between urban expansion and urban resilience in development, we measured and classified the CCD values between the two using CCDM. Figure 9 shows that the antagonistic state remained the most significant between SUP and urban resilience in the YREB. Firstly, the proportion of cities in an antagonistic state in the YREB remained around 3% from 2005 to 2020, and almost all of them were cities with a population of less than 1 million in the upper Yangtze River region. Meanwhile, the interaction between population size and urban resilience in these cities was weak. Secondly, the proportion of cities in a state of antagonism decreased from 83% to 69%. Among them, cities with low resilience and a large population were mainly located upstream, while cities with high resilience and a low population size were mainly located in the middle reaches. Almost all of these cities had a population of 1–3 million. Thirdly, the proportion of cities in a mild conflict state increased from 7% to 14%. Moreover, cities that moved from the antagonistic state to the mild conflict state were overwhelmingly located in the middle and lower reaches of the Yangtze River, with a population size of 3–5 million. Fourthly, the proportion of cities in a moderate coordination state increased from 4% to 12%, with all but six central cities in the middle reaches located downstream. Although these cities did not move to the moderate coordination state simultaneously, they generally had a population size of 5–8 million that year. Moreover, the interaction between population size and resilience was powerful (coupling between 0.8 and 1) in the mild conflict and moderate coordination cities. Fifthly, the only city in a coordination state was Shanghai. However, we found that the CCD between population size and urban resilience in Shanghai continued to decline and could even fall from coordination to a moderate coordination state. Considering the deepening interaction between population size and urban resilience, limiting population expansion will be an unneglectable issue in the future.
Figure 10 shows that the CCS and urban resilience of most cities in the YREB were still transitioning from moderate conflict to coordination between 2005 and 2020, with the average CCD values for the three sub-regions of downstream > midstream > downstream. Firstly, very few upstream cities were in the disorder state, where the city size coefficient was less than 0.001, and the interaction between CCS and resilience was weak. Secondly, the number of cities in antagonism decreased from 16 in 2005 to 6 in 2020, all of which were upstream cities with city size coefficients ranging from 0.001 to 0.003. The interaction between CCS and resilience was also weak. Thirdly, the proportion of cities in the moderate conflict state decreased from 45% in 2005 to about 30% in 2020, most of which were upstream cities, with a coefficient between 0.005 and 0.01. The interaction between CCS and resilience was moderate. Moreover, their spatial scale expansion lagged behind urban resilience development. Fourthly, the proportion of cities in the moderate coordination state increased from 40% to 60%, and the vast majority were cities in the middle and lower reaches. When these cities transited to the moderate coordination state, their city size coefficients were almost all between 0.01 and 0.1, and the interaction between CCS and resilience was at the upper middle level. Fifth, very few cities were in the coordination state, only Shanghai in 2005, although this number increased to four in 2020. When these cities transited to the coordination state, their city size coefficients were close to 0.15, and the coupling between CCS and resilience was high (between 0.8 and 1). However, Shanghai is a special case in that its city size coefficient expanded from 0.12 to 0.24, and the degree of interaction between CCS and resilience deepened. However, coordination between the two continued to decline, suggesting a strong negative correlation between spatial-scale expansion and resilience in this city over the study period.

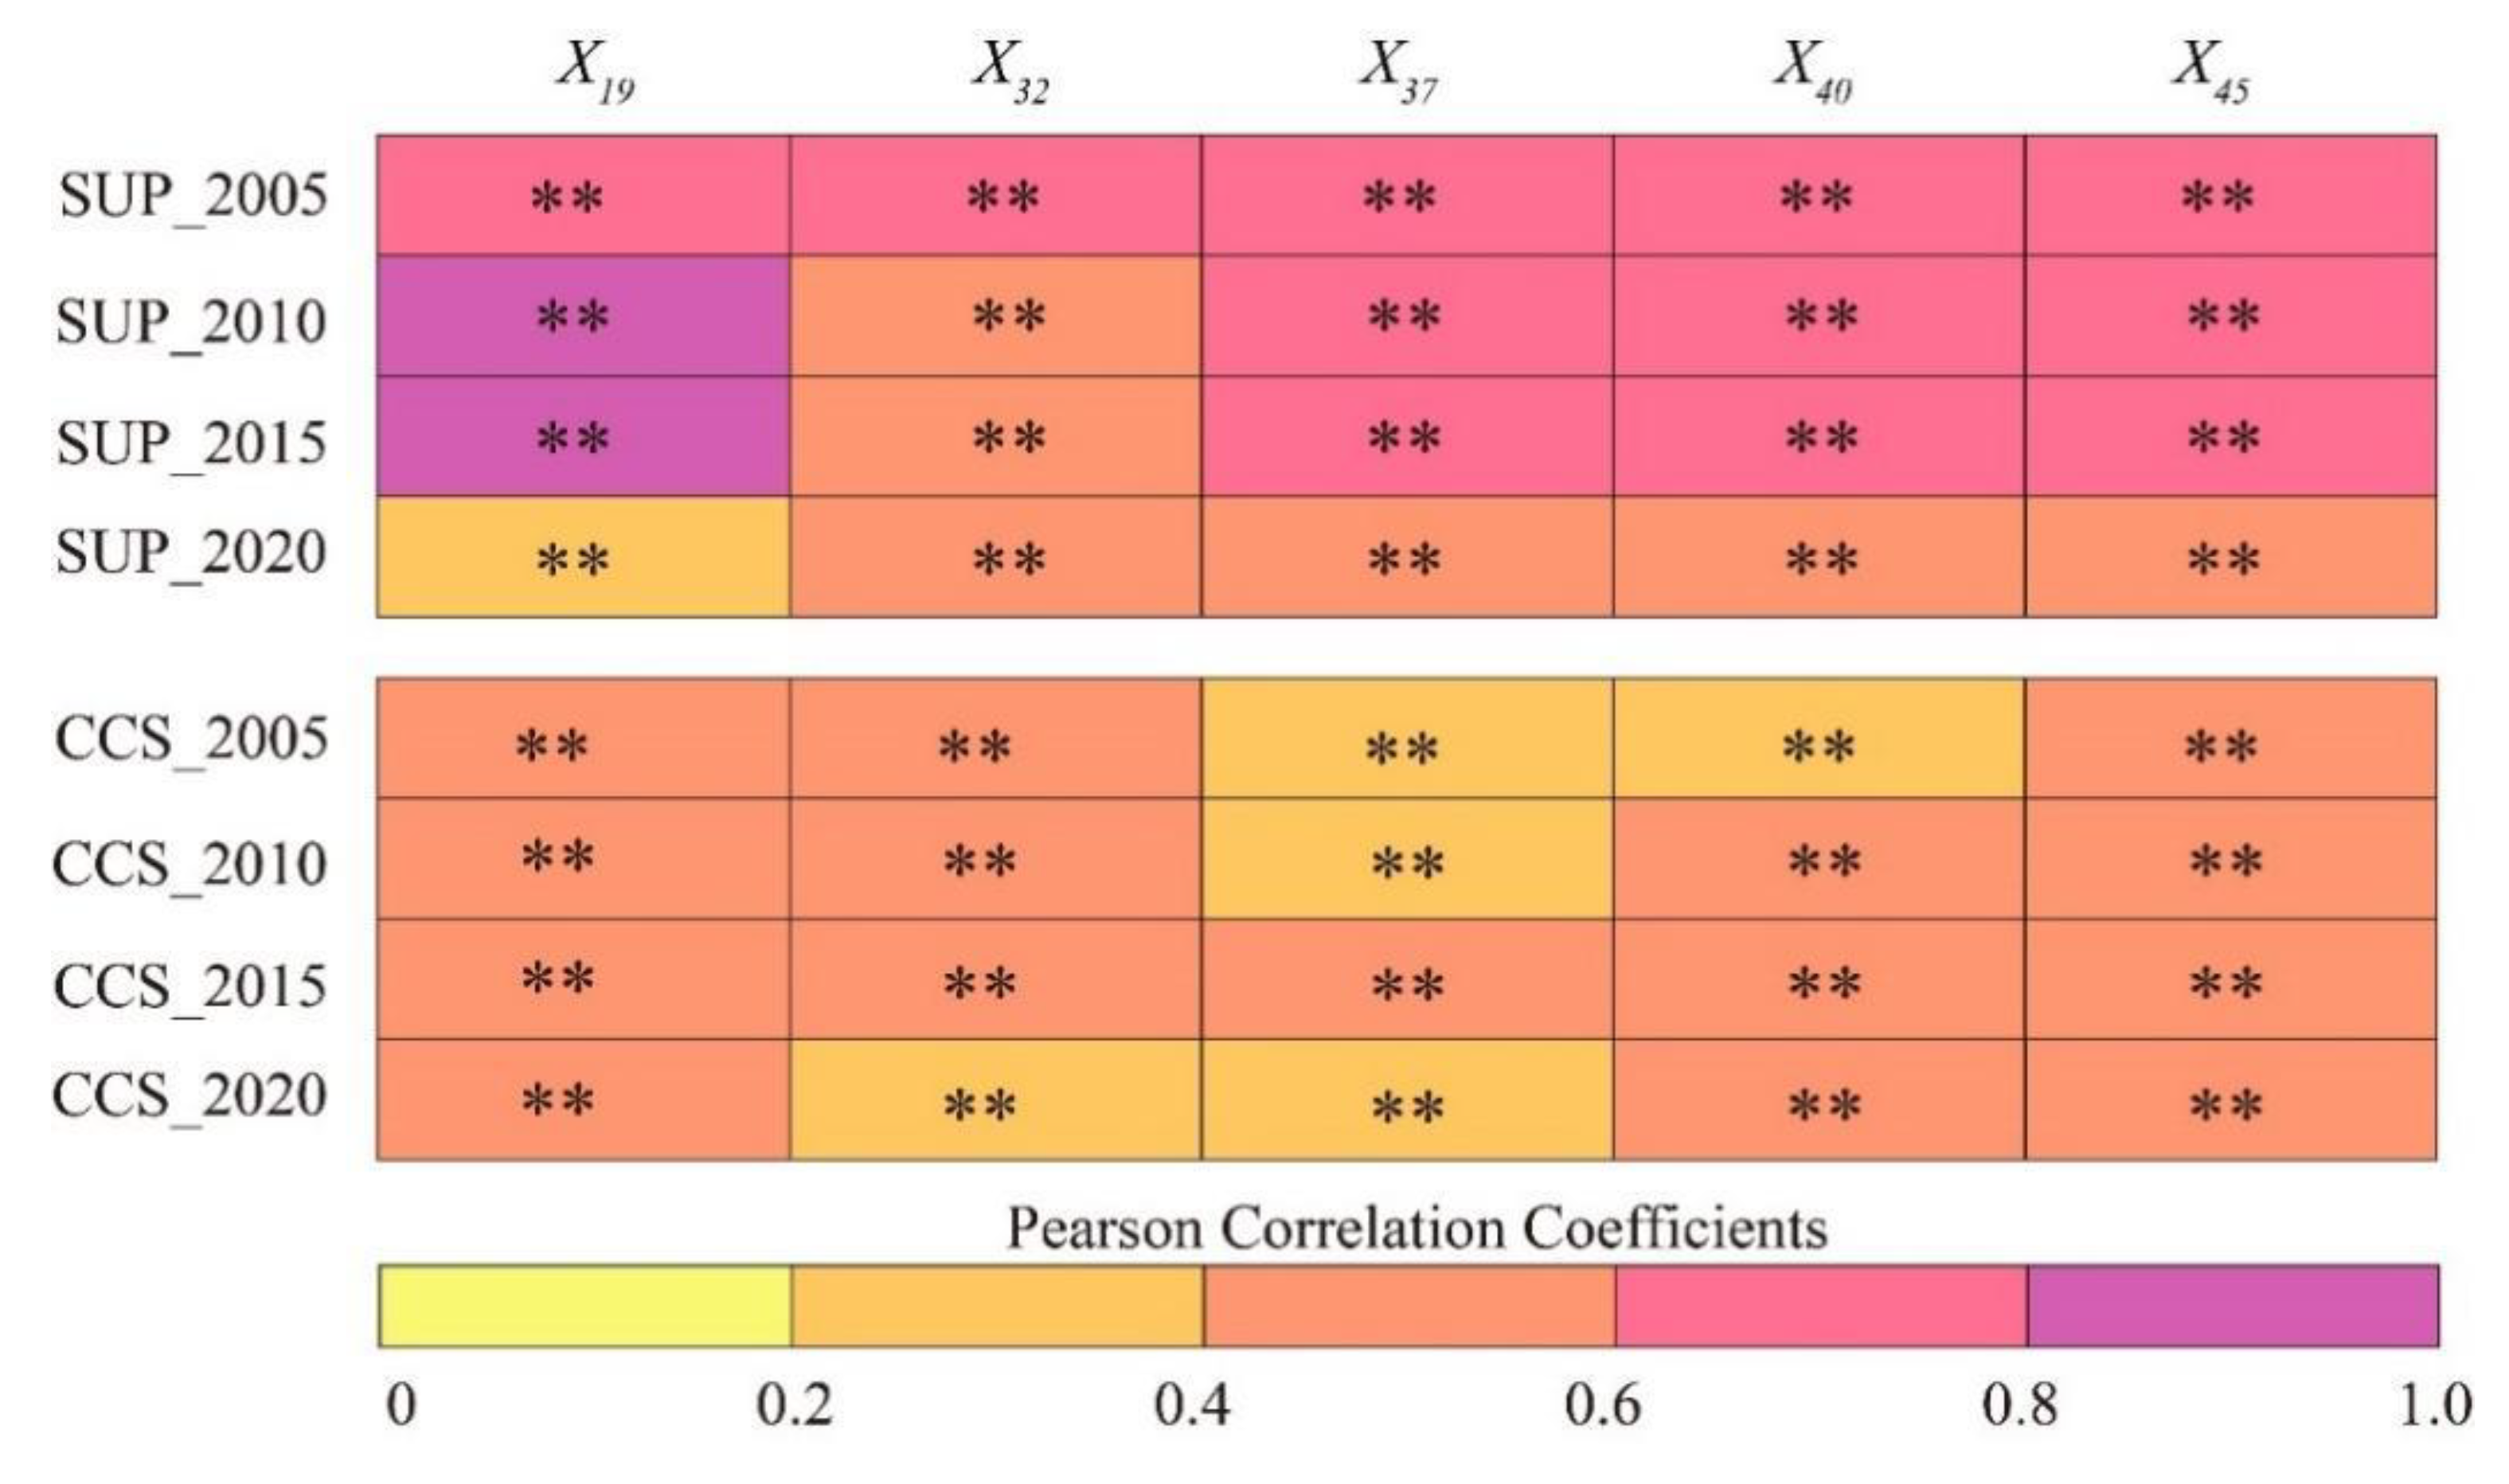
4.4. Relationship between Key Obstacle Factors and City Size

The analysis in Section 4.3 confirms the interaction between city size and urban resilience and its direction from the SUP and CCS perspectives, respectively. In order to understand whether there is a direct correlation between the main obstacle factors affecting urban resilience and city size in different periods, we established a Pearson correlation matrix of the volume of domestic air routes (X19), the number of invention patents granted per 10,000 (X32), the number of headquarters of Fortune 500 enterprises stationed in the city (X37), international tourism revenue (X40), and the number of contracts signed by foreign-invested enterprises (X45) with SUP and CCS in different periods (Figure 11). The results show that the t-test probabilities of the correlation coefficients between SUP and the five obstacle factors from 2005 to 2020 were all less than 0.001. Although there were differences in the performance of the correlation coefficients in different periods, this indicates that the null hypothesis was rejected at the significance level of 0.001. Firstly, from 2005 to 2015, the four main obstacle factors, including the volume of domestic air routes (X19), the number of headquarters of Fortune 500 companies in the city (X37), international tourism revenue (X40), and the number of contracts signed by foreign-invested enterprises (X45), all showed positive and strong correlations, and their correlation coefficients kept increasing. This suggests that the continued expansion of SUP in this period was conducive to improving the performance of the above factors, and thus reducing their resistance. Secondly, the correlations between the five obstacle factors and SUP weakened in 2020, indicating that a larger population size could no longer boost the above factors significantly. Thirdly, the correlation between the number of patents granted per 10,000 (X32) and SUP decreased from a strong correlation to a moderate correlation from 2010 onwards. Given the general expansion of SUP, this was probably because this factor was more closely related to population “quality: than “quantity” after passing a certain threshold. Therefore, based on the CCD analysis in Section 4.3.2 on SUP and urban resilience, we disaggregated the main obstacle factors screened in Section 4.2 by size class (see Appendix B Table A2). The results were as follows: Firstly, from 2005 to 2015, while the above factors still hindered cities with a population size of less than 3 million, the volume of domestic air routes (X19) and the number of invention patents granted per 10,000 (X32) were no longer the main obstacles for cities with a population size of 5–10 million. Meanwhile, cities with a population of 10 million and above were largely no longer influenced by these factors. Therefore, the influence of the five main obstacle factors decreases as population size increases. Secondly, there is no significant variability in the influence of the other major obstacle factors on cities with different population size classes in 2020, except for the number of invention patents granted per 10,000 (X32). Thirdly, the statistical analysis revealed that the number of invention patents granted per 10,000 (X32) did not pose a significant resistance in cities with a population size of 5 million and above from 2005 to 2020. In addition, we also found that energy supply and structure were more problematic for cities with a population of 5 million and above. Energy self-sufficiency (X12) and the proportion of non-fossil fuel power generation (X20) became the main obstacles. There was also the potential of an aging population in cities with a population of 10 million. The natural population growth rate (X26) became the main obstacle. In addition, the null hypothesis was rejected at a significance level of 0.001 between CCS and the five obstacle factors. However, the relationship between CCS and the major obstacle factors largely maintained a stable yet moderately weak correlation from 2005 to 2020, indicating that the current CCS and its expansion range in the YREB did not impact the above factors significantly.

5. Discussion

5.1. Dynamic Changes in Urban Resilience and Its Subdimensions

Based on the analysis of the resilience of cities in the YREB from different dimensions, this study generalized their spatial and temporal variability and the general characteristics of urban resilience. First, the resilience of the vast majority of cities in the YREB was improved to varying degrees from 2005 to 2020, with a distribution pattern that was high in the east and low in the west. This is consistent with the findings of Bai et al. [50] and Zhao et al. [51] in their evaluations from economic, ecological, infrastructural, social, and institutional perspectives. In contrast to their view, this study found that the resilience of some cities did not uniformly increase with socio-economic development and progress. For example, the urban resilience of three upstream autonomous states (each of them has an SUP < 0.5 million, CCS ≤ 0.01) and Shanghai, Hangzhou, Suzhou, and Wuxi in the downstream region (each of them has an SUP ≥ 5 million, CCS ≥ 0.1), declined by more than 5% in 2020 compared to 2005. In particular, the urban resilience of Shanghai continued to decline by more than 25%. This implies that support for small cities [11] and large cities [15] is questionable. We acknowledge the impact of city size on the development of urban resilience. However, we argue that the discussions regarding increasing the urban resilience of cities of different sizes are more relevant in the context of sustainable development than discussions focusing on size itself.
Connectivity was most significantly improved among the four sub-dimensions of the resilience index, followed by stability. Redundancy remained stable, while resourcefulness showed a decreasing trend. Specifically, cities in the YREB showed a general improvement in connectivity and stability. The substantial increase in connectivity is a testament to the YREB’s efforts to build infrastructure (communication and transport) [51] and to open up society and economic markets, both internally and externally. However, connectivity had the lowest resilience index, indicating that most cities in the YREB urgently need to enhance their ability to communicate with the outside world. The increase in stability implies that the YREB strengthened its bedrock in response to the crisis and validates the effective promotion of new urbanization in terms of the economic, demographic, social, and environmental aspects [52]. In contrast, the constant redundancy and declining resourcefulness are attributed to the increasingly differentiated performance of the three subregions. For instance, the upstream and midstream cities with high redundancy and resourcefulness are mainly the central ones, while the downstream region generally shows high redundancy and resourcefulness. Such central cities (more developed cities) have a greater capacity to reserve an additional capacity for crisis resolution and innovative transformation. The difference between redundancy and resourcefulness corresponds to the current east–west regional development gap and China’s local core–fringe spatial structure [53].

5.2. Insights of the Relationship between City Size and Urban Resilience

There is a clear spatial imbalance between urban resilience and the CCD of different types and levels of city size. On the one hand, the SUP rank corresponds to the average urban resilience index. The higher the rank, the higher the average urban resilience index of the city group. Specifically, cities with higher CCDs (CCD ≥ 0.60) mostly had a population of 5 million and above. Such core cities tend to have a higher position and better ability to occupy, dominate, and utilize resources [14], and local governments are more than equal to sustainable urban development [54]. However, SUP is not entirely positively correlated with the urban resilience index for individual cities, a view that differs from that of Zhao et al. (2022) [51]. We found that some mid- and downstream areas with smaller populations did not have lower levels of urban resilience, which might be related to their higher level of functional sophistication or governance [55]. This is also supported by the fact that Shanghai, the city with the highest CCD, saw its urban resilience decrease with population expansion. On the other hand, the distribution of CCS in the YREB followed the pattern of “high in the east and low in the west”. However, the correlation between the two is polarized. While the interaction between spatial size and urban resilience is weaker in most cities, cities with a larger CCS (CCS ≥ 0.1) have higher urban resilience. This might be related to the fact that spatial expansion implies economic growth, increased resource allocation, and infrastructure development [27].

5.3. Major Factors Hindering the Urban Resilience in Different City Size

According to the analysis of the correlation between obstacle factors and city size, it can be seen that the obstacle factors affecting urban resilience are closely related to SUP within a certain range. The resilience of cities with a population size of less than 3 million is mainly constrained by the low connectivity and the lack of innovation and transformation capacity. However, when the population size reaches 5 million and above, the above factors will not hinder urban resilience, which might be related to the higher economic, technological, intellectual, and other capital reserves of larger cities [56,57]. However, the sustainability of energy supply and energy mix and the potential of an aging population become key impediments to urban resilience that must be considered for cities of 5 million and above and, in particular, megacities. The findings of this study echo, firstly, the view that no city can exist completely insulated from risks or disasters [8] and that cities of different sizes and stages of development need to learn about life in the city and its problems. Secondly, the focus on resilience varies among cities of different sizes. Cities with a population of under 3 million should focus on improving their current access to the outside world, such as infrastructure investment and social communication. In contrast, cities with a population of of 5 million and above (especially megacities) should pay attention to maintaining a reasonable population structure and optimize their energy allocation.

6. Conclusions

This study took 126 cities in China’s YREB as case studies to diagnose the spatial–temporal variation and barriers to urban resilience, and analyze the extent and direction of the interaction between city size and resilience. The conclusions are as follows.
From 2005 to 2020, the urban resilience of cities in the YREB showed an overall upward trend, and the spatial differences showed a trend of being “high in the east and low in the west”. With regard to the four dimensions of urban resilience, stability and connectivity were generally improved, and spatial differences narrowed across cities in the YREB. Furthermore, redundancy and resourcefulness showed a general trend of “rising in the east and falling in the west”, with a spatial heterogeneity from downstream to midstream and upstream, and a decreasing “core-fringe” spatial structure. This means downstream areas and central cities have an additional capacity to address the crisis and adapt to constraints and future changes.
In the YREB, city clusters with large population sizes and high city-size coefficients have higher urban resilience, with a decreasing “core-fringe” spatial structure. For cities with similar population sizes or CCS, their urban resilience complies with the following pattern: downstream area > midstream area > upstream area. In addition, the performance of Shanghai and upstream cities with a population of less than 500,000 demonstrates that megacities and tiny cities are more likely to suffer from declining urban resilience.
From 2005 to 2020, the CCD between SUP and resilience continued to rise, but most cities were still in an antagonistic state. Cities with larger populations but lower resilience were mainly located in the upstream region. This mismatch may lead to a wider range of exposure to risks, especially sudden risks. Cities whose population size development lagged behind resilience were mainly located in the midstream and downstream areas. Cities with a moderate coordination and below were mainly located in upstream areas, and the spatial-scale expansion of most cities lagged behind resilience.
SUP is closely related to the main obstacles affecting urban resilience. The lack of potential for obtaining external help in times of crisis (connectivity) and the potential for innovation and transformation is the general reason for the low resilience of cities with a population below 3 million. In contrast, cities with a population of 5 million and above, especially megacities, should focus on the constraints of energy supply, energy structure, an aging population, etc. Moreover, the resilience of cities in the 3–5 million population range is mainly constrained by the low level of connectivity in the YREB.
There were a few limitations to our research. Firstly, the timespan of our research was only fifteen years because of the scarce earlier data, and the indicators we selected could not cover every aspect of urban resilience, due to the constraint of data availability. Secondly, though the obstacles to urban resilience were identified based on statistical methods, we did not provide empirical evidence to analyze the interactions between the obstacles and urban resilience. In future research on this topic, we propose establishing a fixed observation system in cities with a varying size and collecting data related to urban resilience periodically to accumulate sufficient data for assessing urban resilience. Furthermore, we would like to perform in-depth investigations of a city to uncover the links between city size and urban resilience and explore ways to improve urban resilience.

Author Contributions

Conceptualization, L.W.; methodology, L.W.; software, L.W. and L.L.; formal analysis, L.W.; investigation, L.W. and J.L.; resources, L.W.; data curation, L.W.; writing—original draft preparation, L.W. and J.L.; writing—review and editing, L.W. and L.L.; visualization, W.L and L.L.; project administration, L.L.; funding acquisition, L.L. All authors have read and agreed to the published version of the manuscript.

Funding

This research was funded by the National Natural Science Foundation of China, grant number 42271271.

Data Availability Statement

The authors have not obtained permission to publish the data. Therefore, the data can be obtained from the corresponding author upon reasonable request.

Conflicts of Interest

The authors declare no conflict of interest.

Appendix A

The YREB spans the three major regions of east, central, and west China, covering 126 cities (see Appendix A, Table A1).
Table A1. Classification of cities in the YREB.
ZoneMembersCharacteristic
upstreamChongqing Chengdu Zigong Panzhihua Luzhou Deyang Mianyang Guangyuan Suining Neijiang Leshan Nanchong Meishan Yibin Guang’an Dazhou Ya’an Bazhong Ziyang A’Bazhou Ganzizhou Liangshanzhou Kunming Qujing Lijiang Yuxi Zhaotong Baoshan Pu’Er Lincang Chuxiongzhou Dalizhou Dehongzhou Diqingzhou Honghezhou Nujiangzhou Wenshanzhou Sipsongpanna Guiyang Liupanshui Zunyi Anshun Tongren Bijie Qiannanzhou Qianxinanzhou QiandongnanzhouThis region accounts for 60%, 55.4%, 48%, 33.2%, and 23.3% of the species, area, water resource, population, and GDP of the YREB, respectively. It is dominated by mountains and plateaus, with high mountains and deep valleys, and obvious topography. It has abundant water resources, hydropower resources, forest resources, and tourism resources. This region contains some of the most concentrated and serious geological disasters, such as landslides, mud–rock flows, and earthquakes, in China.
midstreamNanchang Jiujiang Jingdezhen Shangrao Yingtan Fuzhou Yichun Xinyu Pingxiang Ji’An Ganzhou Wuhan Huangshi Xiangyang Jingzhou Yichang Shiyan Xiaogan Jingmen E’Zhou Huanggang Xianning Suizhou Enshizhou Changsha Zhuzhou Xiangtan Hengyang Shaoyang Yueyang Changde Zhangjiajie Yiyang Loudi Chengzhou Yongzhou Huaihua XiangxizhouThis region covers the largest urban agglomeration in China, with its area, population, and GDP accounting for about 27.5%, 29.2%, and 24.3% of YREB, respectively. The terrain of this region is relatively flat, with plain, low mountains and hills. It has numerous rivers and lakes, rich in water resources and mineral resources. Flooding is one of the major natural threats testing the resilience of cities in this region.
downstreamSuzhou Wuxi Changzhou Zhenjiang Nanjing Nantong Yangzhou Taizhou Jiangyin Huai’An Suqian Xuzhou Lianyungang Zhoushan Hangzhou Jiaxing Wenzhou Ningbo Shaoxing Huzhou Lishui Taizhou Jinhua Quzhou Hefei Wuhu Bengbu Huainan Ma’Anshan Huaibei Tongling Anqing Huangshan Fuyang Suzhou Chuzhou Lu’An Xuancheng Chizhou BozhouThis region account for 17.1%, 37.6%, and 52% of the area, population, and GDP of the YREB, respectively. This region is one of the flattest areas in China, with wide and deep rivers, abundant water resources, a dense population, and advanced science and technology. The main problems facing this area are water pollution and air pollution.

Appendix B

Based on the CCD analysis in Section 4.3.2 on SUP and urban resilience, we disaggregated the main obstacle factors screened in Section 4.2 by size class (Table A2).
Table A2. Major obstacle factors of cities with different population sizes in the YREB (unit: %).
YearSUPRanking
12345
2005<1 millionX37
163.58
X45
162.80
X19
162.06
X40
161.07
X32
160.27
1–3 millionX37
182.88
X40
180.87
X45
177.45
X44
177.17
X19
176.64
3–5 millionX37
28.62
X33
27.11
X40
26.16
X12
24.93
X19
20.95
5–10 millionX37
15.57
X33
14.28
X40
14.25
X45
14.05
X20
7.69
≥10 millionX26
7.16
X20
7.16
X12
7.16
--
2010<1 millionX37
119.92
X45
119.46
X19
118.89
X32
118.81
X31
117.97
1–3 millionX37
206.57
X40
204.89
X19
204.23
X32
198.40
X31
191.40
3–5 millionX37
41.71
X40
40.35
X45
39.74
X19
34.02
X32
32.76
5–10 millionX45
24.69
X12
24.08
X40
24.66
X37
23.87
X20
18.22
≥10 millionX20
9.53
X39
8.40
X8
8.37
X12
8.15
X33
5.89
2015<1 millionX37
63.45
X45
63.37
X38
63.17
X19
61.43
X32
59.26
1–3 millionX37
231.94
X45
230.38
X40
230.37
X19
227.22
X32
214.12
3–5 millionX37
56.52
X12
56.03
X40
55.54
X45
55.46
X38
54.67
5–10 millionX12
34.71
X45
33.17
X38
32.53
X37
31.61
X40
30.54
≥10 millionX30
11.66
X26
11.42
X12
9.24
X40
6.56
X38
6.43
2020<1 millionX37
64.82
X45
64.53
X40
64.40
X19
61.96
X32
61.05
1–3 millionX40
223.34
X37
222.80
X45
222.70
X19
207.45
X32
202.21
3–5 millionX37
62.59
X40
62.37
X45
61.58
X44
60.87
X19
53.75
5–10 millionX40
33.80
X45
32.69
X37
31.96
X44
29.14
X19
25.24
≥10 millionX20
15.68
X26
13.83
X37
12.61
X40
12.57
X45
12.32

References

  1. Beck, U. Risk Society: Towards a New Modernity; Sage: London, UK, 1992. [Google Scholar]
  2. Huang, G.; Li, D.; Zhu, X.; Zhu, J. Influencing factors and their influencing mechanisms on urban resilience in China. Sustain. Cities Soc. 2021, 74, 103210. [Google Scholar] [CrossRef]
  3. Banai, R. Pandemic and the planning of resilient cities and regions. Cities 2020, 106, 102929. [Google Scholar] [CrossRef]
  4. Shamsuddin, S. Resilience resistance: The challenges and implications of urban resilience implementation. Cities 2020, 103, 102763. [Google Scholar] [CrossRef]
  5. Chen, J.; Guo, X.; Pan, H.; Zhong, S. What determines city’s resilience against epidemic outbreak: Evidence from China’s COVID-19 experience. Sustain. Cities Soc. 2021, 70, 102892. [Google Scholar]
  6. Meerow, S.; Newell, J.P. Urban resilience for whom, what, when, where, and why? Urban Geogr. 2019, 40, 309–329. [Google Scholar] [CrossRef]
  7. City Resilience Index. City Resilience Framework; The Rockefeller Foundation ARUP: New York, NY, USA, 2014; Volume 4, p. 928. [Google Scholar]
  8. Büyüközkan, G.; Ilıcak, Ö.; Feyzioğlu, O. A review of urban resilience literature. Sustain. Cities Soc. 2022, 77, 103579. [Google Scholar] [CrossRef]
  9. World Bank. Building Urban Resilience; Jha, A., Miner, T., Stanton-Geddes, Z., Eds.; World Bank: Washington, DC, USA, 2013. [Google Scholar]
  10. Van Putten, I.; Villanueva, C.; Cvitanovic, C. The Influence of community size and location on different dimensions of vulnerability: A case study of Australian coastal communities. Aust. Geogr. 2017, 48, 121–142. [Google Scholar] [CrossRef]
  11. Stier, A.J.; Berman, M.G.; Bettencourt, L.M.A. COVID-19 attack rate increases with city size. arXiv 2020, 2003, 10376. [Google Scholar]
  12. Hua, J.; Zhang, X.; Ren, C.; Shi, Y.; Lee, T.-C. Spatiotemporal assessment of extreme heat risk for high-density cities: A case study of Hong Kong from 2006 to 2016. Sustain. Cities Soc. 2021, 64, 102507. [Google Scholar]
  13. Capello, R.; Caragliu, A.; Fratesi, U. Spatial heterogeneity in the costs of the economic crisis in Europe: Are cities sources of regional resilience? J. Econ. Geogr. 2015, 15, 951–972. [Google Scholar] [CrossRef]
  14. Feng, X.; Lei, J.; Xiu, C.; Li, J.; Bai, L.; Zhong, Y. Analysis of Spatial Scale Effect on Urban Resilience: A Case Study of Shenyang, China. Chin. Geogr. Sci. 2020, 30, 1005–1021. [Google Scholar] [CrossRef]
  15. Hamidi, S.; Sabouri, S.; Ewing, R. Does Density Aggravate the COVID-19 Pandemic? J. Am. Plann. Assoc. 2020, 86, 495–509. [Google Scholar] [CrossRef]
  16. Earl, C.; Vietnam, R. Living with authoritarianism: Ho Chi Minh city during COVID-19 lockdown. City Soc. 2020, 32, 12306. [Google Scholar] [CrossRef]
  17. Chu, Z.; Cheng, M.; Song, M. What determines urban resilience against COVID-19: City size or governance capacity? Sustain. Cities Soc. 2021, 75, 103304. [Google Scholar] [CrossRef]
  18. Giddens, A. Les Conséquences de la Modernité [1990]; L’Harmattan: Paris, France, 1994. [Google Scholar]
  19. Lloyd. Lloyd’s City Risk Index 2015–2025. City Risk Executive Summary; Lloyd’s of London: London, UK, 2015. [Google Scholar]
  20. UN-Habitat. New Urban Agenda: Habitat III: Quito 17–20 October 2016; UN: Nairobi, Kenya, 2017; ISBN 978-92-1-132731-1. [Google Scholar]
  21. Godschalk, D.R. Urban Hazard Mitigation: Creating Resilient Cities. Nat. Hazards Rev. 2003, 4, 136–143. [Google Scholar] [CrossRef]
  22. Ahern, J. From fail-safe to safe-to-fail: Sustainability and resilience in the new urban world. Landsc. Urban Plan. 2011, 100, 341–343. [Google Scholar] [CrossRef]
  23. Meerow, S.; Newell, J.P.; Stults, M. Defining urban resilience: A review. Landsc. Urban Plan. 2016, 147, 38–49. [Google Scholar] [CrossRef]
  24. Pizzo, B. Problematizing resilience: Implications for planning theory and practice. Cities 2015, 43, 133–140. [Google Scholar] [CrossRef]
  25. Michel-Kerjan, E. We must build resilience into our communities. Nature 2015, 524, 389. [Google Scholar] [CrossRef]
  26. Birkmann, J.; Welle, T.; Solecki, W.; Lwasa, S.; Garschagen, M. Boost resilience of small and mid-sized cities. Nature 2016, 537, 605–608. [Google Scholar] [CrossRef] [PubMed]
  27. Du, M.; Zhang, X.; Wang, Y.; Tao, L.; Li, H. An operationalizing model for measuring urban resilience on land expansion. Habitat Int. 2020, 102, 102206. [Google Scholar] [CrossRef]
  28. Holling, C.S. Resilience and Stability of Ecological Systems. Annu. Rev. Ecol. Syst. 1973, 4, 1–23. [Google Scholar] [CrossRef]
  29. Bruneau, M.; Chang, S.E.; Eguchi, R.T.; Lee, G.C.; O’Rourke, T.D.; Reinhorn, A.M.; Shinozuka, M.; Tierney, K.; Wallace, W.A.; von Winterfeldt, D. A Framework to Quantitatively Assess and Enhance the Seismic Resilience of Communities. Earthq. Spectra 2003, 19, 733–752. [Google Scholar] [CrossRef]
  30. Lin, Y.; Peng, C.; Shu, J.; Zhai, W.; Cheng, J. Spatiotemporal characteristics and influencing factors of urban resilience efficiency in the Yangtze River Economic Belt, China. Environ. Sci. Pollut. Res. 2022, 29, 39807–39826. [Google Scholar] [CrossRef]
  31. Bettencourt, L.M.A.; Lobo, J.; Helbing, D.; Kuhnert, C.; West, G.B. Growth, innovation, scaling, and the pace of life in cities. Proc. Natl. Acad. Sci. USA 2007, 104, 7301–7306. [Google Scholar] [CrossRef]
  32. Lei, W.; Jiao, L.; Xu, G.; Zhou, Z. Urban Scaling in Rapidly Urbanising China. Urban Stud. 2022, 59, 1889–1908. [Google Scholar] [CrossRef]
  33. Lee, V.J.; Aguilera, X.; Heymann, D.; Wilder-Smith, A. Lancet Infectious Diseases Commission Preparedness for Emerging Epidemic Threats: A Lancet Infectious Diseases Commission. Lancet Infect. Dis. 2020, 20, 17–19. [Google Scholar] [CrossRef]
  34. Sharifi, A. Urban form resilience: A meso-scale analysis. Cities 2019, 93, 238–252. [Google Scholar] [CrossRef]
  35. Hu, M.; Roberts, J.D.; Azevedo, G.P.; Milner, D. The role of built and social environmental factors in COVID-19 transmission: A look at America’s capital city. Sustain. Cities Soc. 2021, 65, 102580. [Google Scholar] [CrossRef]
  36. Zhang, X.; Liu, L.; Zhao, T.; Gao, Y.; Chen, X.; Mi, J. GISD30: Global 30 m impervious-surface dynamic dataset from 1985 to 2020 using time-series Landsat imagery on the Google Earth Engine platform. Earth Syst. Sci. Data 2022, 14, 1831–1856. [Google Scholar] [CrossRef]
  37. Manyena, S.B. The concept of resilience revisited. Disasters 2006, 30, 434–450. [Google Scholar] [CrossRef] [PubMed]
  38. Kim, S.; Rowe, P.G. Are master plans effective in limiting development in China’s disaster-prone areas? Landsc. Urban Plan. 2013, 111, 79–90. [Google Scholar] [CrossRef]
  39. Moser, S.; Meerow, S.; Arnott, J.; Jack-Scott, E. The Turbulent World of Resilience: Interpretations and Themes for Transdisciplinary Dialogue. Clim. Change 2019, 153, 21–40. [Google Scholar] [CrossRef]
  40. Nasiri, N.A.; Al-Awadhi, T.; Hereher, M.; Ahsan, R.; AlRubkhi, A.G. Changing urban ecology a challenge for coastal urban resilience: A study on muscat. Environ. Urban. ASIA 2020, 11, 10–28. [Google Scholar] [CrossRef]
  41. Zhao, R.; Fang, C.; Liu, H. Progress and prospect of urban resilience research. Prog. Geogr. 2020, 39, 1717–1731. (In Chinese) [Google Scholar] [CrossRef]
  42. Jha, A.K.; Miner, T.W.; Stanton-Geddes, Z. Building Urban Resilience: Principles, Tools, and Practice; World Bank and Australian Aid: Washington, DC, USA, 2013. [Google Scholar]
  43. Lu, H.; Lu, X.; Jiao, L.; Zhang, Y. Evaluating Urban Agglomeration Resilience to Disaster in the Yangtze Delta City Group in China. Sustain. Cities Soc. 2022, 76, 103464. [Google Scholar] [CrossRef]
  44. Wang, L.; Liu, H. Comprehensive evaluation of regional resources and environmental carrying capacity using a PS-DR-DP theoretical model. J. Geogr. Sci. 2019, 29, 363–376. [Google Scholar] [CrossRef]
  45. Fan, Y.; Fang, C. Evolution process and obstacle factors of ecological security in western China, a case study of Qinghai province. Ecol. Indic. 2020, 117, 106659. [Google Scholar] [CrossRef]
  46. Kuang, W. Mapping global impervious surface area and green space within urban environments. Sci. China Earth Sci. 2019, 62, 1591–1606. [Google Scholar] [CrossRef]
  47. Cottineau, C. MetaZipf. A dynamic meta-analysis of city size distributions. PLoS ONE 2017, 12, e0183919. [Google Scholar] [CrossRef]
  48. Li, Q.; Zhao, Y.; Li, S.; Zhang, L. Spatial-temporal characteristics of the coupling coordination of social security and economic development in China during 2002–2018. Reg. Sustain. 2021, 2, 116–129. [Google Scholar] [CrossRef]
  49. Yang, X.; Zhang, F.; Xiao, Y.; An, Y.; Jiang, C.; Tan, H.; Gong, G. Coupling and interaction between tourism eco-efficiency and new urbanization in the Yangtze River Economic Belt: Based on the perspective of uncoupling coordination. Environ. Dev. Sustain. 2022, 25, 13171–13197. [Google Scholar] [CrossRef]
  50. Bai, L.M.; Xiu, C.L.; Feng, X.H.; Mei, D.W.; Wei, Y. A comprehensive assessment of urban resilience in China and its spatial and temporal variation characteristics. World Reg. Stud. 2019, 28, 77–87. [Google Scholar]
  51. Zhao, R.; Fang, C.; Liu, J.; Zhang, L. The evaluation and obstacle analysis of urban resilience from the multidimensional perspective in Chinese cities. Sustain. Cities Soc. 2022, 86, 104160. [Google Scholar] [CrossRef]
  52. Jiang, J.; Zhu, S.; Wang, W.; Li, Y.; Li, N. Coupling coordination between new urbanization and carbon emissions in China. Sci. Total Environ. 2022, 850, 158076. [Google Scholar] [CrossRef]
  53. Deng, X.; Liang, L.; Wu, F.; Wang, Z.; He, S. A review of the balance of regional development in China from the perspective of development geography. J. Geogr. Sci. 2022, 32, 3–22. [Google Scholar] [CrossRef]
  54. Xiao, Y.; Zhong, J.-L.; Zhang, Q.-F.; Xiang, X.; Huang, H. Exploring the coupling coordination and key factors between urbanization and land use efficiency in ecologically sensitive areas: A case study of the Loess Plateau, China. Sustain. Cities Soc. 2022, 86, 104148. [Google Scholar] [CrossRef]
  55. Feofilovs, M.; Romagnoli, F. Dynamic assessment of urban resilience to natural hazards. Int. J. Disaster Risk Reduct. 2021, 62, 102328. [Google Scholar] [CrossRef]
  56. Mou, Y.; Luo, Y.; Su, Z.; Wang, J.; Liu, T. Evaluating the dynamic sustainability and resilience of a hybrid urban system: Case of Chengdu, China. J. Clean. Prod. 2021, 291, 125719. [Google Scholar] [CrossRef]
  57. Zhou, B.-B.; Aggarwal, R.; Wu, J.; Lv, L. Urbanization-associated farmland loss: A macro-micro comparative study in China. Land Use Policy 2021, 101, 105228. [Google Scholar] [CrossRef]
Figure 1. A four-dimensional framework for urban resilience.
Land 12 02131 g001
Figure 2. Location of the YREB.
Land 12 02131 g002
Figure 3. Spatial–temporal evolution of four dimensions ((ad) is the stability dimension of urban resilience in 2005,2010, 2015 and 2020, respectively; (eh) is the redundancy dimension of urban resilience in 2005, 2010, 2015 and 2020, respectively; (il) is the resourcefulness dimension of urban resilience in 2005, 2010, 2015 and 2020, respectively; (mp) is the connectivity dimension of urban resilience in 2005, 2010, 2015 and 2020, respectively).
Land 12 02131 g003
Figure 4. Frequency distribution of barriers to urban resilience of YREB in 2005 (a), 2010 (b), 2015 (c), 2020 (d).
Land 12 02131 g004
Figure 5. Statistics of urban population size distribution in the YREB.
Land 12 02131 g005
Figure 6. Dynamic changes in CCS of YREB in 2005 (a), 2010 (b), 2015 (c), 2020 (d).
Land 12 02131 g006
Figure 7. Variation in coupling degree between SUP and urban resilience in YREB.
Land 12 02131 g007
Figure 8. Variation in coupling degree between CCS and urban resilience in YREB.
Land 12 02131 g008
Figure 9. The coupling coordination degree between SUP and urban resilience of YREB in 2005 (a), 2010 (b), 2015 (c), 2020 (d).
Land 12 02131 g009
Figure 10. The coupling coordination degree between CCS and urban resilience of YREB in 2005 (a), 2010 (b), 2015 (c), 2020 (d).
Land 12 02131 g010
Figure 11. Heatmap of Pearson correlation between city size and five major obstacle factors. Note: ** Significant at a 1% level.
Land 12 02131 g011
Table 1. Index system used for evaluating urban resilience.
Dimension of Urban ResilienceIndexConnotation of IndicatorsDirectionID
StabilityGDP per capitaEconomic growth+X1
Disposable income per capitaResidents’ resilience+X2
Proportion of fiscal revenue to GDPEconomic growth+X3
Total urban water supplySubsistence resources+X4
Urban registered unemployment rateSocial employment pressureX5
Number of beds in health care facilities per 10,000
Number of doctors per 10,000 people
Medical and health care+X6
+X7
Urban road area per capitaRoad traffic+X8
Density of drainage pipes in built-up areasInfrastructure+X9
Days of good air qualitySurvival environment+X10
Assets and liabilities ratio of industrial enterprises above the scaleMarket riskX11
Energy self-sufficiency rateEnergy security+X12
RedundancyForeign trade dependenceMarket dynamicsX13
Industrialization rateIndustrial development level+X14
Urban basic pension coverageResident health and pension coverage+X15
Urban basic medical insurance coverage+X16
Total fixed asset investmentEconomic growth+X17
Green space per capitaDisaster prevention space+X18
Volume of domestic air routesAir traffic+X19
Proportion of non-fossil fuel power generationGreen energy+X20
Number of books in public libraries per 10,000Intellectual resources+X21
Number of students enrolled in general higher education institutions+X22
Number of general higher education institutions+X23
ResourcefulnessFiscal self-sufficiency rateEconomic dynamism+X24
GDP growth rate+X25
Natural population growth ratePopulation structure+X26
Energy consumption per unit of GDPEnergy use efficiencyX27
Growth rate of social electricity consumptionHigh-quality development+X28
Index of advanced industrial structureIndustry and innovation+X29
Growth rate of total factor productivity+X30
Number of invention patents per 10,000+X31
Number of granted invention patents per 10,000+X32
Proportion of expenditure on science and technology to fiscal expenditureInnovation investment+X33
Proportion of expenditure on education to fiscal expenditure+X34
ConnectivityNumber of Internet broadband subscribers per 10,000Communication connectivity +X35
Number of mobile phones per 10,000+X36
Number of Fortune 500 companies headquartered in the regionLocation connectivity+X37
Freight traffic+X38
Passenger traffic+X39
International tourism revenueSocial connectivity+X40
Proportion of mobile populationOpenness of the economy+X41
Foreign trade contribution+X42
Foreign economic contribution+X43
Amount of actual foreign investment utilized in the current year+X44
Number of contracts signed by foreign-invested enterprises+X45
Note: “+” indicates the indicator contributes positively to urban resilience, and “−” indicates the indicator contributes negatively to urban resilience.
Disclaimer/Publisher’s Note: The statements, opinions and data contained in all publications are solely those of the individual author(s) and contributor(s) and not of MDPI and/or the editor(s). MDPI and/or the editor(s) disclaim responsibility for any injury to people or property resulting from any ideas, methods, instructions or products referred to in the content.

