
Dynamic Monitoring of Winter Wheat Health in Mining Subsidence Areas by Combined Active and Passive Remote Sensing Technology


1
School of Surveying and Land Information Engineering, Henan Polytechnic University, Jiaozuo 454003, China
2
Key Laboratory of Spatio-Temporal Information and Ecological Restoration of Mines (MNR), Henan Polytechnic University, Jiaozuo 454003, China
3
Research Centre of Arable Land Protection and Urban-Rural High-Quality Development in Yellow River Basin, Henan Polytechnic University, Jiaozuo 454003, China
4
School of Energy Science and Engineering, Henan Polytechnic University, Jiaozuo 454003, China
5
Collaborative Innovative Center of Coal Safety Production in Henan Province, Henan Polytechnic University, Jiaozuo 454003, China
*
Author to whom correspondence should be addressed.
Land 2023, 12(11), 2079; https://doi.org/10.3390/land12112079
Submission received: 26 September 2023
/
Revised: 14 November 2023
/
Accepted: 14 November 2023
/
Published: 18 November 2023
Abstract
:The contradiction between efficient coal mining and arable land capacity enhancement in the coal–grain production overlapping area has constrained grain output and threatened food security. In this study, DInSAR was used to extract the mining subsidence areas (SAs). Multiple red-edged vegetation indices were introduced to explore the growth differences between winter wheat in the SAs and Check Areas (CKs). A crop health index (SACHI) was proposed to comprehensively evaluate the health of winter wheat in SAs. The results showed that: (1) Compared with the CKs, the onset of over wintering season (OWS), start of growing season (SOS), and end of growing season (EOS) of winter wheat lagged behind in the SAs. (2) The winter wheat growths were slower in the SAs and their decline rates were faster than that in the CKs. (3) The SACHI could effectively synthesize the information contained in each component and was highly correlated with them. (4) Mining subsidence had a significant impact on the winter wheat health in the length of growing season (LOS), while the impact was weakened during the OWS. Based on the multi-vegetation indices and the SACHI, the impact of mining subsidence on the winter wheat health can be effectively diagnosed and estimated.
1. Introduction
As the main body of China’s energy structure, coal mining and utilization are driving the rapid development of China’s economy [1,2,3]. However, coal mining is also a double-edged sword, which brings about problems such as groundwater level decline, surface subsidence, and farmland damage, and has a series of impacts on the surface ecology [4,5]. In the coal–grain production overlapping area, the impacts mainly manifest as farmland damage and grain reduction [6,7]. For Henan Province, one of the main grain-producing areas and one of eight major provinces in China with coal production exceeding 100 million tons, this problem is particularly prominent [8,9]. Coal–grain production overlapping areas in Henan Province had land destruction areas of 160,000 hectares due to coal mining, of which farmland accounts for more than 70%, resulting in annual reduction in grain production of about 735,000 tons, and the contradiction between food security and mineral resources supply was becoming more and more prominent [1]. Therefore, clarifying the influence regularities of mining subsidence on crop growth and health status can provide theoretical guidance for green mining of coal, sustainable use of land, and capacity enhancement of farmland in coal–grain production overlapping area.
The impact of coal mining on arable land and crops mainly comes from mining subsidence, the goaf generated by underground mining can disrupt the balance of the overlying rock mass, leading to cracks and bending subsidence of the overlying rock mass, leading to regional surface cracking and subsidence, resulting in damage to farmland in the form of soil degradation, deterioration of farming conditions, destruction of water bodies, etc. [1,10]. Therefore, it is necessary to explore the impact of mining subsidence at the working face scale on the growth and health status of winter wheat, and determine the subsidence time and impact area of the underground mining faces. The traditional methods for monitoring mining subsidence mainly include triangulation, traverse survey, precision leveling, and GNSS [11], which obtain data with high accuracy, but there are problems such as high cost, large workload, and difficulty in obtaining the outermost boundaries of the deformation [12]. The emergence of InSAR technology provides a new technical approach to solve these problems [13]. With the in-depth research of domestic and foreign experts and scholars, a series of new techniques for monitoring surface deformation have been derived, such as DInSAR [14], PS-InSAR [15], SBAS InSAR [16], and CR-InSAR [17]. Among them, DInSAR is widely used in mining subsidence monitoring and subsidence range extraction in mining areas for its low cost, high accuracy, and simple operation [18].
The extent, scope and timing of the impacts of mining subsidence on surface vegetation have always been a focus of academic discussion [19,20]. Some research studies have shown that direct damage to surface crops from mining subsidence is mainly root damage, and the main types of damage mainly include ripping, twisting, skinning, and pulling out [21], which reduce the plant’s ability to absorb water and fertilizer and affects its growth and development. Cracks caused by mining subsidence accelerate the evaporation of soil moisture and nutrient loss. Cracks caused by mining subsidence accelerate the evaporation of soil moisture and nutrient loss, lead to deterioration of the soil environment in which root-injured plants grow [22]. Soil erosion can lead to a decrease in soil fertility [23], which in turn affects crop growth and development, and ultimately affects grain yield [24]. The spectral characteristics of crop leaves affected by mining subsidence are bound to change, and optical remote sensing is one of the effective means to capture this change.
Currently, the means of monitoring crop growth and health mainly relies on optical remote sensing inversion of time-series vegetation indices. Among them, the Normalized Difference Vegetation Index (NDVI) is recognized as one of the most effective ecological indices to characterize changes in vegetation [25], and has yielded fruitful results in the study of crop growth and dynamic changes [26]. However, as the research progressed, the reflectance of the red edge band was considered to be of great advantage for vegetation monitoring [27,28]. This red-edge band is in the rapidly changing region at the junction of the near-infrared and red light bands, and can quickly respond to small changes in vegetation canopy structure and chlorophyll content, and is more sensitive to vegetation growth conditions [29]. There is a good correlation between the red-edge band and important biochemical parameters that characterize the growth status of green plants, which can be used to research plant nutrients, health status monitoring, vegetation identification, physiological and biochemical parameters, and other information [30,31]. With the launch of satellites with red-edge channel sensors, represented by the Sentinel-2 satellite, a series of innovative red-edge indices based on red-edge bands have been proposed and have yielded fruitful results in agricultural remote sensing. Studies have shown that using Sentinel-2 with red-edge bands to estimate winter wheat chlorophyll is more effective than using vegetation indices without red edge bands [32]. Sentinel-2 is suitable for inversion of crop leaf chlorophyll content (LCC) and canopy chlorophyll content (CCC) and leaf area index (LAI), which can play an important role in precision agriculture [33]. Comparing Sentinel-2 data with measured winter wheat leaf area index and chlorophyll content data, it was found that Sentinel-2 red-edge vegetation index improved the inversion accuracy of chlorophyll and leaf area index compared to traditional vegetation index [34]. At present, there are relatively few research studies on the use of the red-edge vegetation index for ecological, crop growth, and health monitoring in mining areas. Based on the advantages of the red-edge vegetation index in monitoring crop growth and health, the use of the red-edge band for monitoring crop growth, damage, and health in coal–grain production overlapping areas have great potential for application. The research studies on the growth and health status of crops in mining areas mainly started with single indicators such as chlorophyll content [35], aboveground biomass [36], leaf area index [37], NDVI and EVI [38], and the ecological characteristics of crops reflected by a single indicator tend to be more one-sided. In fact, the health status of crops is closely related to the interaction of multiple indicators, especially in coal–grain production overlapping areas, where there is a diversity of damage caused by mining disturbances on crops. Therefore, there is an urgent need for a multi-indicator comprehensive model to monitor the health status of crops in subsidence areas.
In summary, in this study, the underground mining faces of Jiaozuo coal mine was used as the study area and winter wheat (Triticum aestivum L.) was used as the study object, the effects of mining subsidence on the growth of winter wheat were quantitatively analyzed by, respectively, using the normalized difference vegetation index (NDVI), the modified red-edge normalized vegetation index (RENDVI), the normalized difference red-edge 1 (NDRE1), the normalized difference red-edge 2 (NDRE2), and the modified red-edge difference vegetation index (MREDVI). In addition, the crop health index in subsidence area (SACHI) was constructed to comprehensively evaluate the health status of winter wheat in different growth stages The study aimed to reveal the changes in the growth and health status of winter wheat under coal mining stress, enrich the crop damage monitoring index system in coal–grain production overlapping areas, and develop a comprehensive evaluation model for crop health monitoring based on remote sensing methods. It was expected to provide a certain scientific basis for solving the contradiction between efficient coal mining and increased farmland production capacity.
2. Study Area and Data
2.1. Study Area
The study area is located in Xiuwu County, Jiaozuo City and Huixian City, Xinxiang City, Henan Province, China (Figure 1a–c), with longitude of 113.415° E~113.496° E and latitude of 35.313° N~35.374° N, and has a temperate continental monsoon climate with four distinct seasons. The main food crops in the study area are wheat, maize, rice, and cereals. This area is rich in mineral resources, including: coal, limestone, and iron ore. The topsoil of the study area is the alluvial proluvial loose layer in front of the Taihang Mountains, which belongs to the plain area with high phreatic water level, and the soil is highly susceptible to salinization.
According to the “Guidelines for Retaining and Mining Coal Pillars in Buildings, Water Bodies, Railways, and Main Well Tunnels” [39], −10 mm was the outermost boundary of the subsidence area. Therefore, the outermost boundary of the deformation area was set to −10 mm. DInSAR technology was utilized to track the deformation zones in the study area from 2019–2021, and the extent of mining subsidence impacts was extracted using the contour tool of ArcGIS® (Esri, California, USA; v10.0). Due to the complex changes in the subsidence area caused by underground mining over time, two stable subsidence areas were ultimately obtained: subsidence area 1 and subsidence area 2: the deformation of subsidence area 1 occurred from 17 October 2020 to 6 September 2021, with an impact area of approximately 4.88 × 10⁵ m2 (Figure 1d); and the deformation of subsidence area 2 occurred from 4 December 2020 to 8 July 2021, with an impact area of approximately 3.71 × 10⁵ m2 (Figure 1e). Because the purpose of the study was to investigate the effect of mining subsidence on the growth and health status of winter wheat, large-scale artificial surfaces such as residential areas and main roads within the subsidence area were excluded, respectively, and finally, Subsidence Area 1 (SA1) and Subsidence Area 2 (SA2) were determined, with SA1 covering approximately 3.95 × 10⁵ m2 (Figure 1f) and SA2 covering approximately 1.47 × 10⁵ m2 (Figure 1g). Profile lines were set up along the direction of workface advancement in the area of SA1 and SA2 subsidence centers, respectively, which were used to study the effect of the workface advancement process on the vegetation index of winter wheat, with 34 image elements in the SA1 profile and eight image elements in the SA2 profile.
Quantitative analysis of the impact of mining subsidence on winter wheat was carried out by setting up a comparison area, and the rules for determining the comparison area were as follows: (1) The comparison area needed to be close to the subsidence area to eliminate interference caused by differences in phenological conditions. (2) There should be no subsidence in the comparison area to avoid interference caused by subsidence disturbance. (3) The comparison area should have no large artificial surfaces such as residential areas or main roads to avoid differences in experimental results due to different land features. (4) The comparison area needs to be of the same shape and size as the subsidence area to facilitate comparative analysis. According to the above rules, the final check area 1 (CK1) and check area 2 (CK2) were determined (Figure 1f,g), with CK1 and CK2 occupying the same area as SA1 and SA2, respectively.
2.2. Data Source and Pre-Processing
(1) Radar remote sensing data: Sentinel-1A SAR SLC data. These data were obtained from the NASA’s Alaska Satellite Facility Distributed Active Archive Center (ASF DAAC) (https://search.asf.alaska.edu/, accessed on 22 May 2023). The data have a spatial resolution of 5 m × 20 m and a revisit period of 12 days. The Sentinel-1A satellite has the capability to acquire radar images continuously on a 24/7 basis. In this study, a total of 84 SAR SLC images (see Appendix A) were obtained from 2019, 2020, and 2021 to determine the impact area of the underground mining faces. By preprocessing the SAR data, such as importing and cropping, the DInSAR technology was finally utilized to obtain the range of mining subsidence area in the study area (Figure 2).
(2) Red-edged multispectral data: Sentinel-2A/B data. These data were obtained from Copernicus Open Access Hub of European Space Agency (https://scihub.copernicus.eu/, accessed on 6 June 2023). These two satellites in the same orbit, with a difference of 180°, in the same orbit, with a difference of 180°, and the revisit cycle of a single satellite is 10 days, while the synchronized work of the two satellites under clear and cloudless conditions can shorten the revisit cycle of the satellites to 5 days. The satellite payload is a Multi-Spectral Imager (MSI) which has 13 bands covering the visible to shortwave infrared bands with narrow channel widths. According to spatial resolution, those bands can be divided into 10 m, 20 m, and 60 m. The characteristics of the satellite data can be summarized as follows: high spatial resolution, short revisit period, multiple spectral band channels and narrow band width [40]. In addition, the unique red edge bands (B5, B6, B7) of Sentinel-2A/B also have the characteristic of high spectral resolution, which can provide stronger data support for monitoring the growth status of surface vegetation [41]. The DInSAR results indicated that workface mining in the study area occurred between 2020 and 2021. Therefore, in this study, Sentinel-2A/B study area data were collected for a total of 71 periods between 1 January 2020, and 31 December 2021, with good quality and low cloudiness. The complete life cycle of winter wheat during 2020–2021 was determined based on the trend of vegetation index (Figure 3), and 26 period images were obtained (Table 1).
The Sentinel-2A/B data obtained were Level-1C products, which are radiometrically and geometrically corrected apparent reflectance products that are not atmospherically corrected [42]. Therefore, high-precision atmospheric correction was performed on Level-1C products using Sentinel-2 Level-2A Atmospheric Correction Processor provided by the European Space Agency to obtain Level-2A surface reflectance products. The 13 bands of Level-2A data with different spatial resolutions in each period were first resampled to make the 13 bands of Level-2A data consistent with the spatial resolution of the DInSAR deformation results. Band fusion was then performed to obtain a multiband image with 20 m spatial resolution. The reflectance products Level-1C and Level-2A of Sentinel-2 were the product of a fixed coefficient value of 10,000 (which was found in the QUANTIFICATION Value statement in the header file) [31], and therefore it was necessary to divide the pixel values of the fused multiband by 10,000 to restore the surface reflectance. The calculation formula is:
where ρλ is the surface reflectance of λ-band, with pixels digital number (DN) ranging from 0~1; Q is the original DN of each band. Finally, it was necessary to convert the Sentinel-2 image after restoring the surface reflectance into a coordinate system consistent with the DInSAR deformation map coordinate system.
(3) DEM data: The DEM data were obtained from the SRTM DEM provided by NASA with a spatial resolution of 30 m. The DEM data were utilized during the DInSAR two-pass method processing for the removal of flat earth effects and terrain phase.
3. Methods
The study methods mainly included three modules: (1) Data preprocessing. This module included DInSAR processing of Sentinel-1A SAR data to obtain the impact area of the underground mining faces; atmospheric correction, resampling, and band fusion of Sentinel-2A/B data to lay the foundation for vegetation index calculation; and determination of the CKs. (2) Winter wheat growth monitoring. The purpose of this module was to obtain the length of growing season, overwintering season, and end of growing seasons of winter wheat in the SAs and CKs under different vegetation indices, as well as the growth rates of winter wheat in different seasons, and to quantify the difference in growth rates between the SAs and CKs; determine the most sensitive vegetation index for monitoring growth rate differences, and apply this vegetation index to the construction of crop health index models. (3) Winter wheat health monitoring. This module constructed crop health index in subsidence area (SACHI), aiming at carrying out dynamic monitoring of winter wheat’s health status in the SAs and CKs of each season through comprehensive modeling, and quantitatively analyzing the impact of mining subsidence on winter wheat’s health status. The technology roadmap was shown in Figure 4.
3.1. Calculation Methods of Vegetation Index
The vegetation index can effectively measure the state of surface vegetation and is widely used globally and regionally for land cover, vegetation classification, and environmental change [43]. The time-series vegetation index can also quantitatively reflect the growth and health of vegetation, and has wide applications in vegetation phenology research studies [44], biomass estimation [45], and crop yield estimation [46]. With reference to the above research studies, five vegetation indices were screened out of the numerous vegetation indices, namely: (1) Normalized Differential Vegetation Index (NDVI) [47]: NDVI can reflect the growth and coverage of vegetation, and is most widely used among numerous vegetation indices. (2) Red Edge Vegetation Index: Red Edge Normalized Difference Vegetation Index (RENDVI) [48], Normalized Difference Red Edge1 (NDRE1) [49], Normalized Difference Red Edge2 (NDRE2) [50], Modified Red Edge Difference Vegetation Index (MREDVI) [51]. The calculation formulas for each vegetation index are shown in Table 2.
It should be noted that the center wavelengths of the individual bands of Sentinel-2 and the center wavelengths of the selected vegetation index calculation formula do not exactly coincide, so the index calculation was performed using the bands of Sentinel-2 that are close to the selected vegetation index. In Table 2, ρ670, ρ630-690 corresponds to the band B4; ρ705, ρ720 corresponds to the band B5; ρ730, ρ740 corresponds to the band B6; ρ790, ρ750-780 corresponds to the band B7; ρ800 corresponds to the band B8.
In order to compare the growth and health status of winter wheat reflected by each index, each index was normalized to avoid the interference caused by inconsistent index dimensions on the experimental results. The normalization formula is:
where NI is the normalized index; I is the value of the index; Imin is the minimum value of the index; Imax is the maximum value of the index.
3.2. Crop Growth Trend Analysis
3.2.1. Gaussian Multi-Peak Fitting
The current methods for calculating the length of growing season (LOS) of vegetation are divided into two main categories: filtering and fitting [44]. Filtering is the use of filters or window smoothing methods for denoising, and the commonly used filtering methods in vegetation phenology extraction are S-G filter, Fourier transform and wavelet transform. Fitting is achieved by selecting the objective function and using the least squares method to approximate the time series to achieve smooth data. Common fitting methods include Gaussian fitting, local spline function fitting, and polynomial fitting [44]. Due to cloud cover, resulting in differences of the time-series vegetation index part in the time interval, using filtering to denoise could easily lose valuable information, and so Gaussian fitting method was used to determine the LOS of winter wheat [52].
Gaussian function is a probability density function that represents continuous random variables, usually used to express the periodic evolution of vegetation phenology [53]. According to the trend of temporal vegetation index changes, it was found that there are several peaks in winter wheat throughout its entire lifecycle. Therefore, this study used Gaussian multi-peak fitting. The expression is as follows:
where y0 is the baseline offset; Ai is the integral area under the bell curve; xci is the position of the peak point; wi is approximately 0.849 times the width at half the peak height, represents the LOS. According to the actual trend of vegetation index changes in the study area, the n-value was determined to be five, which meant performing a 5-peak Gaussian fitting on the complete life cycle of winter wheat.
To prevent the fitting accuracy from being affected by irregular intervals between vegetation indices in different periods, it was necessary to interpolate the temporal vacancy values before fitting. The modified Akima interpolation method was used to process temporal vegetation data [54,55], which produced less fluctuations compared to spline interpolation, and interpolated results do not flatten out drastically compared to piecewise cubic Hermite interpolated polynomials. Due to the minimum interval of 5 days for the temporal vegetation index, the mAkima interpolation method was used to interpolate the vegetation index into a time series with a 5-day interval.
3.2.2. Definition of Different Growing Seasons
The main purpose of the study was to explore the relative differences in the growth and duration of winter wheat in different growing seasons between the SAs and the CKs, rather than determining the specific time of the 12 developmental seasons (i.e., sowing season, seedling emergence stage, tillering stage, over-wintering stage, regreening stage, jointing stage, booting stage, heading season, flowering season, grouting season, and ripening season) of winter wheat [56]. Therefore, based on the Gaussian multi-peak fitting results, the growing seasons of winter wheat was defined as follows: (1) Length of growing season 1 (LOS1): The period from sowing winter wheat to the beginning of the overwintering season. During this period, the vegetation index showed a gradual upward trend. As the aboveground biomass of winter wheat partially withered after entering the over wintering season, and the vegetation index decreased [57]. Therefore, the extreme values could be used to determine the start time of the over wintering season. (2) Over wintering season (OWS): the period from the start of overwintering season to the start of greening season (SOS). As the temperature rises, winter wheat begins to regreening, and the vegetation index tends to increase [56]. Therefore, the inflection point method could be used to determine the start time of regreening season. (3) Length of growing season 2 (LOS2): the period from the beginning of greening to the beginning of the heading season. At this season, winter wheat growth enters a peak period, and the vegetation index reaches its peak at the early stage of heading [56,58]. Therefore, the extreme value could be used to determine the start time of the heading season. (4) End of growing season (EOS): the period from heading to harvesting of winter wheat. At this period, the vegetation index shows a gradual downward trend [59]. It was important to note that the four growing seasons of winter wheat defined in this study were not absolute phenological seasons, but rather four relative growing seasons.
3.2.3. Determination of Growth Rate and Change Amplitude for Each Growing Season
On the basis of dividing the growing seasons, the vegetation index means of the four growing seasons in the SAs and the CKs were, respectively, fitted by using univariate linear fitting method, and the impacts of mining subsidence on the growth rate of winter wheat at different growing seasons were quantitatively analyzed. The univariate linear fitting formula is as follows:
where k is the slope of the fitted equation, which can reflect the growth rate of each growing seasons; xi is the vegetation index; and b is the intercept of the fitted equation.
The change amplitude was defined in this study as the ratio of increase or decrease in the growth rate of the SAs compared to the growth rate of the CKs. The change amplitude formula is as follows:
where V is the change amplitude, with V > 0 indicating the amplitude of growth and V < 0 indicating the amplitude of decline; k1 is the growth rate for each growing season in the SAs; and k2 is the growth rate for each growing season in the CKs.
3.3. Construction of Crop Health Assessment Model
To quantitatively analyze the impacts of mining subsidence on the health status of winter wheat, this study screened four indicators (vegetation index (VI), chlorophyll (CHL), canopy water content (CWC), and soil salinity index (SSI)) that can reflect the health status of winter wheat and the characteristics of mining subsidence to construct a comprehensive evaluation model (Crop health index in subsidence area, SACHI), which comprehensively evaluates the health status of winter wheat, and the functional expression is:
(1) Vegetation index (VI). The stress caused by mining subsidence on surface winter wheat is mainly manifested as root cutting stress, which hinders the development of wheat roots and affects their absorption of water and nutrients, and further affects the growth status of vegetation. The most intuitive response to this effect is the decrease and fluctuation of vegetation index, as well as the decrease in growth rate at different growing seasons. In this study, based on the results of Gaussian multi-peak fitting and the results obtained in Section 3.2.3 on growth rates and its change amplitude in each growing season, it was determined that the most sensitive indicator for monitoring the differences in growth of winter wheat was the normalized difference red-edge 2 (NDRE2) [50]. The calculation formula was shown in Table 2. Therefore, NDRE2 was used to participate in the construction of the SACHI model.
(2) Chlorophyll (CHL). The changes physical and chemical properties of soil caused by mining subsidence affect the growth and development of winter wheat in which the lack of nitrogen elements can affect the synthesis of chlorophyll in leaves, affect wheat photosynthesis, and ultimately lead to reduced yield. It was shown that chlorophyll index-red edge (CIre) responded significantly to the chlorophyll content in leaves nourished by nitrogen and could display the photosynthetic activity of the vegetation canopy [60], so CIre was used to participate in the construction of SACHI model. The calculation formula is:
where ρ783 corresponds to the 7th band surface reflectance of Sentinel-2; ρ705 corresponds to the 5th band surface reflectance of Sentinel-2.
(3) Canopy water content (CWC). Mining subsidence is very likely to lead to a decline in the water table, and changes in the slope and direction of the surface will also lead to changes in runoff, which will lead to greater differences in soil moisture of cropland. In addition, root cutting stress can also hinder wheat’s water absorption, which can be manifested as a decrease in canopy moisture content, and in turn affects wheat’s health status. Therefore, the normalized difference moisture index (NDMI) [61] was used in this study to characterize the canopy water content information of winter wheat. NDMI is sensitive to the moisture content of vegetation and can effectively monitor the changes in wheat canopy water content. The calculation formula is:
where ρ835 and ρ1613 correspond to the Sentinel-2 8th (i.e., near-infrared band) and 11th (i.e., short-wave infrared band) bands of surface reflectance, respectively.
(4) Soil salinity index (SSI). Mining subsidence leads to changes in topography and landscape. The study area belongs to a high groundwater level area, and changes in groundwater level can lead to soil salinization in the subsidence area, which is most serious in the core area of mining subsidence. It has been shown that the most sensitive soil salinity index at depths of 0~10 cm and 10~20 cm was the soil salinity index (SI-T) [62]. Therefore, SI-T was used to participate in the construction of the SACHI model. The calculation formula is [63]:
where ρ620 and ρ680 correspond to the surface reflectance of Sentinel-2’s 4th band (i.e., visible red band); ρ770-860 corresponds to the surface reflectance of Sentinel-2’s 8th band (i.e., near-infrared band).
Due to the different units of the four indicators mentioned above (VI, CHL, CWC, and SSI), it was necessary to use equation (2) to normalize each indicator in order to avoid imbalanced weights due to dimensional differences in principal component analysis. Then, the indicators were subjected to band synthesis and principal component analysis. Principal component analysis (PCA) is a commonly used data dimensional compression technique, which reduces the number of data dimensions in a multidimensional dataset by rotating the axes and compressing the information of the dataset into the first few principal components that are perpendicular to each other [64,65].
Similar to the remote sensing ecological index RSEI [64], according to the results of principal component analysis, if the payload of the indicator positively correlated with the health status of winter wheat in the first principal component feature vector is negative, or the payload of the indicator negatively correlated with the health status of winter wheat is positive, it indicated that PC1 was opposite to the actual health status of winter wheat, and 1-PC1 was required to obtain SACHI0. Conversely, PC1 was SACHI0. Then, SACHI0 was normalized to a value between [0, 1], the closer the SACHI is to one, the better the health of winter wheat, and vice versa.
3.4. Binary Logistic Regression
Binary logistic regression is a generalized linear regression model where the dependent variable is dichotomous. The binary response variable takes the value of zero or one, where zero means that the event did not occur, and one means that the event occurred. Binary logistic regression was used in this study to test whether winter wheat health was affected by mining subsidence disturbance.
In this study, the pixel values affected by mining within the SA1 and SA2 were set to one, and the pixel values not affected by mining were set to zero. The Binary logistic regression formula is [41]:
where Y denotes the binary response variable; P is the probability when the binary variable takes a specific value; α0 is a constant term; Xi (i = 1, 2, ···, m) is the SACHI value of the i-th pixel within the range of the SA1, SA2; and ßi is the regression coefficient of the independent variable Xi.
4. Results and Analysis
4.1. Time-Series NDVI Profile Lines
NDVI, as one of the best indicators for monitoring vegetation conditions, is widely used among numerous vegetation indices. Therefore, the NDVI profiles of each season were extracted according to the determined the SA1 and SA2 profiles, respectively, and combined with the scope of influence during the advancement of the corresponding mining face, the influence of mining subsidence on the growth of winter wheat was explored from the scale of the working face profiles (Figure 5). The black line segments in Figure 5 are the pixel intervals corresponding to the impact area of mining subsidence, while the remaining parts represent the parts that did not experience subsidence during that season. The results shown that:
- (1)
- There were a total of 26 time-series NDVI profile lines in the SA1, of which part of the 16 profile lines were located in the impact area during the advancement of the mining workings. It could be seen that there was a fluctuating phenomenon in the NDVI of the area affected by mining subsidence, and the remaining 14 phases were dominated by fluctuating decreases, except for the fluctuating upward trends in the two phases of 3 November 2020 and 8 November 2020.
- (2)
- The SA2 area was first impacted by mining subsidence on 18 December 2020, and a total of 26 time-series NDVI profile lines were obtained, with part of the 10 profile lines located within the impact area during the advancement of the mining workings. It could also be seen that there was a fluctuation phenomenon in the NDVI of the area affected by mining subsidence, but the change characteristics were not clear because the fewer pixels on the profile lines.
In summary, mining subsidence could lead to fluctuations in vegetation index, with a predominantly negative impact, but the profile lines covered a small number of pixels (sample points), which could lead to unclear results. To solve this problem, the subsequent studies were conducted from the overall scope of the study area.
4.2. Areal Differences in Length of Growing Season between SAs and CKs
Gaussian multi-peak fitting and length of growing season division were performed on five vegetation indices of the SAs and CKs, respectively, as shown in Figure 6. The goodness of fit R2 of each vegetation index for the SA1 and CK1 was between 0.870~0.968 and 0.884~0.962, respectively; and the goodness of fit R2 of each vegetation index for the SA2 and CK2 was between 0.818~0.953 and 0.806~0.955, respectively, indicating an overall good fit. In order to quantify the differences in the duration of each growth phase between SAs and CKs, the analysis was carried out for the SA1 and CK1, and the SA2 and CK2, respectively. In order to quantify the differences in the duration of each growth phase between the SAs and CKs, the analysis was carried out for the SA1 and CK1, and the SA2 and CK2, respectively.
By comparing five vegetation indices of the SAs and the CKs, it could be seen that mining subsidence had an impact on each growth stage of winter wheat. However, different vegetation indices had different sensitivity to the spectral characteristics of winter wheat at each growth stage, resulting in a weak regularity of differences in growth stages of each vegetation index between the SAs and the CKs. Due to NDVI being the most widely used and commonly used for phenological information extraction, based on the different growth stages divided by NDVI, the following regularities were obtained: Compared with the CK1, the onset of OWS, SOS, and EOS of winter wheat in the SA1, respectively, lagged behind by 1 d, 3 d, and 1 d. Compared with the CK2, the onset of the OWS, SOS and EOS of winter wheat in the SA1 also lagged behind by 1 d, 3 d, and 1 d, respectively.
4.3. Growth Differences in Length of Growing Season
4.3.1. Difference in Growth Rates during Different Growth Stages
Although the regularities of the growth period differences between the SAs and CKs obtained from the four red-edge indices were not strong, the trend of each vegetation index could also reflect the growth differences of winter wheat over its complete life cycle. Based on the four growth stages between the SAs and CKs of the winter wheat life cycle classified using each vegetation index in Section 4.1, linear fits were made to these four stages separately to obtain the differences in growth rates of winter wheat between the SAs and CKs at different growth stages.
As could be seen from Figure 7: In the LOS1, the growth rates corresponding to the five vegetation indices of the CK1 were greater than those of the SA1, which indicated that growth of winter wheat in the CK1 was better than that in the SA1 at that stage. In the OWS, except for MREDVI corresponding to the absolute value of growth rate showed SA1 > CK1, the other four vegetation indices corresponding to the absolute value of growth rate showed SA1 < CK1, which indicated that the winter wheat vegetation index of CK1 dropped back significantly, and the decline rate was greater than that of the SA1 in this phase. In the LOS2, all five vegetation indices of the CK1 corresponded to growth rates that were similarly greater than those of SA1, and at this stage the growth of winter wheat in the CK1 was better than that in the SA1. In the EOS, all five vegetation indices of SA1 corresponded to growth rates that were all greater than those of the CK1, and at this stage the aging rate of winter wheat in the SA1 was faster than that of winter wheat in the CK1.
The absolute values of growth rates corresponding to the five vegetation indices were greater in the SA1 than in the CK1, and in this stage the SA1 winter wheat senesced faster compared to CK1 winter wheat.
Figure 8 showed the growth rates for each growth stage corresponding to different vegetation indices in the SA2 and CK2. As shown in Figure 8: In the LOS1, the growth rates corresponding to the five vegetation indices of the SA2 were greater than those of the CK2, indicating that growth of winter wheat in SA2 was better than that in CK2 at that stage, which was due to the fact that mining subsidence had not yet occurred at the LOS1. In OWS, except for NDRE1 corresponding to the absolute value of growth rate showed SA2 < CK2, the other four vegetation indices corresponding to the absolute value of growth rate showed SA2 > CK2. In LOS2, all five vegetation indices of CK2 corresponded to growth rates that were greater than those of SA2, and at this stage the growth of winter wheat in CK2 was better than that in SA2. In EOS, the absolute values of winter wheat growth rates corresponding to MREDVI and NDRE2 clearly showed that SA2 > CK2, while the absolute values of winter wheat growth rates corresponding to NDVI, RENDVI, and NDRE1 showed that the SA2 was approximately equal to the CK2. This phenomenon indicated that mining subsidence accelerated the aging of winter wheat in the SA2, but the degree of impact was relatively small compared to SA1.
4.3.2. Change Amplitude in Growth Rates
In order to quantify the influence of mining subsidence on the growth of winter wheat, this study introduced the concept of “change amplitude in growth rates (V)” and calculated the growth rate change amplitude of SA1 relative to the CK1 and SA2 relative to CK2 according to Equation (5) (Table 3). As shown in Table 3:
- (1)
- Compared with the CK1, the change amplitude of each vegetation index corresponding to the growth rate in SA1 was mainly negative in the LOS1, OWS, and LOS2, except for the positive value in the EOS. Mining subsidence resulted in the delayed growth and development of winter wheat in the SA1 compared with the CK1, and the accelerated rate of decline and maturity compared with the CK1.
- (2)
- Compared with CK2, the change magnitude of each vegetation index corresponding to the growth rate in the SA2 was mainly positive in the LOS1 and OWS, and negative in the LOS2, and although it was also negative in the EOS, the decrease in this stage was much smaller than the increase. Combined with the time of SA2 subsidence (from 4 December 2020 to 8 July 2021), the effects of mining subsidence on the growth of winter wheat in the SA2 could be summarized as follows: the OWS was not obvious, the development was delayed after SOS, and the rate of maturation and senescence had been accelerated to some extent.
- (3)
- There were some differences in the change magnitude of winter wheat growth monitored using different vegetation indices, among which the vegetation indices with the larger differences were NDRE2 and MREDVI. From the calculation results in Section 4.2, it could be found that the Gaussian multi-peak R2 (goodness of fit) of MREDVI was poor compared to NDRE2, which indicated that NDRE2 could be used as an optimal indicator to monitor the differences in winter wheat growth.
4.4. Health Evaluation of Winter Wheat
Based on the Gaussian multimodal goodness-of-fit and the changes in the amplitude of growth rate in each vegetation index, the SACHI model was constructed using NDRE2 coupled CIre, NDMI, and SI-T to achieve a comprehensive health evaluation of winter wheat in the subsidence area.
4.4.1. Rationalization of the SACHI Model
Similar to the RSEI model, the SACHI model selected a number of single indicators that were highly correlated with the evaluation objectives, and utilized principal component analysis (PCA) for coupling, thus obtained a comprehensive evaluation indicator that collected a larger amount of information.
The SACHI model should fulfill the following requirements: (1) Is the first principal component (PC1) payload regular? That is, were the indicators that had a positive impact on the health status of winter wheat the same sign? Were the indicators that had a negative impact on the health status of winter wheat the same sign and opposite to the positive indicator sign? (2) Was PC1 able to gather the effective information of each component? The principal component analysis results of the SA1 and SA2 were shown in Table 4.
As shown in Table 4:
- (1)
- In the SA1, PC1 contribution rate of the SACHI model ranged from 77.85% to 97.36%; In the SA2, PC1 contribution rate of the SACHI model ranged from 57.41% to 97.20%, which indicated that the constructed SACHI model gathered the vast majority of information from the four components in both areas. In addition, PC1 contribution rate of the SACHI model constructed in the CK1 and CK2 ranged from 68.91%~96.70% and 67.67%~97.66%, respectively, which also indicated that the SACHI model was able to synthesize most of the information from the four components in the CKs.
- (2)
- The PC1 payload exhibited the same symbols as NDRE2, CIre, and NDMI, and was opposite to the SI-T, which indicated that NDRE2, CIre, and NDMI were all indicators that had a positive impact on the health status of winter wheat, while SI-T had a negative impact on the health status of winter wheat. Similar to the RSEI model, the payload symbols of PC2, PC3, and PC4 did not have clear regularities [64] and did not have clear ecological implications.
- (3)
- PC1 payload of the SACHI model for some periods showed that negative values for payloads that acted positively with the health status of winter wheat and positive values for payloads that acted negatively with the health status, which could be used to obtain SACHI0 by 1–PC1 [64].
4.4.2. Correlation Analysis of Indicators with SACHI
By analyzing the correlation between the SACHI and each indicator, the intrinsic connection between SACHI and each indicator could be revealed (Figure 9). It could be obtained from Figure 9:
- (1)
- NDRE2, CIre and NDMI were all positively correlated with SACHI, with mean correlation coefficients ranging from 0.979~0.981 (p < 0.01), 0.974~0.980 (p < 0.01), and 0.884~0.912 (p < 0.01), respectively. It indicated that the above three indicators were highly correlated with and positively affected the health status of winter wheat.
- (2)
- SI-T was negatively correlated with the SACHI, with mean correlation coefficients ranging from −0.925 to −0.894 (p < 0.01). It indicated that SI-T played a negative role in health status of winter wheat.
- (3)
- The correlation between NDMI and SACHI in both the SAs and CKs decreased significantly on 1 June 2021, when winter wheat was matured or harvested during that period and canopy moisture content was significantly reduced. This phenomenon also reflected the high sensitivity of NDMI to invert vegetation canopy moisture.
4.4.3. Profile Lines Analysis of SACHI
The DN of the SACHI profile lines were, respectively, extracted for each stage in the SA1 and SA2, and the impact of mining subsidence on the health status of winter wheat was explored from the perspective of the working face profile line, combined with the impact range of mining face advancement (Figure 10). The black line segment in Figure 10 represents the pixel interval corresponding to the impact area of mining subsidence, while the remaining parts represent the pixel intervals without subsidence. The results showed that:
- (1)
- In the SA1, there were 16 periods of profile lines with some pixels in the impact area of mining subsidence. Except for four periods of 19 October 12020, 29 October 2020, 3 November 2020, and 8 November 2020 where the DN in the subsidence area were mainly greater than the SACHI mean, the remaining 12 periods were predominantly lower than the SACHI mean and showed a fluctuating downward trend.
- (2)
- There are 10 periods in the SA2 where some pixels were within the impact area of mining subsidence. It could be seen that there were fluctuations in the SACHI DN located in the subsidence area, but the change regularities were not significant due to the small number of sample points.
4.4.4. SACHI Spatial Distribution and Logistic Regression Analysis
The spatial distribution of the SACHI in each period of the SA1 and SA2 was shown in Figure 11. The SACHI values were between [0, 1], and the closer the values were to 1, the better the health condition of winter wheat. There were, respectively, 16 and 10 periods of the SACHI for the SA1 and SA2 in the process of advancing the mining face (Figure 11). As could be seen from Figure 11, The SACHI had obvious seasonal characteristics during the LOS of winter wheat, i.e., with the growth and development of winter wheat, the SACHI tends to increase, and gradually decreases during the EOS.
In order to quantify the impacts of mining face advancement on the health status of winter wheat, the SACHI DN located in the SAs and CKs were extracted and analyzed by binary logistic regression analysis based on the SA1 and SA2 time-series SACHI, respectively (Table 5). The results showed that:
- (1)
- The impacts of the mining process on the health status of winter wheat in the SA1 were relatively significant, which were mainly manifested in the following: At the LOS1, entering the OWS, the impact caused by mining subsidence changes from “highly significant” to “significant” and “insignificant”, and the influence gradually diminishes. At the LOS2, the impact of mining subsidence was again “highly significant” with the onset of the SOS, but progressively “insignificant” as the winter wheat grew and developed.
- (2)
- The impacts of the mining process on the health status of winter wheat in the SA2 were mainly at the LOS2 and were “significant”. As winter wheat grew and developed, this impacts gradually decreases. However, the impacts during the LOS1 and OWS were “not significant”.
4.4.5. Differences in the Health Status of Winter Wheat between SAs and CKs
- (1)
- Mean difference of SACHI
The mean values of SACHI for each period were obtained for SA1, SA2, CK1 and CK2, respectively (Figure 12). According to the trends of the means, it could be seen:
① The mean SACHI of SA1 was smaller than the mean SACHI of CK1 in 22 periods, except for four periods, 19 October 2020, 29 October 2020, 3 November 2020, and 27 January 2021, which were larger than the mean SACHI of CK1. It indicated that the health status of SA1 winter wheat throughout its entire life cycle was relatively poor to winter wheat of CK1.
② Change trends in winter wheat health status in SA2 were more complex compared to SA1. The mean SACHI in SA2 were predominantly greater than the mean SACHI in CK2 until March 2021, the change trend of the mean SACHI in the SA2 from 13 December 2020 to 3 March 2021 was relatively flat compared to that of CK2, and the mean SACHI from 23 March 2021 onwards were all smaller than those in the CK2. Due to the start of SA2 subsidence on 18 December 2020, the mining subsidence had a negative impact on the health status of winter wheat in the SA2, and this impact gradually became apparent after the subsidence occurred.
- (2)
- Difference analysis of SACHI between SAs and CKs
There were differences in the geographical locations between the SAs and the CKs, and the difference analysis could not be directly conducted. This study converted the SACHI of SAs and CKs from matrix form to column vectors to ensuring that each DN corresponds one-to-one. Then, the SACHI of SAs and CKs in each period were compared, and the results could be divided into two types: the SACHI in the SAs were smaller than those in the CKs; The SACHI were greater in the SAs than in the CKs. The difference analysis results are showen in Figure 13.
The difference analysis of SACHI between SA1 and CK1 showed that: The overall health of winter wheat in the SA1 was better than that of CK1 in the four periods of 19 October 2020, 29 October 2020, 3 November 2020, and 27 January 2021, while the health of winter wheat in the remaining 22 periods was poorer compared to CK1. The subsidence of SA1 occurred between 17 October 2020 and 6 September 2021, covering the entire life cycle of winter wheat, resulting in poorer health condition of SA1 winter wheat compared to CK1.
Difference analysis of SACHI between the SAs and CKs indicated that after subsidence occurred in the SA2 on 18 December 2020, mining subsidence had no significant impact on the health status of winter wheat in this area during the OWS. The proportion of SACHI less than zero gradually increased from 21 February 2021, surpassing 50% for the first time on 23 March 2021, and the gradual increase continued until the end of the winter wheat life cycle. Based on the subsidence time of the SA2, it was found that the impact of mining subsidence on the health status of winter wheat in this area was mainly in the LOS2 and EOS.
5. Discussion and Conclusions
5.1. Discussion
This study explored the influence regularities of mining subsidence on the growth and health status of winter wheat, and realized two main steps of exploration: (1) We used multiple vegetation indices to compare and clarify the trend changes in growth. (2) We constructed a comprehensive index SACHI to evaluate the health status. Compared with the peer studies, the following understandings were mainly achieved:
- (1)
- Four growth stages of winter wheat under different vegetation indices were determination by using Gaussian multi-peak fitting. The filtering method [44] was not used mainly because the Sentinel-2 data were affected by cloud cover, resulting in differences in the temporal interval of the vegetation indexes obtained, especially in the peak season of winter wheat growth, where was a large increase in the vegetation indexes within a short period of time [58]. In addition, the filtering method recognized the differences in this time interval as noise [44], which affected the accuracy of the division in the growth stage of the vegetation, and Gaussian multi-peak fitting could effectively avoid this problem.
- (2)
- In contrast to agronomic studies, the growth stages divided in this study were not absolute phenological periods, but relative phenological periods between the SAs and the CKs based on trends in the time-series vegetation index, with the aim of discussing the impact of mining subsidence on the growth stages of winter wheat. Based on the results of growth stages divided by different vegetation indices, it can be seen that the starting and ending times of each LOS varied due to the different sensitivities of different vegetation indices to the spectral characteristics of winter wheat at different the LOS [66]. Despite the poor regularity of the LOS differences exhibited by multiple vegetation indices, the differences in growth rate and its change magnitude of winter wheat at different the LOS based on different vegetation indices separately showed strong regularity. Five vegetation indices were introduced to explore the growth differences, and the impacts of mining subsidence on the growth of winter wheat were comprehensively evaluated through comparative analysis, which avoided the chance errors that may arise from a single vegetation index and make the evaluation results more credible.
- (3)
- A subsidence area crop health index (SACHI) was constructed to comprehensively reflect the health status of winter wheat in each LOS. This index was coupled with the vegetation index NDRE2 [50], which was the most sensitive for monitoring the growth differences of winter wheat, the chlorophyll index CIre [60], which was significantly responsive to chlorophyll content in nitrogen-nourished leaves, the water content index NDMI [61], which was sensitive to the water content of vegetation canopies, and the salinity index SI-T [63], which was able to characterize the phenomenon of soil salinization.
- (4)
- The SACHI construction method was consistent with the RSEI (Remote sensing ecological index), and both used principal component analysis [65], so it had the advantage of objectively determining the weights [64], and could effectively avoid the interference from subjective factors. This was superior to the GI (Growth index) [67] for crop growth, which was constructed using NDVI and EVI weighting by previous researchers. In addition, the four indices used to construct the SACHI were all obtained through remote sensing, which had the characteristics of easy data acquisition, low cost, and high efficiency [68].
- (5)
- When we chose to construct the SACHI index, it was necessary to consider whether the information reflected in the SACHI index could reflect the health status of winter wheat and whether it was consistent with the characteristics of the damage to vegetation caused by mining subsidence. The SACHI composite index was an attempt in the application of remote sensing in agriculture, and in the subsequent research, we will try to combine the soil survey in the field and change the index according to the needs, in order to provide new ideas for crop growth monitoring, weather information extraction, and yield estimation. It should be noted that the selection of remote sensing data needs to ensure that the amount of clouds is low and the data quality is intact, otherwise it will lead to low inversion accuracy of a certain index for constructing SACHI, which in turn affects the accuracy of the SACHI results. At the same time, it is necessary to ensure the continuity of the time series as much as possible. The irregular interval of time series will, to a certain extent, affect the accuracy of the crop health status and phenology division. The discontinuity of the time series is not conducive to the obtaining the changes in the SACHI throughout the entire life cycle of the crops.
- (6)
- It should be noted that although the Sentinel-2 data selected in this study were characterized by short revisit cycles, and the effect of cloud shading resulted in irregular time series intervals, which is not conducive to understanding the hidden patterns in the time dimension of remote sensing data and to some extent affects the accuracy of the crop health status and phenology division. In the subsequent research, attempts can be made to introduce deep learning algorithms to predict the missing data in the time series by utilizing the existing time series data; attempts can also be made to introduce SAR data to assess the growth and health of winter wheat in order to overcome the influence of meteorological factors on the time series. In addition, although the selected CKs were closer to SAs, which could exclude the phenological differences caused by meteorological factors, it was undeniable that the differences in the amount of fertilizer applied to different croplands and winter wheat varieties would interfere with the experimental results. The uncertainties of mining subsidence in time and impact area were a difficult problem to solve. The solution to this problem requires deep cooperation with mining units to obtain information on mining routes and mining times. The subsidence areas (SAs) and check areas (CAs) are selected on the surface of the mining workings, and variables such as the amount of fertilizer applied and the variety of winter wheat in the SAs and CAs are strictly controlled using the control variable method. In addition, a good data collection program needs to be designed so that the effects of mining subsidence on crop growth and health can be more accurately obtained.
5.2. Conclusions
This study combined SAR phase change information and multispectral reflection information to explore the dynamic impact of mining subsidence on the growth and health status of winter wheat at the working face scale. The main study contents included: the outermost boundary of the subsidence in the underground mining faces was acquired by DInSAR technology; four growth stages and the time differences of winter wheat in the SAs and CKs were determined; the differences in the growth rate of winter wheat in different growth stages were investigated by using the NDVI and the four red-edge vegetation indices; the impacts of mining subsidence on the growth of winter wheat were quantified according to the change magnitudes of growth rate; and the SACHI model was constructed to comprehensively assess the health status of winter wheat in the subsidence area. The main conclusions were as follows:
- (1)
- LOS differences: the results of winter wheat LOS divided by NDVI indicated that the SAs lagged behind the onset of the OWS, SOS, and EOS compared to CKs.
- (2)
- Growth differences in winter wheat: Mining subsidence could lead to a decrease in winter wheat growth rate and an increase in decline rate. The mining subsidence made the growth and development of winter wheat in the SA1 area slower than that of the CK1, and the rates of decline and maturity were faster than those of the CK1. The impacts of mining subsidence on winter wheat growth in SA2 were not obvious in the OWS, demonstrating slow growth after the SOS and some acceleration of decline.
- (3)
- Construction rationalization of the SACHI model: The mean contribution rates of the PCA in the four study areas of the model were all between 90.99% and 92.01%, indicating that SACHI can integrate most of the information of the four components; NDRE2, CIre, and NDMI all positively affected the health status of winter wheat, and were highly positively correlated with SACHI, with the means of correlation coefficients ranging from 0.979 to 0.981 (p < 0.01), from 0.974 to 0.980 (p < 0.01), and from 0.884 to 0.912 (p < 0.01), respectively. The correlation coefficients of the SI-T and SACHI were highly negatively correlated, with means of correlation coefficients ranging from −0.925 to −0.894 (p < 0.01).
- (4)
- Impacts of the underground mining faces advancement process on the health status of winter wheat: binary logistic regression analysis revealed that mining subsidence had a significant effect on the health status of winter wheat at the LOS (p < 0.001) and a weaker effect on the health status of winter wheat at the OWS (p > 0.05).
- (5)
- Differences in health status of winter wheat between the SAs and CKs: SA1 winter wheat had poorer health throughout its life cycle relative to CK1 (about 84.6% of the full stage). According to the subsidence time of the SA2, it was found that the impact of mining subsidence on the health status of winter wheat in the SA2 was mainly manifested in the LOS 2 and EOS. In these two stages, the proportion of poor winter wheat health in the SA2 compared to the CK2 was about 53.3%.
Author Contributions
Conceptualization, C.M. and T.L.; methodology, C.M. and H.Z.; software, H.Z.; validation, H.Z. and T.L.; formal analysis, W.G.; investigation, H.Z. and T.L.; data curation, H.Z.; writing—original draft preparation, C.M. and H.Z.; writing—review and editing, W.G. and T.L.; visualization, H.Z.; supervision, C.M.; project administration, C.M.; funding acquisition, C.M. and W.G. All authors have read and agreed to the published version of the manuscript.
Funding
This research was funded by National Natural Science Foundation of China (No. U21A20108) and Scientific and Technological Innovation Team of Universities in Henan Province (No. 22IRTSTHN008).
Data Availability Statement
Radar remote sensing data: Sentinel-1A SAR SLC data. This data were obtained from the NASA’s Alaska Satellite Facility Distributed Active Archive Center (ASF DAAC) (https://search.asf.alaska.edu/, accessed on 22 May 2023). Optical remote sensing data: Sentinel-2A/B data. This data were obtained from Copernicus Open Access Hub of European Space Agency (https://scihub.copernicus.eu/, accessed on 6 June 2023). The DEM data were obtained from the SRTM DEM provided by NASA with a spatial resolution of 30 m. (http://dwtkns.com/srtm30m/, accessed on 22 May 2023).
Acknowledgments
The authors acknowledge all data contributors and platforms that provide data, and express gratitude to anonymous reviewers for constructive comments and improving advice.
Conflicts of Interest
The authors declare that they have no known competing financial interests or personal relationships that could have appeared to influence the work reported in this paper.
Appendix A

Table A1.
Acquired SAR data related information.
| Data Source | Imaging Date | Data Type | Sensor | Data Source | Imaging Date | Data Type | Sensor |
|---|---|---|---|---|---|---|---|
| Sentinel-1A | 8 January 2019 | SLC | SAR | Sentinel-1A | 19 June 2020 | SLC | SAR |
| Sentinel-1A | 20 January 2019 | SLC | SAR | Sentinel-1A | 1 July 2020 | SLC | SAR |
| Sentinel-1A | 1 February 2019 | SLC | SAR | Sentinel-1A | 25 July 2020 | SLC | SAR |
| Sentinel-1A | 13 February 2019 | SLC | SAR | Sentinel-1A | 6 August 2020 | SLC | SAR |
| Sentinel-1A | 25 February 2019 | SLC | SAR | Sentinel-1A | 18 August 2020 | SLC | SAR |
| Sentinel-1A | 9 March 2019 | SLC | SAR | Sentinel-1A | 30 August 2020 | SLC | SAR |
| Sentinel-1A | 21 March 2019 | SLC | SAR | Sentinel-1A | 11 September 2020 | SLC | SAR |
| Sentinel-1A | 2 April 2019 | SLC | SAR | Sentinel-1A | 23 September 2020 | SLC | SAR |
| Sentinel-1A | 14 April 2019 | SLC | SAR | Sentinel-1A | 5 October 2020 | SLC | SAR |
| Sentinel-1A | 26 April 2019 | SLC | SAR | Sentinel-1A | 17 October 2020 | SLC | SAR |
| Sentinel-1A | 8 May 2019 | SLC | SAR | Sentinel-1A | 29 October 2020 | SLC | SAR |
| Sentinel-1A | 20 May 2019 | SLC | SAR | Sentinel-1A | 10 November 2020 | SLC | SAR |
| Sentinel-1A | 1 June 2019 | SLC | SAR | Sentinel-1A | 22 November 2020 | SLC | SAR |
| Sentinel-1A | 13 June 2019 | SLC | SAR | Sentinel-1A | 4 December 2020 | SLC | SAR |
| Sentinel-1A | 25 June 2019 | SLC | SAR | Sentinel-1A | 16 December 2020 | SLC | SAR |
| Sentinel-1A | 7 July 2019 | SLC | SAR | Sentinel-1A | 28 December 2020 | SLC | SAR |
| Sentinel-1A | 19 July 2019 | SLC | SAR | Sentinel-1A | 9 January 2021 | SLC | SAR |
| Sentinel-1A | 31 July 2019 | SLC | SAR | Sentinel-1A | 21 January 2021 | SLC | SAR |
| Sentinel-1A | 12 August 2019 | SLC | SAR | Sentinel-1A | 2 February 2021 | SLC | SAR |
| Sentinel-1A | 24 August 2019 | SLC | SAR | Sentinel-1A | 14 February 2021 | SLC | SAR |
| Sentinel-1A | 5 September 2019 | SLC | SAR | Sentinel-1A | 26 February 2021 | SLC | SAR |
| Sentinel-1A | 17 September 2019 | SLC | SAR | Sentinel-1A | 10 March 2021 | SLC | SAR |
| Sentinel-1A | 29 September 2019 | SLC | SAR | Sentinel-1A | 22 March 2021 | SLC | SAR |
| Sentinel-1A | 11 October 2019 | SLC | SAR | Sentinel-1A | 3 April 2021 | SLC | SAR |
| Sentinel-1A | 23 October 2019 | SLC | SAR | Sentinel-1A | 15 April 2021 | SLC | SAR |
| Sentinel-1A | 4 November 2019 | SLC | SAR | Sentinel-1A | 27 April 2021 | SLC | SAR |
| Sentinel-1A | 16 November 2019 | SLC | SAR | Sentinel-1A | 21 May 2021 | SLC | SAR |
| Sentinel-1A | 28 November 2019 | SLC | SAR | Sentinel-1A | 14 June 2021 | SLC | SAR |
| Sentinel-1A | 10 December 2019 | SLC | SAR | Sentinel-1A | 8 July 2021 | SLC | SAR |
| Sentinel-1A | 22 December 2019 | SLC | SAR | Sentinel-1A | 1 August 2021 | SLC | SAR |
| Sentinel-1A | 3 January 2020 | SLC | SAR | Sentinel-1A | 13 August 2021 | SLC | SAR |
| Sentinel-1A | 15 January 2020 | SLC | SAR | Sentinel-1A | 25 August 2021 | SLC | SAR |
| Sentinel-1A | 27 January 2020 | SLC | SAR | Sentinel-1A | 6 September 2021 | SLC | SAR |
| Sentinel-1A | 8 February 2020 | SLC | SAR | Sentinel-1A | 18 September 2021 | SLC | SAR |
| Sentinel-1A | 3 March 2020 | SLC | SAR | Sentinel-1A | 30 September 2021 | SLC | SAR |
| Sentinel-1A | 15 March 2020 | SLC | SAR | Sentinel-1A | 12 October 2021 | SLC | SAR |
| Sentinel-1A | 27 March 2020 | SLC | SAR | Sentinel-1A | 24 October 2021 | SLC | SAR |
| Sentinel-1A | 8 April 2020 | SLC | SAR | Sentinel-1A | 5 November 2021 | SLC | SAR |
| Sentinel-1A | 20 April 2020 | SLC | SAR | Sentinel-1A | 17 November 2021 | SLC | SAR |
| Sentinel-1A | 2 May 2020 | SLC | SAR | Sentinel-1A | 29 November 2021 | SLC | SAR |
| Sentinel-1A | 14 May 2020 | SLC | SAR | Sentinel-1A | 11 December 2021 | SLC | SAR |
| Sentinel-1A | 7 June 2020 | SLC | SAR | Sentinel-1A | 23 December 2021 | SLC | SAR |
References
- Guo, W.B.; Zhao, G.; Bai, E.; Ma, C.; Nie, X.; Chen, J.; Zhang, H. Research Status and Prospect on Cultivated Land Damage at Surface Subsidence Basin Due to Longwall Mining in the Central Coal Grain Compound Area. J. China Coal Soc. 2023, 48, 388–401. [Google Scholar] [CrossRef]
- Li, Y.; Chiu, Y.-h.; Lin, T.Y. Coal Production Efficiency and Land Destruction in China’s Coal Mining Industry. Resour. Policy 2019, 63, 101449. [Google Scholar] [CrossRef]
- Chen, Y.; Hu, Z.; Li, P.; Li, G.; Yuan, D.; Guo, J. Assessment and Effect of Mining Subsidence on Farmland in Coal–Crop Overlapped Areas: A Case of Shandong Province, China. Agriculture 2022, 12, 1235. [Google Scholar] [CrossRef]
- Hu, Z.; Liu, S.; Gong, Y. Evaluation of Soil Quality and Maize Growth in Different Profiles of Reclaimed Land with Coal Gangue Filling. Land 2021, 10, 1307. [Google Scholar] [CrossRef]
- Feng, Z.; Hu, Z.; Li, G.; Zhang, Y.; Zhang, X.; Zhang, H. Improving Mine Reclamation Efficiency for Farmland Sustainable Use: Insights from Optimizing Mining Scheme. J. Clean. Prod. 2022, 379, 134615. [Google Scholar] [CrossRef]
- Zhang, P.; Liu, G.; Yu, Y. Ecological Stoichiometry of Soil Carbon, Nitrogen and Phosphorus in Reclaimed Farmland in Coal Mining Subsidence Area. J. Soil Sci. Plant Nutr. 2023, 23, 2498–2511. [Google Scholar] [CrossRef]
- Ren, H.; Xiao, W.; Zhao, Y.; Hu, Z. Land Damage Assessment Using Maize Aboveground Biomass Estimated from Unmanned Aerial Vehicle in High Groundwater Level Regions Affected by Underground Coal Mining. Environ. Sci. Pollut. Res. 2020, 27, 21666–21679. [Google Scholar] [CrossRef]
- Xiao, D.; Niu, H.; Guo, J.; Zhao, S.; Fan, L. Carbon Storage Change Analysis and Emission Reduction Suggestions under Land Use Transition: A Case Study of Henan Province, China. Int. J. Environ. Res. Public Health 2021, 18, 1844. [Google Scholar] [CrossRef]
- Chen, L.; Wang, E.; Ou, J.; Fu, J. Coal and Gas Outburst Hazards and Factors of the No. B-1 Coalbed, Henan, China. Geosci. J. 2018, 22, 171–182. [Google Scholar] [CrossRef]
- Guo, G.; Li, H.; Zha, J.; Liu, W.; Hu, Q.; Wang, F.; Chen, C.; Zhang, P.; Zhang, H.; Zhang, Q. Research Status and Countermeasures of Coordinated Development of Coal Mining and Cultivated Land Protection in the Plain Coal-Cropland Overlapped Areas. Coal Sci. Technol. 2023, 51, 416–426. [Google Scholar] [CrossRef]
- Yang, Q.; Tang, F.; Wang, F.; Tang, J.; Fan, Z.; Ma, T.; Su, Y.; Xue, J. A New Technical Pathway for Extracting High Accuracy Surface Deformation Information in Coal Mining Areas Using UAV LiDAR Data: An Example from the Yushen Mining Area in Western China. Measurement 2023, 218, 113220. [Google Scholar] [CrossRef]
- Wang, L.; Teng, C.; Jiang, K.; Jiang, C.; Zhu, S. D-InSAR Monitoring Method of Mining Subsidence Based on Boltzmann and Its Application in Building Mining Damage Assessment. KSCE J. Civ. Eng. 2022, 26, 353–370. [Google Scholar] [CrossRef]
- Wang, Y. Research Progress and Prospect on Ecological Disturbance Monitoring in Mining Area. Acta Geod. Cartogr. Sin. 2017, 46, 1705–1716. [Google Scholar] [CrossRef]
- Gabriel, A.K.; Goldstein, R.M.; Zebker, H.A. Mapping Small Elevation Changes over Large Areas: Differential Radar Interferometry. J. Geophys. Res. Solid Earth 1989, 94, 9183–9191. [Google Scholar] [CrossRef]
- Ferretti, A.; Prati, C.; Rocca, F. Nonlinear Subsidence Rate Estimation Using Permanent Scatterers in Differential SAR Interferometry. IEEE Trans. Geosci. Remote Sens. 2000, 38, 2202–2212. [Google Scholar] [CrossRef]
- Berardino, P.; Fornaro, G.; Lanari, R.; Sansosti, E. A New Algorithm for Surface Deformation Monitoring Based on Small Baseline Differential SAR Interferograms. IEEE Trans. Geosci. Remote Sens. 2002, 40, 2375–2383. [Google Scholar] [CrossRef]
- Fu, W.; Guo, H.; Tian, Q.; Guo, X. Landslide Monitoring by Corner Reflectors Differential Interferometry SAR. Int. J. Remote Sens. 2010, 31, 6387–6400. [Google Scholar] [CrossRef]
- Wang, G.; Wu, Q.; Li, P.; Cui, X.; Gong, Y.; Zhang, J.; Tang, W. Mining Subsidence Prediction Parameter Inversion by Combining GNSS and DInSAR Deformation Measurements. IEEE Access 2021, 9, 89043–89054. [Google Scholar] [CrossRef]
- Hu, Z.; Long, J.; Wang, X. Self-Healing, Natural Restoration and Artificial Restoration of Ecological Environment for Coal Mining. J. China Coal Soc. 2014, 39, 1751–1757. [Google Scholar] [CrossRef]
- Bian, Z.; Lei, S.; Jin, D.; Wang, L. Several Basic Scientific Issues Related to Mined Land Remediation. J. China Coal Soc. 2018, 43, 190–197. [Google Scholar] [CrossRef]
- Gao, Y.; Dang, X.; Wang, J.; Gao, Q.; Zhai, B.; Liu, B. Damage Characteristics of Populus Simonii Root Systems at Different Cracks in Mining Subsidence Area. Bull. Soil Water Conserv. 2022, 42, 34–41. [Google Scholar] [CrossRef]
- Yang, X.; Lei, S.; Shi, Y.; Wang, W. Effects of Ground Subsidence on Vegetation Chlorophyll Content in Semi-Arid Mining Area: From Leaf Scale to Canopy Scale. Int. J. Environ. Res. Public Health 2023, 20, 493. [Google Scholar] [CrossRef] [PubMed]
- Diop, M.; Chirinda, N.; Beniaich, A.; El Gharous, M.; El Mejahed, K. Soil and Water Conservation in Africa: State of Play and Potential Role in Tackling Soil Degradation and Building Soil Health in Agricultural Lands. Sustainability 2022, 14, 13425. [Google Scholar] [CrossRef]
- Lykhochvor, V.; Gnativ, P.; Andrushko, O.; Ivanyuk, V.; Olifir, Y. The Role of Nutrients in the Formation of Yield and Grain Quality of Winter Wheat. Bulg. J. Agric. Sci. 2022, 28, 103–109. [Google Scholar]
- Lin, M.; Hou, L.; Qi, Z.; Wan, L. Impacts of Climate Change and Human Activities on Vegetation NDVI in China’s Mu Us Sandy Land during 2000–2019. Ecol. Indic. 2022, 142, 109164. [Google Scholar] [CrossRef]
- Zhong, X.; Li, J.; Wang, J.; Zhang, J.; Liu, L.; Ma, J. Linear and Nonlinear Characteristics of Long-Term NDVI Using Trend Analysis: A Case Study of Lancang-Mekong River Basin. Remote Sens. 2022, 14, 6271. [Google Scholar] [CrossRef]
- Pabon-Moreno, D.E.; Migliavacca, M.; Reichstein, M.; Mahecha, M.D. On the Potential of Sentinel-2 for Estimating Gross Primary Production. IEEE Trans. Geosci. Remote Sens. 2022, 60, 4409412. [Google Scholar] [CrossRef]
- Ali, A.; Imran, M.; Ali, A.; Khan, M.A. Evaluating Sentinel-2 Red Edge through Hyperspectral Profiles for Monitoring LAI & Chlorophyll Content of Kinnow Mandarin Orchards. Remote Sens. Appl. Soc. Environ. 2022, 26, 100719. [Google Scholar] [CrossRef]
- Jiang, F.; Sun, H.; Li, C.; Ma, K.; Chen, S.; Long, J.; Ren, L. Retrieving the Forest Aboveground Biomass by Combining the Red Edge Bands of Sentinel-2 and GF-6. Acta Ecol. Sin. 2021, 41, 8222–8236. [Google Scholar] [CrossRef]
- Liew, O.; Chong, P.; Li, B.; Asundi, A. Signature Optical Cues: Emerging Technologies for Monitoring Plant Health. Sensors 2008, 8, 3205–3239. [Google Scholar] [CrossRef]
- Fang, C.; Wang, L.; Xu, H. A Comparative Study of Different Red Edge Indices for Remote Sensing Detection of Urban Grassland Health Status. J. Geo-information Sci. 2017, 19, 1382–1392. [Google Scholar] [CrossRef]
- Vincini, M.; Amaducci, S.; Frazzi, E. Empirical Estimation of Leaf Chlorophyll Density in Winter Wheat Canopies Using Sentinel-2 Spectral Resolution. IEEE Trans. Geosci. Remote Sens. 2014, 52, 3220–3235. [Google Scholar] [CrossRef]
- Clevers, J.G.P.W.; Kooistra, L.; van den Brande, M.M.M. Using Sentinel-2 Data for Retrieving LAI and Leaf and Canopy Chlorophyll Content of a Potato Crop. Remote Sens. 2017, 9, 405. [Google Scholar] [CrossRef]
- Xie, Q.; Dash, J.; Huete, A.; Jiang, A.; Yin, G.; Ding, Y.; Peng, D.; Hall, C.C.; Brown, L.; Shi, Y.; et al. Retrieval of Crop Biophysical Parameters from Sentinel-2 Remote Sensing Imagery. Int. J. Appl. Earth Obs. Geoinf. 2019, 80, 187–195. [Google Scholar] [CrossRef]
- Hu, X.; Niu, B.; Li, X.; Min, X. Unmanned Aerial Vehicle (UAV) Remote Sensing Estimation of Wheat Chlorophyll in Subsidence Area of Coal Mine with High Phreatic Level. Earth Sci. Inform. 2021, 14, 2171–2181. [Google Scholar] [CrossRef]
- Guo, Y.; Zhao, Y.; Yan, H. Disturbed Boundaries Extraction in Coal–Grain Overlap Areas with High Groundwater Levels Using UAV-Based Visible and Multispectral Imagery. Environ. Sci. Pollut. Res. 2022, 29, 58892–58905. [Google Scholar] [CrossRef]
- Dai, L.; Zhang, Y.; Ding, R.; Yan, Y. Spatiotemporal Distribution and Influencing Factors of the Net Primary Productivity in the Datai Mine in Western Beijing. Sustainability 2022, 14, 15567. [Google Scholar] [CrossRef]
- Ranjan, A.K.; Parida, B.R.; Dash, J.; Gorai, A.K. Quantifying the Impacts of Opencast Mining on Vegetation Dynamics over Eastern India Using the Long-Term Landsat-Series Satellite Dataset. Ecol. Inform. 2022, 71, 101812. [Google Scholar] [CrossRef]
- Hu, B.; Zhang, H.; Shen, B. Buildings, Water Bodies, Railways and Main Specifications for Coal Column Retention and Pressurized Coal Mining in Shafts and Lanes; China Coal Industry Publishing House: Beijing, China, 2017. [Google Scholar]
- Tian, Y.; Chen, Z.; Hui, F.; Cheng, X.; Ouyang, L. ESA Sentinel-2A/B Satellite:Characteristics and Applications. J. Beijing Norm. Univ. Sci. 2019, 55, 57–65. [Google Scholar] [CrossRef]
- Li, X.; Yang, L.; Zou, Y.; Ma, C. Dynamic Change of Red Edge Vegetation Index within a Growth Cycle in Arid Area under Coal Mining Stress. J. China Coal Soc. 2021, 46, 1508–1520. [Google Scholar] [CrossRef]
- Su, W.; Zhang, M.; Jiang, K.; Zhu, D.; Huang, J.; Wang, P. Atmospheric Correction Method for Sentinel-2 Satellite Imagery. Acta Opt. Sin. 2018, 38, 322–331. [Google Scholar] [CrossRef]
- Xu, T.; Yang, J.; Bai, J.; Jin, Z.; Guo, Z.; Yu, F. An Inversion Model of Nitrogen Content in Rice Canopy Based on UAV Polarimetric Remote Sensing. Trans. Chin. Soc. Agric. Mach. 2023, 54, 171–178. [Google Scholar] [CrossRef]
- Wang, M.; Luo, Y.; Zhang, Z.; Xie, Q.; Wu, X.; Ma, X. Recent Advances in Remote Sensing of Vegetation Phenology: Retrieval Algorithm and Validation Strategy. Natl. Remote Sens. Bull. 2022, 26, 431–455. [Google Scholar] [CrossRef]
- Xu, Z.; Sun, B.; Zhang, W.; Li, Y.; Yan, Z.; Yue, W.; Teng, S. An Evaluation of a Remote Sensing Method Based on Optimized Triangular Vegetation Index (TVI) for Aboveground Shrub Biomass Estimation in Shrub-Encroached Grassland. Acta Prataculturae Sin. 2023, 32, 1–14. [Google Scholar] [CrossRef]
- Liu, J.; Zhou, Z.; He, X.; Wang, P.; Huang, J. Estimating Winter Wheat Yield under Frequency Histogram and Vegetation Index Using Remote Sensing. Trans. Chinese Soc. Agric. Eng. 2021, 37, 145–152. [Google Scholar] [CrossRef]
- Rouse, J.W.; Haas, R.H.; Schell, J.A.; Deering, D.W. Monitoring Vegetation Systems in the Great Plains with ERTS. NASA Spec. Publ. 1974, 351, 309. [Google Scholar]
- Elsayed, S.; Rischbeck, P.; Schmidhalter, U. Comparing the Performance of Active and Passive Reflectance Sensors to Assess the Normalized Relative Canopy Temperature and Grain Yield of Drought-Stressed Barley Cultivars. F. Crop. Res. 2015, 177, 148–160. [Google Scholar] [CrossRef]
- Gitelson, A.; Merzlyak, M.N. Spectral Reflectance Changes Associated with Autumn Senescence of Aesculus hippocastanum L. and Acer platanoides L. Leaves. Spectral Features and Relation to Chlorophyll Estimation. J. Plant Physiol. 1994, 143, 286–292. [Google Scholar] [CrossRef]
- Barnes, E.M.; Clarke, T.; Richards, S.E.; Colaizzi, P.D.; Haberland, J.; Kostrzewski, M.; Waller, P.M.; Choi, C.Y.; Riley, E.; Thompson, T.L.; et al. Coincident Detection of Crop Water Stress, Nitrogen Status and Canopy Density Using Ground-Based Multispectral Data. In Proceedings of the Fifth International Conference on Precision Agriculture, Bloomington, MN, USA, 16–19 July 2000; pp. 16–19. [Google Scholar]
- Tucker, C.J. Red and Photographic Infrared Linear Combinations for Monitoring Vegetation. Remote Sens. Environ. 1979, 8, 127–150. [Google Scholar] [CrossRef]
- Jönsson, P.; Eklundh, L. Seasonality Extraction by Function Fitting to Time-Series of Satellite Sensor Data. IEEE Trans. Geosci. Remote Sens. 2002, 40, 1824–1832. [Google Scholar] [CrossRef]
- Ma, C.; Cui, Z.; Li, T.; Peng, Y. Spatio-Temporal Variation and Its Response to Climate Change of NDVI in the Terrain Transition Zone, China. Acta Ecol. Sin. 2023, 43, 2141–2157. [Google Scholar] [CrossRef]
- Akima, H. A New Method of Interpolation and Smooth Curve Fitting Based on Local Procedures. J. ACM 1970, 17, 589–602. [Google Scholar] [CrossRef]
- Akima, H. A Method of Bivariate Interpolation and Smooth Surface Fitting Based on Local Procedures. Commun. ACM 1974, 17, 18–20. [Google Scholar] [CrossRef]
- Lu, L.; Guo, H. Extraction Method of Winter Wheat Phenology from Time Series of SPOT/VEGETATION Data. Trans. Chinese Soc. Agric. Eng. 2009, 25, 174–179+317. [Google Scholar] [CrossRef]
- Tan, K.; Zhang, X.; Geng, J.; Cui, Z. Study on the Growth and Decline of Aboveground Biomass of Winter Wheat in North China Prior and Post Overwintering. Chin. J. Agrometeorol. 2022, 43, 276–284. [Google Scholar] [CrossRef]
- Zhao, Y.; Wang, X.; Hou, X.; Zhang, A. Spatio-Temporal Characteristics of Key Phenology of Winter Wheat in Shandong Province from 2003 to 2019. Acta Ecol. Sin. 2021, 41, 7785–7795. [Google Scholar] [CrossRef]
- Yan, F.; Shi, P.; Wu, J.; Wang, Y.; Li, C. The Phenology Character of Winter Wheat by MODI S-EVI Data in Hebei China. Acta Ecol. Sin. 2008, 28, 4381–4387. [Google Scholar]
- Gitelson, A.A.; Gritz, Y.; Merzlyak, M.N. Relationships between Leaf Chlorophyll Content and Spectral Reflectance and Algorithms for Non-Destructive Chlorophyll Assessment in Higher Plant Leaves. J. Plant Physiol. 2003, 160, 271–282. [Google Scholar] [CrossRef]
- Gao, B. NDWI—A normalized difference water index for remote sensing of vegetation liquid water from space. Remote Sens. Environ. 1996, 58, 257–266. [Google Scholar] [CrossRef]
- Wang, F.; Ding, J.; Wei, Y.; Zhou, Q.; Yang, X.; Wang, Q. Sensitivity Analysis of Soil Salinity and Vegetation Indices to Detect Soil Salinity Variation by Using Landsat Series Images: Applications in Different Oases in Xinjiang, China. Acta Ecol. Sin. 2017, 37, 5007–5022. [Google Scholar] [CrossRef]
- Tripathi, N.K.; Rai, B.K.; Dwivedi, P. Spatial Modeling of Soil Alkalinity in GIS Environment Using IRS Data. In Proceedings of the 18th Asian Conference on Remote Sensing, Kuala Lumpur, Malaysia, 20–24 October 1997; pp. 20–24. [Google Scholar]
- Xu, H.; Deng, W. Rationality Analysis of MRSEI and Its Difference with RSEI. Remote Sens. Technol. Appl. 2022, 37, 1–7. [Google Scholar] [CrossRef]
- Xu, H.; Duan, W.; Deng, W.; Lin, M. RSEI or MRSEI? Comment on Jia et al. Evaluation of Eco-Environmental Quality in Qaidam Basin Based on the Ecological Index (MRSEI) and GEE. Remote Sens. 2021, 13, 4543. Remote Sens. 2022, 14, 5307. [Google Scholar] [CrossRef]
- Fan, K.; Li, F.; Chen, X.; Li, Z.; Mulla, D.J. Nitrogen Balance Index Prediction of Winter Wheat by Canopy Hyperspectral Transformation and Machine Learning. Remote Sens. 2022, 14, 3504. [Google Scholar] [CrossRef]
- Zhao, X.; Na, X. Study on Remote Sensing Monitoring of Crop Growth Based on Comprehensive Index:A Case Study of the Songnen Plain. Geogr. Geo-Inf. Sci. 2022, 38, 34–39. [Google Scholar] [CrossRef]
- Xu, H.; Wang, Y.; Guan, H.; Shi, T.; Hu, X. Detecting Ecological Changes with a Remote Sensing Based Ecological Index (RSEI) Produced Time Series and Change Vector Analysis. Remote Sens. 2019, 11, 2345. [Google Scholar] [CrossRef]
Figure 1.
Overview of the study area. (a) Henan Province; (b) Huixian City and Xiuwu County; (c) Geographical location and satellite imagery of the study area; (d) Impact area of SA1; (e) Impact area of SA2; (f) The SA1 and the CK1 after removing artificial surfaces; (g) The SA2 and the CK2 after removing artificial surfaces. Notes: SA1: Subsidence area 1; SA2: Subsidence area 2; CK1: Check area 1; CK2: Check area 2.

Figure 2.
Changes in subsidence areas of different underground mining faces.
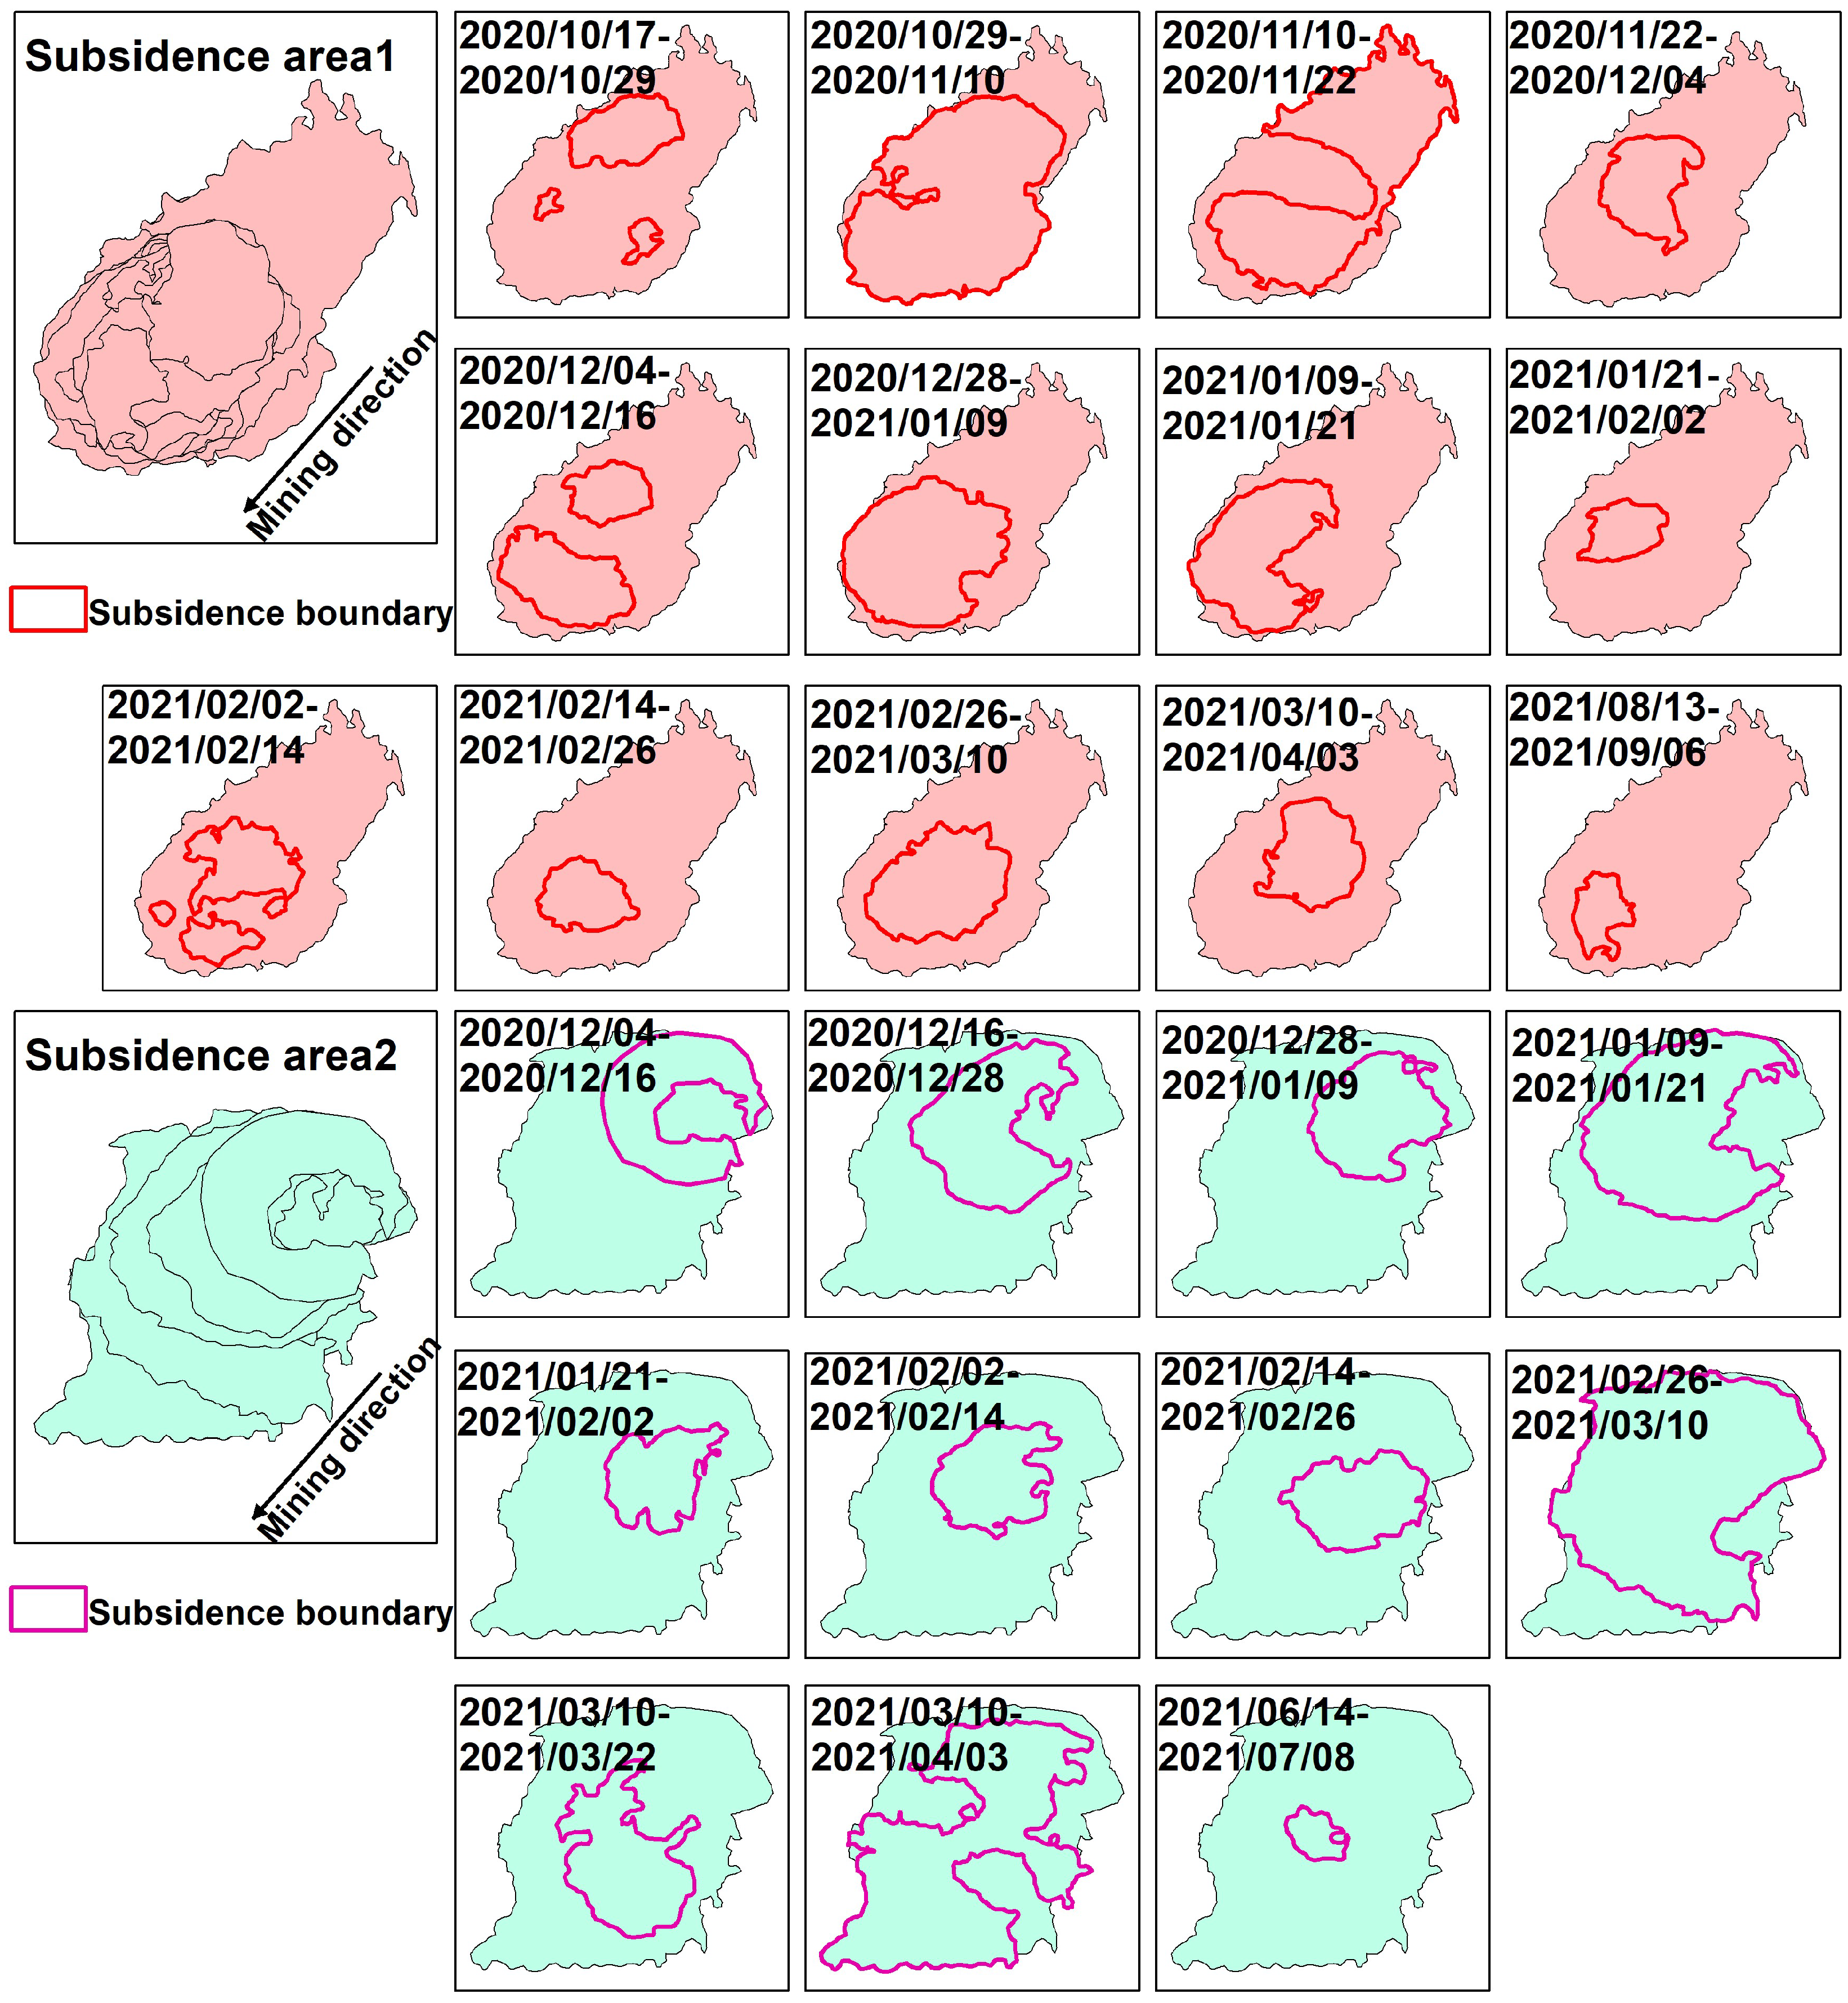
Figure 3.
Trends in NDVI changes from 2020 to 2022. (a) NDVI trends of SA1 and CK1 from 2020 to 2022; (b) NDVI trends of SA2 and CK2 from 2020 to 2022. Notes: SA1: Subsidence area 1; SA2: Subsidence area 2; CK1: Check area 1; CK2: Check area 2.
Figure 3.
Trends in NDVI changes from 2020 to 2022. (a) NDVI trends of SA1 and CK1 from 2020 to 2022; (b) NDVI trends of SA2 and CK2 from 2020 to 2022. Notes: SA1: Subsidence area 1; SA2: Subsidence area 2; CK1: Check area 1; CK2: Check area 2.
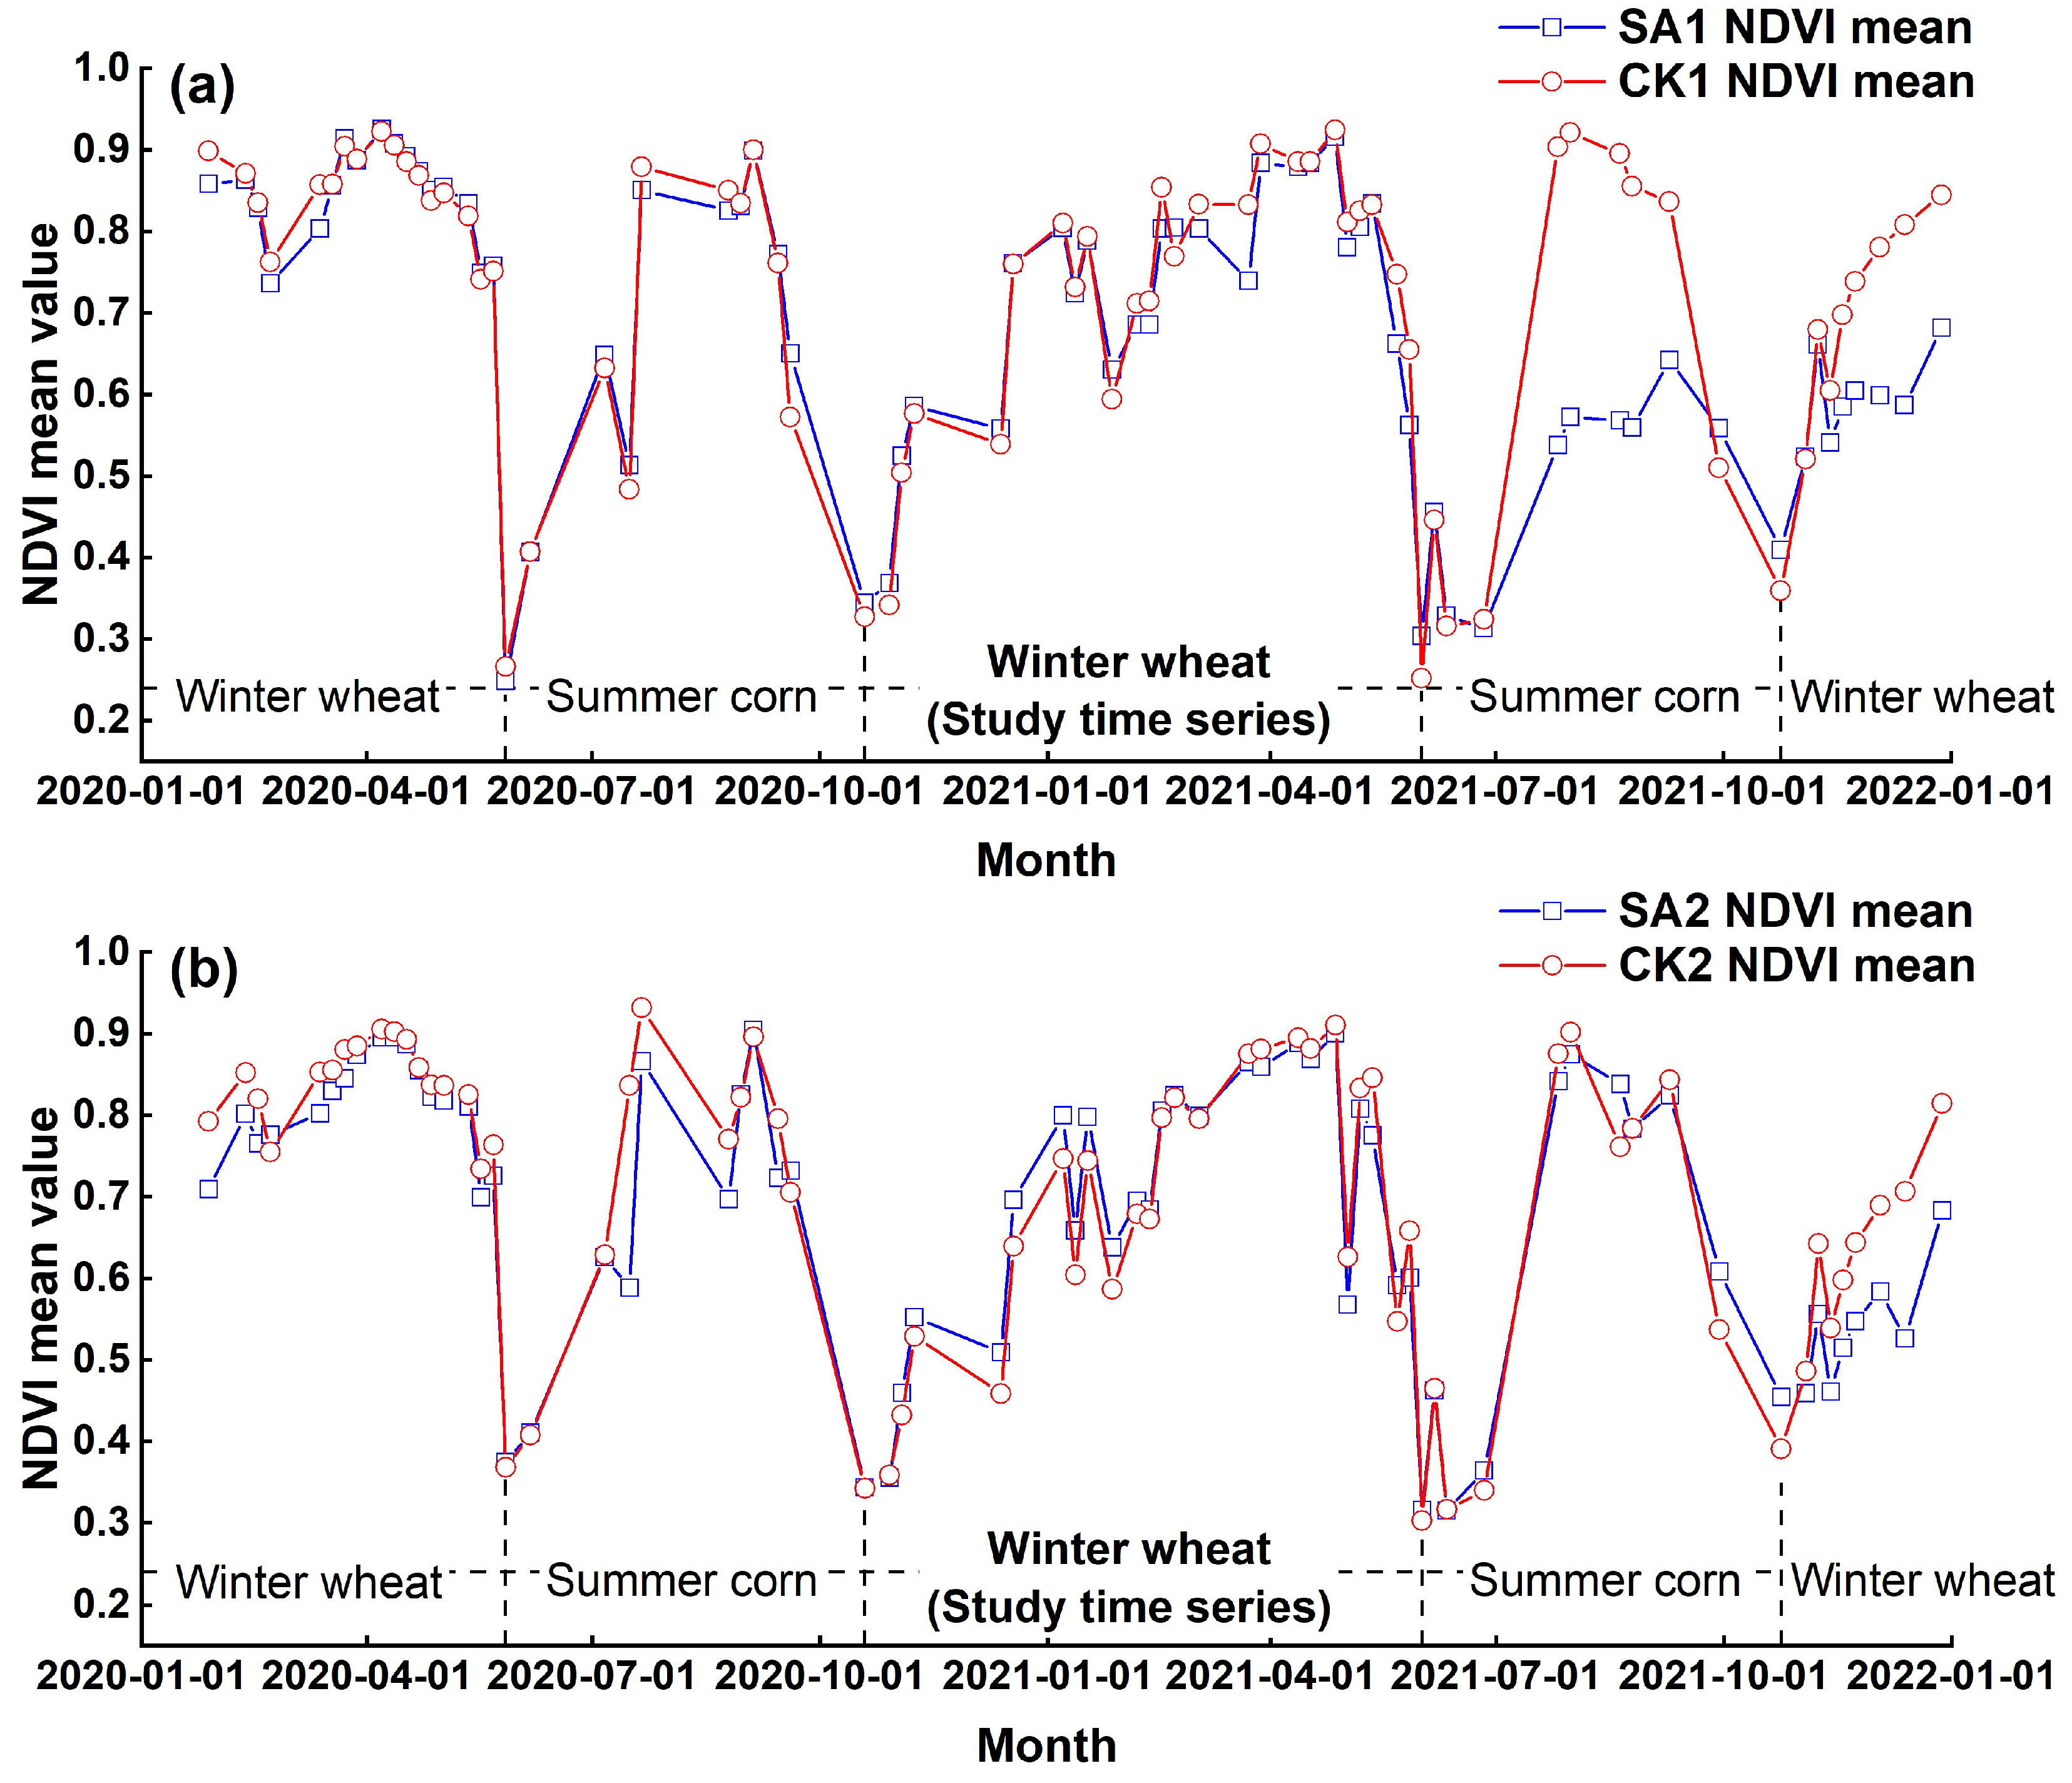
Figure 4.
Technology Roadmap. Notes: NDVI: Normalized difference vegetation index; RENDVI: Red edge normalized difference vegetation index; MREDVI: Modified red edge difference vegetation index; NDRE1: Normalized difference red edge1; NDRE2: Normalized difference red edge2; CIre: Red edged chlorophyll index; NDMI: Normalized difference moisture index; SI-T: Ratio salinity index; PCA: Principal component analysis; SACHI: Crop health index in subsidence area; SAs: Subsidence areas; CKs: Check areas.
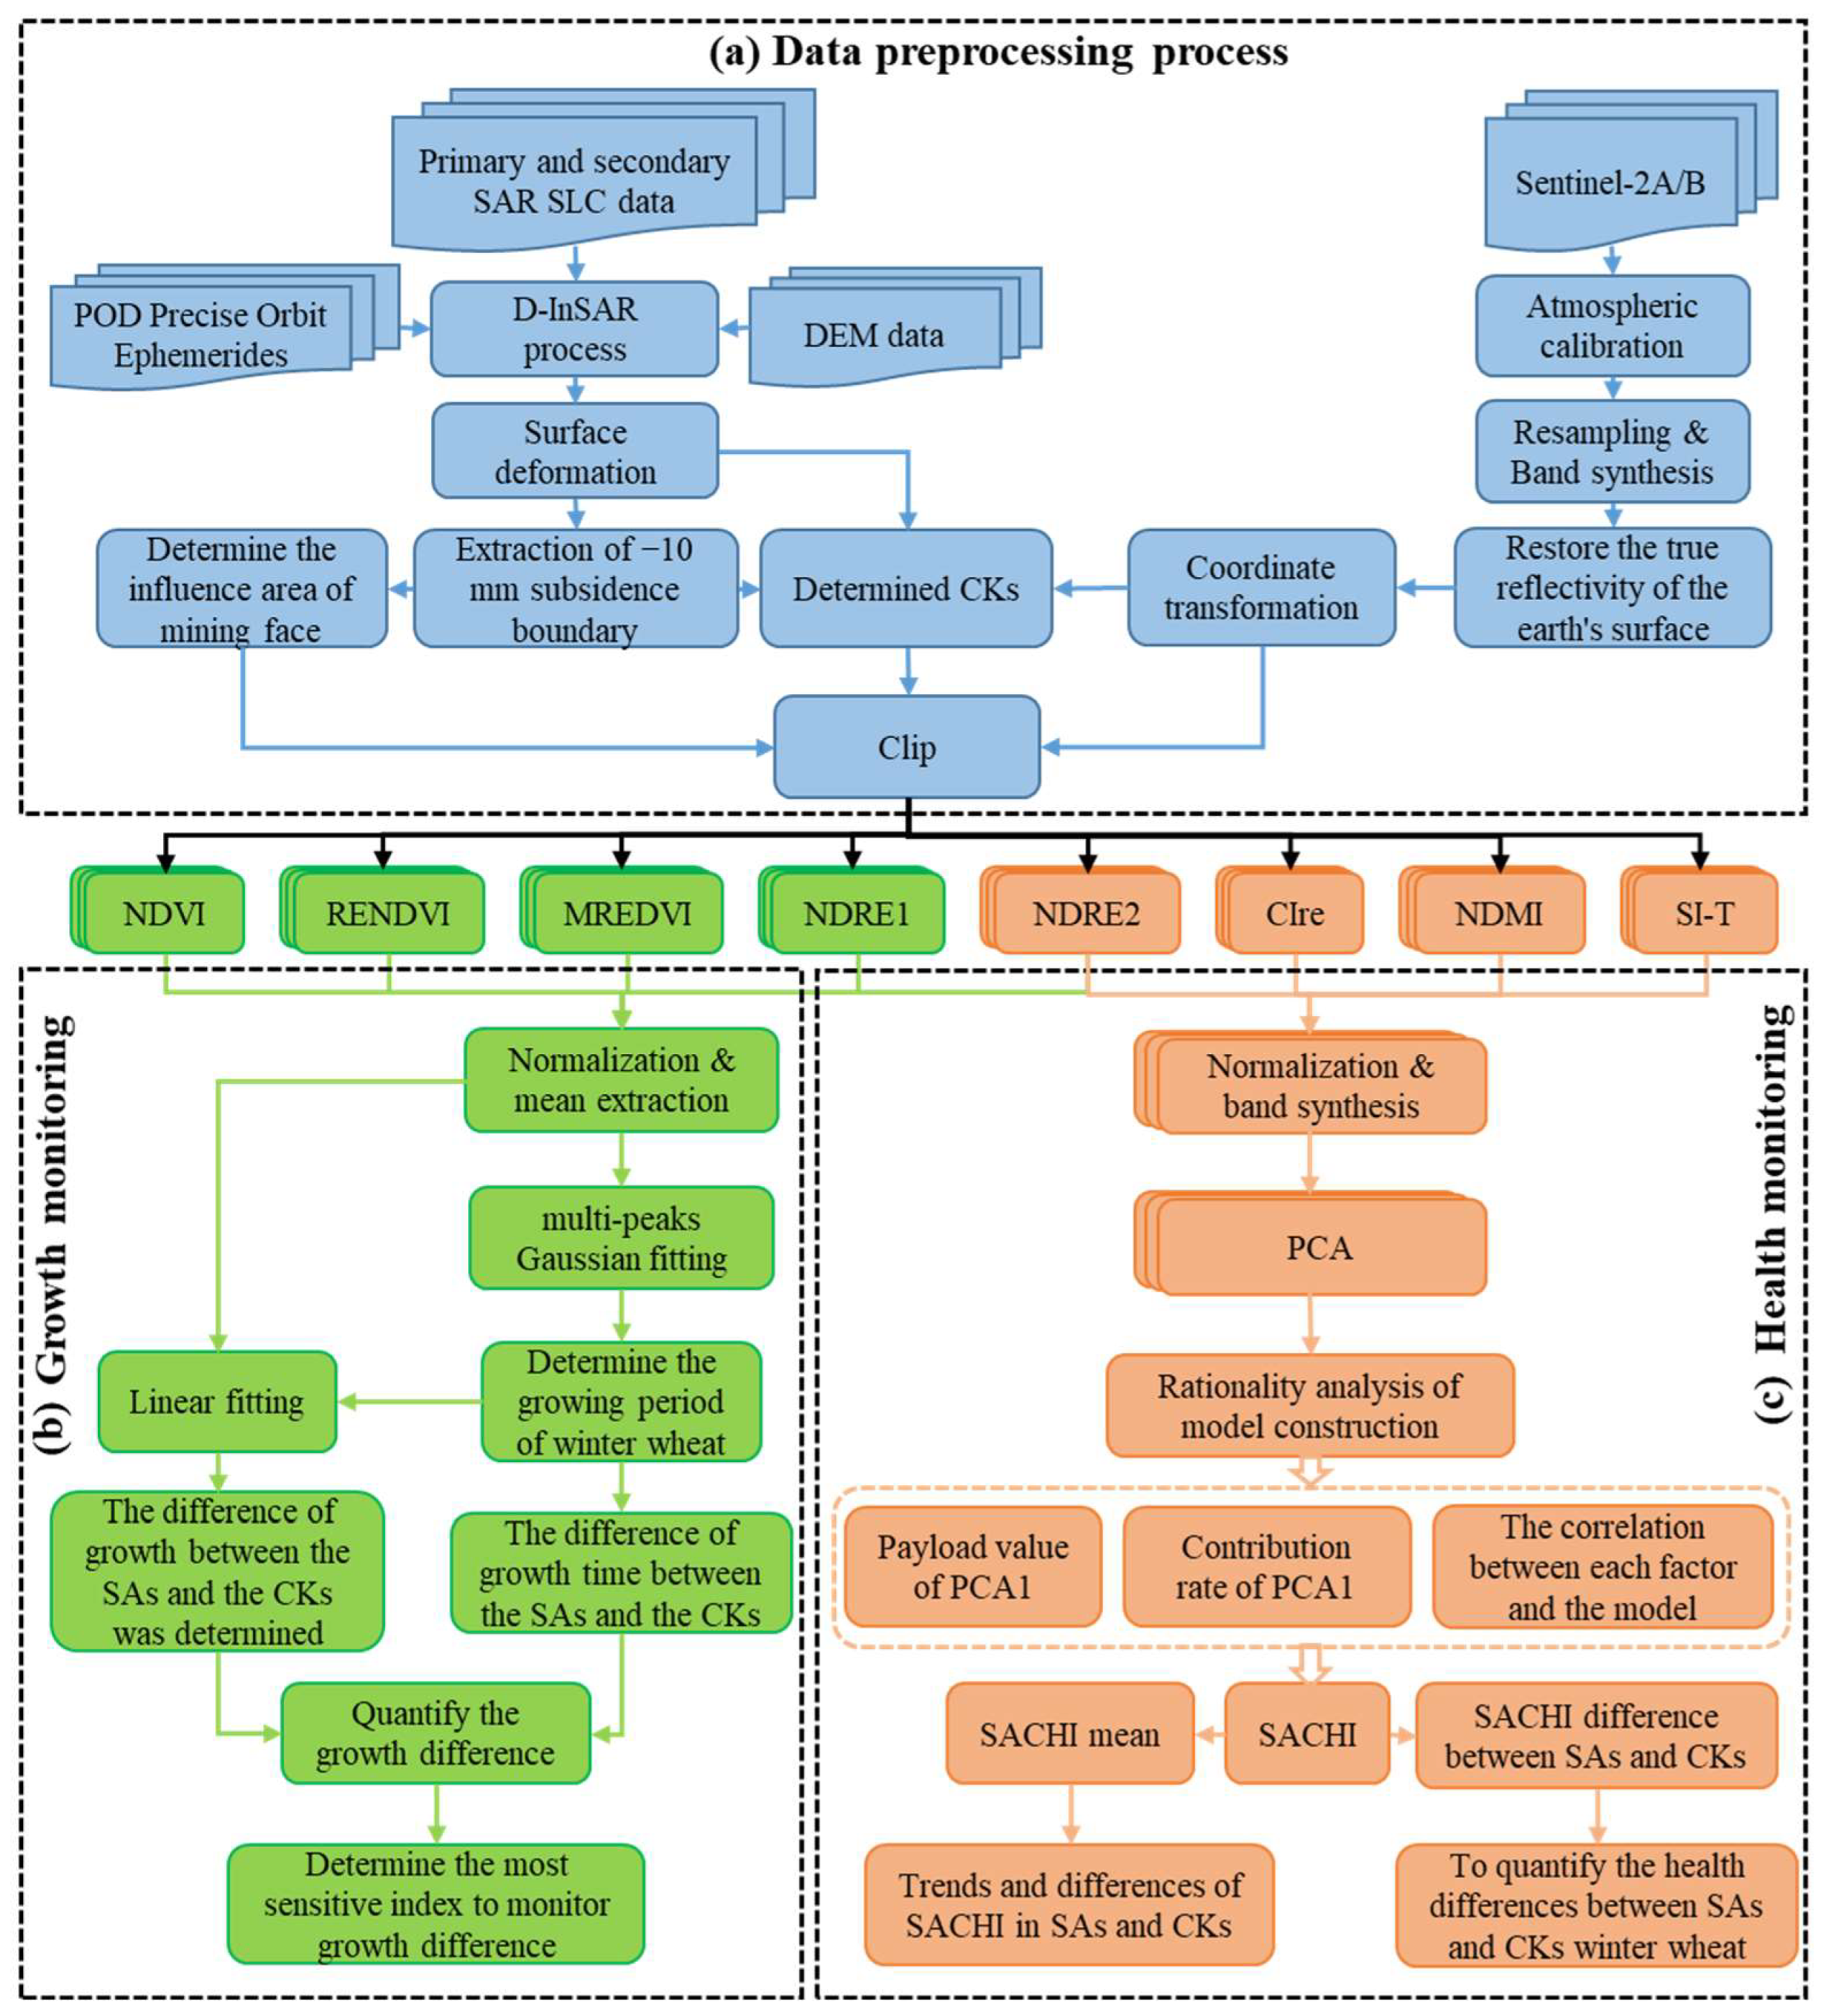
Figure 5.
Time-series NDVI profile lines. (a) NDVI on the SA1 profile line; (b) NDVI on the SA2profile line. Notes: NDVI: Normalized difference vegetation index; SA1: Subsidence area 1; SA2: Subsidence area 2.
Figure 5.
Time-series NDVI profile lines. (a) NDVI on the SA1 profile line; (b) NDVI on the SA2profile line. Notes: NDVI: Normalized difference vegetation index; SA1: Subsidence area 1; SA2: Subsidence area 2.
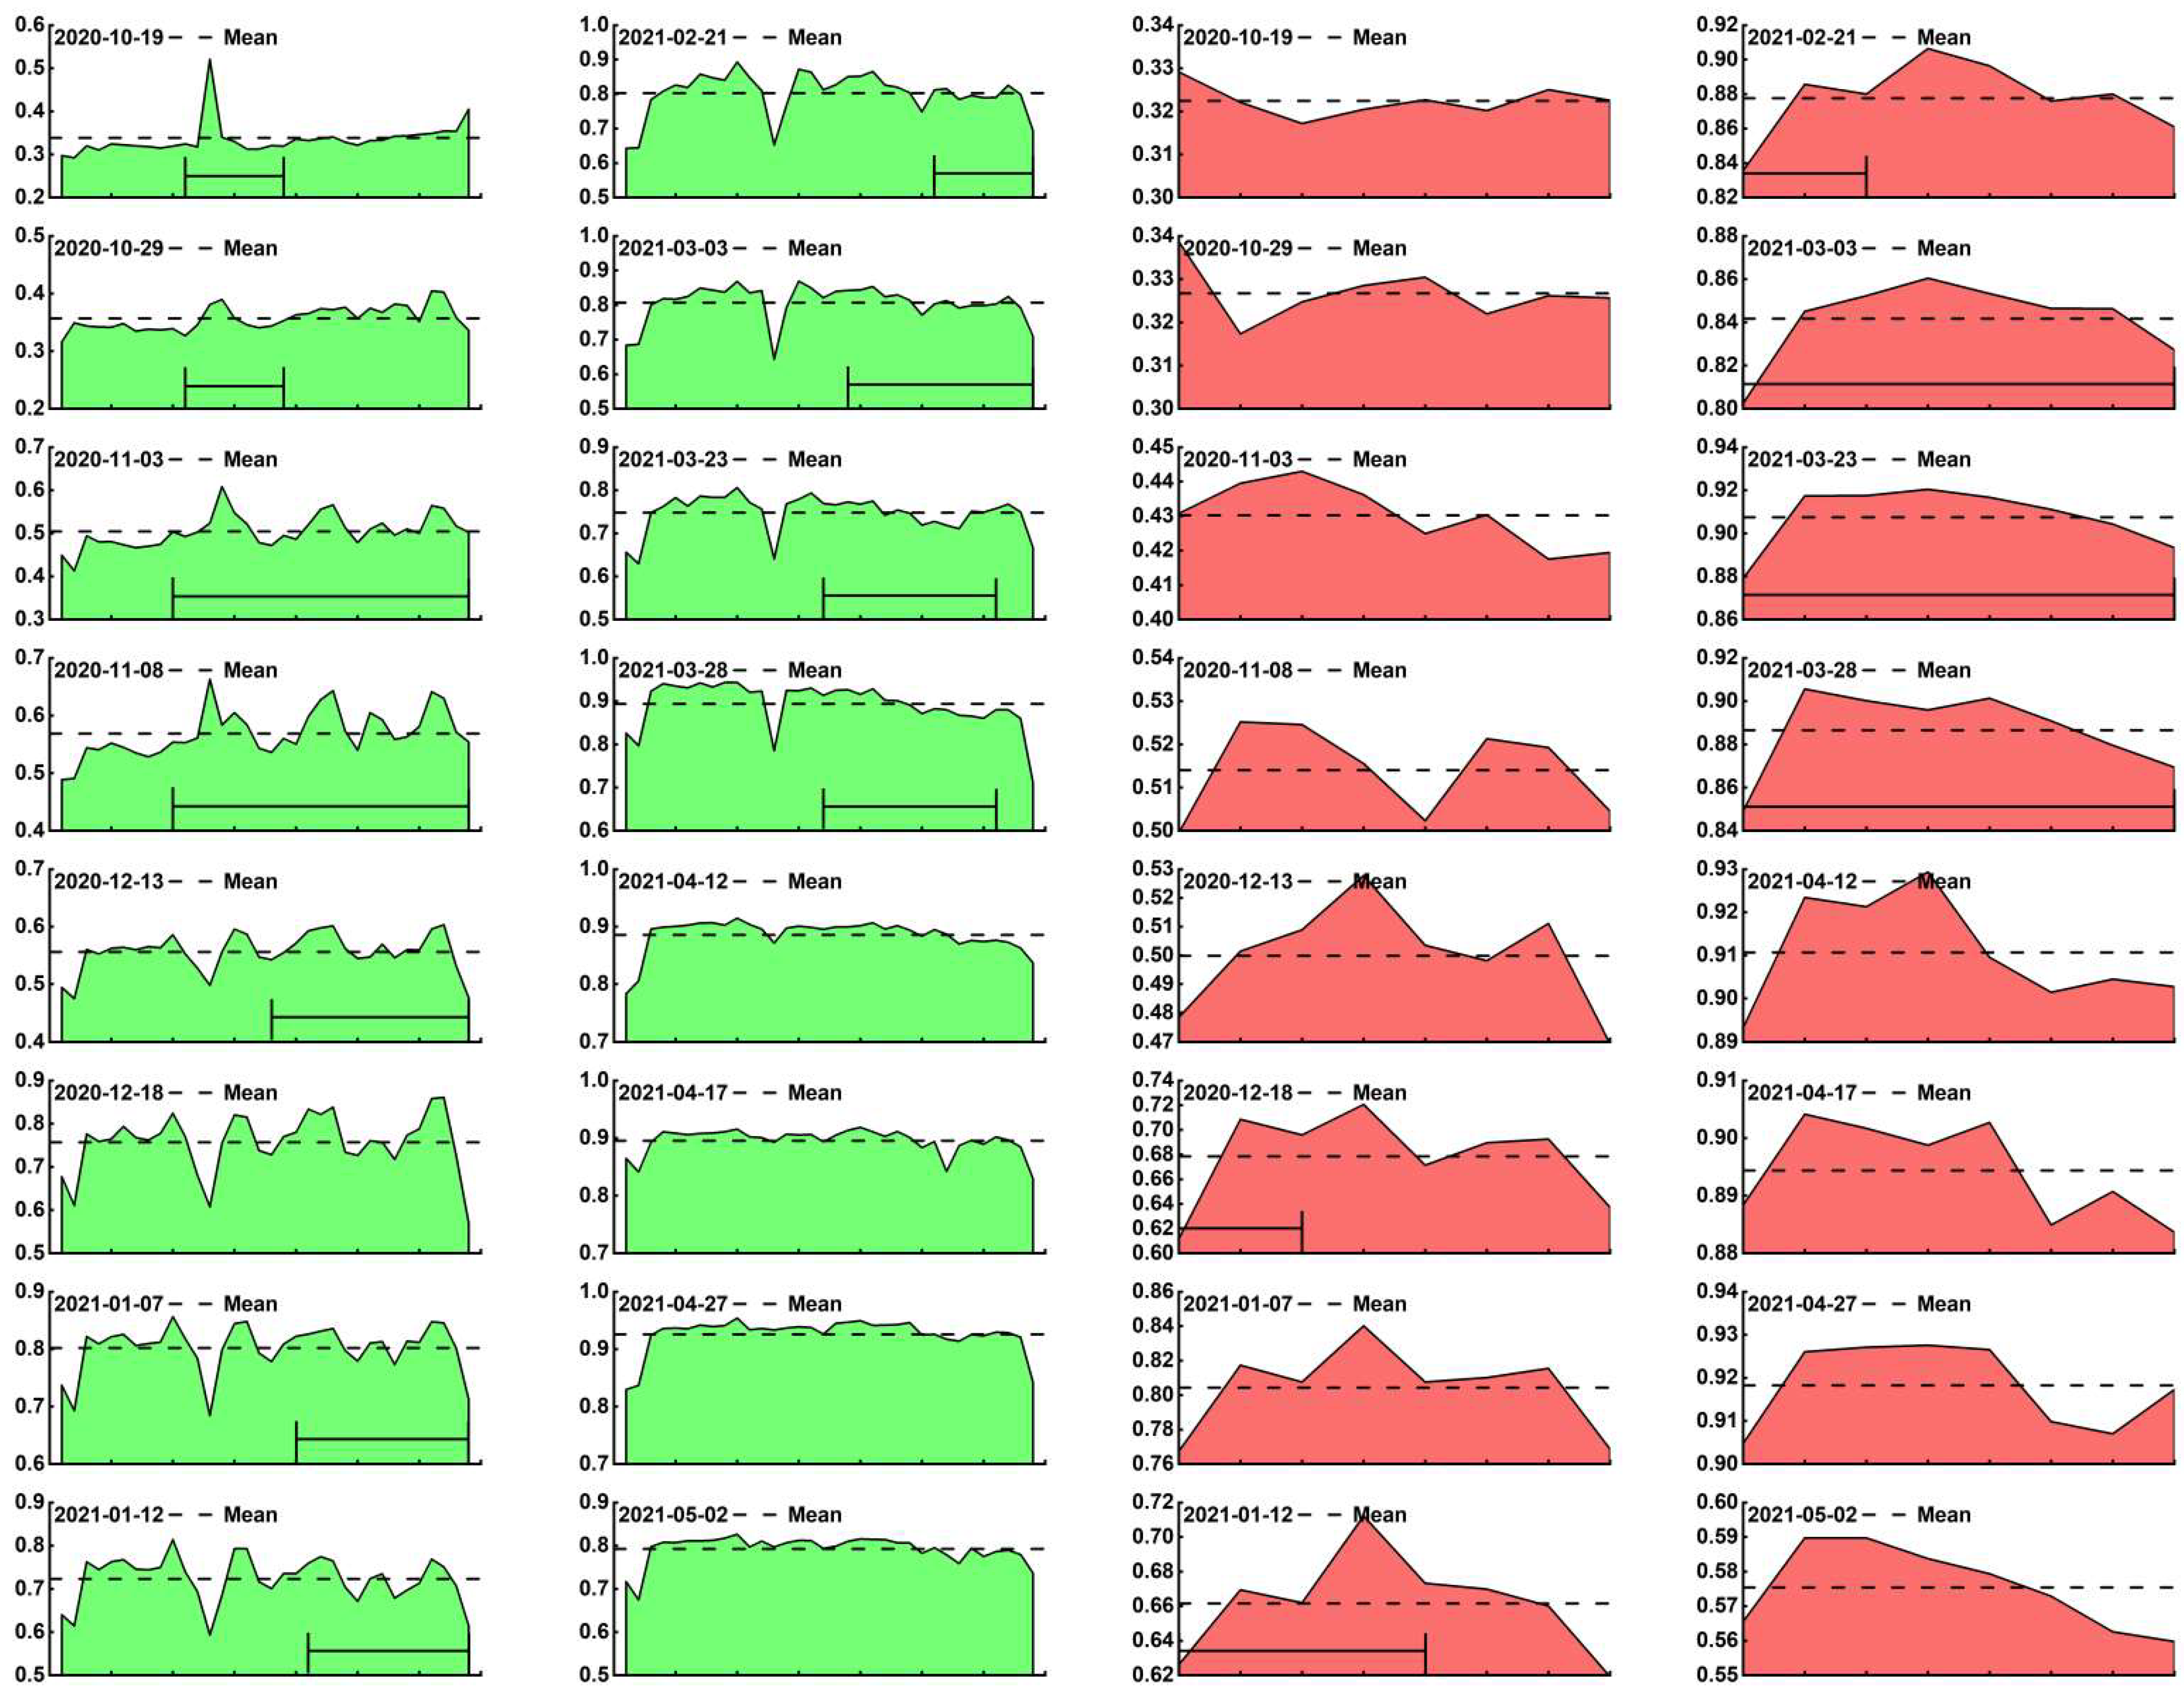
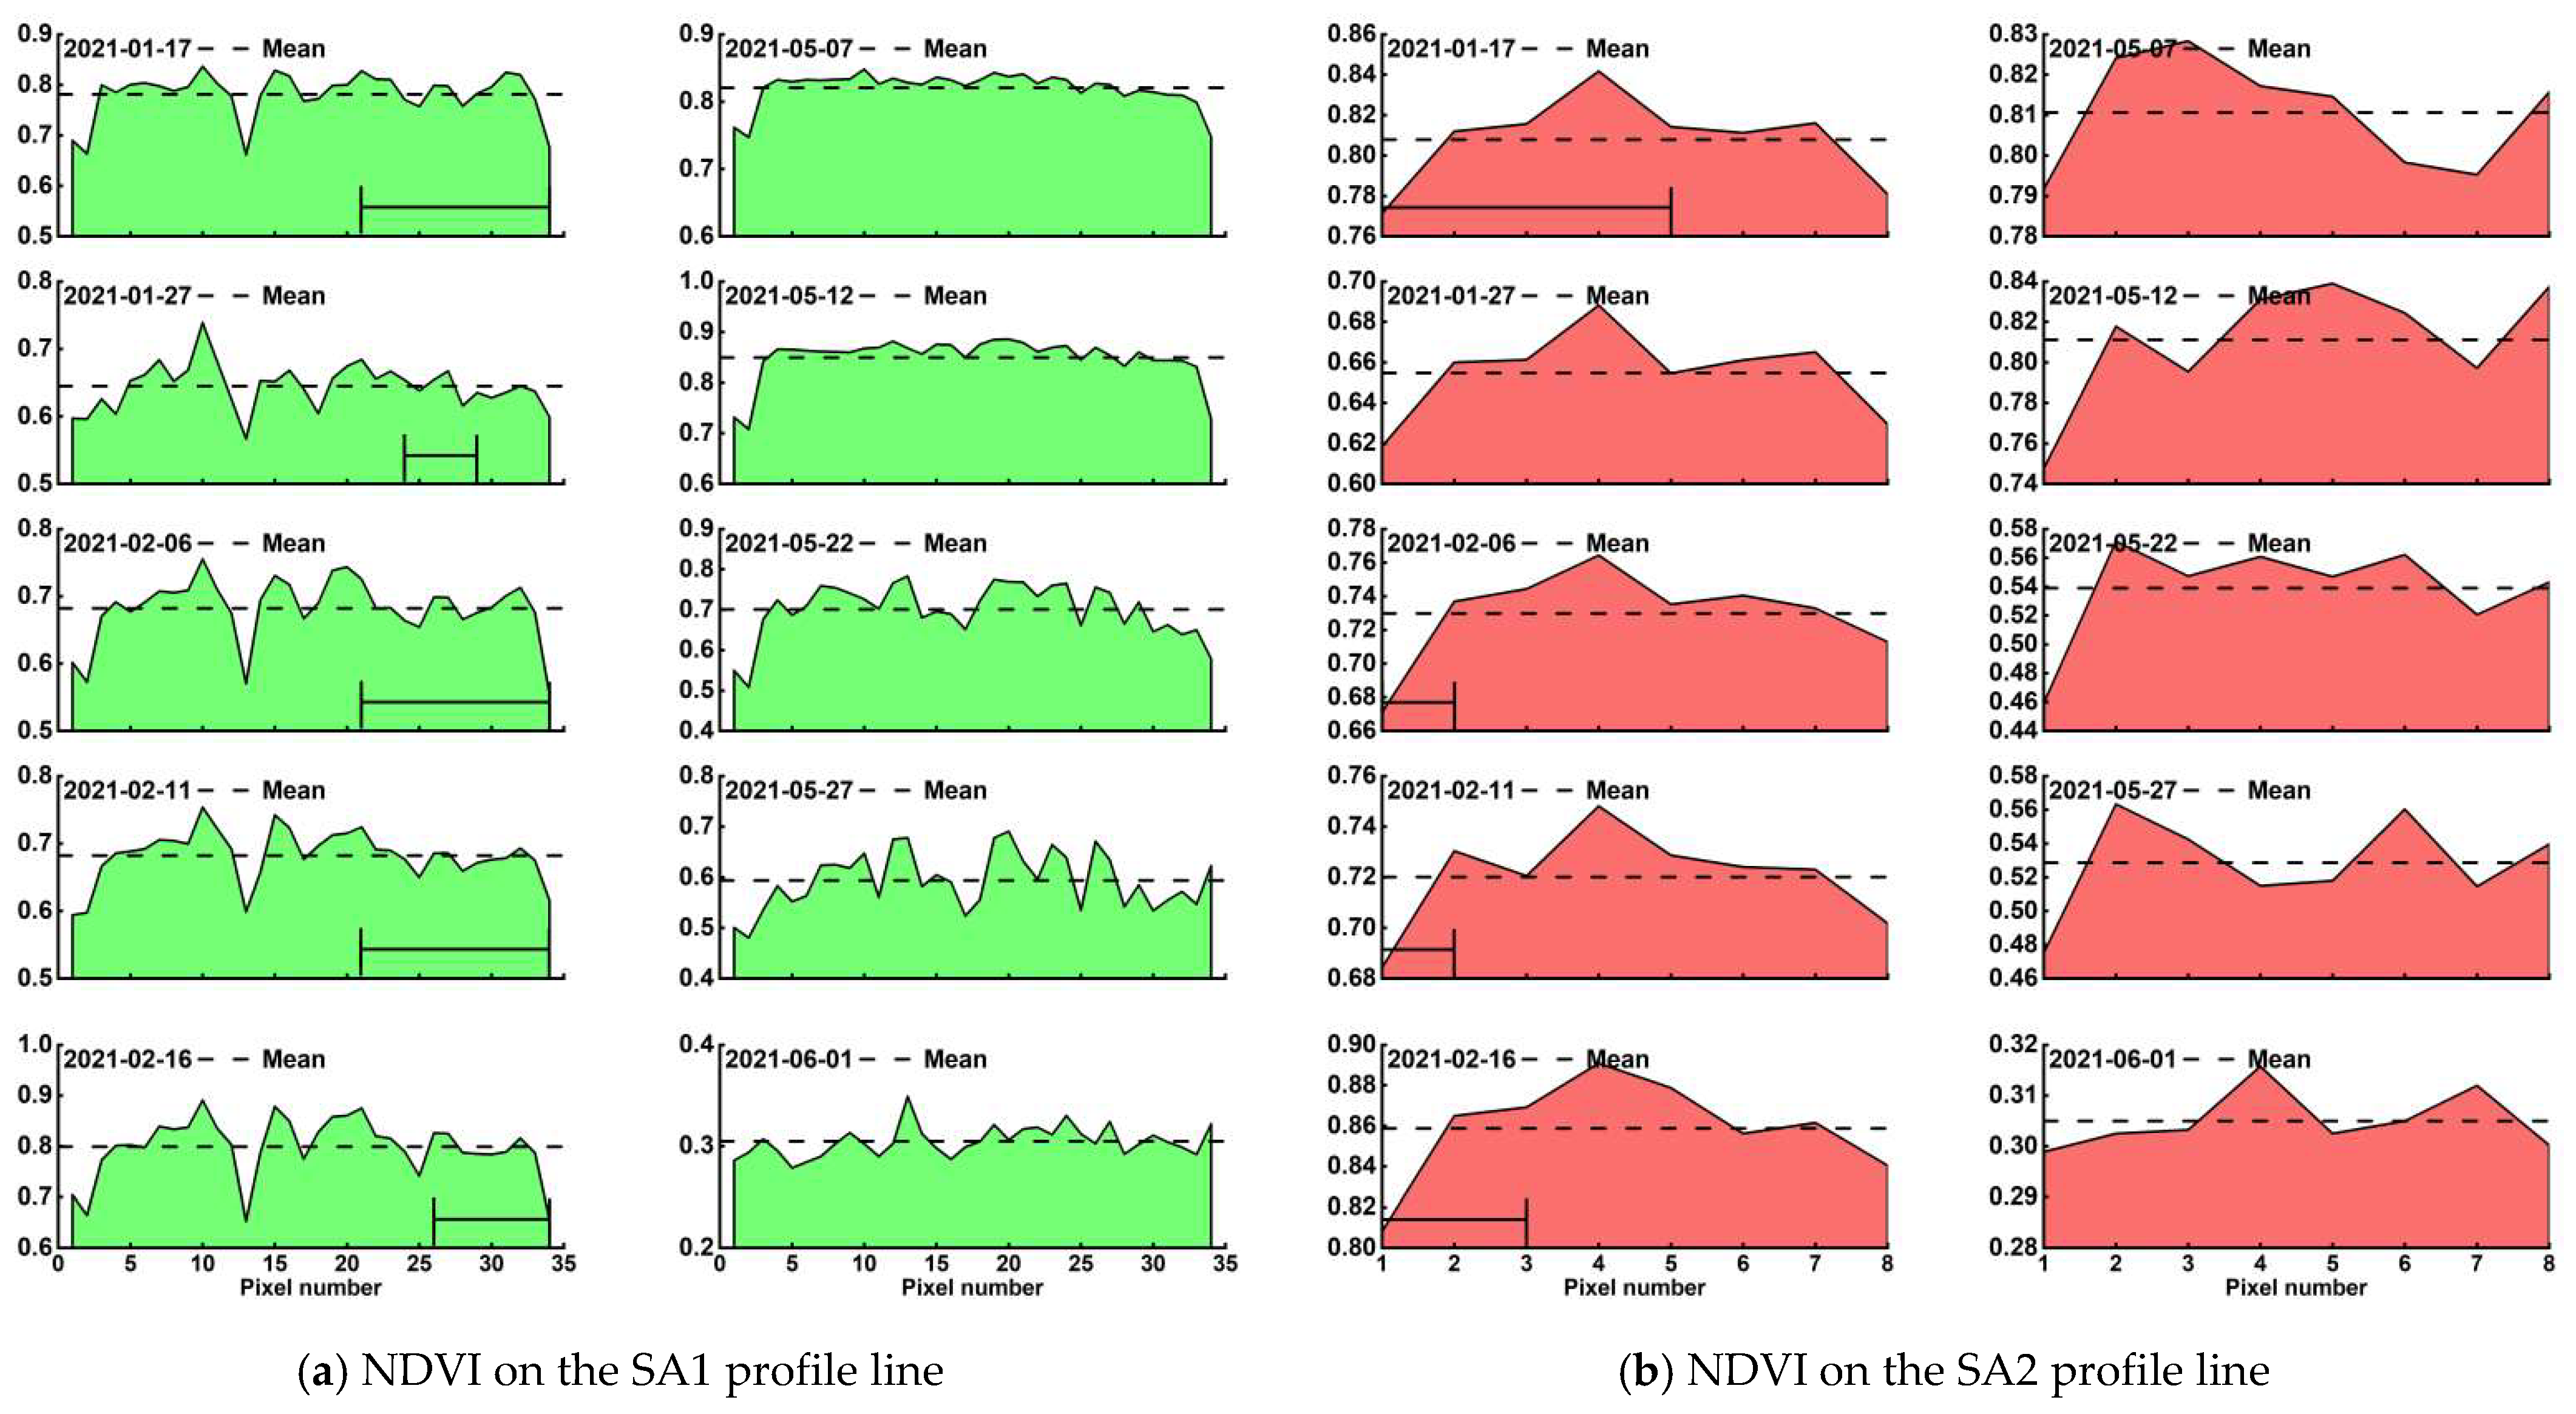
Figure 6.
Difference in length of growing season between SAs and CKs. (a1) Growing seasons of winter wheat in SA1 and CK1 based on NDVI division; (a2) Growing seasons of winter wheat in SA1 and CK1 based on RENDVI division; (a3) Growing seasons of winter wheat in SA1 and CK1 based on NDRE1 division; (a4) Growing seasons of winter wheat in SA1 and CK1 based on NDRE2 division; (a5) Growing seasons of winter wheat in SA1 and CK1 based on MREDVI division; (b1) Growing seasons of winter wheat in SA2 and CK2 based on NDVI division; (b2) Growing seasons of winter wheat in SA2 and CK2 based on RENDVI division; (b3) Growing seasons of winter wheat in SA2 and CK2 based on NDRE1 division; (b4) Growing seasons of winter wheat in SA2 and CK2 based on NDRE2 division; (b5) Growing seasons of winter wheat in SA2 and CK2 based on MREDVI division. Notes: LOS1: Length of growing season 1; OWS: Over wintering season; LOS2: Length of growing season 2; EOS: End of growing season. NDVI: Normalized difference vegetation index; RENDVI: Red edge normalized difference vegetation index; NDRE1: Normalized difference red edge1; NDRE2: Normalized difference red edge2; MREDVI: Modified red edge difference vegetation index; SA1: Subsidence area 1; CK1: Check area 1; SA2: Subsidence area 2; CK2: Check area 2.
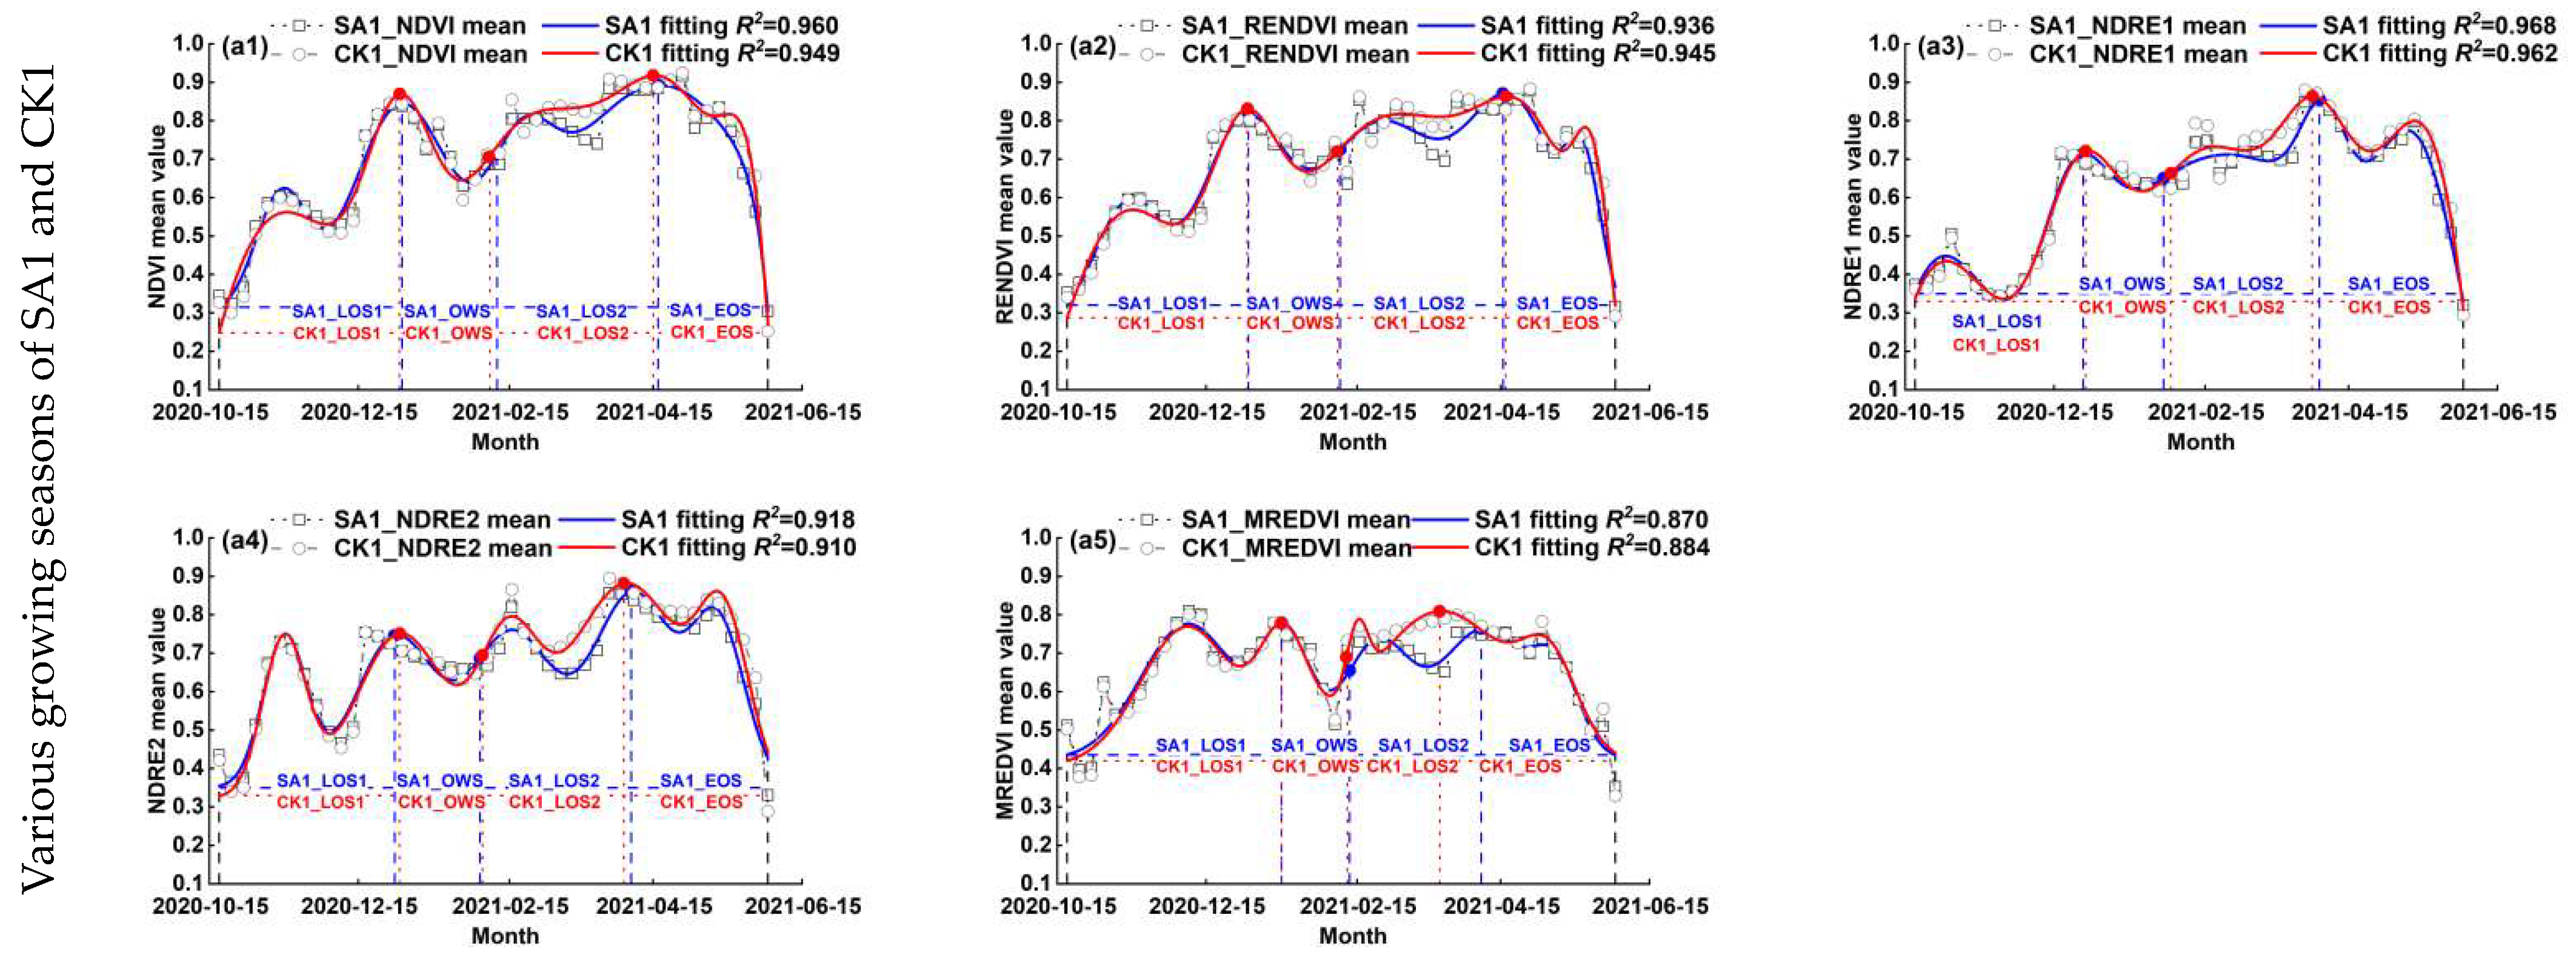
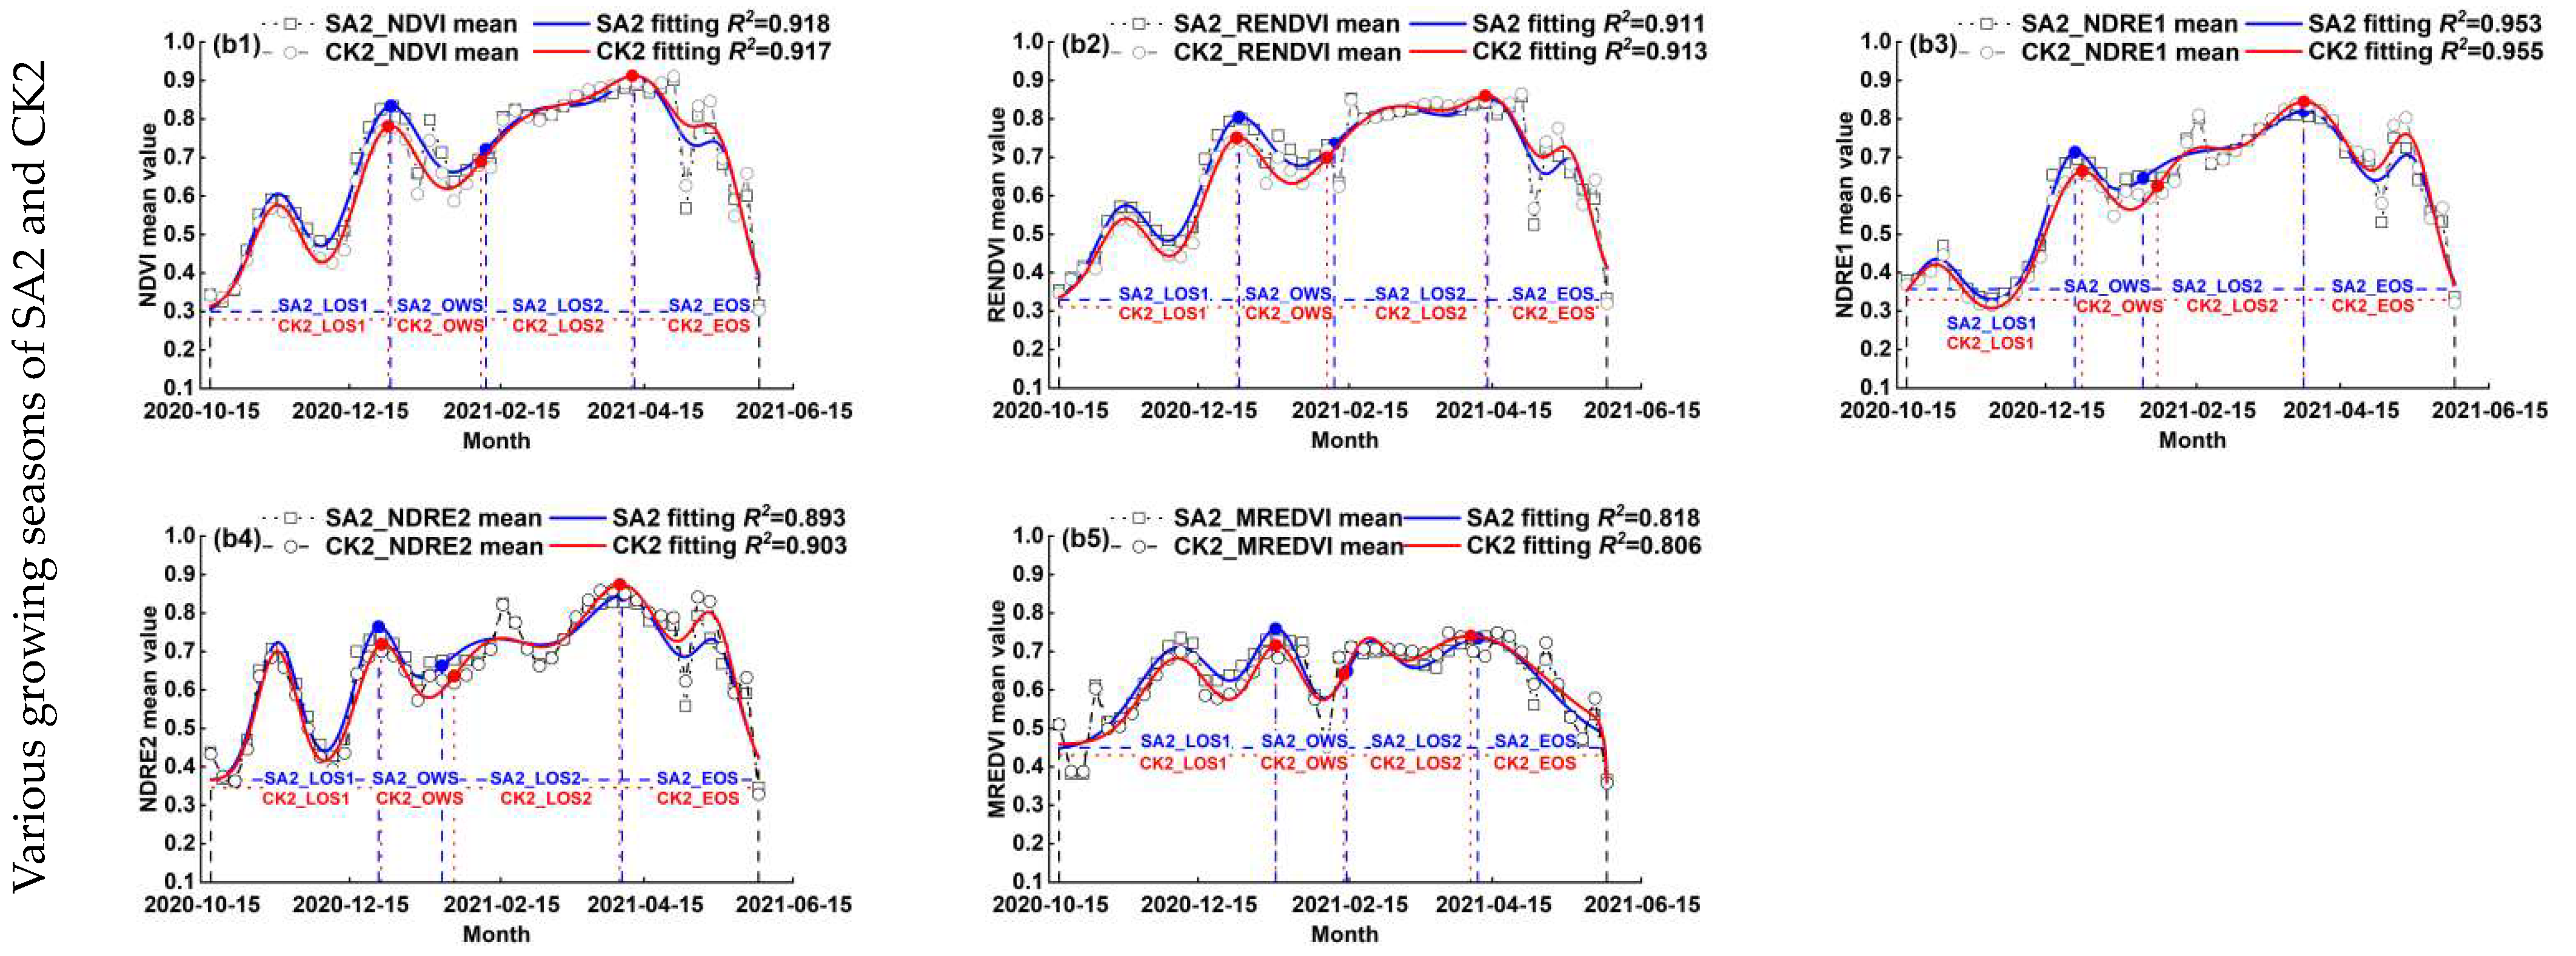
Figure 7.
Growth rates for each growth period corresponding to different vegetation indices in SA1 and CK1. Notes: LOS1: Length of growing season 1; OWS: Over wintering season; LOS2: Length of growing season 2; EOS: End of growing season. NDVI: Normalized difference vegetation index; RENDVI: Red edge normalized difference vegetation index; NDRE1: Normalized difference red edge1; NDRE2: Normalized difference red edge2; MREDVI: Modified red edge difference vegetation index; SA1: Subsidence area 1; CK1: Check area 1.
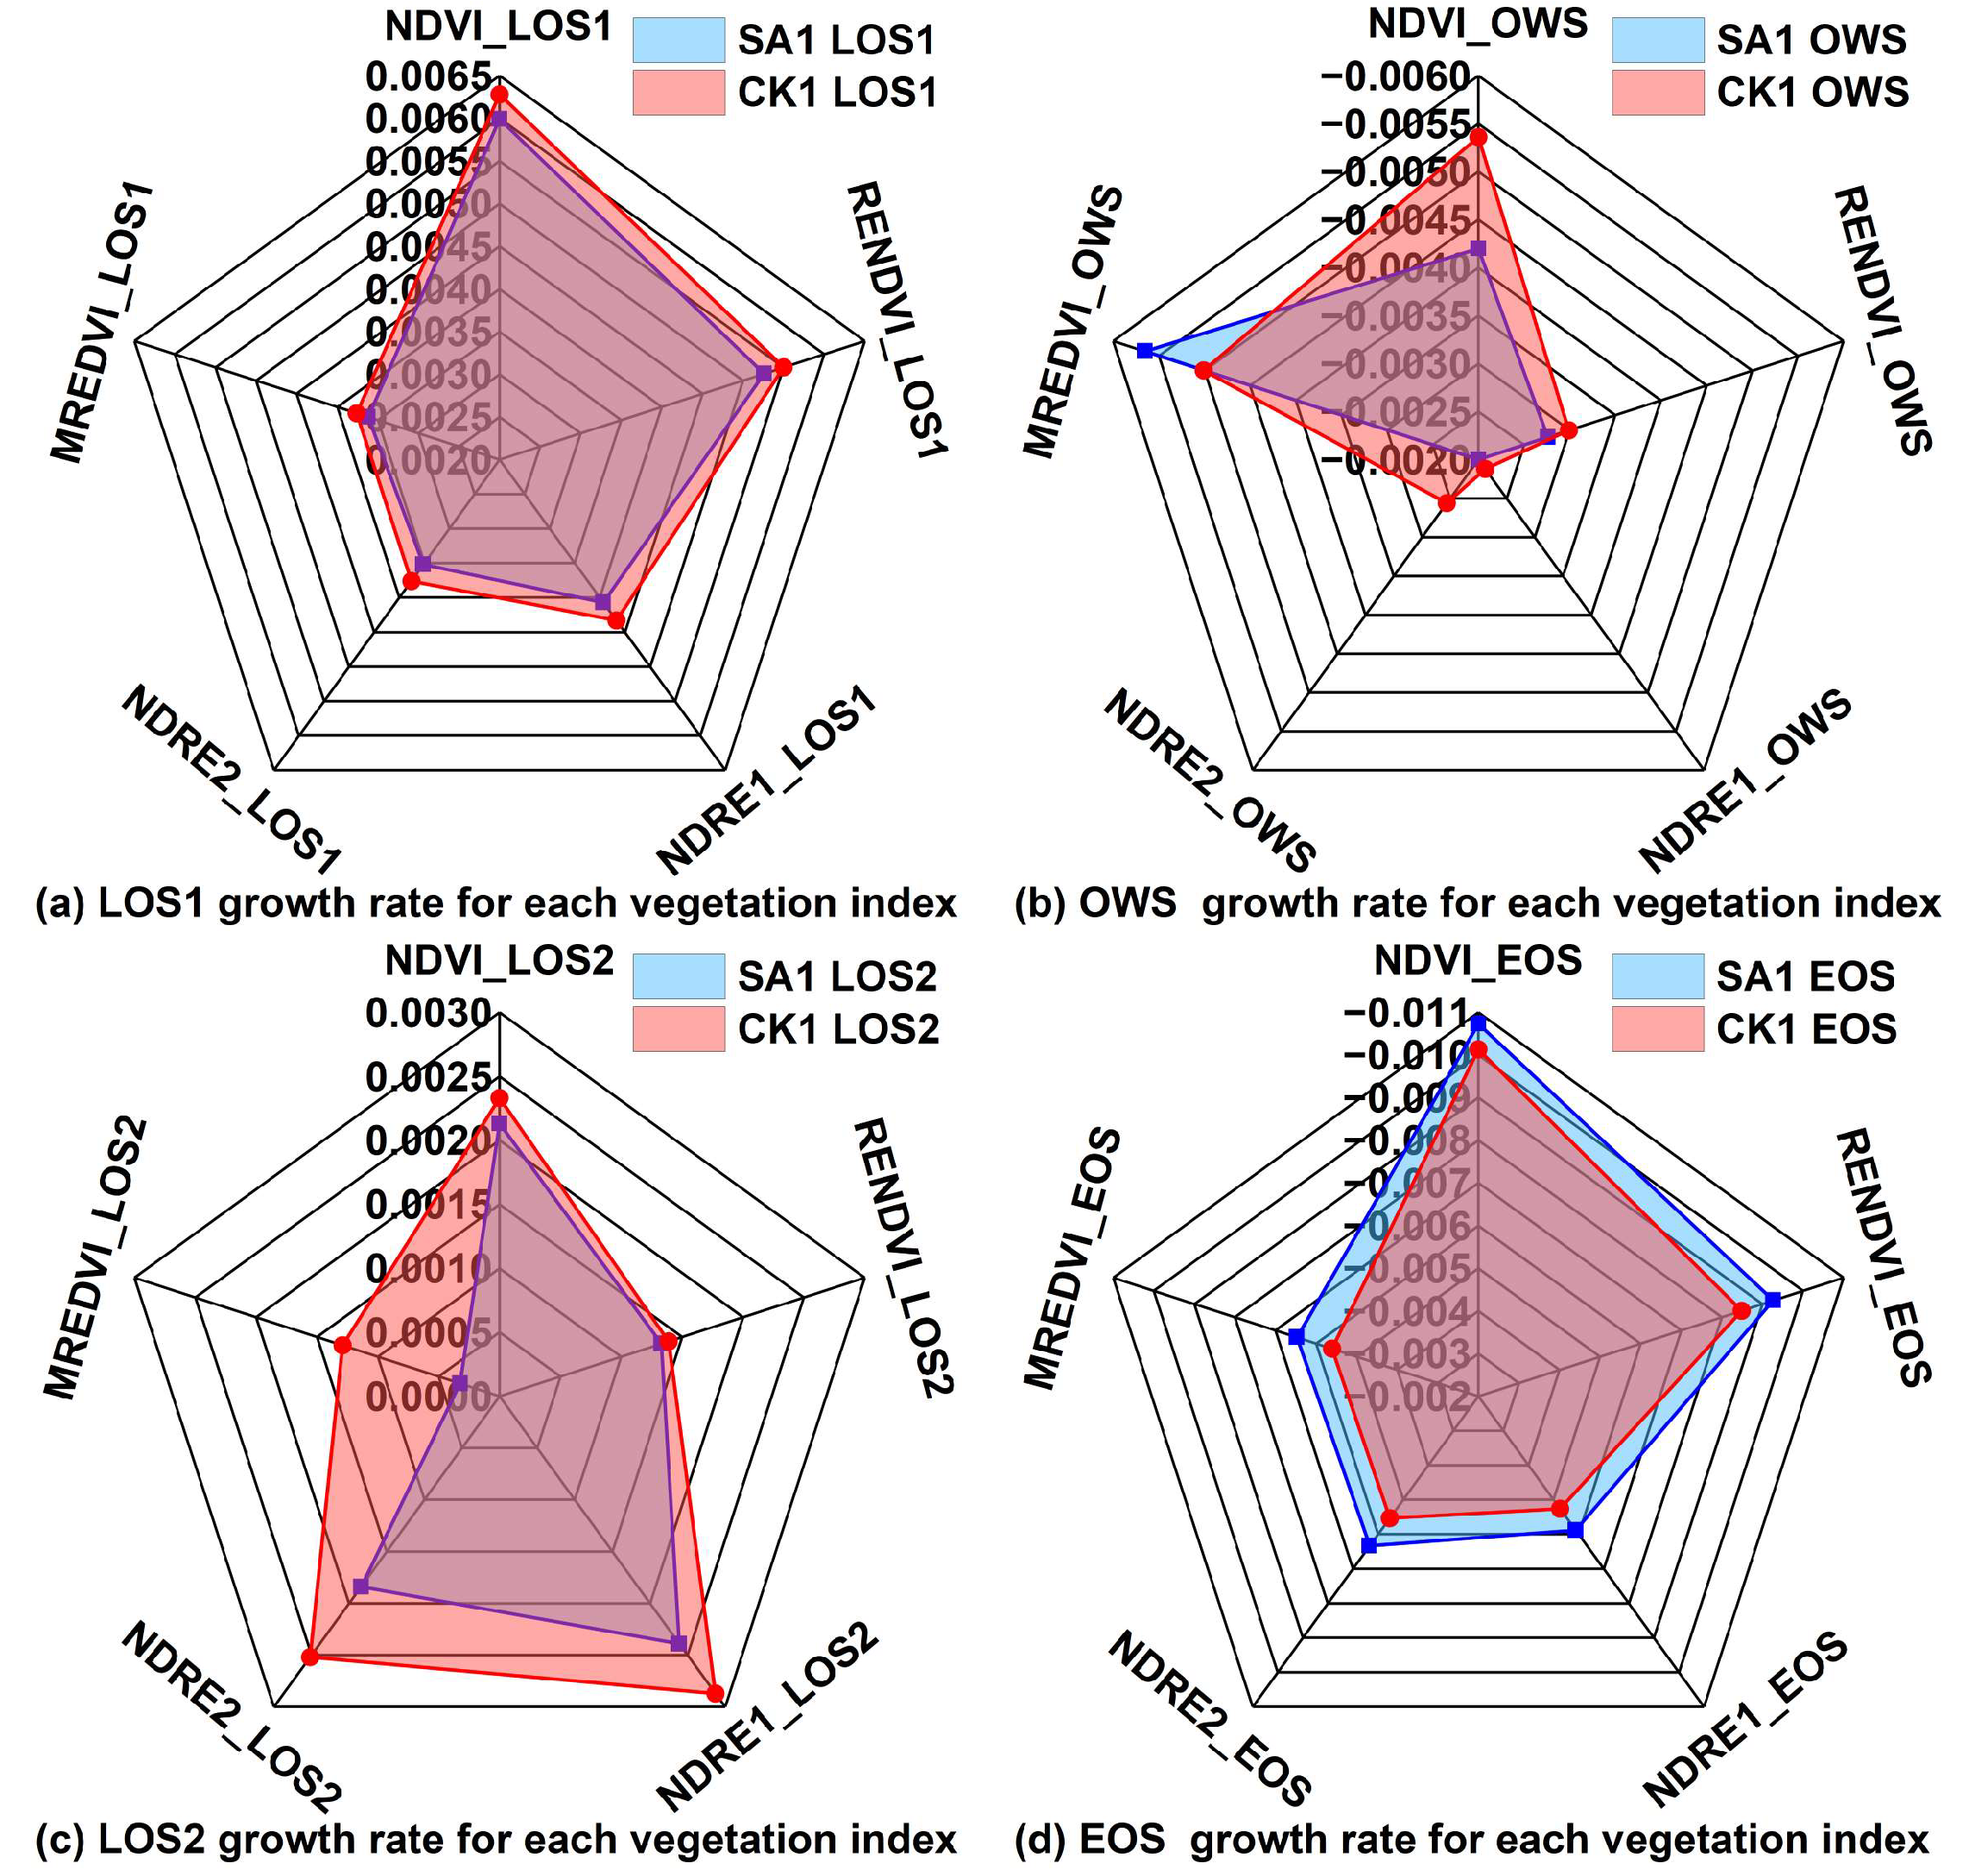
Figure 8.
Growth rates for each growth period corresponding to different vegetation indices in SA2 and CK2. Notes: LOS1: Length of growing season 1; OWS: Over wintering season; LOS2: Length of growing season 2; EOS: End of growing season. NDVI: Normalized difference vegetation index; RENDVI: Red edge normalized difference vegetation index; NDRE1: Normalized difference red edge1; NDRE2: Normalized difference red edge2; MREDVI: Modified red edge difference vegetation index; SA2: Subsidence area 2; CK2: Check area 2.
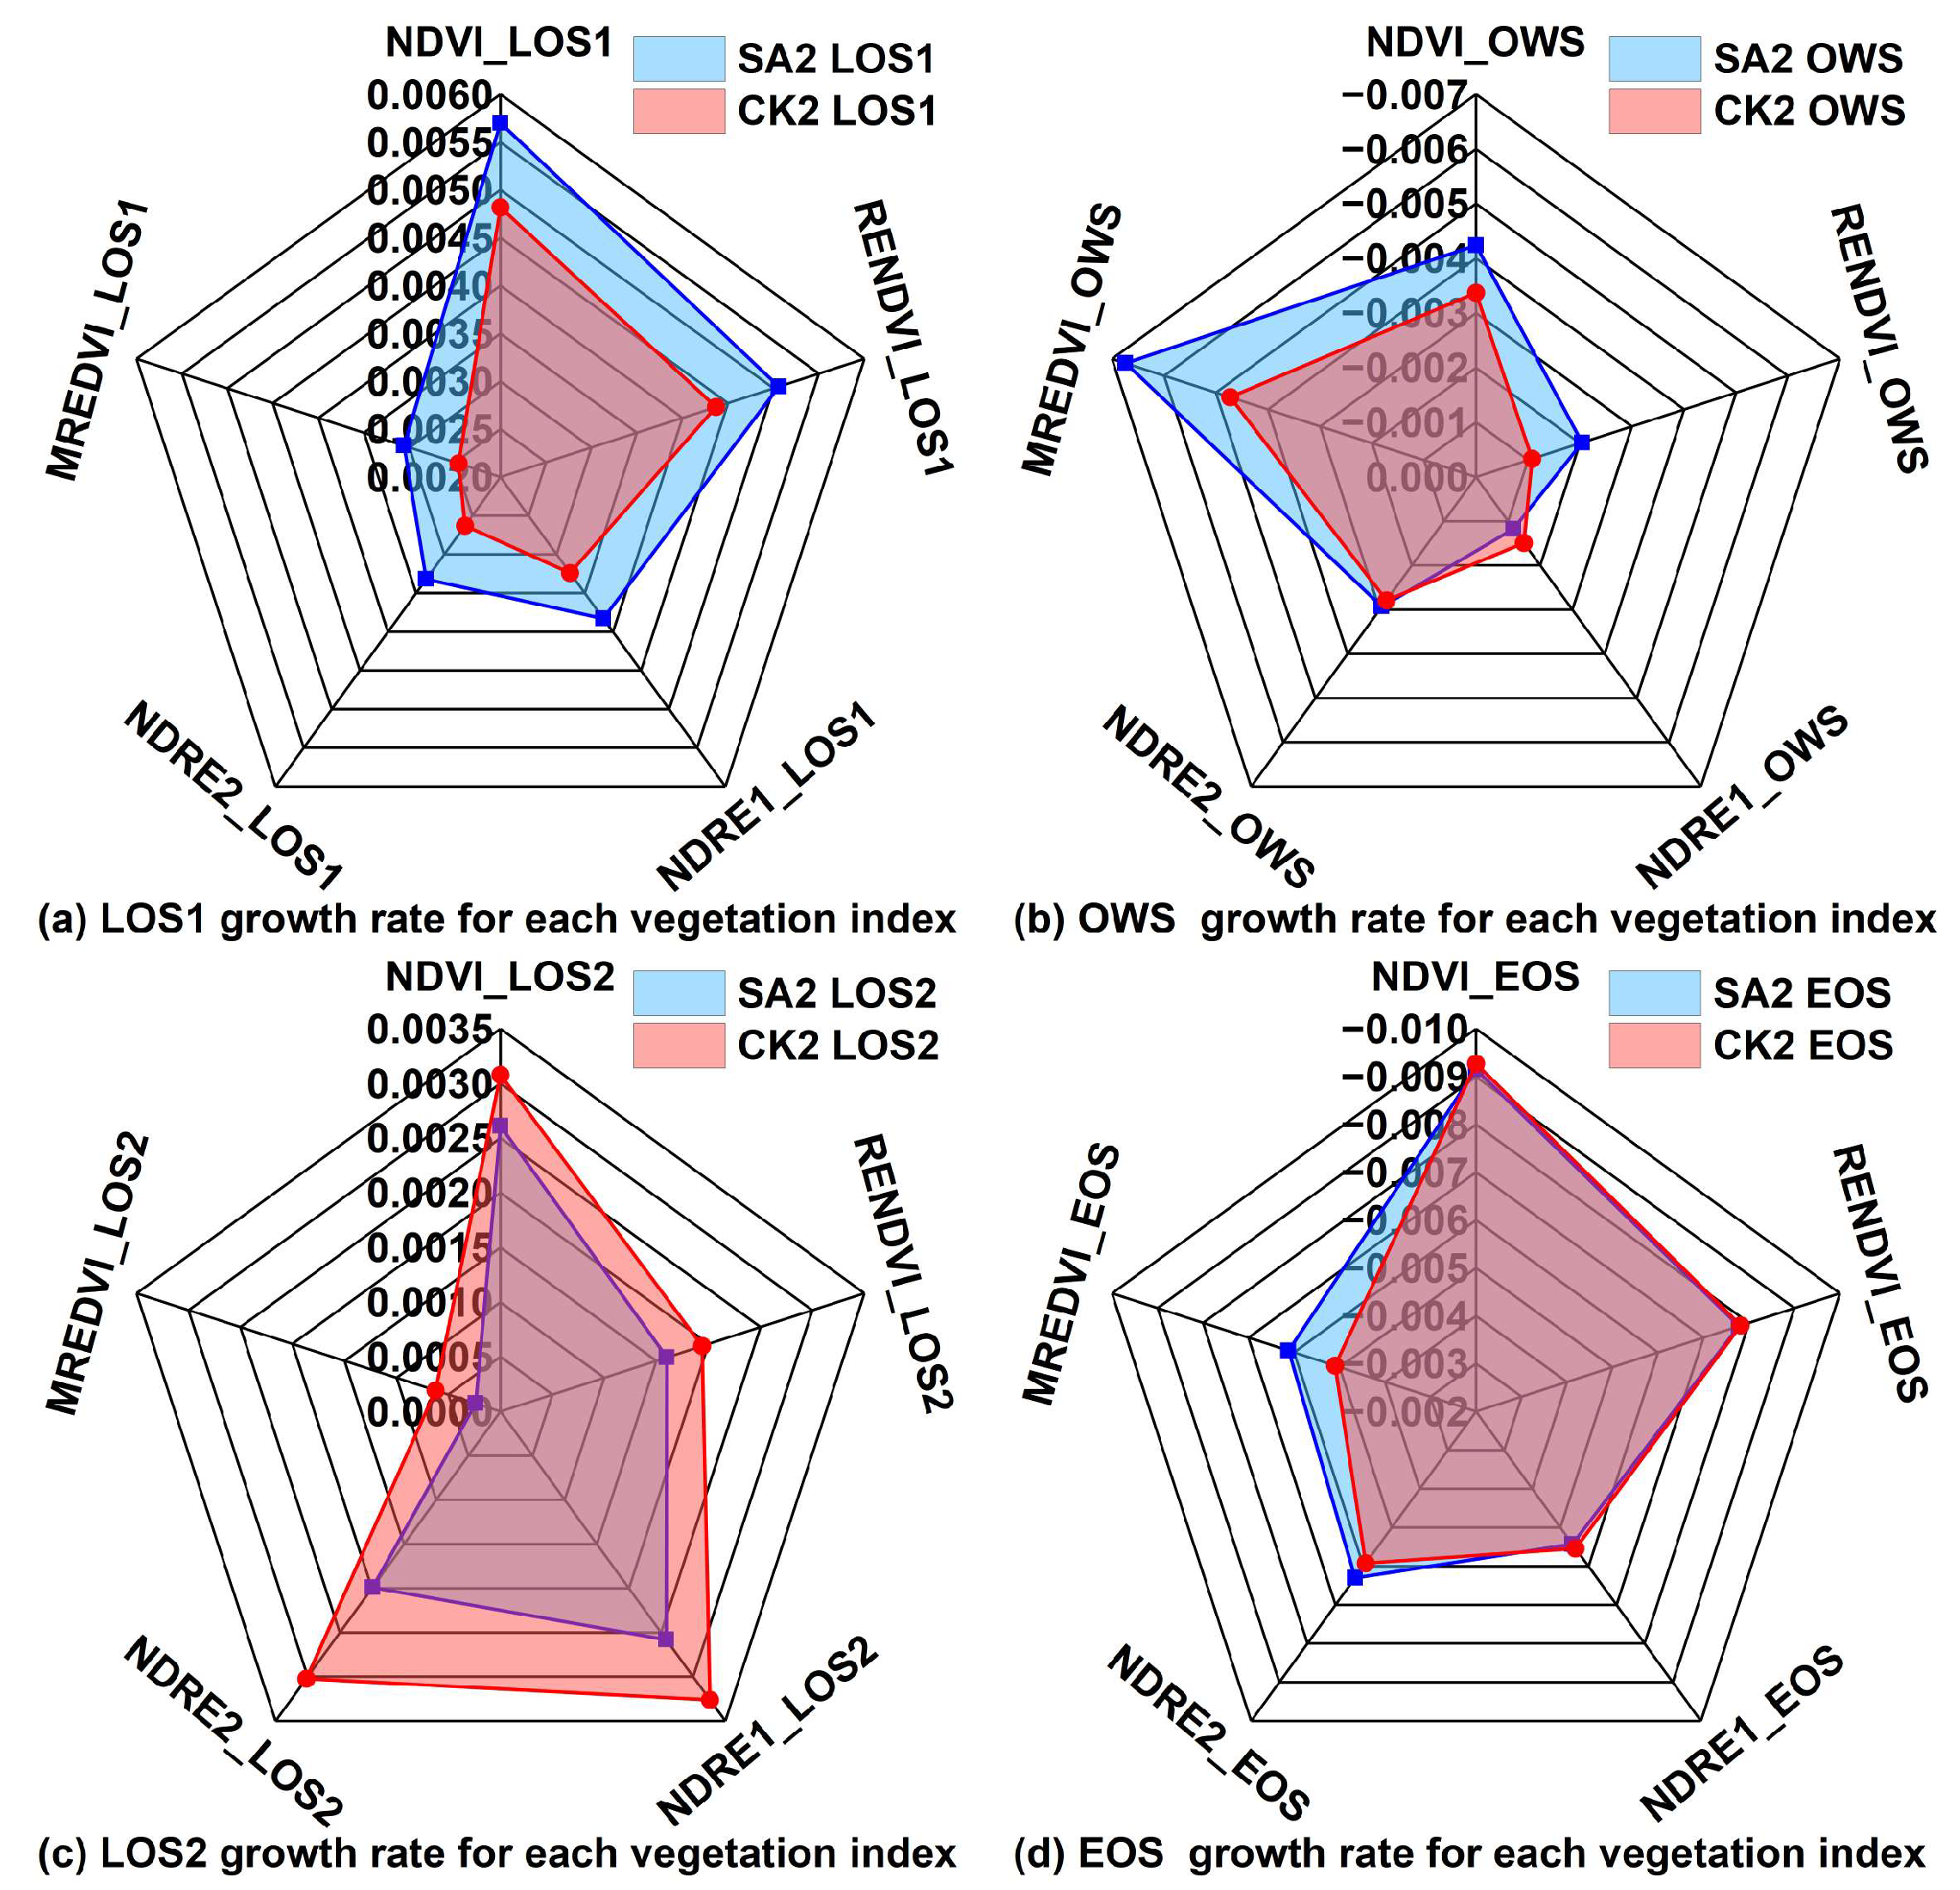
Figure 9.
Correlation analysis of indicators with SACHI in SAs and CKs. Notes: * indicates significant (p < 0.05); ** indicates highly significant (p < 0.01); SA1: Subsidence area 1; CK1: Check area 1; SA2: Subsidence area 2; CK2: Check area 2; NDRE2: Normalized difference red edge2; CIre: Red edged chlorophyll index; NDMI: Normalized difference moisture index; SI-T: Ratio salinity index; SACHI: Crop health index in subsidence area.
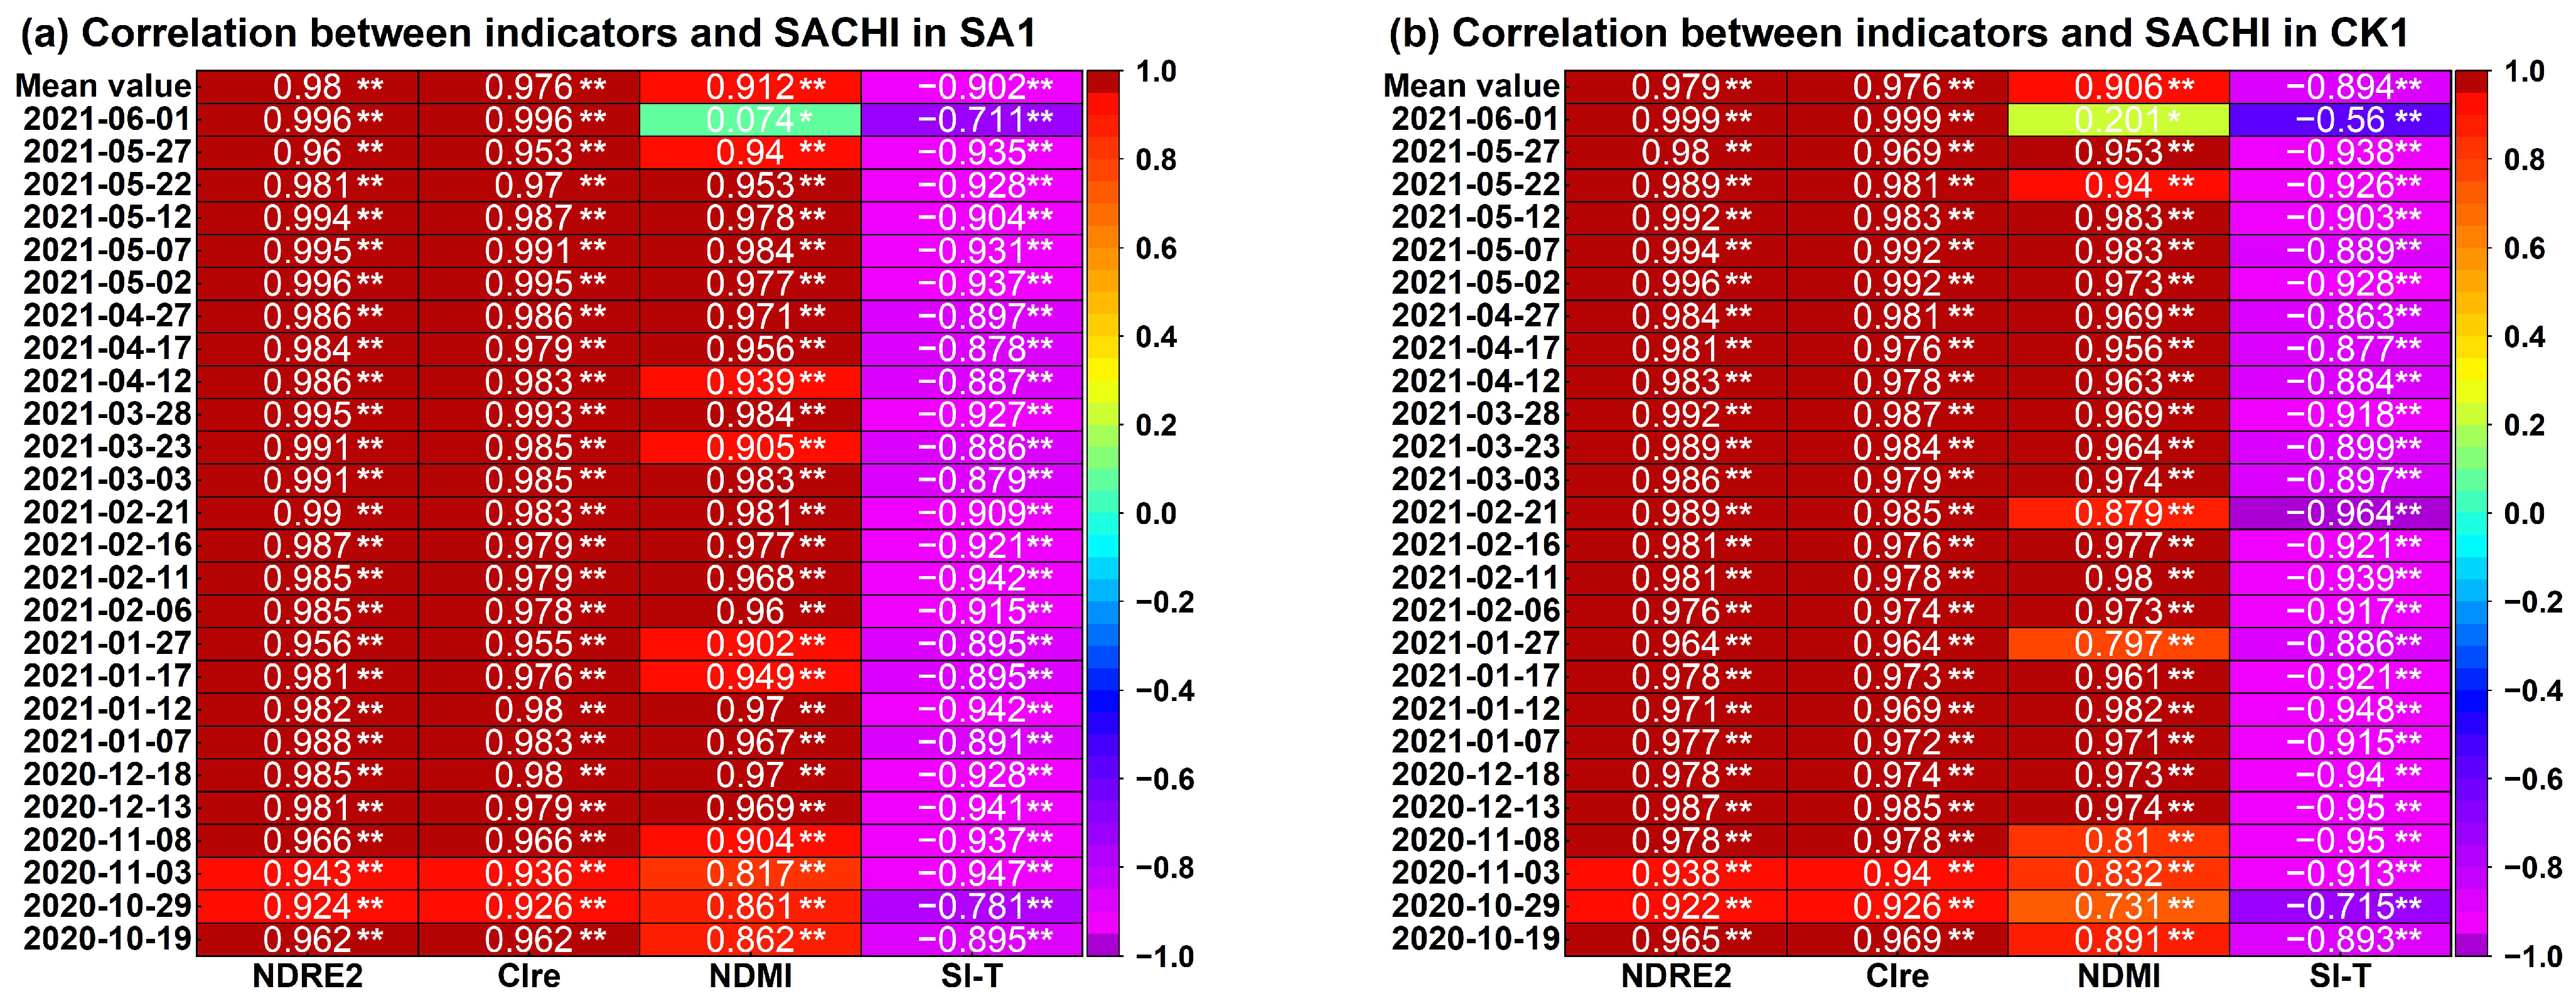
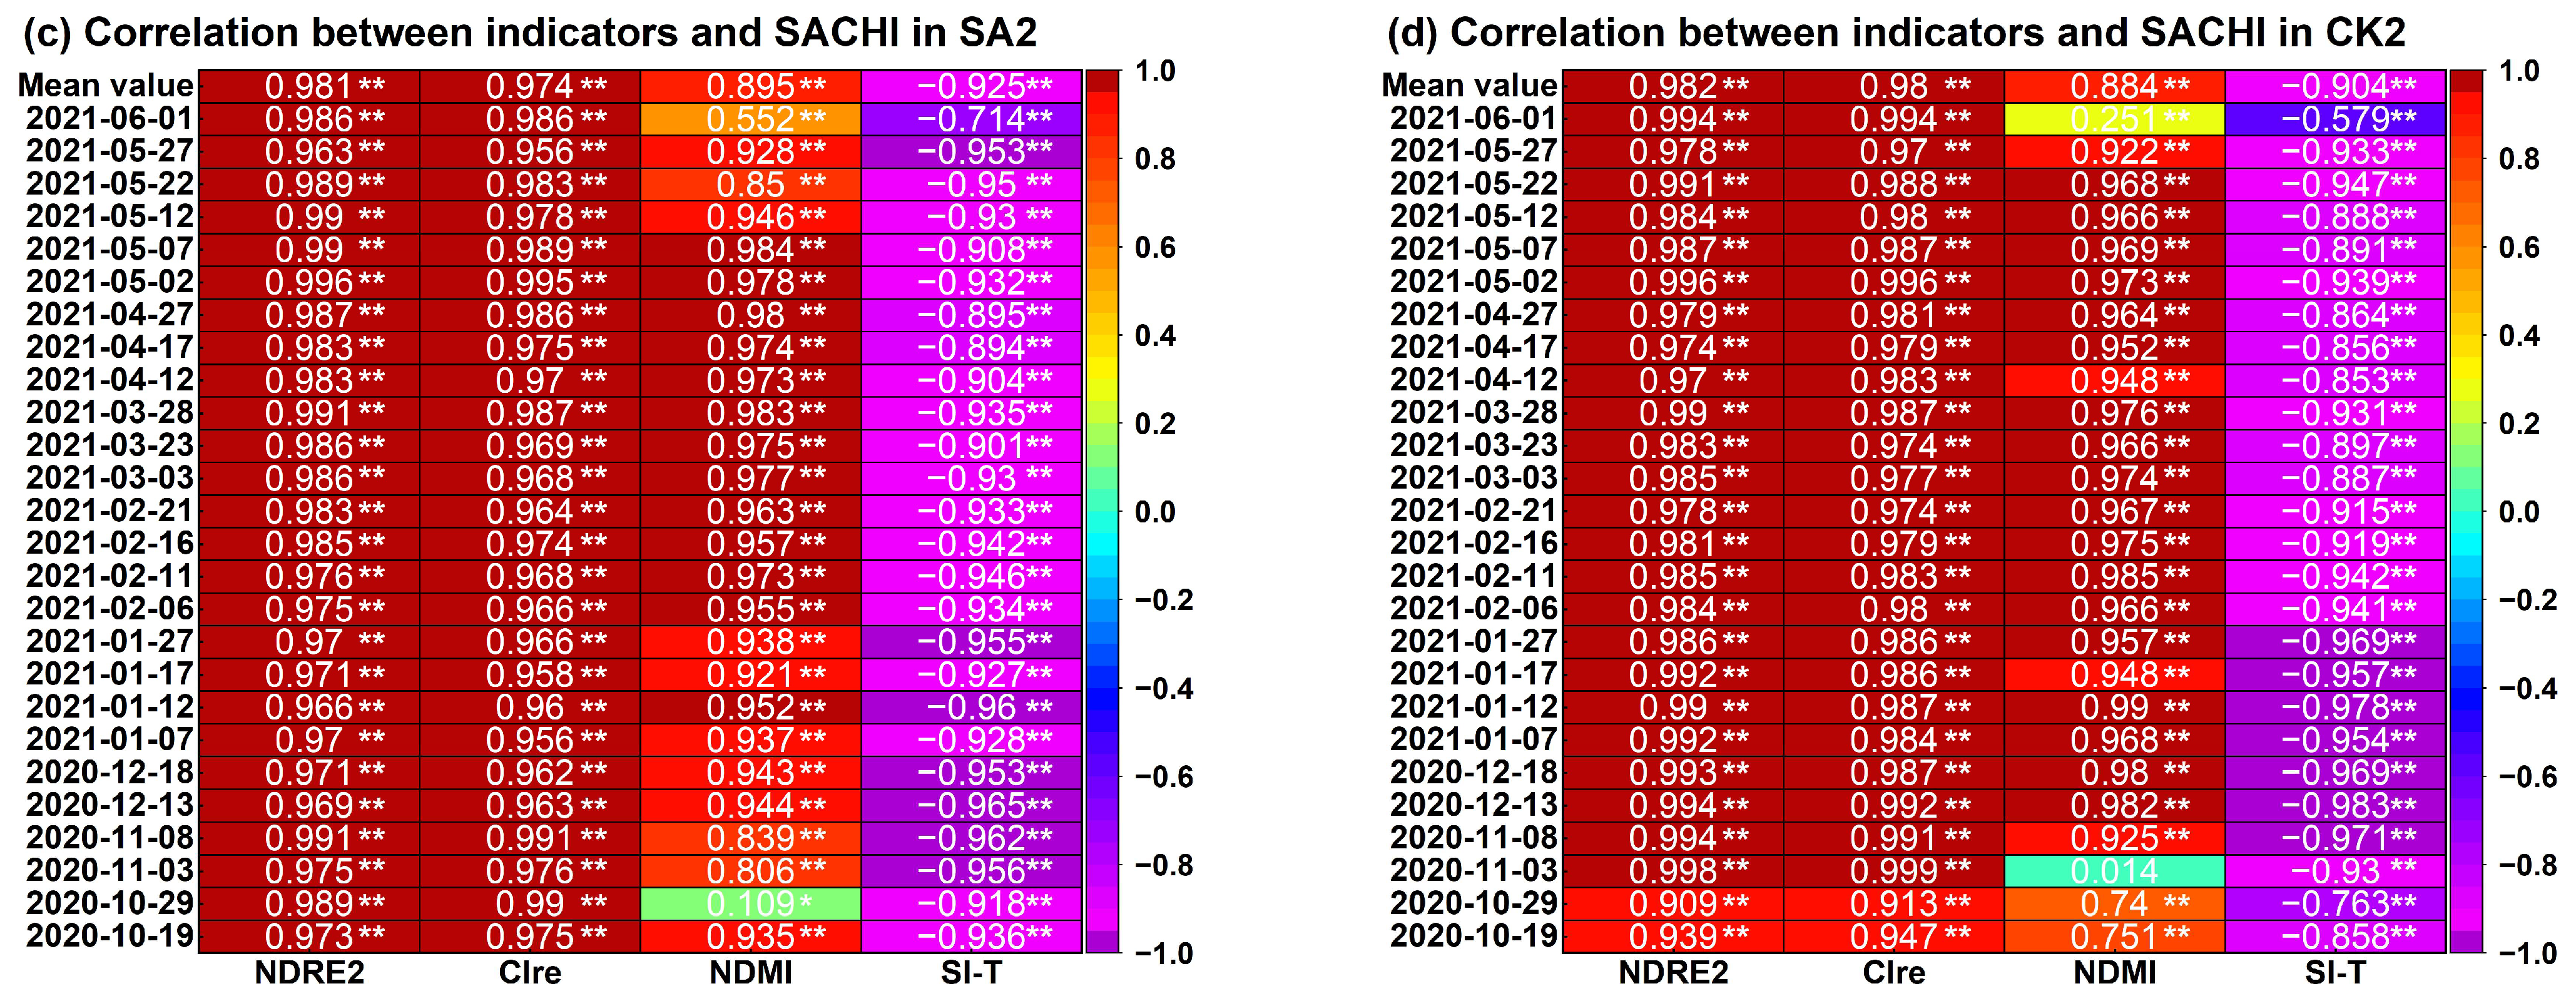
Figure 10.
Time-series profile lines analysis of SACHI. (a) SACHI on the SA1 profile line; (b) SACHI on the SA2 profile line. Notes: SACHI: Crop health index in subsidence area; SA1: Subsidence area 1; SA2: Subsidence area 2.
Figure 10.
Time-series profile lines analysis of SACHI. (a) SACHI on the SA1 profile line; (b) SACHI on the SA2 profile line. Notes: SACHI: Crop health index in subsidence area; SA1: Subsidence area 1; SA2: Subsidence area 2.
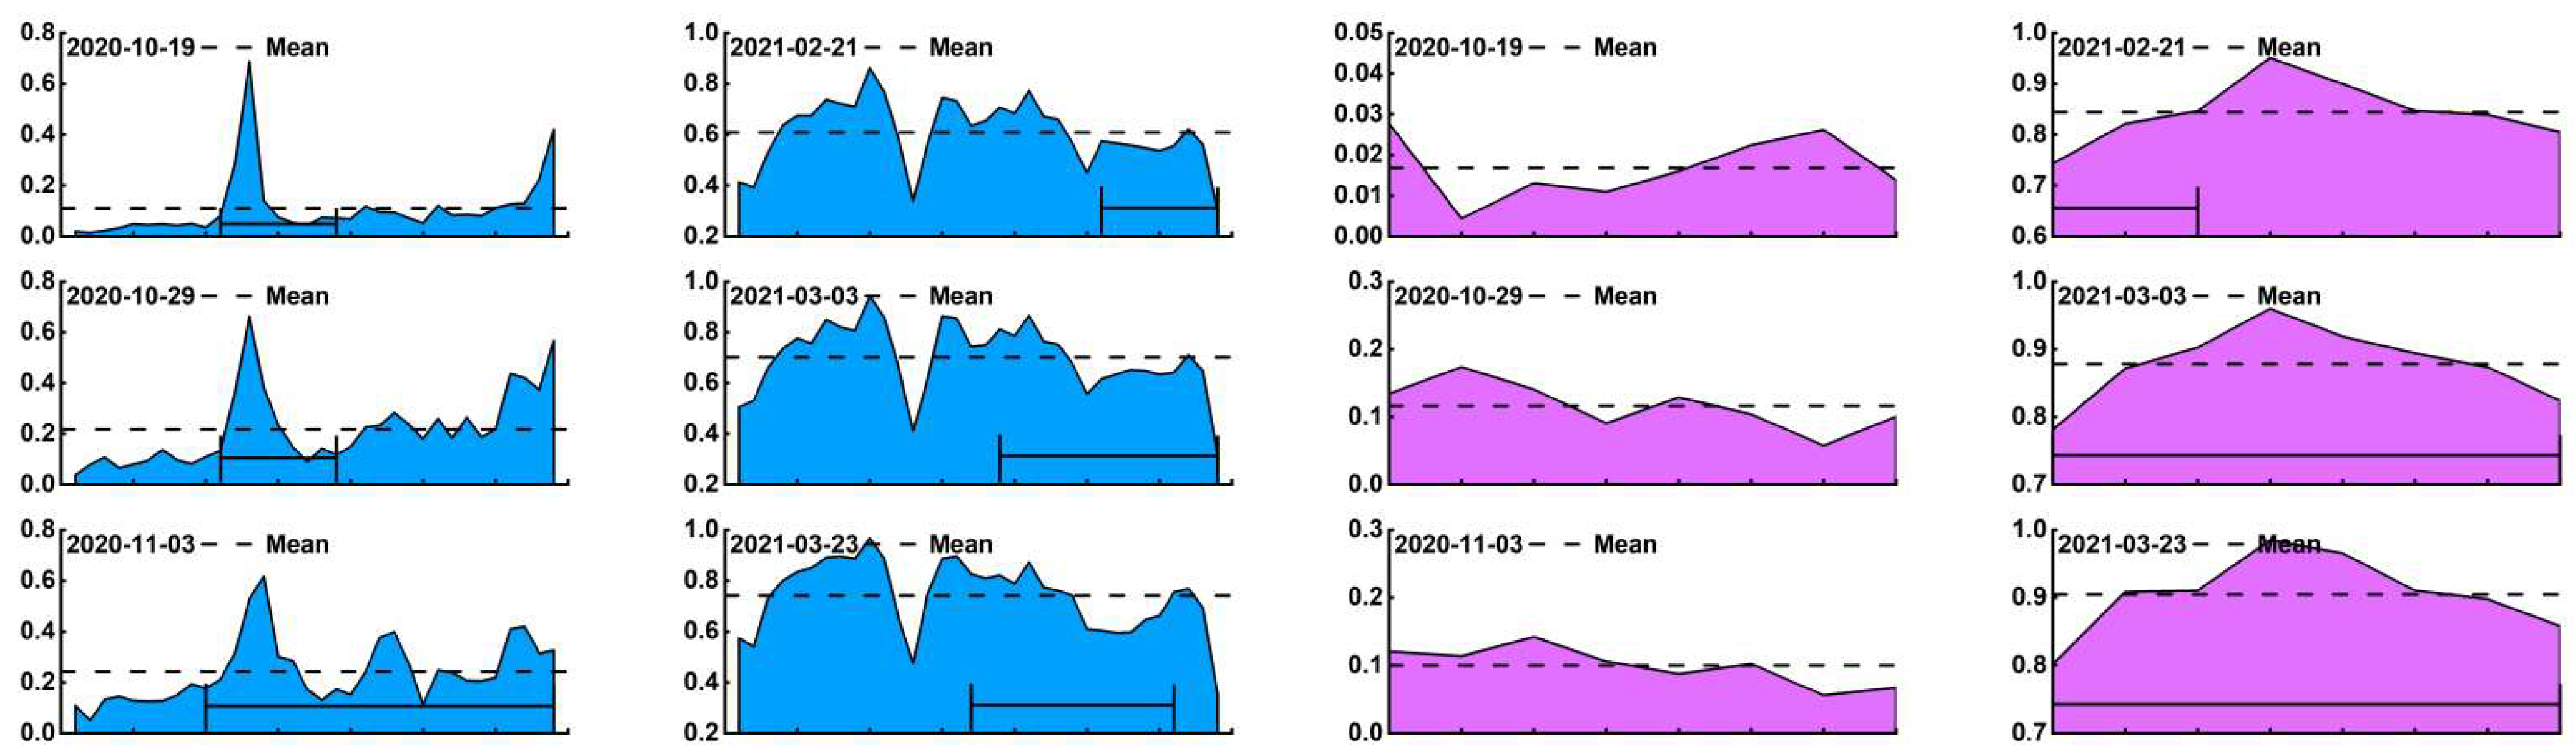
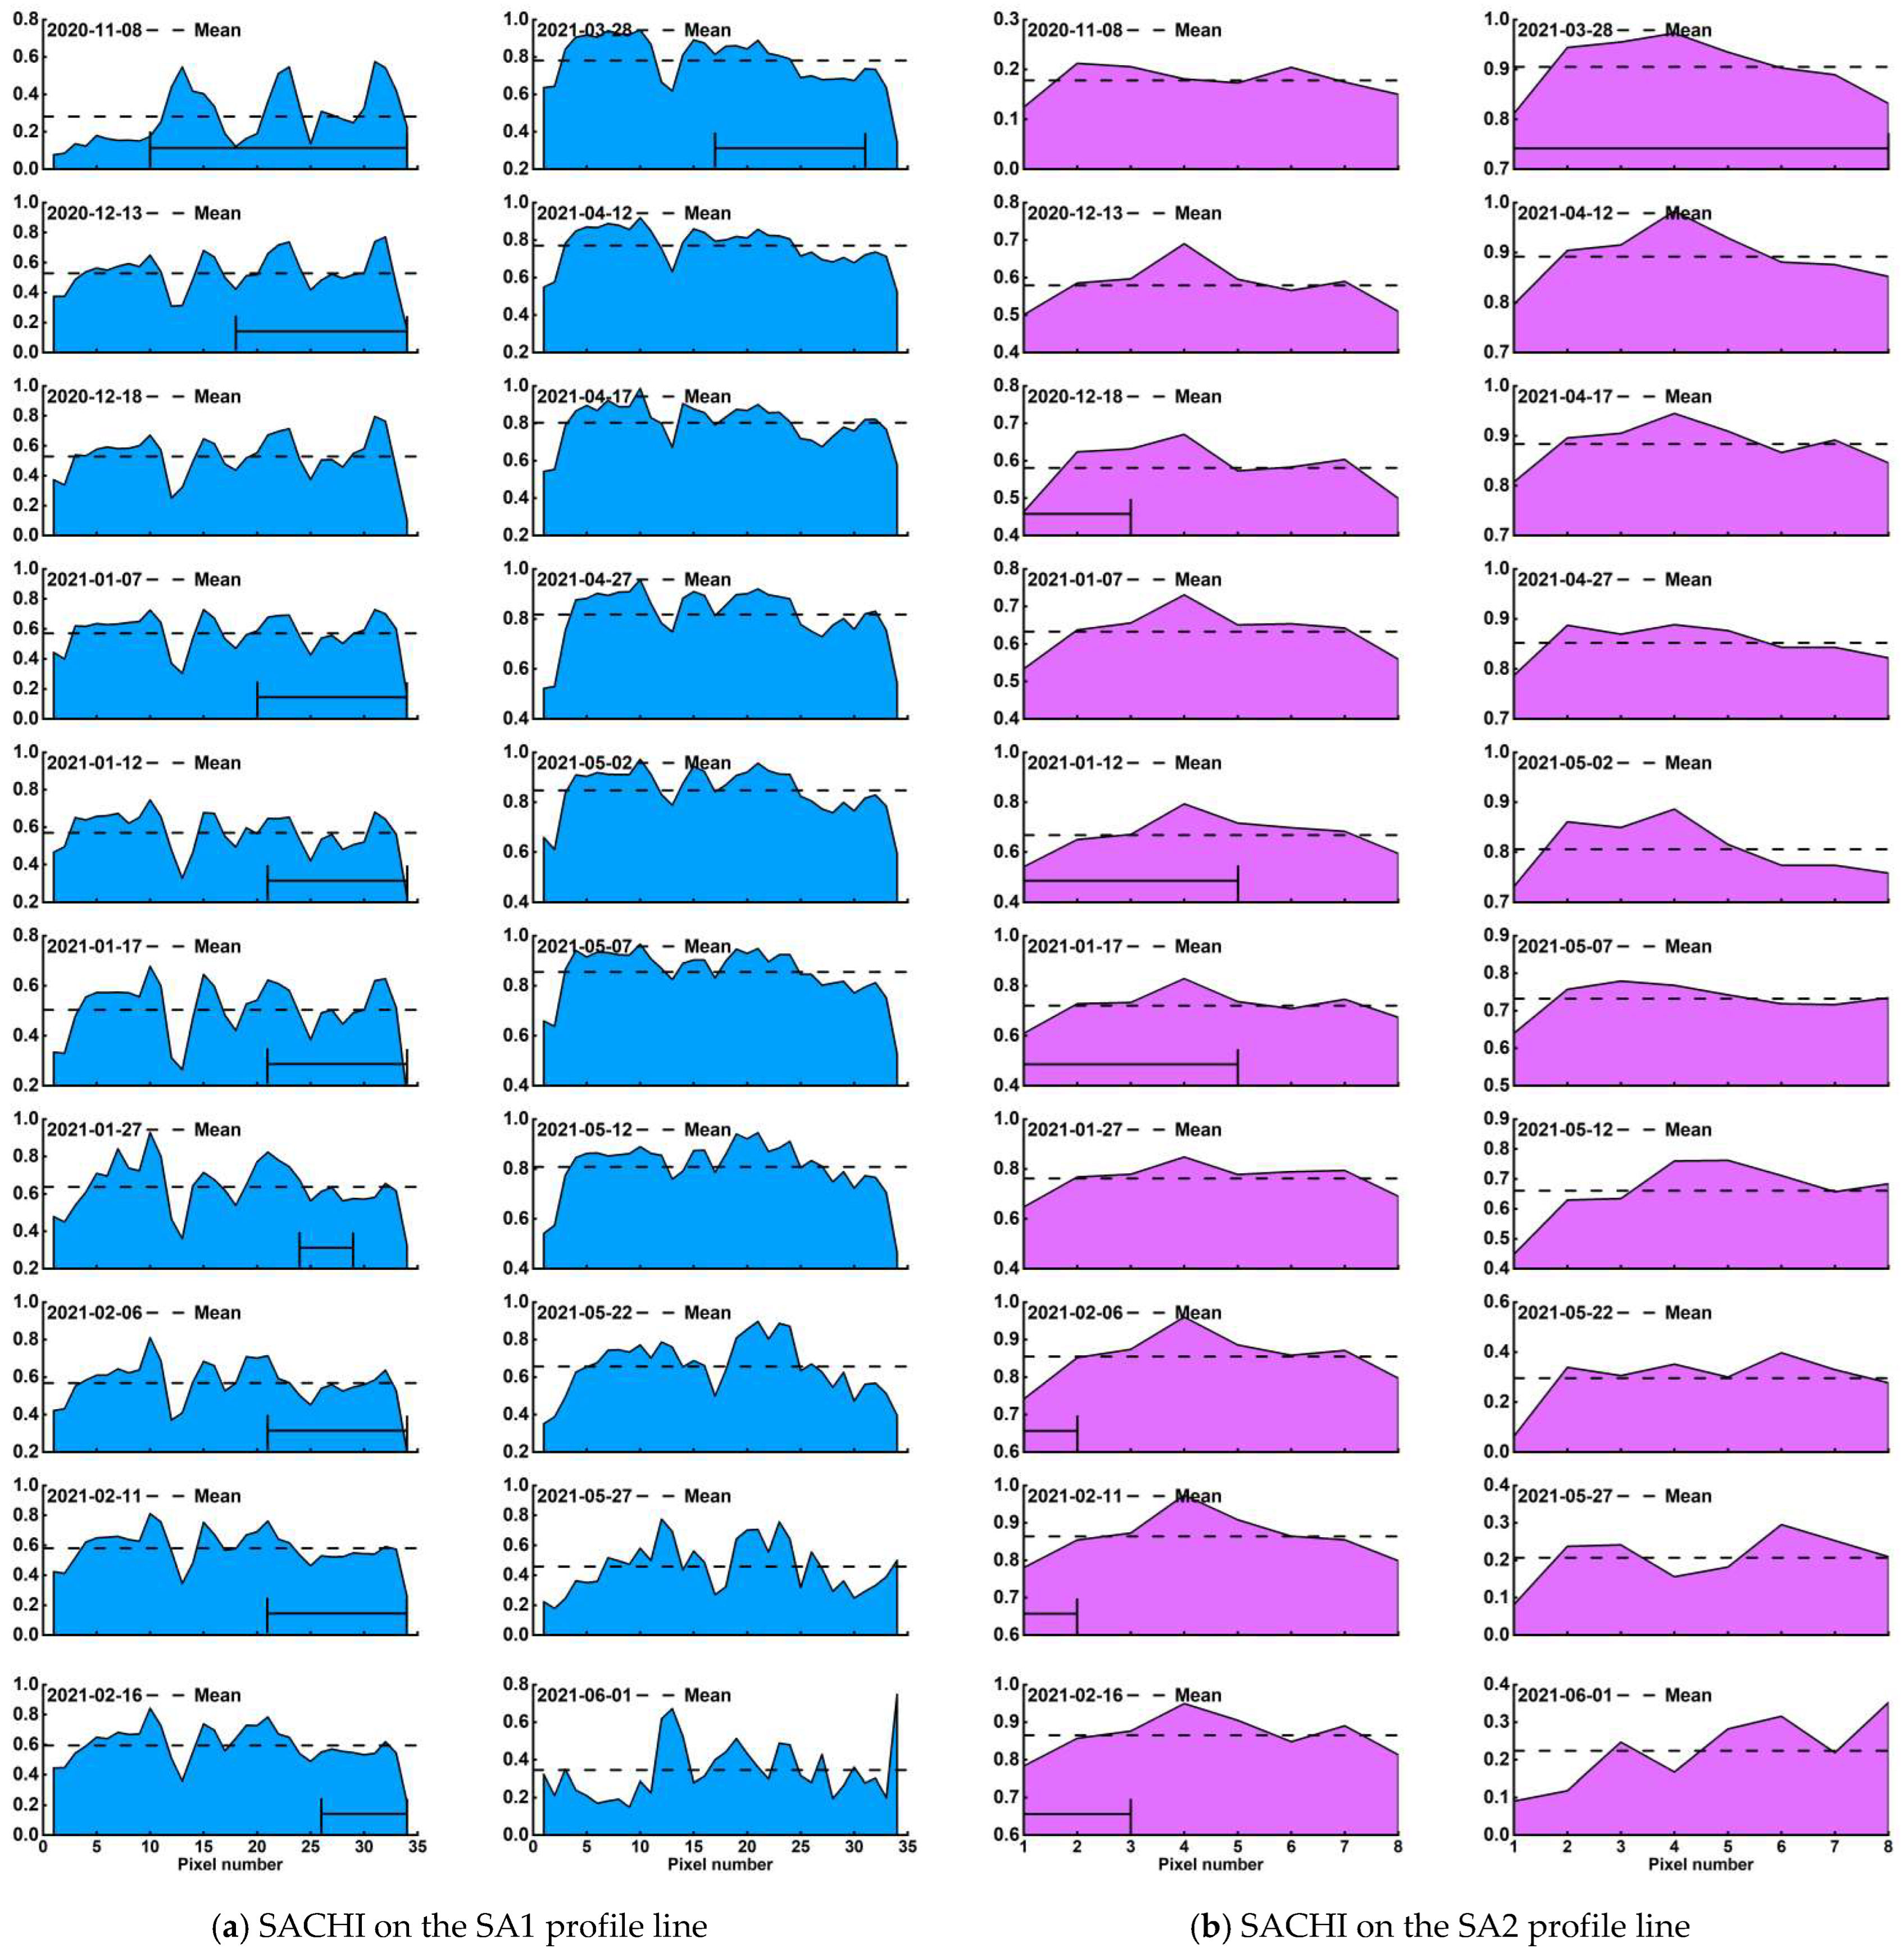
Figure 11.
SACHI spatial distribution of the SA1 and SA2. (a) Spatial distribution of SACHI in SA1; (b) Spatial distribution of SACHI in SA2. Notes: SACHI: Crop health index in subsidence area; SA1: Subsidence area 1; SA2: Subsidence area 2.
Figure 11.
SACHI spatial distribution of the SA1 and SA2. (a) Spatial distribution of SACHI in SA1; (b) Spatial distribution of SACHI in SA2. Notes: SACHI: Crop health index in subsidence area; SA1: Subsidence area 1; SA2: Subsidence area 2.
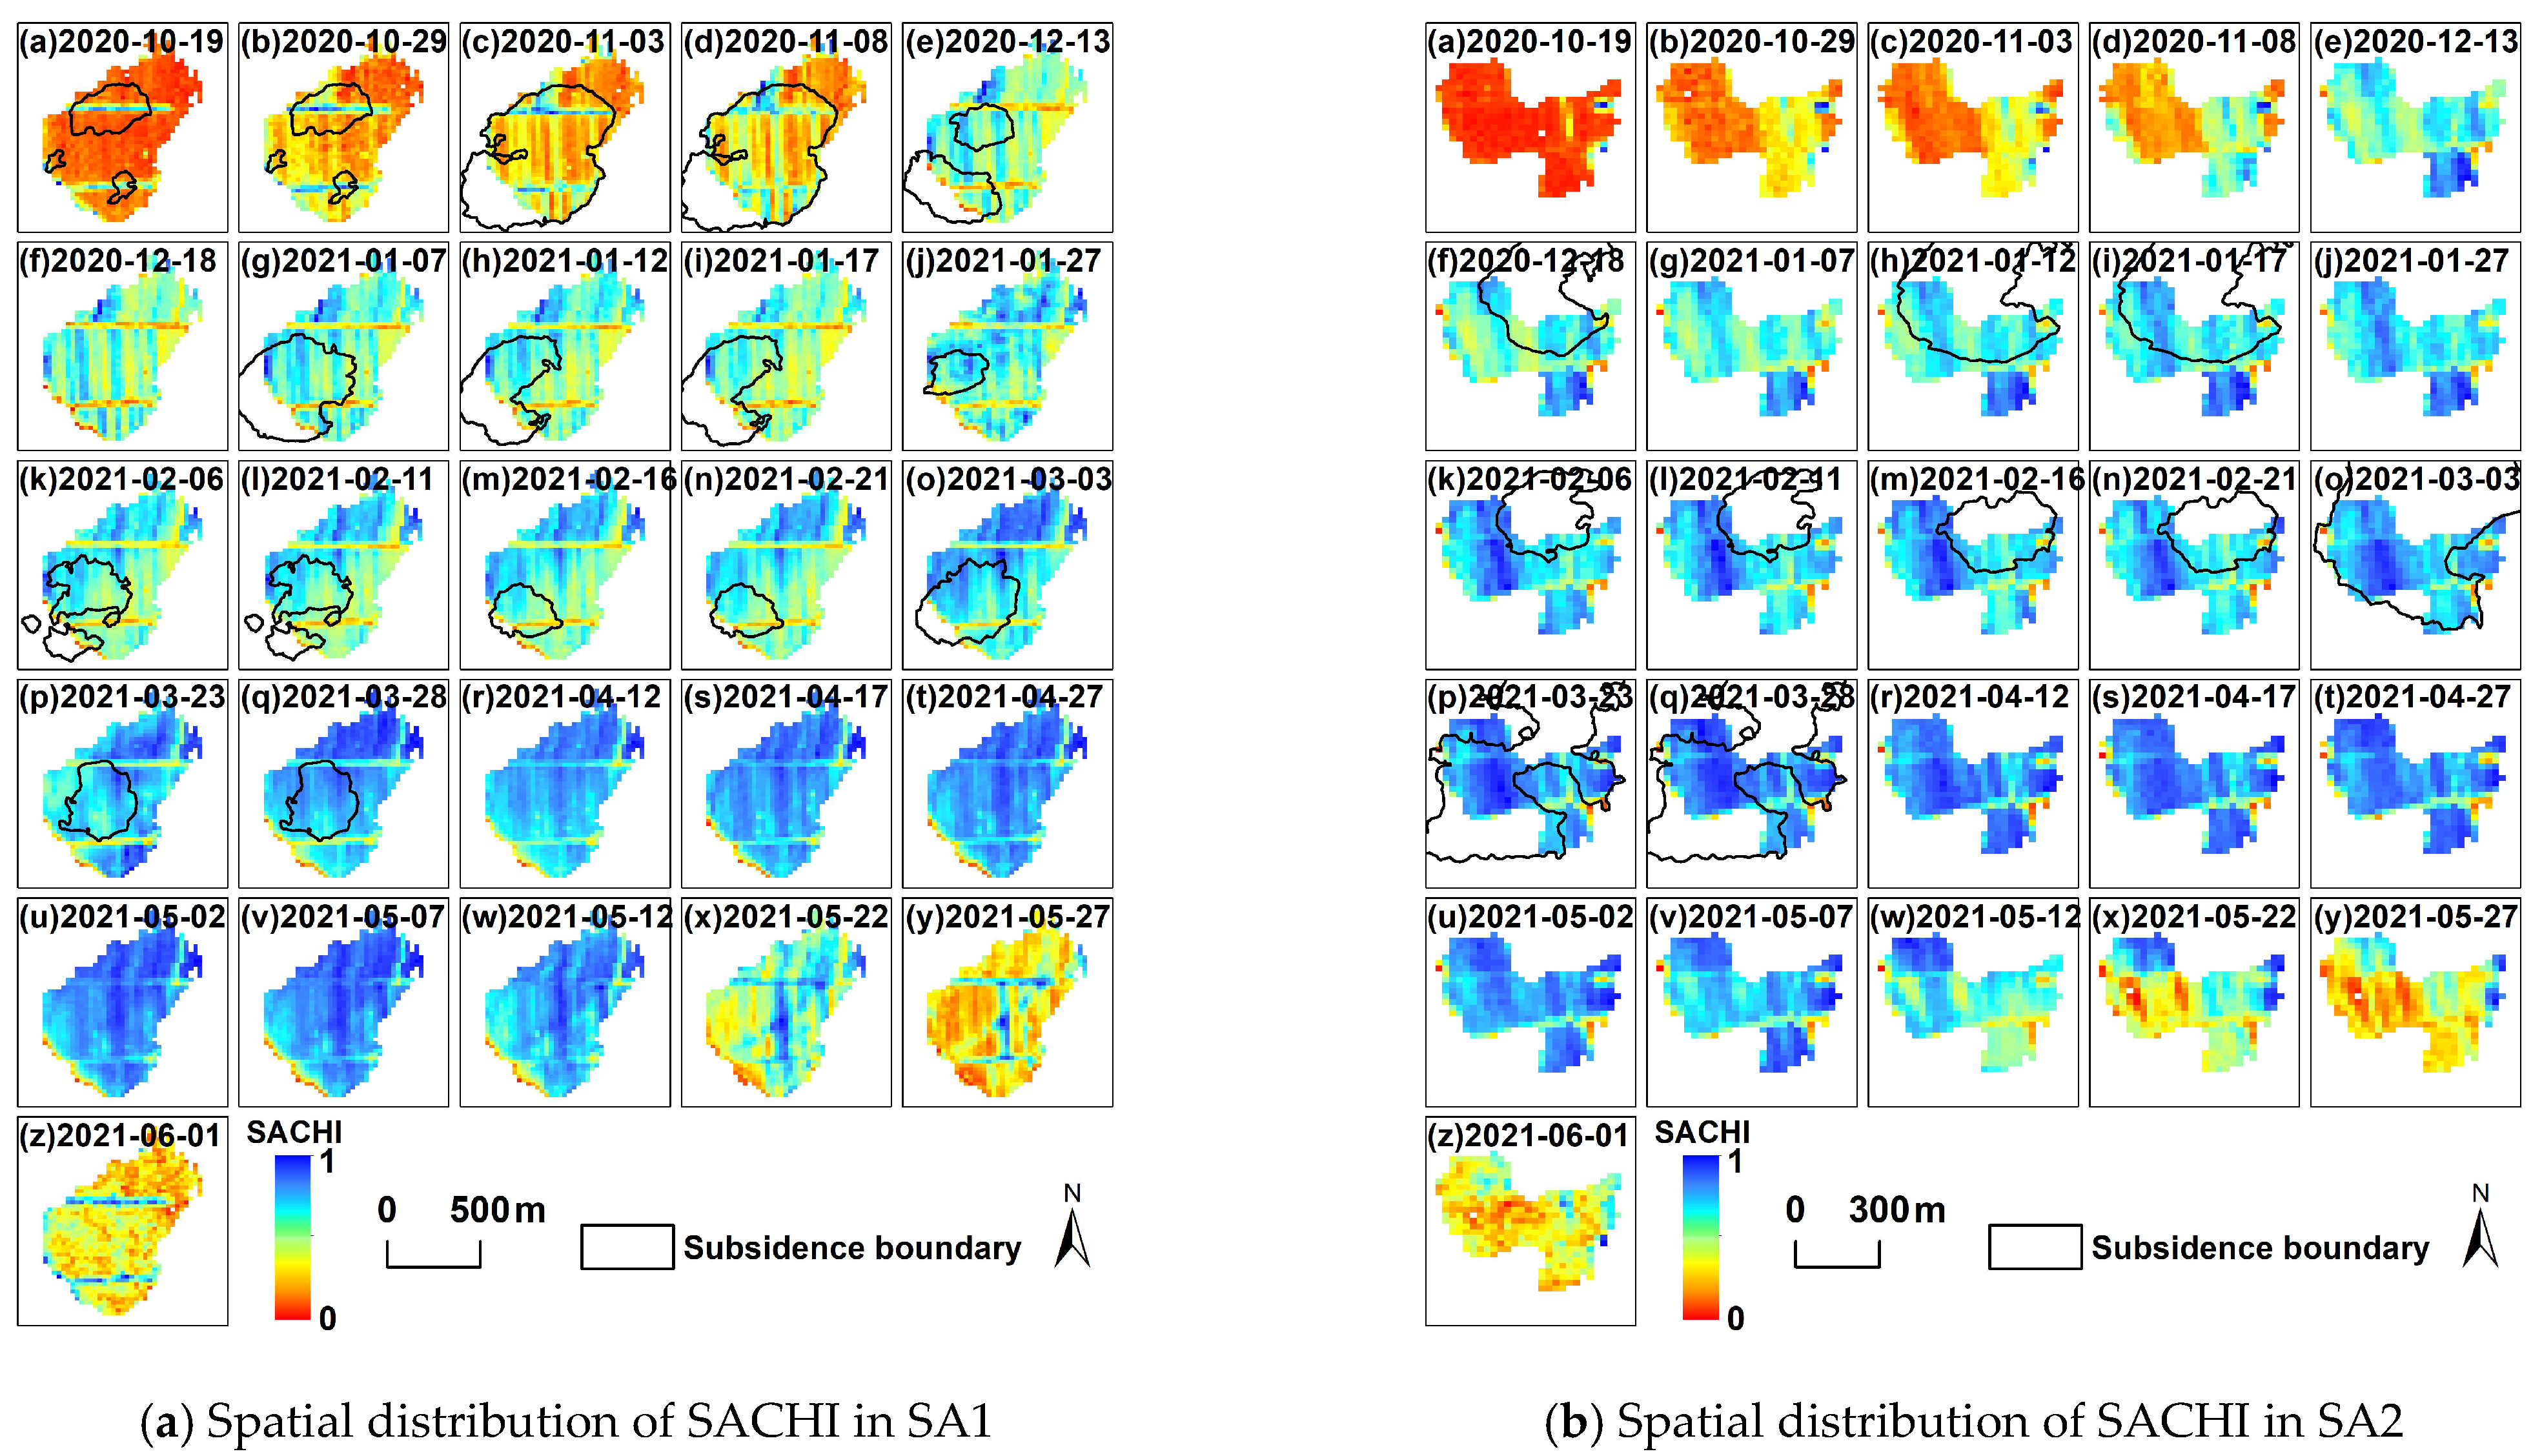
Figure 12.
Change trends in SACHI means between SAs and CKs. (a) Change trends of SACHI mean in SA1 and CK1; (b) Change trends of SACHI mean in SA2 and CK2. Notes: SACHI: Crop health index in subsidence area; SA1: Subsidence area 1; SA2: Subsidence area 2; CK1: Check area 1; CK2: Check area 2.
Figure 12.
Change trends in SACHI means between SAs and CKs. (a) Change trends of SACHI mean in SA1 and CK1; (b) Change trends of SACHI mean in SA2 and CK2. Notes: SACHI: Crop health index in subsidence area; SA1: Subsidence area 1; SA2: Subsidence area 2; CK1: Check area 1; CK2: Check area 2.

Figure 13.
Difference analysis results of SACHI between SAs and CKs. Notes: SACHI: Crop health index in subsidence area; SA1: Subsidence area 1; SA2: Subsidence area 2; CK1: Check area 1; CK2: Check area 2.
Figure 13.
Difference analysis results of SACHI between SAs and CKs. Notes: SACHI: Crop health index in subsidence area; SA1: Subsidence area 1; SA2: Subsidence area 2; CK1: Check area 1; CK2: Check area 2.
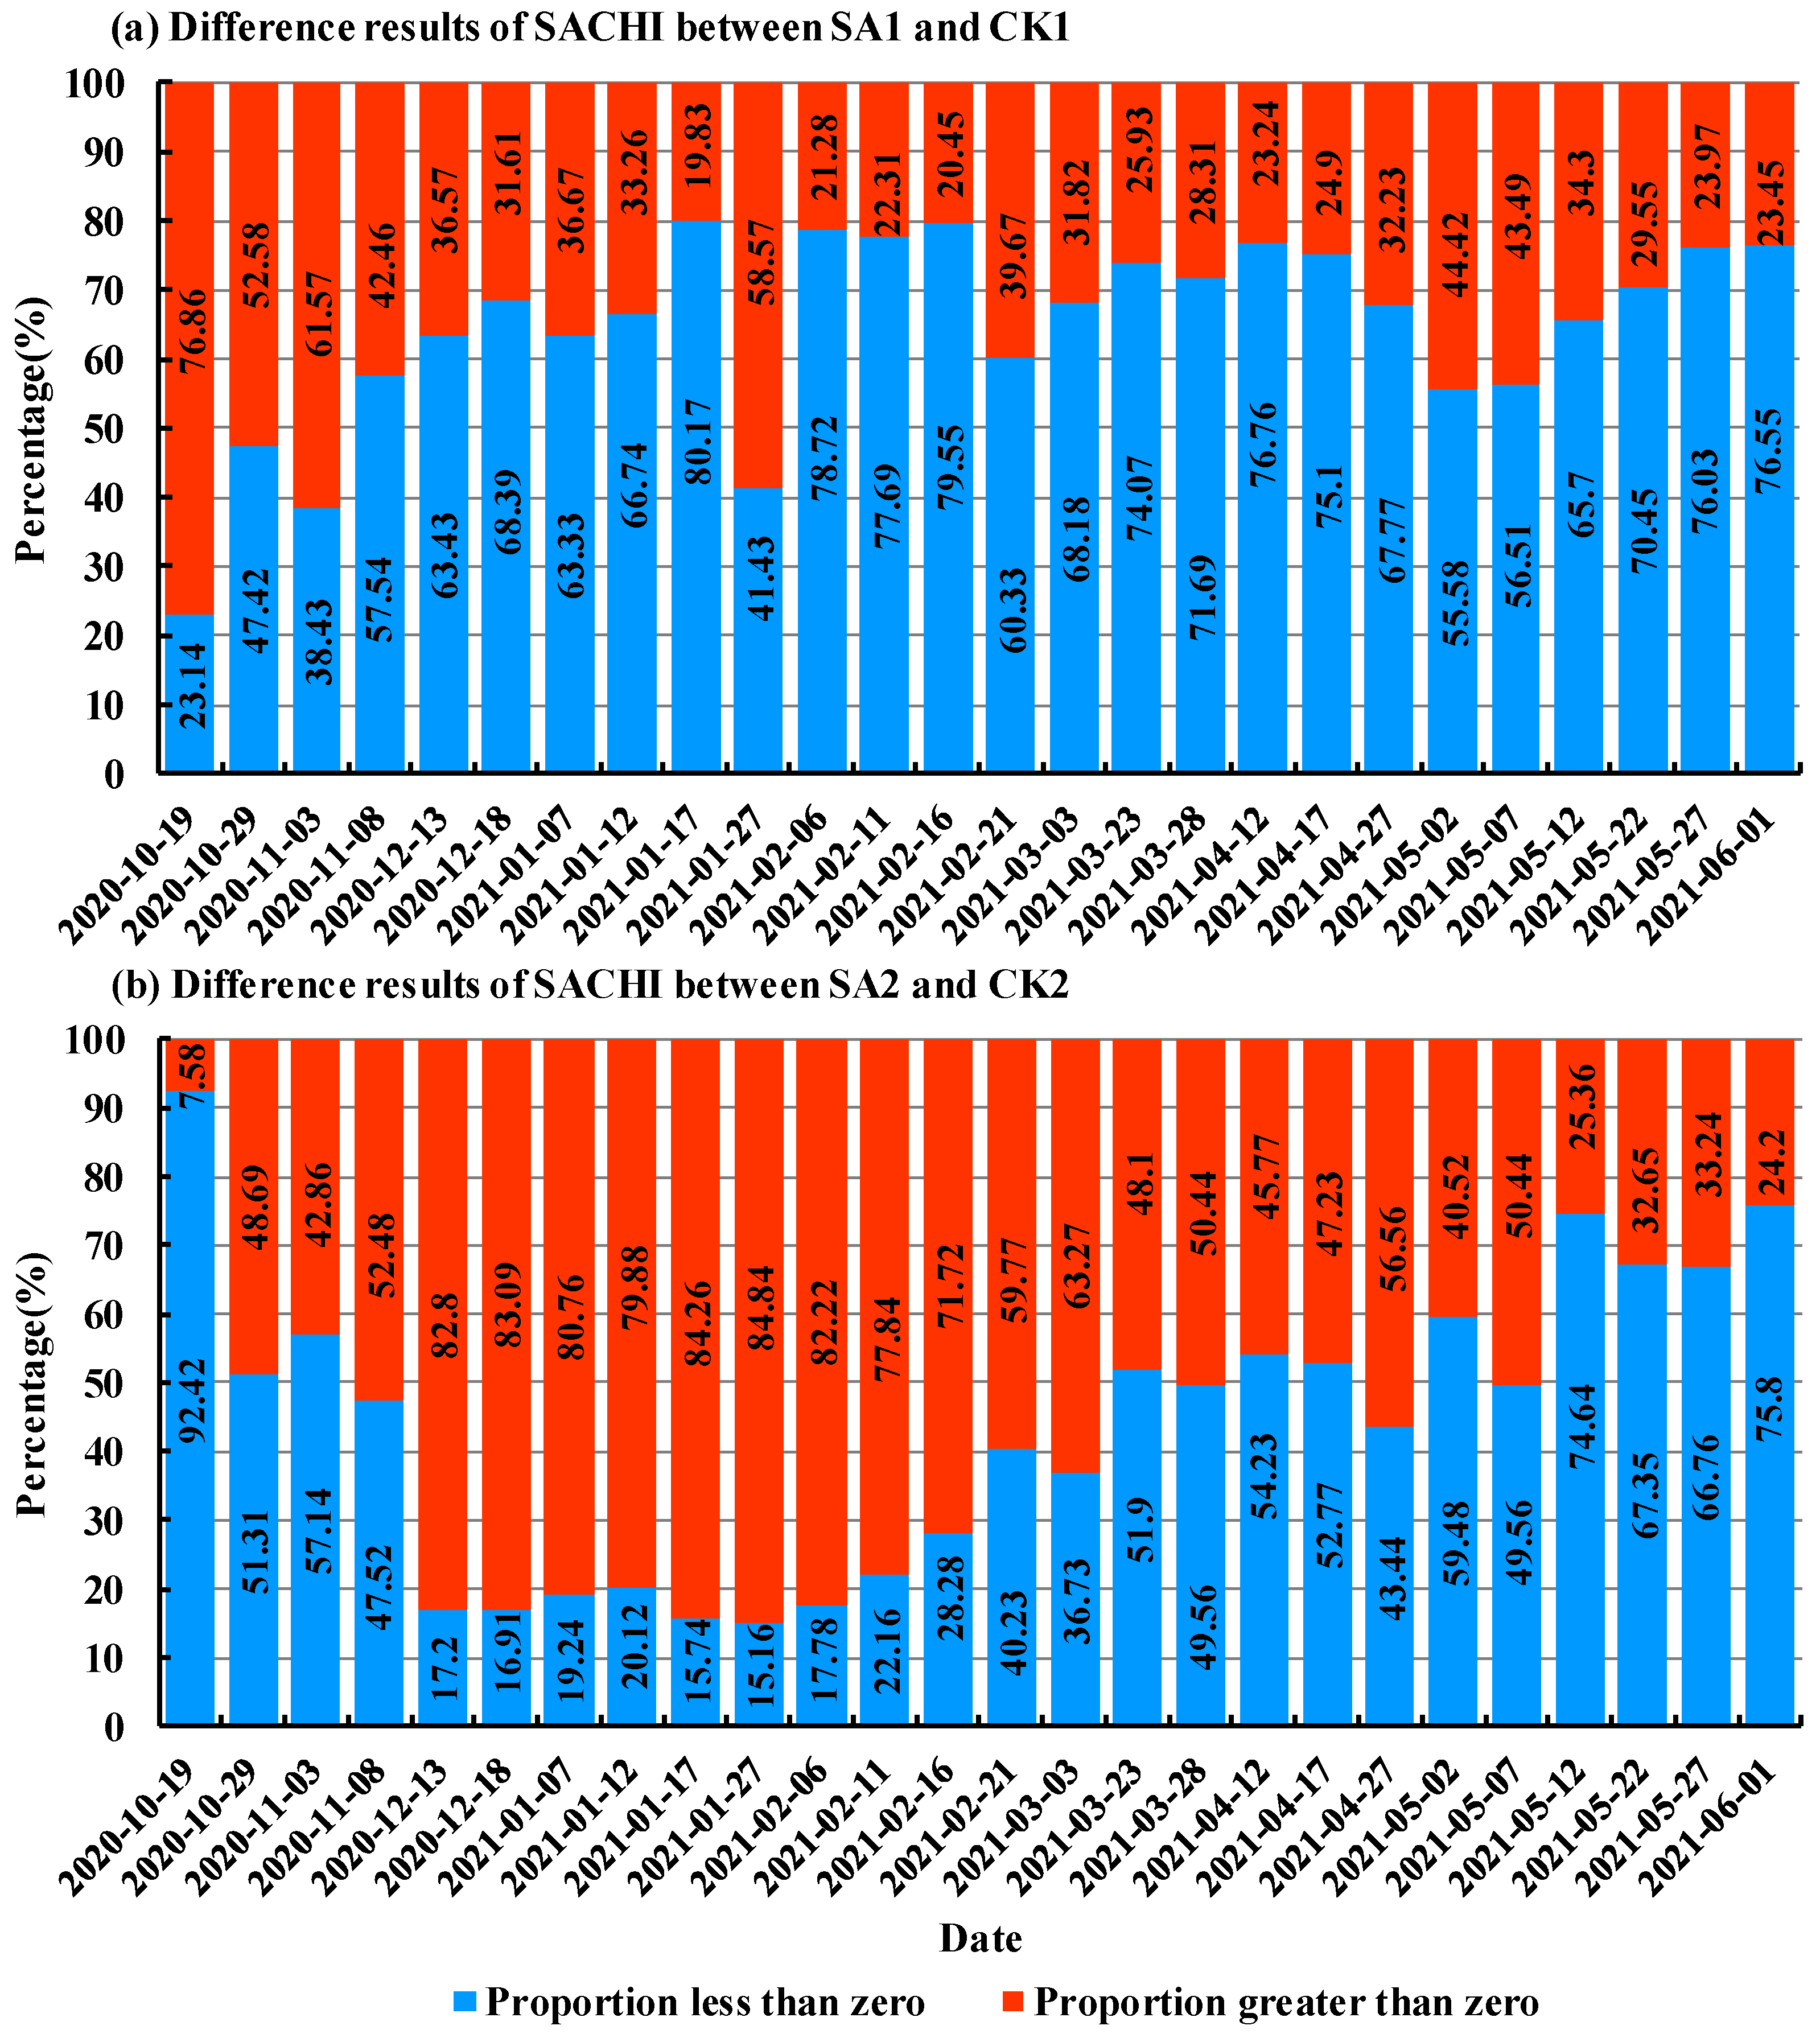
Table 1.
Information on Sentinel-2A/B data used in the study.
| Imaging Date | Data Type | Frame Number | Relative Orbital Number | Imaging Date | Data Type | Frame Number | Relative Orbital Number |
|---|---|---|---|---|---|---|---|
| 19 October 2020 | Level-1C | N0209 | R075 | 21 February 2021 | Level-1C | N0209 | R075 |
| 29 October 2020 | Level-1C | N0209 | R075 | 3 March 2021 | Level-1C | N0209 | R075 |
| 3 November 2020 | Level-1C | N0209 | R075 | 23 March 2021 | Level-1C | N0209 | R075 |
| 8 November 2020 | Level-1C | N0209 | R075 | 28 March 2021 | Level-1C | N0209 | R075 |
| 13 December 2020 | Level-1C | N0209 | R075 | 12 April 2021 | Level-1C | N0300 | R075 |
| 18 December 2020 | Level-1C | N0209 | R075 | 17 April 2021 | Level-1C | N0300 | R075 |
| 7 January 2021 | Level-1C | N0209 | R075 | 27 April 2021 | Level-1C | N0300 | R075 |
| 12 January 2021 | Level-1C | N0209 | R075 | 2 May 2021 | Level-1C | N0300 | R075 |
| 17 January 2021 | Level-1C | N0209 | R075 | 7 May 2021 | Level-1C | N0300 | R075 |
| 27 January 2021 | Level-1C | N0209 | R075 | 12 May 2021 | Level-1C | N0300 | R075 |
| 6 February 2021 | Level-1C | N0209 | R075 | 22 May 2021 | Level-1C | N0300 | R075 |
| 11 February 2021 | Level-1C | N0209 | R075 | 27 May 2021 | Level-1C | N0300 | R075 |
| 16 February 2021 | Level-1C | N0209 | R075 | 1 June 2021 | Level-1C | N0300 | R075 |
Table 2.
Vegetation index calculation formula.
| Vegetation Index | Formula | Corresponds to the Band | Reference |
|---|---|---|---|
| NDVI | B8, B4 | [47] | |
| RENDVI | B6, B4 | [48] | |
| NDRE1 | B6, B5 | [49] | |
| NDRE2 | B7, B5 | [50] | |
| MREDVI | B7, B4 | [51] |
Notes: NDVI: Normalized difference vegetation index; RENDVI: Red edge normalized difference vegetation index; NDRE1: Normalized difference red edge1; NDRE2: Normalized difference red edge2; MREDVI: Modified red edge difference vegetation index.
Table 3.
Change amplitudes in growth rate across growth stages for different vegetation indices in the SAs and CKs.
Table 3.
Change amplitudes in growth rate across growth stages for different vegetation indices in the SAs and CKs.
| Growth Stages | Vegetation Indices | SA1 Slope | CK1 Slope | Change Amplitude/% | SA2 Slope | CK2 Slope | Change Amplitude/% |
|---|---|---|---|---|---|---|---|
| LOS1 | NDVI | 0.00599 | 0.00628 | −4.62 | 0.0057 | 0.00482 | 18.26 |
| RENDVI | 0.00526 | 0.0055 | −4.36 | 0.00506 | 0.00437 | 15.79 | |
| NDRE1 | 0.00407 | 0.00433 | −6.01 | 0.00383 | 0.00324 | 18.21 | |
| NDRE2 | 0.00352 | 0.00376 | −6.38 | 0.00332 | 0.00263 | 26.24 | |
| MREDVI | 0.00362 | 0.00376 | −3.72 | 0.00306 | 0.00246 | 24.39 | |
| OWS | NDVI | −0.0042 | −0.00536 | −21.64 | −0.00424 | −0.00337 | 25.82 |
| RENDVI | −0.00276 | −0.00299 | −7.69 | −0.00204 | −0.00108 | 88.89 | |
| NDRE1 | −0.00175 | −0.00212 | −17.45 | −0.00117 | −0.00149 | −21.48 | |
| NDRE2 | −0.0019 | −0.00256 | −25.78 | −0.00293 | −0.00279 | 5.02 | |
| MREDVI | −0.00565 | −0.00501 | 12.77 | −0.00674 | −0.00473 | 42.49 | |
| LOS2 | NDVI | 0.00213 | 0.00233 | −8.58 | 0.00261 | 0.00308 | −15.26 |
| RENDVI | 0.00133 | 0.00139 | −4.32 | 0.0016 | 0.00194 | −17.53 | |
| NDRE1 | 0.00239 | 0.00287 | −16.73 | 0.00258 | 0.00326 | −20.86 | |
| NDRE2 | 0.00184 | 0.00252 | −26.98 | 0.00199 | 0.00302 | −34.11 | |
| MREDVI | 0.000324 | 0.00129 | −74.88 | 0.0002374 | 0.00062303 | −61.9 | |
| EOS | NDVI | −0.01073 | −0.01013 | 5.92 | −0.00915 | −0.00927 | −1.29 |
| RENDVI | −0.00927 | −0.00849 | 9.19 | −0.00778 | −0.00782 | −0.51 | |
| NDRE1 | −0.00588 | −0.00526 | 11.79 | −0.00543 | −0.00554 | −1.99 | |
| NDRE2 | −0.00633 | −0.00553 | 14.47 | −0.0063 | −0.00592 | 6.42 | |
| MREDVI | −0.00647 | −0.00561 | 15.33 | −0.00612 | −0.0051 | 20 |
Notes: LOS1: Length of growing season 1; OWS: Over wintering season; LOS2: Length of growing season 2; EOS: End of growing season; SA1: Subsidence area 1; SA2: Subsidence area 2; CK1: Check area 1; CK2: Check area 2.
Table 4.
The PC1 payload and contribution rate of each SACHI stage in the SA1 and SA2.
| Date | Payload and Contribution Rate of SA1_SACHI PC1 | Payload and Contribution Rate of SA2_SACHI PC1 | ||||||||
|---|---|---|---|---|---|---|---|---|---|---|
| NDRE2 | CIre | NDMI | SI-T | Contribution Rate/% | NDRE2 | CIre | NDMI | SI-T | Contribution Rate/% | |
| 19 October 2020 | 0.552 | 0.528 | 0.471 | −0.440 | 85.33 | 0.547 | 0.495 | 0.506 | −0.446 | 91.33 |
| 29 October 2020 | 0.502 | 0.506 | 0.632 | −0.305 | 77.85 | −0.622 | −0.605 | −0.091 | 0.488 | 57.41 |
| 3 November 2020 | −0.530 | −0.506 | −0.498 | 0.465 | 82.03 | 0.564 | 0.561 | 0.448 | −0.409 | 86.50 |
| 8 November 2020 | 0.507 | 0.537 | 0.561 | −0.374 | 88.63 | 0.591 | 0.605 | 0.352 | −0.401 | 92.77 |
| 13 December 2020 | 0.460 | 0.559 | 0.612 | −0.320 | 94.37 | −0.478 | −0.550 | −0.596 | 0.338 | 91.71 |
| 18 December 2020 | 0.480 | 0.569 | 0.578 | −0.334 | 94.39 | −0.490 | −0.556 | −0.574 | 0.348 | 91.49 |
| 7 January 2021 | 0.483 | 0.588 | 0.557 | −0.332 | 93.62 | −0.475 | −0.569 | −0.584 | 0.330 | 90.16 |
| 12 January 2021 | 0.470 | 0.551 | 0.602 | −0.336 | 94.61 | −0.468 | −0.532 | −0.611 | 0.353 | 91.81 |
| 17 January 2021 | 0.491 | 0.549 | 0.556 | −0.385 | 91.30 | −0.484 | −0.577 | −0.561 | 0.344 | 89.33 |
| 27 January 2021 | −0.495 | −0.560 | −0.562 | 0.354 | 86.46 | −0.492 | −0.546 | −0.557 | 0.386 | 91.45 |
| 6 February 2021 | 0.497 | 0.560 | 0.562 | −0.352 | 93.22 | −0.480 | −0.558 | −0.595 | 0.322 | 92.27 |
| 11 February 2021 | 0.479 | 0.571 | 0.573 | −0.341 | 94.53 | 0.448 | 0.536 | 0.638 | −0.325 | 93.92 |
| 16 February 2021 | 0.468 | 0.569 | 0.590 | −0.328 | 94.67 | 0.479 | 0.601 | 0.556 | −0.317 | 93.65 |
| 21 February 2021 | −0.476 | −0.595 | −0.561 | 0.324 | 95.07 | 0.469 | 0.585 | 0.575 | −0.328 | 93.02 |
| 3 March 2021 | −0.427 | −0.638 | −0.583 | 0.266 | 95.37 | 0.438 | 0.595 | 0.609 | −0.288 | 94.37 |
| 23 March 2021 | 0.4413 | 0.707 | 0.477 | −0.280 | 91.66 | 0.439 | 0.641 | 0.569 | −0.271 | 93.80 |
| 28 March 2021 | 0.431 | 0.687 | 0.527 | −0.254 | 97.23 | 0.434 | 0.638 | 0.582 | −0.256 | 96.65 |
| 12 April 2021 | 0.391 | 0.748 | 0.496 | −0.203 | 93.59 | 0.419 | 0.658 | 0.575 | −0.248 | 93.85 |
| 17 April 2021 | 0.415 | 0.721 | 0.509 | −0.220 | 93.76 | 0.430 | 0.660 | 0.562 | −0.253 | 94.16 |
| 27 April 2021 | 0.416 | 0.717 | 0.513 | −0.223 | 95.49 | 0.422 | 0.683 | 0.552 | −0.226 | 95.89 |
| 2 May 2021 | 0.452 | 0.709 | 0.477 | −0.256 | 97.36 | 0.504 | 0.687 | 0.426 | −0.305 | 97.20 |
| 7 May 2021 | 0.430 | 0.683 | 0.542 | −0.234 | 97.19 | 0.430 | 0.663 | 0.564 | −0.239 | 96.49 |
| 12 May 2021 | 0.432 | 0.679 | 0.542 | −0.240 | 96.11 | 0.444 | 0.644 | 0.558 | −0.277 | 93.38 |
| 22 May 2021 | 0.501 | 0.557 | 0.575 | −0.330 | 92.60 | −0.549 | −0.646 | −0.418 | 0.325 | 90.96 |
| 27 May 2021 | −0.498 | −0.504 | −0.608 | 0.358 | 89.80 | −0.503 | −0.510 | −0.582 | 0.385 | 89.78 |
| 1 June 2021 | 0.665 | 0.690 | 0.023 | −0.284 | 84.48 | 0.638 | 0.667 | 0.190 | −0.335 | 82.30 |
Notes: SACHI: Crop health index in subsidence area; PC1: Principal component 1; NDRE2: Normalized difference red edge2; CIre: Red edged chlorophyll index; NDMI: Normalized difference moisture index; SI-T: Ratio salinity index; SA1: Subsidence area 1; SA2: Subsidence area 2.
Table 5.
Significance levels of binary logistic regression for SACHI mining impacts.
| Data Date | Total Number of Samples | Number of Samples Unaffected by Mining | Number of Samples Affected by Mining | Significance Level (p) | |
|---|---|---|---|---|---|
| SA1_SACHI | 19 October 2020 | 991 | 776 | 215 | <0.001 ** |
| 29 October 2020 | 991 | 776 | 215 | <0.001 ** | |
| 3 November 2020 | 991 | 249 | 742 | <0.001 ** | |
| 8 November 2020 | 991 | 249 | 742 | <0.001 ** | |
| 13 December 2020 | 991 | 745 | 246 | 0.972 | |
| 7 January 2021 | 991 | 644 | 347 | 0.013 * | |
| 12 January 2021 | 991 | 761 | 230 | <0.001 ** | |
| 17 January 2021 | 991 | 761 | 230 | <0.001 ** | |
| 27 January 2021 | 991 | 885 | 106 | 0.032 * | |
| 6 February 2021 | 991 | 762 | 229 | 0.978 | |
| 11 February 2021 | 991 | 762 | 229 | 0.426 | |
| 16 February 2021 | 991 | 855 | 136 | <0.001 ** | |
| 21 February 2021 | 991 | 855 | 136 | <0.001 ** | |
| 3 March 2021 | 991 | 690 | 301 | <0.001 ** | |
| 23 March 2021 | 991 | 754 | 237 | 0.655 | |
| 28 March 2021 | 991 | 754 | 237 | 0.112 | |
| SA2_SACHI | 18 December 2020 | 367 | 271 | 96 | 0.059 |
| 12 January 2021 | 367 | 188 | 179 | 0.954 | |
| 17 January 2021 | 367 | 188 | 179 | 0.875 | |
| 6 February 2021 | 367 | 329 | 38 | 0.590 | |
| 11 February 2021 | 367 | 329 | 38 | 0.681 | |
| 16 February 2021 | 367 | 286 | 81 | 0.007 ** | |
| 21 February 2021 | 367 | 286 | 81 | 0.004 ** | |
| 3 March 2021 | 367 | 70 | 297 | 0.010 * | |
| 23 March 2021 | 367 | 141 | 226 | 0.103 | |
| 28 March 2021 | 367 | 141 | 226 | 0.932 |
Notes: * indicates significant (p < 0.05); ** indicates extremely significant (p < 0.01); the red font represents growth LOS 1; the green font indicates the OWS; the blue font represents the LOS2; SA1: Subsidence area 1; SA2: Subsidence area 2; SACHI: Crop health index in subsidence area.
Disclaimer/Publisher’s Note: The statements, opinions and data contained in all publications are solely those of the individual author(s) and contributor(s) and not of MDPI and/or the editor(s). MDPI and/or the editor(s) disclaim responsibility for any injury to people or property resulting from any ideas, methods, instructions or products referred to in the content. |
© 2023 by the authors. Licensee MDPI, Basel, Switzerland. This article is an open access article distributed under the terms and conditions of the Creative Commons Attribution (CC BY) license (https://creativecommons.org/licenses/by/4.0/).
Share and Cite
MDPI and ACS Style
Zhang, H.; Ma, C.; Guo, W.; Li, T. Dynamic Monitoring of Winter Wheat Health in Mining Subsidence Areas by Combined Active and Passive Remote Sensing Technology. Land 2023, 12, 2079. https://doi.org/10.3390/land12112079
AMA Style
Zhang H, Ma C, Guo W, Li T. Dynamic Monitoring of Winter Wheat Health in Mining Subsidence Areas by Combined Active and Passive Remote Sensing Technology. Land. 2023; 12(11):2079. https://doi.org/10.3390/land12112079
Chicago/Turabian StyleZhang, Haobin, Chao Ma, Wenbing Guo, and Tingting Li. 2023. "Dynamic Monitoring of Winter Wheat Health in Mining Subsidence Areas by Combined Active and Passive Remote Sensing Technology" Land 12, no. 11: 2079. https://doi.org/10.3390/land12112079
Note that from the first issue of 2016, this journal uses article numbers instead of page numbers. See further details here.