Article

Towards Sustainable Development Goals: Coupling Coordination Analysis and Spatial Heterogeneity between Urbanization, the Environment, and Food Security in China

1
School of Management, Sichuan Agricultural University, Chengdu 611130, China
2
Sichuan Rural Development Research Center, Chengdu 611130, China
3
School of Mechanical Engineering and Automation, Harbin Institute of Technology, Shenzhen 518055, China
*
Author to whom correspondence should be addressed.
These authors contributed equally to this work.
Land 2023, 12(11), 2002; https://doi.org/10.3390/land12112002
Submission received: 8 October 2023 / Revised: 29 October 2023 / Accepted: 30 October 2023 / Published: 31 October 2023
(This article belongs to the Section Land Systems and Global Change)

Abstract

:
The interconnection between urbanization, the environment, and food security necessitates an exploration of their coupling coordination to advance the attainment of Sustainable Development Goals. However, limited research directly addresses the feasibility and strategies required to achieve such coordination. This study investigates the coupling coordination and spatial heterogeneity between urbanization, the environment, and food security in China from 2004 to 2020, employing the coupling coordination degree model, the spatial correlation model, the Dagum Gini coefficient, and the obstacle degree model. The results show that: (1) the level of coordinated development between urbanization, the environment, and food security in China has significantly increased, as evidenced by a remarkable rise in the coupling coordination degree; (2) a robust positive spatial correlation is observed in the coupling coordination degree, with “Low-Low” clusters predominantly concentrated in northwest China and “High-High” clusters primarily located in southeast China; (3) inter-regional differences are identified as the primary cause of this spatial heterogeneity; (4) food security has emerged as the foremost obstacle to coordinated development between urbanization, the environment, and food security in China. Optimizing the rational allocation of natural resources across different sectors, enhancing resource use efficiency, and strengthening environmental pollution control and management have been proven to be crucial measures and key strategies for promoting their coordinated development. This study provides a novel perspective on balancing the intricate relationship between urbanization, environmental protection, and food security, which is conducive to the achievement of Sustainable Development Goals in developing countries.

1. Introduction

Urbanization is a crucial component and an inevitable trend of social and economic development, contributing to economic prosperity, industrial modernization, and scientific and technological progress [1,2]. However, rapid urbanization, especially in developing countries, has also resulted in various catastrophic threats to sustainable development [3]. Urban sprawl occupies large-scale farmland and forests, and industrialization accompanied by urbanization produces a large number of pollutants [4,5]. The natural environment subsequently deteriorates, leading to air pollution, water pollution, and other issues [6]. Moreover, the reduction in farmland and environmental degradation has put great pressure on food supply, directly impacting human food security [7,8].
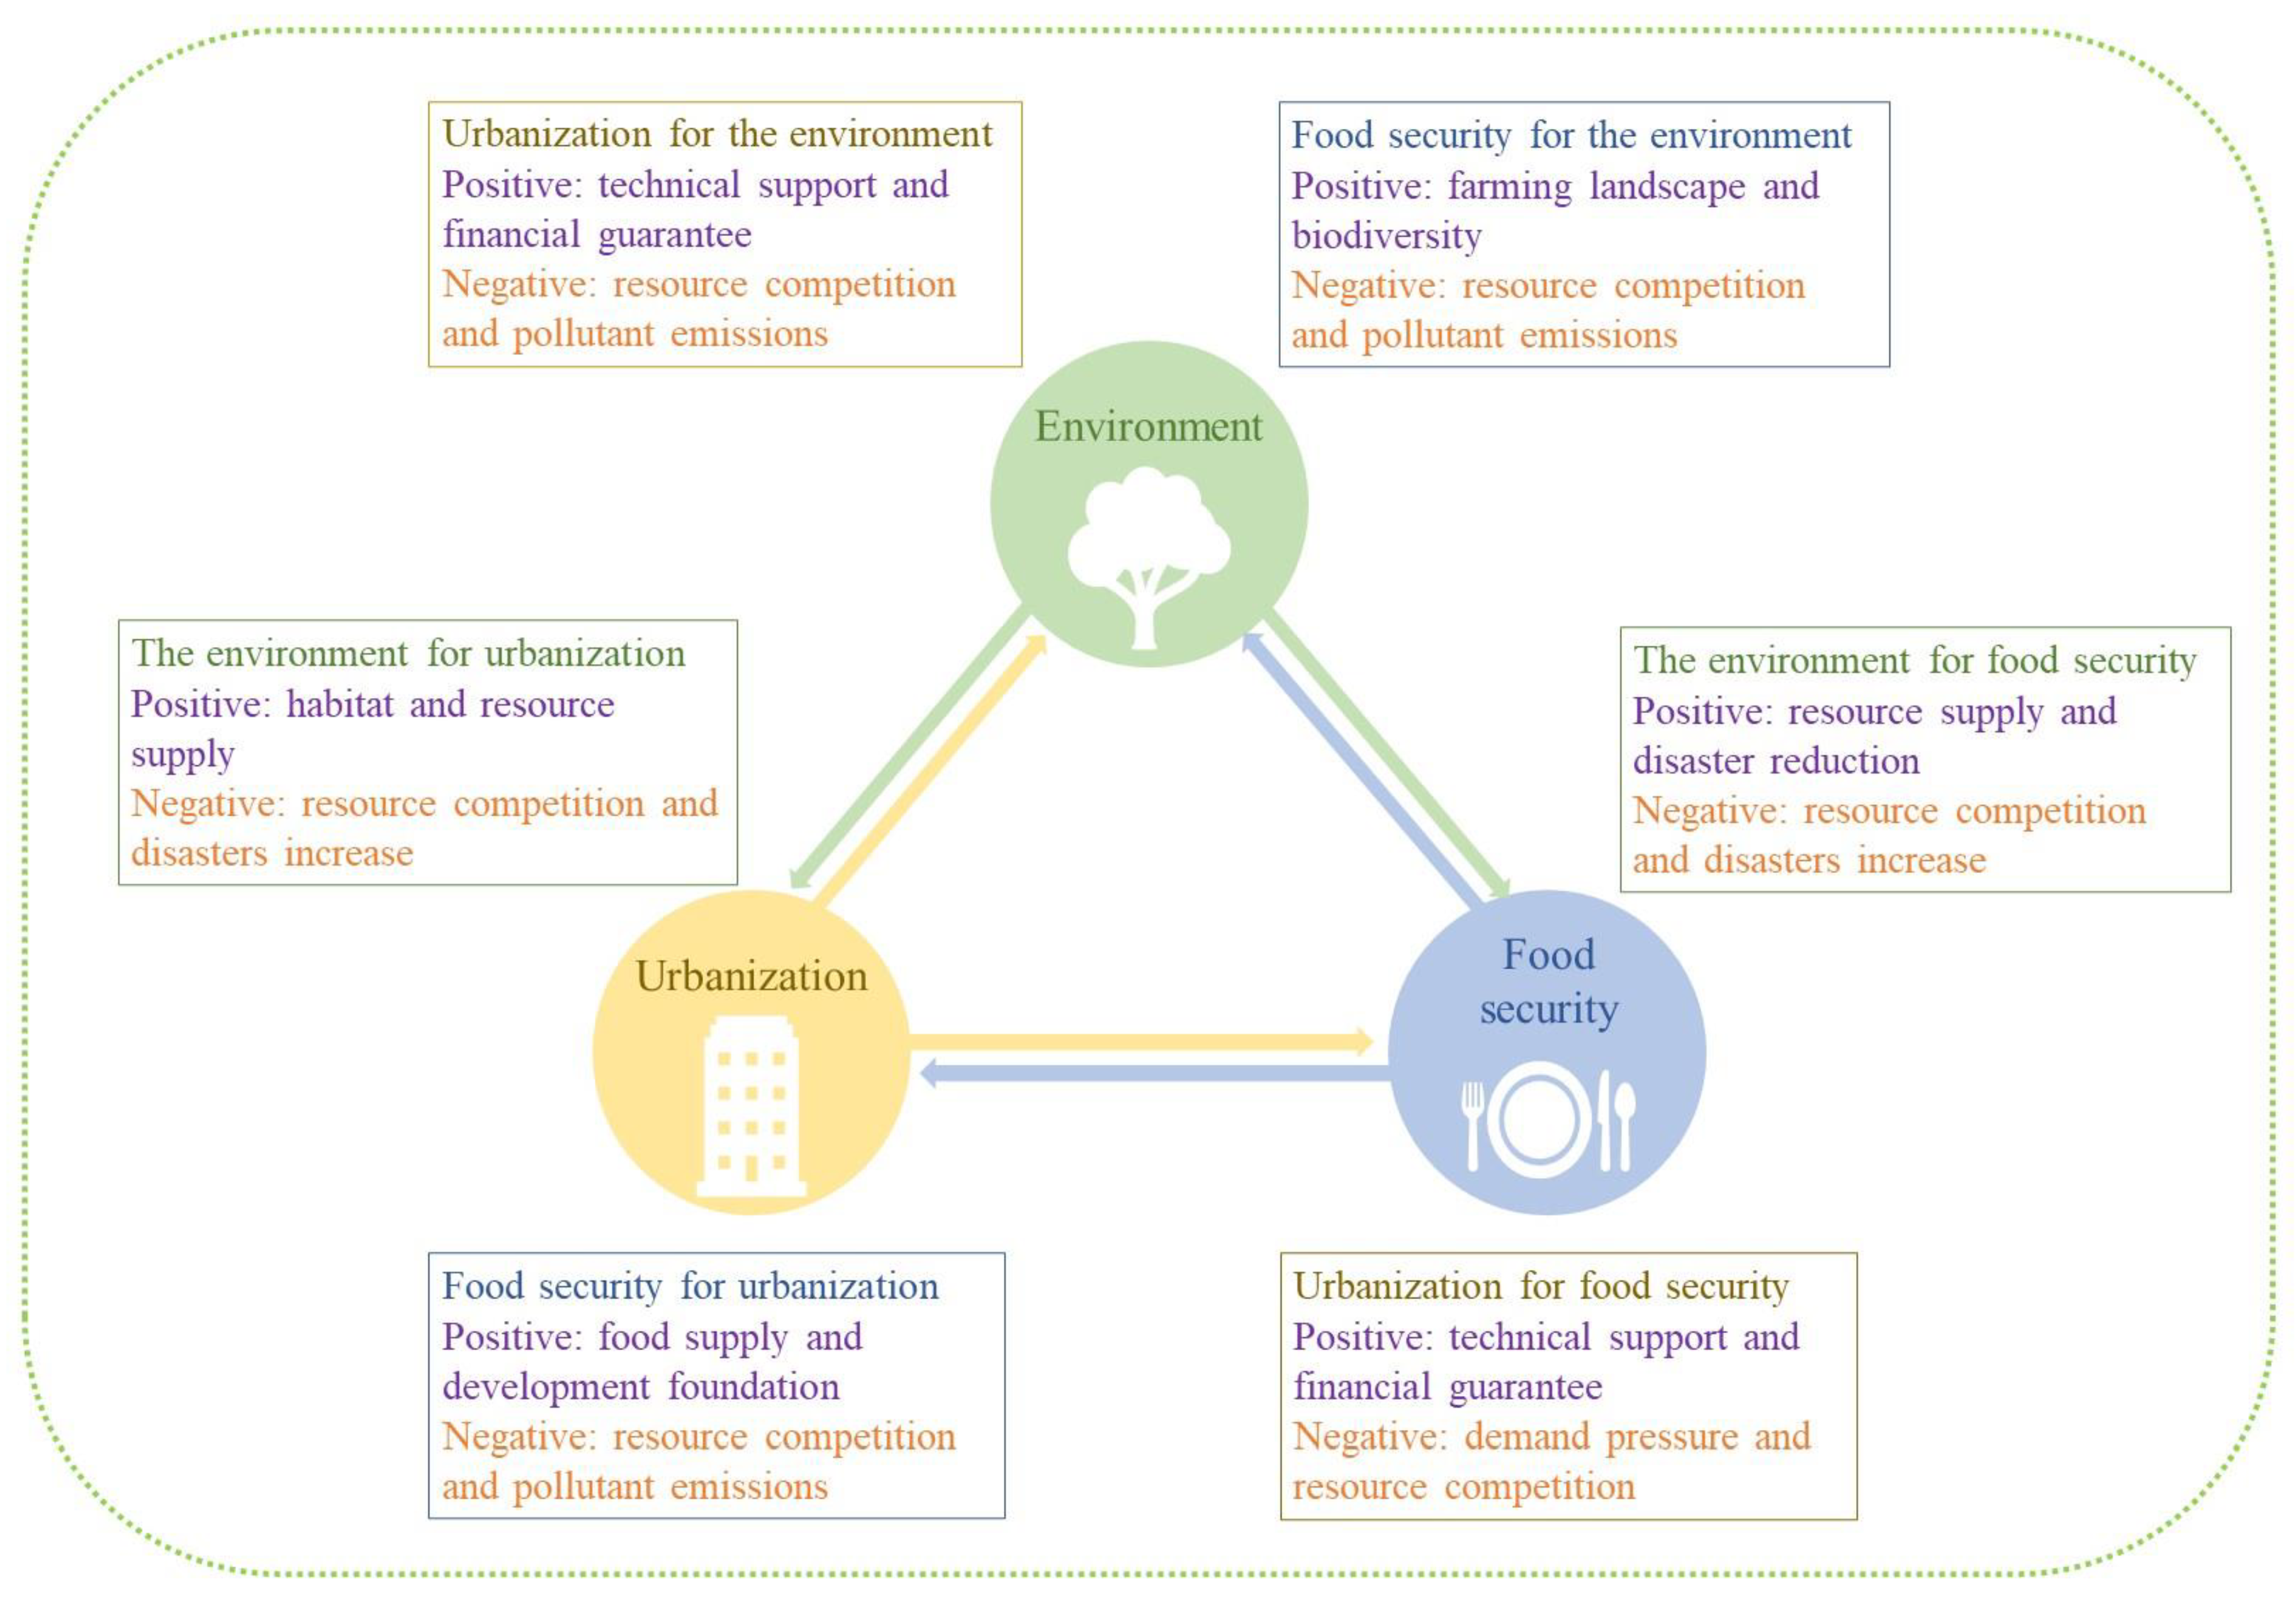
As key constituents within the human–natural system, urbanization, the environment, and food security are intricately linked. They operate as a cohesive and interdependent entity, where each component influences the others either positively or negatively (Figure 1). Urbanization drives socioeconomic progress, facilitating capital accumulation and technological advancement [9]. This enables greater investment in environmental protection and ecological management. Moreover, against the backdrop of rapid population growth and climate change, urbanization has facilitated enhanced food production efficiency to meet the increasing demands [10]. The financial investments and technological advancements catalyzed by urbanization are indispensable in achieving these outcomes. The environment plays a fundamental role in providing the resources and habitats required for human survival and serves as a vital foundation for sustainable urbanization [11]. It also acts as a bulwark against natural disasters and contributes to food production, while degradation augments the risks to food security through phenomena like soil erosion and land desertification [12]. Food security serves as a prerequisite for sustainable urbanization, with an adequate food supply being essential not only for human survival but also as a raw material for industrial production. Additionally, food production significantly influences the environment, shaping the agricultural landscape and nurturing biodiversity [13,14].
However, inherent conflicts persist between urbanization, the environment, and food security (Figure 1). One such conflict stems from the competition for natural resources, particularly land and water. Urbanization, environmental conservation, and food production all exert significant demands on land resources. With limited land availability, the expansion of urban areas leads to a decline in arable land and ecological land, such as forests and wetlands. This not only directly impacts food production, but also damages the ecological environment, thereby manifesting “urban diseases” like flooding and the heat island effect [15,16]. Water, a critical component of the natural environment, is indispensable for both agricultural production and urban development. Considering the significantly higher productivity of the urban and industrial sectors as compared to agriculture, there is a shifting trend of transferring water resources from agricultural and environmental systems to urban areas [17]. Such transfers and depletion of groundwater pose significant threats to food security [18]. The emergence of environmental pollution and degradation resulting from the processes of urbanization and food production has instigated a series of interconnected reactions, posing a critical conflict. The discharge of industrial wastewater and domestic wastewater causes eutrophication and organic pollution in aquatic ecosystems [19]. Excessive use of chemical fertilizers and pesticides renders them indecomposable by soil microorganisms, leading to the contamination of water sources with organic pollutants and heavy metals through precipitation and irrigation [20]. To compound the issue, the decomposition of municipal waste and atmospheric pollution engender acid rain, further depreciating soil quality and compromising food production [21]. Moreover, changes in human lifestyles associated with urbanization have led to the increased consumption of animal-based food, adding pressure on the ecological environment and food security [22]. In essence, it is imperative to recognize the intricate interplay between urbanization, the environment, and food security. Neglecting to establish a harmonious and coordinated equilibrium between them may undoubtedly trigger a domino effect of detrimental consequences that impede the attainment of sustainable development.
Given the escalating global change and the growing human–nature conflict, the international community has recognized the imperative of advancing global sustainable development to ensure the enduring sustenance of human civilization. In response, the United Nations introduced the 2030 Agenda for Sustainable Development in 2015. This comprehensive framework encompasses 17 Sustainable Development Goals (SDGs), which aims to address urgent global challenges and strives to forge a sustainable and prosperous world for both current and future generations [23]. China also released the National Plan and Progress Report on China’s Implementation of the 2030 Agenda for Sustainable Development, signaling to the world its commitment to achieving the SDGs [
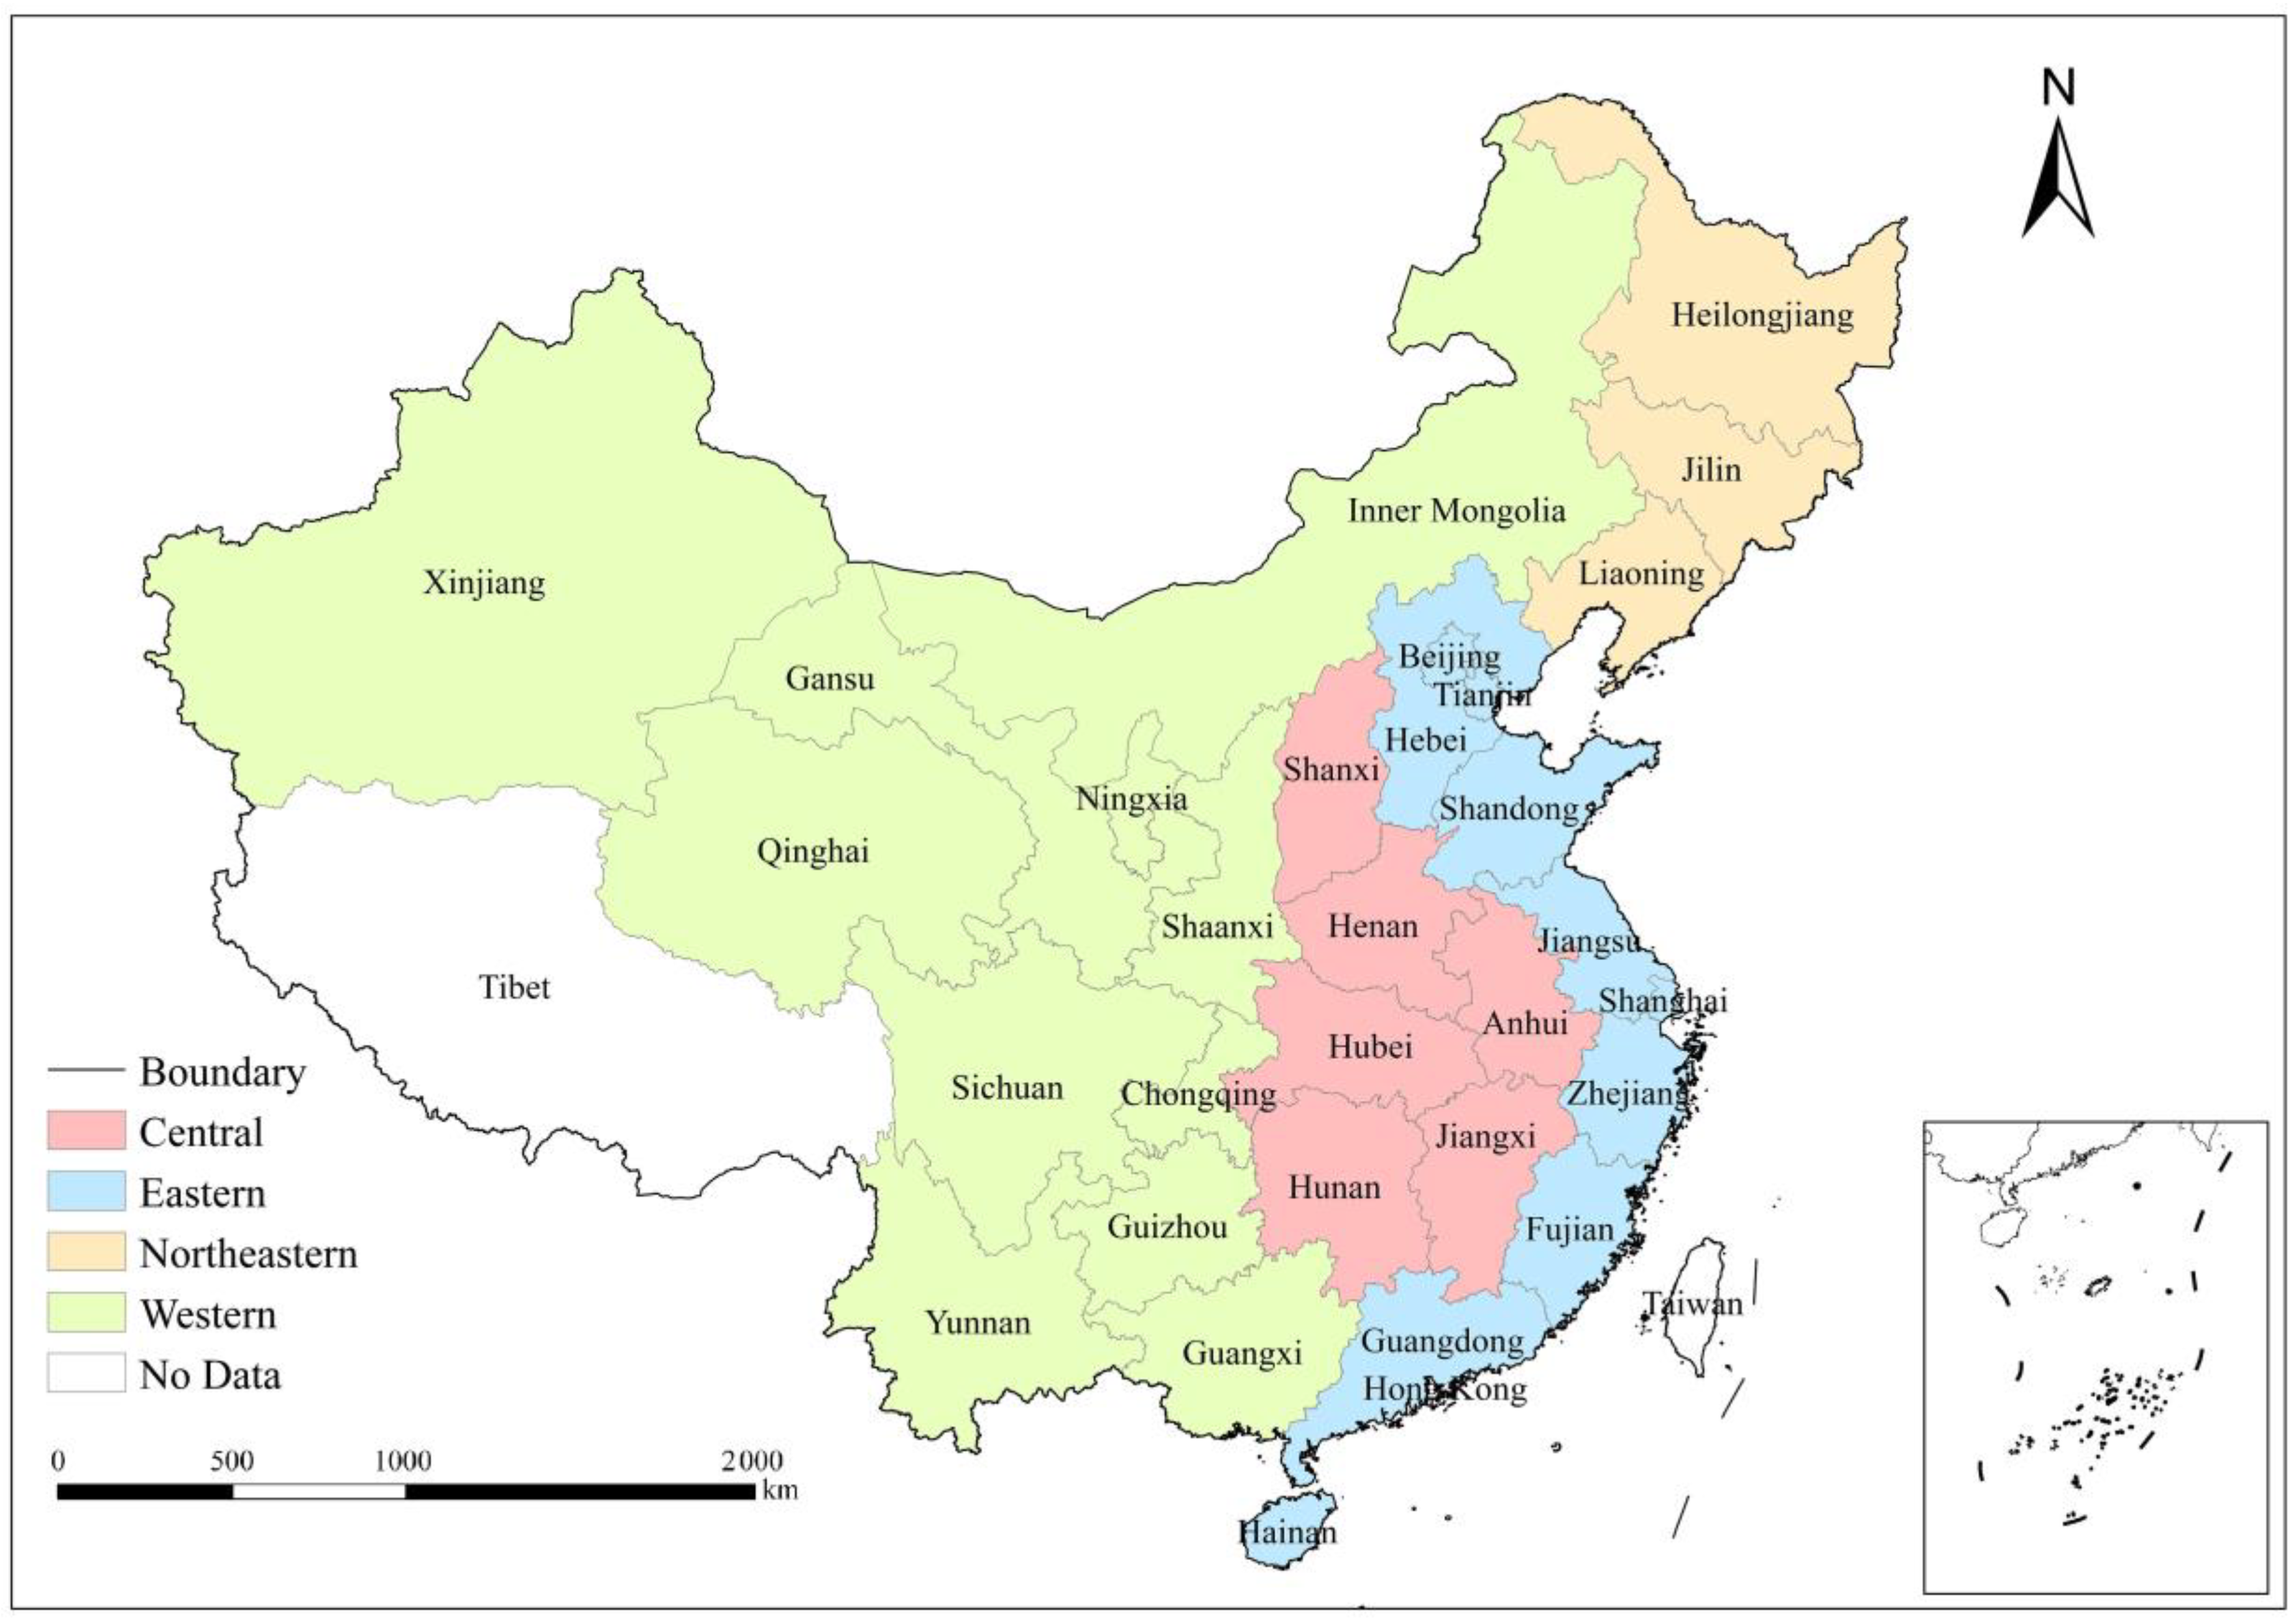
24]. China, being a large and rapidly growing economy, has experienced a notable increase in its urbanization rate, rising from 17.92% in 1978 to 63.89% in 2020. However, it is confronted with numerous serious challenges, particularly in terms of the environment and food security [25,26,27]. Significant ecological and environmental issues, such as air pollution, water pollution, soil erosion, and desertification, persist within China [28,29]. Moreover, China’s per capita arable land falls considerably below the global average, raising concerns about food security on a global scale [30]. The failure to adequately address these issues will undoubtedly impede further advancements in urbanization and economic development. Based on the SDGs on food (SDGs 2), cities (SDGs 11), and the land ecosystem (SDGs 15), promoting coordinated development between urbanization, the environment, and food security assumes critical significance for China and other developing countries in their pursuit of the Sustainable Development Goals.
In reality, the reconciliation of tensions between urbanization, the environment, and food security remains a critical question. In other words, can coordinated development between urbanization, the environment, and food security be achieved? The theory of coordinated development and sustainable development recognizes that economic growth, social progress, and environmental sustainability are not isolated from each other, but are closely interlinked and should be addressed in a coordinated and integrated manner [31]. They advocate a holistic approach to development that pursues economic growth, while benefiting society as a whole and minimizing negative impacts on the environment, thereby achieving sustainable development in harmony with nature [32]. In this context, numerous scholars have delved into the intricate interactions within the coupled social-ecological or human–nature system, revealing the multiple linkages across ecology, society, the economy, resources, energy, and the environment. These studies, with the aim of achieving coordinated development, encompass various themes such as “urbanization and environment” [33,34,35], “social economy and ecological environment” [36,37], “urbanization and food security” [38], “economy–resource–environment” [39,40], “economy–society–environment” [41,42], “energy-economy-ecology” [43], “water–energy–food” [44,45], “urbanization-resources-environment” [46,47], and so on. To investigate the interaction between different systems and evaluate their coordinated development state, the coupling coordination degree model (CCDM) has been widely employed as a research method. For instance, Li and Yi [41] employed the CCDM to assess the sustainability of nine national central cities in China, providing guidance for coordinating the urban economy, society, and the environment. Liu et al. [48] developed a novel framework to measure land use efficiency and quantified the coupling coordination relationship between grain production, economic development, and ecological protection in Jiangsu, China. Dong et al. [49] utilized the CCDM to examine the interactive coupling effect of the economic–social–environmental system in the Yangtze River Delta urban agglomeration in China, thereby facilitating high-quality sustainable urban development.
These studies have significantly advanced the coordinated development of the social economy and the ecological environment and helped to better achieve the SDGs. However, few studies have directly addressed the question of whether and how coordinated development can be achieved between urbanization, the environment, and food security. The answer to this question holds immense importance for China and other developing countries worldwide. Furthermore, most of the existing studies only measure and assess the degree of coordination coupling between different systems and describe their spatial pattern. Research on the spatial heterogeneity of coupling coordination and how to promote the development of inter-regional coupling coordination does not go far enough. Meanwhile, there is a relative lack of research on the influencing factors of coupling coordination.
In light of this, this study aims to deepen the understanding of the overall process on the interaction between urbanization, the environment, and food security (UEFS). It seeks to provide answers to crucial questions regarding the possibility and methods for achieving coordinated development between UEFS. Specifically, this study addresses the following research questions: (1) what is the status of coupling coordination between UEFS? (2) What are the causes behind the spatial heterogeneity of coupling coordination between UEFS? (3) How can the coordinated development between UEFS be promoted? We respond to our aim in three steps, and Figure 2 shows the methodological framework. First, we constructed the index system to evaluate the comprehensive development index (CDI) for urbanization, the environment, and food security. The CCDM was used to evaluate the coupling coordination status between UEFS in China from 2004 to 2020. Secondly, the spatial autocorrelation model and the Dagum Gini coefficient were used to quantify the spatial correlation and heterogeneity. Finally, we used the obstacle diagnosis model to investigate the key factors affecting coordinated development between UEFS. This work provides a new perspective for studying the sustainable urbanization process and offers new quantitative evidence for the coordination between human and natural systems.

2. Materials and Methods

2.1. Data Sources

This research was conducted in the 30 provincial-level administrative regions of China, hereafter referred to as “provinces”. These provinces can be categorized into four regions as per the division criteria provided by the China Statistical Yearbook, namely eastern, central, western, and northeastern regions (Figure 3). The panel data set encompasses data from the 30 Chinese provinces throughout 2004 to 2020. Tibet, Hong Kong, Macau, and Taiwan were excluded from the analysis due to insufficient data availability. The primary source of essential statistics used in this study was the National Bureau of Statistics (http://www.stats.gov.cn/, accessed on 1 January 2023). We also used data from the China Statistical Yearbook, the China Environmental Statistical Yearbook, the China Rural Statistical Yearbook, and the Statistical Yearbooks for each province. It is important to note that some years’ data were found to be incomplete, and we employed the linear interpolation method to fill these gaps by referring to relevant studies [50].

2.2. Evaluation Index System

2.2.1. Evaluation Index System for Urbanization

A multi-dimensional index system is more appropriate and rational to evaluate China’s urbanization [51]. In this study, four dimensions were selected as they are widely used and representative, namely population, economy, space, and society [52,53,54]. The demographic effects of urbanization can be primarily observed through the high concentration of the urban population and the significant influx of rural residents into cities for non-agricultural employment. Thus, indicators such as the proportion of the urban population, urban resident density, and the percentage of employees in non-agricultural industries are used to capture the level of population urbanization [55]. Urbanization also brings about changes in the economic structure and production methods, further accelerating regional economic growth. To assess economic urbanization, indicators such as the per capita GDP, the share of secondary and tertiary industries in terms of GDP, and the per capita disposable income of urban residents are used [56]. The rapid expansion of urban construction land results in the constant growth of the urban built-up area during the urbanization process. Key metrics for measuring spatial urbanization include the per capita urban road area and the proportion of the built-up area compared to the total urban area. Additionally, we take into account the economic efficiency of urban land use by considering the output value per unit of the built-up area [57]. Furthermore, urbanization has social effects that impact individuals’ lifestyles and enhance social services, such as culture, education, and health care. Urban parks contribute to meeting people’s recreational needs and improving their quality of life. [58]. To gauge the level of social urbanization, we selected three indicators: the number of students enrolled in higher education institutions, the number of beds in medical facilities, and the per capita park area.

2.2.2. Evaluation Index System for the Environment

The pressure–state–response (PSR) framework is commonly utilized in environmental assessments [59,60]. The pressure index shows how economic and social activities affect the environment. Indicators including chemical oxygen demand, sulfur dioxide emissions, soot emissions, the generation of industrial solid waste, and electricity consumption are selected to reflect pollutant emissions and energy utilization [34,46]. The environmental state and change at a certain time stage are represented by the state index. The quality of the natural environment can be enhanced by resources allocated for green spaces, which create favorable conditions for human existence. The forest coverage rate and greening rate of built-up areas are the two primary indicators used to describe the availability of green space resources in a region [34,37]. The status index also takes into account the proportion of the desertification land area. Water is widely considered to be the most crucial natural resource for both human existence and economic activities [61]. Therefore, the number of water resources in a particular region can, to some extent, represent the state of the environment [55]. Response indicators illustrate how communities and individuals may act to minimize, avoid, repair, and prevent the negative environmental repercussions of human activities. These indicators include the comprehensive utilization rate of industrial solid waste, the rate of harmless treatment of domestic garbage, and the ratio of investment in environmental pollution control to GDP [37,46].

2.2.3. Evaluation Index System for Food Security

The Committee on World Food Security has identified four crucial parameters for food security: availability, access, utilization, and stability [62]. Furthermore, food production factors and sustainability dimensions are taken into account when assessing food security [63,64]. Factors closely related to grain production have been selected, including the per capita cultivated land area, labor and machinery input per unit area, and water consumption per unit area [65]. Availability and stability represent the quantity and stability of food supply and are the most intuitive perspectives to measure the level of regional food security. The indicators include the per capita grain sown area, the proportion of the area of crops affected by disasters, the per capita grain output, and the per unit area yield of grain. Adequate availability is necessary, but does not ensure universal access to “sufficient, safe, and nutritious food” [66]. Food access encompasses both physical access to the marketplace and economic access to food at the household level. Physical access to food is determined by infrastructure, such as roads and food market outlets; the density of the regional road network is chosen as a metric. Economic access is influenced by household purchasing capacity and current food price levels. We use Engel’s coefficient as an indicator. Sustainability is a key focus of the 2021 UN Food Systems Summit, which emphasizes the long-term functioning of food systems, particularly in a well-balanced interaction with ecosystems. China’s arable land is seriously polluted by non-point sources [67]. The overuse of pesticides, fertilizers, and plastic films has a detrimental impact on the natural environment of the soil, as well as the long-term sustainability of the food system. Thus, the number of fertilizers, pesticides, and plastic films used are selected as indicators to quantify the sustainability dimension of food security.

2.2.4. Weight Determination and Calculation of Comprehensive Development Index

Table 1 shows the evaluation indicators and their corresponding weights for the comprehensive development index for urbanization, the environment, and food security. Initially, the indicator data is standardized utilizing the extreme value method, resulting in a standardized value range from 0 to 1. Subsequently, the objective entropy method and CRITIC method were employed to determine the weight assigned to each indicator within the urbanization system, environment system, and food security system, individually. The final weight for each indicator is the average of the weights obtained from both methods [68,69]. Lastly, a weight summation method is utilized to calculate the comprehensive development index for urbanization, the environment, and food security, respectively [70].

2.3. Coupling Coordination Degree Model (CCDM)

The coupling coordination degree model can describe the link between several subsystems, as well as comprehensively analyze the entire system [60]. It is widely utilized in various fields of study, including the environment, economics, sustainable development, urbanization, etc. [70,71]. The coupling coordination degree model was used to evaluate the coordinated development between urbanization, the environment, and food security in this study.
C = U × E × F / [ ( U + E + F ) / 3 ] 3 1 / 3
T = α U + β E + γ F
D = C × T
where C denotes the coupling degree. U , E and F denote the comprehensive development index for urbanization, the environment, and food security, respectively. T denotes the overall development level of the system. The contributions of each subsystem are α , β , and γ , respectively. We believe that each subsystem is equally important to the coordinated development of the system. Taking into consideration relevant studies [41,42,43,72], this paper ultimately determines that α = β = γ = 1/3. D denotes the value of the coupling coordination degree (CCD). As shown in Table 2, the CCD between urbanization, the environment, and food security was classified into three stages and ten different types [73].

2.4. Spatial Autocorrelation Model

Spatial autocorrelation refers to the relationship between a specific characteristic or phenomenon of a regional unit and its neighboring regional units. It is often employed to uncover the potential interdependence among these phenomena. We used Moran’s I index to reveal the spatial distribution of the CCD between urbanization, the environment, and food security. The formula is as follows:
G l o b a l   M o r a n s   I = n i = 1 n j = 1 n w i j ( D i D ¯ ) × ( D j D ¯ ) ( i = 1 n j = 1 n w i j ) × i = 1 n ( D i D ¯ ) 2
D ¯ = i = 1 n D i n
where n denotes the number of provinces; w i j represents the spatial weight matrix and the geographical distance matrix is used in this study; and D i and D j denote the CCD of region i and j , respectively.
Global spatial autocorrelation cannot reveal the spatial agglomeration or heterogeneity of local regions, while local spatial autocorrelation has the advantage of revealing these spatial characteristics [74]. The formula is as follows:
L o c a l   M o r a n s   I = n ( D i D ¯ ) j = 1 n w i j × ( D j D ¯ ) i = 1 n ( D i D ¯ ) 2

2.5. Dagum Gini Coefficient

The spatial heterogeneity of the CCD between urbanization, the environment, and food security was examined by the Dagum Gini coefficient. Its details and decompositions are shown as follows [75]:
G = j = 1 k h = 1 k i = 1 n j r = 1 n h y j i y h r 2 n 2 y ¯
where y ¯ denotes the mean value of the CCD in China’s 30 provinces, n is the number of provinces, k is the number of regions ( k = 4), y j i ( y h r ) denotes the CCD for each province in j h t h region, and n j ( n h ) is the number of provinces in j ( h ) -th region.
G j j = i = 1 n j r = 1 n j y j i y j r 2 n j 2 Y j ¯
G j h = i = 1 n j r = 1 n h y j i y h r n j n h ( Y j ¯ + Y h ¯ )
G w = j = 1 k G j j p j s j
G n b = j = 2 k h = 1 j 1 G j h ( p j s h + p h s j ) D j h
G t = j = 2 k h = 1 j 1 G j h ( p j s h + p h s j ) ( 1 D j h )
where
p j = n j / n , s j = n j Y j ¯ / n Y ¯ . D j h represents the relative impact of the CCD between the j -th and h -th regions.
D j h = d j h p j h d j h + p j h
d j h = 0 d F j ( y ) 0 y ( y x ) d F h ( x )
p j h = 0 d F h ( y ) 0 y ( y x ) d F j ( x )
where d j h   is the difference in the CCD between the j -th and h -th regions, which can be understood as the mathematical expectation of the sum of all the sample values satisfying     y j i y h r > 0 in the j -th and h -th regions; p j h   is the first moment of transvariation, which can be understood as the mathematical expectation of the sum of all the sample values satisfying   y h r y j i > 0 in the j -th and h -th regions.

2.6. Obstacle Diagnosis Model

The obstacle diagnosis model is a mathematical model based on an evaluation model that identifies obstacles to the development or achievement of the goals of the subject [76]. It can help clarify the obstacle factors affecting the coordinated development between urbanization, the environment, and food security and, then, put forward more targeted strategies. The calculation formula is as follows:
O j = I j × T j j = 1 m I j × T j × 100 %
where O j denotes the obstacle degree of the j -th index or subsystem in the coordinated development between urbanization, the environment, and food security; I j denotes the factor contribution degree, expressed by the index weight w j ; and T j denotes the deviation degree of the index, which represents the deviation between the actual value for each index and the optimal value.

3. Results

3.1. Analysis of Comprehensive Development Index (CDI) for Urbanization, the Environment, and Food Security

3.1.1. Evolution Characteristics of the CDI for Urbanization

As shown in Figure 4a, China has displayed significant progress in urbanization. However, regional disparities remain pronounced. Central and eastern China have shown a higher CDI for urbanization compared to other regions, demonstrating a more balanced development in all four subsystems. On the other hand, western and northeastern China have a relatively low CDI, especially in terms of the land use and population.
Economic urbanization has surged remarkably, increasing from 0.038 in 2004 to 0.110 in 2020. This indicates that economic growth has played a pivotal role in driving China’s urbanization [77]. The improvement of social services is also a crucial aspect of urbanization, with the level of social urbanization witnessing an increase of 0.081 over the research period. On the contrary, population urbanization and land urbanization have shown slower growth rates, expanding by 0.029 and 0.057, respectively. Hence, prioritizing the orderly migration of rural residents to urban areas and the scientific planning of urban spatial expansion should be fundamental to China’s future urbanization efforts.

3.1.2. Evolution Characteristics of the CDI for the Environment

As shown in Figure 4b, the CDI for the environment in central China has shown the most significant improvement, primarily due to advancements in the environmental state and response subsystems. Eastern and western China have exhibited similar levels of improvement, with northeastern China showing the lowest level of progress.
The Chinese government has implemented a series of protective policies for natural resources and the ecological environment, resulting in the noteworthy improvement in the environmental state subsystem. This subsystem has demonstrated an increase from 0.175 in 2004 to 0.220 in 2020. However, the environmental stress and response subsystems still have significant room for improvement. The level of environmental stress has risen slightly from 0.205 to 0.217, indicating the partial alleviation of China’s environmental stress, but falling short of desirable standards. It is worth noting that the extensive development mode, although providing short-term economic benefits, results in the wastage of natural resources and environmental damage, thus compromising sustainability. The level of the environmental response increased from 0.104 to 0.131. Through the implementation of recycling, safe waste disposal, and increased investment in pollution management, we can effectively reduce the excessive burden that humans place on the environment and restore a healthy balance between humans and nature.

3.1.3. Evolution Characteristics of the CDI for Food Security

As shown in Figure 4c, China has strengthened its capacity to ensure food security during the study period. However, significant regional differences in the CDI for food security have emerged. Northeastern China has experienced the most rapid improvement in food security, followed by central and western China, with eastern China showing the least progress.
China’s rapid economic development and infrastructure improvements have contributed to the fastest increase in the access subsystem, rising from 0.050 in 2004 to 0.113 in 2020. This finding shows that Chinese residents have easier access to food security, both financially and geographically. Additionally, China has made advancements in the availability and stability subsystem, witnessing an increase of 0.034. The factor of production subsystem has only grown by 0.004, mainly due to a significant decline in arable land and agricultural labor. Nonetheless, with the advancement in agricultural modernization in China, agricultural machinery has partially replaced manual labor, objectively improving the level of the grain production factors subsystem. The sustainability subsystem shows a declining trend, decreasing by 0.006. Excessive use of chemical fertilizers, pesticides, and plastic films in some areas of China has resulted in non-point source contamination to arable land, jeopardizing sustainable production [78]. It is crucial to address this issue promptly and take measures to prevent further harm to cultivated land and the environment.

3.2. Analysis of the Coupling Coordination between Urbanization, the Environment, and Food Security

The CCD between UEFS in China increased from 0.579 in 2004 to 0.695 in 2020. Accordingly, the coordinated development between UEFS evolved from slight coordination to primary coupling coordination (Table 2). Central China experienced the greatest advancement in the coordinated development between UEFS, followed by western China, northeastern China, and finally eastern China. In 2004, only eastern China had reached the highly coordinated stage, while the other regions were in a transitional stage (Figure 5). Eight provinces within the eastern region, namely Beijing, Tianjin, Shanghai, Jiangsu, Zhejiang, Fujian, Guangdong, and Hainan, were categorized under the primary coupling coordination type (Figure 6a). The remaining provinces in China were categorized under the slight coordination type. By 2020, all regions had successfully reached the highly coordinated stage. Thirteen provinces were categorized under the moderate coupling coordination type, with seven in the east (Beijing, Shanghai, Jiangsu, Zhejiang, Fujian, Shandong, and Guangdong), five in the middle (Anhui, Jiangxi, Henan, Hubei, and Hunan), and one in the west (Chongqing). The remaining provinces were categorized under the primary coupling coordination type.
To analyze the spatial evolution of CCD between UEFS in China, trend surface analysis maps were generated using the geostatistical analysis module in ArcMap 10.7 [24]. In Figure 5b,c, the X, Y, and Z axes correspond to the longitude, latitude, and CCD between UEFS, respectively. The evolution trend of the CCD in the east–west direction shows a transition from a “diagonal” shape to an “inverted U” shape. This indicates that the coordinated development between UEFS in central China has progressed quickly, narrowing the gap with eastern China, but widening the gap with western China. In the north–south direction, the evolution trend of CCD changes from a “U” shape to an “inverted U” shape. This indicates that the gap in the coordinated development between UEFS in northern and southern China is widening. In summary, eastern China demonstrates better coordinated development between UEFS compared to western China, while southern China outperforms northern China in terms of this coordination.

3.3. Spatial Correlation of Coordinated Development between UEFS

Table 3 shows that the global Moran’s I index for the coupling coordination degree between urbanization, the environment, and food security from 2004 to 2020 passed the significance test. This finding suggests that the coordinated development between UEFS in China has positive spatial dependence and spatial spillover effects. Specifically, provinces with high or low CCD between UEFS tend to be geographically adjacent to other provinces with similar values. Furthermore, there was an upward trend in Moran’s I index, suggesting an increase in inter-regional agglomeration.
The results from the local spatial autocorrelation analysis, illustrated in Figure 7, reveal three types of aggregations in the CCD between UEFS in China: the “Low-Low” cluster, the “Low-High” outlier, and the “High-High” cluster. Over time, the “Low-High” type of CCD gradually diminishes and eventually disappears. The “Low-Low” type of CCD remains concentrated in northwest China, while the “High-High” type of CCD remains concentrated in southeast China, highlighting a pronounced regional disparity in the coordinated development between UEFS.
Northwest China has a vast territory and abundant resources. However, it faces ecological fragility and has a sparse population. The inhospitable natural environment poses challenges to urbanization in these areas and hinders the attraction of human and financial capital. Exploiting natural resources in the northwest necessitates significant financial and technical resources, which are often lacking, impeding the ability to overcome the “resource curse”. Consequently, resource exploitation remains inefficient and pollution levels are severe. Moreover, the region experiences serious soil erosion and desertification, worsened by unfavorable natural conditions and climatic circumstances. These factors compromise the effectiveness of the food security system. Owing to the dual challenges of poor natural conditions and inadequate economic and technical capital, northwest China has the lowest CCD between UEFS, resulting in a “Low-Low” cluster pattern.
In contrast, southeast China functions as the economic development core, benefiting from its exceptional natural environment and advanced technology. Although, the growing conflict between humans and nature jeopardizes the sustainability of the environment and food security. The southeast, however, has substantial economic and technical capabilities to more comprehensively optimize the exploitation of natural resources, such as land and water. Through reductions in pollution and a balanced interaction between humans and nature, the southeast region exhibits a more comprehensive approach to coordinated development between UEFS, resulting in a “High-High” cluster pattern.

3.4. Spatial Heterogeneity of the Coordinated Development between UEFS

The spatial heterogeneity of the coupling coordination degree between urbanization, the environment, and food security was measured using the Dagum Gini coefficient, as shown in Table 4. The overall Gini coefficient declined from 0.040 in 2004 to 0.029 in 2013, followed by a slight fluctuation, leading to a value of 0.031 in 2020. This indicates that the spatial heterogeneity of the coordinated development between UEFS has somewhat reduced at the national level. Regarding the intra-regional Gini coefficients, except for the eastern region, the Gini coefficients in other regions generally show an increasing trend, suggesting an increase in the heterogeneity of the CCD within these regions. With respect to inter-regional Gini coefficients, the heterogeneity of the CCD between the central and western regions, as well as between the central and northeastern regions, has increased, while the differences between the other regions have narrowed.
Examining the sources of regional heterogeneity in the CCD between UEFS, it is observed that the contribution rate of intra-regional differences (Gw) to the overall difference increased from 17.1% to 22.8%. The contribution rate of inter-regional differences (Gnb) to the overall difference decreased from 77.9% to 61.6%. Additionally, the contribution rate of the transvariation density (Gt) to the overall difference increased from 3.1% to 17.2%. Therefore, the inter-regional differences (Gnb) continue to be the primary cause of the uneven coordinated development between UEFS in China.

3.5. Diagnosis of Factors Influencing the Coordinated Development between UEFS

3.5.1. Obstacle Degree in System Layer

Figure 8 shows the obstacle degree in the system layer for the coordinated development between UEFS in China and in different regions. In 2004, the obstacle degree for urbanization, the environment, and food security in China were 39.57%, 26.67%, and 33.76%, respectively. By 2020, the obstacle degree for the three aspects were 35.06%, 28.30%, and 36.64%, respectively. This indicates a shift in the biggest obstacle from urbanization to food security in achieving the coordinated development between UEFS in China.
From a regional perspective, urbanization posed the highest obstacle degree for all regions in 2004, followed by food security and the environment. However, by 2020, there has been a shift in the greatest obstacle. Food security has become the major obstacle in eastern, central, and western China, while urbanization remains the biggest impediment in northeastern China. Additionally, the obstacle degree for urbanization showed a declining trend in each region, while the obstacle degree for the environment exhibited an upward trend. With the exception of northeastern China, the obstacle degree for food security has increased in other regions.

3.5.2. Obstacle Degree in Subsystem Layer

Figure 9 shows the obstacle degree in the subsystem layer for the coordinated development between UEFS in China and in different regions. In terms of urbanization, the obstacle degree gradually increased in the land use and population subsystems, while the social and economic subsystems experienced a gradual decrease. In 2020, the land use and population subsystems displayed the highest obstacle degree. This indicates that the issue of conflicting interests between human activities and land use becomes increasingly prominent during the process of urbanization. Balancing this relationship is essential to promote further urbanization development and coordinated development between UEFS.
In terms of the environment, the obstacle degree in different subsystems show a fluctuation trend. It is obvious that the state subsystem posed the greatest obstacle degree, followed by the response subsystem, and finally the pressure subsystem. This highlights the significance of enhancing the environmental state to improve the comprehensive development index for the environment. Poor environmental conditions will greatly hinder the coordinated development between UEFS, ultimately jeopardizing sustainability.
In terms of food security, the obstacle degree for the access subsystem decreases gradually, while the obstacle degree for other subsystems increase gradually. The production factors subsystem has the highest obstacle degree, followed by the availability and stability subsystem, the access subsystem, and finally the sustainability subsystem. This underlines the critical importance of sufficient grain production factors and stable food supply levels in ensuring food security. These two subsystems also present major obstacles to achieving coordinated development between UEFS.

3.5.3. Obstacle Degree in Indicator Layer

Due to space limitations, Table 5 presents the key obstacle factors influencing the CDI for urbanization, the environment, and food security. Generally, the primary obstacle factors affecting the CDI for urbanization include U7, U2, U12, and U10, with the cumulative degree of the top three obstacle factors exceeding 35%. The primary obstacle factors affecting the CDI for the environment include E8, E10, and E6, with the cumulative degree of the top three obstacle factors all exceeding 60%. The primary obstacle factors affecting the CDI for food security are F4, F1, F5, F3, and F9, with the cumulative degree of the top three obstacle factors all exceeding 35%.
Table 6 shows the primary obstacle factors that play a key role in the coordinated development between UEFS. In 2020, the top nine obstacle factors influencing the coordinated development between UEFS in China are E8, E10, F4, F1, U7, F5, U2, E6, and F3. These factors correspond to the population and land use subsystem within the urbanization indicator system, the state and response subsystem within the environmental indicator system, and the factors of production and availability and stability subsystem within the food security indicator system. Further analysis reveals that the primary obstacle factors affecting the coordinated development between UEFS are primarily concentrated in three aspects: resource endowment (E8, E6, F4, and F1), resource utilization efficiency (U2, U7, F5, and F3), and environmental pollution control (E10).

4. Discussion

4.1. Coordinated Development between UEFS in Different Regions

Promoting coordinated development between urbanization, the environment, and food security (UEFS) is imperative in addressing global change and achieving the Sustainable Development Goals. However, there is a lack of direct research concerning the feasibility and strategies for achieving such coordination. Consequently, this study examines the coupling coordination and spatial heterogeneity between UEFS in China, the world’s largest developing country, as a case study. The research results affirm that coordinated development between UEFS is indeed achievable. Through the in-depth analysis of various regions within China, two important findings emerge: the existence of the “buckets effect” will constrain further coordinated development between UESF, and coordinated development is not the simultaneous development of all the parts, but emphasizes structural optimization and overall optimization.
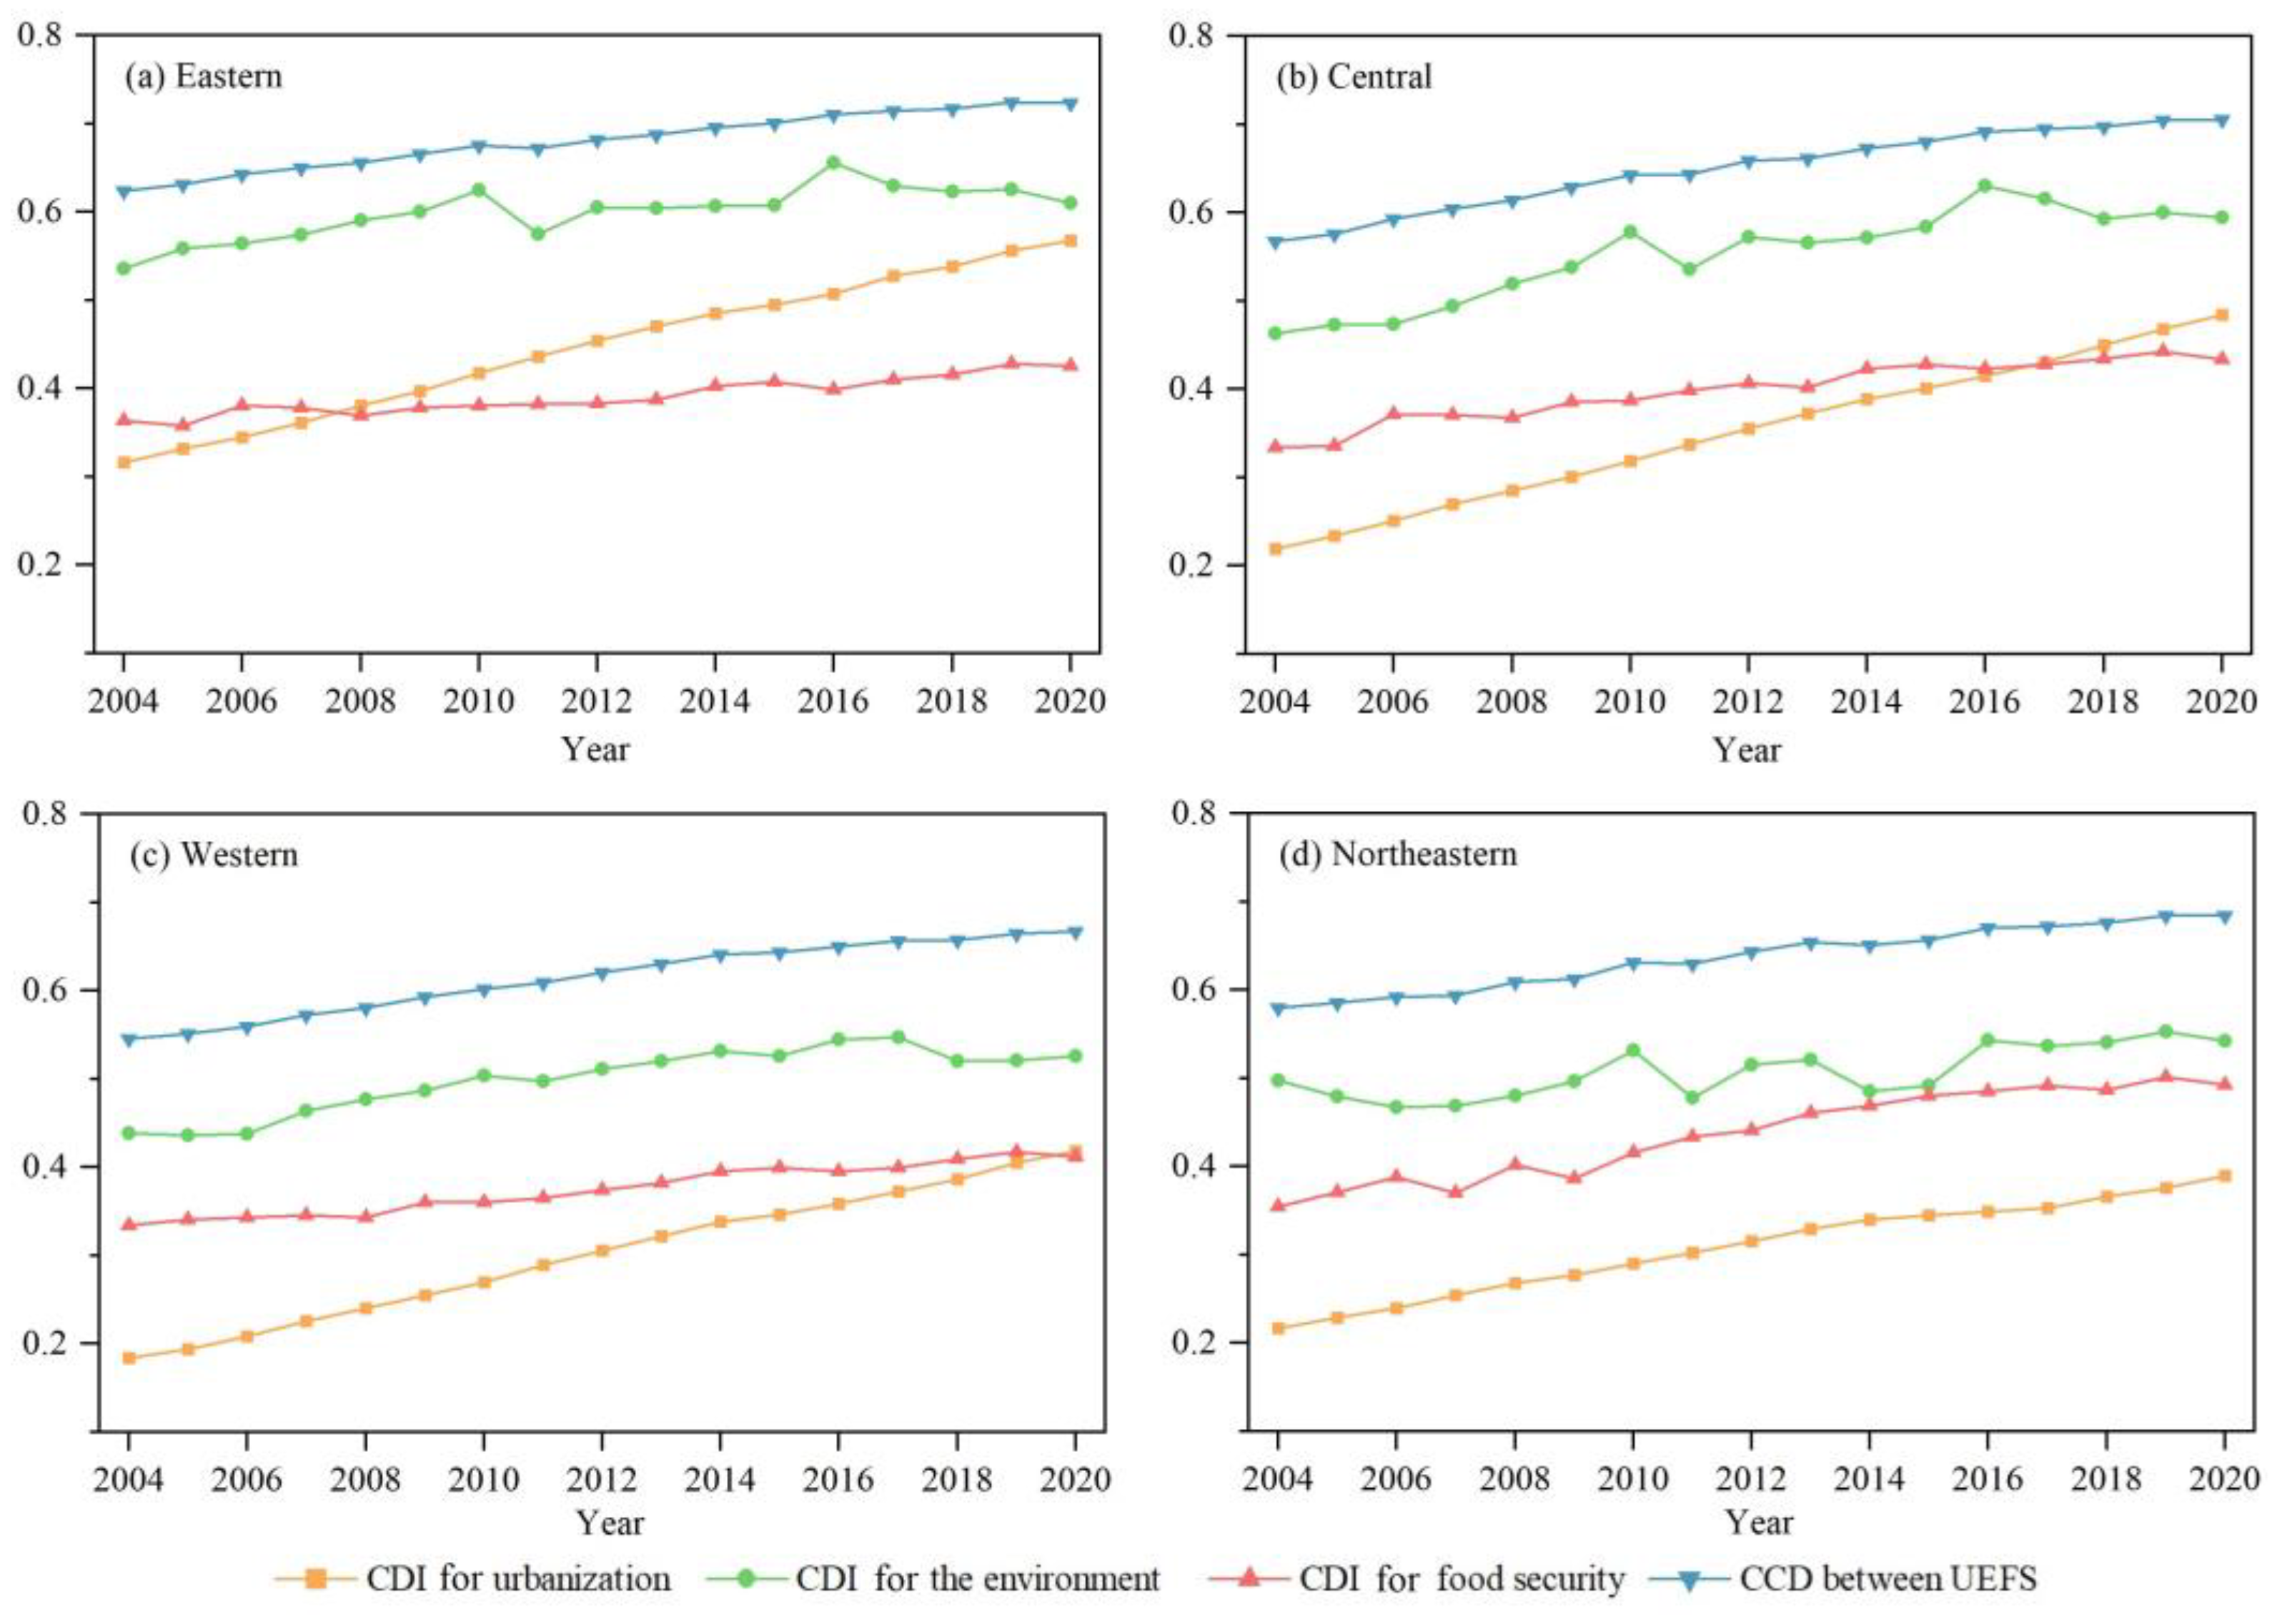
Eastern China has witnessed the slowest improvement in CCD between UEFS due to the “buckets effect” caused by the low CDI for food security. The CDI for urbanization and the environment in eastern China is prominent, leading to the highest level of CCD between UEFS (Figure 4a). With its cutting-edge manufacturing concepts and technology, it may achieve the optimal utilization of resources and lower pollutant emissions for social and economic growth [79,80]. Governments in eastern China are also paying more attention to environmental protection [
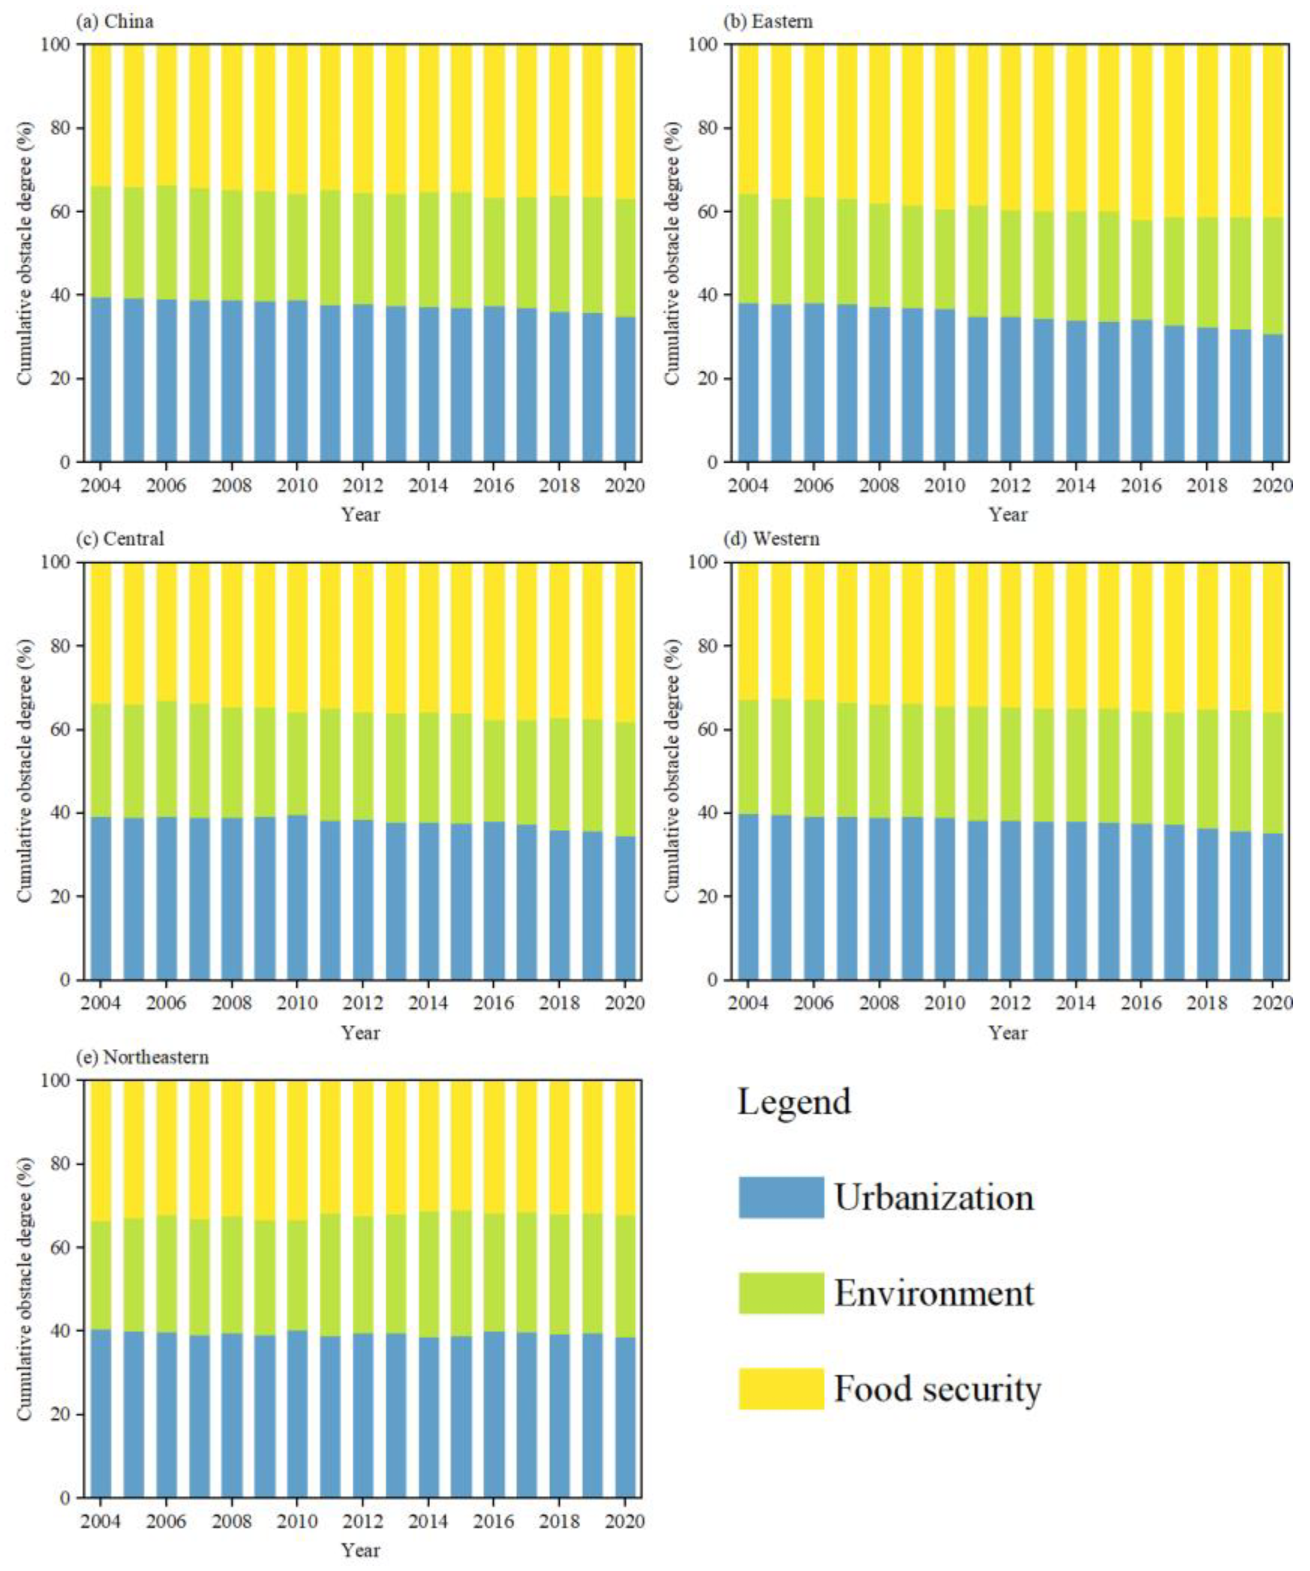
81]. However, the greatest obstacle degree hindering coordinated development between UEFS stems from food security (Figure 8b). Adequate arable land, a crucial condition for ensuring a stable food supply, has been extensively converted for urban construction due to rapid urbanization. Moreover, a high population density has exacerbated the pressure on food supplies, resulting in the lowest level in terms of food availability and stability [82].
In northeastern China, the coordinated development between UEFS faces constraints due to the “buckets effect” caused by the low CDI for urbanization. With a vast plain of black soil excellent for cultivation and the widespread adoption of mechanization, northeastern China serves as the country’s principal grain producing base [83]. The CDI for food security in northeastern China has increased rapidly, greatly promoting the coordinated development between UEFS (Figure 4d). However, the obstacle degree for urbanization in northeastern China is the biggest, followed by the environment (Figure 8b). The region lacks systematic and scientific planning for urban development and ignores the improvement in land use efficiency. Thus, numerous “ghost towns” characterized by tall buildings and wide streets, but with sparse populations, have emerged [84,85] Moreover, urbanization in northeastern China has stalled due to a lack of economic impetus and a reliance on heavy industry, which lacks innovative manufacturing technologies and involves outdated industrial organization [86]. Large quantities of pollutants discharged from industrial activities do great harm to the environment.
Central China has witnessed the fastest improvement in CCD between UEFS due to structural optimization and overall optimization of each part (Figure 4b). Since the implementation of the plan for promoting the development of central China, economic development and urbanization have accelerated, and high-tech industries and modern manufacturing have developed rapidly [87]. In addition, central China has vigorously promoted a resource-saving and environmentally friendly development model, gradually replacing the previous high-pollution and high-emissions development approach [88]. This shift has enhanced resource utilization and alleviated the pressure on the ecological environment. Central China has always been the main grain production base because of its favorable climate and abundant water and land resources [89]. In the process of social and economic development, it attaches great importance to balancing the relationship between people and land, thus realizing the rapid improvement of the CDI for food security. Consequently, great progress has been made in the coordinated development between UEFS.
Western China exhibits the smallest gap in the CDI for urbanization, the environment, and food security, but demonstrates the lowest level of CCD between UEFS (Figure 4c). This region faces environmental vulnerability, with challenging natural conditions, inadequate water resources, and serious desertification in most areas [90]. Serious soil erosion, a fragile ecological environment, and poor land resources greatly restrict the improvement of the CDI for the environment and food security. Although the CDI for urbanization has improved significantly, the economic development mode remains extensive, relying primarily on energy-intensive and highly polluting industries [91]. Challenges persist in resource utilization efficiency and environmental protection. The harsh natural environment and extensive development mode aggravate the friction and hinder coordinated development between UEFS.

4.2. Key Factors Influencing the Coordinated Development between UEFS

This study identifies the primary obstacle factors affecting the coordinated development between UEFS at multiple levels. At the systemic level, the foremost obstacle to the coordinated development between UEFS in China lies in the low comprehensive development index for food security. Extensive research has also increasingly emphasized the significance of enhancing the food security level for China’s future sustainable development [38,92]. At the subsystem level, the dimensions on land use, environmental status, and food production factors emerge as the most prominent barriers. Indicators exhibiting a high obstacle degree within these dimensions can be categorized as follows: natural resource endowment (E8, F1, E6), resource utilization efficiency (U7, F5, U2, F4, F3), and environmental pollution control (E10).
Urbanization, the environment, and food security are integral components of the human–natural system, all of which rely significantly on natural resources. The availability and quality of natural resources have a direct impact on their coordinated development. Recent studies have recognized insufficient land and water endowment as major obstacles to the coordinated development of subsystems in coupled socio-ecological systems [93,94]. Therefore, optimizing their distribution in different sectors, while facing limited resources, becomes a challenging task for achieving the coordinated development between UEFS, and an essential consideration for sustainability [95,96]. Additionally, improving the efficiency of resource utilization is fundamental to overcoming the limitations of scarce resources and serves as the most effective and promising pathway toward achieving coordinated development between UEFS. However, China, like many other developing countries, faces the challenge of low per capita availability of natural resources and low efficiency in their utilization [97]. This study reveals that inefficient land resource utilization stands out as a prominent obstacle to the coordinated development between UEFS in China. The disorderly expansion of urban space during the process of urbanization leads to insufficiently intensive urban land use and underutilization of its potential [98]. In agricultural production, arable land resources are not fully utilized, resulting in land abandonment and the inadequate input of production factors, ultimately hindering agricultural output from reaching optimal levels [99,100]. Furthermore, strengthening the control and management of environmental pollution will play a pivotal role in promoting the coordinated development between UEFS in China. Given that China and other developing countries are at a critical stage of industrialization, there is inevitably pressure on the ecological environment. The environmental Kuznets curve elucidates the relationship between economic development and environmental impact, emphasizing that economic development and environmental protection are not irreconcilable contradictions [101]. While negative environmental impacts may increase during the initial stage of economic development, technological advancements and improved environmental governance can effectively control and reduce these impacts [102]. Nevertheless, it is important to note that the environmental Kuznets curve does not ensure the automatic resolution of environmental problems. Rather, it presents the potential of reducing the extent of environmental damage through appropriate policies and actions throughout economic development, which aligns with China’s future endeavors to promote coordinated development between UEFS.

4.3. Policy Implications

By shedding light on the importance of coordinated development, this research contributes to the advancement of Sustainable Development Goals and the harmonious integration of urbanization, environmental preservation, and food security. The following policy recommendations are proposed:
(1) Formulate targeted regional sustainable development strategies to counteract the unbalanced growth pattern between urbanization, the environment, and food security. The “buckets effect” poses a considerable constraint to further coordinated development. Given the pronounced disparities in coupling coordination degrees and spatial heterogeneity across regions, each region must devise strategies that specifically target challenges and address weaknesses.
(2) Implement policies and measures to strengthen resource management and rationalize the use of natural resources, especially land and water. The efficient utilization of natural resource endowment poses a key challenge to sustainable development. The government must address significant obstacles related to land use during the urbanization process. This involves optimizing land allocation through effective urban planning, improving land resource utilization efficiency, and safeguarding agricultural land to ensure adequate food supply. Additionally, the adoption of sustainable water resource management methods and the promotion of economical water usage across all sectors are of utmost importance.
(3) Emphasize the pivotal role of environmental protection in sustainable development, with a focus on reducing resource wastage and pollutant emissions. The promotion of sustainable practices necessitates improving resource utilization efficiency and bolstering environmental pollution control measures. Governments should increase investment in environmental pollution control, improve waste management throughout the production process, adopt cleaner production technologies, advocate for renewable energy sources, and enforce stricter regulations to minimize the environmental impact.
(4) Optimize factor inputs for food production and bolster the technical efficiency of agricultural production. Given that food security has become a major obstacle to sustainable development, diversified and comprehensive measures should be adopted to promote comprehensive food security. The government should advocate for green and high-quality agricultural development, reduce excessive pesticide and chemical fertilizer usage, address non-point source pollution issues, and enhance the sustainable production capacity of arable land. Furthermore, improvements in rural infrastructure and the implementation of effective food distribution and storage systems are necessary to reduce losses during transportation and processing. Upgrading agricultural mechanization will also enhance agricultural production factors, ensuring an adequate and secure food supply.

4.4. Limitations and Prospects

Due to the relatively long research period and large-scale research units, we encountered great obstacles in data collection, leading to a limited scope of the study. There is still room for improvement in the indicator system, and it is important to acknowledge that certain indicators may not represent the optimal choice. However, considering the continuity and availability of data, they are currently the most appropriate selection. In our future research, we will enhance the indicator system. For instance, we will incorporate air quality indicators and ecosystem service indicators into environmental assessments. We will also consider integrating statistical data with satellite remote sensing data. Furthermore, we intend to employ China’s municipal or county-level administrative regions as research units in future studies to attain more precise and targeted outcomes. Regarding the research methodology, we plan to apply system dynamics modeling to delve into the coordinated development between urbanization, the environment, and food security, thereby uncovering the underlying interaction mechanisms among these factors in greater depth.

5. Conclusions

To enhance the equilibrium between the human–natural system and facilitate China’s pursuit of Sustainable Development Goals, this paper constructs a comprehensive development index evaluation indicator system for urbanization, the environment, and food security based on authoritative statistical data published by the Chinese government, and studies their coupling coordination and spatial heterogeneity from 2004 to 2020, by using the coupling coordination model, the spatial correlation model, the Dagum Gini coefficient, and the obstacle degree model. The main conclusions are as follows:
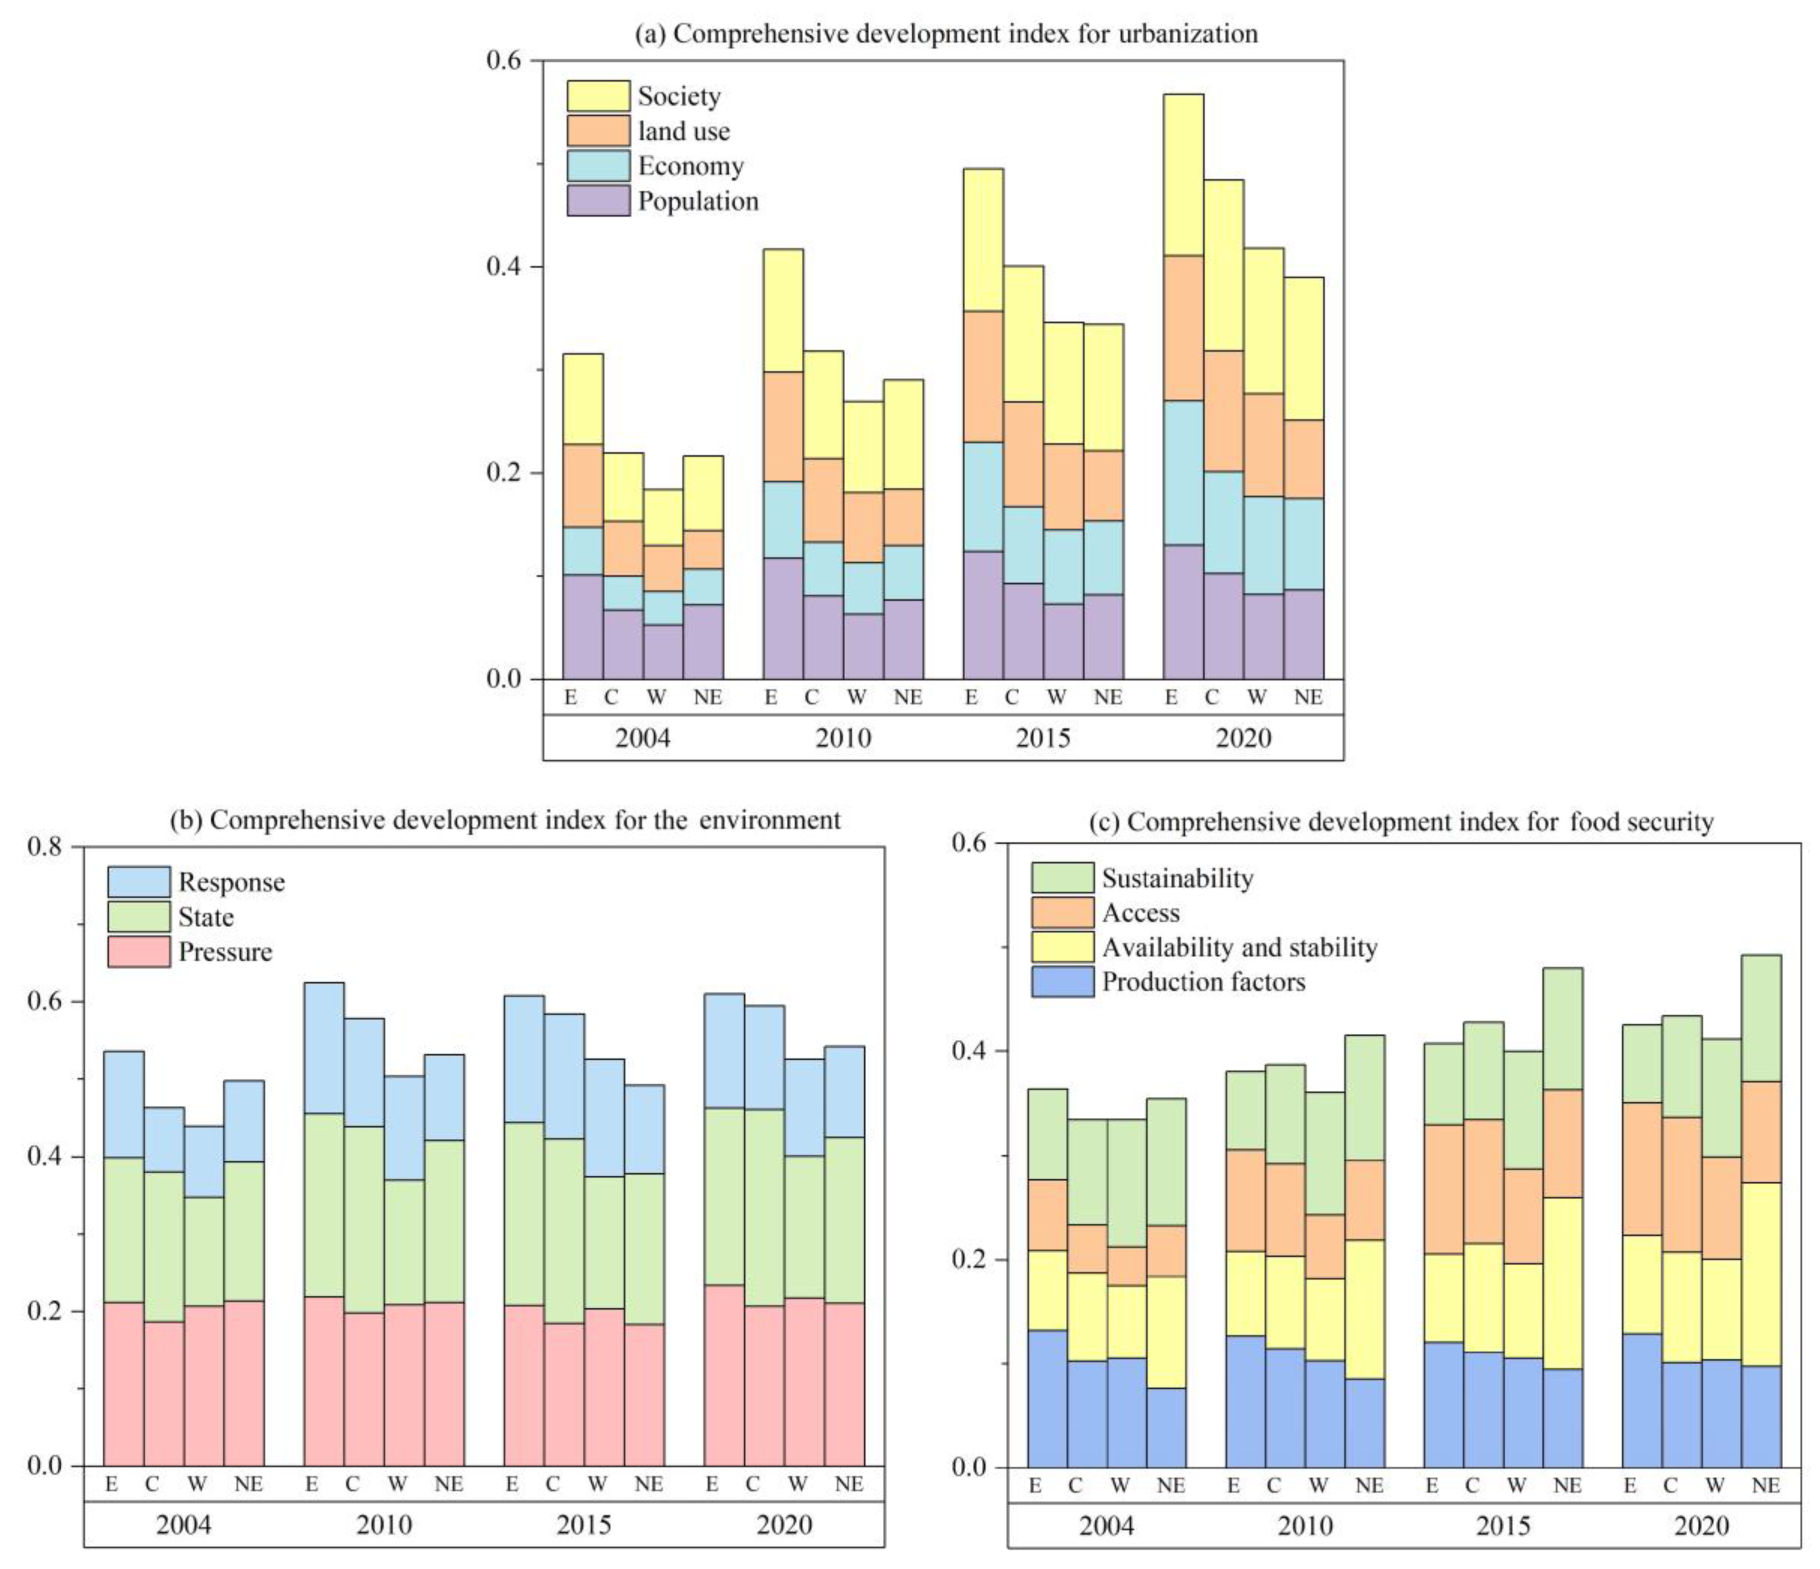
(1) During the study period, the comprehensive development index for urbanization, the environment, and food security in China exhibited uneven growth patterns. Urbanization experienced a notably faster growth rate compared to the environment and food security. Eastern and central regions of China demonstrated higher comprehensive development indexes for urbanization and the environment, while northeastern China displayed a higher comprehensive development index for food security.
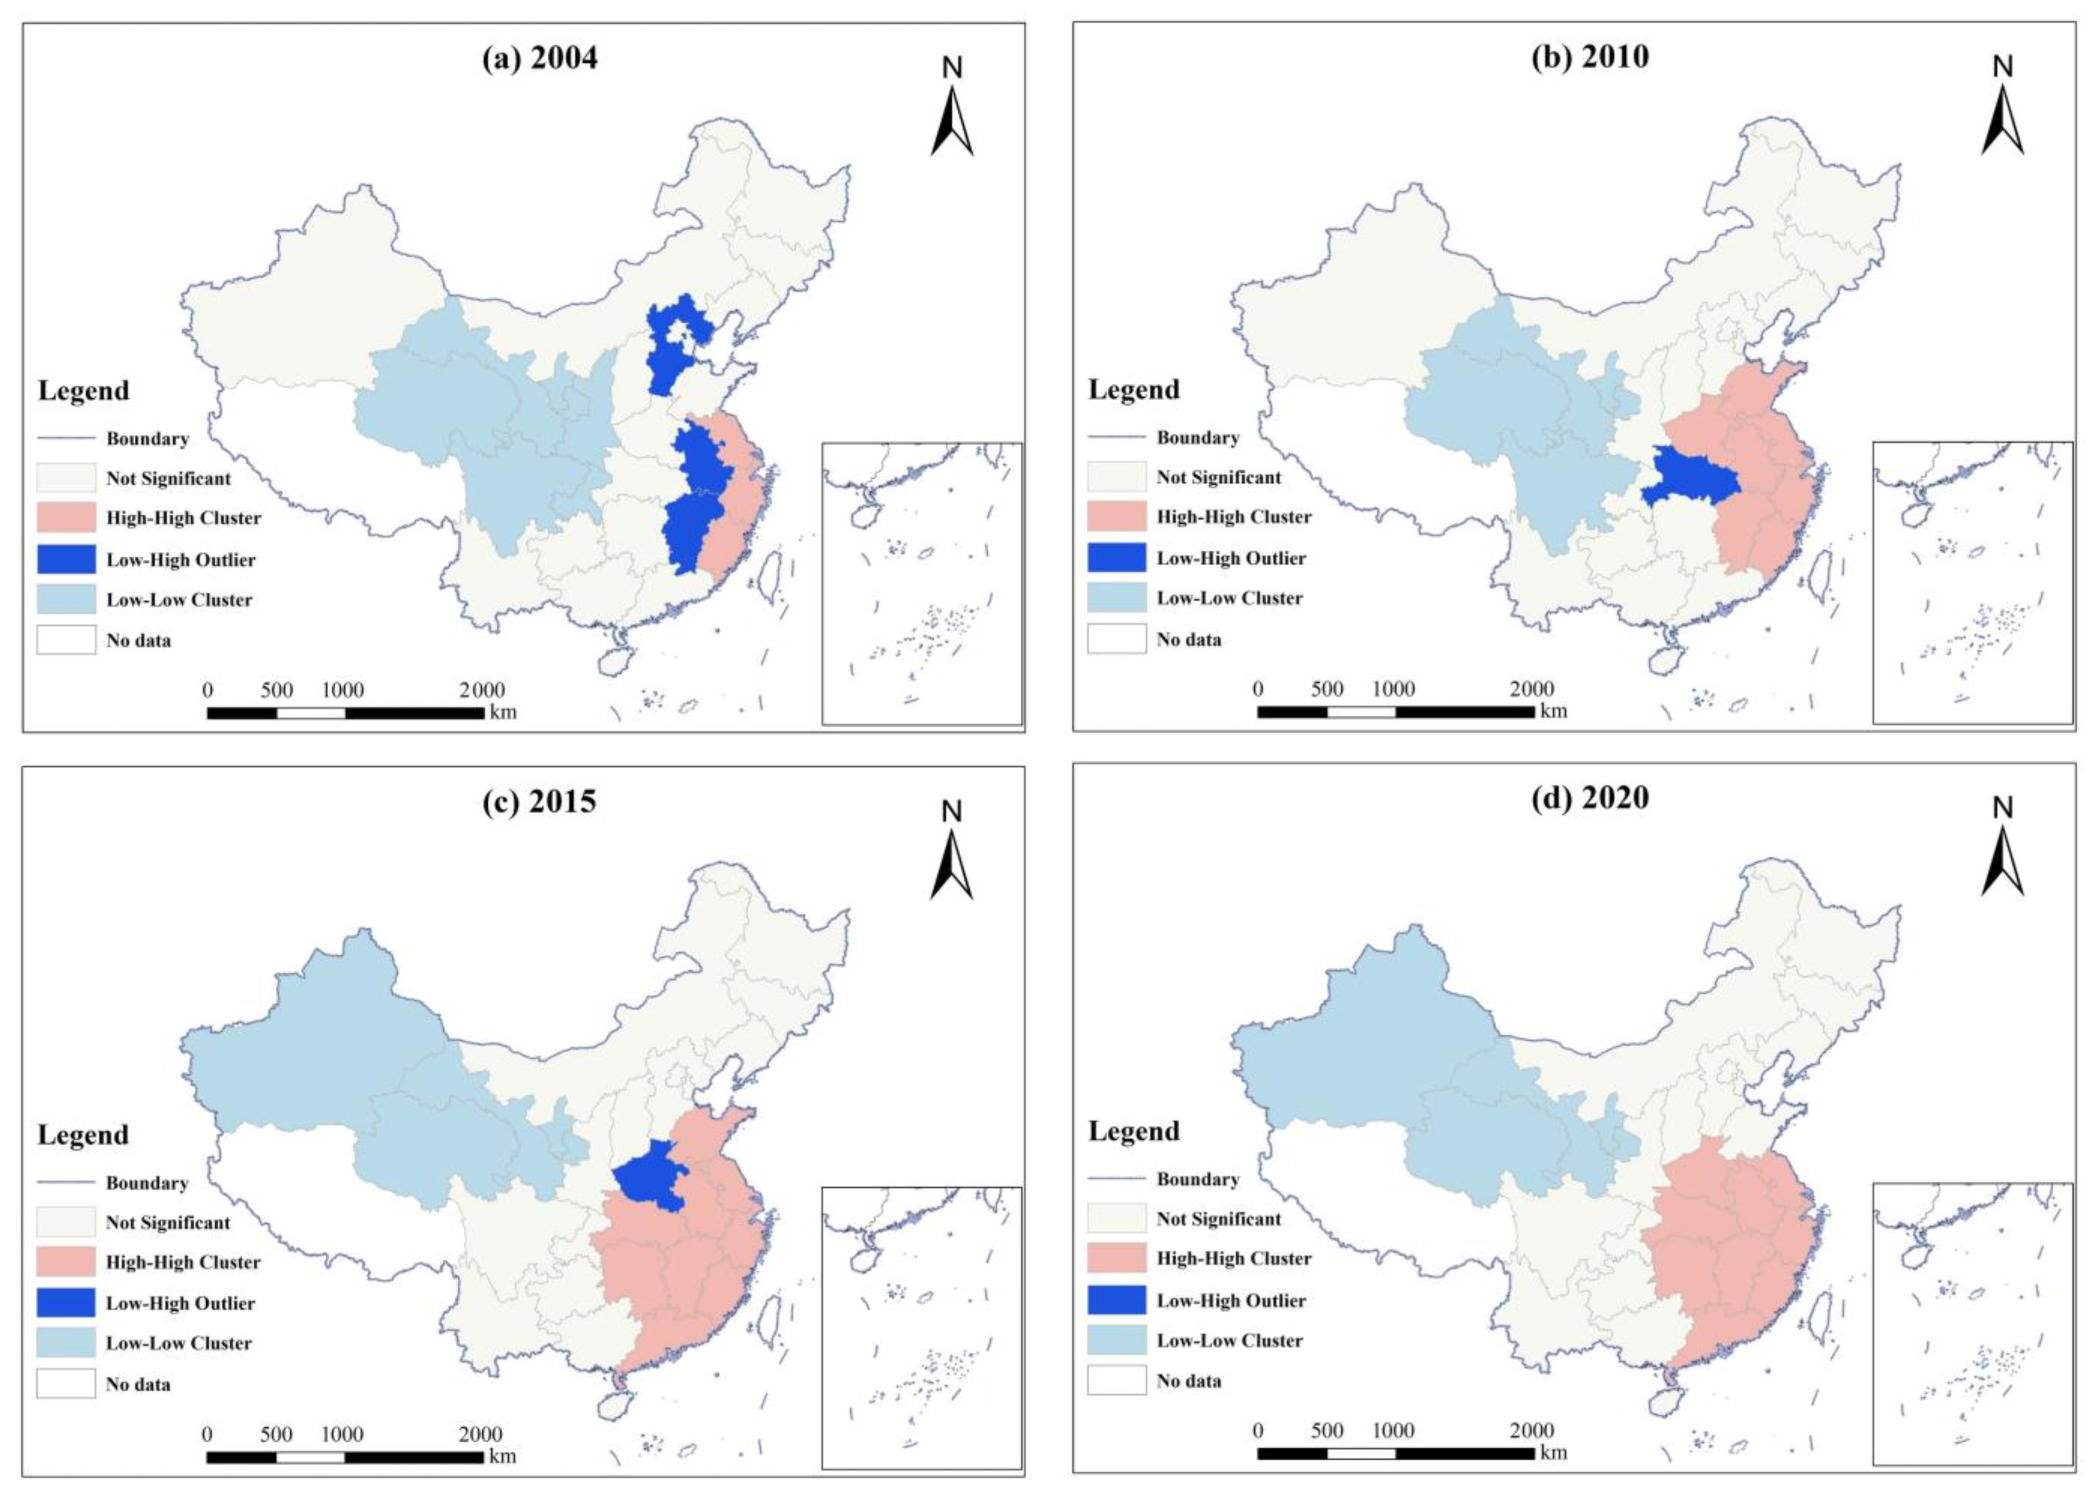
(2) China has achieved a remarkable level of coordinated development between urbanization, the environment, and food security, evidenced by a significant increase in the coupling coordination degree. There exists a strong positive spatial correlation in the coupling coordination degree, with “Low-Low” clusters predominantly concentrated in northwest China and “High-High” clusters predominantly concentrated in southeast China, thereby revealing distinct regional differences. The findings obtained through the Dagum Gini coefficient suggest that inter-regional differences serve as the primary source of spatial heterogeneity in the coordinated development between urbanization, the environment, and food security in China.
(3) The obstacle degree model highlights that food security has superseded urbanization as the most significant barrier to the coordinated development of urbanization, the environment, and food security in China. Among the dimensions of the comprehensive development index, the land use dimension of urbanization, the status dimension of the environment, and the production factor dimension of food security exhibit the most prominent obstacles. Key factors impeding the coordinated development between urbanization, the environment, and food security in China include natural resource endowment (E8, F1, E6), resource utilization efficiency (U7, F5, U2, F4, F3), and environmental pollution control (E10).

Author Contributions

Conceptualization, Q.Y. and L.C.; methodology, Q.Y., L.C. and J.L.; software, Q.W., X.D. and W.S.; formal analysis, Q.Y., L.C. and J.L.; resources, H.T.; data curation, L.C. and Q.W.; writing—original draft preparation, Q.Y. and L.C.; writing—review and editing, Q.Y. and L.C.; visualization, L.C.; supervision, H.T. and W.S.; project administration, Q.Y. and H.T.; funding acquisition, Q.Y. and X.D. All authors have read and agreed to the published version of the manuscript.

Funding

This research was funded by the National Social Science Fund of China (grant no. 23XJY015), the Philosophy and Social Science Planning Project of Chengdu (grant no. 2022C04), the 2023 Chengdu Green Low Carbon Research Base Project (grant no. LD23YB02), the Open Fund of Sichuan Province Cyclic Economy Research Center (grant no. XHJJ-2207), and the 2023 Sichuan Porvincial Science and Technology Activity Program for Returned Scholars from Overseas (grant no. 24, Start-Up Projects).

Data Availability Statement

Data available on request.

Conflicts of Interest

The authors declare no conflict of interest.

References

  1. Guan, X.; Wei, H.; Lu, S.; Dai, Q.; Su, H. Assessment on the urbanization strategy in China: Achievements, challenges and reflections. Habitat Int. 2018, 71, 97–109. [Google Scholar] [CrossRef]
  2. Cai, Z.; Liu, Q.; Cao, S. Real estate supports rapid development of China’s urbanization. Land Use Policy 2020, 95, 104582. [Google Scholar] [CrossRef]
  3. Du Pisani, J.A. Sustainable development–historical roots of the concept. Environ. Sci. 2006, 3, 83–96. [Google Scholar] [CrossRef]
  4. Vardhan, K.H.; Kumar, P.S.; Panda, R.C. A review on heavy metal pollution, toxicity and remedial measures: Current trends and future perspectives. J. Mol. Liq. 2019, 290, 111197. [Google Scholar] [CrossRef]
  5. Wang, J.; Zhou, W.; Pickett, S.T.; Yu, W.; Li, W. A multiscale analysis of urbanization effects on ecosystem services supply in an urban megaregion. Sci. Total Environ. 2019, 662, 824–833. [Google Scholar] [CrossRef]
  6. Hu, C.; Song, M.; Zhang, A. Dynamics of the eco-environmental quality in response to land use changes in rapidly urbanizing areas: A case study of Wuhan, China from 2000 to 2018. J. Geogr. Sci. 2023, 33, 245–265. [Google Scholar] [CrossRef]
  7. Pouliot, S.; Sumner, D.A. Traceability, liability, and incentives for food safety and quality. Am. J. Agric. Econ. 2008, 90, 15–27. [Google Scholar] [CrossRef]
  8. Lambin, E.F.; Meyfroidt, P. Global land use change, economic globalization, and the looming land scarcity. Proc. Natl. Acad. Sci. USA 2011, 108, 3465–3472. [Google Scholar] [CrossRef]
  9. Almulhim, A.I.; Cobbinah, P.B. Can rapid urbanization be sustainable? The case of Saudi Arabian cities. Habitat Int. 2023, 139, 102884. [Google Scholar] [CrossRef]
  10. Wang, S.; Bai, X.; Zhang, X.; Reis, S.; Chen, D.; Xu, J.; Gu, B. Urbanization can benefit agricultural production with large-scale farming in China. Nat. Food 2021, 2, 183–191. [Google Scholar] [CrossRef]
  11. Cheng, Y.; Wu, H.; Yang, B. Conserving habitat and ecosystem in protected areas amid increasing intensive human modification: A case study of China’s Pan-Pearl River Delta. Ecol. Indic. 2023, 154, 110799. [Google Scholar] [CrossRef]
  12. Liu, Z.; Si, J.; Deng, Y.; Jia, B.; Li, X.; He, X.; Zhou, D.; Wang, C.; Zhu, X.; Qin, J.; et al. Assessment of Land Desertification and Its Drivers in Semi-Arid Alpine Mountains: A Case Study of the Qilian Mountains Region, Northwest China. Remote Sens. 2023, 15, 3836. [Google Scholar] [CrossRef]
  13. Kallio, G.; LaFleur, W. Ways of (un) knowing landscapes: Tracing more-than-human relations in regenerative agriculture. J. Rural. Stud. 2023, 101, 103059. [Google Scholar] [CrossRef]
  14. Toivonen, M.; Huusela, E.; Hyvönen, T.; Marjamäki, P.; Järvinen, A.; Kuussaari, M. Effects of crop type and production method on arable biodiversity in boreal farmland. Agric. Ecosyst. Environ. 2022, 337, 108061. [Google Scholar] [CrossRef]
  15. Zimmerer, K.S.; Olivencia, Y.J.; Rodríguez, L.P.; López-Estébanez, N.; Álvarez, F.A.; Olmo, R.M.; Ochoa, C.Y.; Pulpón, Á.R.R.; García, Ó.J. Assessing social-ecological connectivity of agricultural landscapes in Spain: Resilience implications amid agricultural intensification trends and urbanization. Agric. Syst. 2022, 203, 103525. [Google Scholar] [CrossRef]
  16. Chen, M.; Zhou, Y.; Hu, M.; Zhou, Y. Influence of urban scale and urban expansion on the urban heat island effect in metropolitan areas: Case study of Beijing–Tianjin–Hebei urban agglomeration. Remote Sens. 2020, 12, 3491. [Google Scholar] [CrossRef]
  17. Bao, C.; Fang, C.L. Water resources flows related to urbanization in China: Challenges and perspectives for water management and urban development. Water Resour. Manag. 2012, 26, 531–552. [Google Scholar] [CrossRef]
  18. Khan, S.; Hanjra, M.A.; Mu, J. Water management and crop production for food security in China: A review. Agric. Water Manag. 2009, 96, 349–360. [Google Scholar] [CrossRef]
  19. Lemessa, F.; Simane, B.; Seyoum, A.; Gebresenbet, G. Assessment of the Impact of Industrial Wastewater on the Water Quality of Rivers around the Bole Lemi Industrial Park (BLIP), Ethiopia. Sustainability 2023, 15, 4290. [Google Scholar] [CrossRef]
  20. Akhtar, N.; Syakir Ishak, M.I.; Bhawani, S.A.; Umar, K. Various Natural and Anthropogenic Factors Responsible for Water Quality Degradation: A Review. Water 2021, 13, 2660. [Google Scholar] [CrossRef]
  21. Grennfelt, P.; Engleryd, A.; Forsius, M.; Hov, Ø.; Rodhe, H.; Cowling, E. Acid rain and air pollution: 50 years of progress in environmental science and policy. Ambio 2020, 49, 849–864. [Google Scholar] [CrossRef]
  22. Han, Z.; Zheng, X.; Hou, L.; Xiao, N.; Deng, X. Changes in China’s food security driven by nutrition security and resource constraints. Environ. Dev. Sustain. 2023, 1–19. [Google Scholar] [CrossRef] [PubMed]
  23. Nilsson, M.; Griggs, D.; Visbeck, M. Policy: Map the interactions between Sustainable Development Goals. Nature 2016, 534, 320–322. [Google Scholar] [CrossRef]
  24. Lu, X.; Zhang, Y.; Lin, C.; Wu, F. Analysis and comprehensive evaluation of sustainable land use in China: Based on sustainable development goals framework. J. Clean. Prod. 2021, 310, 127205. [Google Scholar] [CrossRef]
  25. Zhang, K.M.; Wen, Z.G. Review and challenges of policies of environmental protection and sustainable development in China. J. Environ. Manag. 2008, 88, 1249–1261. [Google Scholar] [CrossRef] [PubMed]
  26. Godfray, H.C.J.; Beddington, J.R.; Crute, I.R.; Haddad, L.; Lawrence, D.; Muir, J.F.; Pretty, J.; Robinson, S.; Thomas, S.M.; Toulmin, C. Food security: The challenge of feeding 9 billion people. Science 2010, 327, 812–818. [Google Scholar] [CrossRef] [PubMed]
  27. Lam, H.M.; Remais, J.; Fung, M.C.; Xu, L.; Sun, S.S.M. Food supply and food safety issues in China. Lancet 2013, 381, 2044–2053. [Google Scholar] [CrossRef]
  28. Pata, U.K.; Isik, C. Determinants of the load capacity factor in China: A novel dynamic ARDL approach for ecological footprint accounting. Resour. Policy 2021, 74, 102313. [Google Scholar] [CrossRef]
  29. Tan, R.; Hu, R.; Vatn, A. What does sustainability demand? An institutionalist analysis with applications to China. J. Chin. Gov. 2021, 6, 486–514. [Google Scholar] [CrossRef]
  30. Piao, S.L.; Ciais, P.; Huang, Y.; Shen, Z.H.; Peng, S.S.; Li, J.S.; Zhou, L.P.; Liu, H.Y.; Ma, Y.C.; Ding, Y.H.; et al. The impacts of climate change on water resources and agriculture in China. Nature 2010, 467, 43–51. [Google Scholar] [CrossRef]
  31. Liu, S.; Wang, J. Coupling Coordination between Marine S&T Innovation and the High-Quality Development of the Marine Economy: A Case Study of China’s Coastal Provinces. Sustainability 2022, 14, 7373. [Google Scholar]
  32. Cui, Y. The coordinated relationship among industrialization, environmental carrying capacity and green infrastructure: A comparative research of Beijing-Tianjin-Hebei region, China. Environ. Dev. 2022, 44, 100775. [Google Scholar] [CrossRef]
  33. Li, Y.; Li, Y.; Zhou, Y.; Shi, Y.; Zhu, X. Investigation of a coupling model of coordination between urbanization and the environment. J. Environ. Manag. 2012, 98, 127–133. [Google Scholar] [CrossRef] [PubMed]
  34. Liu, N.; Liu, C.; Xia, Y.; Da, B. Examining the coordination between urbanization and eco-environment using coupling and spatial analyses: A case study in China. Ecol. Indic. 2018, 93, 1163–1175. [Google Scholar] [CrossRef]
  35. Cai, J.; Li, X.; Liu, L.; Chen, Y.; Wang, X.; Lu, S. Coupling and coordinated development of new urbanization and agro-ecological environment in China. Sci. Total Environ. 2021, 776, 145837. [Google Scholar] [CrossRef] [PubMed]
  36. Fan, Y.; Fang, C.; Zhang, Q. Coupling coordinated development between social economy and ecological environment in Chinese provincial capital cities-assessment and policy implications. J. Clean. Prod. 2019, 229, 289–298. [Google Scholar] [CrossRef]
  37. Li, W.; Yi, P.; Zhang, D.; Zhou, Y. Assessment of coordinated development between social economy and ecological environment: Case study of resource-based cities in Northeastern China. Sustain. Cities Soc. 2020, 59, 102208. [Google Scholar] [CrossRef]
  38. Liu, Y.; Zhou, Y. Reflections on China’s food security and land use policy under rapid urbanization. Land Use Policy 2021, 109, 105699. [Google Scholar] [CrossRef]
  39. Li, L.; Lei, Y.; Wu, S.; He, C.; Yan, D. Study on the coordinated development of economy, environment and resource in coal-based areas in Shanxi Province in China: Based on the multi-objective optimization model. Resour. Policy 2018, 55, 80–86. [Google Scholar] [CrossRef]
  40. Xing, L.; Xue, M.; Hu, M. Dynamic simulation and assessment of the coupling coordination degree of the economy–resource–environment system: Case of Wuhan City in China. J. Environ. Manag. 2019, 230, 474–487. [Google Scholar] [CrossRef]
  41. Li, W.; Yi, P. Assessment of city sustainability—Coupling coordinated development between economy, society and environment. J. Clean. Prod. 2020, 256, 120453. [Google Scholar] [CrossRef]
  42. Xu, M.; Hu, W.Q. A research on coordination between economy, society and environment in China: A case study of Jiangsu. J. Clean. Prod. 2020, 258, 120641. [Google Scholar] [CrossRef]
  43. Liu, J.; Tian, Y.; Huang, K.; Yi, T. Spatial-temporal differentiation of the coupling coordinated development of regional energy-economy-ecology system: A case study of the Yangtze River Economic Belt. Ecol. Indic. 2021, 124, 107394. [Google Scholar] [CrossRef]
  44. Biggs, E.M.; Bruce, E.; Boruff, B.; Duncan, J.M.; Horsley, J.; Pauli, N.; McNeill, K.; Neef, A.; Van Ogtrop, F.; Curnow, J.; et al. Sustainable development and the water–energy–food nexus: A perspective on livelihoods. Environ. Sci. Policy 2015, 54, 389–397. [Google Scholar] [CrossRef]
  45. Qian, X.Y.; Liang, Q.M. Sustainability evaluation of the provincial water-energy-food nexus in China: Evolutions, obstacles, and response strategies. Sustain. Cities Soc. 2021, 75, 103332. [Google Scholar] [CrossRef]
  46. Bahtebay, J.; Zhang, F.; Ariken, M.; Chan, N.W.; Tan, M.L. Evaluation of the coordinated development of urbanization-resources-environment from the incremental perspective of Xinjiang, China. J. Clean. Prod. 2021, 325, 129309. [Google Scholar] [CrossRef]
  47. Cui, X.; Fang, C.; Liu, H.; Liu, X. Assessing sustainability of urbanization by a coordinated development index for an Urbanization-Resources-Environment complex system: A case study of Jing-Jin-Ji region, China. Ecol. Indic. 2019, 96, 383–391. [Google Scholar] [CrossRef]
  48. Liu, J.; Jin, X.; Xu, W.; Gu, Z.; Yang, X.; Ren, J.; Fan, Y.; Zhou, Y. A new framework of land use efficiency for the coordination among food, economy and ecology in regional development. Sci. Total Environ. 2020, 710, 135670. [Google Scholar] [CrossRef]
  49. Dong, L.; Longwu, L.; Zhenbo, W.; Liangkan, C.; Faming, Z. Exploration of coupling effects in the Economy–Society–Environment system in urban areas: Case study of the Yangtze River Delta Urban Agglomeration. Ecol. Indic. 2021, 128, 107858. [Google Scholar] [CrossRef]
  50. Zhang, F.; Sarker MN, I.; Lv, Y. Coupling coordination of the regional economy, tourism industry, and the ecological environment: Evidence from western China. Sustainability 2022, 14, 1654. [Google Scholar] [CrossRef]
  51. Chen, M.; Lu, D.; Zhang, H. Comprehensive evaluation and the driving factors of China’s urbanization. Acta Geogr. Sin. 2009, 64, 387–398. [Google Scholar]
  52. Chen, M.; Lu, D.; Zha, L. The comprehensive evaluation of China’s urbanization and effects on resources and environment. J. Geogr. Sci. 2010, 20, 17–30. [Google Scholar] [CrossRef]
  53. Zhou, D.; Tian, Y.; Jiang, G. Spatio-temporal investigation of the interactive relationship between urbanization and eco-system services: Case study of the Jingjinji urban agglomeration, China. Ecol. Indic. 2018, 95, 152–164. [Google Scholar] [CrossRef]
  54. Zhou, C.; Wang, S.; Wang, J. Examining the influences of urbanization on carbon dioxide emissions in the Yangtze River Delta, China: Kuznets curve relationship. Sci. Total Environ. 2019, 675, 472–482. [Google Scholar] [CrossRef] [PubMed]
  55. Liu, W.; Zhan, J.; Zhao, F.; Wei, X.; Zhang, F. Exploring the coupling relationship between urbanization and energy eco-efficiency: A case study of 281 prefecture-level cities in China. Sustain. Cities Soc. 2021, 64, 102563. [Google Scholar] [CrossRef]
  56. Fan, W.; Wang, H.; Liu, Y.; Liu, H. Spatio-temporal variation of the coupling relationship between urbanization and air quality: A case study of Shandong Province. J. Clean. Prod. 2020, 272, 122812. [Google Scholar] [CrossRef]
  57. Liu, Y.B.; Li, R.D.; Song, X.F. Analysis of coupling degrees of urbanization and ecological environment in China. J. Nat. Resour. 2005, 20, 105–112. [Google Scholar]
  58. Ugolini, F.; Massetti, L.; Pearlmutter, D.; Sanesi, G. Usage of urban green space and related feelings of deprivation during the COVID-19 lockdown: Lessons learned from an Italian case study. Land Use Policy 2021, 105, 105437. [Google Scholar] [CrossRef] [PubMed]
  59. Sun, T.; Lin, W.; Chen, G.; Guo, P.; Zeng, Y. Wetland ecosystem health assessment through integrating remote sensing and inventory data with an assessment model for the Hangzhou Bay, China. Sci. Total Environ. 2016, 566, 627–640. [Google Scholar] [CrossRef]
  60. Wang, Z.; Liang, L.; Sun, Z.; Wang, X. Spatiotemporal differentiation and the factors influencing urbanization and ecological environment synergistic effects within the Beijing-Tianjin-Hebei urban agglomeration. J. Environ. Manag. 2019, 243, 227–239. [Google Scholar] [CrossRef]
  61. Vörösmarty, C.J.; McIntyre, P.B.; Gessner, M.O.; Dudgeon, D.; Prusevich, A.; Green, P.; Glidden, S.; Bunn, S.E.; Sullivan, C.A.; Liermann, C.R.; et al. Global threats to human water security and river biodiversity. Nature 2010, 467, 555–561. [Google Scholar] [CrossRef] [PubMed]
  62. Babu, S.; Gajanan, S.; Sanyal, P. Food Security, Poverty and Nutrition Policy Analysis: Statistical Methods and Applications; Academic Press: Cambridge, MA, USA, 2014. [Google Scholar]
  63. Yao, C.; Teng, Y.; Huang, L. Evaluation index system construction and empirical analysis on food security in China. Trans-Actions Chin. Soc. Agric. Eng. 2015, 31, 1–10. [Google Scholar]
  64. Clapp, J.; Moseley, W.G.; Burlingame, B.; Termine, P. The case for a six-dimensional food security framework. Food Policy 2021, 106, 102164. [Google Scholar] [CrossRef]
  65. Luo, H.; Yu, Z.; Zou, N. The empirical study on the spatial coupling of ecology and food security in major grain-producing areas in China. Chin. J. Agric. Resour. Reg. Plan. 2020, 41, 32–39. [Google Scholar]
  66. Barrett, C.B. Measuring food insecurity. Science 2010, 327, 825–828. [Google Scholar] [CrossRef]
  67. Ongley, E.D.; Xiaolan, Z.; Tao, Y. Current status of agricultural and rural non-point source pollution assessment in China. Environ. Pollut. 2010, 158, 1159–1168. [Google Scholar] [CrossRef]
  68. Lu, H.; Zhao, Y.; Zhou, X.; Wei, Z. Selection of Agricultural Machinery Based on Improved CRITIC-Entropy Weight and GRA-TOPSIS Method. Processes 2022, 10, 266. [Google Scholar] [CrossRef]
  69. Zhang, J.; Yang, X.; Lu, D. Evaluation of Urban Resilience Based on Trio Spaces: An Empirical Study in Northeast China. Buildings 2023, 13, 1695. [Google Scholar] [CrossRef]
  70. Chen, Y.; Chang, J.; Li, Z.; Ming, L.; Li, C.; Li, C. Coupling Coordination and Spatiotemporal Analysis of Urban Compactness and Land-Use Efficiency in Resource-Based Areas: A Case Study of Shanxi Province, China. Land 2023, 12, 1658. [Google Scholar] [CrossRef]
  71. Huan, Y.; Liang, T.; Li, H.; Zhang, C. A systematic method for assessing progress of achieving sustainable development goals: A case study of 15 countries. Sci. Total Environ. 2021, 752, 141875. [Google Scholar] [CrossRef]
  72. Cai, E.; Zhao, X.; Zhang, S.; Li, L. Spatial Agglomeration and Coupling Coordination of Population, Economics, and Construction Land in Chinese Prefecture-Level Cities from 2010 to 2020. Land 2023, 12, 1561. [Google Scholar] [CrossRef]
  73. Bai, X.; Jin, J.; Zhou, R.; Wu, C.; Zhou, Y.; Zhang, L.; Cui, Y. Coordination evaluation and obstacle factors recognition analysis of water resource spatial equilibrium system. Environ. Res. 2022, 210, 112913. [Google Scholar] [CrossRef] [PubMed]
  74. Ming, L.; Chang, J.; Li, C.; Chen, Y.; Li, C. Spatial-Temporal Patterns of Ecosystem Services Supply-Demand and Influencing Factors: A Case Study of Resource-Based Cities in the Yellow River Basin, China. Int. J. Environ. Res. Public Health 2022, 19, 16100. [Google Scholar] [CrossRef]
  75. Dagum, C. A new approach to the decomposition of the Gini income inequality ratio. In Income Inequality, Poverty, and Economic Welfare; Physica-Verlag HD: Heidelberg, Germany, 1998; pp. 47–63. [Google Scholar]
  76. Lu, T.; Li, C.; Zhou, W.; Liu, Y. Fuzzy Assessment of Ecological Security on the Qinghai–Tibet Plateau Based on Pressure–State–Response Framework. Remote Sens. 2023, 15, 1293. [Google Scholar] [CrossRef]
  77. Kuang, W.; Liu, J.; Dong, J.; Chi, W.; Zhang, C. The rapid and massive urban and industrial land expansions in China be-tween 1990 and 2010: A CLUD-based analysis of their trajectories, patterns, and drivers. Landsc. Urban Plan. 2016, 145, 21–33. [Google Scholar] [CrossRef]
  78. Jiao, X.Q.; Mongol, N.; Zhang, F.S. The transformation of agriculture in China: Looking back and looking forward. J. Integr. Agric. 2018, 17, 755–764. [Google Scholar] [CrossRef]
  79. Feng, C.Y.; Yang, X.; Afshan, S.; Irfan, M. Can renewable energy technology innovation promote mineral resources’ green utilization efficiency? Novel insights from regional development inequality. Resour. Policy 2023, 82, 103449. [Google Scholar] [CrossRef]
  80. Shah, W.U.H.; Lu, Y.; Hao, G.; Yan, H.; Yasmeen, R. Impact of “Three Red Lines” Water Policy (2011) on Water Usage Efficiency, Production Technology Heterogeneity, and Determinant of Water Productivity Change in China. Int. J. Environ. Res. Public Health 2022, 19, 16459. [Google Scholar] [CrossRef]
  81. Zhang, J.; Cheng, M.; Wei, X.; Gong, X.; Zhang, S. Internet use and the satisfaction with governmental environmental protection: Evidence from China. J. Clean. Prod. 2019, 212, 1025–1035. [Google Scholar] [CrossRef]
  82. Cheng, J.; Yin, S. Quantitative Assessment of Climate Change Impact and Anthropogenic Influence on Crop Production and Food Security in Shandong, Eastern China. Atmosphere 2022, 13, 1160. [Google Scholar] [CrossRef]
  83. Ren, G.; Song, G.; Wang, Q.; Sui, H. Impact of “Non-Grain” in Cultivated Land on Agricultural Development Resilience: A Case Study from the Major Grain-Producing Area of Northeast China. Appl. Sci. 2023, 13, 3814. [Google Scholar] [CrossRef]
  84. Chang, Z.; Zheng, L.; Yang, T.; Long, F. High-speed rail, new town development, and the spatial mismatch of land leases in China. Land Use Policy 2022, 115, 106014. [Google Scholar] [CrossRef]
  85. Jin, X.; Long, Y.; Sun, W.; Lu, Y.; Yang, X.; Tang, J. Evaluating cities’ vitality and identifying ghost cities in China with emerging geographical data. Cities 2017, 63, 98–109. [Google Scholar] [CrossRef]
  86. Liu, X.; Xin, Y. Exploring the characteristics and driving factors of coupling coordination of regional sustainable development: Evidence from China’s 31 provinces. Environ. Sci. Pollut. Res. 2022, 29, 71075–71099. [Google Scholar] [CrossRef] [PubMed]
  87. Zhu, F.; Lai, L.; Zhu, Z.; Zhang, X. A study on the path of improving the performance of China’s provincial circular economy—An empirical study based on the fsQCA method. Front. Environ. Sci. 2022, 10, 1690. [Google Scholar] [CrossRef]
  88. Wu, L.; Wan, X.; Jahanger, A.; Li, M.; Murshed, M.; Balsalobre-Lorente, D. Does the digital economy reduce air pollution in China? A perspective from industrial agglomeration. Energy Rep. 2023, 9, 3625–3641. [Google Scholar] [CrossRef]
  89. Yu, D.; Hu, S.; Tong, L.; Xia, C.; Ran, P. Dynamics and Determinants of the Grain Yield Gap in Major Grain-Producing Areas: A Case Study in Hunan Province, China. Foods 2022, 11, 1122. [Google Scholar] [CrossRef]
  90. Zhang, Q.; Yuan, R.; Singh, V.P.; Xu, C.-Y.; Fan, K.; Shen, Z.; Wang, G.; Zhao, J. Dynamic vulnerability of ecological systems to climate changes across the Qinghai-Tibet Plateau, China. Ecol. Indic. 2022, 134, 108483. [Google Scholar] [CrossRef]
  91. Chen, B.; Yu, Q.; Lan, X.; Fang, L.; Wen, C. Assessing China’s development zones and carbon emissions. Environ. Sci. Pollut. Res. 2023, 30, 99298–99309. [Google Scholar] [CrossRef]
  92. Lu, Y.; Zhang, Y.; Hong, Y.; He, L.; Chen, Y. Experiences and lessons from Agri-Food system transformation for sustainable food security: A review of China’s practices. Foods 2022, 11, 137. [Google Scholar] [CrossRef]
  93. Zhu, C.; Fang, C.; Zhang, L. Analysis of the coupling coordinated development of the Population–Water–Ecology–Economy system in urban agglomerations and obstacle factors discrimination: A case study of the Tianshan North Slope Urban Ag-glomeration, China. Sustain. Cities Soc. 2023, 90, 104359. [Google Scholar] [CrossRef]
  94. Liu, F.; Wang, C.; Luo, M.; Zhou, S.; Liu, C. An investigation of the coupling coordination of a regional agricultural eco-nomics-ecology-society composite based on a data-driven approach. Ecol. Indic. 2022, 143, 109363. [Google Scholar] [CrossRef]
  95. Xiang, X.; Li, Q.; Khan, S.; Khalaf, O.I. Urban water resource management for sustainable environment planning using artificial intelligence techniques. Environ. Impact Assess. Rev. 2021, 86, 106515. [Google Scholar] [CrossRef]
  96. Li, M.; Cao, X.; Liu, D.; Fu, Q.; Li, T.; Shang, R. Sustainable management of agricultural water and land resources under changing climate and socio-economic conditions: A multi-dimensional optimization approach. Agric. Water Manag. 2022, 259, 107235. [Google Scholar] [CrossRef]
  97. Wan, Q.; Miao, X.; Afshan, S. Dynamic effects of natural resource abundance, green financing, and government environmental concerns toward the sustainable environment in China. Resour. Policy 2022, 79, 102954. [Google Scholar] [CrossRef]
  98. Zhang, W.; Li, Y.; Zheng, C. The distribution characteristics and driving mechanism of vacant land in Chengdu, China: A perspective of urban shrinkage and expansion. Land Use Policy 2023, 132, 106812. [Google Scholar] [CrossRef]
  99. Hou, D.; Meng, F.; Prishchepov, A.V. How is urbanization shaping agricultural land-use? Unraveling the nexus between farmland abandonment and urbanization in China. Landsc. Urban Plan. 2021, 214, 104170. [Google Scholar] [CrossRef]
  100. Ma, L.; Long, H.; Tang, L.; Tu, S.; Zhang, Y.; Qu, Y. Analysis of the spatial variations of determinants of agricultural production efficiency in China. Comput. Electron. Agric. 2021, 180, 105890. [Google Scholar] [CrossRef]
  101. Wang, P.; Ren, Z.; Qiao, G. How Does Agricultural Trade Liberalization Have Environmental Impacts? Evidence from a Literature Review. Sustainability 2023, 15, 9379. [Google Scholar] [CrossRef]
  102. Wang, Q.; Wang, X.; Li, R. Does urbanization redefine the environmental Kuznets curve? An empirical analysis of 134 Countries. Sustain. Cities Soc. 2022, 76, 103382. [Google Scholar] [CrossRef]
Figure 1. Interactions between urbanization, the environment, and food security.
Land 12 02002 g001
Figure 2. Methodological framework.
Land 12 02002 g002
Figure 3. Study area.
Land 12 02002 g003
Figure 4. The comprehensive development index (CDI) for urbanization, the environment, and food security in eastern (E), central (C), western (W), and northeastern (NE) China.
Land 12 02002 g004
Figure 5. The comprehensive development index (CDI) for urbanization, the environment, food security, and CCD between UEFS.
Land 12 02002 g005
Figure 6. (a) The CCD between UEFS in 30 provinces in China; (b) The trend surface analysis of CCD between UEFS in 2004; (c) The trend surface analysis of CCD between UEFS in 2020.
Land 12 02002 g006
Figure 7. Local spatial autocorrelation results.
Land 12 02002 g007
Figure 8. Obstacle degree in system layer for the coordinated development between UEFS.
Land 12 02002 g008
Figure 9. (ac) Obstacle degree in subsystem layer for the coordinated development between UEFS in China; (do) Obstacle degree in subsystem layer for the coordinated development between UEFS in eastern, central, western, and northeastern China.
Land 12 02002 g009
Table 1. Evaluation index system for urbanization, the environment, and food security.
SystemSubsystemIndicatorEntropyCRITICMean
UrbanizationDemographicU1: Proportion of urban population (%)0.05520.06540.0603
U2: Urban population density (person/km2)0.15880.0920.1254
U3: Proportion of employees in the secondary and tertiary industries (%)0.03220.0630.0476
EconomicU4: GDP per capita (CNY 10,000)0.11280.06220.0875
U5: Proportion of the output value from the secondary and tertiary industries to GDP (%)0.01590.02870.0223
U6: Per capita disposable income of urban residents (CNY 10,000)0.120.06770.0939
Land useU7: Output value per unit of built-up area (CNY 100 million/km2)0.14270.15220.1475
U8: Per capita urban road (m2)0.05270.06150.0571
U9: Proportion of built-up area to urban area (%)0.07540.07580.0756
SocialU10: Number of beds in medical institutions per 10,000 people0.11690.0750.096
U11: Number of students in institutions of higher learning per 10,000 people0.0710.10480.0879
U12: Per capita park area (m2)0.04650.15160.0991
EnvironmentPressureE1: Total sulfur dioxide emissions (10,000 tons)0.04580.08260.0642
E2: Total emissions of solid particulate matter (10,000 tons)0.03150.06750.0495
E3: Industrial solid waste generation (10,000 tons)0.02130.07020.0457
E4: Total chemical oxygen demand (10,000 tons)0.03690.09620.0665
E5: Electricity consumption per unit of GDP (CNY 10,000/kwh)0.02610.07120.0487
StateE6: Forest coverage (%)0.18220.10560.1439
E7: Proportion of desertification land area (%)0.04690.08920.068
E8: Water resources endowment (10,000 m3/km2)0.30220.07450.1883
E9: Green coverage in built-up area (%)0.03130.06230.0468
ResponseE10: Ratio of investment in environmental pollution control to GDP (%)0.14460.08940.117
E11: Comprehensive utilization rate of industrial solid waste (%)0.07960.09450.087
E12: Proportion of household garbage harmless treatment (%)0.05160.09690.0743
Food securityFactors of productionF1: Per capita cultivated area (hectare)0.14770.06060.1042
F2: Labor input in agricultural production (person/hectare)0.0720.0940.083
F3: Agricultural machinery input (kw/hectare)0.09540.09210.0938
F4: Water consumption per unit area (m3/hectare)0.13650.08050.1085
Availability and stabilityF5: Per capita sown area of grain crops (hectare)0.12760.0510.0893
F6: Proportion of the area of crops affected by disasters (%)0.01360.06440.039
F7: Per unit area yield of grain (kg)0.05910.07410.0666
F8: Per capita grain output (kg)0.12830.04780.0881
AccessF9: Density of regional road network (km/km2)0.09460.09280.0937
F10: Engel coefficient of urban resident0.03490.06030.0476
F11: Engel coefficient of rural resident0.03380.06980.0518
SustainabilityF12: Intensity of fertilizer application (kg/hectare)0.02420.07620.0502
F13: Intensity of pesticide used (kg/hectare)0.01930.07270.046
F14: Intensity of agricultural plastic film used (kg/hectare)0.0130.06370.0384
Table 2. Division of coupling coordination degree (CCD) between urbanization, the environment, and food security.
StagesCCD RangeCoupling Coordination Types
Uncoordinated stage(0.00, 0.10)C1, extreme incoordination
(0.10, 0.20)C2, severe incoordination
(0.20, 0.30)C3, moderate incoordination
(0.30, 0.40)C4, slight incoordination
Transitional stage(0.40, 0.50)C5, approaching incoordination
(0.50, 0.60)C6, slight coordination
Highly coordinated stage(0.60, 0.70)C7, primary coupling coordination
(0.70, 0.80)C8, moderate coupling coordination
(0.80, 0.90)C9, good coupling coordination
(0.90, 1.00)C10, superior coupling coordination
Table 3. Results of the global Moran’s I index.
YearMoran’s Ip-ValueZ-ScoreYearMoran’s Ip-ValueZ-Score
20040.23640.0013.272920130.40940.0015.3681
20050.26140.0013.570920140.39990.0015.2642
20060.31650.0014.240120150.44830.0015.8619
20070.3240.0014.331720160.47370.0016.1753
20080.37060.0014.896420170.4620.0016.0112
20090.3760.0014.958220180.45980.0015.9689
20100.42130.0015.510320190.44920.0015.831
20110.37370.0014.927920200.45950.0015.9714
20120.42790.0015.571
Table 4. The Dagum Gini coefficient and sources of spatial heterogeneity in the coupling coordination degree between urbanization, the environment, and food security.
YearGIntra-Regional Gini CoefficientInter-Regional Gini CoefficientContribution Rate (%)
EastCentralWestNortheastEast-CentralEast-WestEast-NortheastCentral-WestCentral-NortheastWest-NortheastGwGnbGt
20040.0400.0290.0170.0210.0040.0500.0680.0410.0260.0140.03017.177.95.0
20050.0410.0300.0210.0220.0030.0490.0690.0410.0300.0150.03017.576.85.7
20060.0410.0280.0190.0240.0030.0440.0700.0440.0340.0150.02817.477.55.1
20070.0390.0250.0170.0260.0030.0400.0640.0460.0330.0190.02218.275.76.1
20080.0370.0240.0170.0280.0040.0370.0620.0380.0340.0150.02819.174.66.3
20090.0370.0230.0170.0290.0090.0330.0580.0430.0350.0210.02519.672.87.6
20100.0360.0220.0180.0290.0080.0310.0580.0350.0370.0170.02819.773.86.4
20110.0330.0200.0180.030.0050.0280.0510.0340.0340.0180.02521.068.810.2
20120.0320.0220.0200.0270.0050.0270.0500.0330.0340.0180.02421.268.210.6
20130.0290.0210.0140.0250.0070.0260.0460.0300.0290.0130.02321.467.710.9
20140.0310.0260.0160.0250.0130.0270.0450.0380.0300.0220.02122.462.515.1
20150.0320.0260.0200.0260.0110.0280.0460.0360.0340.0240.02222.962.314.8
20160.0310.0240.0160.0250.0070.0250.0460.0310.0340.0210.02121.967.110.9
20170.0300.0210.0180.0250.0060.0240.0440.0320.0350.0250.01921.566.212.3
20180.0310.0220.0190.0270.0080.0250.0450.0310.0370.0250.02221.865.113.1
20190.0320.0240.0220.0260.0090.0270.0460.0310.0370.0250.02322.263.414.3
20200.0310.0230.0200.0270.0090.0250.0430.0310.0360.0250.02322.861.615.6
Table 5. The main obstacle factors affecting the CDI for urbanization, the environment, and food security.
RegionYearObstacle Factors and the Order of Obstacle Degree
UrbanizationEnvironmentFood security
123123123
China2004U7(14.67%)U2(12.59%)U12(9.77%)E8(30.42%)E10(17.52%)E6(14.92%)F1(12.49%)F4(12.38%)F9(11.91%)
2020U7(14.53%)U2(12.8%)U12(9.64%)E8(31.69%)E10(24.98%)E6(15.43%)F4(16.49%)F1(13.30%)F5(11.51%)
Eastern2004U7(14.62%)U2(12.51%)U12(9.76%)E8(33.09%)E10(20.48%)E6(16.60%)F1(14.93%)F5(12.79%)F8(12.65%)
2020U7(14.36%)U2(12.7%)U12(9.75%)E8(33.9%)E10(28.89%)E6(16.98%)F1(17.17%)F4(15.10%)F5(14.44%)
Central2004U7(14.65%)U2(12.55%)U12(9.79%)E8(26.62%)E10(19.00%)E6(14.17%)F4(14.06%)F1(13.36%)F9(11.38%)
2020U7(14.5%)U2(12.77%)U12(9.67%)E8(27.28%)E10(25.59%)E6(15.76%)F4(17.11%)F1(15.91%)F5(12.68%)
Western2004U7(14.63%)U2(12.63%)U12(9.77%)E8(27.83%)E6(16.15%)E10(15.14%)F9(12.97%)F3(12.65%)F1(11.57%)
2020U7(14.56%)U2(12.87%)U10(9.61%)E8(31.05%)E10(21.81%)E6(16.26%)F4(14.41%)F1(12.66%)F5(12.00%)
Northeastern2004U7(14.77%)U2(12.65%)U12(9.76%)E8(34.13%)E10(15.47%)E6(12.74%)F3(13.71%)F4(13.67%)F9(13.03%)
2020U7(14.72%)U2(12.87%)U12(9.61%)E8(34.51%)E10(23.63%)E6(12.71%)F4(19.34%)F2(15.67%)F3(15.56%)
Note: the data in brackets represent the obstacle degree for the corresponding indicator.
Table 6. The main obstacle factors affecting the coordinated development between UEFS.
RegionYearObstacle Factors and the Order of Obstacle Degree
123456789
China2004E8(8.11%)U7(5.78%)U2(4.96%)E10(4.67%)F1(4.24%)F4(4.21%)F9(4.05%)E6(3.98%)U12(3.85%)
2020E8(8.88%)E10(7.01%)F4(6.25%)F1(5.04%)U7(4.95%)F5(4.36%)U2(4.36%)E6(4.33%)F3(4.29%)
Eastern2004E8(8.56%)U7(5.60%)F1(5.35%)E10(5.30%)U2(4.80%)F5(4.58%)F8(4.53%)E6(4.30%)F4(4.00%)
2020E8(9.43%)E10(8.04%)F1(7.13%)F4(6.27%)F5(6.00%)F8(5.80%)E6(4.73%)U7(4.39%)U2(3.89%)
Central2004E8(7.18%)U7(5.78%)E10(5.12%)U2(4.95%)F4(4.73%)F1(4.49%)U12(3.86%)F9(3.82%)E6(3.82%)
2020E8(7.37%)E10(6.91%)F4(6.53%)F1(6.07%)U7(5.04%)F5(4.84%)F8(4.64%)U2(4.44%)E6(4.26%)
Western2004E8(7.61%)U7(5.85%)U2(5.05%)E6(4.42%)F9(4.23%)E10(4.14%)F3(4.13%)U12(3.91%)U10(3.85%)
2020E8(8.86%)E10(6.22%)F4(5.20%)U7(5.16%)E6(4.64%)U2(4.56%)F1(4.56%)F5(4.32%)F8(4.27%)
Northeastern2004E8(8.88%)U7(5.99%)U2(5.13%)F3(4.58%)F4(4.56%)F9(4.35%)E10(4.02%)U12(3.96%)U10(3.89%)
2020E8(10.03%)U10(6.87%)F4(6.21%)U7(5.72%)F3(5.03%)U2(5.00%)F2(4.99%)F9(4.48%)U12(3.73%)
Note: the data in brackets represent the obstacle degree for the corresponding indicator.
Disclaimer/Publisher’s Note: The statements, opinions and data contained in all publications are solely those of the individual author(s) and contributor(s) and not of MDPI and/or the editor(s). MDPI and/or the editor(s) disclaim responsibility for any injury to people or property resulting from any ideas, methods, instructions or products referred to in the content.

