Article

Distribution and Speciation of Trace Elements in Soils of Four Land-Use Systems

1
Department of Environmental Sciences, COMSATS University Islamabad, Abbottabad Campus, Abbottabad 22060, Pakistan
2
State Key Laboratory of Urban Water Resource and Environment, Shenzhen Key Laboratory of Organic Pollution Prevention and Control, School of Civil and Environmental Engineering, Harbin Institute of Technology Shenzhen, Shenzhen 518055, China
3
Department of Environmental Science and Engineering, Fudan University, Shanghai 200433, China
4
State Key Laboratory of Biogeology and Environmental Geology, School of Environmental Studies, China University of Geosciences, Wuhan 430074, China
5
Department of Zoology, College of Science, King Saud University, P.O. Box 2455, Riyadh 11451, Saudi Arabia
*
Authors to whom correspondence should be addressed.
Land 2023, 12(10), 1894; https://doi.org/10.3390/land12101894
Submission received: 4 September 2023 / Revised: 4 October 2023 / Accepted: 8 October 2023 / Published: 9 October 2023

Abstract

:
Land use has a greater impact on trace element (TE) concentration present in soils. In mountainous regions of the western Himalayas, some dominating geogenic and human-dependent anthropogenic factors are involved in the spatial distribution of TEs in various land uses. Soil samples were collected from permafrost, pasture, forest, and agricultural land-use systems of Babusar Valley and Fairy Meadows in Diamer districts and the Rama region in Astore Districts in replications for investigation of three TEs, i.e., copper (Cu), zinc (Zn), and nickel (Ni). These samples were analyzed for exchangeable, adsorbed, organically bound, carbonate precipitated, and residual forms. Significant differences among these TEs were observed. Differences in the levels of TEs within soil samples were observed to be influenced by land usage patterns. The physicochemical properties of soil samples were also investigated. Additionally, the total metals (Ni, Zn, Cu) were extracted and their concentrations were measured in all samples. The concentration of soil TEs was observed in the following order: adsorbed < organically bound < exchangeable < residual < carbonate precipitated form across all the land uses. The results indicate that the contents of TEs (Ni, Zn, Cu) in agricultural soils were greater than in the permafrost pasture and forest soil samples. The total TE concentration varied as Zn > Ni > Cu irrespective of the area and land uses. We believe this work will open avenues for researchers to explore TEs in various regions of the world.

1. Introduction

As a host to heavy metals (HMs), essential nutrients, and trace elements (TEs) in the soil play an important role in the environment. TEs are essentially required in the soils of various land uses in specific desired trace amounts, which are taken by the plants with nutrients [1,2,3,4]. Studies concerning the availability of elements have primarily concentrated on the distribution of TEs and the key factors that influence them [5], farmland ecosystems, and ecological succession processes through a bioavailability analysis of TEs in soil ecosystems [6]. Apart from nutrients, the trace elements, i.e., Cu, Ni, and Zn, are of vital importance in agriculture because of their direct impact on the quality of crops, food, and consumer health [7,8]. TEs usually persist for a longer period in various land uses. In an environment, land-use and land cover (LULC) changes have a vitally important role. The fusion of LULC series with soil survey databases offers a significant opportunity to assess the connection between soil properties and historical land utilization patterns [9,10,11,12]. Land-use changes have a long-lasting impact on soil characteristics by altering many factors, trace elements being one of them. The concentration of TEs in the soil is influenced by various factors, such as soil reaction [13,14,15,16], the level of organic matter (OM) [17,18], the capacity of the soil’s sorption complex, and cation exchange capacity [19]; soil salinity [17]; the composition of grain sizes [20,21]; the presence of carbonates [18]; the amounts of organic carbon and total nitrogen [19]; the presence and activity of soil microorganisms [22]; and the presence of sulfate and phosphate [23].
Permafrost is sediment, rock, soil, or other earth materials that either remain at 0 °C or below it for two or more years. Permafrost soils are generally characterized by water saturation, slow biogeochemical turnover rates, reductive conditions, and the accumulation of OM [24,25]. Permafrost is broadly classified into two broad zones: the continuous and the discontinuous. In some areas of western Himalaya mountainous regions, there is discontinuous permafrost, in which the active layer usually thaws in summer with the increase in temperatures. This thawing of permafrost at higher altitudes may cause the transportation of trace elements along with other nutrients to other land uses, such as pastures, forests, and agricultural lands, which are at considerably lower altitudes in the area. Thus, parent material and environmental factors both play their role in any change in the trace element concentration in various land uses. Mountain soils exhibit delicate ecosystems characterized by significant spatial variability, which arises from their profound reliance on factors, i.e., parent material, climate conditions, and topography [25,26].
There are considerable forests in the Diamer region of western Himalaya. The forest land is also under immense pressure because of many factors. Pastures of mountainous and hilly regions are mostly on shallow soil [27]. Unlike the forests and agricultural land uses, pastures are not usually subject to any land use reform and management. They provide fodder for livestock and are the main source of income for local inhabitants. Most of the people in the Diamer region depend on the resources of mountains, agroforestry, and agriculture [28]. Varying quantities and proportions of trace elements are present in soils. Trace element availability in soils is important to maintain the nutrient balance in fodder. If trace elements, such as Cu and Zn, exceed certain thresholds, they might induce toxicity symptoms in plants and soil organisms [29].
An increased use of fertilizers targeted to achieve more yield is one of the major factors of increased trace elements in agricultural soils. Another factor that corresponds to the availability of TEs, such as Cu, Ni, and Zn, in the soil is soil texture as it has been observed that clay soil contains a comparatively larger amount of TEs [30]. Human activities, with a particular emphasis on agricultural practices, are the primary sources of environmental HM releases [31]. In western Himalayan areas, the other factors are a huge tourism influx in summers and the resultant urbanization, which put enormous pressure on various land-use systems, thus causing a change in the trace elements’ concentration. Apart from these facts, the parent material also greatly influences the soil. A major threat to soil function and fertility is heavy metal buildup, which might happen because of particular geology [32]. Similarly, the depletion of trace elements from agricultural soils is also receiving increased attention [33]. Unapplied TEs in agriculture may become depleted and lead to deficiencies [34].
TEs are chemical elements that are present in the soil in very small amounts and are essentially required in the soil for plant growth [35,36]. However, some trace elements can be toxic, such as heavy metals, upon an increase in concentration. Various human activities that produce contaminants are consistently polluting the environment. This fact necessitates sustainable soil management putting minimum pressure on land uses. Various elements in the soils are persistent in different concentration levels, which help in characterizing the soil quality. The mobility and availability of such elements depend on the reactivity and binding behavior of an element with the components of the soil matrix [37]. Several studies have examined the connection between soil characteristics and metal distribution [38], but varied conclusions of the researchers indicate different natures and characteristics of soils. Trace elements in the soil are concentrated easily; they are persistent so they cannot be easily decomposed [39].
Earth’s landscape has been substantially altered by human activities, such as deforestation, urban development, and agriculture [40,41]. These activities have extensively altered land use and land cover. Forest cutting, grazing, cultivation, fertilization, and mowing have been considered common processes causing abrupt land-use changes in many regions of the world. Another factor in the transportation of trace elements is due to industrialization and urbanization. Trace elements may be deposited in various land uses after being transported through the atmosphere. Factors, such as wind and precipitation, help the transportation and deposition of these trace elements. They disperse elevated levels of trace metal pollutants into the urban soil through aerial deposition [42,43].
To understand the impact of various land uses on soil quality and sustainability, it is important to monitor all essential nutrients, including trace elements. Presently, the accumulation of trace elements in soil and their effects on land-use patterns are mainly focused on forest land, farmland, and vegetable land [44]. There is a need to investigate the trace elements in all land uses as they are directly linked with the sustainable environment. Several studies have shown divergent findings when it comes to the presence of HMs in soils at higher altitudes, which have received comparatively less attention in terms of their characteristics and pedogenic properties compared to soils at lower altitudes [45]. In the western Himalayan region of the Diamer district, trace element status has not been thoroughly investigated earlier. This study may offer a record of the TEs, providing the basis for any advanced level research in the land uses of the western Himalayan region.

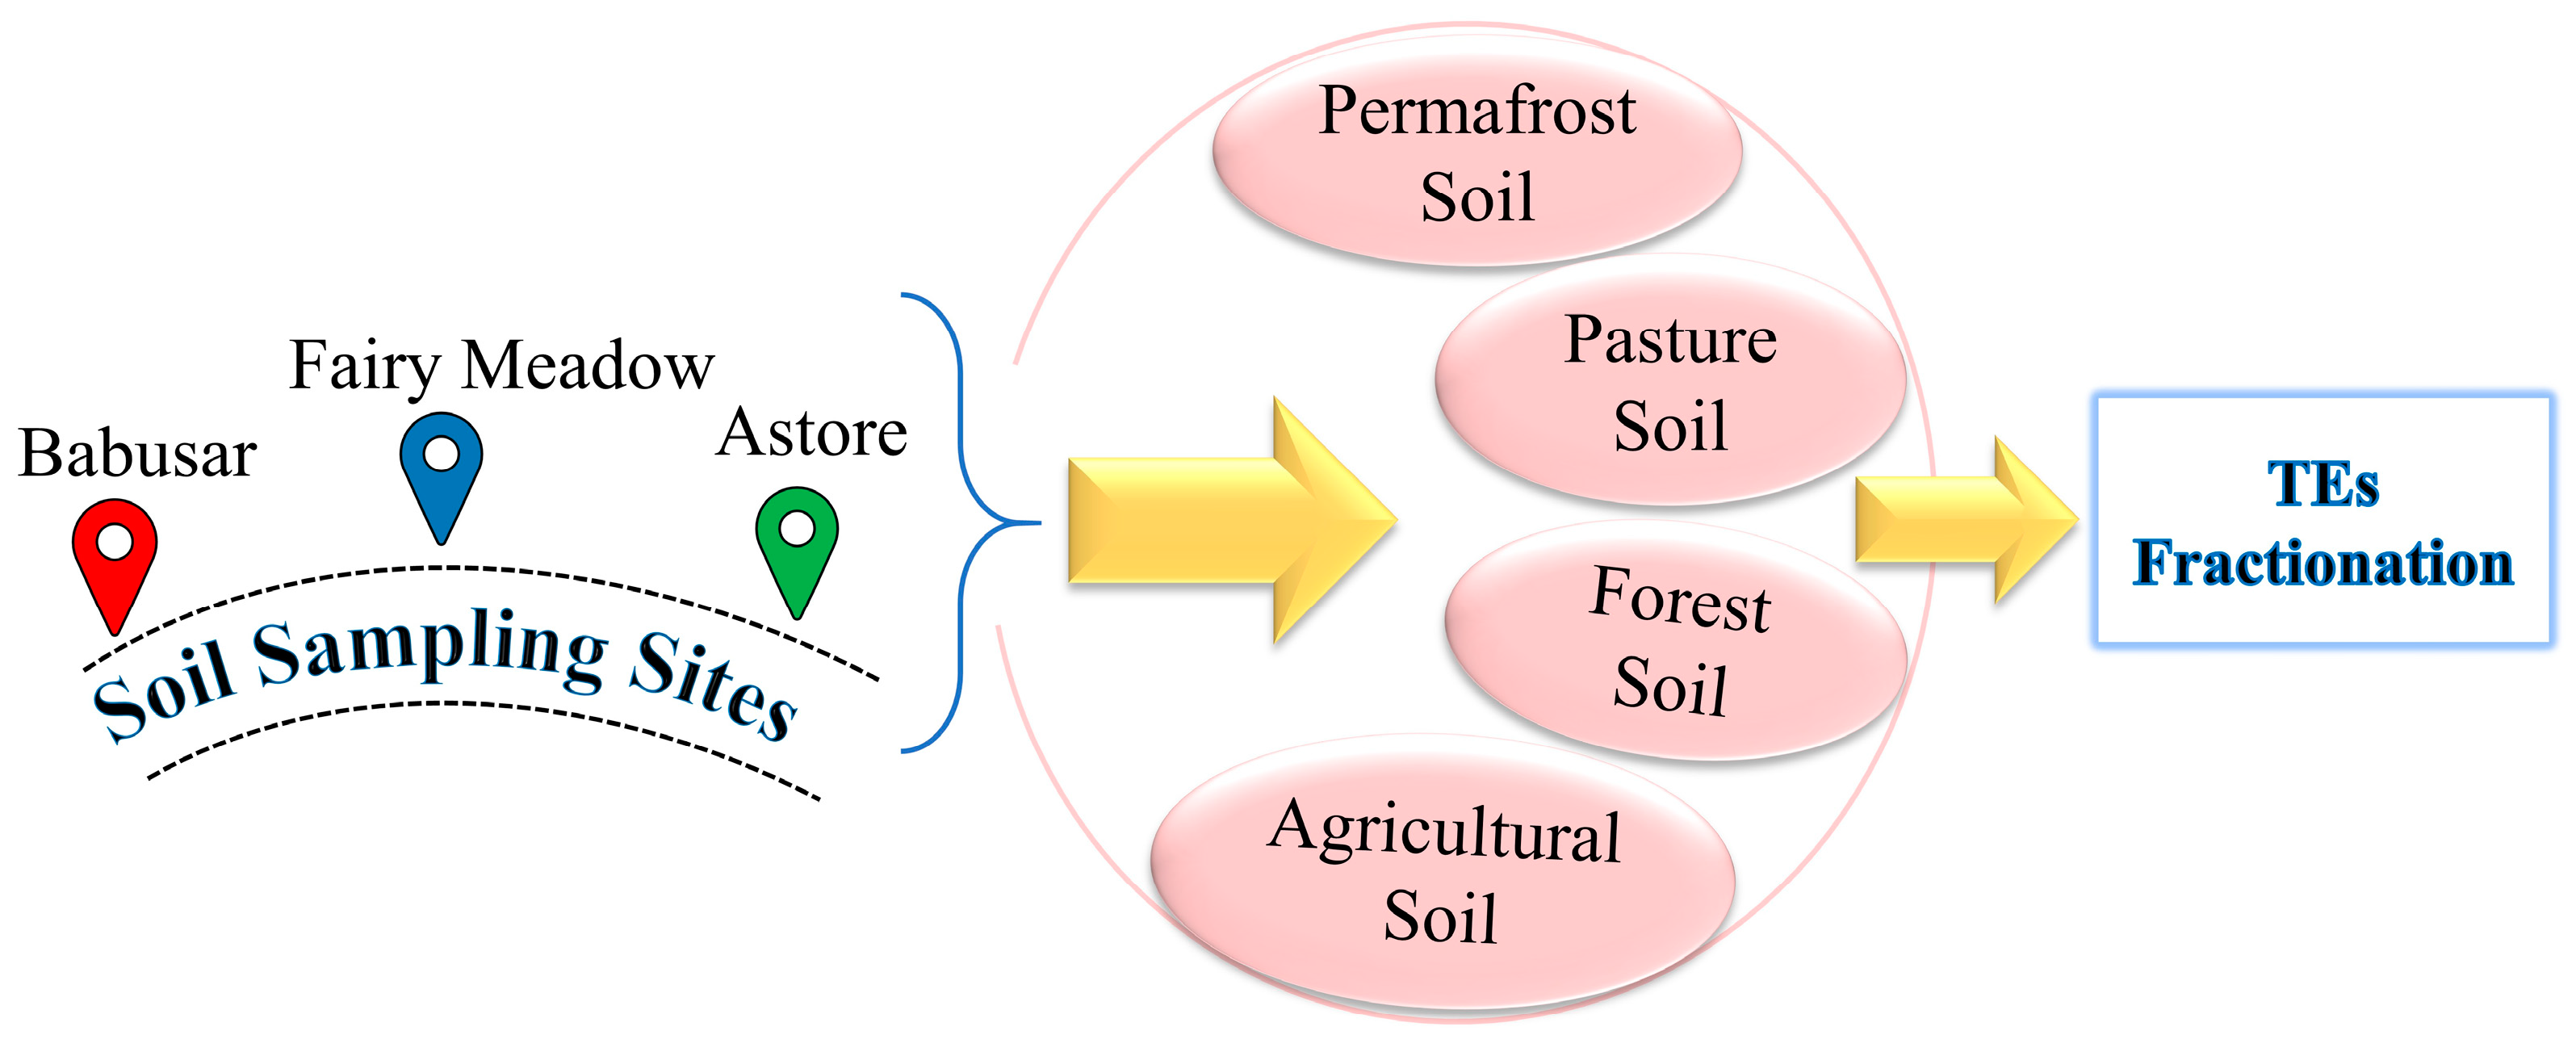
2. Materials and Methods

The region lies between 76° E and 77° E longitude and 35°22′ N latitude. The selected areas of Astore Rama Valley, Babusar Valley, and Fairy Meadows are stretched over Astore and Diamer districts of the Diamer region in the western Himalayas with altitudes of sampling areas ranging from 1670 m to 4307 m above sea level for four land-use systems. The western Himalayas have unique geological extremities with the reliefs ascending from deep valleys to the high mountain peaks of the western Himalayas. The entire area is dominated by high mountains, meadows, and glaciers, which are sources of the Indus River tributaries. Diamer is one of the main forest hotspots in Gilgit Baltistan with farmlands and pastures of Fairy Meadows ascending towards Nanga Parbat mountain as shown in Figure 1.
The soil samples were obtained from three valleys of the Diamer region, i.e., Babusar Valley, Astore Rama Valley, and Fairy Meadows (Figure 2). Collected samples were air-dried and later oven-dried. In order to find the moisture content, 30 g of soil sample were heated at 105 °C for 24 h and weighed again after drying. The soil moisture content was calculated by finding the difference between the initial and final weights of the sample measured using the following formula [46].
M o i s t u r e   c o n t e n t = M o i s t   w e i g h t   o f   s a m p l e D r y   w e i g h t   o f   s a m p l e D r y   w e i g h t   o f   t h e   s a m p l e × 100
To investigate the organic matter, the dry combustion method was used by placing 20 g of soil in a heating furnace at 550 °C for 24 h. Soil organic content (OC) was calculated by finding the percentage difference in the initial and final weight of soil. The pH and electric conductivity (EC) were analyzed using the weight-to-volume ratio (w/v) of soil and water as 1:5 [47]. To determine the pH and EC, 4 g of soil were mixed in 20 mL of deionized (DI) water and permitted to settle for 20 min, and the electrode of the pH/EC meter was dipped in soil solution for 30 s.
Successive extractions were completed in triplicate utilizing 3 g of sample in 50 mL centrifuge tubes. TEs (Cu, Ni, Zn) were fractionated into exchangeable, adsorbed, organically bound, carbonate precipitated, and remaining structures with successive removals with 25 mL of the reagents. For the investigation of exchangeable TEs, 0.5 Mole KNO3 was added to the sample and shaken for 16 h. Exchangeable TEs are weakly bound to the soil particles and can be easily exchanged with other ions in the soil solution. Then, 25 mL de-ionized water was added to the residue and shaken for 2 h (separated three times and consolidated) in order to find the TEs in adsorbed form. Adsorbed fractions include TEs adsorbed onto the surface of soil or sediment particles. They are not tightly bound and can be released under certain conditions. Organic bounded fractions consist of TEs that are bound to organic matter in the sample. Organic matter in soil or sediment can act as a binding agent for TEs. This was identified by taking residues of adsorbed fraction in 0.5 M solution of NaOH shaken for 16 h and filtering it. Some TEs can form carbonate precipitates, especially in alkaline conditions. For investigating the carbonated precipitated form, 0.05 Mole of Na2EDTA were added to the residual sample and shaken for 6 h. The residual fraction contains TEs that are strongly bound to the mineral matrix of the sample. These metals are not easily released and are considered relatively immobile. This was identified by taking residues of carbonate precipitated metal and adding 4 Mole HNO3 and shaking for 16 h at 80 °C. The TEs were fractionated into exchangeable, adsorbed, organically bound, carbonate precipitated, and residual forms with sequential extractions. During every fraction, the sample tubes were centrifuged at the speed of 2500 rpm for 10 min, and the subsequent supernatant arrangement was tapped and separated by a 0.22 μm channel. The trace element substance in the separated arrangement was resolved with the captivated Zeeman Atomic Absorption Spectrophotometer. For quality control and assurance analysis, the instruments used in the analyses were calibrated with AMS instrumentation and calibration solutions, which is the most reliable method to ensure quality consideration. The instrument was calibrated using standard solutions to measure the accuracy of each TE. The accuracy of the analytical procedures was evaluated by analyzing the standard reference material (SRM). The mean value for each sample was calculated using three measurement readings on the atomic absorption spectrophotometer, and the error estimate was calculated via the standard deviation of the results. Results were statistically analyzed with the help of two-way ANOVA in order to find the significant differences. Pearson correlation coefficients of soil physiochemical properties with trace elements were investigated using the software Sigma Plot 14.0.

3. Results and Discussion

The physicochemical properties of the soils, i.e., pH, electrical conductivity (EC), organic matter (OM) content, and percentage moisture content (MC) under four different land-use systems (permafrost, forest, pasture, and agricultural soil) are shown in Table 1. Table 1 shows the greatest pH value was investigated in the pasture soils of Babusar Valley (7.452), and the lowest value was observed in the forest soils of Babusar Valley (7.0). Various factors, such as fertilization as well as parent material, can influence the soil pH. In Astore Rama Valley, the highest value of pH was noticed in the permafrost soils (7.67), and the lowest value was noticed in the agricultural soil of Astore Rama Valley (7.4). In Fairy Meadow, the maximum value was observed in the permafrost soils (7.16), and the minimum was noticed in the agricultural soil (6.59). Soil pH is also related to the mobility and bioavailability of the metals [48]. The highest value of electrical conductivity was observed in the agricultural soil of Babusar (601.6 µS/cm), and the lowest was indicated in the permafrost soils of Babusar (482.2 µS/cm). In Astore Valley, the maximum value was noticed in the pasture soils (549 µS/cm), and the minimum value was observed in the agricultural soil of Astore (419 µS/cm). In Fairy Meadow, the greatest value was found in the agricultural soil (492 µS/cm), and the lowest value was investigated in forest land-use (412 µS/cm). Among all three valleys, the moisture content’s greatest value was observed in the permafrost soils of Astore Rama (13%), and the lowest was observed in the agricultural soil of Astore Rama Valley and Babusar valley (5%). The maximum value of OM was noticed in the forest soils of Fairy Meadows (0.75 mg·kg−1), and the lowest value was investigated in the permafrost soils of Astore Rama Valley (0.12 mg·kg−1)). Soils richer in OM are characterized by a higher reaction (pH) [15,18]. Man-induced activities may alter the physical and chemical properties of soils as well as bodies of water, making them detrimental to the surrounding ecosystem. Generally, the silt and sand content were found dominant in all the sites in all four land-use systems. In Babusar Valley, the soil texture was silt clay loam in agricultural soils, silt loom in forest and pasture soils, and sandy loam in permafrost soils. In Astore Rama, the agricultural soil was silt loam, the forest was sandy loam, and pasture and permafrost were also found to be silt loam. In Fairy Meadows, the agricultural soil was silt loam, and forest soils were loamy while the sandy loam soils were found in both pasture and permafrost soils.
During the extraction process, the amounts of trace elements remained highly dependent on the extraction method. The element fractions extracted by the reagents varied in the order of H2O < KNO3< NaOH < HNO3 < EDTA. Table 2 indicates the maximum concentration of nickel in the agricultural soil of Astore Rama Valley (6.95 mg·kg−1), and the minimum was noted in the pasture soils of Babusar Valley (1.75 mg·kg−1) in an exchangeable form. The low level of Ni in the pasture land-use system translates into the low Ni in the herbs grown on the same land uses [49]. In an adsorbed form, the highest value of Ni was examined in the agricultural soil of Fairy Meadows Valley (3.85 mg·kg−1), and the lowest value was observed in the permafrost soils of Astore Rama Valley (0.25 mg·kg−1). The lower amount of TE in permafrost suggests leaching or transportation of the Ni to other land uses with precipitation and other environmental factors.
The maximum absorption of Ni was observed In an organically bound form in the agricultural soils of Astore Rama (9.3 mg·kg−1), and the least was noted in the agricultural soil of Babusar Valley (1.45 mg·kg−1). The increased concentration of Ni in agricultural lands may be due to anthropogenic influences. The maximum Ni concentration was found in the carbonate precipitated form in the agricultural soil of Fairy Meadows Valley (372.8 mg·kg−1), whereas the minimum was noted in the pasture soils of Astore Rama Valley (206.6 mg·kg−1). Elements in the residual fractions are tightly bound and not expected to be released readily under natural conditions. The highest concentration of Ni was found in the agricultural soil of Astore Rama Valley (298.3 mg·kg−1), and the lowest concentration was in the pasture soils of Astore Rama Valley (116.9 mg·kg−1). Table 2 shows a pattern indicating a higher concentration of Ni in the land uses, which are easily accessible to human influence. The studies showed that the frequent application of sewage sludge raised the content of heavy metals in the soil, which ultimately increased the concentration of those metals in plant tissues. An example is the Champagne-Ardenne area (Reims, France) where sludge-amended soil columns corresponded to elevated Ni levels [50].
The zinc concentration in the soils of different land-use systems was observed as H2O < NaOH < KNO3 < HNO3 < EDTA (Table 3). Zinc showed a maximum concentration in the agricultural soil of Babusar (119.5 mg·kg−1), and the lowest amount was observed in the forest soils of Babusar (52.75 mg·kg−1) in an exchangeable form. The availability of the tEs also depends upon the soil texture [30]. Zn is a significant element for its involvement in many biological processes [51]. Within permissible limits, Zn plays an important role in enzyme activity in plants [52]. On the other hand, when it exceeds this limit, it causes many adverse effects and leads to heavy metal toxicity [53]. tEs are often attributed to the parent material, become part of various land uses under environmental influences that persist over a geologic period of time, and ultimately become an important part of natural soils. However, apart from the parent material, due to anthropogenic sources, the level of tEs in soils increases [54].
Zinc extracted with H2O was found highest in both the permafrost soils of Babusar and the agricultural soils of Astore (1.25 mg·kg−1), and the lowest value was in the pasture soils of Fairy Meadows (0.4 mg·kg−1), as shown in Table 3. Low levels of Zn may have an adverse effect on such land uses by resulting in the poor growth of pastures. The highest amount of Zn was noted in the organically bound form in the agricultural soils of Astore (22.85 mg·kg−1) and the lowest in the Babusar forest soils (8.35 mg·kg−1) (Table 3). One of the reasons for a high Zn content in the agricultural soils may be the fact that agricultural land use is prone to anthropogenic influences and practices [31]. Generally, the high content of tEs in the soil corresponds to their high content in forages grown in the same land-use systems, which also have an impact on grazing animals [49]. The Zn maximum amount was found in the carbonated precipitated form in the agricultural soils of Babusar (327.65 mg·kg−1) whereas the minimum was in the forest soils of Fairy Meadows (105.5 mg·kg−1). In residual form, the highest concentration of Zn was found in the Babusar agricultural soils (295.5 mg·kg−1) and the lowest concentration in the Babusar pasture soils (85.9 mg·kg−1), as shown in Table 3. The lowest amount of Zn was observed in the pasture soils irrespective of the regions.
The concentration of Cu in the samples of different land uses was noticed in the order of H2O < NaOH < KNO3 < HNO3 < EDTA (Table 4). The maximum content of Cu was in the agricultural soils of Astore (22.3 mg·kg−1) and the minimum in the pasture soils of Fairy Meadows (11.6 mg·kg−1) in exchangeable metals. In the western Himalayas, small leveled agricultural land patches are commonly fed by glacial water channels. There is also a trend of using organic and chemical fertilizers for better crop yield in these agricultural land uses. The elevated concentration of Cu in agricultural soils may be attributed to the use of fertilizers and pesticides [55]. Soil respiration activity is significantly impaired and restricted when exposed to elevated levels of copper (Cu) [56]. The maximum adsorption of Cu was investigated in the permafrost soils of Babusar Valley (1.7 mg·kg−1), and the minimum was noted in the forest of Babusar Valley (0.15 mg·kg−1). The greatest organically bound Cu was noticed in the permafrost soils of Fairy Meadows (16.8 mg·kg−1), and a lesser amount was found in the pasture soils of Fairy Meadows (11.3 mg·kg−1), as indicated by Table 4.
The elevated amount of Cu in permafrost soils suggests the parent material with the presence of Cu. Further study of the reasons for the presence of a high content of Cu in the specific land use may be yet another dimension of the study. The cu maximum concentration was found in the carbonate precipitated form in the agricultural soils of Fairy Meadows (94.65 mg·kg−1), whereas the minimum was observed in the Babusar Valley forest soils (31.3 mg·kg−1), as shown in Table 4. A high Cu content in agricultural soils is in agreement with the conclusions of many researchers who find divergent reasons for significantly high Cu in agricultural soils. One of the reasons for the elevated amount of Cu in agricultural soils may be the practice of Cu-based sprays, which were frequently observed in countries such as Italy [57]. It is reported in many studies that agricultural land was observed with a higher concentration of Cu compared to forest lands. Elevated concentrations of Cu and Zn can lead to an imbalanced absorption of vital nutrients and foster cooperative or opposing interactions among various elements [58]. The residual form of Cu shows the highest concentration in the agricultural soils of Fairy Meadows (33.75 mg·kg−1) and the lowest concentration in the pasture of Fairy Meadows (10.4 mg·kg−1). Some specific sites in soils have more affinity to adsorb heavy metals, such as Cu and Zn, applied in the form of fertilizers due to some functional groups of organic compounds [59].
Table 2, Table 3 and Table 4 are statistically analyzed with the help of a two-way ANOVA. In Table 2, Table 3 and Table 4, the upper-case letters show the significant differences in land uses within the same regions while the lower-case letters show the significant differences among the same land uses across all three regions. The analysis of variance (ANOVA) revealed that land use had a significant effect on trace element concentration. Generally, the trace elements were found in higher concentrations in agricultural land use irrespective of the study area. The concentration of trace elements considerably varied in the order of H2O < NaOH < KNO3 < HNO3 < EDTA. The concentration of the extractable, water-soluble, and total Ni, Zn, and Cu was observed in the order of agricultural > permafrost > pasture > forest.
Table 5 shows the Pearson correlation coefficient of physical and chemical properties with other physicochemical properties as well as trace elements in the total form. In Babusar Valley, a non-significant relationship was found among all physicochemical properties and trace elements. Soil pH was negatively correlated with EC (r2 = 0.501, p = 0.499) and Moisture Content (MC) (r2 = −0.749, p = 0.251). Organic matter (OM) also showed a negative co-relation with Ni (r2 = −0.956, p = 0.189), Zn (r2 = −0.862, p = 0.338), and Cu (r2 = −0.984, p = 0.115). However, parameters pH and EC are observed to be positively correlated with the selected trace elements.
In Astore Rama, a non-significant relationship was found among all physicochemical properties and trace elements except Zn and Cu. A negative significant correlation was observed between EC and Zn (r2 = −0.968, p = 0.031) and soil OM and Cu (r2 = −0.979, p = 0.021). Soil pH is observed to be negatively correlated with EC and OM. A negative correlation of EC, OM, and MC is found with Ni, Cu, and Zn. However, pH showed a positive correlation with the selected trace elements. In Fairy Meadows, a non-significant relationship was found among all physicochemical properties and trace elements. The pH showed a negative non-significant correlation with three TEs; however, EC was found to be positively and non-significantly correlated with Cu, Ni, and Zn. OM was found negatively correlated with physicochemical properties as well as TEs. MC showed a positive non-significant co-relation with total Zn and Cu.

4. Conclusions

In the present work, we have observed the significant dependence of TEs in various land-use systems. TEs concentration was found dependent on land-use patterns. There are many factors influencing the TEs’ dynamics in the land-use systems in Diamer, such as growing commercial and economic activities, rapid urbanization, and a boom in the tourism and hospitality industry. The land uses in the region are along topographical gradients, thus allowing for the influence of the parent material from permafrost at higher altitudes to pasture, forest, and agricultural land uses at lower altitudes down the slope. It was found that for all the areas in the Diamer region, the TEs varied significantly with higher amounts in agricultural soils as compared with other land uses. The concentration of soil TEs was observed in the order of adsorbed < organically bound < exchangeable < residual < carbonated precipitated form across all the land-use systems in the Diamer region. The total TE concentration varied as Zn > Ni > Cu across the land-use systems of the selected areas in the region.

Author Contributions

Conceptualization, F.U.H. and F.F.; methodology, F.U.H. and F.F.; validation, A.I.; formal analysis, A.-U.-R.B., F.H. and A.I.; writing—review and editing, F.U.H., F.F., M.I., A.-U.-R.B., F.H., Z.U., M.F., R.N., A.F.A. and M.H.A.; supervision, F.F. and A.-U.-R.B.; software, A.-U.-R.B., F.U.H. and A.I.; project administration, A.F.A. and M.H.A. All authors have read and agreed to the published version of the manuscript.

Funding

This research was funded by Researchers Supporting Project Number (RSP2023R191), King Saud University, Riyadh, Saudi Arabia.

Data Availability Statement

The data presented in this study are available on request from the corresponding author.

Acknowledgments

We extend our appreciation to the Researchers Supporting Project (No. RSP2023R191), King Saud University, Riyadh, Saudi Arabia.

Conflicts of Interest

The author declares no conflict of interest.

References

  1. Shaji, H.; Chandran, V.; Mathew, L. Chapter 13—Organic fertilizers as a route to controlled release of nutrients. In Controlled Release Fertilizers for Sustainable Agriculture; Lewu, F.B., Volova, T., Thomas, S., Rakhimol, K.R., Eds.; Academic Press: Cambridge, MA, USA, 2021; pp. 231–245. [Google Scholar] [CrossRef]
  2. Bhardwaj, A.K.; Arya, G.; Kumar, R.; Hamed, L.; Pirasteh-Anosheh, H.; Jasrotia, P.; Kashyap, P.L.; Singh, G.P. Switching to nanonutrients for sustaining agroecosystems and environment: The challenges and benefits in moving up from ionic to particle feeding. J. Nanobiotechnol. 2022, 20, 19. [Google Scholar] [CrossRef]
  3. Martínez-Toledo, Á.; González-Mille, D.J.; Briones-Gallardo, R.; Carrizalez-Yañez, L.; Felipe Martínez-Montoya, J.; de Jesús Mejía-Saavedra, J.; Ilizaliturri-Hernández, C.A. Functioning of semi-arid soils under long-term mining activity with trace elements at high concentrations. CATENA 2023, 222, 106851. [Google Scholar] [CrossRef]
  4. Muszyńska, E.; Labudda, M. Dual Role of Metallic Trace Elements in Stress Biology—From Negative to Beneficial Impact on Plants. Int. J. Mol. Sci. 2019, 20, 3117. [Google Scholar] [CrossRef]
  5. Jiang, S.; Zhang, H.; Zheng, Y.; Chen, Z. Atomistic study of the mechanical response of copper nanowires under torsion. J. Phys. D Appl. Phys. 2009, 42, 135408. [Google Scholar] [CrossRef]
  6. Zhang, H.; Wang, Z.; Zhang, Y.; Ding, M.; Li, L. Identification of traffic-related metals and the effects of different environments on their enrichment in roadside soils along the Qinghai–Tibet highway. Sci. Total Environ. 2015, 521–522, 160–172. [Google Scholar] [CrossRef]
  7. Romero-Crespo, P.; Jiménez-Oyola, S.; Salgado-Almeida, B.; Zambrano-Anchundia, J.; Goyburo-Chávez, C.; González-Valoys, A.; Higueras, P. Trace elements in farmland soils and crops, and probabilistic health risk assessment in areas influenced by mining activity in Ecuador. Environ. Geochem. Health 2023, 45, 4549–4563. [Google Scholar] [CrossRef]
  8. Ahamad, A.; Raju, N.J.; Madhav, S.; Khan, A.H. Trace elements contamination in groundwater and associated human health risk in the industrial region of southern Sonbhadra, Uttar Pradesh, India. Environ. Geochem. Health 2020, 42, 3373–3391. [Google Scholar] [CrossRef]
  9. Baude, M.; Meyer, B.C.; Schindewolf, M. Land use change in an agricultural landscape causing degradation of soil based ecosystem services. Sci. Total Environ. 2019, 659, 1526–1536. [Google Scholar] [CrossRef]
  10. Della Chiesa, S.; la Cecilia, D.; Genova, G.; Balotti, A.; Thalheimer, M.; Tappeiner, U.; Niedrist, G. Farmers as data sources: Cooperative framework for mapping soil properties for permanent crops in South Tyrol (Northern Italy). Geoderma 2019, 342, 93–105. [Google Scholar] [CrossRef]
  11. Hengl, T.; Mendes de Jesus, J.; Heuvelink, G.B.; Ruiperez Gonzalez, M.; Kilibarda, M.; Blagotić, A.; Shangguan, W.; Wright, M.N.; Geng, X.; Bauer-Marschallinger, B. SoilGrids250m: Global gridded soil information based on machine learning. PLoS ONE 2017, 12, e0169748. [Google Scholar] [CrossRef]
  12. Pande, C.B.; Moharir, K.N.; Khadri, S.F.R. Assessment of land-use and land-cover changes in Pangari watershed area (MS), India, based on the remote sensing and GIS techniques. Appl. Water Sci. 2021, 11, 96. [Google Scholar] [CrossRef]
  13. Wieczorek, J.; Baran, A.; Urbański, K.; Mazurek, R.; Klimowicz-Pawlas, A. Assessment of the pollution and ecological risk of lead and cadmium in soils. Environ. Geochem. Health 2018, 40, 2325–2342. [Google Scholar] [CrossRef] [PubMed]
  14. Wyszkowski, M.; Modrzewska, B. Acidity and sorption properties of Zinc-contaminated soil following the application of neutralising substances. J. Ecol. Eng. 2016, 17, 63–68. [Google Scholar] [CrossRef] [PubMed]
  15. Navarro-Pedreño, J.; Almendro-Candel, M.B.; Gómez Lucas, I.; Jordán Vidal, M.M.; Bech Borras, J.; Zorpas, A.A. Trace Metal Content and Availability of Essential Metals in Agricultural Soils of Alicante (Spain). Sustainability 2018, 10, 4534. [Google Scholar] [CrossRef]
  16. Yan, X.; Liu, M.; Zhong, J.; Guo, J.; Wu, W. How Human Activities Affect Heavy Metal Contamination of Soil and Sediment in a Long-Term Reclaimed Area of the Liaohe River Delta, North China. Sustainability 2018, 10, 338. [Google Scholar] [CrossRef]
  17. Nunes, J.R.; Ramos-Miras, J.; Lopez-Piñeiro, A.; Loures, L.; Gil, C.; Coelho, J.; Loures, A. Concentrations of Available Heavy Metals in Mediterranean Agricultural Soils and their Relation with Some Soil Selected Properties: A Case Study in Typical Mediterranean Soils. Sustainability 2014, 6, 9124–9138. [Google Scholar] [CrossRef]
  18. Sungur, A.; Soylak, M.; Ozcan, H. Investigation of heavy metal mobility and availability by the BCR sequential extraction procedure: Relationship between soil properties and heavy metals availability. Chem. Speciat. Bioavailab. 2014, 26, 219–230. [Google Scholar] [CrossRef]
  19. Józefowska, A.; Miechówka, A.; Gąsiorek, M.; Zadrożny, P. Content of zinc, lead and cadmium in selected agricultural soils in the area of the Śląskie and Ciężkowickie foothills. J. Ecol. Eng. 2014, 15, 74–80. [Google Scholar] [CrossRef]
  20. Sayadi, M. Grain size fraction of heavy metals in soil and their relationship with land use. Proc. Int. Acad. Ecol. Environ. Sci. 2017, 7, 1. [Google Scholar]
  21. Verla, E.N.; Verla, A.W.; Osisi, A.F.; Okeke, P.N.; Enyoh, C.E. Finding a relationship between mobility factors of selected heavy metals and soil particle size in soils from children’s playgrounds. Environ. Monit. Assess. 2019, 191, 742. [Google Scholar] [CrossRef]
  22. Wang, L.; Chen, H.; Wu, J.; Huang, L.; Brookes, P.C.; Mazza Rodrigues, J.L.; Xu, J.; Liu, X. Effects of magnetic biochar-microbe composite on Cd remediation and microbial responses in paddy soil. J. Hazard. Mater. 2021, 414, 125494. [Google Scholar] [CrossRef] [PubMed]
  23. Wyszkowski, M.; Modrzewska, B. Effect of neutralising substances on the total content of trace elements in soil contaminated with zinc. J. Elem. 2017, 22, 4. [Google Scholar] [CrossRef]
  24. Dobiński, W. Permafrost active layer. Earth-Sci. Rev. 2020, 208, 103301. [Google Scholar] [CrossRef]
  25. Dobiński, W. The Occurrence of Permafrost within the Glacial Domain. Geosciences 2020, 10, 193. [Google Scholar] [CrossRef]
  26. Zanini, E.; Freppaz, M.; Stanchi, S.; Bonifacio, E.; Egli, M. Soil variability in mountain areas. In Understanding Mountain Soils: A Contribution from Mountain Areas to the International Year of Soils 2015; FAO: Rome, Italy, 2015; pp. 60–62. [Google Scholar]
  27. Baronti, S.; Ungaro, F.; Maienza, A.; Ugolini, F.; Lagomarsino, A.; Agnelli, A.E.; Calzolari, C.; Pisseri, F.; Robbiati, G.; Vaccari, F.P. Rotational pasture management to increase the sustainability of mountain livestock farms in the Alpine region. Reg. Environ. Chang. 2022, 22, 50. [Google Scholar] [CrossRef]
  28. Qureshi, R.; Ghufran, M.; Sultana, K.; Ashraf, M.; Khan, A. Ethnomedicinal studies of medicinal plants of Gilgit District and surrounding areas. Ethnobot. Res. Appl. 2007, 5, 115–122. Available online: https://ethnobotanyjournal.org/index.php/era/article/view/143 (accessed on 31 December 2007). [CrossRef]
  29. Brunetto, G.; Bastos de Melo, G.W.; Terzano, R.; Del Buono, D.; Astolfi, S.; Tomasi, N.; Pii, Y.; Mimmo, T.; Cesco, S. Copper accumulation in vineyard soils: Rhizosphere processes and agronomic practices to limit its toxicity. Chemosphere 2016, 162, 293–307. [Google Scholar] [CrossRef]
  30. Sungur, A.; Temel, E.; Everest, T.; Soylak, M.; Özcan, H. Effects of soil texture on trace metal concentrations and geochemical fractions in the soil of apple orchards (Çanakkale, NW Turkey). Arch. Agron. Soil Sci. 2023, 69, 2677–2691. [Google Scholar] [CrossRef]
  31. Vareda, J.P.; Valente, A.J.M.; Durães, L. Assessment of heavy metal pollution from anthropogenic activities and remediation strategies: A review. J. Environ. Manag. 2019, 246, 101–118. [Google Scholar] [CrossRef]
  32. Zhang, Q.; Wang, C. Natural and Human Factors Affect the Distribution of Soil Heavy Metal Pollution: A Review. Water Air Soil Pollut. 2020, 231, 350. [Google Scholar] [CrossRef]
  33. Graham, R.D.; Welch, R.M. Breeding for Staple Food Crops with High Micronutrient Density; International Food Policy Research Institute: Washington, DC, USA, 1996; Volume 3. [Google Scholar]
  34. Chang, A.; Page, A. Trace elements slowly accumulating, depleting in soils. Calif. Agric. 2000, 54, 49–55. [Google Scholar] [CrossRef]
  35. Naz, M.; Raza, M.A.; Bodlah, M.A.; Bouzroud, S.; Ghani, M.I.; Riaz, M.; Shah, T.; Zubair, A.; Bodlah, I.; Fan, X. Beneficial Elements in Plant Life under A Changing Environment. Benef. Chem. Elem. Plants Recent Dev. Future Prospect. 2023, 1, 1–21. [Google Scholar] [CrossRef]
  36. Khan, S.; Naushad, M.; Lima, E.C.; Zhang, S.; Shaheen, S.M.; Rinklebe, J. Global soil pollution by toxic elements: Current status and future perspectives on the risk assessment and remediation strategies—A review. J. Hazard. Mater. 2021, 417, 126039. [Google Scholar] [CrossRef] [PubMed]
  37. Giacomino, A.; Abollino, O.; Malandrino, M.; Mentasti, E. The role of chemometrics in single and sequential extraction assays: A Review. Part II. Cluster analysis, multiple linear regression, mixture resolution, experimental design and other techniques. Anal. Chim. Acta 2011, 688, 122–139. [Google Scholar] [CrossRef] [PubMed]
  38. Luz, F.; Mateus, A.; Matos, J.X.; Gonçalves, M.A. Cu- and Zn-Soil Anomalies in the NE Border of the South Portuguese Zone (Iberian Variscides, Portugal) Identified by Multifractal and Geostatistical Analyses. Nat. Resour. Res. 2014, 23, 195–215. [Google Scholar] [CrossRef]
  39. Odukudu, F.B.; Ayenimo, J.G.; Adekunle, A.S.; Yusuff, A.M.; Mamba, B.B. Safety evaluation of heavy metals exposure from consumer products. Int. J. Consum. Stud. 2014, 38, 25–34. [Google Scholar] [CrossRef]
  40. Ayoubi, S.; Khormali, F.; Sahrawat, K.; De Lima, A. Assessing impacts of land use change on soil quality indicators in a loessial soil in Golestan Province, Iran. Rodrigues 2011, 13, 727–742. [Google Scholar]
  41. Panditharathne, D.L.D.; Abeysingha, N.S.; Nirmanee, K.G.S.; Mallawatantri, A. Application of Revised Universal Soil Loss Equation (Rusle) Model to Assess Soil Erosion in “Kalu Ganga” River Basin in Sri Lanka. Appl. Environ. Soil Sci. 2019, 2019, 4037379. [Google Scholar] [CrossRef]
  42. Zang, F.; Wang, H.; Zhao, C.; Nan, Z.; Wang, S.; Yang, J.; Li, N. Atmospheric wet deposition of trace elements to forest ecosystem of the Qilian Mountains, northwest China. Catena 2021, 197, 104966. [Google Scholar] [CrossRef]
  43. Marsay, C.M.; Kadko, D.; Landing, W.M.; Buck, C.S. Bulk aerosol trace element concentrations and deposition fluxes during the US GEOTRACES GP15 Pacific Meridional Transect. Glob. Biogeochem. Cycles 2022, 36, e2021GB007122. [Google Scholar] [CrossRef]
  44. Zheng, G.; Yue, L.; Li, Z.; Chen, C. Assessment on heavy metals pollution of agricultural soil in Guanzhong District. J. Geogr. Sci. 2006, 16, 105–113. [Google Scholar] [CrossRef]
  45. Magnani, A.; Viglietti, D.; Godone, D.; Williams, M.W.; Balestrini, R.; Freppaz, M. Interannual variability of soil N and C forms in response to snow-cover duration and pedoclimatic conditions in alpine tundra, northwest Italy. Arct. Antarct. Alp. Res. 2017, 49, 227–242. [Google Scholar] [CrossRef]
  46. Hafeez, F.; Amin, B.A.Z.; Akbar, U.; Iqbal, A.; Faridullah; Bilal, M.; Nazir, R. Assessment of phosphorus availability in soil by introducing P-solubilizing novel bacterial and fungal strains of Lower Himalaya. Commun. Soil Sci. Plant Anal. 2019, 50, 1541–1549. [Google Scholar] [CrossRef]
  47. Ahmad, D.; Hafeez, F.; Irshad, M.; Mehmood, Q.; Tahir, A.A.; Iqbal, A.; Faridullah. The comparative analysis of essential nutrient fractions in permafrost and different land use systems of Diamer Division, Gilgit-Baltistan. Arab. J. Geosci. 2021, 13, 1286. [Google Scholar] [CrossRef]
  48. Sungur, A.; Gur, E.; Everest, T.; Soylak, M.; Ozcan, H. Assessment of relationship between geochemical fractions of barium in soil of cherry orchards and plant barium uptake and determination by inductively coupled plasma optical emission spectrometry. Spectrosc 2019, 40, 173–178. [Google Scholar] [CrossRef]
  49. Swartjes, F.A.; Siciliano, S. Dealing with contaminated sites: From theory towards practical application. Soil Sci. Soc. Am. J. 2012, 76, 748. [Google Scholar] [CrossRef]
  50. Mamindy-Pajany, Y.; Sayen, S.; Guillon, E. Impact of sewage sludge spreading on nickel mobility in a calcareous soil: Adsorption–desorption through column experiments. Environ. Sci. Pollut. Res. 2013, 20, 4414–4423. [Google Scholar] [CrossRef]
  51. Yang, M.; Li, Y.; Liu, Z.; Tian, J.; Liang, L.; Qiu, Y.; Wang, G.; Du, Q.; Cheng, D.; Cai, H. A high activity zinc transporter OsZIP9 mediates zinc uptake in rice. Plant J. 2020, 103, 1695–1709. [Google Scholar] [CrossRef]
  52. Alsafran, M.; Usman, K.; Ahmed, B.; Rizwan, M.; Saleem, M.H.; Al Jabri, H. Understanding the phytoremediation mechanisms of potentially toxic elements: A proteomic overview of recent advances. Front. Plant Sci. 2022, 13, 881242. [Google Scholar] [CrossRef]
  53. Zhang, Y.Y.; Stockmann, R.; Ng, K.; Ajlouni, S. Revisiting phytate-element interactions: Implications for iron, zinc and calcium bioavailability, with emphasis on legumes. Crit. Rev. Food Sci. Nutr. 2022, 62, 1696–1712. [Google Scholar] [CrossRef]
  54. Sungur, A.; Soylak, M.; Yilmaz, E.; Yilmaz, S.; Ozcan, H. Characterization of heavy metal fractions in agricultural soils by sequential extraction procedure: The relationship between soil properties and heavy metal fractions. Soil Sediment Contam. Int. J. 2015, 24, 907238. [Google Scholar] [CrossRef]
  55. Acosta, J.A.; Jansen, B.; Kalbitz, K.; Faz, A.; Martínez-Martínez, S. Salinity increases mobility of heavy metals in soils. Chemosphere 2011, 85, 1318–1324. [Google Scholar] [CrossRef]
  56. Romero-Freire, A.; Sierra Aragón, M.; Martínez Garzón, F.J.; Martín Peinado, F.J. Is soil basal respiration a good indicator of soil pollution? Geoderma 2016, 263, 132–139. [Google Scholar] [CrossRef]
  57. Provenzano, M.R.; El Bilali, H.; Simeone, V.; Baser, N.; Mondelli, D.; Cesari, G. Copper contents in grapes and wines from a Mediterranean organic vineyard. Food Chem. 2010, 122, 1338–1343. [Google Scholar] [CrossRef]
  58. Marastoni, L.; Sandri, M.; Pii, Y.; Valentinuzzi, F.; Brunetto, G.; Cesco, S.; Mimmo, T. Synergism and antagonisms between nutrients induced by copper toxicity in grapevine rootstocks: Monocropping vs. intercropping. Chemosphere 2019, 214, 563–578. [Google Scholar] [CrossRef]
  59. Brunetto, G.; Miotto, A.; Ceretta, C.A.; Schmitt, D.E.; Heinzen, J.; de Moraes, M.P.; Canton, L.; Tiecher, T.L.; Comin, J.J.; Girotto, E. Mobility of copper and zinc fractions in fungicide-amended vineyard sandy soils. Arch. Agron. Soil Sci. 2014, 60, 609–624. [Google Scholar] [CrossRef]
Figure 1. A digital elevation map showing the location of the Diamer region (District Diamer and Astore).
Land 12 01894 g001
Figure 2. Soil sampling and experimental design of the study.
Land 12 01894 g002
Table 1. Physicochemical properties of soil as affected by different land-use systems.
RegionLand UsepHEC
(µS/cm)
OM
(mg·kg−1)
Moisture Content%
Babusar ValleyPermafrost7.07 ± 0.07482.2 ± 5.20.17 ± 0.0411.2 ± 0.3
Forest7.0 ± 0.05577.6 ± 4.80.58 ± 0.079.4 ± 0.6
Pasture7.45 ± 0.08362.2 ± 6.10.48 ± 0.067.3 ± 0.2
Agriculture7.33 ± 0.04601.6 ± 5.30.56 ± 0.055.1 ± 0.03
Astore Rama ValleyPermafrost7.67 ± 0.06451.4 ± 4.50.12 ± 0.0213.3 ± 0.4
Forest7.51 ± 0.05527.2 ± 6.20.61 ± 0.0710.5 ± 0.7
Pasture6.95 ± 0.06549.2 ± 5.60.5 ± 0.088.4 ± 0.5
Agriculture7.46 ± 0.08419.5 ± 4.10.58 ± 0.055.3 ± 0.4
Fairy MeadowPermafrost7.16 ± 0.03412.6 ± 3.70.26 ± 0.0512.4 ± 0.3
Forest6.97 ± 0.08412 ± 5.20.75 ± 0.038.4 ± 0.5
Pasture7.11 ± 0.04422.8 ± 4.20.46 ± 0.027.3 ± 0.2
Agriculture6.59 ± 0.03492 ± 5.50.27 ± 0.056.1 ± 0.3
Table 2. Ni concentration (mg·kg−1) in soil under different land uses.
RegionLand UseExchangeable (KNO3)Adsorbed (H2O)Organically Bound (NaOH)Carbonate Precipitated (EDTA)Remaining Structures (HNO3)Total (hClO4 + HNO3)
Babusar ValleyPermafrost3.15 ± 1.06 B,b1.4 ± 0.28 A,b8.35 ± 0.35 A,a336.7 ± 0.28 A,c144.7 ± 0.85 B,b483.3 ± 2.83 B,a
Forest3.5 ± 0.28 B,b0.85 ± 0.07 A,a2.4 ± 0.42 C,b216.7 ± 0.28 C,b122.7 ± 0.14 C,b340.6 ± 3.11 C,a
Pasture1.75 ± 0.21 C,b0.65 ± 0.21 B,b4.75 ± 0.07 B,b206.8 ± 1.56 D,b117.7 ± 1.41 D,b330.3 ± 0.57 D,b
Agriculture5.9 ± 0.28 A,b1.65 ± 0.07 A,c1.45 ± 0.07 C,b313.4 ± 0.42 B,c290.65 ± 0.35 A,b545.5 ± 1.41 A,b
Astore Rama ValleyPermafrost3.5 ± 0.85 B,a0.25 ± 0.01 C,c6.65 ± 1.63 B,b354.65 ± 0.21 A,a156.95 ± 0.21 B,a435.5 ± 1.41 B,c
Forest6.6 ± 0.71 B,a1.35 ± 0.78 B,a5.85 ± 0.64 B,a215.5 ± 0.57 C,b125.7 ± 0.85 C,a323.6 ± 0.57 D,c
Pasture3.8 ± 0.1.84 C,a2.5 ± 0.28 A,a3.8 ± 0.57 C,b206.6 ± 0.28 D,b116.9 ± 1.41 D,b342.5 ± 1.27 C,a
Agriculture6.95 ± 0.78 A,a2.6 ± 0.28 A,b9.3 ± 0.85 A,a315.5 ± 0.42 B,b298.3 ± 0.14 A,a555.5 ± 2.12 A,c
Fairy MeadowPermafrost4.45 ± 0.07 B,b3.3 ± 0.71 C,a7.05 ± 0.78 AB,a343.5 ± 0.21 B,b134.05 ± 0.35 B,c442.2 ± 3.11 B,b
Forest3.65 ± 0.78 B,b0.55 ± 0.07 B,a4.45 ± 0.35 C,a233.8 ± 0.42 C,a121.35 ± 0.35 C,c332.1 ± 1.27 C,b
Pasture2.25 ± 0.21 C,b2.65 ± 0.64 A,a6.55 ± 0.49 B,a218.45 ± 0.49 D,a122.45 ± 0.21 C,a311.2 ± 3.96 D,c
Agriculture5.7 ± 0.148 A,b3.85 ± 0.35 A,a8.5 ± 0.14 A,a372.85 ± 2.19 A,a282.45 ± 0.49 A,c642.5 ± 0.14 A,a
Note: Upper-case letters show the significant differences in land uses within the same region while the lower-case letters show the significant differences among the same land uses across all three regions.
Table 3. Zn concentration (mg·kg−1) under different land-use systems.
RegionLand UseExchangeable (KNO3)Adsorbed (H2O)Organically Bound (NaOH)Carbonate Precipitated (EDTA)Remaining Structures (HNO3)Total (hClO4 + HNO3)
Babusar ValleyPermafrost72.85 ± 0.07 B,c1.25 ± 0.07 A,a17.3 ± 0.14 B,b225.35 ± 0.07 B,c196.45 ± 0.21 D,a522.5 ± 0.71 B,b
Forest52.75 ± 0.21 D,c0.65 ± 0.07 B,a8.35 ± 0.21 D,c124.15 ± 1.91 C,b183.45 ± 3.04 C,a355.6 ± 1.70 C,a
Pasture62.55 ± 0.07 C,c0.8 ± 0.14 B,a11.35 ± 0.21 C,b109 ± 0.28 D,a85.9 ± 0.57 D,c284.6 ± 3.25 D,b
Agriculture119.5 ± 0.14 A,a1.15 ± 0.07 A,a18.35 ± 0.21 A,b327.65 ± 2.62 A,a295.55 ± 0.35 A,a752.5 ± 1.41 A,a
Astore Rama ValleyPermafrost81.65 ± 0.35 B,b1.2 ± 0.14 A,ab21.6 ± 0.42 B,a250.4 ± 0.14 B,a167.45 ± 0.21 D,c518.8 ± 0.14 B,b
Forest68.35 ± 0.07 D,b0.7 ± 0.14 B,ab20.7 ± 0.28 B,a124.7 ± 0.14 B,a122.7 ± 2.97 C,c322.5 ± 0.0 C,b
Pasture70.75 ± 0.21 C,b0.55 ± 0.21 B,ab18.1 ± 1.41 C,a105.25 ± 0.64 C,b98.55 ± 0.35 D,a301.55 ± 2.9 D,a
Agriculture111.85 ± 0.07 A,a1.25 ± 0.07 A,ab22.85 ± 0.07 A,a311.8 ± 0.71 A,c289 ± 1.13 A,b731.5 ± 1.41 A,b
Fairy MeadowPermafrost87.75 ± 0.92 B,a1.15 ± 0.07 A,b14.8 ± 0.14 B,c235.35 ± 1.34 B,b183.8 ± 6.08 D,b555.7 ± 2.97 B,a
Forest71.5 ± 0.57 D,a0.45 ± 0.21 B,b9.7 ± 0.14 D,b105.15 ± 0.07 C,b122.75 ± 0.92 C,b310.8 ± 1.56 C,c
Pasture76.85 ± 0.35 C,a0.4 ± 0.14 B,b12.25 ± 0.21 C,b108.5 ± 1.41 D,a91.5 ± 0.99 D,b285.5 ± 3.96 D,b
Agriculture115.3 ± 2.12 A,b1.15 ± 0.07 A,b18.15 ± 0.07 A,b317.2 ± 0.85 A,b263.15 ± 1.34 A,c705.7 ± 4.38 A,c
Note: Upper-case letters show the significant differences in land uses within the same region while the lower-case letters show the significant differences among the same land uses across all three regions.
Table 4. Cu concentration (mg·kg−1) under different land-use systems.
RegionLand UseExchangeable (KNO3)Adsorbed (H2O)Organically Bound (NaOH)Carbonate Precipitated (EDTA)Remaining Structures (HNO3)Total (HClO4 + HNO3)
Babusar ValleyPermafrost15.6 ± 042 B,c1.7 ± 0.14 A,a14.35 ± 0.35 A,c84.4 ± 0.28 B,a23.6 ± 0.28 AC,b137.3 ± 2.62 B,c
Forest12.7 ± 0.21 C,a.0.15 ± 0.07 D,b11.85 ± 0.07 C,b31.3 ± 0.28 D,c13.7 ± 0.14 D,a69.65 ± 0.64 D,b
Pasture11.7 ± 0.14 D,b0.45 ± 0.07 C,a11.8 ± 0.14 C,b34.5 ± 0.14 C,b20.7 ± 0.28 C,a73.85 ± 1.91 C,b
Agriculture18.3 ± 0.28 A,c0.85 ± 0.07 B,b13.4 ± 0.14 B,c91.35 ± 0.21 A,c24.85 ± 0.92 A,b148.35 ± 1.77 A,b
Astore Rama ValleyPermafrost19.4 ± 0.14 B,a0.65 ± 0.07 B,c15.85 ± 0.07 B,b78.9 ± 0.57 B,c31.4 ± 1.13 A,a146.15 ± 0.35 A,b
Forest12.5 ± 0.49 C,a0.35 ± 0.07 C,a12.65 ± 0.21 C,a32.7 ± 0.28 D,b16.4 ± 3.11 B,a74.55 ± 0.35 B,a
Pasture12.4 ± 0.14 D,a0.25 ± 0.07 D,b12.35 ± 0.35 C,a33.35 ± 0.21 C,c15.7 ± 0.57 B,a74.55 ± 1.20 B,b
Agriculture22.3 ± 0.14 A,a1.35 ± 0.07 A,a16.7 ± 0.28 A,a84 ± 0.21 A,b32.45 ± 1.48 A,a74.05 ± 0.49 B,c
Fairy MeadowPermafrost17.4 ± 0.21 B,b1.45 ± 0.07 A,b16.8 ± 0.14 A,a81.7 ± 0.28 B,b33.65 ± 1.56 A,a150.65 ± 0.21 B,a
Forest12.5 ± 0.14 C,a0.4 ± 0.14 D,a11.65 ± 0.21 C,c33.45 ± 0.07 D,a14.85 ± 1.34 B,a71.85 ± 2.05 D,a
Pasture11.6 ± 0.28 D,c0.5 ± 0.14 C,a11.3 ± 0.14 C,c51.8 ± 0.14 C,a12.55 ± 1.63 B,b87.45 ± 0.35 C,a
Agriculture19.2 ± 0.07 A,b1.55 ± 0.21 A,a 14.65 ± 0.21 B,b 94.65 ± 0.21 A,a34.25 ± 2.90 A,a166.85 ± 0.35 A,a
Note: Upper-case letters show the significant differences in land uses within the same region while the lower-case letters show the significant differences among the same land uses across all three regions.
Table 5. Pearson correlation coefficients of soil physiochemical properties with total soil Ni, Zn, and Cu in Babusar Valley, Astore Rama Valley, and Fairy Meadows.
Land-Use SystemsPropertiesECOMMCNi Zn Cu
Babusar ValleypH−0.5010.142−0.7490.01910.04520.0218
EC-0.169−0.1770.5100.6520.394
OM--−0.694−0.956−0.862−0.984
MC---−0.255−0.4200.158
Astore Rama ValleypH−0.649−0.4070.4360.3680.4710.581
EC-0.3000.193−0.9410.968 *−0.379
OM--−0.738−0.0935−0.1040.979 *
MC---−0.488−0.4310.778
Fairy MeadowspH−0.9320.1860.704−0.810−0.637−0.460
EC-−0.493−0.6530.8930.7540.653
OM--−0.185−0.681−0.783−0.907
MC---−0.2500.00420.134
Note: The bold numbers indicate substantial correlations with n = 4 and statistical significance levels of p = < 0.05 (*), while (-) denotes non-applicability.
Disclaimer/Publisher’s Note: The statements, opinions and data contained in all publications are solely those of the individual author(s) and contributor(s) and not of MDPI and/or the editor(s). MDPI and/or the editor(s) disclaim responsibility for any injury to people or property resulting from any ideas, methods, instructions or products referred to in the content.

