Article

A Comparative Analysis of the Interaction between Urban-Rural Construction Land Transition and Population Flow: Dominant and Recessive Perspectives

1
School of Business, Hangzhou City University, Hangzhou 310000, China
2
College of Environmental and Resource Sciences, Zhejiang University, Hangzhou 310000, China
3
Business School, Shaoxing University, Shaoxing 312000, China
4
School of Remote Sensing and Information Engineering, Wuhan University, Wuhan 430000, China
*
Author to whom correspondence should be addressed.
Land 2023, 12(10), 1829; https://doi.org/10.3390/land12101829
Submission received: 10 August 2023 / Revised: 30 August 2023 / Accepted: 13 September 2023 / Published: 25 September 2023
(This article belongs to the Section Urban Contexts and Urban-Rural Interactions)

Abstract

:
Population flow caused by rapid urbanization has driven the urban-rural construction land transition. A systematic recognition of their interaction is essential for achieving coordinated and sustainable urban-rural development. We chose Hangzhou, one of the most urbanized cities in China, as the study area to analyze this interaction from the perspectives of dominant morphology and recessive morphology during the period of 2010 to 2020. From the perspective of dominant morphology, a structured analysis method is applied to assess the variation in the internal components. A dynamic land utilization efficiency index is proposed and combined with an original static land utilization efficiency index to comprehensively portray a complete periodicity of urban-rural construction land transition and population flow from the perspective of recessive morphology. Results demonstrate that the path dependence of rural industrialization leads to a seemingly stagnant urban-rural construction land transition in Hangzhou. Meanwhile, the rapid increase in the demographic urbanization rate has been supported by the massive inflow of external migrants. Based on the more stringent dynamic land utilization efficiency index and the more comprehensive combination of static and dynamic indices, the moderate expansion of urban construction land increases the proportion of township-level units of the intensive land utilization pattern while, instead of population loss, the general non-intensive land utilization pattern in rural areas has been driven by the overexpansion of rural residential land.

1. Introduction

The relatively fragmented urban and rural systems in the past have interacted more frequently originating from the urbanization process, which has been ongoing since the industrial revolution in the 18th century [1]. The improvement of productivity has led to the change in production relationships and society’s transformation from traditional agricultural areas to modern industrial and urban areas, promoting socioeconomic development through the concentration of production factors to cities. Thus the urban-rural transition has gradually become an essential socio-economic phenomenon in the world [2,3,4].
Driven by industrialization, populations continue to gather in cities [5]. As the spatial carrier of the urban-rural transition, urban-rural construction land has changed dramatically in quantity and structure under the joint effect of population flow and socioeconomic development [6]. The expansion of urban construction land (UCL) is mainly in line with the urban population inflow [7], presenting a relatively synchronous human-land relationship. Theoretically, the rural residential land (RRL) should shrink along with the outflow of the rural population, but the phenomenon of “population outflow but land expansion” appears as the general irrationality in China’s rural areas [8]. Broadly, the key issue of the current urban-rural construction land transition (URCLT) in China lies in the inefficient land utilization due to the excessive expansion of UCL and the rigid expansion of RRL [9]. The reasons for the abovementioned problems are mainly from two aspects. Firstly, land finance [10,11,12] to support industrialization and urbanization and the model of GDP growth driven by infrastructure investment [13,14] has pushed uncontrolled UCL sprawl [15], which has led to lower land use efficiency, especially when the increasing rate of UCL expansion far exceeds that of urban population inflow. Secondly, despite the phenomenon of ‘‘massive population entering the city’’, rural-urban migrants still retain their RRL under the constraints of the urban-rural dual system, which results in hollowed and abandoned residential land and aging rural inhabitants [16,17,18].
To solve the above problems, the Chinese government has made efforts in different aspects. The Notice on Improving the Performance Assessment for Promoting High Quality Development issued by the Organization Department of the Central Committee of the Communist Party of China has requested government leading cadres to implement a quality-oriented performance assessment instead of the GDP-oriented performance appraisal system, in order to transform the economic growth pattern, which helps reduce the capital and commodity attributes of land [19], guiding the expansion of UCL from excessive to moderate. Meanwhile, the establishment of a human-oriented new-type urbanization strategy [20] has provided policy support to optimize the quantity and structure of URCLT and proper migrant placement. The citizenization of rural-urban migrants provides feasibility for completing the withdrawal mechanism of RRL [21], leading RRL from rigid growth to rational reduction [22]. In view of this, for geography studies, analyzing population flow and URCLT integrally and systematically can provide powerful technical support for achieving a balanced allocation of population and construction land between urban and rural areas under the new situation.
The URCLT is a systematic study about the dynamic evolution and allocation efficiency of urban-rural construction land from the perspective of land use transition, which is mainly divided into the transformation of dominant morphology and recessive morphology [23]. Studies on dominant morphology primarily focused on the spatial-temporal characteristics of the quantitative structure and spatial pattern [4,24,25,26,27,28], as well as their driving mechanism [24,25,26,27,28] and ecological effects [2,29,30,31]. The transformation of recessive morphology is manifested representatively in the changes in land use efficiency and intensification [9,25,31]. These studies have generated various constructive conclusions, such as reducing the quantity of RRL orderly, which is the key issue to achieve the reasonable internal structure of urban-rural construction land [26]; the passive URCLT is lagging behind the proactive population flow; and capital inflow causes the periodic fluctuation in the urbanization process [25].
The topic of population flow has been studied more extensively in the fields of development economics [32,33,34,35] and demographic geography [36,37,38,39]. The most typical modern population flow models introduced in China hold different views, some of which were even opposite and always confused Chinese researchers. For example, the Lewis model, born in the post-war economic recovery phase, holds the opposite view from the Todaro Model proposed during the economic crisis of the 1970s [32]. In the dual economic structure, the former examines how rural-urban migrants support economic expansion [34], while the latter emphasizes how to bring rural-urban migrants back to the rural areas through income mechanisms during economic downturns [35]. Although serving many other objectives desired by the state [40,41], the population flow in China still exhibits significant spatial regularities. As the population flow has gradually shifted from short-distance migration caused by local urbanization to long-distance migration absorbed by the rapid urbanization of large cities [38], the population distribution at the macroscale revealed by Hu Huanyong Line [39] in 1935 is still followed today [36,37].
Single-perspective research on URCLT or population flow provides a broad basis and effective support for further study of their interaction. Many scholars employed elastic coefficients to reveal the coordination degree of the human-land interaction in urban and rural areas, respectively, and then used the Tapio decoupling model to classify the interaction types [9,25,42,43,44]. Sometimes the per capita construction land index was also introduced to measure the land utilization efficiency [9,25]. Considering that the dominant morphologies (quantitative structure, changing tendency) of urban-rural construction land are also applicable to describe population characteristics, we attempt to display their formation mechanisms at the macroscale and reflect their inner laws at the microscale by comparing and analyzing their differences and connections of dominant morphologies. From the perspective of recessive morphology, a dynamic land utilization efficiency index inspired by the elasticity coefficient is proposed to simultaneously reveal the intensification level and coordination level of the human-land interaction and, combined with the traditional static land utilization efficiency index, focused on different time-points to comprehensively portray a complete periodicity of URCLT and population flow during the study period. In addition, cross-sectional and temporal combinations at the microscale are proposed to assess the land utilization pattern systematically. Hereby, this study establishes a framework for analyzing the interaction between URCLT and population flow from both dominant and recessive morphologies.
The primary objective of this paper is to quantify and compare the interaction between URCLT and population inflow in the Hangzhou megacity from 2010 to 2020. We specifically attempt to: (1) characterize the dominant morphology including the internal structure and population-land changing tendency of URCLT and population flow; (2) quantify the static and dynamic land utilization efficiency from the perspective of recessive morphology and classify corresponding land utilization pattern; (3) establish cross-sectional and temporal combinations at the microscale.

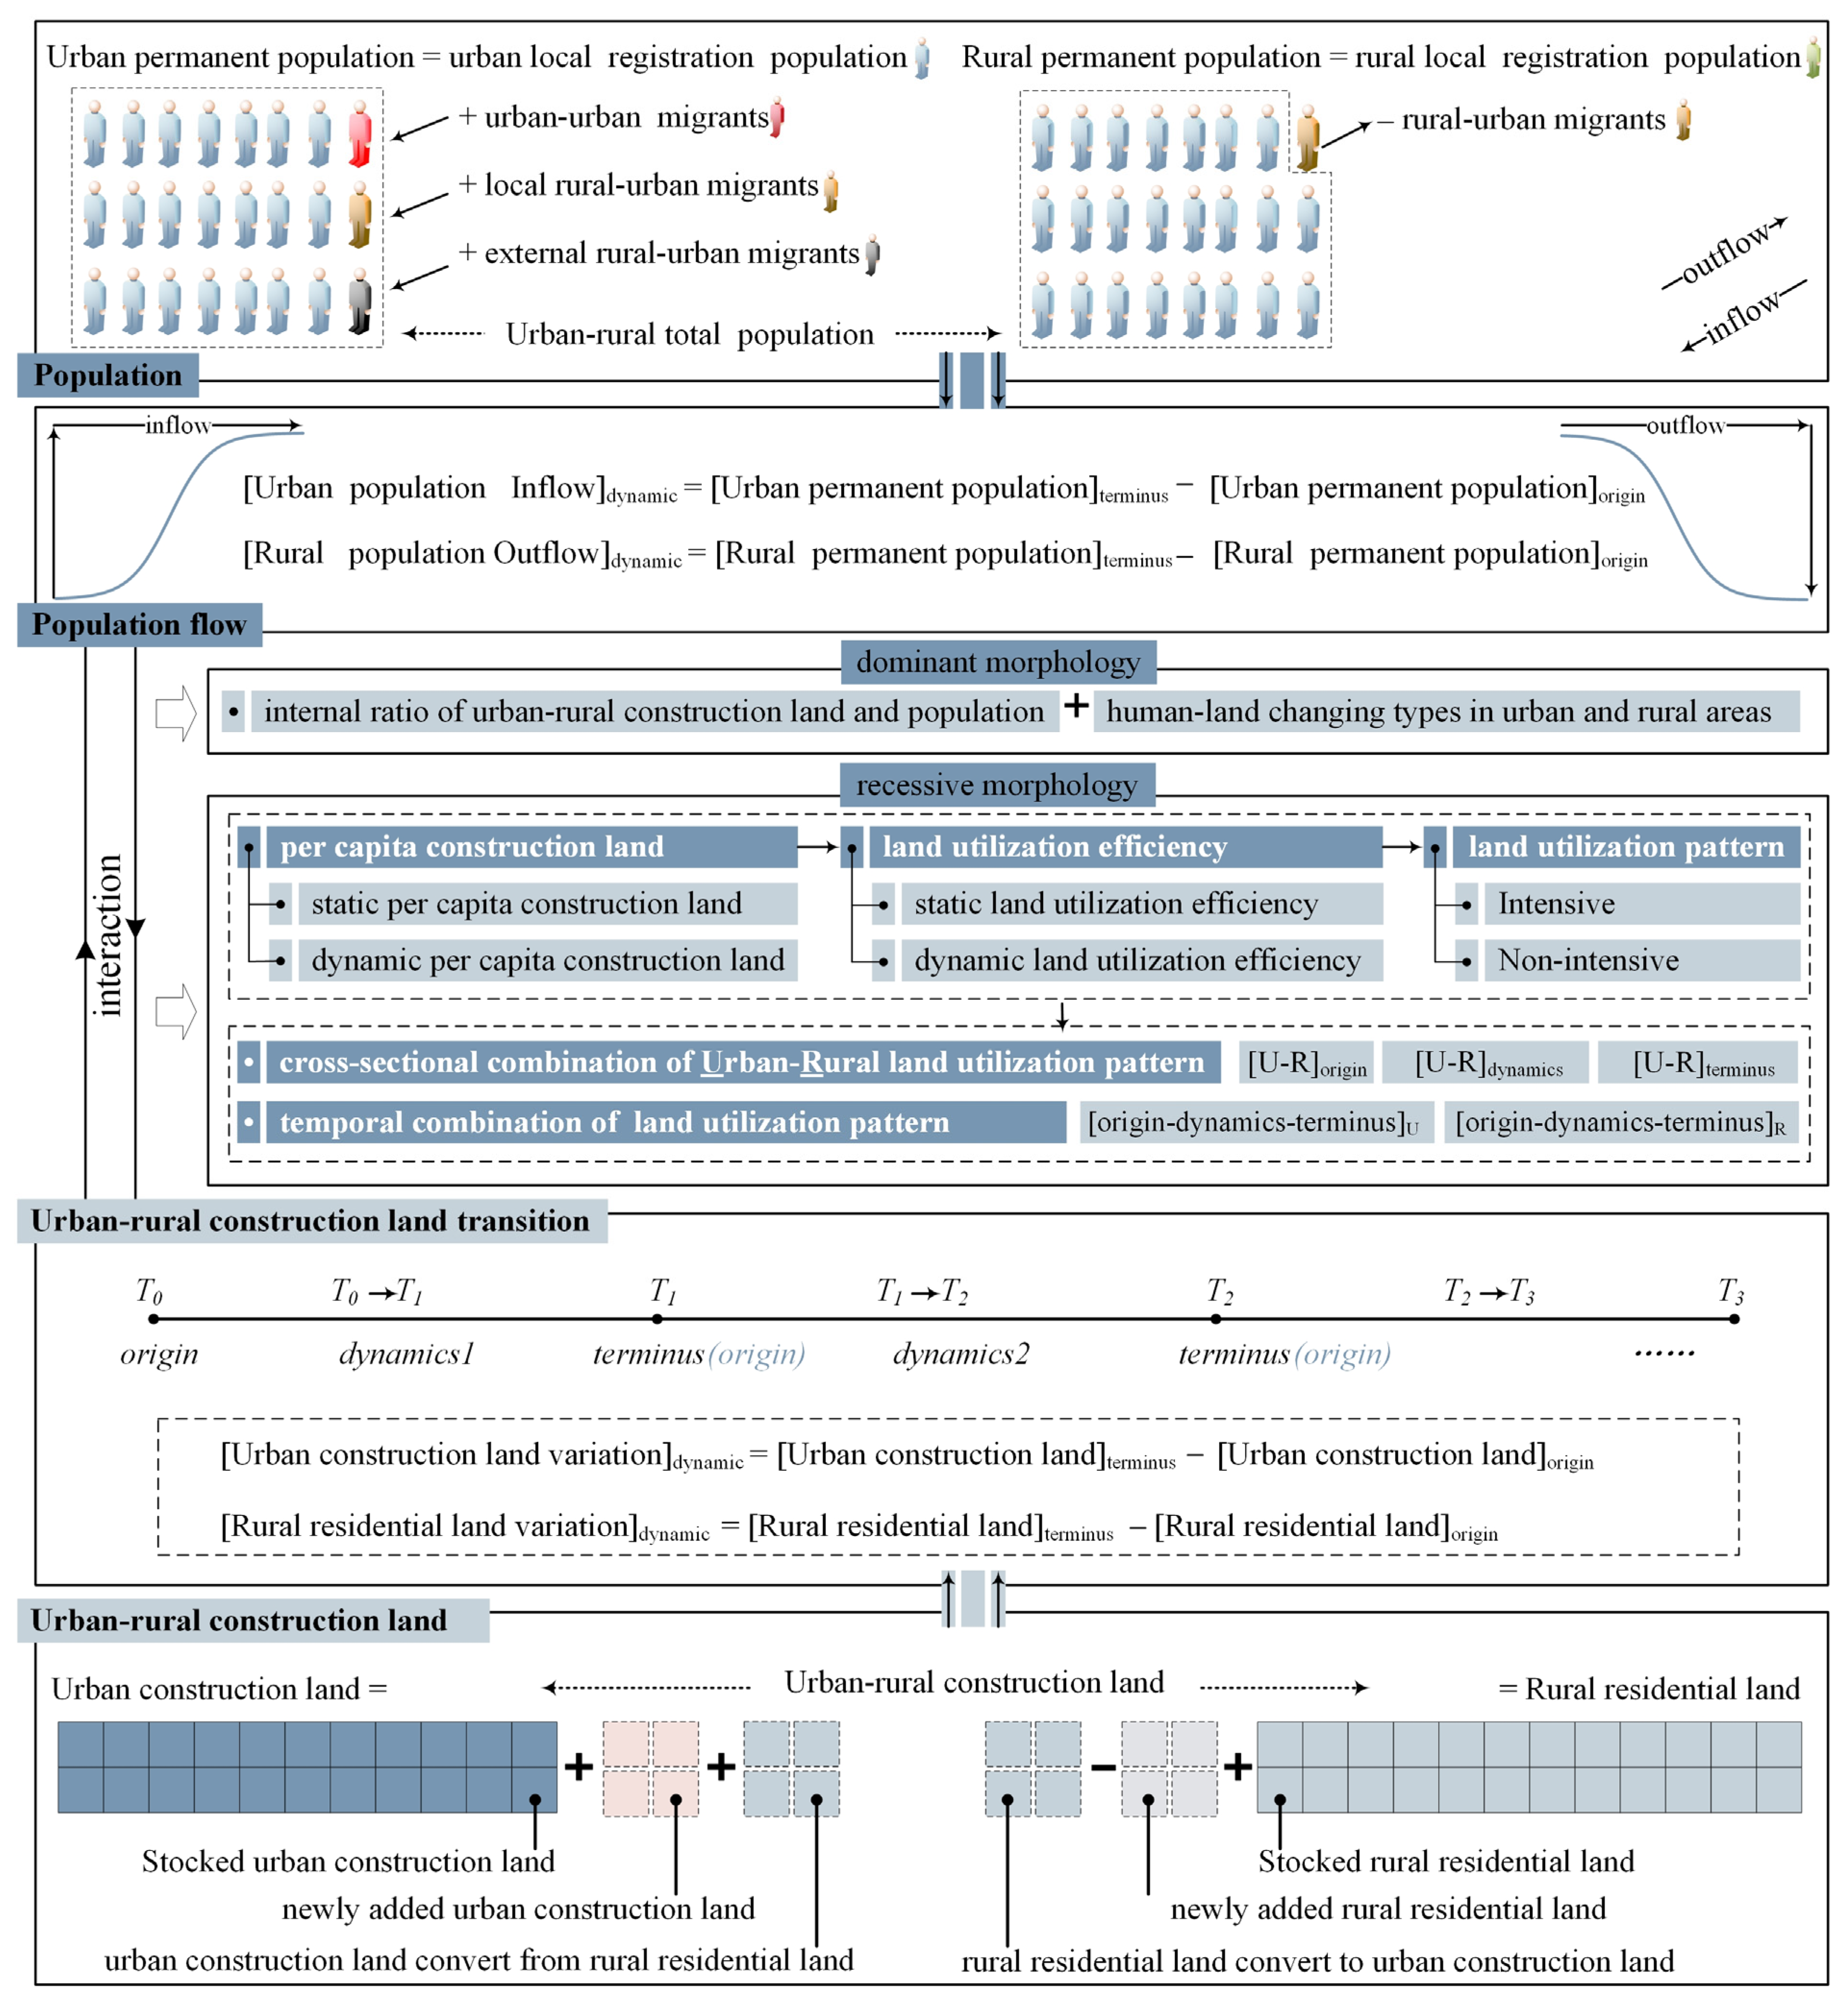
2. URCLT and Population Flow: A Conceptual Framework

2.1. Connotations of URCLT and Population Flow

URCLT in this study mainly involves two land use types, urban construction land (UCL) and rural residential land (RRL), which are intrinsically interrelated but spatially discontinuous. As the main cause of population change in China’s rapid urbanization process [44], population flow can be generally divided into two major types compositing of urban population inflow and rural population outflow. Both the URCLT and population flow are continuous evolution processes of dominant and recessive morphology, rather than fixed or final states. Thus, quantifying the interaction between URCLT and population flow from the perspectives of dominant morphology and recessive morphology should also consider the complete periodicity including origin, dynamics and terminus.

2.2. Conceptual Framework of Interactions between URCLT and Population Flow

The conceptual framework of interactions between URCLT and population flow is proposed from two perspectives of dominant morphology and recessive morphology (Figure 1). In terms of dominant morphology, a structured analysis is used to explore the change in internal components in the urban-rural construction land system and population system as well as their variation trend, which includes the internal structure characteristics in certain time-points, the spatiotemporal change in the internal structure and human-land changing combinations over a period of time.
From the perspective of recessive morphology, the population-oriented land utilization efficiency organically combines static urban-rural construction land use with population distribution and dynamic URCLT with population flow, which is inspired by the application of per capita construction land metrics. We further identify the corresponding land utilization pattern on the basis of land utilization efficiency. Considering the diversity of land utilization patterns at the microscale can provide effective solutions to problems revealed at the macroscale. We also establish cross-sectional land utilization pattern combinations in origin, dynamics and terminus separately, and temporal land utilization pattern combinations based on the complete origin, dynamics and terminus periodicity at the microscale.

3. Data and Methodology

3.1. Study Area

Hangzhou City is the capital and the largest city of the Zhejiang Province in the Yangtze River Delta Region (Figure 2), with a total area of 16,596 km2 and a total population of more than 10 million [45]. The whole area includes 13 county-level districts (10 districts, 1 city and 2 counties) and 190 township-level districts (92 subdistricts, 75 towns and 23 townships). The Yangtze River Delta Region is one of the most intense urban expansion areas and the fastest urbanizing region in the world [46]. As an important central city of this region, Hangzhou ranks 9th on an expanding scale of built-up areas and 6th for population inflow in China over the past decade [20]. The variable topography composed of mountains, hills and plains shapes spatial gaps of socioeconomic development, while the developed rural economy leads to quite a small urban-rural resident income gap.

3.2. Data Sources

The vector data for urban-rural construction land in this paper are obtained from the Annual Land Use Change Survey in 2010 and 2018 at 1:10,000 scale and newly expanded construction land data in 2019 and 2020, which are provided by the Hangzhou Bureau of Planning and Natural Resources. The Annual Land Use Change Survey, updating annually based on the Second National Land Survey in 2009, the most comprehensive quantification of China’s land with legal effects [26], is accurate and reliable. The UCL land refers to urban lands and town lands, whereas RRL refers to village land. The permanent resident population data in 2010 and 2020 are obtained from the sixth and seventh population censuses in China. The urban permanent resident is obtained from the local public security department. The rural permanent resident population is calculated by subtracting the urban permanent resident population from the permanent resident population.

3.3. Methodology

3.3.1. Structured Analysis

The structured analysis is utilized to explore the change in the internal proportional relationships of urban-rural construction land and population, including the internal structural features and their spatiotemporal evolution. We set two structured analysis indices to analyze the spatiotemporal characteristics of the urban-rural land use structure and population structure.
L U R = U C L U C L + R R L
P U R = U P   U P + R P  
α = L U R 2020 L U R 2010
β = P U R 2020 P U R 2010
ΔPop = Pop2020 − Pop2010
ΔLand = Land2020 − Land2010
where UCL and RRL represent urban construction land and rural residential land, respectively, UP and RP represent urban permanent population and rural permanent population, respectively, LUR and PUR represent the proportion of UCL in urban-rural construction land and UP in urban-rural total population, respectively. α represents the proportion change of UCL to RRL. β represents the proportion change of urban permanent population vs. r permanent population. Pop2020 and Pop2010 represent the population in 2020 and 2010, respectively. Land2020 and Land2010 represent the construction land area in 2020 and 2010, respectively. ΔPop and ΔLand are the changing value of population and construction land, respectively.
According to the positive or negative value of ΔPop and ΔLand, the changing types of human-land interaction in urban and rural areas can be classified as shown in Figure 3.

3.3.2. The P c c l a r Index for Land Utilization Efficiency and Pattern Recognition

The reasonable regulation of the per capita construction land area ( P c c l a ) is one of the most effective recessive indices to measure the land utilization efficiency during socioeconomic transition and unveil the evolution of URCLT and population flow [9]. The standards of P c c l a in urban and rural areas are strictly stipulated in “Chinese code for classification of urban land use and planning standards of development land (GB50137)” and “Chinese standard for planning of town (GB50188)”. However, the P c c l a in most urban and rural areas has exceeded the upper limit of the regulation [20], yet so far an effective monitoring mechanism has not been established. In this paper, we use the ratio of the actual value to the ideal value of P c c l a ( P c c l a r ) to demonstrate the land utilization efficiency and identify the land utilization pattern from the dimensions of static time-points and dynamic time-intervals.
(1) The selection of P c c l a ideal value
According to the abovementioned two standards, different actual values of per capita urban-rural construction land have been set to the corresponding reasonable planning standard range. The average value of the planning standard range is adapted as the ideal value based on previous studies [47] in this paper (Table 1).
(2) The static P c c l a r index
The P c c l a r static index is helpful for revealing the land utilization efficiency at certain time-points. The formula is as follows:
P c c l a r ( s t a t i c ) = P c c l a ( r e a l ) P c c l a ( i d e a l )
The P c c l a ( r e a l ) and P c c l a ( i d e a l ) represents the actual value of P c c l a and its corresponding ideal value, respectively.
The static land utilization pattern can be identified based on the following formula:
f P c c l a r ( s t a t i c ) = I n t e n s i v e                           ,     P c c l a r ( s t a t i c ) 1 N o n i n t e n s i v e ,     P c c l a r ( s t a t i c ) > 1
(3) The dynamic P c c l a r index
The dynamic land utilization efficiency index inspired by the elasticity coefficient is proposed to simultaneously reveal the intensification level and coordination level between URCLT and population flow. The dynamic land utilization efficiency at a certain time-interval can be expressed by the P c c l a r dynamic index calculated as follows:
P c c l a r ( d y n a m i c ) = Δ L a n d Δ P o p / P c c l a ( i d e a l )
where P c c l a r ( d y n a m i c ) is the P c c l a r dynamic index. P c c l a ( i d e a l ) is the ideal value of per capita construction land area.
Since the calculation results of the P c c l a r ( d y n a m i c ) index can be positive or negative, we set two basic guidelines before the dynamic land utilization pattern recognition:
Guideline 1: along with the population inflow, moderate construction land supply can be considered, and yet the construction land supply area for a new settler should not exceed the current ideal value of per capita construction land.
Guideline 2: the construction land should be reduced when population outflows, while the corresponding reduction in construction land for each outflow person should be no less than the current ideal value of per capita construction land under the background of relatively rough land use.
Any situation that meets the abovementioned two guidelines is considered as intensive. Conversely, it is non-intensive. Specifically, it can be divided into different situations (Figure 4):
①Referring to guideline 1, when population inflow is accompanied by construction land expansion, P c c l a r ( d y n a m i c ) 1 is considered as intensive and P c c l a r ( d y n a m i c ) > 1 is considered as non-intensive.
②Referring to guideline 2, when population outflow is accompanied by construction land expansion, P c c l a r ( d y n a m i c ) < 0 is considered as non-intensive.
③Referring to guideline 2, when population outflow is accompanied by construction land shrinkage, P c c l a r ( d y n a m i c ) > 1 is considered as intensive and P c c l a r ( d y n a m i c ) 1 is considered as non-intensive.
④Referring to guideline 1, when population inflow is accompanied by construction land shrinkage, P c c l a r ( d y n a m i c ) < 0 is considered as intensive.
Finally, the dynamic land utilization pattern can be expressed as the following formula, in which P c c l a r ( d y n a m i c ) is denoted by c o t θ .
f L a n d , P o p , c o t θ = N o n i n t e n s i v e 1 ,                       L a n d > 0 , P o p > 0 , c o t θ ( 1 , + ) I n t e n s i v e 1 ,                                                             L a n d > 0 , P o p > 0 , c o t θ [ 0,1 ] I n t e n s i v e 2 ,                                                 L a n d < 0 , P o p > 0 , c o t θ ( , 0 ] I n t e n s i v e 3 ,                                                   L a n d < 0 , P o p < 0 , c o t θ [ 1 , + ) N o n i n t e n s i v e 3 ,                                     L a n d < 0 , P o p < 0 , c o t θ ( 0,1 ) N o n i n t e n s i v e 2 ,                           L a n d > 0 , P o p < 0 , c o t θ ( , 0 )

3.3.3. Multiple Combination Types for Different Land Utilization Patterns

The URCLT and population flow are complex interactions among the population, land, urban and rural systems. Using P c c l a r indicators to measure the land use efficiency and further identify land utilization patterns can effectively embody the interactive process, meanwhile degrading the complexity of multi-system interactions significantly. According to Equations (5)–(8), the land utilization patterns for different time-points and time-intervals in urban and rural areas are derived. Therefore, we couple the calculation results cross-sectionally in two time-points and one time-interval (Figure 5a), respectively, within the urban-rural system to reflect the urban-rural coordination of the land utilization pattern. The calculation results are also coupled temporally with the origin, dynamics and terminus process in urban systems and rural systems (Figure 5b), respectively, to reflect the dynamic coordination of land utilization patterns in each single system.

4. Results and Analysis

4.1. Dominant and Recessive Morphology Analysis at the Macroscale

4.1.1. The Dominant Morphology Analysis at the Macroscale

From 2010 to 2020, the total area of urban-rural construction land in Hangzhou increased from 1443.77 km2 to 1717.11 km2, of which the area ratio of the two internal land-use types (UCL: RRL) was roughly maintained between 60 and 40 over the entire study period, with a slight change of only 0.61%. Correspondingly, the total population and demographic urbanization rate reached 8.70 million and 67.27% in 2010 and further climbed to 11.94 million and 83.05% in 2020, which has ushered in conspicuous changes and, thus, the urbanization rate increased by 15.78%. Hangzhou has undergone “population inflow accompanied by construction land expansion (PILE)” in urban areas and “population outflow accompanied by construction land expansion (POLE)” in rural areas simultaneously due to the synergistic growth of urban and rural construction land areas and nearly 800 thousand rural-urban migrants.
Meanwhile, the area ratios of UCL to RRL in nine county-level units basically remain stable, except in Yuhang, Fuyang, Chun’an and Xiaoshan (Figure 6a). The ratio with relatively great change in Yuhang and Fuyang is related to the newly expanded construction land around the Future Science and Technology City and Fuyang new area. The ratio of Chun’an increases by 6% and it is mainly due to the enhancement of public service infrastructure in the western less developed areas. Xiaoshan, where the ratio of UCL has reduced by 2%, represented a totally opposite changing tendency. The demographic urbanization rates of eight county-level units increased less than 15%, while five other county-level units consisting of Fuyang, Xiaoshan, Yuhang, Tonglu and Qiantang made a more than 20% advance (Figure 6b), which indicates that the population inflow is more active in the suburbs compared to the urban core and distant suburbs. Besides, the change of the human-land pattern in 13 county-level units is consistent with that in Hangzhou.

4.1.2. The Recessive Morphology Analysis at the Macroscale

Up to 2020, neither the urban areas nor the rural areas of Hangzhou remained as an intensive land use pattern, although they have a totally inverse tendency (Figure 7a), an intensive land supply with 41 m2 for each new settler in urban areas has led to a significant boost of land utilization efficiency over the past decade. However, the “population outflow accompanied by construction land expansion (POLE)” pattern in rural areas has lowered the land utilization efficiency ulteriorly.
The only county-level unit with an intensive UCL pattern was Gongshu in 2010, Shangcheng, Linping, Xiaoshan and Tonglu were newly added in 2020 (Figure 7b). The UCL supply for inflowing population in all county-level units has not exceeded the upper limit based on the ideal value of P c c l a except in Chun’an, which has led to the generally intensive dynamic land utilization pattern (Figure 7c). Nevertheless, both the stock RRL use and incremental RRL supply exhibit non-intensive characteristics in all county-level units with an urbanization rate less than 100%.

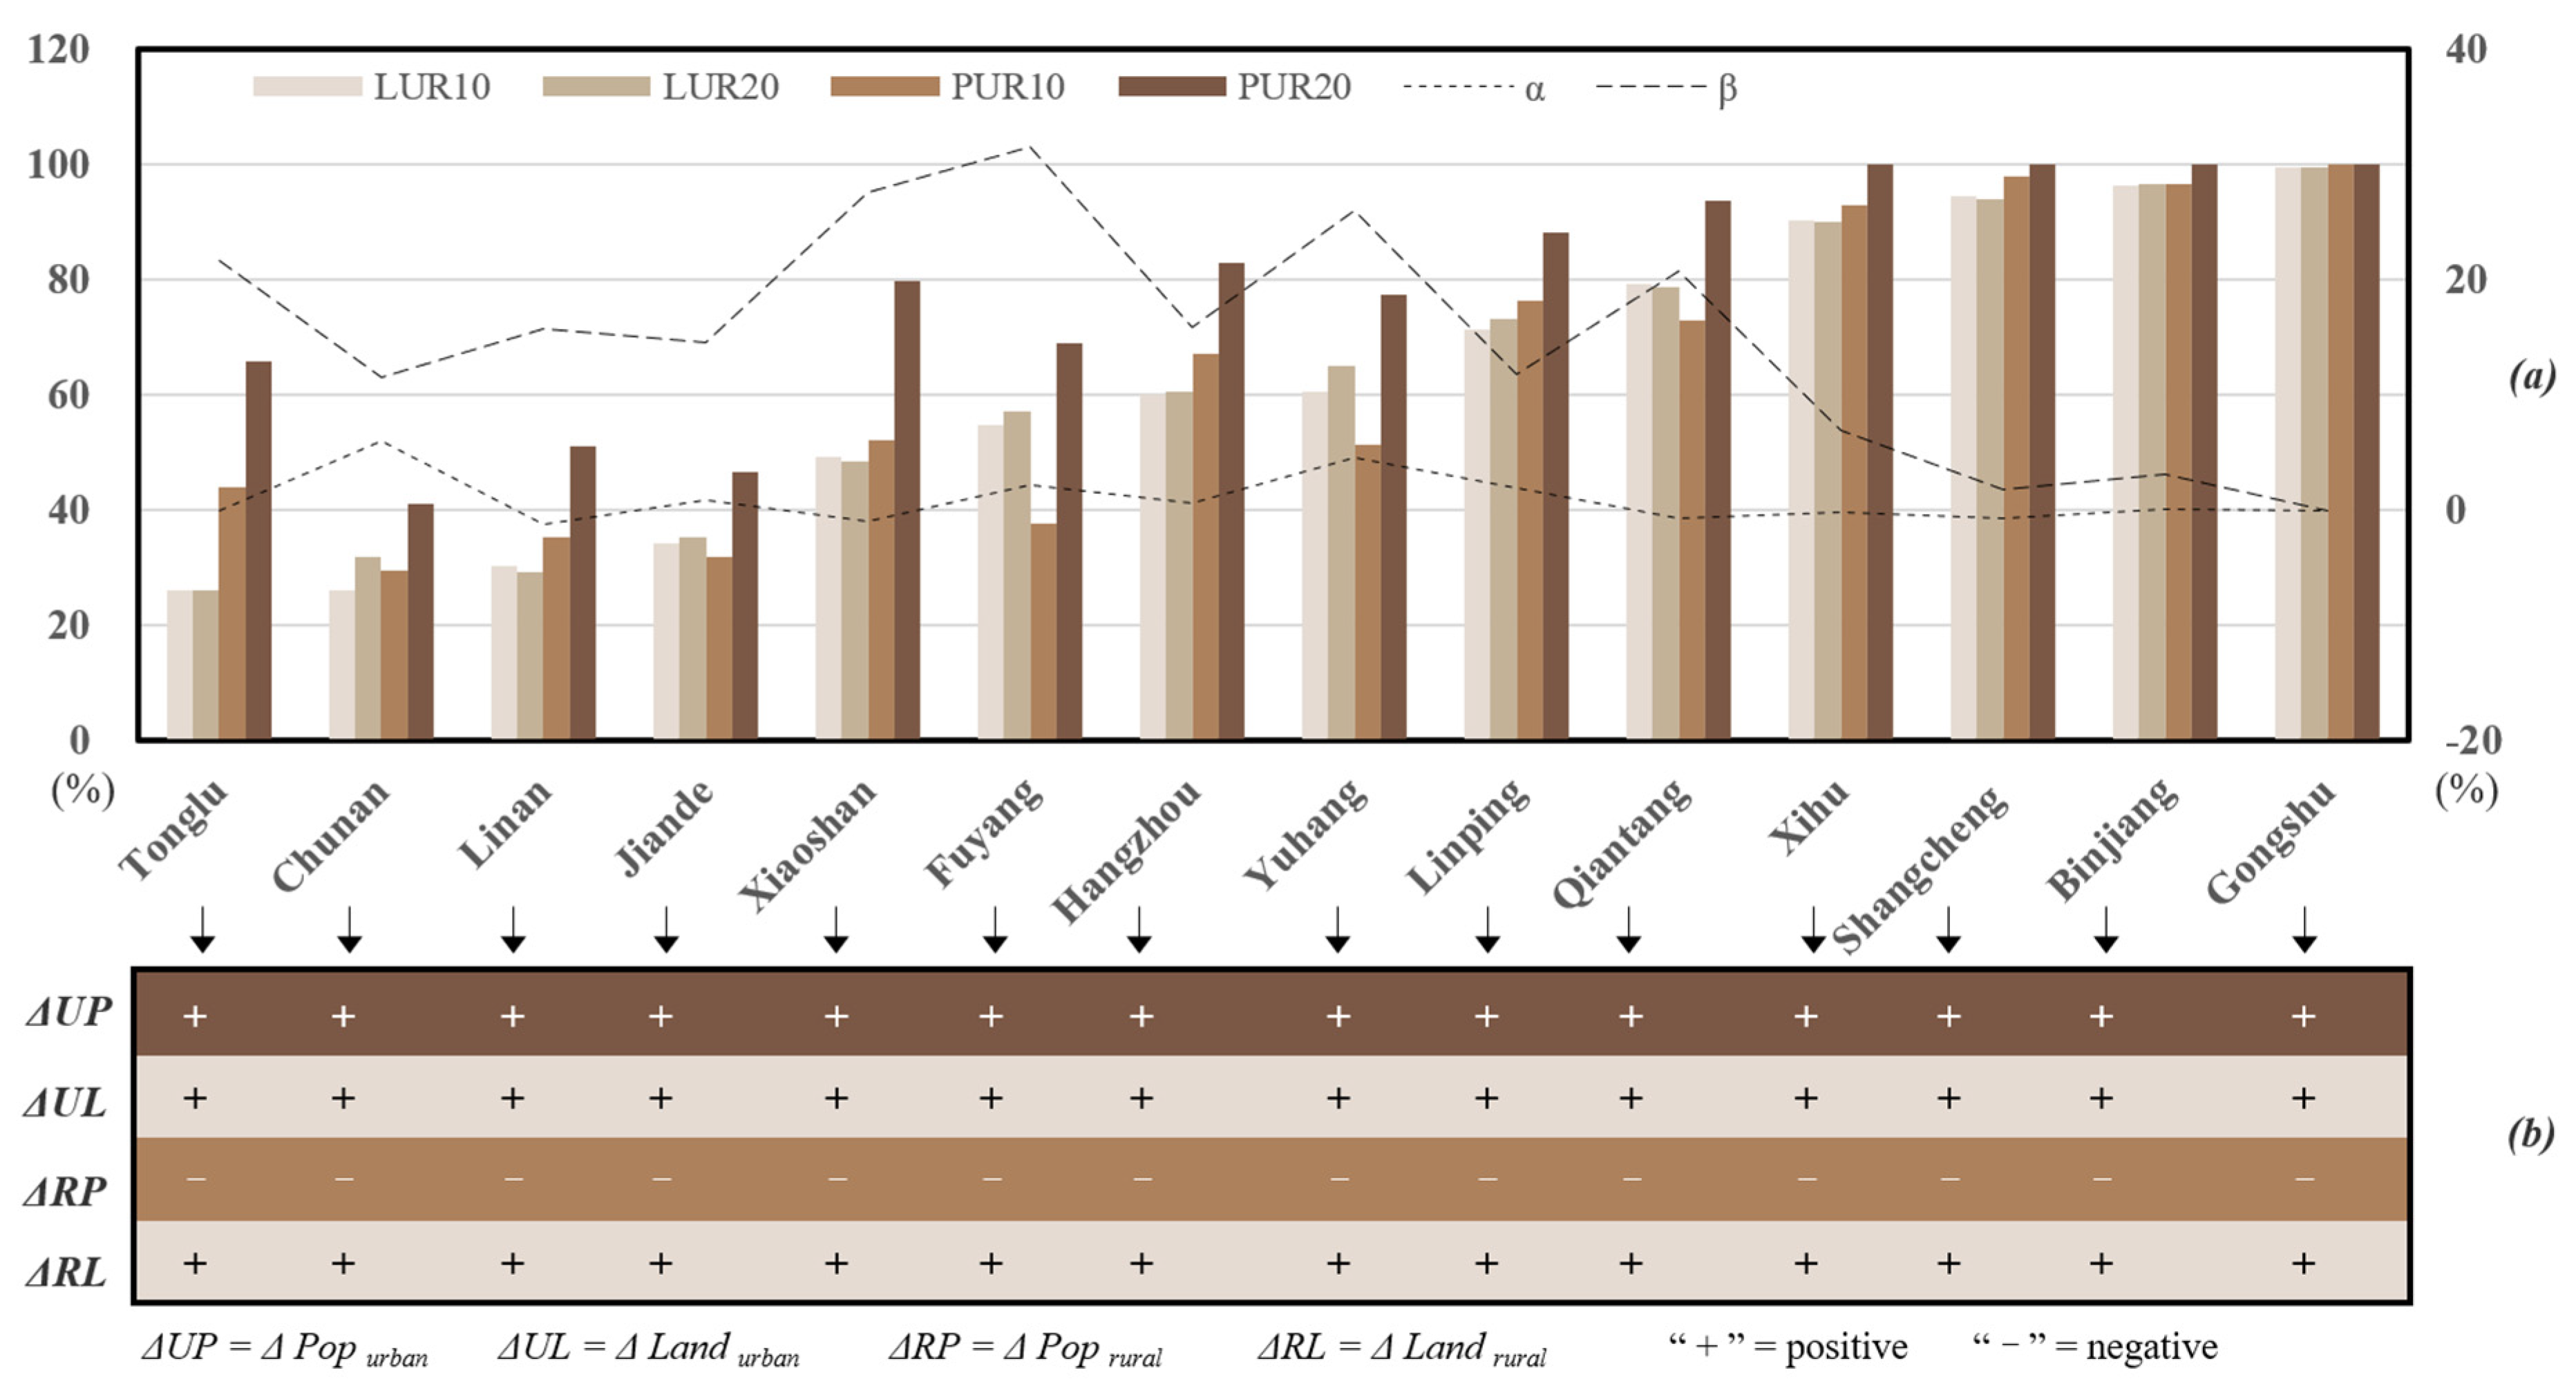
4.2. Dominant and Recessive Morphology Analysis at the Microscale

4.2.1. The Dominant Morphology Analysis at the Microscale

We calculated the α and βvalue in each township-level unit (Figure 8a,c) and classified different types of human-land changing patterns (Figure 8e,f). In addition, the land and demographic urbanization rates in 2010 are shown in Figure 8b,d, respectively.
Figure 8b,d displays that although units with land urbanization rates above 45% and units with demographic urbanization rates of more than 45% are distributed around urban cores and county towns, the latter distributes in a more concentrated manner compared with the former and its number is much less than that of the former. The results of α and β reveal the magnitude of structural changes in urban-rural construction land and population over the past decade. The total number of units with a demographic urbanization rate growth of more than 5% is almost twice that of units with a land urbanization rate growth of more than 5%. This indicates that the intensity of population flow is significantly higher than that of URCLT at the microscale. Additionally, the units with the largest increases in land urbanization rates mainly occurred in the western less developed regions, where the demographic urbanization rates have not been elevated and they exhibited a multi-block united distribution. In the eastern region, with the distinct growth of demographic urbanization rates, the variation amplitude of urban-rural construction land structures tends to be notably diverse. Moreover, although the dominant types of human-land changing patterns in urban and rural areas remain PILE and POLE, respectively, other changing types, including PILS and POLS, appear at the microscale with limited numbers (Figure 8e,f). It is worth noting that the POLE pattern is widely distributed in the western rural areas, as well as the western urban areas.

4.2.2. The Recessive Morphology Analysis at the Microscale

The Static Land Utilization Efficiency and Pattern at the Microscale

Figure 9 displays that the result of the static P c c l a r index of the microscale units has been conspicuous since 2010. The proportion of the units of intensive land utilization pattern in urban areas increased from 22.63% in 2010 to 33.74% in 2020. In total, 41 units remained with unchanged intensive patterns, while 29 other units witnessed changes, 93.10% of which shifted to intensive land utilization patterns. However, as a steady deterioration of rural land utilization efficiency, the rural land utilization pattern of all the units has turned non-intensive in 2020.
Although the increase in the land utilization efficiency in most urban areas and the general decrease in the land utilization efficiency in rural areas reveals completely different trends, the static land utilization pattern in both urban areas and rural areas cannot display good intensification degrees. In distant suburbs, the elevation of the urban land utilization efficiency is often accompanied by a deteriorating rural land utilization efficiency, typically as the units in Tonglu. This indicates that rural residents in these areas may be more inclined to choose short-distance migration, while other units with a deteriorating land utilization efficiency in both urban and rural areas may have experienced population loss due to the long-distance migration of local residents.

The Dynamic Land Utilization Efficiency and Pattern at the Microscale

From the perspective of the dynamic land utilization pattern, it is found that 58.95% of the units present intensive patterns in urban areas and 85.71% of them are identified as the I-1 type. In contrast, 41.05% of the units present non-intensive patterns in urban areas (Figure 10b). Specially, 71.79% of them are identified as the N-2 type, followed by N-1 type (24.36%) and N-3 type (3.85%). However, the rural dynamic land utilization pattern of all the units is non-intensive, including 86.27% of the N-2 type, 7.19% of the N-3 type and 6.54% of the N-1 type (Figure 10d).
A clear spatial disparity of the dynamic land utilization pattern in urban areas changes gradually from the northeast and southwest. The northeast units are dominated by I-1 types, and the N-2 type occupies most of the southwest units. The N-1 type also appears in suburban areas when the growth rate of UCL exceeds that of the urban population. Overall, the northeastern units have notably more efficient urban land utilization, whereas the inadequate urban land utilization in the southwest is mainly caused by irrational land supply accompanied by urban population loss.
Theoretically, RRL should be expropriated to UCL or reclaimed to cropland when population outflows [9], which means that the more stringent I-3 type and the relatively tolerant N-3 type need to be the mainstream in rural areas. However, the overwhelming majority of the units are of the N-2 type due to the phenomenon of “population outflow but RRL expansion”.

4.3. Multiple Combination Types for Different Land Utilization Patterns at the Microscale

4.3.1. The Cross-Sectional Combination Types of Urban-Rural Land Utilization Pattern

The static cross-sectional combination of nearly 70% units is of the UN-RN type and remains invariable (Figure 11a,b). In suburbs, the increase in the urban land utilization efficiency may benefit from the influx of external migrants and does not have a significant negative impact on the local rural land utilization efficiency, leading to a transfer from the UN-RN type to the UI-RN type. As rural population flows to the more attractive urban centers, the deteriorating rural land utilization efficiency in distant suburbs may not optimize the local urban land utilization efficiency, resulting in a shift from the UN-RI type to the UN-RN type. Moreover, the UI-RI type, the ideal urban-rural land utilization pattern, does not appear during the whole study period.
Comparatively, the dynamic combination of nearly 50% units is of the UI-RN type and 33.16% units are of UN-RN type (Figure 11c). Although massive external migrants improve the dynamic urban land utilization efficiency in many units, further curbs on UCL expansion are necessary to achieve static intensification eventually. For the rural areas, restraining the excessive growth of RRL becomes the top priority.

4.3.2. The Temporal Combination Types of Urban and Rural Land Utilization Pattern

As for the temporal urban land utilization pattern (Figure 11d), 34.21% of units have been intensive in 2020, comprising 14.21% of the N-I-I type, 12.11% of the I-I-I type and 7.89% of the I-N-I type. The non-intensive pattern contains primarily 32.63% of the N-I-N type and 30.53% of the N-N-N type. Only five units of the I-N-N type are dotted. Under the common effect of external rural-urban migrants and internal urban-urban migrants, a staggered distribution of I-I-I types, I-N-I types and N-I-I types in the urban core displays the gradual homogenization of land utilization patterns. The passive UCL transition in the suburbs lags behind active population inflow, resulting in a wide distribution of N-I-N types. A few units of the I-N-N type represent the evolution of land utilization patterns in the industrial-dominated units following industry hollowing. As it is difficult to improve the urban land utilization efficiency, the N-N-N type covers most of the western units.
Figure 11e shows the spatial distribution of the temporal rural land utilization pattern, with nearly 80% of units of the N-N-N type spread throughout the region. In the more developed eastern region, efficient urban land use can already be achieved gradually through a rational population-land allocation, whereas there are few successful examples of rural land utilization efficiency improvement at present.

5. Discussion

5.1. Why Has the Proportion of UCL to RRL in Hangzhou Stayed Almost Stable over the Past Decade?

The internal structure of urban-rural construction land acts as an essential measurement of URCLT [26]. Although a clear ratio standard for this internal structure has not been proposed, a consensus is that the share of UCL will increase accordingly as the demographic urbanization progresses [25]. However, when the ratio of UCL to RRL stayed almost stable, from 60 to 40, the demographic urbanization rate of Hangzhou rose from 67.27% in 2010 to 83.05% in 2020. Most of the county-level units have shown an increasing proportion of UCL, while a few are decreasing. Thus, a seemly stable proportion of UCL to RRL has been the most notable dominant morphology over the past decade in Hangzhou.

5.1.1. Proportion Improvement of UCL and Future Development Strategy

The emphases in Hangzhou’s Master Planning Outline to make up the shortcomings of public services in western less-developed regions and strengthen the eastern growth poles for urban development have been fully reflected in the urban-rural construction land allocation. On the one hand, as the most remote and backward county, Chun’an has indicated the greatest increase in the UCL proportion over the past decade under the strategy of the promotion of holistic urban areas and public service equalization. On the other hand, as the new growth poles of the urban development strategy transforming from the “Qiantang era” to the “Westward era”, Yuhang and Fuyang have occupied the second and third increases in UCL proportion, in order.

5.1.2. Proportion Improvement of RRL and Historic Advantages

In situ urbanization [48], once known as the “the most dramatic transformation in China over the past 25 years” [49], refers to rural residents achieving a career change from peasants to workers without largescale migration to cities or towns [50]. This particular phenomenon is prevalent in developed areas along the southeast coast of China, such as Zhejiang [51,52], where the rural industrialization represented by township-owned and village-owned enterprises was top-ranked nationwide [49] and made up 65.6% of the gross industrial output value in 2003 [52], leading the per capita income of rural households ranked first in China for 36 years till 2020 [53,54]. Therefore, driven by the historic advantages of rural industrialization, the proportion improvement of RRL, a seemingly illogical phenomenon, has appeared in the areas represented by Xiaoshan, where the rural industries have always been front row of the state [55,56].

5.1.3. A Seemingly Stagnant URCLT under Path Dependence and Demographic Urbanization Supported by Massive Inflow of External Migrants

In most cases, a higher demographic urbanization rate results in a higher proportion of UCL (Table 2). However, due to long-term path dependence, areas with developed rural industries may compel the growth rates of RRL higher than that of UCL. This phenomenon has also been observed in the Tongzhou District, Jiangsu Province (Table 2). Above all, a seemingly stagnant URCLT from the perspective of the internal structure is thought to be largely determined by the combined effects of the pull force of urbanization and the reverse drawing force of rural industrialization. Additionally, with a massive inflow of external migrants, the demographic urbanization rates have still increased significantly.

5.2. Why Is the Dynamic Land Utilization Efficiency Index a More Rigorous and Comprehensive Measurement?

The calculation results of the dynamic land use efficiency index have provided a more rigorous and comprehensive measurement of the recessive morphology of the relationship between URCLT and population flow in Hangzhou over the past decade. The result of the traditional coupling coordination index is displayed in Figure 12b. Figure 12c shows that 11 township-level units with coordinated human-land interactions are of non-intensive dynamic land utilization patterns. This indicates that the dynamic land utilization efficiency index is more rigorous than the coupling coordination index. Meanwhile, P c c l a is both an important indicator of land utilization efficiency and an important feature of recessive land use morphology [9]. Introducing the ideal value of P c c l a to characterize land use efficiency at different time-points provides kernel data for studying URCLT and population flow, which not only measures the trend of population flow during URCLT, but also reveals the evolution process of the regional human-land relationship and further serves as an important reference for policy regulating. Therefore, this approach of quantifying URCLT and population flow from static and dynamic perspectives separately is also more comprehensive. Eventually, the cross-sectional combinations of urban and rural land utilization patterns at the microscale can be utilized to assess the transition degree of URCLT and the coordination level between URCLT and population flow. The temporal combination of land utilization patterns can reflect the dynamic trend of urban and rural transitions, respectively.

6. Conclusions

A systematic comparative analysis and recognition of the interaction between URCLT and population flow is essential for adjusting the human-land relationship and achieving coordinated and sustainable urban-rural development. This paper explores the interaction of URCLT and population flow from perspectives of dominant morphology and recessive morphology. From the perspective of the dominant morphology, the path dependence of rural industrialization leads to a seemingly stagnant urban-rural construction land transition in Hangzhou. Meanwhile the rapid increase in the demographic urbanization rate has been supported by the massive inflow of external migrants. In terms of the recessive morphology, the improvement of the dynamic land utilization efficiency in urban areas has proposed the proportion of township-level units of static intensive patterns, increasing from 22.63% in 2010 to 33.74% in 2020. Comparatively, the deterioration of the dynamic land utilization efficiency in rural areas has resulted in a general non-intensive pattern in 2020. The overexpansion of RRL instead of population outflow is the most important reason for the deterioration of rural land utilization efficiency, and active rural industries exacerbate this overexpansion to some extent, although it curbs population loss. This study confirmed that the human-land relationship of urban and rural land in Hangzhou has been decoupled. These findings can provide valuable implications for the implementation of Hangzhou’s land use management to balance the urban and rural development and promote sustainable urbanization.
The results of our research show that, still, the generally non-intensive rural land utilization pattern at the microscale is the biggest constraint to the URCLT. The adjustment of rural spatial structure is the key point to realize the benign interaction between URCLT and population flow. A rural stock construction land investigation conducted by the Zhejiang Bureau of Planning and Natural Resources in 2016 revealed that the rural collective operation construction land accounted for 34.22% of the total RRL outside the urban growth boundary. Therefore, improving the rural land utilization efficiency through the revitalization of rural collective operation construction land may really be the crucial solution. Future research should be conducted on this aspect.

Author Contributions

S.X.: Data curation, Formal analysis, Methodology, Software, Writing—original draft; L.S.: Writing—review & editing; W.L.: Writing—review & editing; L.H.: Funding acquisition and Resources. All authors have read and agreed to the published version of the manuscript.

Funding

This research received no external funding.

Data Availability Statement

Data is unavailable due to privacy or ethical restrictions.

Conflicts of Interest

The authors declare no conflict of interest.

References

  1. Neiderud, C.-J. How Urbanization Affects the Epidemiology of Emerging Infectious Diseases. Infect. Ecol. Epidemiol. 2015, 5, 27060. [Google Scholar] [CrossRef] [PubMed]
  2. Xing, L.; Hu, M.; Xue, M. The Effect of Urban–Rural Construction Land Transition on Ecosystem Services: A Theoretical Framework and Empirical Evidence for China. Habitat Int. 2022, 124, 102576. [Google Scholar] [CrossRef]
  3. Díaz-Palacios-Sisternes, S.; Ayuga, F.; García, A.I. A Method for Detecting and Describing Land Use Transformations: AN Examination of Madrid’s Southern Urban-Rural Gradient between 1990 and 2006. Cities 2014, 40, 99–110. [Google Scholar] [CrossRef]
  4. Chen, K.; Long, H.; Liao, L.; Tu, S.; Li, T. Land Use Transitions and Urban-Rural Integrated Development: Theoretical Framework and China’s Evidence. Land Use Policy 2020, 92, 104465. [Google Scholar] [CrossRef]
  5. Deng, X.; Huang, J.; Rozelle, S.; Uchida, E. Growth, Population and Industrialization, and Urban Land Expansion of China. J. Urban Econ. 2008, 63, 96–115. [Google Scholar] [CrossRef]
  6. Andersson, E.; Brogaard, S.; Olsson, L. The Political Ecology of Land Degradation. Annu. Rev. Environ. Resour. 2011, 36, 295–319. [Google Scholar] [CrossRef]
  7. Bai, X.; Shi, P.; Liu, Y. Realizing China’s Urban Dream. Nature 2014, 509, 158–160. [Google Scholar] [CrossRef]
  8. Qu, Y.; Zhan, L.; Jiang, G.; Ma, W.; Dong, X. How to Address “Population Decline and Land Expansion (PDLE)” of Rural Residential Areas in the Process of Urbanization: A Comparative Regional Analysis of Human-Land Interaction in Shandong Province. Habitat Int. 2021, 117, 102441. [Google Scholar] [CrossRef]
  9. Cai, E.; Liu, Y.; Li, J.; Chen, W. Spatiotemporal Characteristics of Urban–Rural Construction Land Transition and Rural–Urban Migrants in Rapid-Urbanization Areas of Central China. J. Urban Plan. Dev. 2020, 146, 1–10. [Google Scholar] [CrossRef]
  10. Cao, G.; Feng, C.; Tao, R. Local “Land Finance” in China’s Urban Expansion: Challenges and Solutions. China World Econ. 2008, 16, 19–30. [Google Scholar] [CrossRef]
  11. Qun, W.; Yongle, L.; Siqi, Y. The Incentives of China’s Urban Land Finance. Land Use Policy 2015, 42, 432–442. [Google Scholar] [CrossRef]
  12. Liu, Y.; Fan, P.; Yue, W.; Song, Y. Impacts of Land Finance on Urban Sprawl in China: The Case of Chongqing. Land Use Policy 2018, 72, 420–432. [Google Scholar] [CrossRef]
  13. Ansar, A.; Flyvbjerg, B.; Budzier, A.; Lunn, D. Does Infrastructure Investment Lead to Economic Growth or Economic Fragility? Evidence from China. Oxf. Rev. Econ. Policy 2016, 32, 360–390. [Google Scholar] [CrossRef]
  14. Shi, Y.; Guo, S.; Sun, P. The Role of Infrastructure in China’s Regional Economic Growth. J. Asian Econ. 2017, 49, 26–41. [Google Scholar] [CrossRef]
  15. Brueckner, J.K. Urban Sprawl: Diagnosis and Remedies. Int. Reg. Sci. Rev. 2000, 23, 160–171. [Google Scholar] [CrossRef]
  16. Liu, Y. Introduction to Land Use and Rural Sustainability in China. Land Use Policy 2018, 74, 1–4. [Google Scholar] [CrossRef]
  17. Li, Y.; Liu, Y.; Long, H.; Cui, W. Community-Based Rural Residential Land Consolidation and Allocation Can Help to Revitalize Hollowed Villages in Traditional Agricultural Areas of China: Evidence from Dancheng County, Henan Province. Land Use Policy 2014, 39, 188–198. [Google Scholar] [CrossRef]
  18. Long, H.; Li, Y.; Liu, Y.; Woods, M.; Zou, J. Accelerated Restructuring in Rural China Fueled by ‘Increasing vs. Decreasing Balance’Land-Use Policy for Dealing with Hollowed Villages. Land Use Policy 2012, 29, 11–22. [Google Scholar] [CrossRef]
  19. Christophers, B. For Real: Land as Capital and Commodity. Trans. Inst. Br. Geogr. 2016, 41, 134–148. [Google Scholar] [CrossRef]
  20. Chen, M.; Liu, W.; Lu, D. Challenges and the Way Forward in China’s New-Type Urbanization. Land Use Policy 2016, 55, 334–339. [Google Scholar] [CrossRef]
  21. Huang, X.; Li, H.; Zhang, X.; Zhang, X. Land Use Policy as an Instrument of Rural Resilience–The Case of Land Withdrawal Mechanism for Rural Homesteads in China. Ecol. Indic. 2018, 87, 47–55. [Google Scholar] [CrossRef]
  22. Agboola, O.P.; Rasidi, M.H.; Said, I.; Abogan, S.O.; Adejuwon, A.S. Morphological and GIS-Based Land Use Analysis: A Critical Exploration of a Rural Neighborhood. J. Contemp. Urban Aff. 2018, 2, 106–121. [Google Scholar] [CrossRef]
  23. Qu, Y.; Shu, Y.; Zong, H.; Si, H.; Yang, Z.; Liu, T. Understanding the Characteristics and Realization Path of Urban Land Use Transition in the Bohai Economic Rim: An Analytical Framework of “Dominant–Recessive” Morphology Coupling. Land 2021, 10, 493. [Google Scholar] [CrossRef]
  24. Yang, R.; Zhang, J.; Xu, Q.; Luo, X. Urban-Rural Spatial Transformation Process and Influences from the Perspective of Land Use: A Case Study of the Pearl River Delta Region. Habitat Int. 2020, 104, 102234. [Google Scholar] [CrossRef]
  25. Yanbo, Q.; Guanghui, J.; Yaya, T.; Ran, S.; Shuwen, W.; Yuling, L. Urban—Rural Construction Land Transition (URCLT) in Shandong Province of China: Features Measurement and Mechanism Exploration. Habitat Int. 2019, 86, 101–115. [Google Scholar] [CrossRef]
  26. Liu, Y.; Luo, T.; Liu, Z.; Kong, X.; Li, J.; Tan, R. A Comparative Analysis of Urban and Rural Construction Land Use Change and Driving Forces: Implications for Urban-Rural Coordination Development in Wuhan, Central China. Habitat Int. 2015, 47, 113–125. [Google Scholar] [CrossRef]
  27. Ma, L.; Chen, M.; Fang, F.; Che, X. Research on the Spatiotemporal Variation of Rural-Urban Transformation and Its Driving Mechanisms in Underdeveloped Regions: Gansu Province in Western China as an Example. Sustain. Cities Soc. 2019, 50, 101675. [Google Scholar] [CrossRef]
  28. Liu, J.; Liu, Y.; Yan, M. Spatial and Temporal Change in Urban-Rural Land Use Transformation at Village Scale—A Case Study of Xuanhua District, North China. J. Rural Stud. 2016, 47, 425–434. [Google Scholar] [CrossRef]
  29. Long, H.; Liu, Y.; Hou, X.; Li, T.; Li, Y. Effects of Land Use Transitions Due to Rapid Urbanization on Ecosystem Services: Implications for Urban Planning in the New Developing Area of China. Habitat Int. 2014, 44, 536–544. [Google Scholar] [CrossRef]
  30. Chen, W.; Chi, G.; Li, J. The Spatial Association of Ecosystem Services with Land Use and Land Cover Change at the County Level in China, 1995–2015. Sci. Total Environ. 2019, 669, 459–470. [Google Scholar] [CrossRef]
  31. Xiao, L.; Xianjin, H.; Quanjing, Z. A Literature Review on Urban-Rural Construction Land Transition. City Plan. Rev. 2015, 39, 105–112. [Google Scholar]
  32. Bhattacharya, P.C. Rural–Urban Migration in Economic Development. J. Econ. Surv. 1993, 7, 243–281. [Google Scholar] [CrossRef]
  33. Knight, J.; Gunatilaka, R. Great Expectations? The Subjective Well-Being of Rural-Urban Migrants in China. World Dev. 2010, 38, 113–124. [Google Scholar] [CrossRef]
  34. Lewis, W.A. Economic Development with Unlimited Supplies of Labour; University of Texas: Austin, TX, USA, 1954. [Google Scholar]
  35. Harris, J.R.; Todaro, M.P. Migration, Unemployment and Development: A Two-Sector Analysis. Am. Econ. Rev. 1970, 60, 126–142. [Google Scholar]
  36. Hu, H. The Distribution, Regionalization and Prospect of China’s Population. Acta Geogr. Sin. 1990, 2, 139–145. [Google Scholar]
  37. Chen, M.; Gong, Y.; Li, Y.; Lu, D.; Zhang, H. Population Distribution and Urbanization on Both Sides of the Hu Huanyong Line: Answering the Premier’s Question. J. Geogr. Sci. 2016, 26, 1593–1610. [Google Scholar] [CrossRef]
  38. Li, S.-M. Population Migration and Urbanization in China: A Comparative Analysis of the 1990 Population Census and the 1995 National One Percent Sample Population Survey. Int. Migr. Rev. 2004, 38, 655–685. [Google Scholar] [CrossRef]
  39. Hu, H. Distribution of China’s Population—With Statistical Tables and Density Maps. Acta Geogr. Sin. 1935, 2, 33–74. [Google Scholar]
  40. Cheng, Z.; Nielsen, I.; Smyth, R. Access to Social Insurance in Urban China: A Comparative Study of Rural-Urban and Urban-Urban Migrants in Beijing. Habitat Int. 2014, 41, 243–252. [Google Scholar] [CrossRef]
  41. Chan, K.W.; Zhang, L. The Hukou System and Rural-Urban Migration in China: Processes and Changes. China Q. 1999, 26, 818–848. [Google Scholar] [CrossRef]
  42. Li, M.; Hao, J.; Chen, L.; Gu, T.; Guan, Q.; Chen, A. Decoupling of Urban and Rural Construction Land and Population Change in China at the Prefectural Level. Resour. Sci. 2019, 41, 1897–1910. [Google Scholar] [CrossRef]
  43. Zhang, H.; He, R.; Li, J. Coupling Coordination Status of Urban and Rural Population and Construction Land in Henan Province from the Perspective of Decoupling. Geogr. Geo-Inf. Sci. 2020, 36, 145–178. [Google Scholar]
  44. Chen, R.; Ye, C.; Cai, Y.; Xing, X.; Chen, Q. The Impact of Rural Out-Migration on Land Use Transition in China: Past, Present and Trend. Land Use Policy 2014, 40, 101–110. [Google Scholar] [CrossRef]
  45. Han, J.; Meng, X.; Zhou, X.; Yi, B.; Liu, M.; Xiang, W.-N. A Long-Term Analysis of Urbanization Process, Landscape Change, and Carbon Sources and Sinks: A Case Study in China’s Yangtze River Delta Region. J. Clean. Prod. 2017, 141, 1040–1050. [Google Scholar] [CrossRef]
  46. Bureau, Z.M.S. Zhejiang Statistical Yearbook; China Planning Press: Beijing, China, 2021. [Google Scholar]
  47. Liu, Y.L.; Li, J.W.; Hou, H.P.; Liu, Y.F. Study on Urbanization Rate of Urban-Rural Construction Land and Its Influencing Factors: A Case Study of Hubei Province. Geogr. Res. 2014, 33, 132–142. [Google Scholar]
  48. Zhu, Y. In Situ Urbanization in Rural China: Case Studies from Fujian Province. Dev. Change 2000, 31, 414–434. [Google Scholar] [CrossRef]
  49. Friedmann, J. China’s Urban Transition; U of Minnesota Press: Minneapolis, MN, USA, 2005; ISBN 0816646155. [Google Scholar]
  50. Qi, X.; Zhu, Y.; Zhou, Y.P. A Double-Pull Model of Rural Labor Migration and Its in Situ Urbanizationeffect: Cases Studies of Three Coastal Areas in Southeast China. Sci. Geogr. Sin. 2012, 32, 25–30. [Google Scholar]
  51. Chen, X.; Huang, Z. Analysis of Factors Influencing the Migration of Locally Transferred Labor to Cities in Economically Developed Areas. China Rural Econ. 2003, 5, 34–39. [Google Scholar]
  52. Huang, Z.; Zhu, Y. The Development and Inspiration of Zhejiang’s Rural Industrialization. Contemp. China Hist. Stud. 2006, 13, 118. [Google Scholar]
  53. Chen, H.; Zhao, L.; Zhao, Z. Influencing Factors of Farmers’ Willingness to Withdraw from Rural Homesteads: A Survey in Zhejiang, China. Land Use Policy 2017, 68, 524–530. [Google Scholar] [CrossRef]
  54. Li, L.; Zeng, Y.; Ye, Z.; Guo, H. E-Commerce Development and Urban-Rural Income Gap: Evidence from Zhejiang Province, China. Pap. Reg. Sci. 2021, 100, 475–494. [Google Scholar] [CrossRef]
  55. White, G. Prospects for Civil Society in China: A Case Study of Xiaoshan City. Aust. J. Chin. Aff. 1993, 29, 63–87. [Google Scholar] [CrossRef]
  56. Han, H. Under the Shadow of the Collective Good: An Ethnographic Analysis of Fertility Control in Xiaoshan, Zhejiang Province, China. Mod. China 2007, 33, 320–348. [Google Scholar] [CrossRef]
  57. Li, X.S.; Qu, F.T.; Guo, Z.X.; Jiang, D.M.; Pan, Y.Q.; Chen, X.L. Decoupling between Urban and Rural Construction Land. China Popul. Resour. Environ. 2008, 18, 179–184. [Google Scholar]
  58. Chen, C.; Zhang, Q.; Zhang, P.X. Spatial—Temporal Evolution Characteristics of Urban-Rural Construction Land in Developed Areas: A Case Study of Tongzhou in Jiangsu Province. Chin. J. Soil Sci. 2018, 49, 537–545. [Google Scholar]
  59. Mo, L. Research on the Interactive Relationship between Rural Out-Migration and Urban and Rural Construction Land Change: The Case of Chongqing Bishan Region 2017. Master’s Thesis, Southwest University, Chongqing, China.
Figure 1. Conceptual framework of the interaction between URCLT and population flow.
Land 12 01829 g001
Figure 2. Location of the study area.
Land 12 01829 g002
Figure 3. Four changing types of human-land interaction.
Land 12 01829 g003
Figure 4. Six types of dynamic land utilization pattern (a) and the value range (b).
Land 12 01829 g004
Figure 5. Three cross-sectional combination types (a) and two temporal combination types (b).
Land 12 01829 g005
Figure 6. Structured analysis results (a) and changing types of human-land interaction (b) in Hangzhou and 13 county-level units.
Land 12 01829 g006
Figure 7. Index (a), static land utilization pattern (b) and dynamic land utilization pattern (c) in Hangzhou and 13 county-level units.
Land 12 01829 g007
Figure 8. Structured analysis results and changing types of human-land interaction in 190 township-level units.
Land 12 01829 g008
Figure 9. Static P c c l a r index in urban and rural areas.
Land 12 01829 g009
Figure 10. Spatial distribution (a) and quantity proportion (b) of six dynamic land utilization patterns in urban areas, and spatial distribution (c) and quantity proportion (d) of six dynamic land utilization patterns in rural areas.
Land 12 01829 g010
Figure 11. Cross-sectional combination types of urban-rural land utilization patterns (ac) and temporal combination types of land utilization patterns in urban (d) and rural (e) areas.
Land 12 01829 g011
Figure 12. Results of the dynamic land utilization efficiency index (a) and traditional coupling coordination index (b) in urban areas; comparison of their results (c).
Land 12 01829 g012
Table 1. The ideal value of per capita urban-rural construction land.
Per Capita Urban Construction LandPer Capita Rural Construction Land
Real ValuePlanning Standard ValueIdeal ValueReal ValuePlanning Standard ValueIdeal Value
≤65[65, 85]75≤50[50, 80]65
(65, 75][65, 95]80(50, 60][50, 80]65
(75, 85][75, 100]87.5(60, 80][60, 100]80
(85, 95][80, 105]92.5(80, 100][60, 120]90
(95, 105][85, 105]95(100, 120][80, 120]100
(105, 115][90, 110]100(120, 150][100, 150]125
>115≤110110>150≤150150
Table 2. Relevant results of other researchers (a): [57]; (b): [9]; (c): [25]; (d): [58]; (e): [59].
Study AreaPURLUR φ ω
(a)China30% → 42%14:86 → 17:8391%9%
(b)Huei46% → 58%25:75 → 32:6887%13%
(c)Shandong26% → 57%14:86 → 38:62109%−1%
(d)Tongzhou26% → 57%14:86 → 9:91−33%133%
(e)Bishan23% → 44%14:86 → 31:6990%10%
(f)Hangzhou67% → 83%60:40 → 60:4063%37%
Note: φ = ( U C L 2020 U C L 2010 ) / ( U R C L 2020 U R C L 2010 ) ;   ω = ( R R L 2020 R R L 2010 ) / ( U R C L 2020 U R C L 2010 ) .
Disclaimer/Publisher’s Note: The statements, opinions and data contained in all publications are solely those of the individual author(s) and contributor(s) and not of MDPI and/or the editor(s). MDPI and/or the editor(s) disclaim responsibility for any injury to people or property resulting from any ideas, methods, instructions or products referred to in the content.

