
Modelling the Effect of Keyline Practice on Soil Erosion Control
by
 ,
,
Yamuna Giambastiani
1,2,3,* ,
,
Gherardo Biancofiore
1,4,
Matteo Mancini
4,
Antonio Di Giorgio
4,
Riccardo Giusti
1,3,
Stefano Cecchi
1,3,
Lorenzo Gardin
1,3 and
Alessandro Errico
2 1
CNR-IBE, National Research Council, Institute of Bioeconomy, 50019 Florence, Italy
2
Bluebiloba Startup Innovativa SRL, 50126 Florence, Italy
3
Environmental Modelling and Monitoring Laboratory for Sustainable Development, LaMMA Consortium, 50019 Florence, Italy
4
Deafal ONG, 20124 Milano, Italy
*
Author to whom correspondence should be addressed.
Land 2023, 12(1), 100; https://doi.org/10.3390/land12010100
Submission received: 30 November 2022
/
Revised: 20 December 2022
/
Accepted: 23 December 2022
/
Published: 28 December 2022
(This article belongs to the Special Issue Quantification of Soil Erosion and Sediment Transport in Basins)
Abstract
:The global agricultural sector needs to implement good soil management practices, in particular to prevent erosion and to improve water-retention capacity. The introduction of tillage techniques along particular theoretical lines, called keylines, can make a significant contribution to improving the management of the soil and agricultural crops. The keyline system has been around for less than 100 years. With this preliminary work, we performed a comparative analysis of two small river basins (less than 100 ha) before and after keyline application, based on GIS computational models (TWI and SIMWE). The calculation models were elaborated starting from a DTM with 2 m resolution, obtained from a LIDAR survey. The comparative analysis, in qualitative terms, showed a positive effect of the keylines, both in terms of erodibility and infiltration of runoff water. The use of GIS models to verify the effectiveness in the planning phase can constitute a decision support system that guides agronomists, technicians, and farmers.
1. Introduction
The problems concerning erosion are well represented in the elaboration carried out by the JRC (Joint Research Centre of the European Commission) in 2015, which shows that Italy has the highest values of soil loss among EU countries with 8.77 t/ha against a European average of about 2.46 (JRC, 2015). More than 75% of the national territory is at risk of erosion [1] due to the high relief energy and often associated with non-conservative management practices which fuel the progressive thinning of the soil, affecting both productive capacity and physical-hydrological properties. Moreover, in Italy, 21.3% of soils are at risk of desertification [2,3,4,5,6]. The soil degradation that has occurred over the last 40 years has caused a decrease of about 30% in the water retention capacity of agricultural soils, also compromising their ability to respond to calamitous weather events [7,8]. In the agricultural sector, there are many techniques that can be implemented in order to effectively contrast the erosion phenomenon. Soil and water resource conservation are intimately related, and in this sense, farm water management systems represent an essential tool. In hilly cultivated areas, where slopes are less severe, keyline design is an effective approach to tackling erosion [9].
Keyline design is an agriculture water management system developed in the late 1940s by the Australian engineer and geologist P.A. Yeomans, whose aim is to increase water use efficiency within agricultural production systems [10,11]. One of the potential benefits of this design is that it can be introduced into a multitude of contexts: agroforestry, forestry design, ecological restoration, watershed design and management, and urban planning. Another important aspect of keyline design is the creation of effective water catchment areas.
Over time, some professionals [12,13] have reshaped and simplified the original design scheme, implementing a design that is easier in terms of execution and adaptability in different agronomic contexts called a keyline layout [14]. The main purpose of this system is to harness the force of gravity to slow down the surface runoff of water, intercept it, and distribute it slowly away from the accumulation areas (valleys) where the level of superficial erosion is higher towards the ridges, i.e., the areas that usually suffer from low water permanence, especially during the dry season. In this sense, keyline design can be a mitigation strategy for both erosion and drought phenomena where the slope of the land does not exceed 15%. In the agronomic context, this is achieved by designing a precise cultivation pattern in which tillage, cultivation operations, and the planting of permanent crops, hedges, and tree strips follow the direction of the keylines. A keyline is considered efficient when, being reproduced in parallel upstream and downstream, it always induces the same water behavior over the entire slope, or a large part of it, regardless of the contour lines. Keyline design is applied in many countries, including Italy [15], and is promoted by many farmers and agro-technicians, who report improvements in the infiltration, storage, and distribution of water in their soils; furthermore, increases in soil fertility have been recorded. However, these results have been achieved by combining keyline design with additional sustainable soil management practices, such as soil amendments, cover crops, minimum tillage, agroforestry systems, and rotational grazing. Although the keyline strategy has already been applied with broad empirical success, we have found few studies to verify its effectiveness [16,17,18] from a qualitative and not a quantitative point of view.
The objective of this communication is to show the effect of keylines on the rain runoff in hilly arable land by means of a simulation carried out with mathematical models elaborated in a GIS environment. The hydrological effects of keylines influence runoff and, consequently, soil erosion [19,20,21,22,23,24,25]. Other parameters that impact soil loss, such as cover, soil erodibility, and rainfall action, do not vary and therefore cannot be verified with a simulation.
2. Materials and Methods
The study was carried out within two hydrographic basins in Mugello, in the province of Florence. These two basins present at the closing section a hilly lake for irrigation use, owned by an agricultural private company (Figure 1). Both are part of a previous study on erosion [26,27]. This allowed us to work remotely, without the need to carry out data collection or surveys as the research was based on an already known territory [28]. Furthermore, we can say that there are normal erosion conditions in both cases, so the site under study is representative for a modeling approach.
The Galliano lake basin (ID = 3036, geographic coordinates: Long 11.3002759332; Lat 44.0183733785) has an area of about 67 ha, is located between 400 and 280 m asl, and the average slope is 8%. The basin of Lake Schifanoia (ID = 7719, geographic coordinates: Long 11.2985087460; Lat 43.9880056812) has an area of 87 ha, located between 280 and 240 m asl and a 4% average slope. From a cover and land use point of view, the basins are similar, mostly arable cropland and woodland, with small portions of built-up land, a limited road network, and the lakes.
Keyline design has been applied to different rainfed arable land parcels, identified through photointerpretation from orthophotos, with a total area of approximately 763 ha and an average slope of 6%, excluding plots with a slope of more than 15%, where arable farming would be inadvisable. The plot is a homogeneous portion of land included in natural constraints (watersheds, slopes).
Keyline design always starts with a topographical survey (GPS, drone, remote sensing, total station) in order to obtain a contour map of the area under consideration. Taking a contour line as a reference, a line is drawn, called a keyline, which, starting upstream of the reference curve, intersects it and crosses the reference curve with a slight slope. By drawing the keyline parallel to the upstream and downstream, a layout representing the cultivation pattern is outlined. In practice, water is thereby forced to flow in the direction of the keylines through tillage and cultivation operations (e.g., ripping, harrowing, sowing, harvesting, etc.) for arable crops, aeration for pastures and permanent crops, and surface water regulation systems (e.g., ditches) (Figure 2).
In the first phase of the design, a careful analysis of the current orography of the sites under consideration was carried out. Using LIDAR data (Light Detection and Ranging) with a resolution of 2 × 2 m, a DTM model (Digital Terrain Model) was created which allowed us to derive a contour map with lines placed every 2 m. In the next step, the keyline layout was drawn using Autocad software. From the contour map, following the Pavlov methodology [14], a keyline was identified for each plot under consideration to be used as a guide, and subsequent lines were drawn parallel below and above the keyline. In some plots, due to the high orographic variability, it was necessary to identify an additional keyline guide to ensure continuity in the functionality of the layout (Figure 3). In the areas of the sites under investigation characterized by numerous, sometimes very abrupt, changes in slope, it was not possible to apply keyline geometry to the full extent; however, ease of execution was favored over faithful interpretation of the landscape. Indeed, in these areas, the keyline guides have undergone adjustments in order to achieve a realistic tillage pattern, i.e., one that is simple and safe (no risk of overturning for the tractor) for farm operators to implement in the field in exchange for losing some of the beneficial effects of the keyline design.
The cultivation pattern design was carried out by assuming two different intervention strategies:
- Surface water regulation: creation of temporary ditches every 25 m along keylines with a depth of 20 cm;
- Tillage: subsoiling at a depth of 30 cm parallel to the keylines.
Lastly, water regulation was completed by assuming, for each strategy, the creation of 30 cm-deep collection ditches at the edges of the plots.
The effect of keylines was analyzed using two hydrological models: the Topographic Wetness Index and a overland flow hydrologic simulation using the path sampling method. The Topographic Wetness Index (TWI) is based on the assumption that topography controls the movement of water in sloped terrain and thus the spatial pattern of soil moisture. High TWI values are found in converging, flat terrain. Low values are typical for steep, diverging areas. The simulation of water erosion model (SIMWE) estimates the net erosion/deposition at a point, under the assumption that the erosion and deposition are proportional based on the difference between the sediment transport capacity and the actual sediment flow, depending on soil and cover properties. The TWI was elaborated with the aid of the SAGA GIS software, while the SIMWE was elaborated on GRASS GIS. Both are well-known in the scientific community and are applied in many works [29,30,31,32,33,34,35]. The two models allow us to take into account both approaches to the keyline design, i.e., the excavation of real ditches (interception by means of drainage channels of surface water) and the change in the soil infiltration capacity (tillage with aerator ripper). The TWI was developed on the basis of a DTM (Digital Terrain Model) with a resolution of 2 m before and after the application of keyline design. The GRASS GIS processing algorithm, r.carve, was used to report the hydraulic arrangements on the DEM, which allows the DTM to be excavated along lines, specifying width and depth [36]. The evaluation of the changes between the two simulations resulting from the TWI are mainly qualitative. Using the SIMWE (r.sim.water), it was possible to simulate the effect of a rain precipitation event of 50 mm for 10 min, obtaining the runoff (water discharge-cubic meter per second). The model has as input the DTM of the area, and the spatialized runoff coefficient based on the basin characteristics (soil, slope, cover), which is the same procedure for determining the runoff coefficient used in Cambi et al. (2021) [30]. The classification is based on soil type, slope, and vegetation cover. The runoff coefficients are identified by crossing the parameters within a matrix. The effect of the keylines has been inserted by modifying the runoff coefficient along them, reducing by 0.2 compared to the previous coefficient. This is carried out to see the effect of keylines on the general balance in the catchment area. The reduction in the runoff coefficient was chosen using the same approach, considering the less weighted and compacted soil along the keylines.
3. Results
The results obtained from the hydrological models show an evident impact of the keylines on the runoff distribution and soil moisture within the basin. The excavation operation of the DTM shows changes in the water concentration in the cropland involved by the keyline system (Figure 4 and Figure 5). The introduction of 20 cm deep ditches, placed at a distance of about 25 m from each other, leads to a regulation of surface waters capable of reducing erosive phenomena in the portions between the keylines. The outflow follows the keylines, with the exception of some cases where they are probably not deep enough to contain the flow, and then the water flows out in a disorderly way. The slope statistics generally show an increase in the wetness index, given the fact that the outflow in the keylines is much greater. They are not reported as they are not significant for a theoretical modeling simulation.
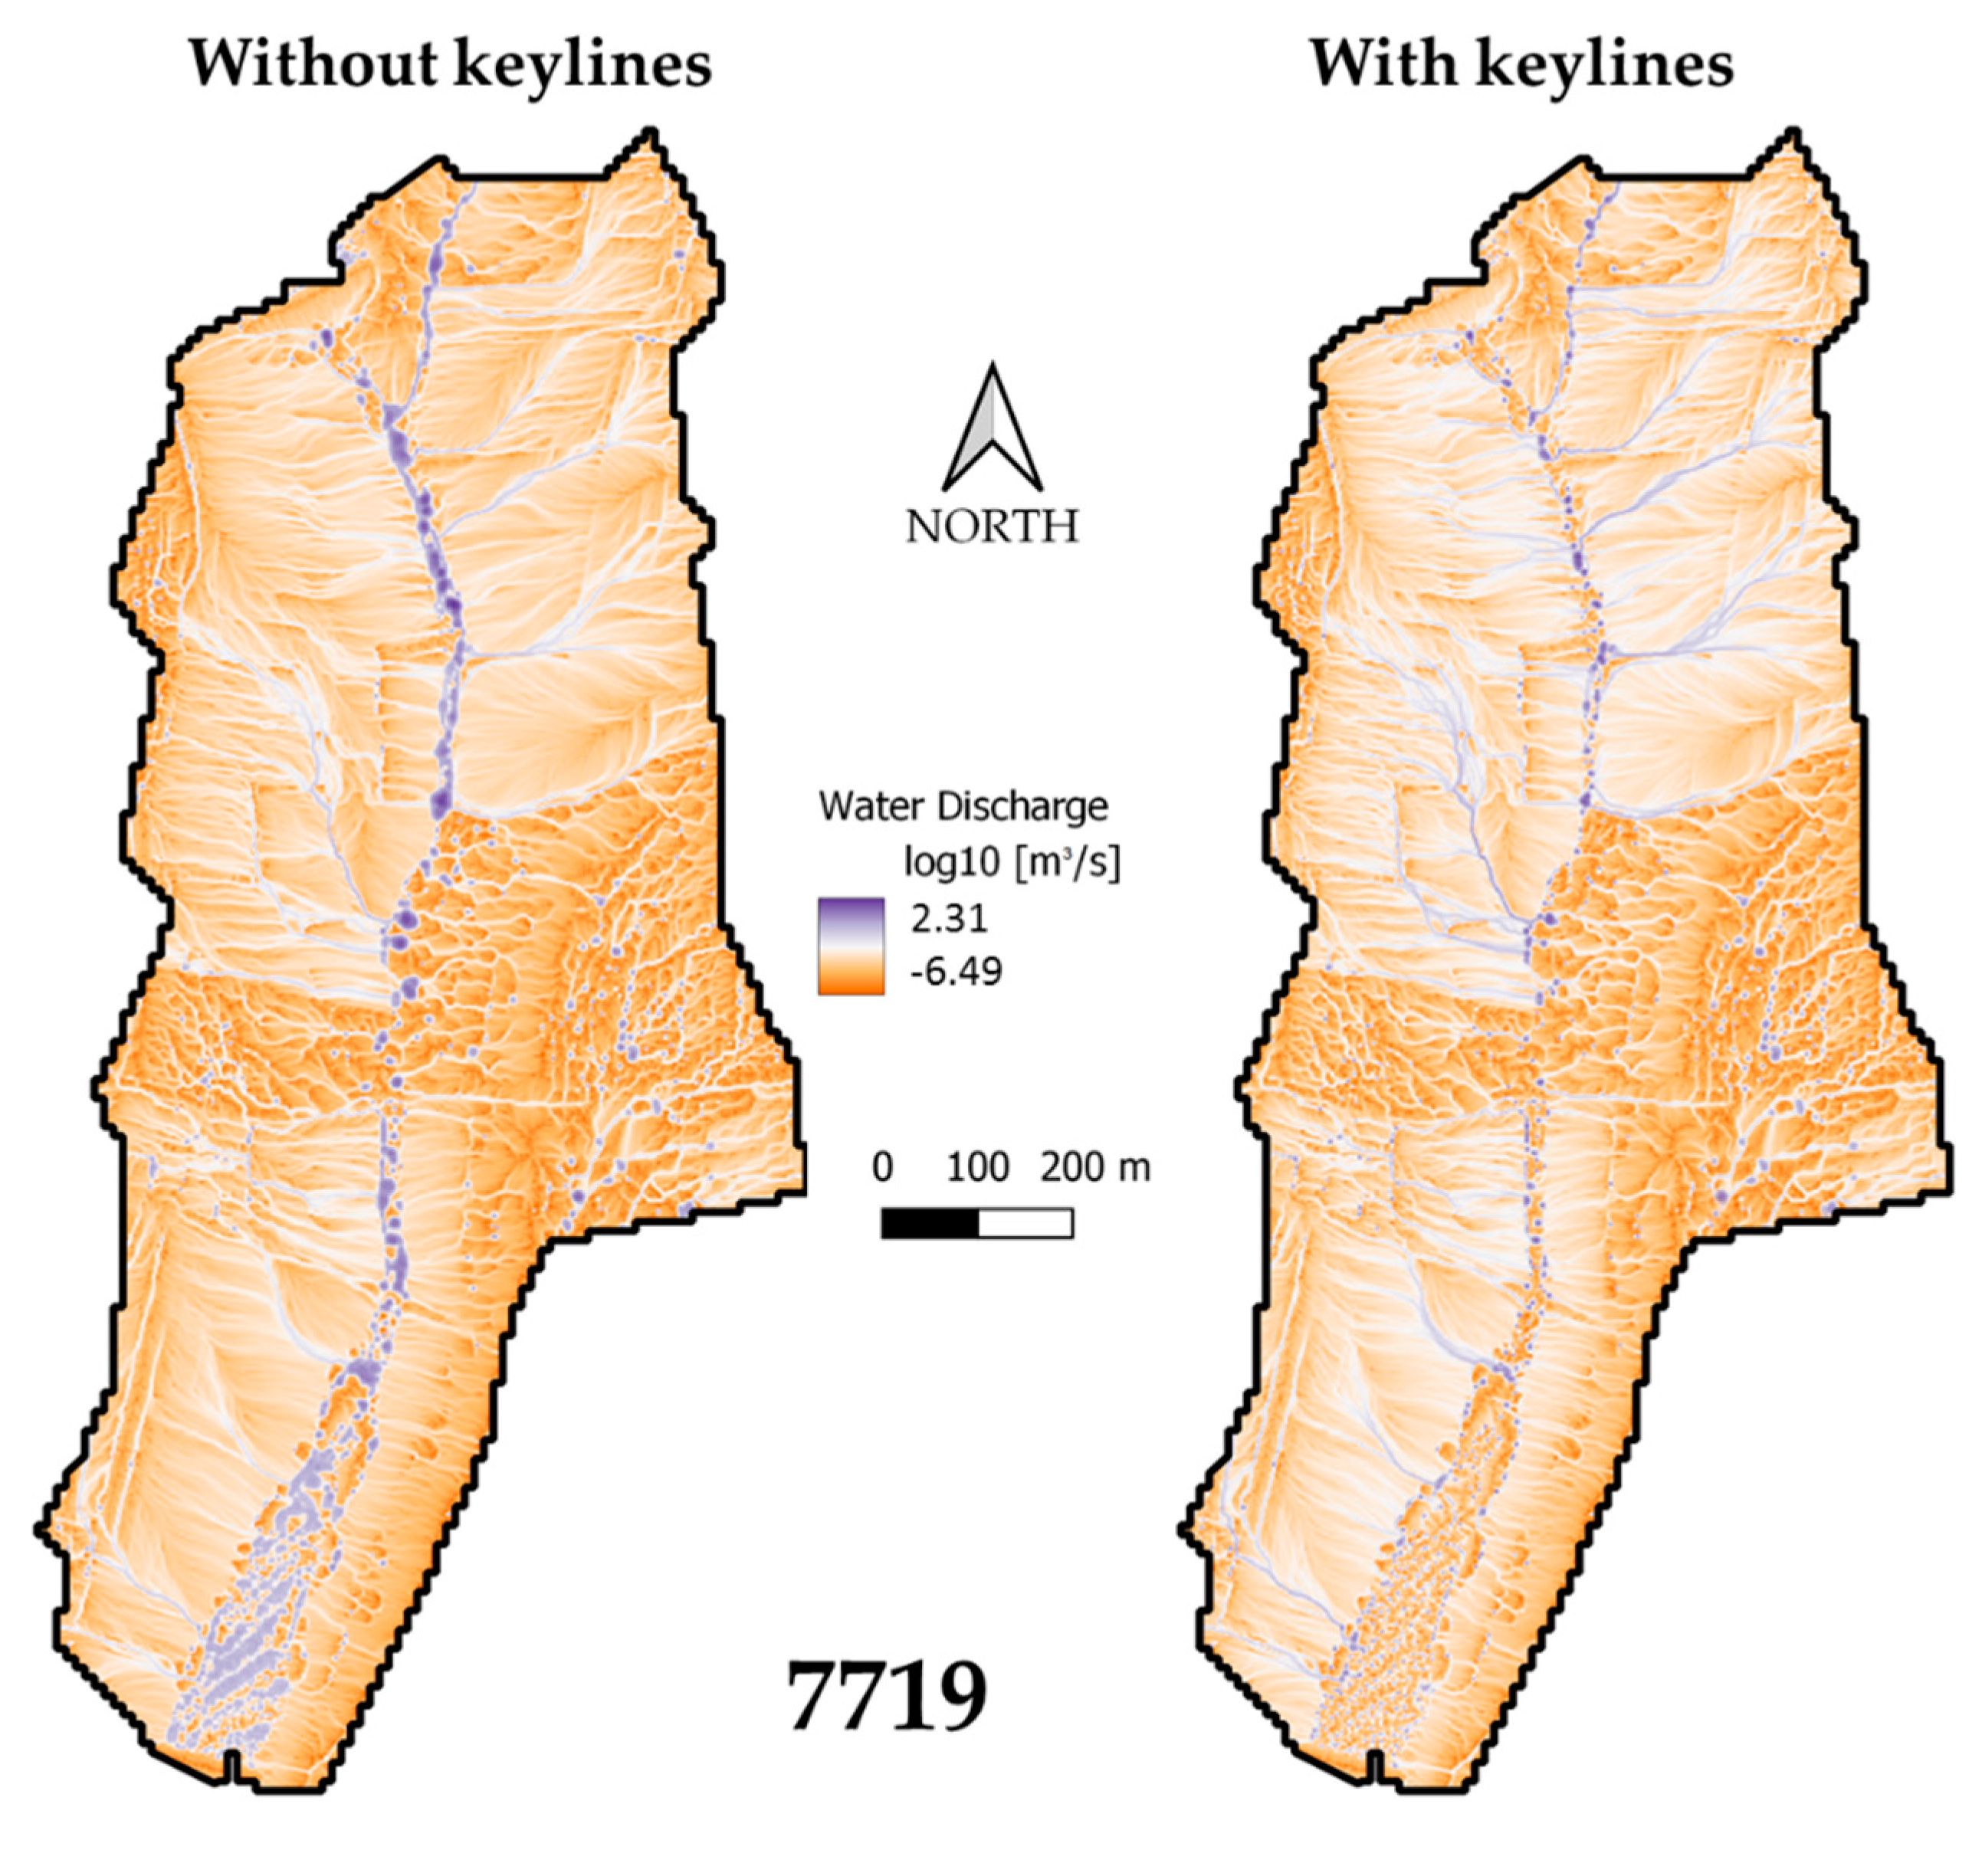
The runoff with the keylines, obtained from the simulation using the SIMWE, is less than in the previous conditions (Figure 6 and Figure 7). We notice a general reduction in the runoff in the whole area where the keylines are present, without changing the flow direction, as the terrain does not undergo changes from an elevation point of view, only the physical characteristics of the soil vary in terms of the infiltration. In fact, the outflow follows the same direction before and after keylines are added, but it is reduced in absolute terms, as more water is retained on the slopes. In statistical terms, the mean water discharge value of all the pixels in the simulation with the keyline is lower for each of the basins (Table 1). Basin 3036 shows a reduction of 8%, and basin 7719 shows a reduction of 12%. The difference between the basins is consistent with the dimensions, and 7719 is flatter than 3036.
4. Discussion
The soil erosion phenomenon is a problem present in every slope area subject to cultivation, as every year, centimeters of fertile soil are lost and hydrogeological problems occur, especially in addition to climate change [37]. The use of techniques for improving water regulation can make a significant contribution to reducing soil erosion and can also increase water accumulation, therefore establishing a greater water reserve during the dry period.
The keyline technique shows, in this preliminary modeling analysis, a positive effect for these purposes. For both approaches applied, there are advantages to reduce the uncontrolled runoff and a greater permanence of water in the slopes. The positive effects are similar to those identified by Bazzoffi in his works on water furrows [38,39,40].
The portions of territory that are not affected by the influence of the keylines are the result of a compromise between agronomic and hydrological needs, as the design must allow the farmer to work safely. It is thus acceptable to obtain a lower result in terms of water regulation.
The keyline design for this study was based on data, maps, and photointerpretation. No surveys were carried out, which usually allow for a more detailed analysis of the plots.
The digital terrain model used has a resolution of 2 m and is a high-resolution model. In this application, however, it shows an important limitation: variations of less than one meter are not very noticeable. For the correct verification of the keyline effect, it would be advisable to use DTMs with even higher resolutions [41,42,43], models that can be easily obtained with photogrammetric surveys by drones (UAV) in areas without or with reduced vegetation cover and with an extension limited to a few tens of hectares [44].
In addition to the positive aspects, the consideration of some factors which could lead to land degradation, both for erosion and for water accumulation, is necessary. In the first case, the arrangement of the ditches following the natural slope of the land could cause greater erosion problems due to the greater runoff concentration [45,46,47]. Water increases its speed with greater concentration and therefore drag energy, causing localized but intense erosion. In this regard, it is necessary to thoroughly verify the arrangement of the keylines with the help of distributed morpho-hydrological models such as the TWI. To overcome these drawbacks, it is necessary to provide stabilized ditches with small “steep and pools” [48] in order to reduce the flow speed or alternatively by keeping the channels grassed or vegetated in order to reduce the flow speed a result of greater surface roughness [49,50]. Another solution can be to create horizontal ditches in order to reduce the speed thanks to the lower slope, thus creating a profile like a terraced slope [51].
In the second case, we have a greater soil water retention with positive effects for crops during the dry season. In clayey soils, this could prove to be a problem, as between the higher density of the soil and the possible formation of compact layer due to tillage, soliflow phenomena could occur [52], or even landslides and increased instability.
Considering the above, the combination of the two approaches could be optimal to gain a greater benefit in terms of water regulation and infiltration. More specifically, the realization of ditches should be arranged parallel to the keylines along the entire slope, combining minimum tillage to prepare the soil for sowing, avoiding machinery that creates compaction and harms soil structure.
5. Conclusions
The use of keylines is an interesting management practice of cultivated land, with a good ability to reduce soil erosion and improve the water-retention capacity of the soil for the greater resilience of crops during drought periods. In order to carry out the correct design of a slope arrangement, it is advisable to check the new layout of the territory, together with the characteristics that influence erosion: slope, type of soil, distribution of precipitation events, and soil cover.
It is shown that the models based on soil morphology (TWI and SIMWE) can constitute a real decision support system for the design of keylines and for agricultural hydraulic arrangements in general. The accuracy of the results also depends on the resolution of the digital terrain models.
Author Contributions
Conceptualization, Y.G. and G.B.; methodology, Y.G., G.B., M.M. and A.D.G.; software, Y.G.; validation, R.G., S.C. and L.G.; formal analysis, Y.G.; investigation, Y.G. and R.G.; resources, A.D.G. and L.G.; data curation, Y.G., G.B. and M.M.; writing—original draft preparation, Y.G. and G.B.; writing—review and editing, A.E. and R.G.; visualization, S.C. and A.D.G.; supervision, A.E. and L.G.; project administration, L.G.; funding acquisition, L.G. All authors have read and agreed to the published version of the manuscript.
Funding
This research received no external funding.
Informed Consent Statement
Informed consent was obtained from all subjects involved in the study.
Data Availability Statement
Not applicable.
Acknowledgments
We thank the agricultural cooperative “Agriambiente Mugello” for allowing us to monitor its lakes and related basins for scientific research purposes.
Conflicts of Interest
The authors declare no conflict of interest.
References
- Van der Knijff, J.M.F.; Jones, R.J.A.; Montanarella, L. Soil Erosion Risk Assessment in Italy; EUR 19022; European Soil Bureau, European Commission: Brussels, Belgium, 1999; 32p. [Google Scholar]
- Bathurst, J.C. Decision support system for desertification mitigation in the Agri basin, southern Italy. Phys. Chem. Earth 2003, 28, 579–587. [Google Scholar] [CrossRef]
- Egidi, G.; Cividino, S.; Paris, E.; Palma, A.; Salvati, L.; Cudlin, P. Assessing the impact of multiple drivers of land sensitivity to desertification in a Mediterranean country. Environ. Impact Assess. Rev. 2021, 89, 106594. [Google Scholar] [CrossRef]
- Nickayin, S.S.; Coluzzi, R.; Marucci, A.; Bianchini, L. Desertification risk fuels spatial polarization in ‘affected’ and ‘unaffected’ landscapes in Italy. Sci. Rep. 2022, 12, 747. [Google Scholar] [CrossRef] [PubMed]
- Imbrenda, V.; Coluzzi, R.; Di Stefano, V.; Egidi, G.; Salvati, L.; Samela, C.; Simoniello, T.; Lanfredi, M. Modeling Spatio-Temporal Divergence in Land Vulnerability to Desertification with Local Regressions. Sustainability 2022, 14, 10906. [Google Scholar] [CrossRef]
- Salvati, L.; Bajocco, S. Land sensitivity to deserti fi cation across Italy: Past, present, and future. Appl. Geogr. 2011, 31, 223–231. [Google Scholar] [CrossRef]
- Pagliai, M. Conoscenza, conservazione e uso sostenibile del suolo: Aspetti fisici e morfologici. Ital. J. Agron. 2009, 4, 151–160. [Google Scholar] [CrossRef]
- Palese, A.M.; Vignozzi, N.; Celano, G.; Agnelli, A.E.; Pagliai, M.; Xiloyannis, C. Influence of soil management on soil physical characteristics and water storage in a mature rainfed olive orchard. Soil Tillage Res. 2014, 144, 96–109. [Google Scholar] [CrossRef]
- Shukla, P.R.; Skeg, J.; Calvo Buendia, E.; Masson-Delmotte, V.; Pörtner, H.-O.; Roberts, D.C.; Zhai, P.; Slade, R.; Connors, S.; van Diemen, S.; et al. Climate Change and Land: An IPCC Special Report on Climate Change, Desertification, Land Degradation, Sustainable Land Management, Food Security, and Greenhouse Gas Fluxes in Terrestrial Ecosystems; IPCC Press Office: Geneva, Switzerland, 2019; pp. 35–74. [Google Scholar]
- Yeomans, P.A. The Challenge of Landscape: The Development and Practice of Keyline. Geogr. Rev. 1958, 50, 463. [Google Scholar] [CrossRef]
- Yeomans, P.A. The Keyline plan. Creat. Indep. Publ. Platf. 1954, 22, 120pp. [Google Scholar] [CrossRef]
- Duncan, T. Case Study: Taranaki Farm Regenerative Agriculture. Pathways to Integrated Ecological Farming; Elsevier Inc.: Amsterdam, The Netherlands, 2016; ISBN 9780128013533. [Google Scholar]
- Gras, E. Cosecha de agua y tierra Diseño con permacultura; Ediciones COAS: Navarra, Spain, 2009. [Google Scholar]
- Pavlov, G. Uderstanding the Application of Keyline Geometry; HUMA: Samuel, Bulgaria, 2015. [Google Scholar]
- Mancini, M. Agricoltura Organica e Rigenerativa Oltre il Biologico: Le Idee, gli Strumenti e le Pratiche per Un’agricoltura di Qualità; Terra Nuova Ed.: Firenze, Italy, 2019. [Google Scholar]
- Ponce-Rodríguez, M.D.C.; Carrete-Carreón, F.O.; Núñez-Fernández, G.A.; Muñoz-Ramos, J.d.J.; Pérez-López, M.E. Keyline in bean crop (Phaseolus vulgaris l.) for soil and water conservation. Sustainability 2021, 13, 9982. [Google Scholar] [CrossRef]
- Duncan, S.; Krawczyk, T. Keyline Water Management: Field Research & Education in the Capital Region Soil Indicators Monitoring Program. 2018. Available online: http://crkeyline.ca (accessed on 9 December 2022).
- Al-Siaede, R. Using Landscape analysis techniques to prevent silt accumulation in the reservoir of the Dwerige weir project and developing River basin, Missan, South Eastern IRAQ. Iraqi J. Sci. 2022, 63, 3031–3039. [Google Scholar] [CrossRef]
- Wang, D.; Yuan, Z.; Cai, Y.; Jing, D.; Liu, F.; Tang, Y.; Song, N.; Li, Y.; Zhao, C.; Fu, X. Characterisation of soil erosion and overland flow on vegetation-growing slopes in fragile ecological regions: A review. J. Environ. Manag. 2021, 285, 112165. [Google Scholar] [CrossRef] [PubMed]
- Rutebuka, J.; Munyeshuli Uwimanzi, A.; Nkundwakazi, O.; Mbarushimana Kagabo, D.; Mbonigaba, J.J.M.; Vermeir, P.; Verdoodt, A. Effectiveness of terracing techniques for controlling soil erosion by water in Rwanda. J. Environ. Manag. 2021, 277, 111369. [Google Scholar] [CrossRef] [PubMed]
- Wolka, K.; Biazin, B.; Martinsen, V.; Mulder, J. Soil and water conservation management on hill slopes in Southwest Ethiopia. I. Effects of soil bunds on surface runoff, erosion and loss of nutrients. Sci. Total Environ. 2021, 757, 142877. [Google Scholar] [CrossRef]
- Carroll, C.; Merton, L.; Burger, P. Impact of vegetative cover and slope on runoff, erosion, and water quality for field plots on a range of soil and spoil materials on central Queensland coal mines. Aust. J. Soil Res. 2000, 38, 313–327. [Google Scholar] [CrossRef]
- Gómez, J.A.; Sobrinho, T.A.; Giráldez, J.V.; Fereres, E. Soil management effects on runoff, erosion and soil properties in an olive grove of Southern Spain. Soil Tillage Res. 2009, 102, 5–13. [Google Scholar] [CrossRef]
- Parhizkar, M.; Shabanpour, M.; Lucas-Borja, M.E.; Zema, D.A.; Li, S.; Tanaka, N.; Cerdà, A. Effects of length and application rate of rice straw mulch on surface runoff and soil loss under laboratory simulated rainfall. Int. J. Sediment Res. 2021, 36, 468–478. [Google Scholar] [CrossRef]
- Sidorchuk, A. Article models of gully erosion by water. Water 2021, 13, 3293. [Google Scholar] [CrossRef]
- Giambastiani, Y.; Giusti, R.; Gardin, L.; Cecchi, S.; Iannuccilli, M.; Romanelli, S.; Bottai, L.; Ortolani, A.; Gozzini, B. Assessing Soil Erosion by Monitoring Hilly Lakes Silting. Sustainability 2022, 14, 5649. [Google Scholar] [CrossRef]
- Giambastiani, Y.; Giusti, R.; Cecchi, S.; Palomba, F.; Manetti, F.; Romanelli, S.; Bottai, L. Volume estimation of lakes and reservoirs based on aquatic drone surveys: The case study of Tuscany, Italy. J. Water Land Dev. 2020, 46, 84–96. [Google Scholar] [CrossRef]
- Gardin, L.; Chiesi, M.; Fibbi, L.; Maselli, F. Mapping soil organic carbon in Tuscany through the statistical combination of ground observations with ancillary and remote sensing data. Geoderma 2021, 404, 115386. [Google Scholar] [CrossRef]
- Penna, D.; Mantese, N.; Hopp, L.; Dalla Fontana, G.; Borga, M. Spatio-temporal variability of piezometric response on two steep alpine hillslopes. Hydrol. Process. 2015, 29, 198–211. [Google Scholar] [CrossRef]
- Cambi, M.; Giambastiani, Y.; Giannetti, F.; Nuti, E.; Dani, A.; Preti, F. Integrated low-cost approach for measuring the state of conservation of agricultural terraces in tuscany, Italy. Water 2021, 13, 113. [Google Scholar] [CrossRef]
- Li, H.; Gao, H.; Zhou, Y.; Xu, C.Y.; Rengifo, M.; Sælthun, N.R. Usage of SIMWE model to model urban overland flood: A case study in Oslo. Hydrol. Res. 2020, 51, 366–380. [Google Scholar] [CrossRef]
- Pijl, A.; Reuter, L.E.H.; Quarella, E.; Vogel, T.A.; Tarolli, P. GIS-based soil erosion modelling under various steep-slope vineyard practices. Catena 2020, 193, 104604. [Google Scholar] [CrossRef]
- Schmidt, F.; Persson, A. Comparison of DEM data capture and topographic wetness indices. Precis. Agric. 2003, 4, 179–192. [Google Scholar] [CrossRef]
- Abu El-Magd, S.A.; Orabi, H.O.; Ali, S.A.; Parvin, F.; Pham, Q.B. An integrated approach for evaluating the flash flood risk and potential erosion using the hydrologic indices and morpho-tectonic parameters. Environ. Earth Sci. 2021, 80, 1–17. [Google Scholar] [CrossRef]
- Eagleston, H.; Marion, J.L. Application of airborne LiDAR and GIS in modeling trail erosion along the Appalachian Trail in New Hampshire, USA. Landsc. Urban Plan. 2020, 198, 103765. [Google Scholar] [CrossRef]
- Mitasova, H.; Mitas, L.; Brown, W.M.; Johnston, D.M. Terrain Modeling and Soil Erosion Simulations for Fort Hood and Fort Polk Test Areas; Annual Report; U.S. Army Construction Engineering Research Laboratory: Champaign, IL, USA, 1999; pp. 1–22. [Google Scholar]
- Borrelli, P.; Robinson, D.A.; Panagos, P.; Lugato, E.; Yang, J.E.; Alewell, C.; Wuepper, D.; Montanarella, L.; Ballabio, C. Land use and climate change impacts on global soil erosion by water (2015–2070). Proc. Natl. Acad. Sci. USA 2020, 117, 21994–22001. [Google Scholar] [CrossRef]
- Bazzoffi, P. Linee guida per l’assistenza aziendale nella realizzazione dei solchi acquai efficaci nel contenimento dell’erosione (Standard di condizionalità 1.1a) nell’ambito della misura m02, sottomisura 2.3 (sostegno alla formazione dei consulenti) dei psr. Ital. J. Agron. 2015, 10, 1–11. [Google Scholar] [CrossRef]
- Bazzoffi, P. Indicatori per la valutazione a scala geografica regionale dell’efficacia dello Standard 1.1 di condizionalità (solchi acquai temporanei). Ital. J. Agron. 2016, 10, 1–9. [Google Scholar] [CrossRef] [Green Version]
- Bazzoffi, P.; Francaviglia, R.; Neri, U.; Napoli, R.; Marchetti, A.; Falcucci, M.; Pennelli, B.; Simonetti, G.; Barchetti, A.; Migliore, M.; et al. Environmental effectiveness of GAEC cross-compliance Standard 1.1a (temporary ditches) and 1.2g (permanent grass cover of set-aside) in reducing soil erosion and economic evaluation of the competitiveness gap for farmers. Ital. J. Agron. 2016, 10, 1–13. [Google Scholar] [CrossRef]
- Preti, F.; Tarolli, P.; Dani, A.; Calligaro, S.; Prosdocimi, M. LiDAR derived high resolution topography: The next challenge for the analysis of terraces stability and vineyard soil erosion. J. Agric. Eng. 2013, 44. [Google Scholar] [CrossRef]
- Eltner, A.; Baumgart, P. Accuracy constraints of terrestrial Lidar data for soil erosion measurement: Application to a Mediterranean field plot. Geomorphology 2015, 245, 243–254. [Google Scholar] [CrossRef]
- Neugirg, F.; Stark, M.; Kaiser, A.; Vlacilova, M.; Della Seta, M.; Vergari, F.; Schmidt, J.; Becht, M.; Haas, F. Erosion processes in calanchi in the Upper Orcia Valley, Southern Tuscany, Italy based on multitemporal high-resolution terrestrial LiDAR and UAV surveys. Geomorphology 2016, 269, 8–22. [Google Scholar] [CrossRef]
- Giannetti, F.; Chirici, G.; Gobakken, T.; Næsset, E.; Travaglini, D.; Puliti, S. A new approach with DTM-independent metrics for forest growing stock prediction using UAV photogrammetric data. Remote Sens. Environ. 2018, 213, 195–205. [Google Scholar] [CrossRef]
- Ravenna, V.; Bresci, E.; Preti, F. Historical terraces influence on peak runoff and hydraulic hazard at watershed scale. Quadermi Idronomia Mont. 2015, 32, 333–344. [Google Scholar]
- Claessens, L.; Knapen, A.; Kitutu, M.G.; Poesen, J.; Deckers, J.A. Modelling landslide hazard, soil redistribution and sediment yield of landslides on the Ugandan footslopes of Mount Elgon. Geomorphology 2007, 90, 23–35. [Google Scholar] [CrossRef]
- Uchida, T.; Kosugi, K.N.I.; Mizuyama, T. Effects of pipeflow on hydrological process and its relation to landslide: A review of pipeflow studies in forested headwater catchments. Hydrol. Process. 2001, 15, 2151–2174. [Google Scholar] [CrossRef]
- Molnar, P.; Densmore, A.L.; McArdell, B.W.; Turowski, J.M.; Burlando, P. Analysis of changes in the step-pool morphology and channel profile of a steep mountain stream following a large flood. Geomorphology 2010, 124, 85–94. [Google Scholar] [CrossRef]
- Errico, A.; Pasquino, V.; Maxwald, M.; Chirico, G.B.; Solari, L.; Preti, F. The effect of flexible vegetation on flow in drainage channels: Estimation of roughness coefficients at the real scale. Ecol. Eng. 2018, 120, 411–421. [Google Scholar] [CrossRef]
- Errico, A.; Lama, G.F.C.; Francalanci, S.; Chirico, G.B.; Solari, L.; Preti, F. Flow dynamics and turbulence patterns in a drainage channel colonized by common reed (Phragmites australis) under different scenarios of vegetation management. Ecol. Eng. 2019, 133, 39–52. [Google Scholar] [CrossRef]
- Preti, F.; Guastini, E.; Penna, D.; Dani, A.; Cassiani, G.; Boaga, J.; Deiana, R.; Romano, N.; Nasta, P.; Palladino, M.; et al. Conceptualization of Water Flow Pathways in Agricultural Terraced Landscapes. Land Degrad. Dev. 2017, 29, 651–662. [Google Scholar] [CrossRef]
- Matsuoka, N. Solifluction rates, processes and landforms: A global review. Earth Sci. Rev. 2001, 55, 107–134. [Google Scholar] [CrossRef]
Figure 1.
Geographical position of the two basins analyzed.
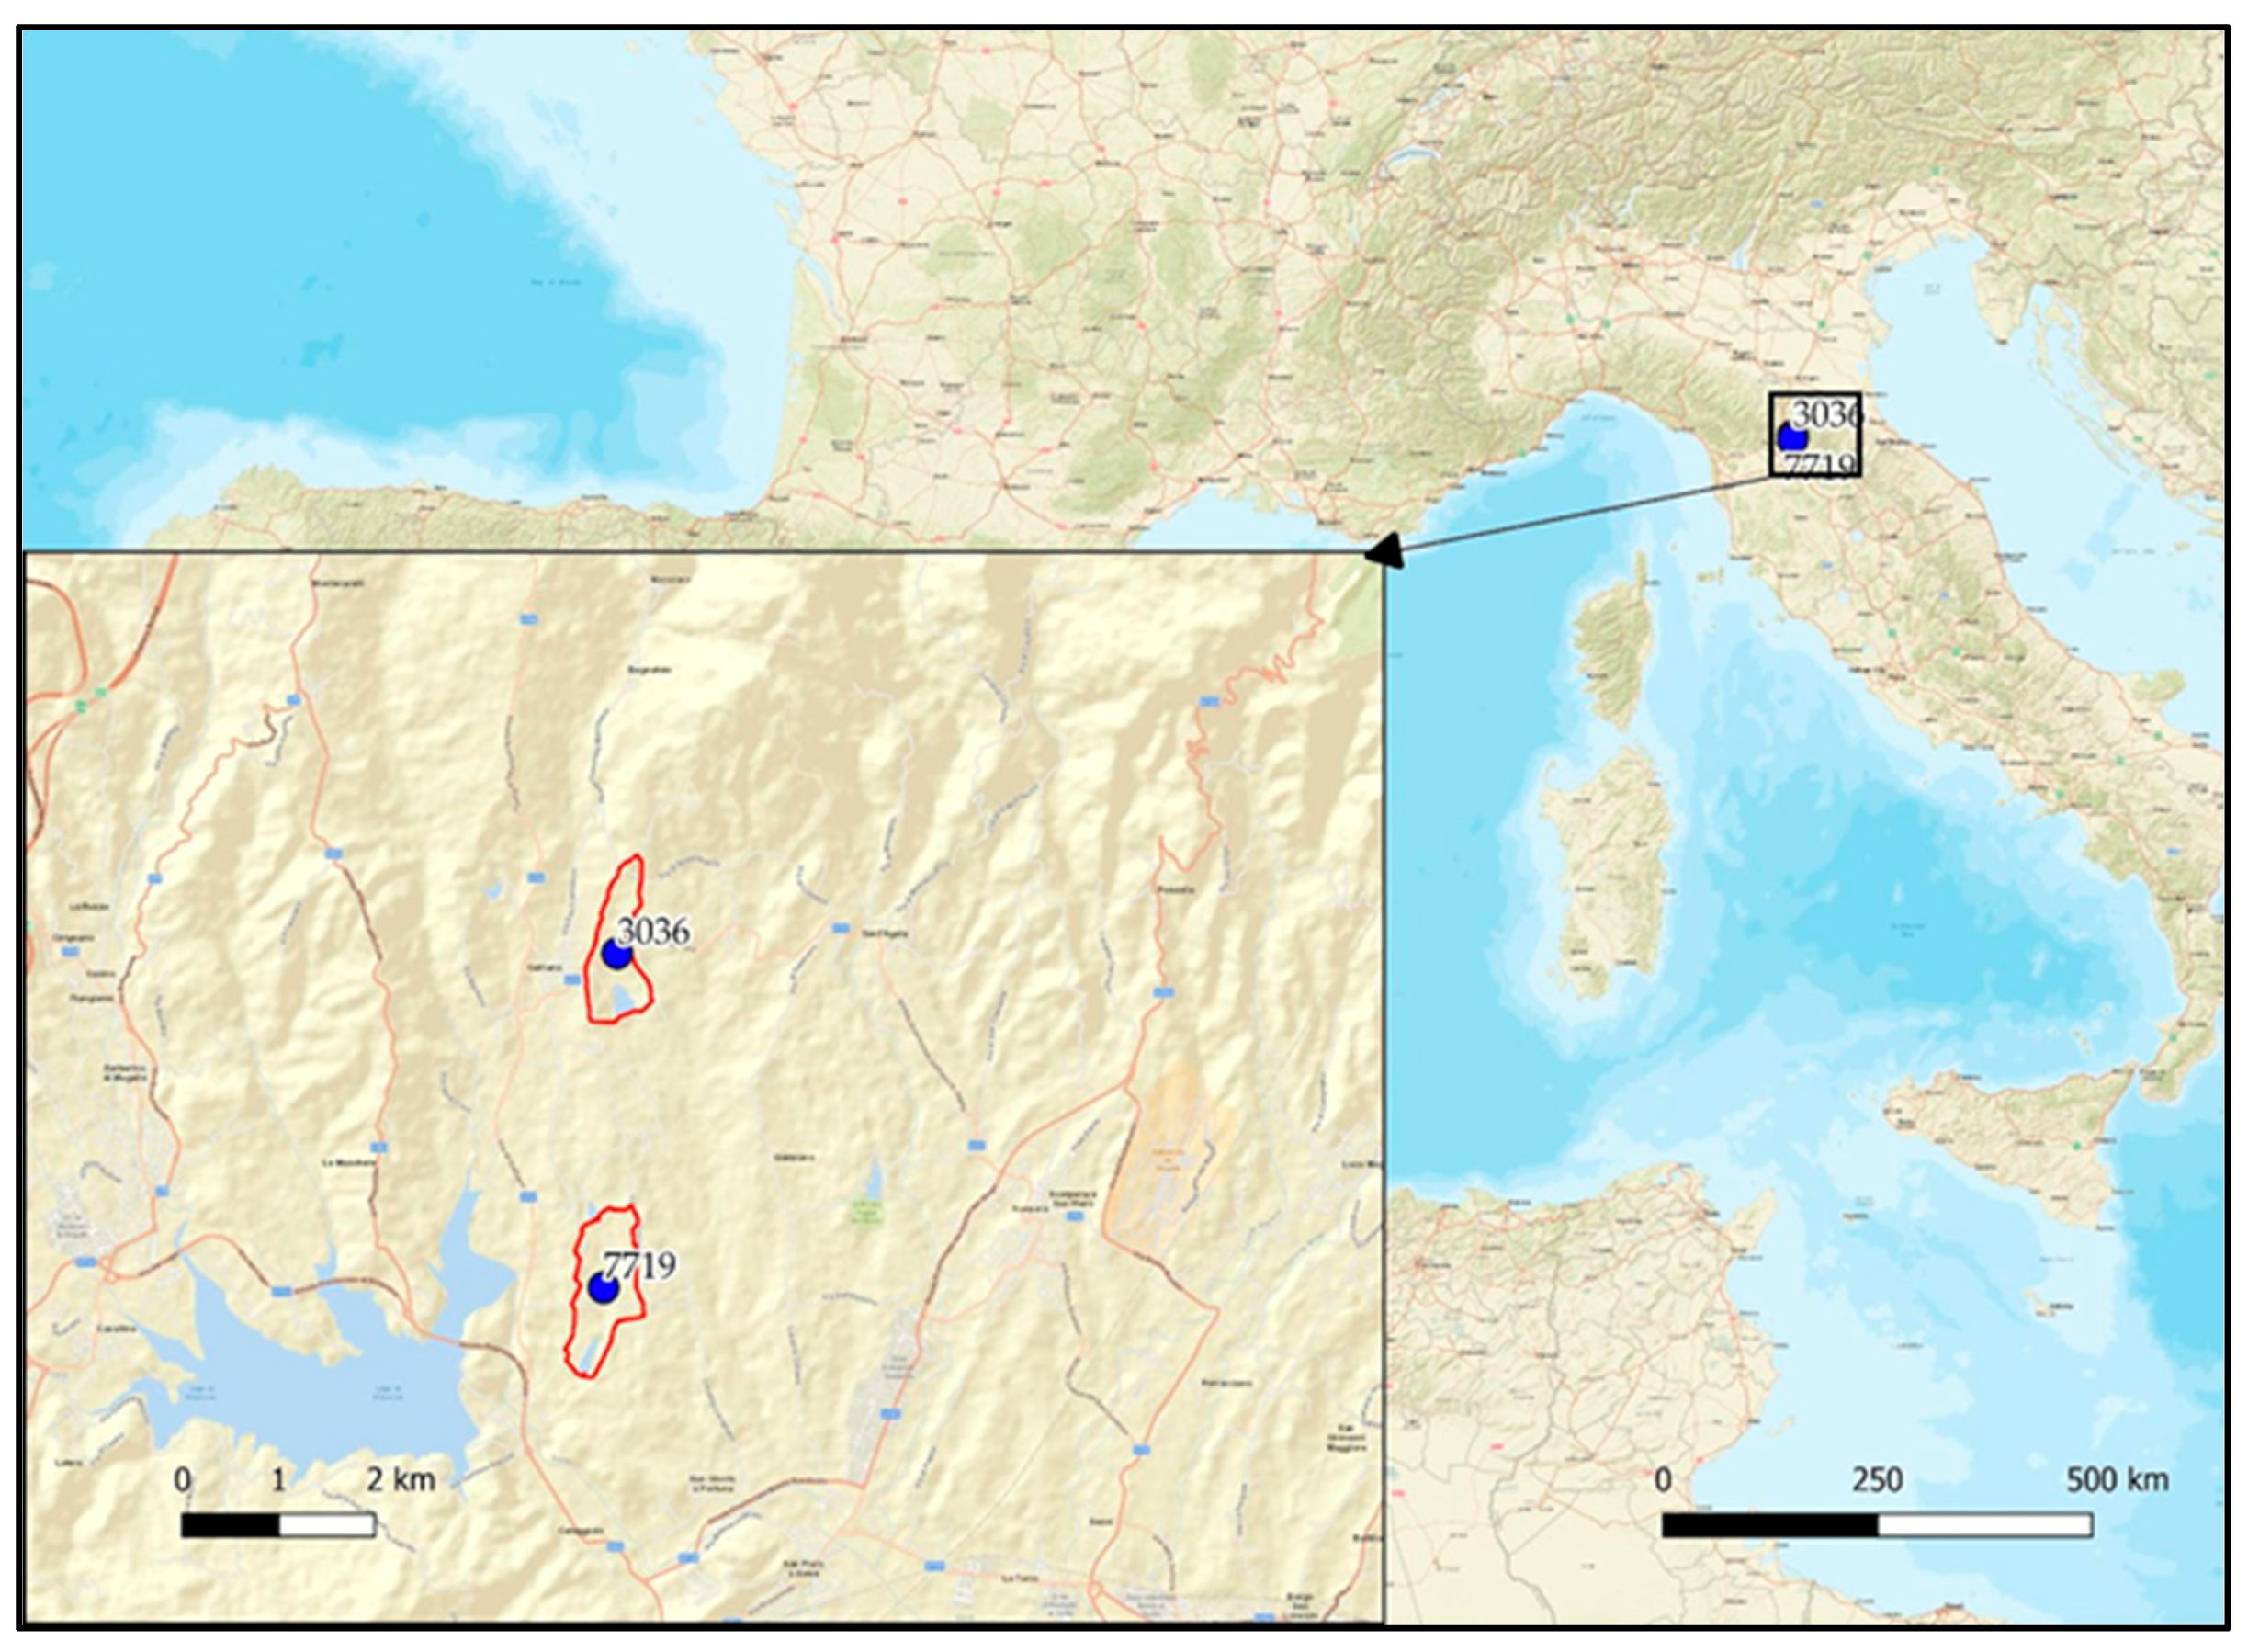
Figure 2.
Example of tillage using a soil aerator ripper in pasture and following keyline design.
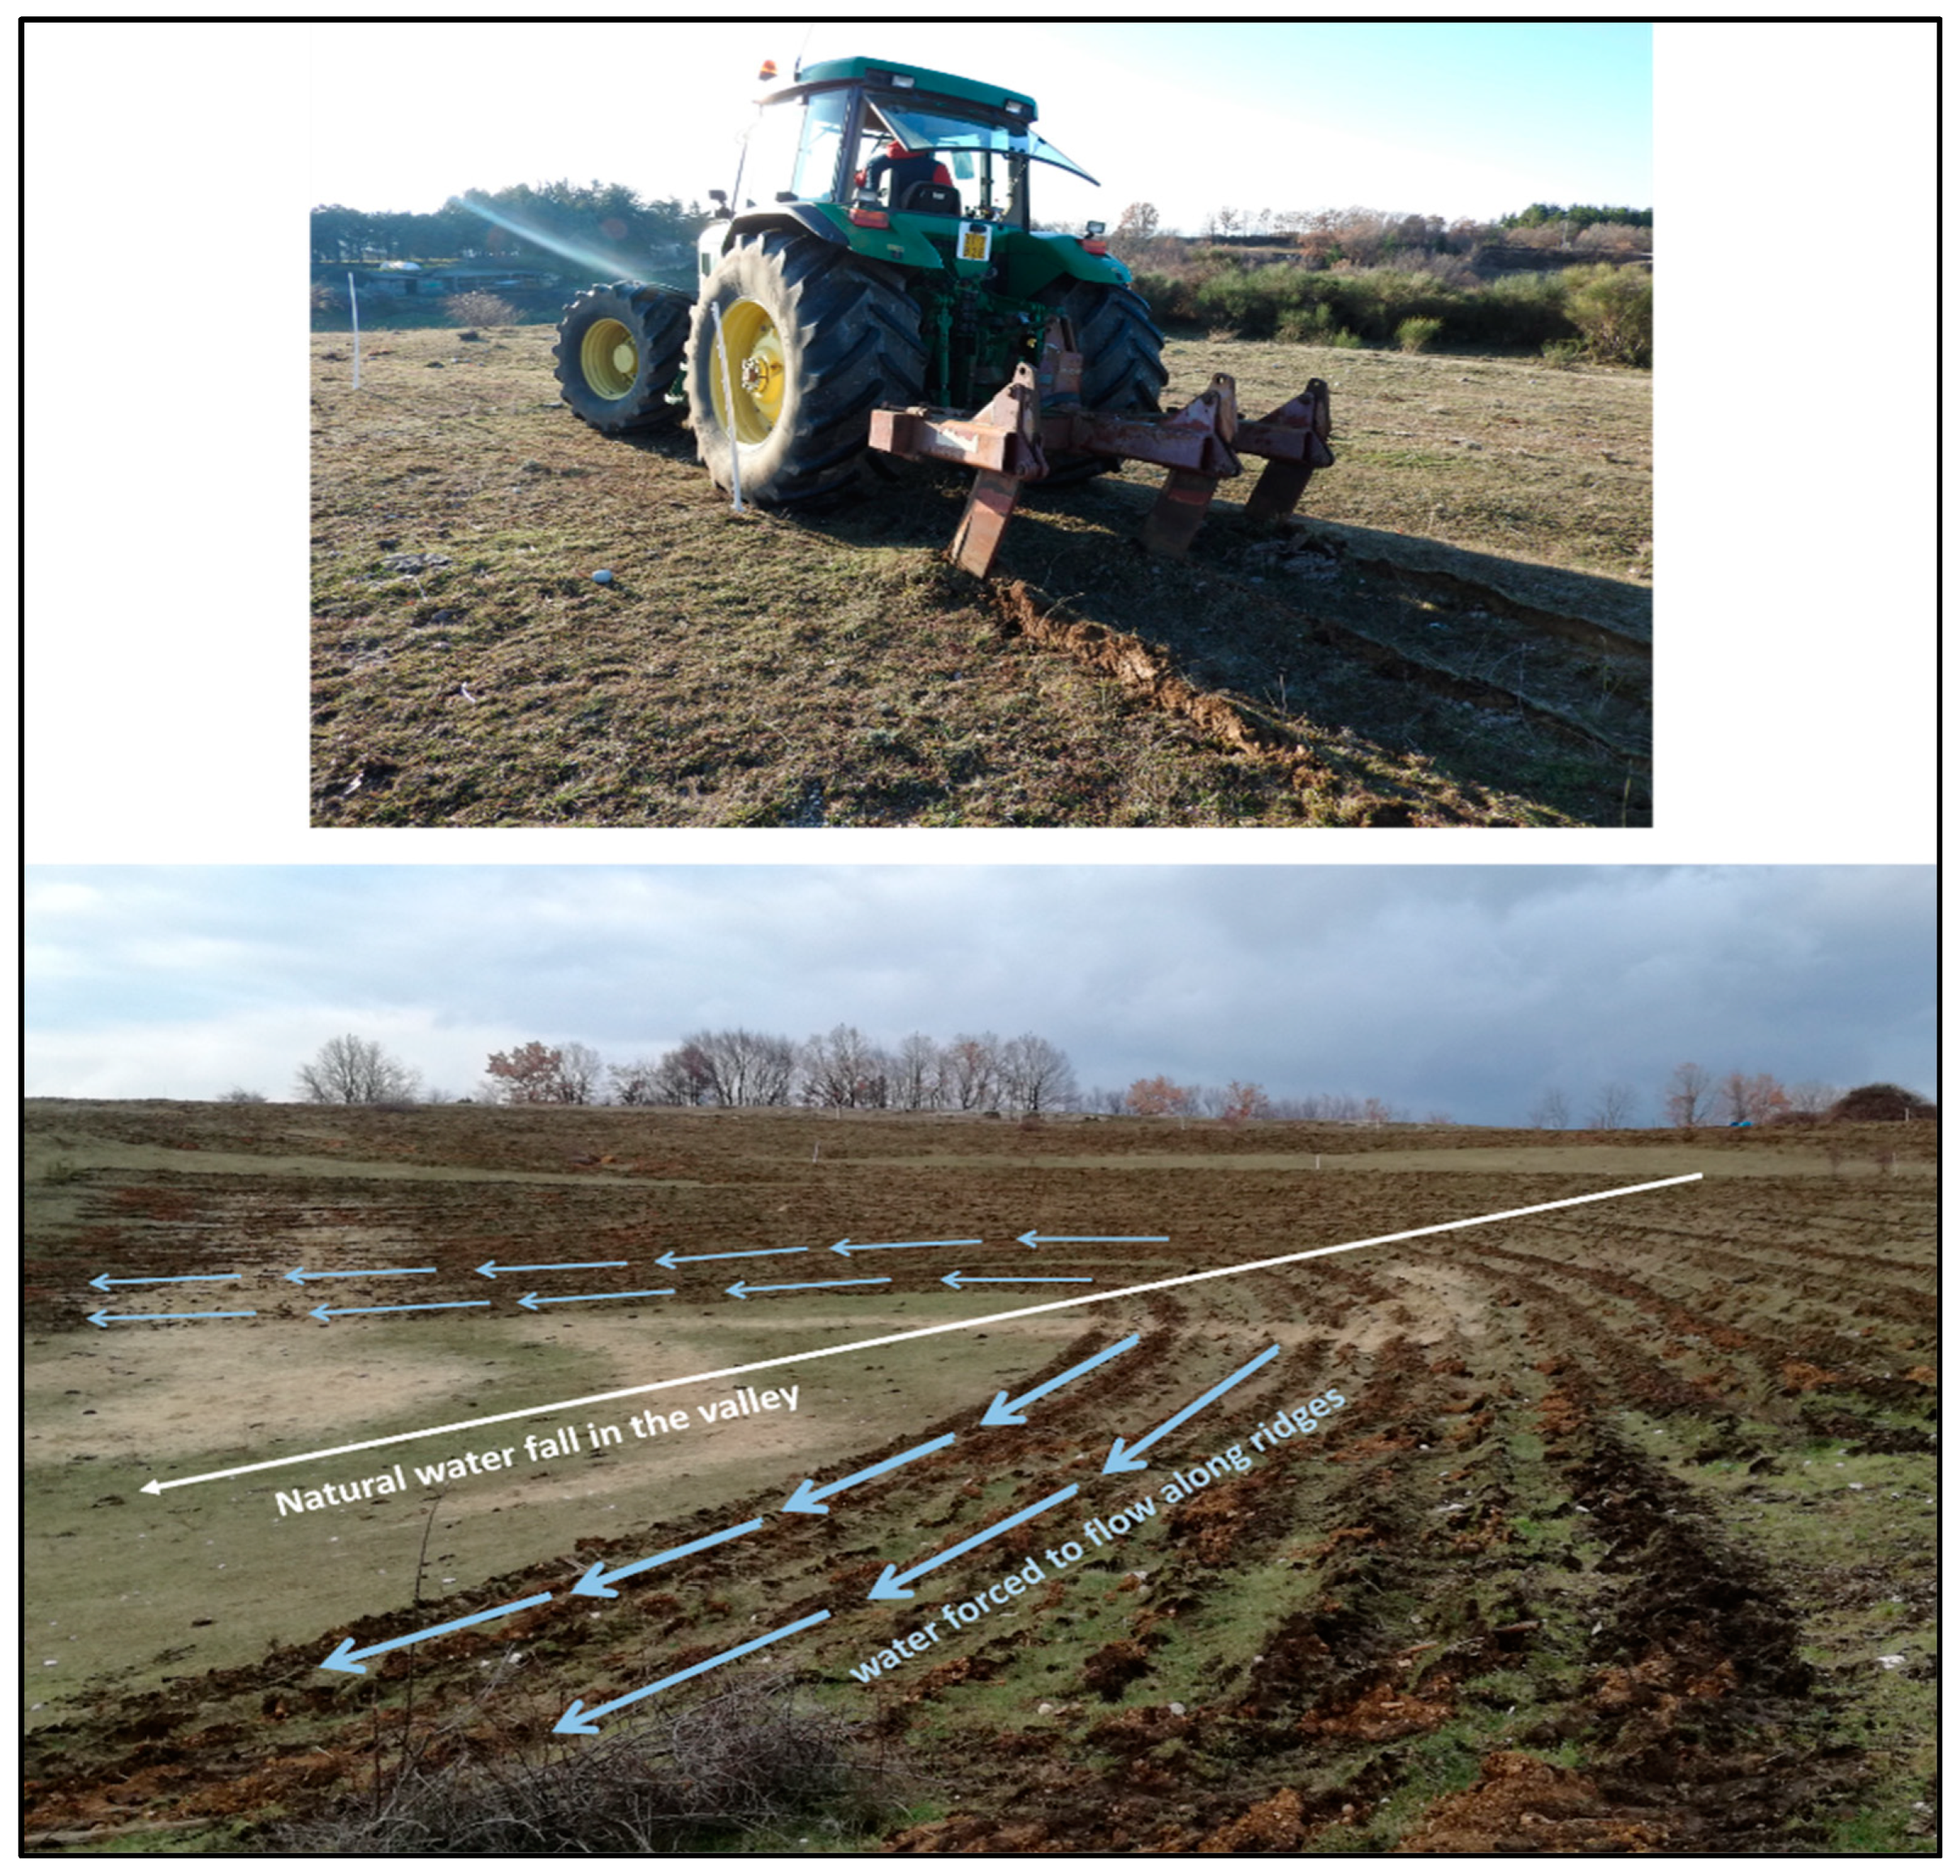
Figure 3.
Arrangement of keylines in arable land.

Figure 4.
Topographic Wetness Index (TWI) maps with and without the keylines for basin 3036.

Figure 5.
Topographic Wetness Index (TWI) maps with and without the keylines for basin 7719.
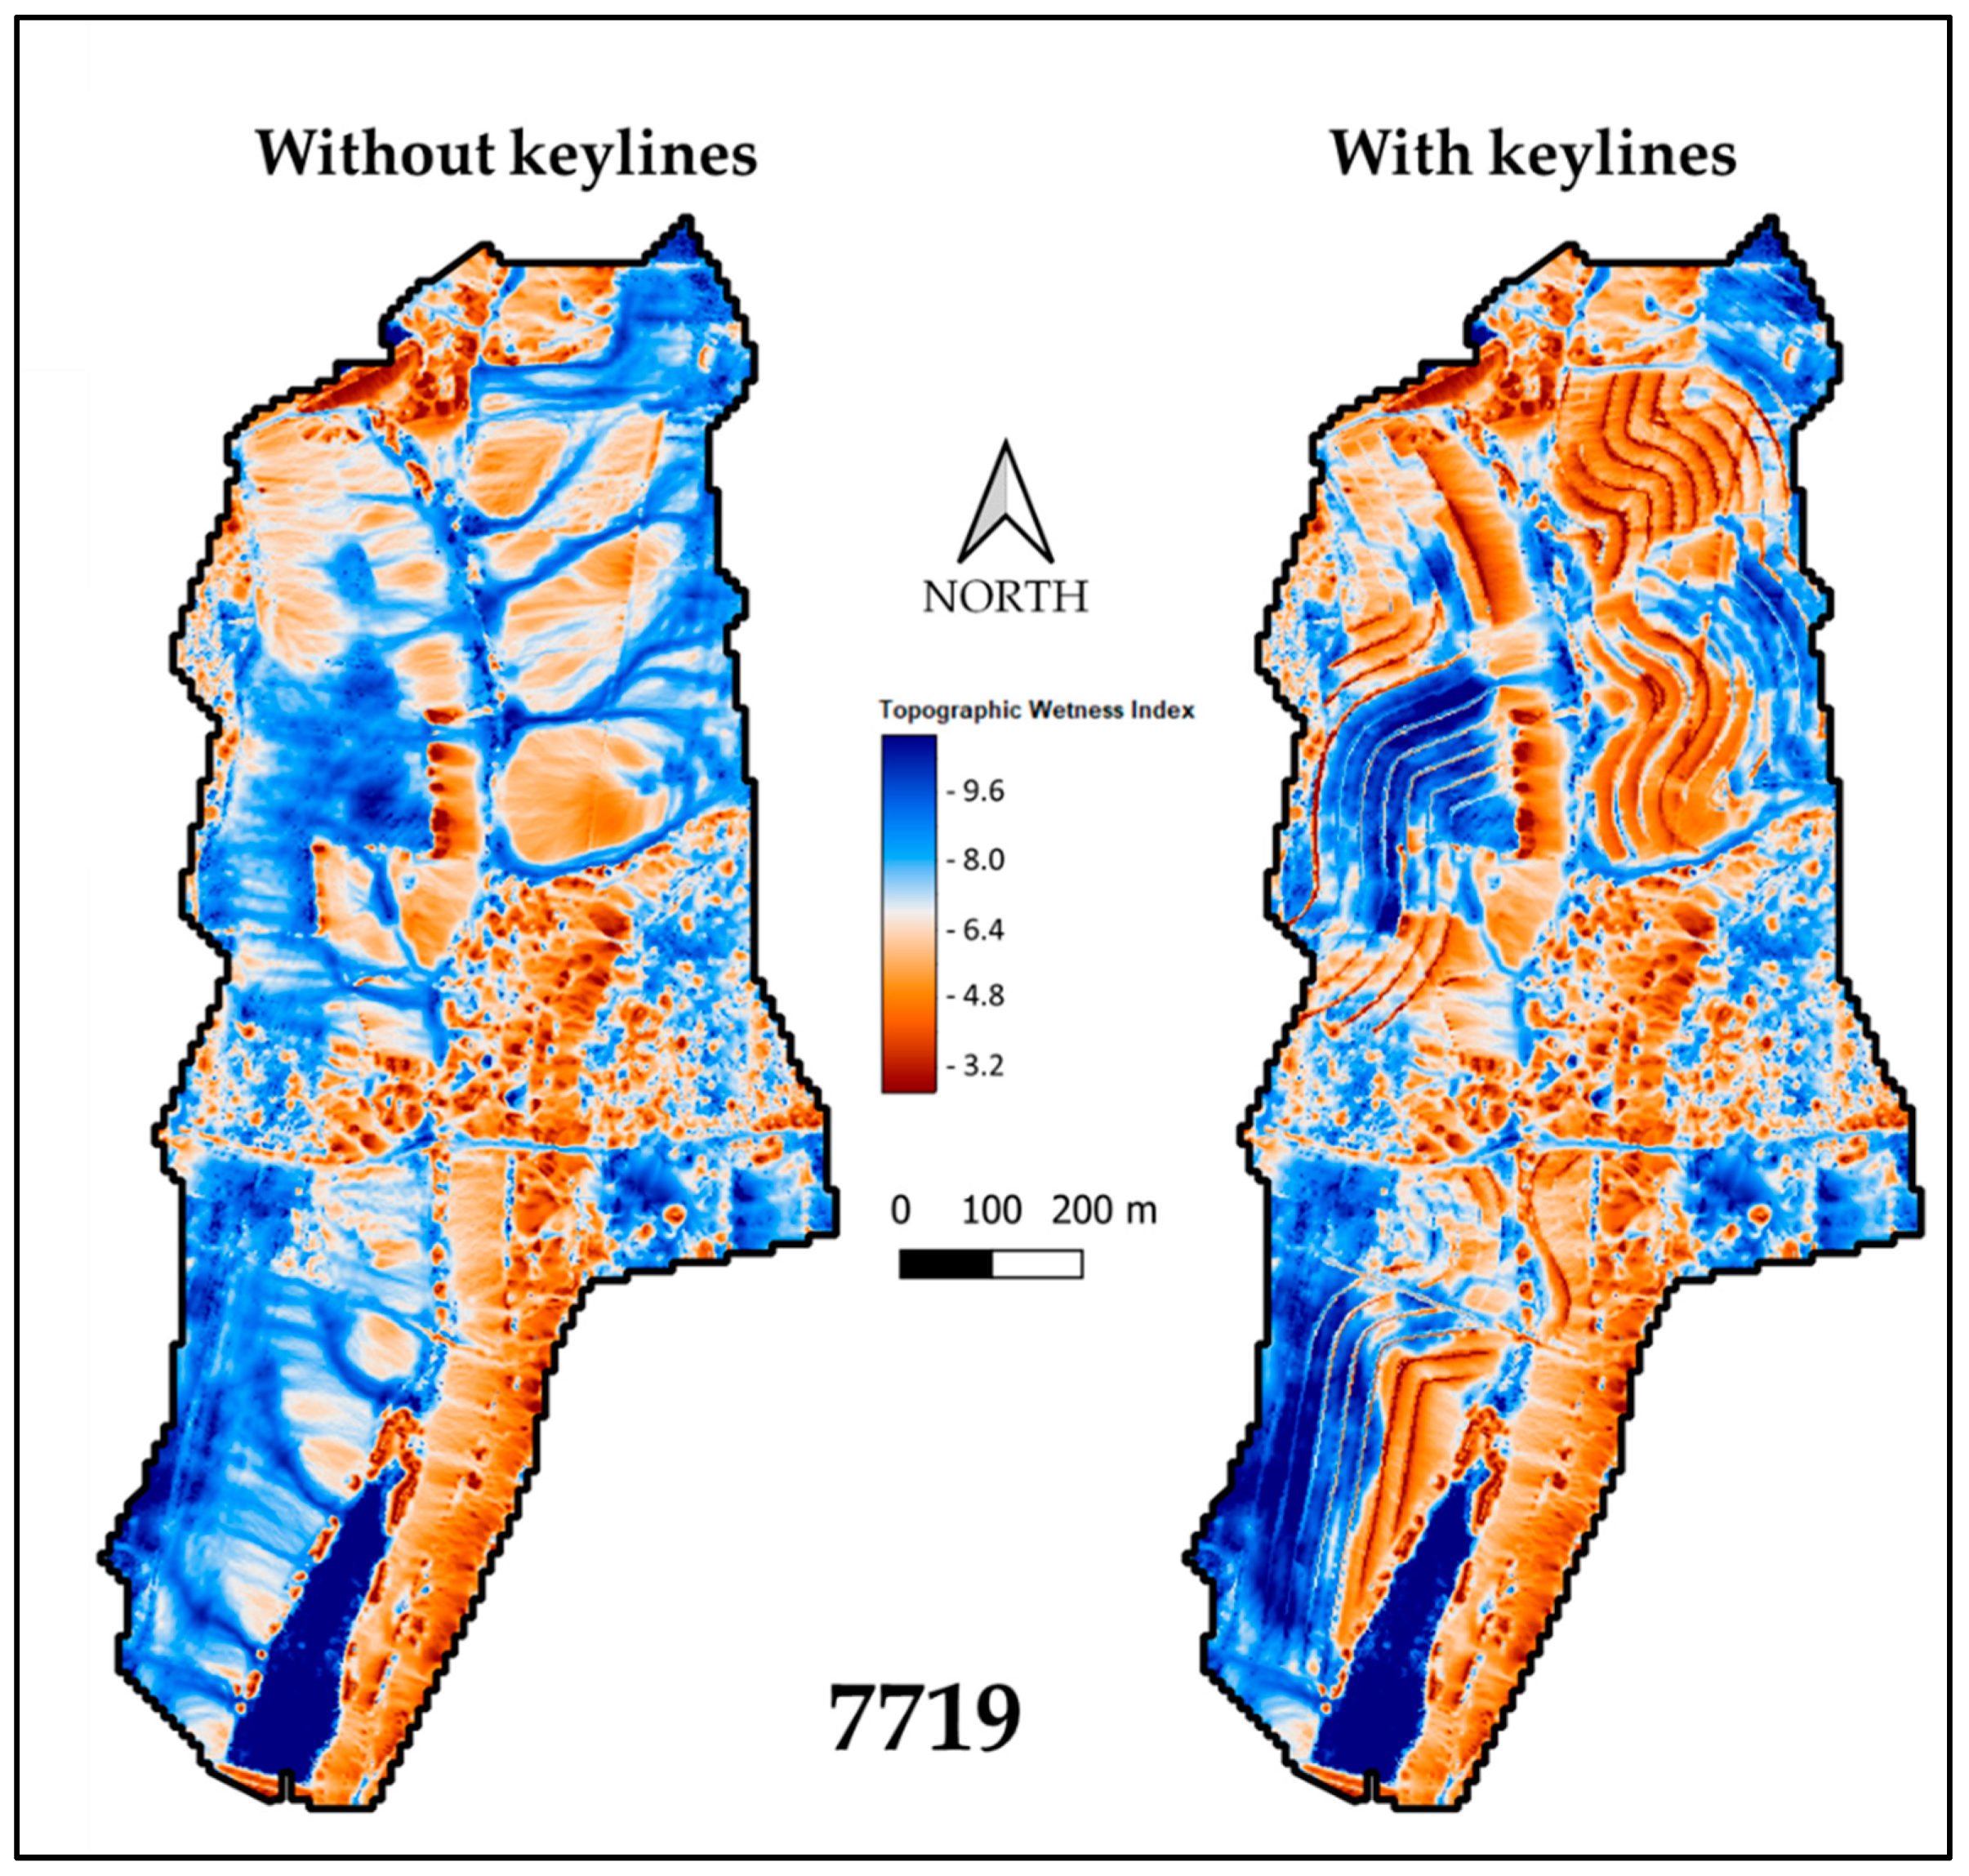
Figure 6.
Water discharge (SIMWE) maps with and without the keylines for basin 3036.
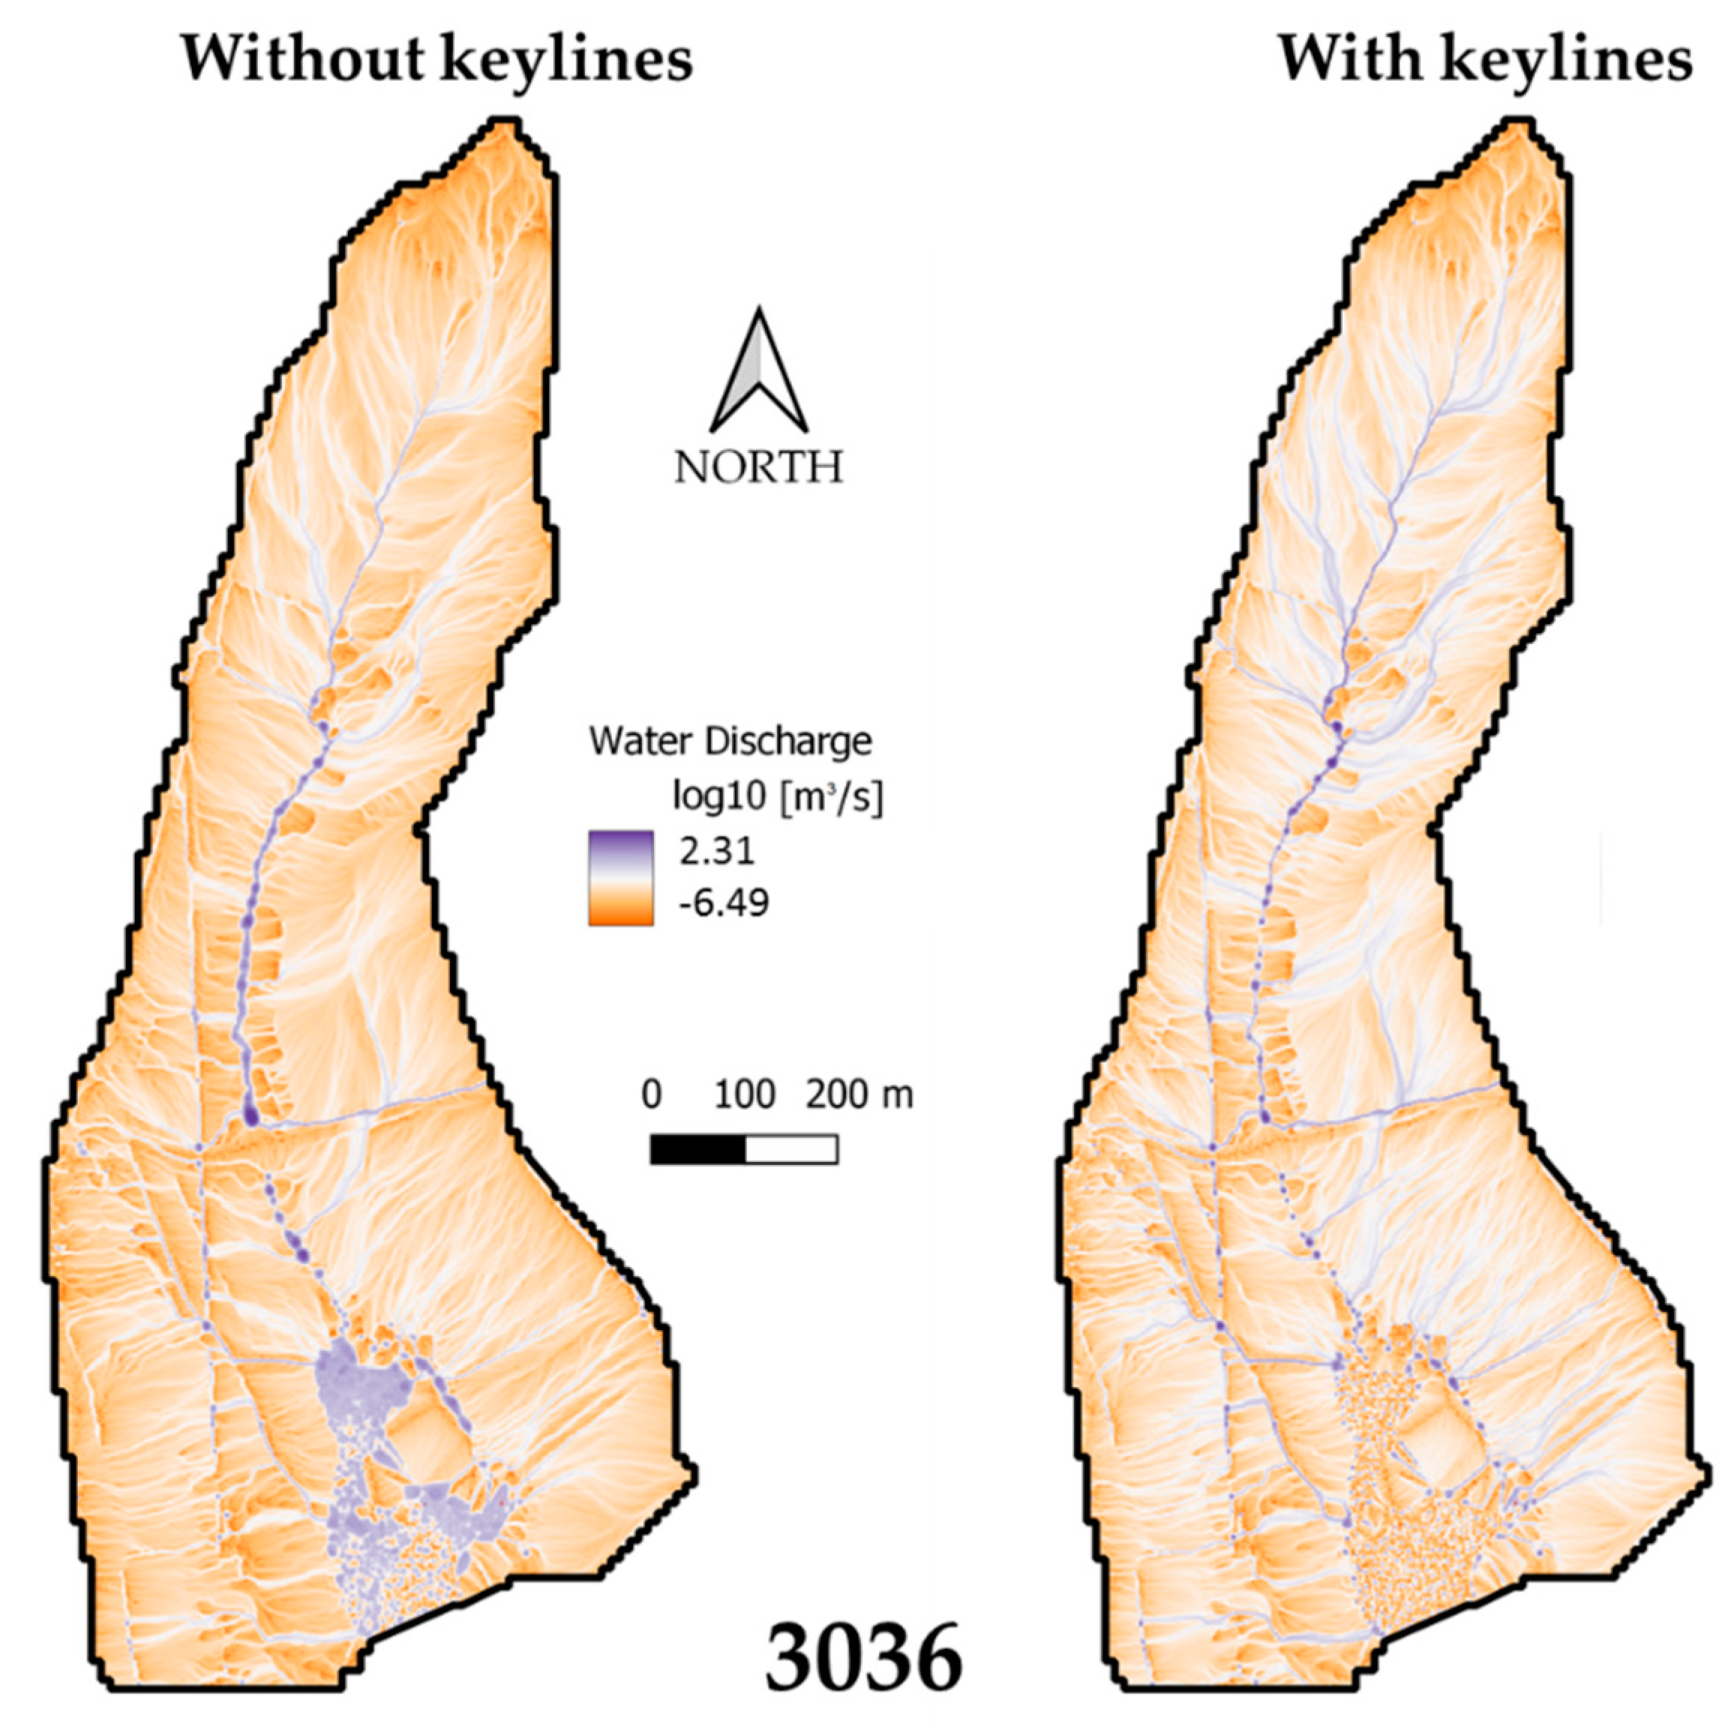
Figure 7.
Water discharge (SIMWE) maps with and without the keylines for basin 7719.

Table 1.
Main results obtained from the analysis with the SIMWE model (UM: unit of measurement).
| ID Basin | UM | 3036 | 7719 |
|---|---|---|---|
| Pixel | number | 168,120 | 217,619 |
| Basin Area | m2 | 67.25 | 87.04 |
| Total keylines | m | 15,470.3 | 15,356.6 |
| Keyline density | m/ha | 230.1 | 176.4 |
| Mean Water Discharge without keylines | m3/s | 0.178 | 0.124 |
| Mean Water Discharge with keylines | m3/s | 0.164 | 0.108 |
| Reduction | % | 8.18 | 12.34 |
Disclaimer/Publisher’s Note: The statements, opinions and data contained in all publications are solely those of the individual author(s) and contributor(s) and not of MDPI and/or the editor(s). MDPI and/or the editor(s) disclaim responsibility for any injury to people or property resulting from any ideas, methods, instructions or products referred to in the content. |
© 2022 by the authors. Licensee MDPI, Basel, Switzerland. This article is an open access article distributed under the terms and conditions of the Creative Commons Attribution (CC BY) license (https://creativecommons.org/licenses/by/4.0/).
Share and Cite
MDPI and ACS Style
Giambastiani, Y.; Biancofiore, G.; Mancini, M.; Di Giorgio, A.; Giusti, R.; Cecchi, S.; Gardin, L.; Errico, A. Modelling the Effect of Keyline Practice on Soil Erosion Control. Land 2023, 12, 100. https://doi.org/10.3390/land12010100
AMA Style
Giambastiani Y, Biancofiore G, Mancini M, Di Giorgio A, Giusti R, Cecchi S, Gardin L, Errico A. Modelling the Effect of Keyline Practice on Soil Erosion Control. Land. 2023; 12(1):100. https://doi.org/10.3390/land12010100
Chicago/Turabian StyleGiambastiani, Yamuna, Gherardo Biancofiore, Matteo Mancini, Antonio Di Giorgio, Riccardo Giusti, Stefano Cecchi, Lorenzo Gardin, and Alessandro Errico. 2023. "Modelling the Effect of Keyline Practice on Soil Erosion Control" Land 12, no. 1: 100. https://doi.org/10.3390/land12010100
Note that from the first issue of 2016, this journal uses article numbers instead of page numbers. See further details here.