Article

Appraisal of Building Price in Urban Area Using Light Detection and Ranging (LiDAR) Data in Depok City

1
Geography Department, Faculty of Mathematic and Natural Sciences, University of Indonesia, Depok 16424, Indonesia
2
Architecture Department, Faculty of Engineering, University of Indonesia, Depok 16424, Indonesia
*
Author to whom correspondence should be addressed.
Land 2022, 11(8), 1320; https://doi.org/10.3390/land11081320
Submission received: 13 July 2022 / Revised: 11 August 2022 / Accepted: 12 August 2022 / Published: 16 August 2022

Abstract

:
Economic growth and its demographic benefits have enhanced the high rate of urbanization in Indonesia, although property tax revenues are still low compared to G20 countries. This low performance is partly due to the limited capacity of local governments, regarding the determination of building values for tax calculations. To improve local government tax performance, LIDAR mapping is capable of being used for quickly estimating the price of a building. Therefore, this study aimed to determine the patterns by which the spatial differences in building price values influence the tax databases and LiDAR mapping results. Based on this mapping process, the present building site size in high-density housing areas was on average 1.66-times larger than those in the Depok City Government tax database. Meanwhile, the sites in medium-density housing and trade/service areas were 1.35- and 1.08-times wider, respectively. Using a LiDAR 3D model, the observed level of construction was much higher in the highly-urbanized area compared to the price in the Depok City Government tax database. This was based on the construction cost of a building per square meter. Regarding these results, the building prices in high- and medium-density areas, as well as the trade/service area, were nine, six, and three-times higher, respectively.

1. Introduction

Indonesia is gradually being transformed through the influence of urbanization, with the growth and development of the economy and the middle-class population. According to the World Bank [1,2], the economic growth of the country has been influenced by the development of the middle-class population. Since 2002, the consumption of this group has increased by 12% annually, or almost half of all Indonesian household utilization. The middle-class population is also developing faster than any other group, presently containing 52 million people. This population mostly lives in urban agglomeration areas, especially on the island of Java. Approximately 13 million people also reside in the Greater Jakarta area, namely Jakarta, Bogor, Depok, Tangerang, and Bekasi (Jabodetabek). This is equivalent to 31% of the middle-class population living in urban areas or 24% of the national medium-density housing. Furthermore, Indonesia’s economic prospects have been boosted by this demographic benefit, with 64% of the population expected to be productive between 2020 and 2025, according to the Central Statistics Agency. This expectation emphasizes the potential for economic growth.
At the proclamation of independence in 1945, only one in eight people reportedly lived in cities and towns. This showed that the country’s urbanized population was around 8.6 million people or equivalent to the present density of London. However, approximately 151 million people (56%) presently live in urban areas or about 18-times the population of London. The urbanization rate is expected to continuously increase until 2045, with more than 70% of Indonesians living in these areas [1,2]. The growth and development of the middle-class and productive age population, as well as the high rate of urbanization, is also related to the demand for property. In 2020, approximately 6.9 million households had no place to live, with 57% of the population living in urban areas [3]. Regarding the GJ (Greater Jakarta) area, the sites outside Jakarta have experienced faster growth than the interior parts. Meanwhile, the proportion of this population has decreased by 5%, compared to those living in the Greater Jakarta area [4]. This indicates that the development in demand for property is expected to shift from Jakarta to suburban areas, such as Depok City. Besides the high backlog in Indonesia, government policies related to property ownership have also increased the demand for property. As a derivative of Law no. 11 of 2020 concerning Job Creation, the Government Regulation (PP) Number 18 of 2021 was issued, regarding management and land rights, flat units, and site registration. This provides an opportunity for foreign nationals to own property as apartment units. In this case, the government also constructed several transportation infrastructures such as new toll roads and light rapid transit (LRT), to improve the connectivity between the regions in GJ (Greater Jakarta); as such, Depok City is presently receiving commuters, especially from Jakarta and Bogor [5].
Based on a high rate of urbanization, the fiscal capacity of the local government is not sufficient, due to the non-optimal utilization of Land and Building Tax (PBB), which is a source of revenue in Indonesia [6]. According to BPS 2022 [7], the national income from PBB was approximately IDR 14.83 trillion in 2021. This proved that the ratio of PBB to Indonesia’s GDP was only around 0.57%, one of the lowest values among the G20 countries. Irrespective of the low yield, Indonesia is still better than Mexico, Turkey, and India. Moreover, the PBB revenue is likely to increase by optimizing the cadastral coverage, as well as tax rates, especially for urban areas, and collection levels or collectability [1]. The tax database update is also an important factor in optimizing PBB revenues. Based on Law No. 1 of 2022 concerning the financial relations between the central and regional governments, this database has been updated every three years or annually for some areas, according to specific regional developments. However, the local governments experienced difficulties in meeting the obligations of the law, regarding their limited ability to update the tax database. For PBB, the sales value of tax objects (NJOP) in the tax database was also lower than that of the present price. According to the World Bank, local governments need to conduct training and development programs in tax collection and management, irrespective of the utilization of field survey methods to determine the value of the tariff object. To prepare an effective cadastral system, the use of satellite imagery, drones, and automation methods has also been widely carried out in various regions [8], with advanced 3D LiDAR remote-sensing technology being developed to detect the appearance and shape of objects on the earth’s surface. This technology is used to provide a breakthrough in tax administration, which focuses on the accuracy, speed, and relatively cheap costs of determining the NJOP (value of tax objects). These are based on minimizing the direct identification that consumes time and effort. [9]. Therefore, this study aimed to determine the patterns by which the spatial differences in building price value influences the tax database and LiDAR mapping outcomes.

2. Study Areas and Materials
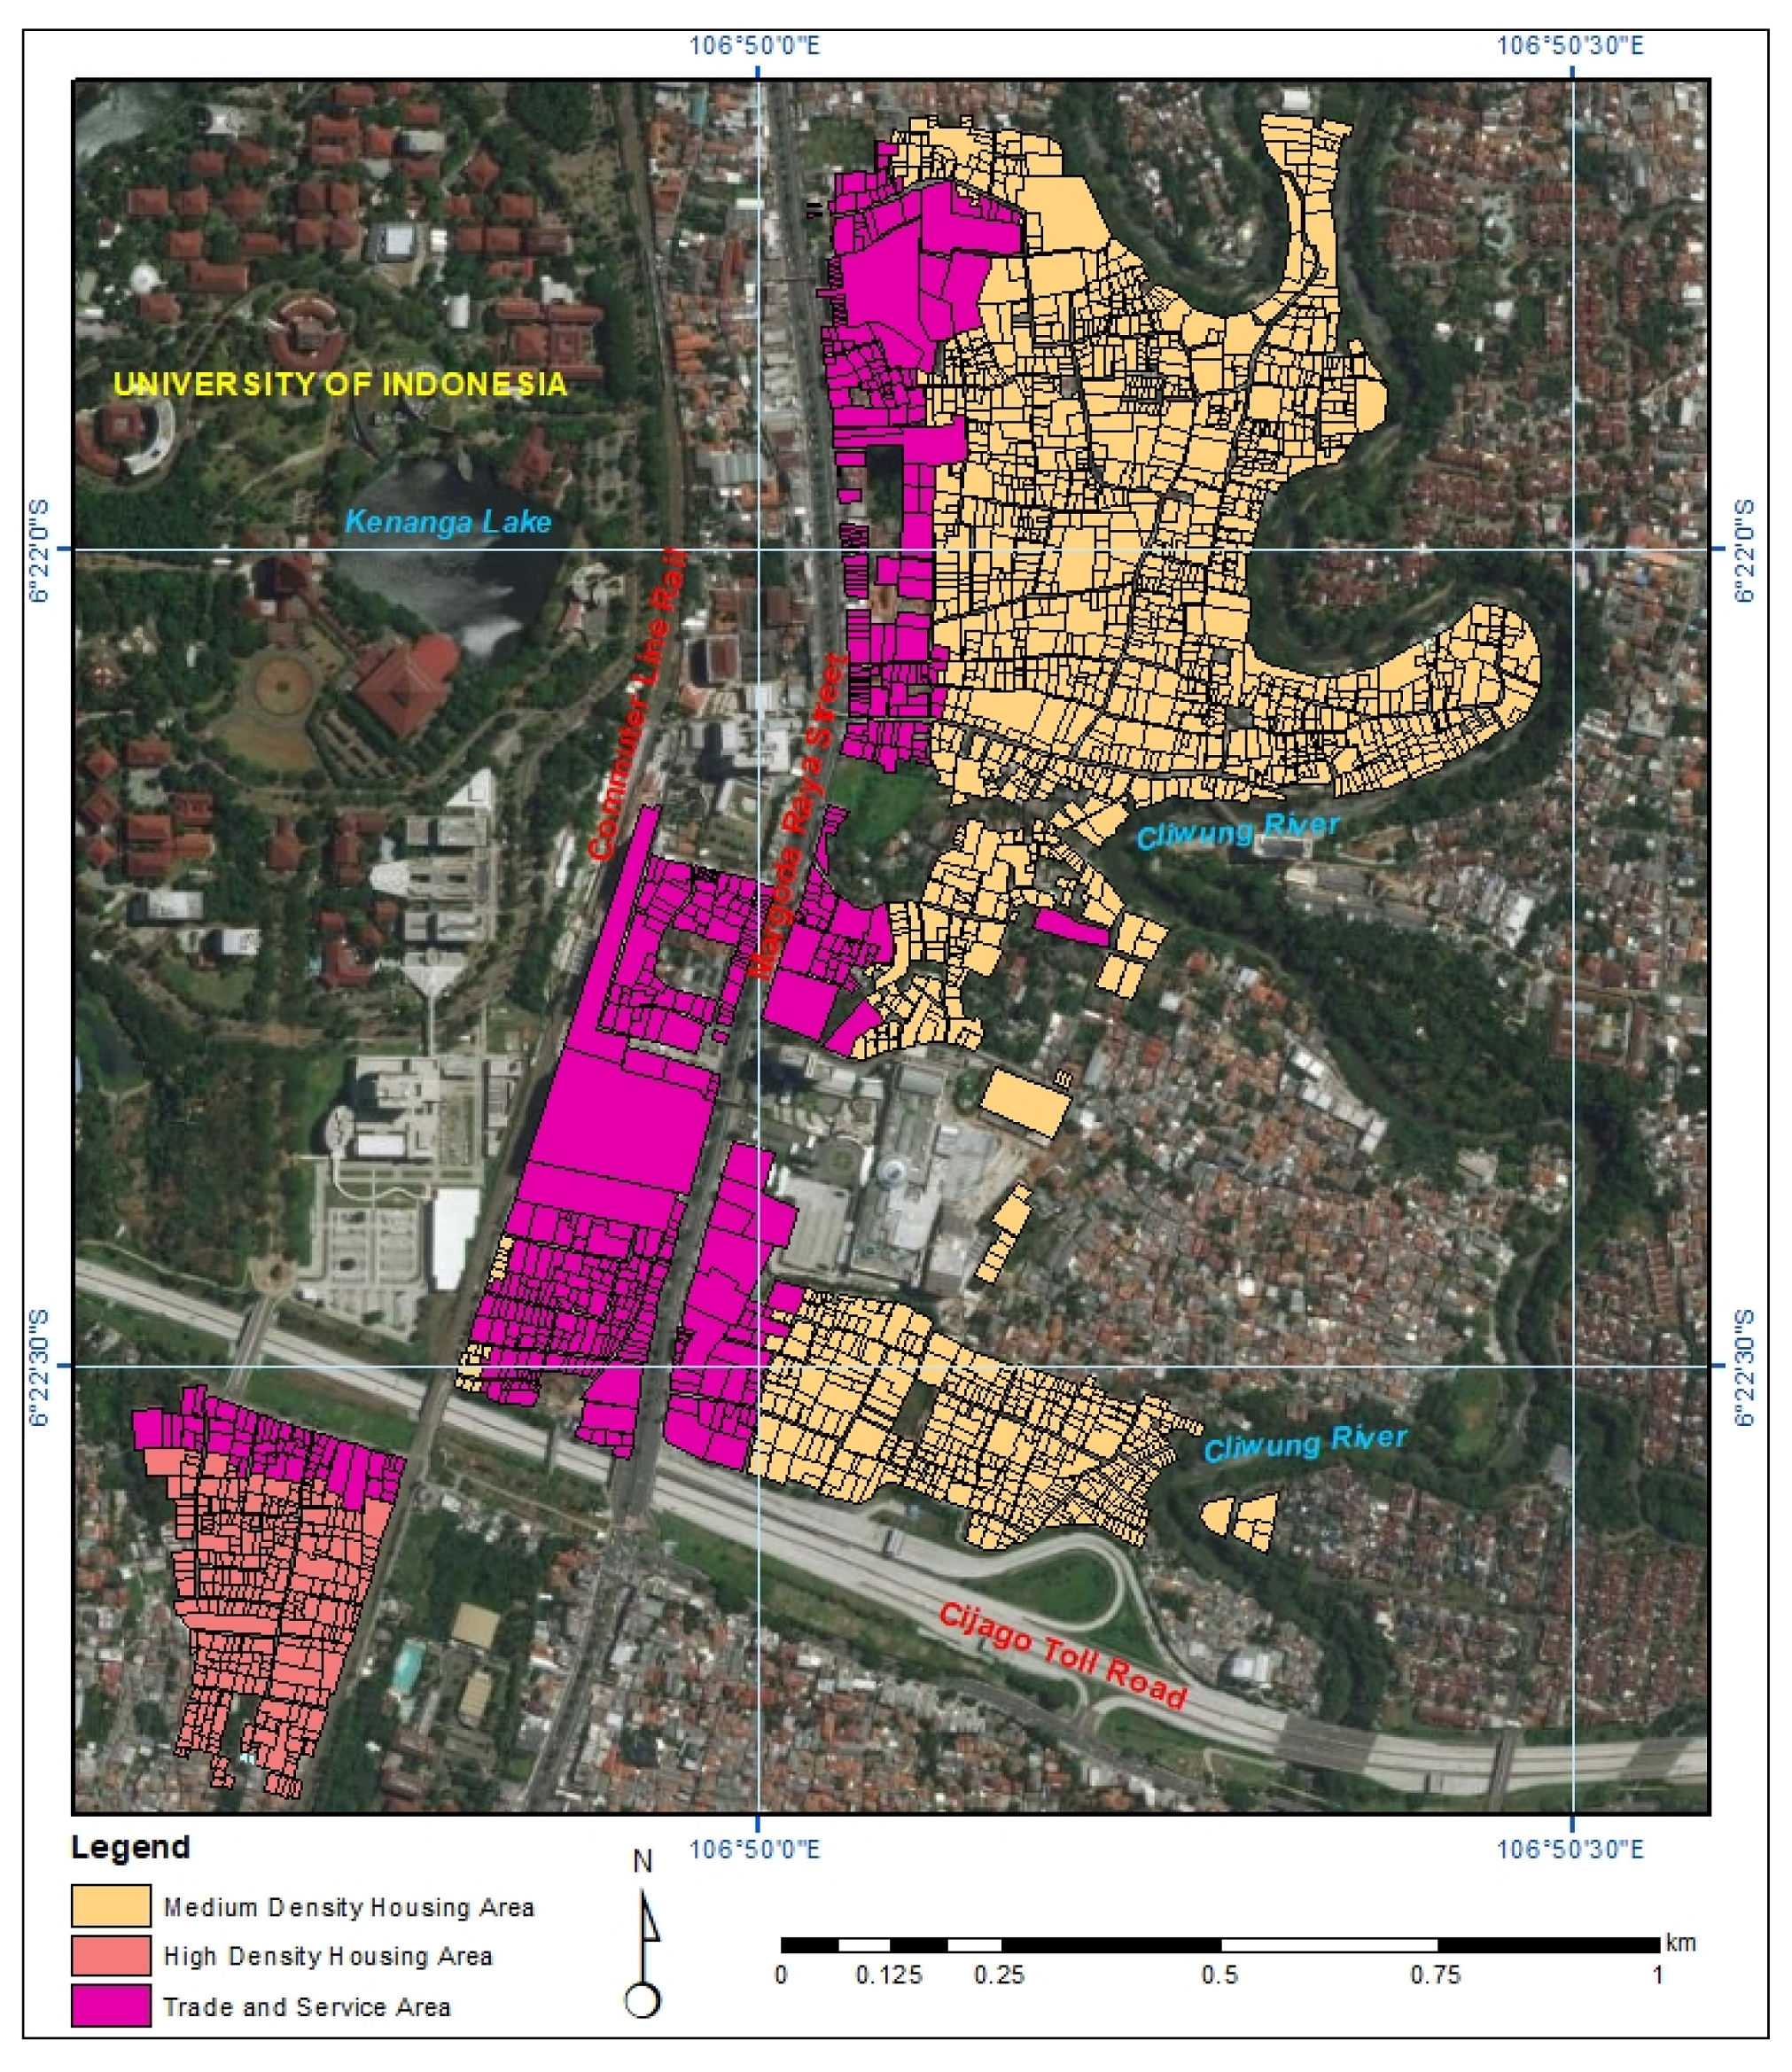
2.1. Study Areas

This study was conducted in Depok City, which is located at 6°18′30″–6°28′ 00″ south latitude and 106°42′30″–106°55′30″ east longitude. The city is also situated at an elevation of 50–140 m above sea level and slopes between 0–25% and is supported by two large rivers, namely the Ci Liwung and Ci Sadane. Furthermore, Depok City is one of the development centers in West Java Province, and is directly adjacent to DKI Jakarta and located within the Jabodetabek area. The complexity and integration of this area have caused the massive urbanization process and positively affected the rate of property development. The area of this city is approximately 19,998.49 ha or 199.98 km2, in which 11 sub-districts and 63 urban villages are contained. With limited LiDAR data, the buildings sampled in this study are scattered around various Jalan Margonda areas, such as Pondok Cina and Kemiri Muka Villages. As observed in the 2020–2040 Depok City RTRW Raperda concerning the City Activity Centre System, the present experimental location is included in the area planned as the PPK (Margonda City Service Centre). The distribution of the sampled buildings is shown in Figure 1.

2.2. Data Source

The information utilized in this report was obtained from primary and secondary data. Based on the primary data, various information was acquired through direct field and online surveys. Meanwhile, the secondary data were obtained through the Smart Land-Surveillance System (SLSS), which has copyright with registration number of 000230276, at the Ministry of Law and Human Rights. The data utilized are described in Table 1.

3. Methods

NJOP calculations emphasized the 3D models generated by the LiDAR data obtained from the Smart Land-Surveillance System (SLSS) application. From these data, information on the building area and the number of floors was obtained and validated using field surveys. After the model validation, the real NJOP of the building was then calculated, with an emphasis on the construction costs, due to the present prevailing price. This building cost per square meter was then obtained through a market price survey. From the multiplication of this cost by the building area and the number of floors, the real NJOP was obtained (Figure 2).
To produce information on the building area and floors in the SLSS application, the processing of LiDAR data into a 3D model contained the following 3 steps:
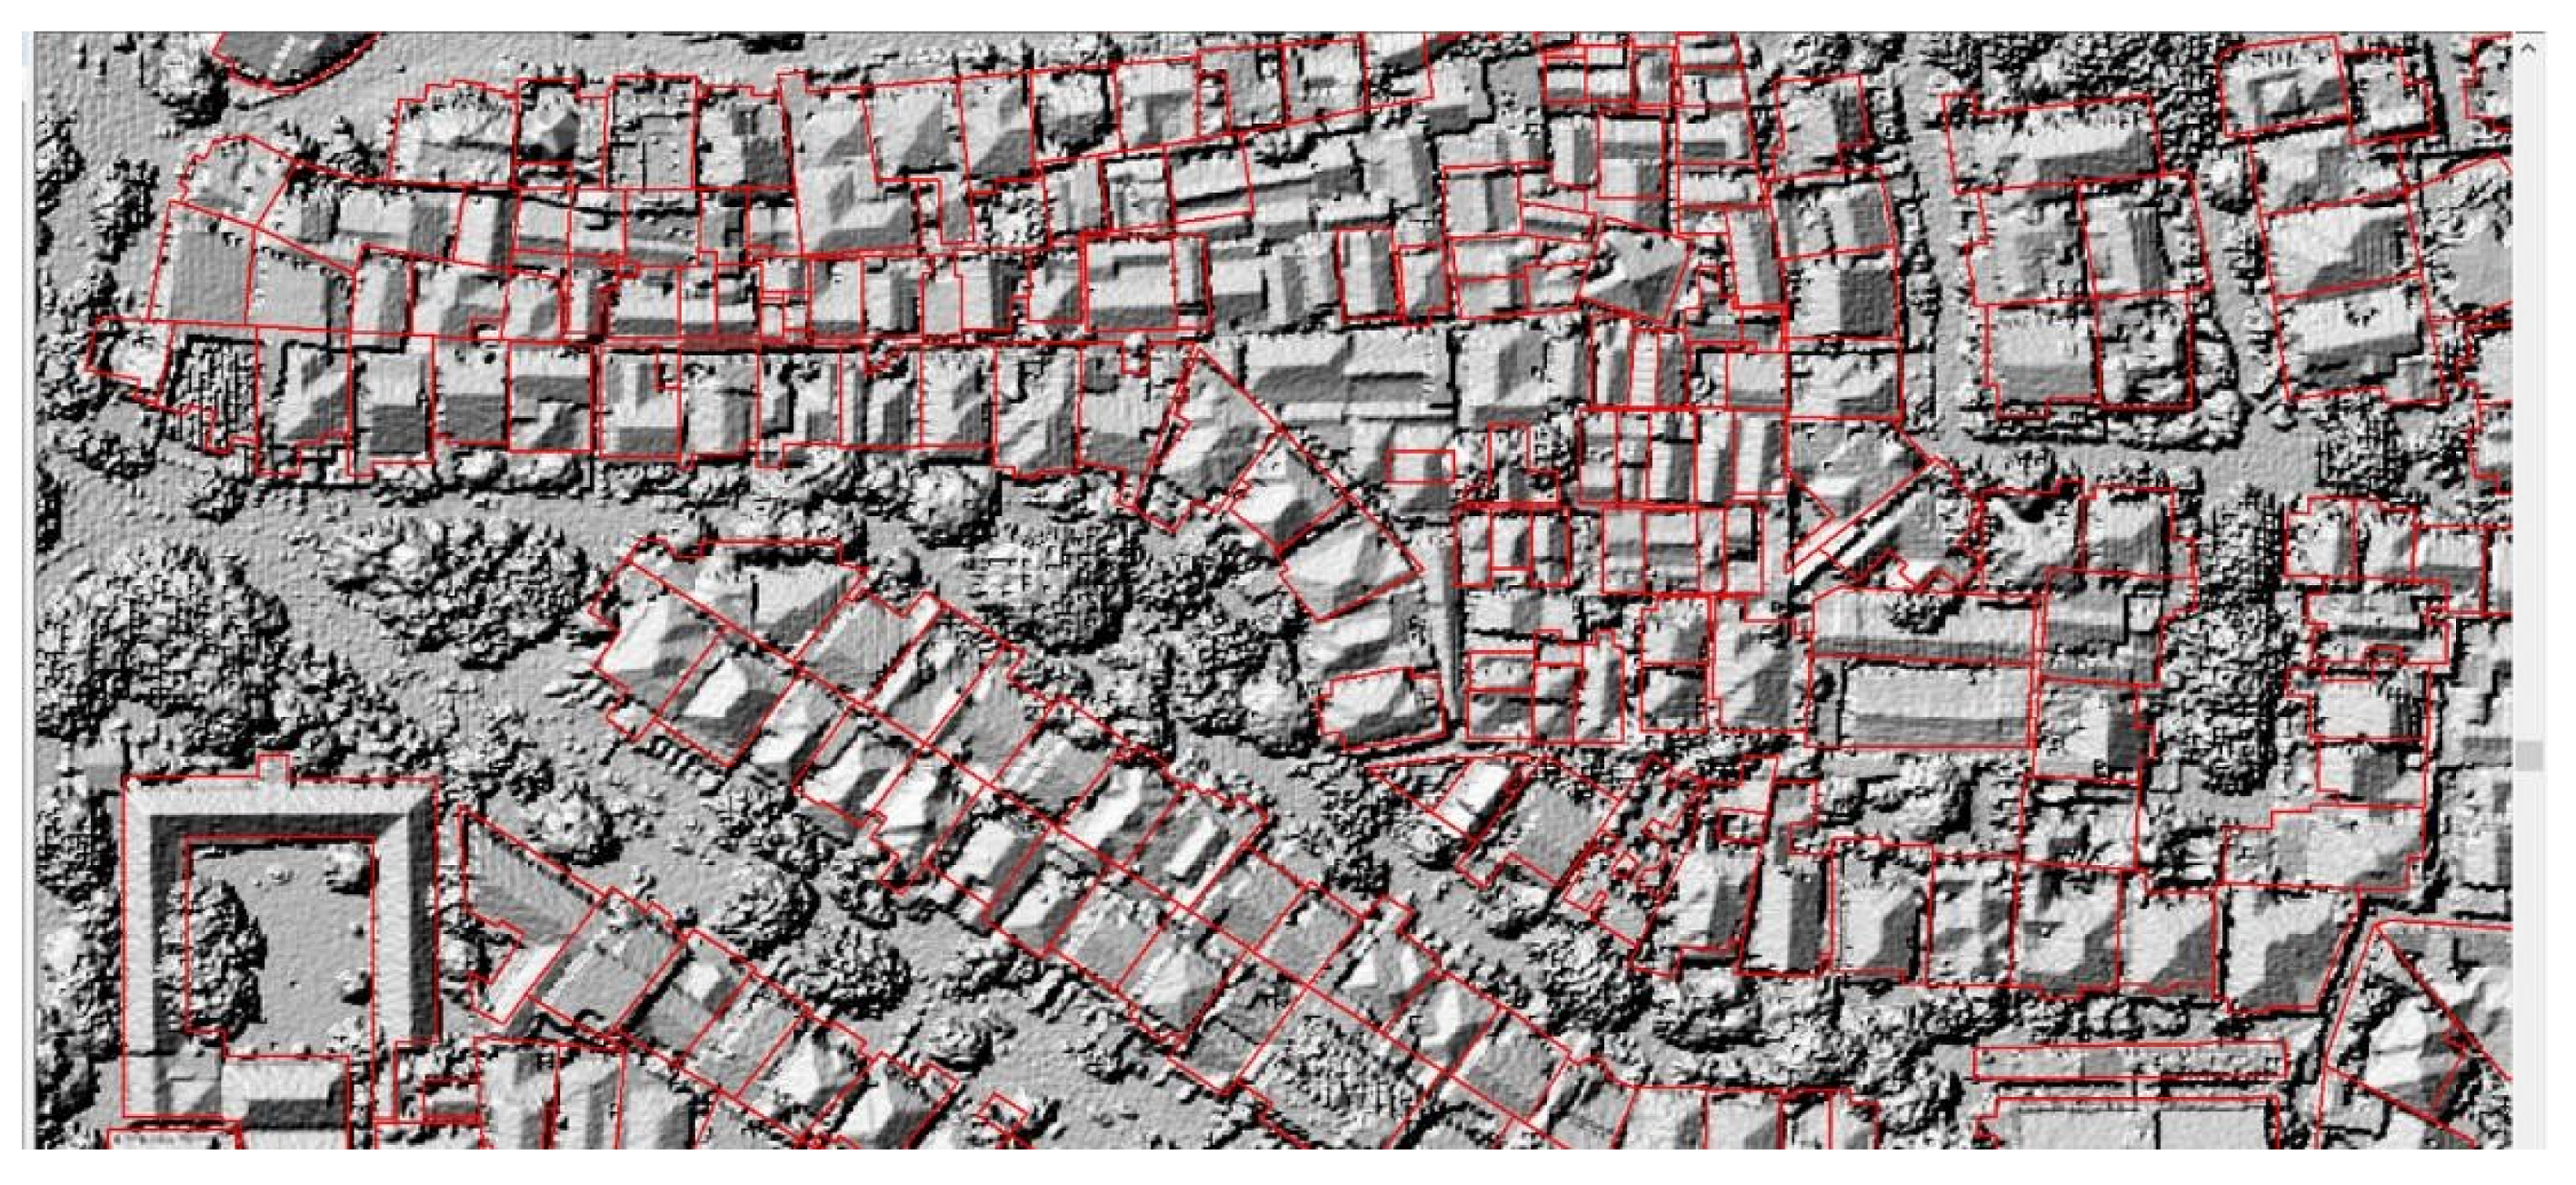
  • Create a digital terrain and surface model (DTM and DSM).
A DTM and DSM show the ground height without and with buildings or other objects. These are then processed into a normalized digital surface model (nDSM), which shows the height of the object above ground level, especially buildings.
2.
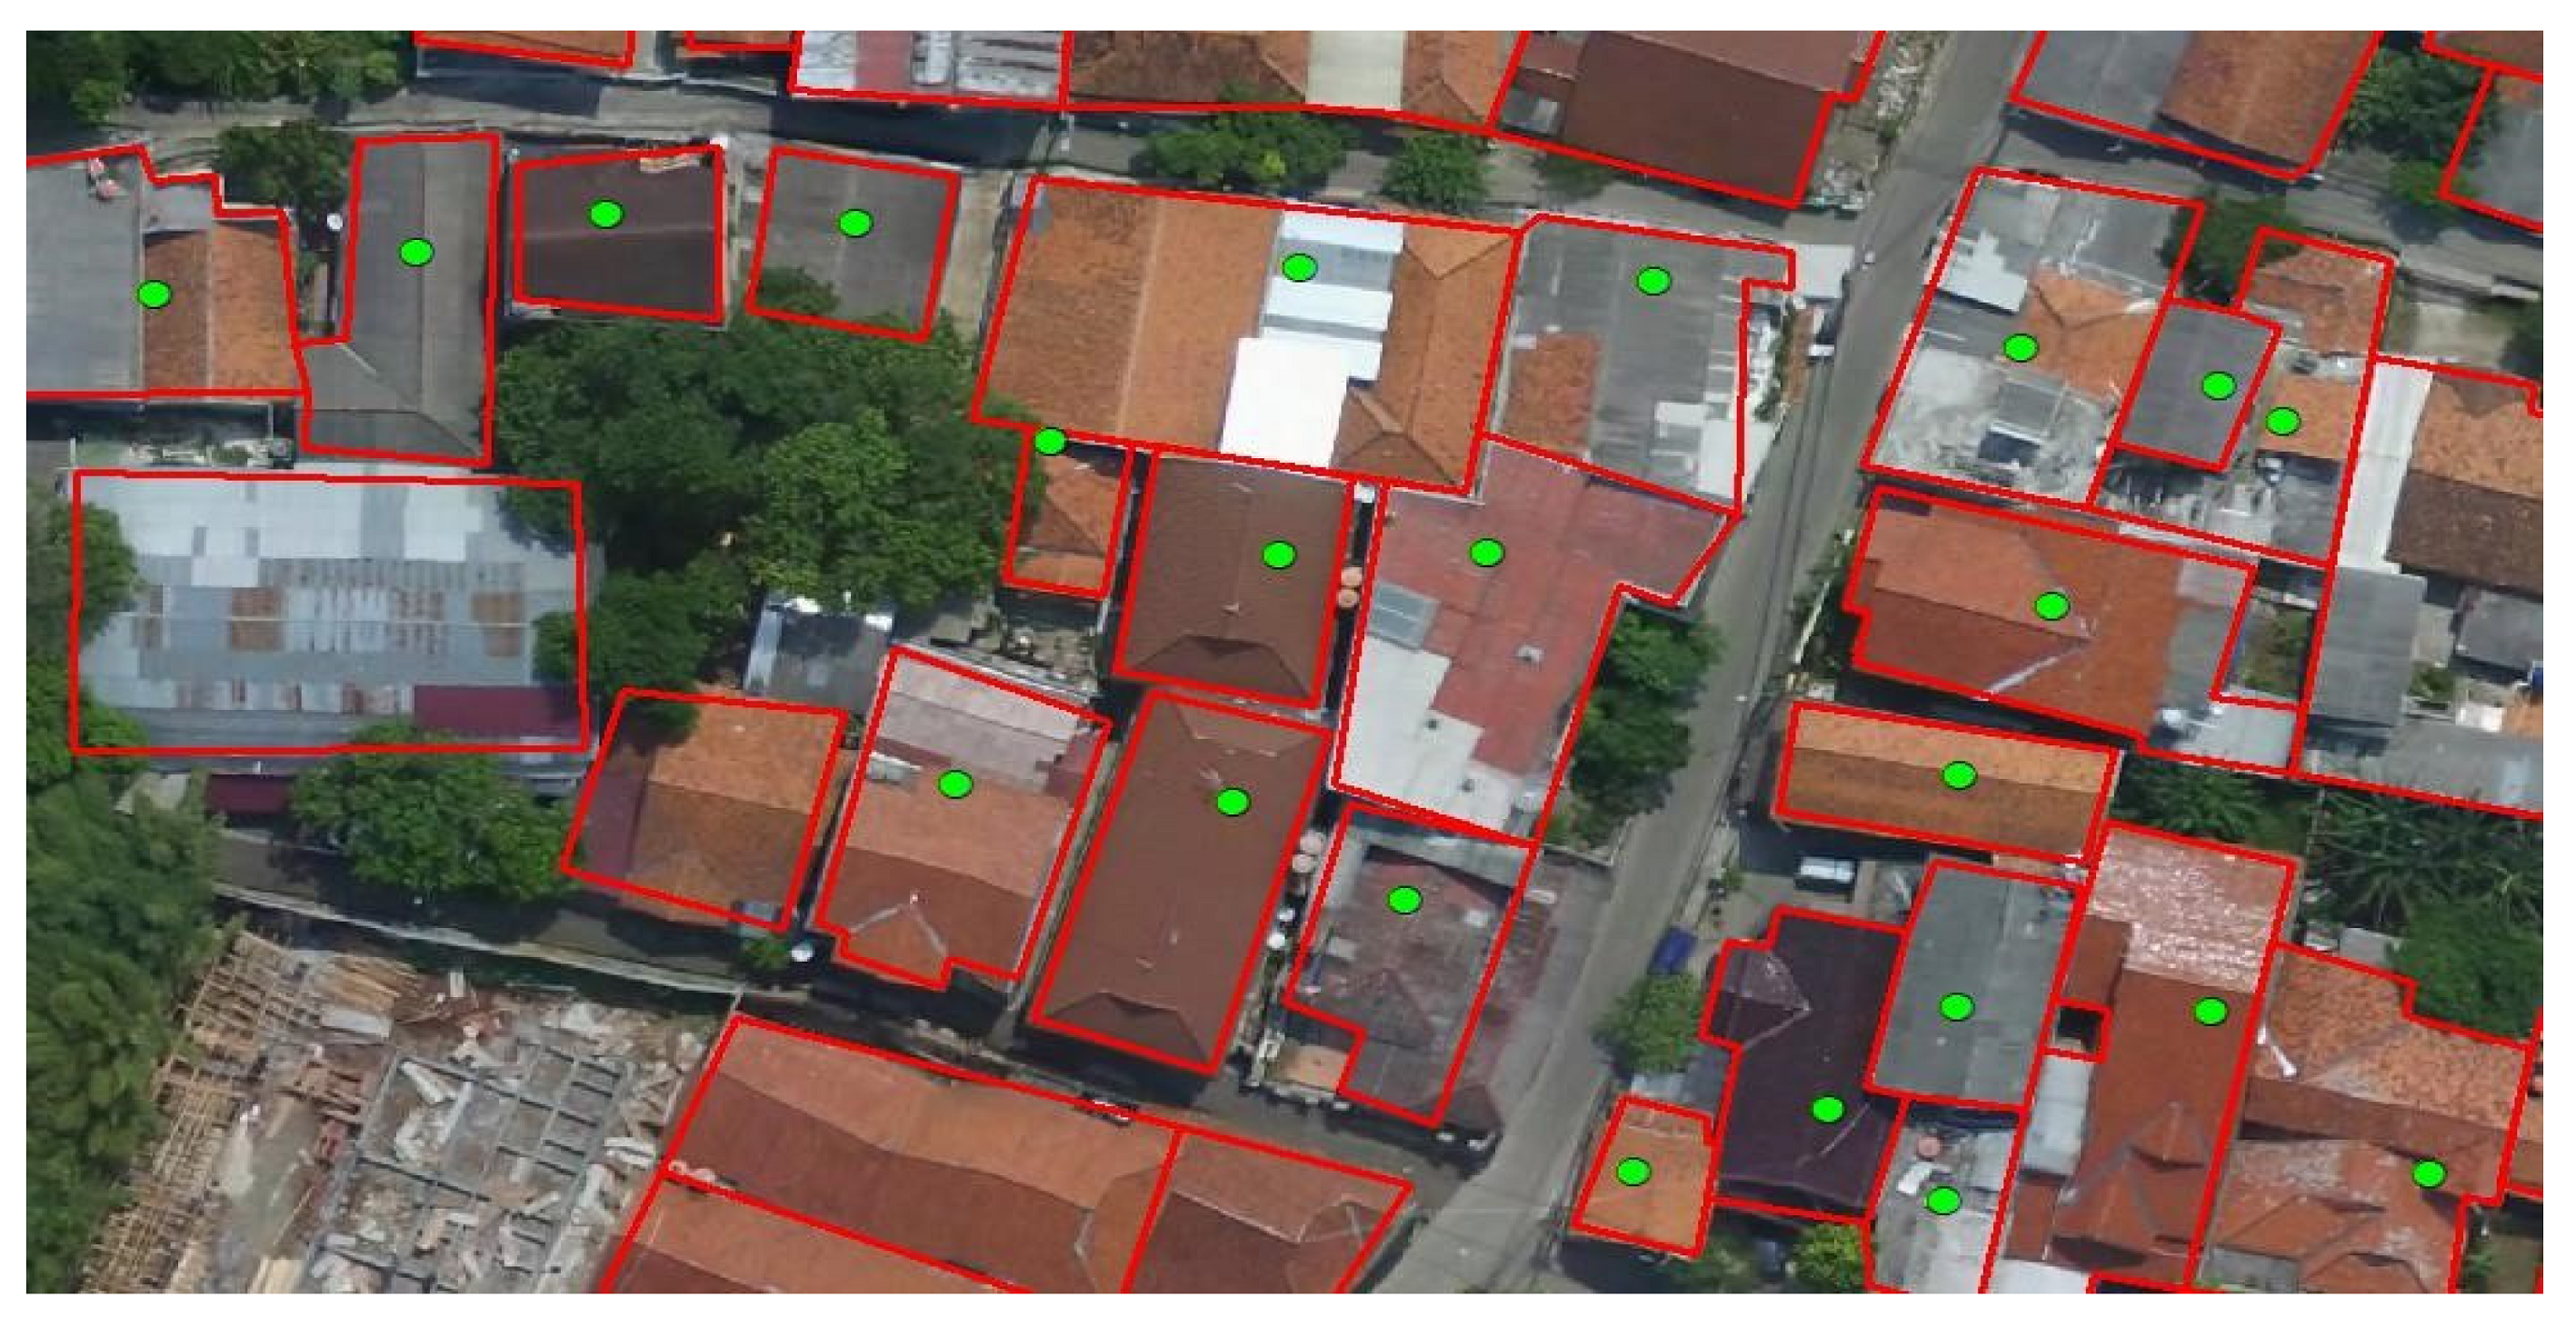
Extract the shape of the roof and determine the building site in 3D.
This stage aims to obtain more detailed information from each building, for the determination of the construction area and the number of floors. Moreover, the DTM, DSM, and nDSM data are processed to produce the following,
  • BLDGHEIGHT (building height): The maximum building height.
  • EAVEHEIGHT (eave height): The minimum building height, i.e., the level of construction without or with a flat roof.
  • ROOFFORM (roof form): The shape of the roof.
  • BASEELEV (base elevation): The base height of the building, which is often equal to the elevation of the ground level.
  • ROOFDIR (roof direction): The direction of the roof (in degrees).
  • RoofDirAdjust (roof direction adjusted): This value is changed to manually adjust the direction of the roof. Since the default value is 0, the estimations of 1 and 2 are observed to counterclockwise rotate the roof by 90° and 180°, respectively.
3.
Edit the 3D model of the building.
This process is performed with machine learning algorithms and is limited to the formation of a 3D building model at Level of Detail 2 (LOD2). Based on Figure 3, the on-screen digitization process is carried out, to obtain the building footprint area, which is not extracted with machine learning algorithms, to minimize modelling errors. This shows that the area of each building in several attached constructions is more likely to be identified manually. To facilitate digitization, the 3D model of the LOD2 building is then visualized with a hill-shade effect, which sharpens the appearance of construction objects (Figure 4). Aerial photography is also used to easily interpret the building boundaries based on the roof limits (Figure 5).
NJOP value was obtained through the tax database from the Depok City Revenue, Financial Management, and Assets Office. This was to integrate the two types of data obtained from the agency, namely building parcels (shapefile information) and DHKP (tax assessment association list). In addition, the DHKP-based NJOP information was then combined into the building parcel shapefile (SHP) attribute data (join attribute). Based on the 3D modelling outcomes, data synchronization was required before the comparative analysis of NJOP quantities. This proved that the shapefile obtained from the modelling process did not completely match the building parcels, according to the Depok City Revenue, Financial Management, and Assets Office data. When the two datasets were superimposed, all building parcels were not properly overlapped, leading to the non-identification of many construction plots in the modelling process. This confirmed that the unidentified parcels were eliminated before the comparative analysis of the NJOP data values.
To check the data, a field survey was then carried out to ensure validation of the 3D model outcomes and interpretation of the building parcels. Uneven contour conditions also caused the non-identification of buildings, due to the location being below the ground surface. Moreover, high building density led to the identification of two close buildings as one construction in aerial photographs. Field surveys were also carried out to understand the process of land-use change in the study area. This showed that some vacant or previously-constructed land was likely to be transformed into built-up sites with larger buildings, after the LiDAR data-recording process.

4. Results

To obtain information on construction specifications, including the area and number of floors, the analysis of LiDAR data processed into a 3D model produced 2331 building parcels. Some of these parcels were then synchronized with the Depok City Revenue, Financial Management, and Assets Office data, where many discrepancies were found between the two parameters. In this case, many 3D modelling parcels did not overlap or the location was not identified within the Depok City data. Meanwhile, a few building parcels included in the appraisal process were only identified in the tax data. After the synchronization process, only 623 of the 2331 products were identified and proceeded to the appraisal process. The distribution of these identified parcels is depicted in Figure 6.
The determination of building prices was also limited to structural factors, which were part of the determinants of property costs [11,12]. This confirmed that the structural factor of the building was related to the number of bedrooms and bathrooms, the garage area, terrace, property age, and the size of the plot [13]. To simplify the calculations, the cost of development in an area was then determined based on the administrative region at the sub-district level. This proved that all buildings had uniform conditions in one sub-district [14]. Regarding the structural factors, the price of buildings was estimated based on the wholesale/material costs and the construction services obtained from an online price survey. According to a survey of several construction sites, the building prices from service providers were classified into three classes for the Jabodetabek area, namely simple (basic), standard (medium), and luxury (lux/premium) houses. This indicated that the average construction cost of a simple house in Depok City was IDR 3,500,000 per square meter.
Based on Figure 7 and Figure 8, high-density housing contained 67 building plots, with 10 being vacant lands. This showed that a total of three and seven parcels were registered as NJOP land without and with buildings, respectively. The medium-density housing area also contained 420 building parcels, with 31 plots being vacant lands. In this case, 10 and 21 parcels were registered as NJOP land without and with buildings, respectively. Meanwhile, 96 building plots were observed in the trade and service areas, where a total of 11 parcels were vacant lands. From these results, 10 and 1 building plots were registered as NJOP land without and with buildings, respectively. Regarding the LIDAR 3D model, the parcels identified and registered as NJOP land with buildings were vacant lands. This showed that the building areas in the high and medium-density, as well as the trade/service housings, were 1.66-, 1.35-, and 1.08-times higher than those in the tax data at the Depok City Revenue, Financial Management, and Assets Office, respectively.
According to the tax data at the Department of Revenue, Financial Management, and Assets Office, the average NJOP of buildings in the high and medium-density, as well as the trade/service residential areas were IDR566,000; 676,000; and 756,000 per square meter, or approximately 0.16, 0.19, and 0.21 times the value of the real assumption analytically utilized, respectively (Figure 9 and Figure 10). This confirmed that the NJOP of buildings in these areas was lower than the present real value, due to the construction location and the current prices.

5. Discussion

Using the 3D LiDAR model based on the construction cost per square meter, a gap was observed between the building values obtained from the appraisal process and the NJOP data at the Depok City Revenue, Financial Management and Assets Office. The size of this gap was also different for each type of land use, and high-density housing had the highest characteristic. Meanwhile, the smallest gap was observed for the trade and service buildings, with their value remaining significant. In these three land use types, the differences in the gap sizes were in line with the site utilization dynamics in Depok City. According to the City’s Medium-Term Development Plan for 2021–2026, a land use mismatch was observed between the function of housing development and industry. A tendency was also found for the development of formal and self-help housing areas (agricultural land), as well as locally-protected regions (river/irrigation borders and lakes). Another factor, subsequently emphasized, was the elevation of land intensity, for low-density residential areas to become averagely and highly populated. Besides that, a tendency was also found in Jalan Margonda, to develop mixed-function areas with office designation, retail trade, and non-retail. Irrespective of this observation, Jalan Margonda is presently being replaced by residential, commercial, and service areas. The development of this area was also influenced by the University of Indonesia (UI) campus being established in 1987 [15]. In residential areas, a higher land use intensity was obtained through converting regions into housing estates. With low-density housing being developed into average and maximum infrastructures, high-density residences experienced a greater increase than medium-density regions. This was observed from a comparative analysis of the building area elevation in high- and medium-density housing, which were 1.66- and 1.35-times greater than the Depot City tax data. Meanwhile, the area of trade and service buildings remained constant or increased 1.08 times. Various field conditions, such as limited vacant land, also hindered the expansion of these buildings. Although the construction ratios with IMB per building unit were only 0.5504 in 2020 [16], the control of land use around Jalan Margonda Raya was still relatively better. In setting building prices below their real values, the tendency of the tax databases was in line with Mahyeda and Buchori (2020) [14], where the use of LIDAR for determining the NJOP of buildings produced a positive (+) contribution of Rp. 974,- per square meter at a PBB-P2 rate. This indicated that the price of buildings contained in the tax database was below the present market value. In Regional Regulation Number 9 of 2021, concerning the Medium-Term Development Plan of the Depok City for 2021–2026, the updating of local tax data was part of the strategic issues in the financial sector of the region. This proved that the lack of up-to-date tax data was one of the reasons that the NJOP of buildings was far below the current prices. According to Law Number 1 of 2022 [17] concerning Financial Relations between the Central and Regional Governments, the NJOP in the tax database needs to be updated every 3 years or once yearly, depending on the local conditions. In this present report, Depok City’s revenue from the P-2 PBB sector was still significantly increased, as the NJOP of the building was elevated approximately 3–9-times over those registered in the present tax database. This value still had the potential to be increased, as the reference price in the appraisal process emphasized the cost of construction, i.e., material and service expenses. Besides this, the NJOP of the buildings was also determined by the acquisition price used at the time of sale and purchase, according to Law No. 1 of 2022 [17]. The building prices used in buying and selling are influenced by several factors, as a property cost is often determined by structural, environmental, and location indicators (Lee, 2016). For example, when someone buys a house, they are simultaneously purchasing its structural features, work accessibility, and environmental comforts (amenities) [11]. Structural characteristics are defined as the attributes possessed by the goods being purchased, such as the building age and area, the size of the plot, the presence of various facilities, and the number of bedrooms. Environmental characteristics are also observed as the shared neighborhood or regional features, covering the school quality, median income, vacancy rate, and racial composition of the areas where property units are located [18]. However, location characteristics are operationally defined as the measures of accessibility to local facilities, including distance to urban work centers, CBD, subway stations, and shopping platforms [19].
The livability index, which includes education, transportation, entertainment, and other amenities (restaurants, shops, and supermarkets) is also significantly correlated with property prices in urban areas [20]. This is because educational facilities (kindergarten, elementary, and junior high), health, and all recreational facilities have a positive and statistically significant impact on property prices [21]. The presence of green open spaces [22] and the accessibility of walking and driving are also positively correlated with property prices [23]. Moreover, the aesthetic views around a property, which provide a sensation of relaxation for the owners, have been found to increase the selling value of the infrastructure [24]. In the United Kingdom, property prices are even positively correlated with the presence of pubs [25], with macroeconomic conditions also observed as relevant influential indicators, especially gross domestic product (GDP), inflation and interest rates, as well as the availability of funds for housing acquisitions [26]. The increase in property prices is subsequently influenced by economic stimulus policies, such as capital deepening [21]. Irrespective of these benefits, environmental factors such as air pollution lead to the reduction of property values [27]. The risk of disasters in urban areas, especially underground pipe explosions, also hurt property prices, with crime negatively influencing the process, such as robbery and serious assault [28]. According to Rahman et al. [1], the factors used in determining property prices can be divided into four main categories, namely location, structural, environmental, and economic variables. In this case, the location variable contains the accessibility to shopping centers, schools, hospitals, and restaurants, as well as the availability of public transportation. The structural variable also contains the number of bedrooms and bathrooms, floor area, garages, terraces, property age, and size of plots. For the environmental variables, the following were observed: (1) crime rates, (2) places of worship, (3) pleasant views, and (4) a quiet atmosphere. The economic variables subsequently consisted of the amount of income and material cost factors. In addition, the locational and structural factors are commonly used, with the environmental and economic variables being difficult to define and measure. Since several factors were found to influence property prices, the present analytical results are very important, regarding the display of lower building costs in the tax database. This indicated that the value of the buildings needs to be higher than the listed price, due to the closeness of the study area to universities, several shopping centers, and commuter line stations. Therefore, subsequent reports are needed, to comprehensively understand the differentiation patterns of building prices, regarding tax databases and LiDAR mapping, as well as to consider the structural, location, environmental, and economic factors. In improving the performance of local tax administration, LIDAR technology utilization requires cooperation between local and central agencies [20]. The non-comparable building parcels obtained from the LiDAR 3D model also proved that the data used in tax administration were not integrated with other relevant parameters. This showed that the provision of another type of referential data, such as the 3D geospatial parameters, was necessary for the implementation of regional development. According to Awrangjeb and Fraser [10], a 3D model obtained from LiDAR displayed referential building specifications for object price determination. This was because the model approach to the data adequately exhibited the shape of the building surface [15]. Validation of 3D building models should also be comprehensively carried out, by measuring the length, width, and height of the building. This should be statistically compared with the modelling results, to obtain a root mean square error (RMSE) value, for the model acceptability to be more measurable [10].

6. Conclusions

To determine whether the NJOP of buildings had a significantly different value from the conventionally-determined estimation, the use of a LiDAR 3D model in the appraisal process relied on direct field observations. This was because the conventional method required a long time and a great amount of human resources, leading to non-proportional updating of the tax database compared to the rate of urban area development. Moreover, a LiDAR 3D model was used successfully and accurately in the appraisal process. It was also in line with the need for compiling a tax database for urban areas, especially PBB-P2, which should be continuously updated. Based on the two appraisal methods, the difference in the amount of NJOP varied, according to the type of land use in an area, and was higher in regions with a greater site intensity.

Author Contributions

M.D. and A.G. developed the building pricing system and model, using LiDAR (Light Detection and Ranging) technology. Meanwhile, R.A. utilized systems and models to process data for the experimental needs. R.A. and R.P. also helped in compiling this paper. All authors have read and agreed to the published version of the manuscript.

Funding

This study was funded by the Directorate of Research and Development, the University of Indonesia, under Hibah PUTI 2022 (Grant No. NKB-284/UN2.RST/HKP.05.00/2022).

Institutional Review Board Statement

Not applicable.

Informed Consent Statement

Not applicable.

Data Availability Statement

Related data are available upon reasonable request.

Conflicts of Interest

The authors declare no conflict of interest.

References

  1. The World Bank. Aspiring Indonesia—Expanding the Middle Class; The World Bank: Washington, DC, USA, 2019. [Google Scholar]
  2. The World Bank. Realizing Indonesia’s Urban Potential; The World Bank: Washington, DC, USA, 2019. [Google Scholar]
  3. Ministry of Finance of the Republic of Indonesia. Macroeconomic Framework and Fundamentals of Fiscal Policy for 2022—Economic Recovery and Structural Reform; Ministry of Finance of the Republic of Indonesia: Jakarta Utara, Indonesia, 2020. [Google Scholar]
  4. BPS. Statistical Yearbook of Indonesia 2019; BPS: Depok City, Indonesia, 2019; Volume 34, Nomor 46. [Google Scholar]
  5. Government of Depok City. Depok City Regional Regulation Number 9 of 2021 Concerning the Medium Term Development Plan of the Depok City of 2021–2026; Government of Depok City: Depok City, Indonesia, 2021. [Google Scholar]
  6. von Haldenwang, C. The Political Cost of Local Revenue Mobilization: Decentralization of the Property Tax in Indonesia; Public Finance and Management: Jakarta, Indonesia, 2017; ISSN 1523-9721. [Google Scholar]
  7. BPS. Statistical Yearbook of Indonesia 2022; BPS: Jakarta, Indonesia, 2019; Volume 37, Nomor 49. [Google Scholar]
  8. Terefenko, P.; Wziatek, D.Z.; Dalyot, S.; Boski, T.; Lima-Filho, F.P. A high-precision LiDAR-based method for surveying and classifying coastal notches. ISPRS Int. J. Geo-Inf. 2018, 7, 295. [Google Scholar] [CrossRef]
  9. Diana, S.R.; Rafikasari, A.; Musdafia, I.; Tinggi, I.S.; Economics, I.; Jakarta, Y.A.I.; Rahma Diana, S.; Hidayat, A.; Musdafia Ibrahim, I.; Farida, F. Economic Assessment of Satellite Remote Sensing Data in Indonesia: A Net Present Value Approach. Int. J. Econ. Financ. Issues 2019, 9, 140–146. [Google Scholar]
  10. Biljecki, F.; Ledoux, H.; Stoter, J. An improved LOD specification for 3D building models. Comput. Environ. Urban Syst. 2016, 59, 25–37. [Google Scholar] [CrossRef]
  11. Law, S.; Paige, B.; Russell, C. Take a look around: Using street view and satellite images to estimate house prices. ACM Trans. Intell. Syst. Technol. 2019, 10, 1–19. [Google Scholar] [CrossRef]
  12. Lee, G.; Cho, D.; Kim, K. The modifiable area unit problem in hedonic house-price models. Urban Geogr. 2016, 37, 223–245. [Google Scholar] [CrossRef]
  13. Bharathi, N.; Malghan, D.; Mishra, S.; Rahman, A. Fractal urbanism: City size and residential segregation in India. World Dev. 2021, 141, 105397. [Google Scholar] [CrossRef]
  14. Mahyeda, A.; Buchori, I. Utilization of Lidar for Determination of Zoning Value of Tax Objects Free of Spatial Utilization Plans. J. Urban Reg. Dev. 2020, 16, 158–172. [Google Scholar]
  15. Shirowzhan, S.; Trinder, J. Building Classification from Lidar Data for Spatio-temporal Assessment of 3D Urban Devefiscalopments. Procedia Eng. 2017, 180, 1453–1461. [Google Scholar] [CrossRef]
  16. Minister of Public Works and the State Minister of Public Housing. Joint Decree between the Minister of Home Affairs, the Minister of Public Works and the State Minister of Public Housing, Numbers 648-381 of 1992, 739/kpts/1992, and 09/kpts/1992 Concerning Guidelines for the Development of Housing and Settlements with a Balanced Residential Environment; Minister of Public Works and the State Minister of Public Housing: Jakarta, Indonesia, 1992. [Google Scholar]
  17. Ministry of Finance of the Republic of Indonesia. Law of the Republic of Indonesia Number 1 of 2022 Concerning Financial Relations between the Central Government and Regional Governments; Ministry of Finance of the Republic of Indonesia: Jakarta Utara, Indonesia, 2020. [Google Scholar]
  18. Liu, L. The relationship between liveability and price of residential houses—A case study of shenzhen. Int. Arch. Photogramm. Remote Sens. Spat. Inf. Sci. 2020, 42, 141–144. [Google Scholar] [CrossRef]
  19. Bergman, U.M.; Sørensen, P.B. The interaction of actual and fundamental house prices: A general model with an application to Sweden. J. Hous. Econ. 2021, 54, 101792. [Google Scholar] [CrossRef]
  20. Kang, Y.; Zhang, F.; Peng, W.; Gao, S.; Rao, J.; Duarte, F. Understanding house price appreciation using multi-source big geo-data and machine learning. Land Use Policy 2020, 111, 104919. [Google Scholar] [CrossRef]
  21. Chen, K.; Long, H.; Qin, C. The impacts of capital deepening on urban housing prices: Empirical evidence from 285 prefecture-level or above cities in China. Habitat Int. 2020, 99, 102173. [Google Scholar] [CrossRef]
  22. Liebelt, V.; Bartke, S.; Schwarz, N. Hedonic pricing analysis of the influence of urban green spaces on residential prices: The case of Leipzig, Germany. Eur. Plan. Stud. 2018, 26, 133–157. [Google Scholar] [CrossRef]
  23. Chen, S.; Zhang, L.; Huang, Y.; Wilson, B.; Mosey, G.; Deal, B. Spatial impacts of multimodal accessibility to green spaces on housing prices in Cook County, Illinois. Urban For. Urban Green. 2022, 67, 127370. [Google Scholar] [CrossRef]
  24. Jayasekare, A.S.; Herath, S.; Wickramasuriya, R.; Perez, P. The price of a view: Estimating the impact of view on house prices. Pac. Rim Prop. Res. J. 2019, 25, 141–158. [Google Scholar] [CrossRef]
  25. Cabras, I.; Sohns, F.; Canduela, J.; Toms, S. Public houses and house prices in Great Britain: A panel analysis. Eur. Plan. Stud. 2021, 29, 163–180. [Google Scholar] [CrossRef]
  26. Gasparėnienė, L.; Remeikienė, R.; Skuka, A. Assessment of the impact of macroeconomic factors on housing price level: Lithuanian case. Intellect. Econ. 2016, 10, 122–127. [Google Scholar] [CrossRef]
  27. Ihlanfeldt, K.; Mayock, T. Panel data estimates the effects of different types of crime on housing prices. Reg. Sci. Urban Econ. 2010, 40, 161–172. [Google Scholar] [CrossRef]
  28. Awrangjeb, M.; Fraser, C.S. Automatic segmentation of raw LIDAR data for extraction of building roofs. Remote Sens. 2014, 6, 3716–3751. [Google Scholar] [CrossRef]
Figure 1. Map of the study area.
Land 11 01320 g001
Figure 2. Study workflow.
Land 11 01320 g002
Figure 3. LiDAR 3D model swallowability level [10].
Land 11 01320 g003
Figure 4. Hill-shade effect on LiDAR 3D model (source: data processing documentation).
Land 11 01320 g004
Figure 5. Use of high-resolution aerial photography to help interpret building boundaries (source: data processing documentation).
Land 11 01320 g005
Figure 6. Map of building parcels under study.
Land 11 01320 g006
Figure 7. Area Comparison Graph Based on the 3D LiDAR. Model. (Source: data processing documentation).
Land 11 01320 g007
Figure 8. Comparison map of building area based on LiDAR mapping with tax database (source: data processing documentation).
Land 11 01320 g008
Figure 9. Comparison Graph of Building Values Based on NJOP (source: data processing documentation).
Land 11 01320 g009
Figure 10. Comparison map of building prices based on LiDAR mapping with tax databases (source: data processing documentation).
Land 11 01320 g010
Table 1. Required data.
No.Data TypeSource/Method of Obtaining Data
1.The building specifications (area and number of floors)The 3D LiDAR data-processing model obtained from Smart Land-Surveillance System (SLSS)
2.A detailed description of the building and the study environmentThe Smart Land-Surveillance System (SLSS) processed from building parcel maps and DHKP (list of the tax assessment) of the Depok City Revenue, Financial Management, and Assets Office.
3.The sales value of the tax object (NJOP) of the building, which is presently used for the imposition of PBB-P2The SLSS processed by the Department of Revenue, Financial Management, and Assets Office of Depok City.
4.The real tax object selling value (NJOP)The calculation of the building values emphasizes the cost of constructing a building per square metre. This is multiplied by the construction area regarding the 3D modelling outcome and online market price surveys.
5.The cost of buildingThe observation of building prices from several online sites.
6.The model data validationField survey
Publisher’s Note: MDPI stays neutral with regard to jurisdictional claims in published maps and institutional affiliations.

