
How Can the Layout of Public Service Facilities Be Optimized to Reduce Travel-Related Carbon Emissions? Evidence from Changxing County, China

1
School of Architecture, Tianjin University, Tianjin 300072, China
2
Urban Planning & Design Institute of Shenzhen, Shenzhen 518052, China
*
Author to whom correspondence should be addressed.
Land 2022, 11(8), 1200; https://doi.org/10.3390/land11081200
Submission received: 14 July 2022
/
Revised: 23 July 2022
/
Accepted: 27 July 2022
/
Published: 30 July 2022
(This article belongs to the Topic Climate Change and Environmental Sustainability)
Abstract
:With the developments in urbanization and motorization, travel-related carbon emissions are increasing rapidly. The layout of public service facilities (LPSF) has a direct impact on travel-related carbon emissions. However, existing public service facility planning methods focus on population, economy, and other aspects, ignoring the environmental impact. So, how do we optimize the LPSF to reduce carbon emissions? This paper proposed a method to optimize the LPSF under the constraint of travel carbon emissions. We selected medical facilities in Changxing County, China, and applied the method we proposed. We found that (1) the carbon reduction effect was significant—the total monthly emissions in Changxing were reduced by 26.10%, and the area covered by high emissions was reduced; (2) the medical facilities in Changxing under a low-carbon goal should be distributed in the county center and surrounding urban areas in a multi-center form; and (3) improving the accessibility of facilities can help to form a low-carbon facilities layout. This paper provides a spatial planning method to guide the specific locations of facilities under low-carbon goals. It also provides scientific suggestions for low-carbon land-use policies at the county level in China.
1. Introduction
Global warming has become a major challenge to the sustainable development of human society. Various types of gas emissions play a significant role in changing the global climate including the dramatic growth in energy consumption, CO2 emissions, and air pollution (e.g., PM2.5) and its associated health impacts [1,2]. The transport sector is the most rapidly growing sector in terms of energy consumption in China [3,4]. According to IEA (International Energy Agency) statistics in 2019, China’s total carbon emissions have exceeded 10 billion tons in the last two years, of which emissions from the transportation sector have reached approximately 10% or 1 billion tons of China’s total emissions [5]. In addition, China’s urbanization and household car ownership continue to increase. From 2010 to 2017, emissions from road transport, mostly for residential travel, which accounts for approximately three-quarters of total transport emissions, increased 3.5-fold in China [5]. The increase in travel-related carbon emissions has posed a significant challenge for the region’s sustainable development. There are three main approaches to reducing travel-related carbon emissions: (1) developing mandatory policies; (2) improving energy-efficient technologies and using more efficient vehicles; and (3) optimizing the road traffic structure (e.g., road network optimization, travel structure optimization) and implementing a low-energy spatial layout [6]. Among them, the third approach is a crucial emission reduction strategy for controlling carbon emissions at the source. Spatial planning can be used in the third approach through land-use control to help reduce the environmental impact. Specifically, spatial planning can design a low-energy-consumption space layout and guide residents to a low-carbon style of travel. This mechanism lies in the fact that spatial planning directly or indirectly influences residents’ travel choices through the design of the spatial layout [7], including the spatial organization of housing, traffic stations, public service facilities, and so on [8,9]. This further affects travel-related carbon emissions.
Public service facilities are an important component of the spatial planning elements. They are resources directly or indirectly provided by the government for the public and shared by all, including public green spaces, pensions, medical treatments, educational facilities, etc. [10]. Earlier studies have demonstrated that the layout of public service facilities (LPSF) has an impact on travel-related carbon emissions. Table 1 shows a summary of the researches on the relationship between the LPSF and travel carbon emissions. Zahabi et al. found that for every 10% increase in the accessibility of public service facilities in the built environment, there was a corresponding 5.8% reduction in transportation greenhouse gases (GHG) [11]. Taking Guangzhou City in China as an example, Ma et al. found that the poorer accessibility of public service facilities in remote urban areas or newly developed urban areas usually generates more travel-related carbon emissions [12]. This indicates that different layouts will lead to differences in the carbon emissions generated by residents reaching these facilities. That is to say, differences in the LPSF will affect differences in travel carbon emissions. An unreasonable facilities layout will cause residents to travel too far or choose high-emission transportation, thus generating more carbon emissions as a result of their travel. Moreover, public service facilities are expensive to build and have a long average life span, which will be difficult to change in a short period of time once a high-carbon-emission-dependent travel pattern is formed [13]. At present, carbon emissions from travel are growing rapidly and improving travel carbon emissions is an important issue for low-carbon urban and rural development. Spatial planning can improve the problem of high travel carbon emissions by optimizing the LPSF. Therefore, the aim of this paper is to optimize the LPSF to reduce travel-related carbon emissions from the perspective of spatial planning.
In order to optimize the LPSF under the low-carbon goal, it is first necessary to calculate the travel-related carbon emissions from residential access to the facilities. Lahtinen et al. estimated the travel carbon emissions generated by residents arriving at libraries in the Finnish capital region [14]. Wang et al. calculated the carbon emissions of educational and medical-facility-related trips [15]. Li et al. measured the travel carbon emissions generated by consumers’ travel to commercial centers of different levels in the city of Shenyang and by comparing the results, showed that the carbon emissions generated by residents’ access to different levels of facilities are not the same [16]. These studies mainly account for the travel-related carbon emissions at the individual level, adopting a ‘bottom-up’ approach in which emissions are estimated from disaggregated attributes, such as travel distance, mode choice, and mode-specific emission factors [20]. However, studies have demonstrated that residents’ preferences have a strong effect on their travel behavior [21], which also affects travel-related carbon emissions. Most of the current studies do not consider the characteristics of residents’ travel behavior preferences when accounting for facility-related travel carbon emissions. Therefore, it is necessary to consider the characteristics of residents’ travel behavior preferences when establishing the calculation model of travel-related carbon emissions.
To calculate the carbon emissions of facility-related trips, the LPSF can be optimized under a certain amount of carbon emission constraints. The LPSF has always been a crucial concern in spatial planning. Some previous studies on the optimization of public service facility layouts are mostly based on accessibility [22,23], economic costs [24], and service capacity [25,26]. There are few studies on the LPSF with the goal of reducing travel carbon emissions, and this paper establishes a relationship between the reduction in travel carbon emissions and the LPSF. For previous LPSF research from a low-carbon perspective, on the one hand, some studies have proposed optimization suggestions at the theoretical level [17,27], which are not enough to provide guidance on specific facilities’ locations. On the other hand, some studies have explored how to build a facility layout optimization model under low-carbon goals such as Chen et al., who investigated the logistics facility location model by considering economic costs, services, and CO2 emissions simultaneously [28]. Tang et al. proposed a multi-objective optimization model based on the classic facility location problem, which maximizes the reliability of services and minimizes CO2 emissions from transport activities [18]. Hwang et al. proposed a new location model for high-demand facilities in urban areas with the incorporation of the traffic congestion and GHG emission costs [19]. These studies have developed a variety of methods for optimizing the LPSF. The most widely used is the location-allocation model. The p-median model, as one of the location-allocation models, has been shown to be more efficient and effective in solving the LPSF problem [29,30]. However, these LPSF studies from a low-carbon perspective ignore the residents’ travel preferences, which may have an impact on the optimization results of facilities’ locations, thereby affecting related planning and policy formulation.
In this study, we make methodological advances on previous work. By considering the characteristics of residents’ travel behavior preferences, we improve the bottom-up calculation approach to facility-related travel carbon emissions and the p-median model for facilities’ layout optimizations. This helps to enhance the accuracy of the location results. Based on this, we propose a spatial planning method to optimize the LPSF under the constraints of the carbon emissions of facility-related trips. This provides a more precise calculation method for facility-related travel carbon emissions. In addition, it makes up for the lack of spatial planning tools available for planners to guide the specific locations of facilities under low-carbon goals. At the same time, the method is also applicable to other regions and other types of public service facilities. However, it should be noted that the settings for the facilities’ location criteria for the different types of facilities need to be analyzed according to the specific case as this method cannot be applied across the board. Furthermore, it seems that there is limited research that focuses on the LPSF from a low-carbon perspective at the county level. It can be said that the relatively slow development of county-level towns in China is largely attributable to the unreasonable allocation and location of public service facilities in those towns [15]. Therefore, this study tested the proposed method in a county in China. Changxing is an economically developed representative county of China and will play an important role in the region’s sustainable development. Therefore, we selected Changxing County, Zhejiang Province, China, as the study site and their medical facilities as representative of public service facilities and then applied the proposed method. Then, we completed an optimized plan for the layouts of the medical facilities with significant carbon-reduction benefits. This provides a more incisive analysis of the integration of travel carbon emissions and the optimization of the LPSF. Furthermore, it can provide an innovative spatial planning method for reducing travel-related carbon emissions as well as scientific suggestions for low-carbon land-use planning and sustainable policies at the county level in China, that is, in the low-carbon planning of facilities’ layouts, attention should be paid to improving accessibility, which can help to form a low-carbon facilities layout pattern. The rest of the paper is organized as follows. We establish the methodology in Section 2 and present the study area and data in Section 3. The analysis of these results is illustrated in Section 4, and Section 5 provides a summary of the conclusions of this study and possible real-world applications of the method.
2. Methodology
2.1. Methodological Framework
In order to answer the question “How to optimize the LPSF to reduce travel-related carbon emissions”, we first designed the application scenario of optimization as follows: under the goal of minimizing travel-related carbon emissions, the total number of facilities remained unchanged, but the facilities’ scales were allowed to be adjusted, and then the LPSF was optimized. Based on this, we proposed a two-step low-carbon optimization method for the LPSF (TS-LC-LPSF). TS-LC-LPSF included two steps: calculating travel-related carbon emissions under a specific facilities layout pattern and optimizing the LPSF with the goal of minimizing facility-related travel carbon emissions. The method integrated different mathematical models and GIS functions (Figure 1).
First, we introduced the characteristics of residents’ travel behavior preferences to improve the traditional bottom-up analysis method and combined travel distances and carbon emission factors to complete the calculation of travel-related carbon emissions under the layout of specific public service facilities, which was the premise for the layout optimization. Second, we simulated the public service facility layout optimization under the constraints of travel carbon emissions. With the goal of minimizing travel-related carbon emissions, incorporating travel behavior preferences improves the p-median model. Then, we used MATLAB to obtain the optimal LPSF. It was integrated into the GIS environment to form the spatial visualization. Furthermore, with the spatial analysis function of GIS, the suitability evaluation of the candidate areas for the optimal site selection was carried out. By establishing the suitability evaluation criteria, the final optimization plan was determined by a comprehensive evaluation using the AHP method and the entropy method. Our proposed method was then applied to the medical facilities in Changxing, Zhejiang Province, China.
2.2. Step 1: Calculation of Travel-Related Carbon Dioxide Emissions
The calculation methods for travel carbon emissions generally fall into two categories, top-down and bottom-up methods [31,32]. The top-down method is based on the fuel types consumed by the various modes of transport and CO2 emission factors for each fuel type [33,34,35]. However, this method requires detailed information on the types of fuel consumed by the various modes of transportation and their consumption data. It is suitable for the macroscopic estimation of the carbon emissions of an entire region [36]. Therefore, this approach is not suitable for the low-carbon assessment of spatial planning and the identification of emission hotspots. In the bottom-up approach, emissions are estimated using the travel mode, vehicle kilometers traveled, and CO2 emission factors [37,38], which can capture the impact of the temporal and spatial characteristics of traffic flow on carbon emissions. Therefore, this paper extended the traditional bottom-up measurement method to calculate travel-related carbon emissions.
The traditional bottom-up approach to calculating travel-related carbon emissions was based on the following formula:
where CE denoted the total travel-related carbon emissions and Dkij represented the travel distance from origin i to destination j using k types of transportation. This paper used the travel distance from residential point i to public service facility point j using k type of transportation. By building an OD matrix based on the probability of residents’ travel, which was a table of all travel between the origins and destinations in the transportation network [39], we can obtain the travel distance; αk denoted the carbon emission factor of the k types of transportation modes.
Considering that the residents of each residential point have different travel choices when obtaining facilities, that is, the residents of each residential point have preferences when choosing facilities [40,41], this is referred to as “residents’ travel behavior preferences” in the following. This paper introduced residents’ travel behavior preferences based on the traditional bottom-up measurement method. Therefore, we took each residential point (M = 1, 2, …, m) and chose a different public service point (N = 1, 2, …, n). The probability of the travel behavior of each residential point was represented by the following quantified formula:
where Pij represented the probability that residential point i chose to travel to facility j to access services; Wi represented the population at residential point i; Zk represented the share of k types of transportation; and Fi represented the frequency of monthly travel.
The Huff model is used for the calculation of the travel probability Pij. The Huff model expresses the travel probability of a residential point to a particular facility point, which was calculated as follows [42]:
where Qj was the service capacity score of the facility (which can delineate the level of facilities), which was used to explain the probability of residents choosing different levels of facilities, dij denoted the travel distance between the residential and public service facilities, and β denoted the distance friction coefficient. It was shown that when β took the value of 2, it better reflected the decaying effect of the attractiveness of public service facilities with increasing distance [43]. Therefore, this paper used β = 2. denoted the number of service resources that residential i can obtain at facility j under the effect of distance attenuation. then denoted the total amount of service resources that residential i may access.
Based on this, the bottom-up measurement approach was extended. We proposed a model to measure travel-related carbon emissions under the layout of public services.
The measurement model was able to account for carbon emissions generated by a residential point arriving at different levels of facilities and by the different modes of transportation. Based on this, we can analyze the carbon emissions of facility-related trips.
2.3. Step 2: Low-Carbon Layout Planning of Public Service Facilities
To simulate the changes in public service facility layouts with the constraint of travel carbon emissions, we adopted the improved p-median model with the objective of minimizing the total carbon emissions to optimize the locations of public service facilities. The p-median model is mainly used to solve the location-allocation problem, which was proposed by Hakimi in 1964 [44]. The main idea of the location-allocation problem is to use the mathematical programming method to build a location optimization model under a set of constraints to seek the maximum or minimum objective function so as to select the optimal facilities layout location from a batch of candidate locations according to the optimization goal. The purpose of the p-median problem is to locate p facilities and allocate demand points in a network so that the total sum of the weighted distances between the demand points and their corresponding assigned facilities is minimized [45]. It measures the effectiveness of the elements by determining the total travel costs between the demand point and the target point and is widely used in siting decisions for various types of facilities such as commercial and medical facilities [46,47]. In this paper, the Huff model was incorporated into the traditional p-median model to reflect residents’ travel behavior preferences. Then, we obtained a method for optimizing the LPSF with the constraint of carbon emissions of facility-related trips.
Its objective function is
where Z denoted the travel distance; and since the carbon emission factors of various transportation modes in the same region are fixed, the travel distance can be used as the constraint objective instead of the travel carbon emissions, i.e., the objective condition can be converted from requiring the minimum travel carbon emissions to the minimum travel distance. Dij was the travel costs between residential point i and facility point j (this is the travel distance); Wi was the demand of the residential point, i.e., the population; Xj represented the facility candidate point; and Pij represented the probability of residential point i choosing to travel to facility point j.
Set the constraints as follows.
(1) The total number of facilities:
(2) The relationship between the residential points and facility points:
(3) The levels of the facilities:
(4) The travel distance between residential points and facilities points did not exceed the tolerable distance of the residents:
Equation (7) indicated that the total number of facilities to be configured in the study area is constant at P.
Xj was a binary decision variable for facility candidate points, and Equation (8) meant that when Xj equaled 1 (Xj = 1), a facility was allocated at j and when it equaled 0 (Xj = 0), no facility was allocated at j.
In Equation (9), Yij indicated whether the facility candidate served the residential point, using 1 to indicate that facility point j served residential point i and 0 to indicate that facility point j did not serve residential point i.
Equation (10) indicated that residentials can only be linked to facility candidates that provided services.
Equation (11) indicated that only one facility candidate can be selected for a residential point.
Equation (12) indicated that each facility candidate has a service capacity score, which determined the level of the facility.
Equation (13) indicated that the travel distance between the residential and the facility points must not exceed the tolerable distance D0. This paper assumes that beyond a certain distance, residents will give up on trying to reach a facility.
After the optimized plan of public service facilities under the carbon emission constraint was obtained in the simulation, there was a possibility that the results were located in a zone that was not suitable for placing public service facilities. Therefore, we analyzed the suitability evaluation of the public service facility layout as an auxiliary decision-making tool in the optimization model [48]. In this paper, the evaluation criteria influencing the suitability of public service facility layout construction were summarized as follows: traffic convenience, urban development level, population distribution, and distance from flammable and explosive sites. The influencing factors of the suitability evaluation analysis presented in this paper are for reference only and can be appropriately supplemented or modified for specific problems.
2.4. Processes of Optimization
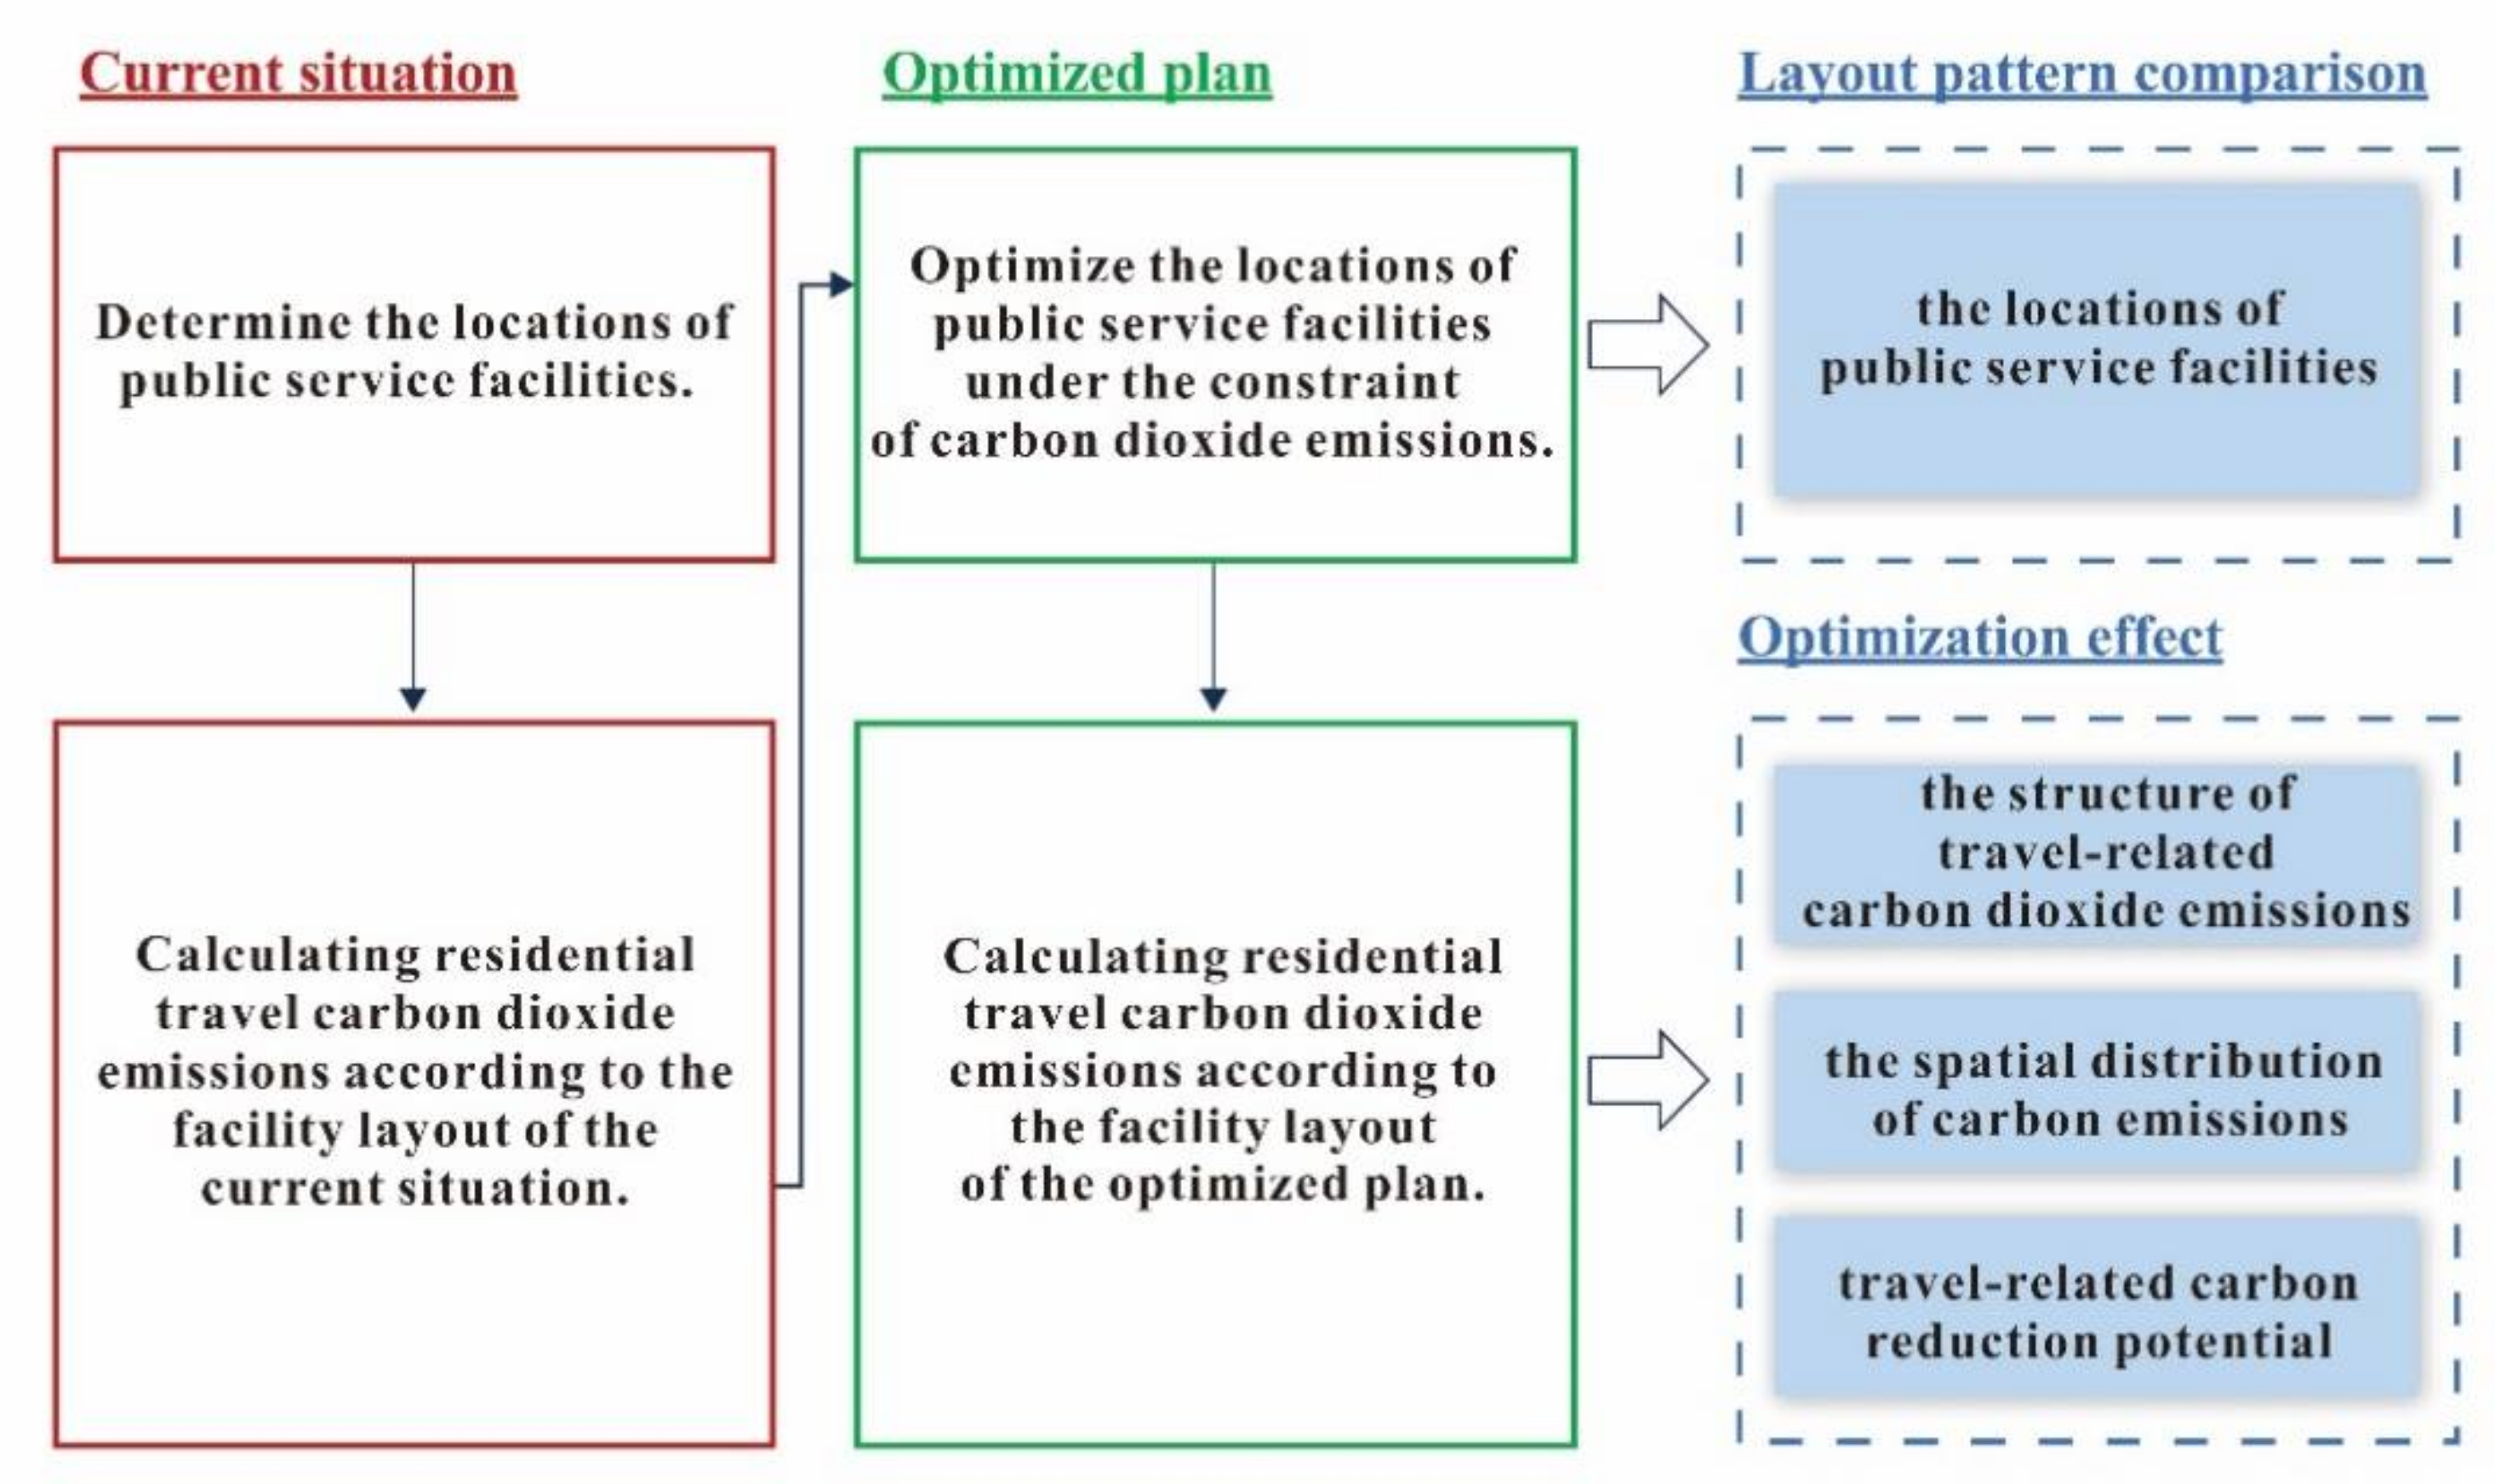
Figure 2 illustrates the process of the TS-LC-LPSF. The current LPSF is a “current situation”. After completing the TS-LC-LPSF, the “optimized plan” formed was the result of the low-carbon LPSF.
In the process of the low-carbon layout planning of public service facilities, first, the locations of public service facilities were determined and then the travel-related carbon emissions were obtained based on “Step 1”. Then, “Step 2” was used to optimize the locations of public service facilities under the constraint of travel carbon emissions. Finally, based on the facility layout pattern of the optimized plan, “Step 1” was used again to obtain the travel-related carbon emissions of the optimized plan.
To verify the carbon emissions reduction effect of the optimized plan, we compared the current situation with the optimized plan to examine the sustainability performance of the facility layouts in the optimized plan. Before doing so, we first compared the locations of the facilities before and after optimization. Based on this, the emissions reduction effect after optimization was illustrated, including (1) in a comparison of the quantitative structure of carbon emissions, where the quantitative structure of carbon emissions was obtained by substituting the travel distances for different situations; (2) in a comparison of the spatial distribution of the carbon emissions that was fed back into the carbon reduction of each street or township by the distribution of per capita carbon emissions, which was obtained by pooling the travel carbon emissions for each residential point and applying the inverse distance weight (IDW) method; and (3) in a comparison of the carbon-reduction potential of the current situation and the optimized plan. The carbon-reduction potential defined in this paper referred to travel carbon emissions generated beyond the residents’ tolerance time (or tolerable distance), which was calculated as the difference between the total carbon emissions and the carbon emissions within the tolerable time of residents (obtained by substituting the tolerable distance). A comparison of emission reduction effects is presented in detail in the Results section.
3. Study Area and Datasets
3.1. Study Area
We selected Changxing as the study area for the TS-LC-LPSF. It is a county-level city located in northeastern Zhejiang Province in China. We selected Changxing’s medical facilities as the study object (Figure 3). There are several reasons for the selection. First, counties in China are facing rapid urbanization and motorization and the construction of public service facilities in counties is much less developed than in cities, with much lower accessibility and higher travel costs for residents to access services. By optimizing the LPSF in counties and improving the service efficiency of the facilities, it is more practically meaningful for reducing travel-related carbon emissions [49]. Second, Changxing is located in the Yangtze River Delta region of China, which is an economically developed representative county and will play an important role in the construction of low-carbon cities and counties in the future [50]. Third, medical facilities are the most basic public service facilities to ensure human health and safety. This means that even if it takes a certain amount of time, residents are bound to use some mode of transportation to access the service [3]. Using the medical facilities in Changxing as an application object has realistic application significance.
3.2. Datasets
In this paper, the process of establishing the TS-LC-LPSF required the use of data on the residents’ travel behavior, spatial data, and carbon emission factors of travel modes. All data represented the situations in 2017.
Among them, travel behavior data were obtained through questionnaires. The survey contents included basic information, such as place of residence, destination, travel time, etc.; travel behavior such as travel mode, travel frequency, and travel route; and residents’ preferences when choosing medical facilities and the tolerance time for residents to arrive at those facilities. The survey method was to select four schools in the urban area of the county and one school in the suburban area in October 2018 and 100 questionnaires were distributed to each grade in each school. The questionnaires were distributed to families and students and parents were asked to answer together. A total of 3000 questionnaires were distributed, of which 2790 questionnaires were returned and the questionnaire response rate was 93%.
The spatial data included location data of current residential sites, facility sites, and roads. The location data of the residential points in Changxing were provided by the Changxing Construction Bureau and include all the residential points involved in the questionnaire, that is, the spatial distribution of the samples (Figure 3). The POI (point-of-interest) data of 25 medical facilities were obtained from the Pulse Data website (https://www.metrodata.cn/ (accessed on 3 March 2020)). To obtain the OD matrix of the travel distance by residents, speed data for the roads were needed so the speeds of all the roads during two time periods, 9:00–10:00 and 14:00–15:00, were recorded on Monday, Wednesday, and Saturday, respectively, and the average speed for each class of road was finally obtained. According to the resident travel time obtained from the questionnaires multiplied by the corresponding speed data, the OD matrix of the resident travel distance was established.
The carbon emission factors of the transport mode referred to the results of the TREMOVE model and the relevant literature [51]. Since the carbon emission factors of electric bicycles vary in different areas, the carbon emission factors of electric bicycles were calculated in this paper based on the energy-use efficiency of electric vehicles and the carbon emission factors of electricity production in Zhejiang Province, and the calculation method is shown in the Appendix A. The data involved in this study and their types, values, and sources are shown in Table 2.
For the assignment of the suitability evaluation indicators for the locations of the medical facilities, we combined the analytic hierarchy process (AHP method) [52] and entropy method [53] and finally obtained the results of the suitability evaluation (Table 3). For the evaluation criteria of each evaluation factor, see Table A1.
4. Results
Due to the different attractiveness of the different levels of facilities to residents [54,55], it was necessary to divide the levels of the medical facilities based on the comprehensive evaluation score of the facility service capacity. An evaluation system containing 11 indicators was constructed from three aspects: the number of technicians, medical equipment, and diagnostic and treatment capacity (Table 4). The medical facilities selected in this paper were those with comprehensive diagnosis and treatment services, excluding specialized medical facilities, such as dental and orthopedic hospitals. Due to the limitation of the data acquisition, level one medical facilities, such as health offices and small clinics, were not included and only medical facilities at township-level health centers and above were considered.
The scores were obtained using indicator analysis, and the service level of the medical facilities in Changxing was divided into three levels comprising three level three medical facilities, eight level two medical facilities, and fourteen level one medical facilities. Level three obtained the highest score, and the evaluation results of the levels of the Changxing medical facilities are shown in Table 5.
According to the TS-LC-LPSF, the three levels of the medical facilities in Changxing were applied (the current situation of the medical facilities layout is shown in Figure 4), and we obtained an optimized facility layout plan that met the conditions of the application scenario. The comparison between the current situation and the optimized plan was carried out as described in 2.4, including (1) a comparison of the layout patterns; (2) a comparison of carbon emission structures; (3) a comparison of carbon emission spatial distributions; and (4) a comparison of carbon reduction potential. By the comparative analysis, the effectiveness of the TS-LC-LPSF and the carbon reduction effect of the optimized plan were tested.
4.1. Changes in the Locations of Medical Facilities
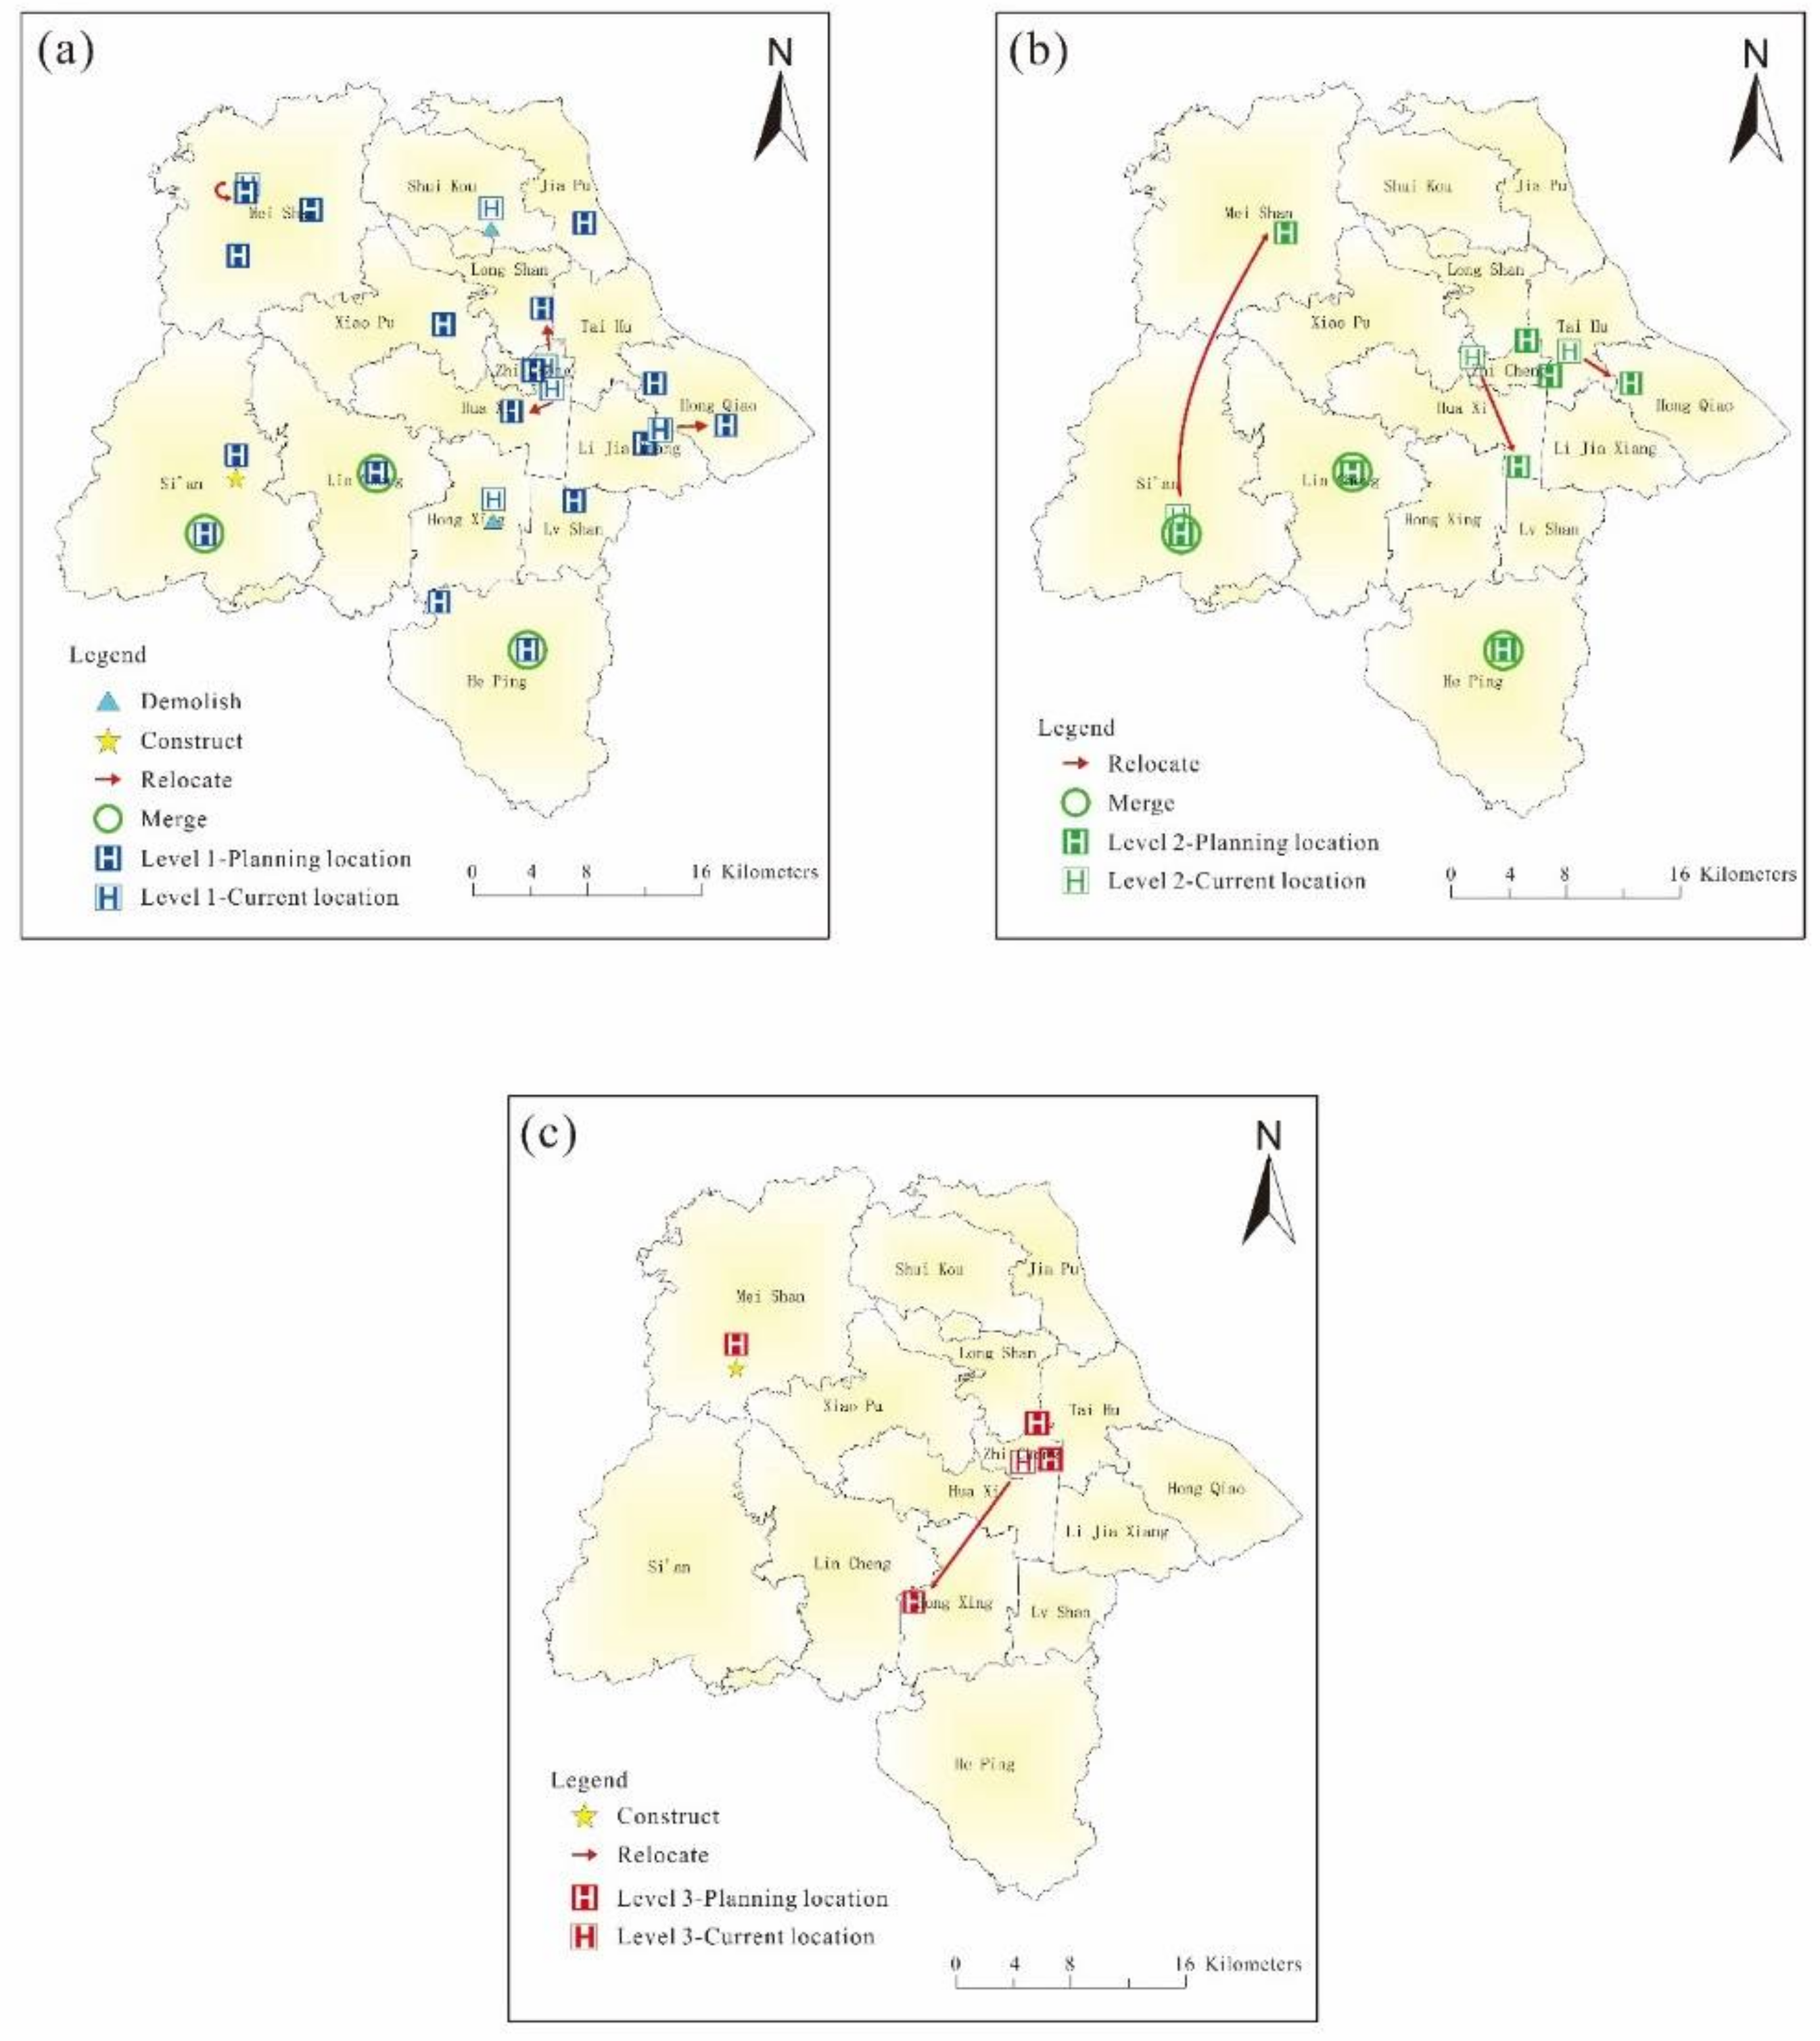
Through the “Step 2” method, the layouts of the medical facilities in Changxing were optimized under the constraint of minimum travel carbon emissions and we obtained the optimized plan. In the process of changing the layouts, the layouts of the medical facilities in the optimized plan were based on the current situation, and the current medical facilities were adjusted in four ways: demolish, construct, relocate, and merge. Then, we obtained the layouts of the medical facilities after optimization. Figure 5 represents the changes in the medical facility layouts of the optimized plan compared to the current situation. Among them, blue triangles indicate the medical facilities to be demolished, yellow pentagons indicate the new medical facilities to be constructed, red arrows indicate the relocation of the medical facilities, and green circles indicate the two levels of the medical facilities to be merged in the current situation.
Based on the comparison between the current situation and the locations of the medical facilities in the optimized plan, we analyzed the differences in the layouts of the medical facilities before and after optimization. The layout of the level one medical facilities was adjusted more significantly than those of the other levels (Figure 5a), including three facilities that were relocated, two facilities in Hongxingqiao Township and Shuikou Township that were demolished, two new facilities that were built in Si’an Township and Heping Township in the suburbs, and three in the southern suburbs that were merged based on the level two medical facilities so that the two levels were combined. This indicates that the construction of the level one medical facilities is redundant and that there are more underutilized medical facilities, indirectly causing excess carbon emissions from unreasonable travel. For the level two medical facilities (Figure 5b), three relocations were made mainly in urban areas where the facilities are more densely distributed. As mentioned earlier, three of them were combined with level one medical facilities, which helped to improve the utilization of the facilities by residents, thus rationalizing the travel structure and reducing travel carbon emissions. For the level three medical facilities (Figure 5c), one relocation and one new construction were adjusted. Specifically, one medical facility was relocated from Zhicheng Township in the central city to Hongxingqiao Township in the southern suburbs and there was one new facility in Meishan Township in the northwest suburbs. The adjustment results of dispersing from the urban area to the suburban area also show that the current layouts of the medical facilities are too concentrated in the central urban area. This means that residents located in the suburban area have to travel longer distances if they want to access the services of the level three medical facilities, which results in higher carbon emissions. Overall, in the optimized plan, the layouts of the medical facilities in Changxing become more decentralized in space compared to reality, which allows residents to have more equal opportunities to access the different levels of medical facilities.
4.2. Changes in the Quantitative Structure of Carbon Emissions
To test the low-carbon performance of the TS-LC-LPSF and the optimized plan, first, an analysis was carried out from the perspective of the quantity of travel carbon emissions. The comparison between the current situation and the optimized plan was carried out on four aspects: the total carbon emissions, the carbon emissions from accessing the different levels of medical facilities, the carbon emissions from using different modes of transportation, and the per capita carbon emissions.
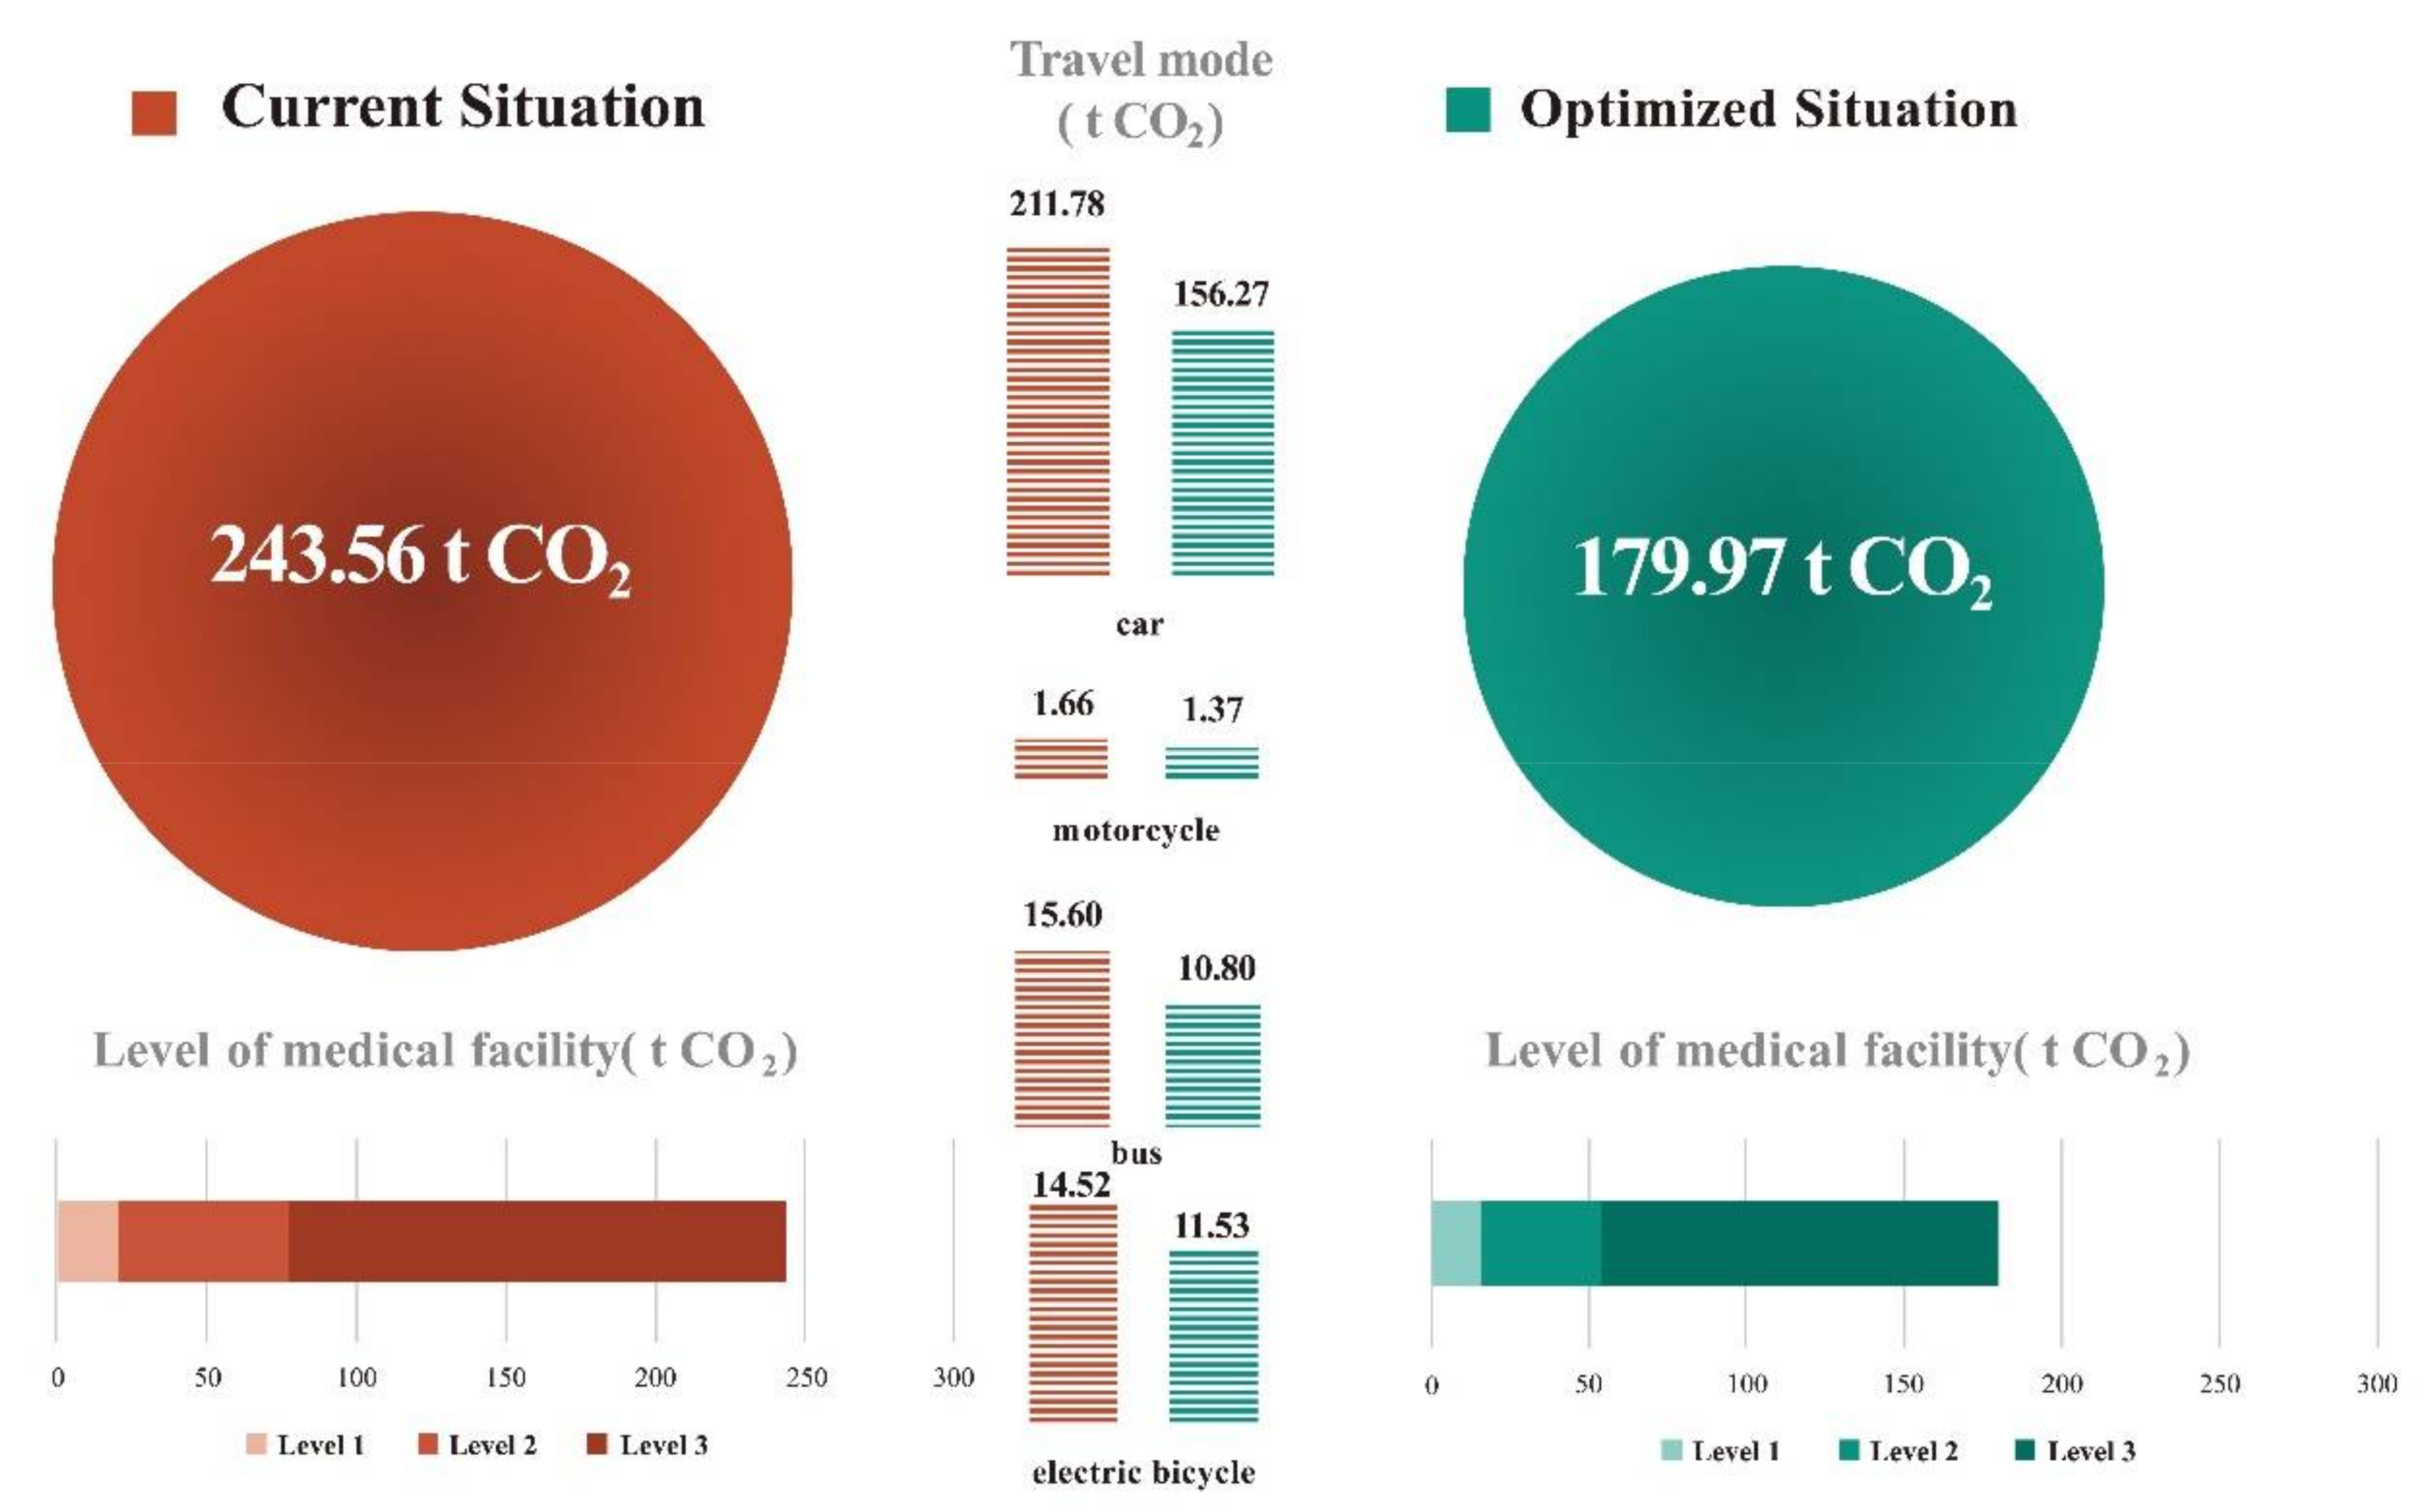
The structure of travel carbon emissions was significantly improved in the optimized plan compared to reality (Figure 6). In terms of the total amount, the total carbon emissions were obviously reduced, with monthly carbon emissions from medical travel decreasing from 243.56 tons of CO2 in the current situation to 179.97 tons of CO2 in the optimized plan. The total carbon reduction reached 63.58 tons, which is 26.10% of the current situation’s carbon emissions.
In terms of carbon emissions from access to the different levels of medical facilities, carbon emissions decreased with the level of medical facilities in the current situation. The travel-related carbon emissions to the level three medical facilities were 166.59 tons, accounting for 69% of the total carbon emissions. This means that the layout planning of the level three medical facilities in Changxing largely influences the total carbon emissions and is the main source of carbon emissions. After optimization, the structure of carbon emissions continued to decrease with the level of medical facilities, and the carbon emissions from travel to access the different levels of facilities all decreased. Among them, the total monthly carbon reduction for the level three medical facilities was 40.627 tons, which contributed the most to the carbon emissions reduction from the medical travel of residents in Changxing, reaching 63.90%. The carbon emission reduction for level two medical facilities was 18.691 tons, with a contribution rate of 29.40%. The total carbon reduction for level one medical facilities was 4.263 tons, with a contribution rate of 6.70%.
In terms of carbon emissions from the various modes of transport, in the current situation, car travel accounted for more than 50% of carbon emissions and was the main source of carbon emissions, followed by buses and electric bicycles. After optimization, the carbon emissions generated by the different modes of transportation decreased. Among them, the carbon emissions from cars decreased the most, with a reduction of 55.51 t CO2 and a decrease ratio of 26.21%. This indicates that changing the LPSF can lead residents to change their travel behavior and reduce their reliance on high carbon emission travel patterns.
A comparison of the per capita carbon emissions before and after optimization shows that there was also a significant decrease in per capita carbon emissions (Table 6). After optimization, the monthly per capita travel carbon emissions generated from medical visits to level three medical facilities decreased by 22.14%, level two medical facilities by 32.33%, and level one medical facilities by 16.76%.
From the different aspects of the characteristics analysis, it can be seen that using the TS-LC-LPSF to optimize the medical facility layout pattern in Changxing has a significant effect on controlling and weakening travel carbon emissions.
4.3. Changes in the Spatial Distribution of Carbon Emissions
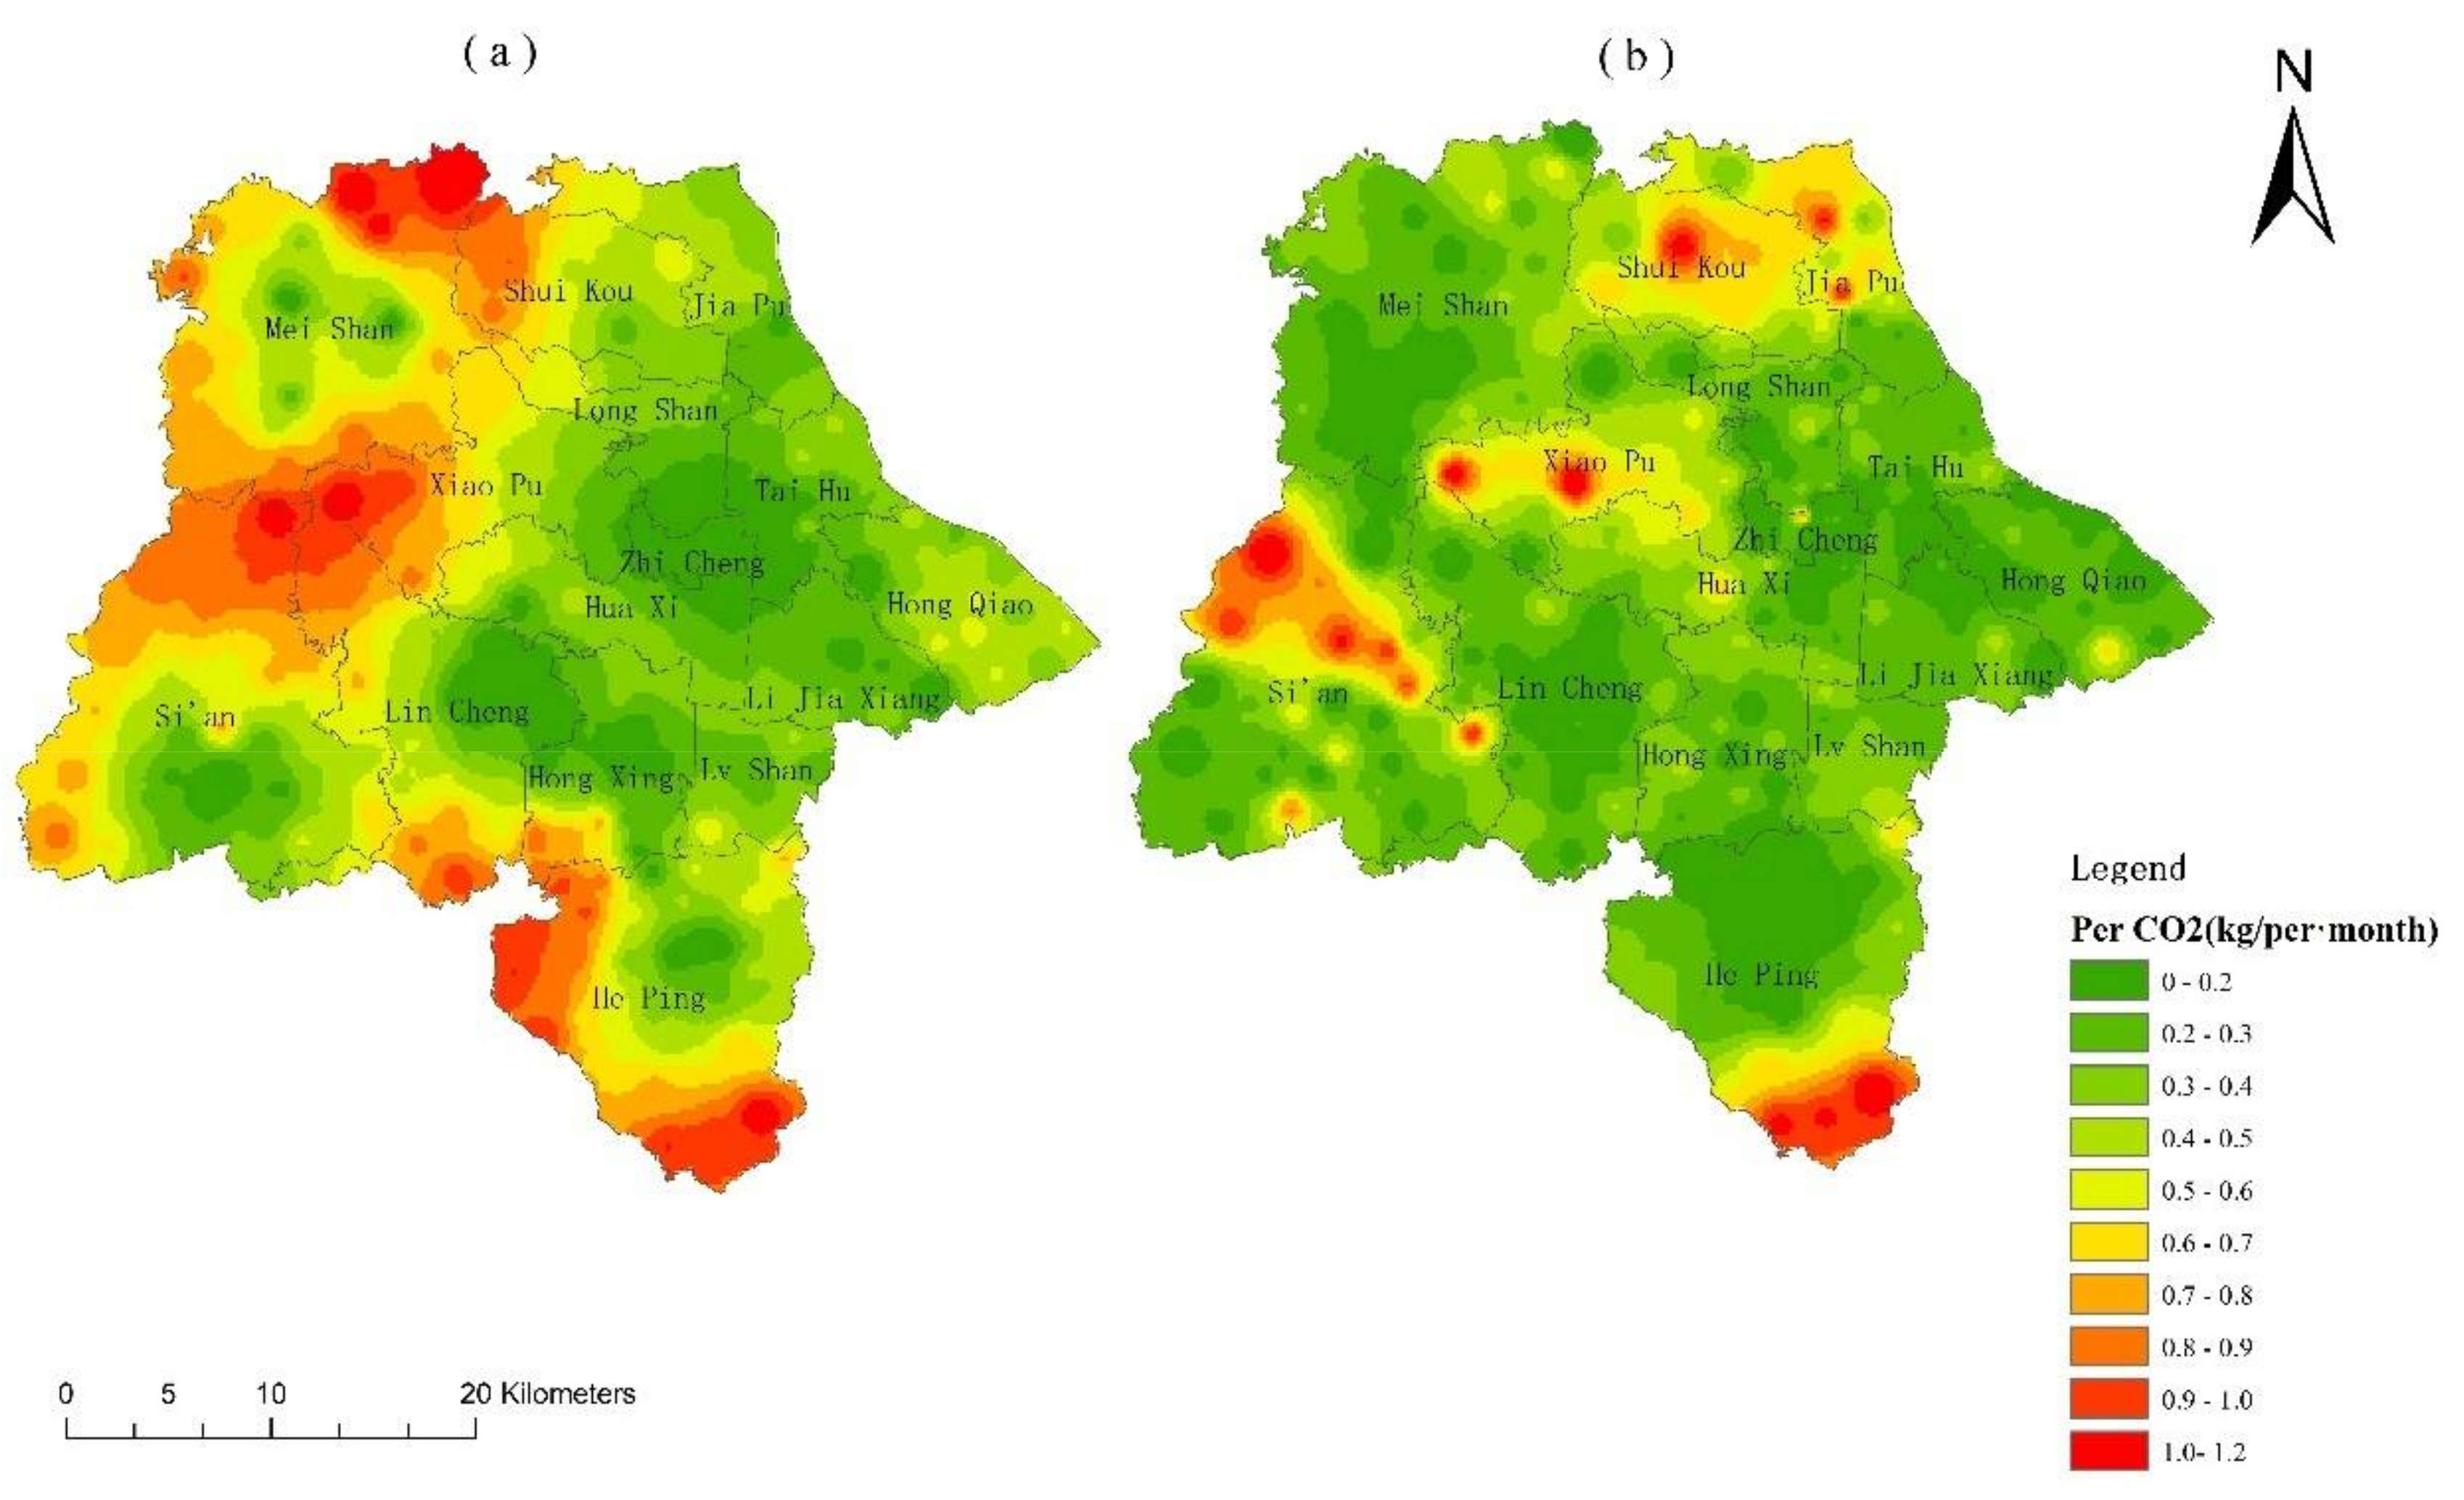
In addition to the changes in the quantitative structure of travel-related carbon emissions, the spatial distribution of travel-related carbon emissions can also indicate the low-carbon performance of the optimized plan. If the area covered by the high value of the per capita travel carbon emissions shrinks, it indicates that travel-related carbon emissions are reduced (Figure 7).
In terms of the spatial distribution of carbon emissions, the medical facilities in the current situation are mainly concentrated in the central part of the city. However, high values of per capita carbon emissions occur mainly at the junctions between streets, such as the junction between Meishan Township and Shuikou Township and the junction between the four townships of Meishan, Xiaopu, Lin Cheng, and Si’an. In addition, there are southern regions far away from other regions (Figure 7a). This shows that the current layouts of the medical facilities do not provide sufficient service coverage to residents at the junctions of streets and in the southern area, and the level of medical facility supply is insufficient. This resulted in unequal access to medical facility services for residents thus generating higher carbon emissions. In the optimized plan (Figure 7b), by optimizing the layouts of the medical facilities, the coverage of medical facilities in the northwest and southwest areas of the county is improved. Meanwhile, the average travel distance is reduced, thus reducing travel-related carbon emissions. It can be seen that the high value of per capita carbon emissions in the optimized plan is significantly reduced. The hotspots of per capita carbon emissions change from a piecewise distribution to a pointwise distribution, indicating that optimizing the layouts of the medical facilities has a significant effect on reducing carbon emissions.
4.4. Changes in Travel-Related Carbon Reduction Potential
As mentioned above, the carbon reduction potential refers to the carbon emissions generated beyond the residents’ tolerance time in this paper (Figure 8). By optimizing the layouts of the medical facilities, if the carbon reduction potential of travel-related carbon emissions decreases, medical facilities will reach more residential locations. This results in a reduction in travel carbon emissions generated beyond the residents’ tolerance time, and then the optimization is proven to be effective.
In reality, the carbon reduction potential for the level three medical facilities was 94.93 tons, which represented 57.65% of the total carbon emissions from travel to level three medical facilities. The carbon reduction potential of the level two facilities accounted for 80.42% of the total level two carbon emissions and the carbon reduction potential of the level one facilities accounted for 70.37%. The carbon emission reduction of the three levels of medical facilities through optimization was more than 50% of the carbon emission reduction. The carbon reduction potential of the level three medical facilities was the largest. This indicates that the potential to reduce carbon emissions by improving the efficiency of medical facility services and reducing the average travel distance through facility layout optimization is very large.
In the optimized plan, the total carbon emissions generated beyond the residents’ tolerance time were reduced from 154.81 tons to 67.52 tons. With a decrease of 56.39%, the optimization effect is obvious. The most significant optimization effect was the portion generated by residents’ travel to level three medical facilities, which decreased from 94.93 tons to 31.25 tons, a decrease of 67.08%. The carbon reduction potential of the different levels of facilities all had a reduced proportion of the total (level three, 24.81%; level two, 71.80%; level one, 55.94%). All these comparisons show that the carbon reduction effect is more obvious after improving the layout patterns of the medical facilities.
In general, by comparing the current situation and the optimized plan, it was found that the carbon reduction effect was significant. In terms of quantity, the monthly travel carbon emissions decreased from 243.56 tons of CO2 in the current situation to 179.97 tons of CO2 in the optimized plan, a decrease of 26.10%. In terms of space, the area covered by the high value of per capita travel carbon emissions in the optimized plan shrank. In terms of the changes in the layout of the medical facilities, the layout in the optimized plan was relatively dispersed in space compared to the current situation. This improves the accessibility of facilities. It shows that the medical facilities in Changxing County under a low-carbon goal should be distributed in the center and surrounding urban areas in a multi-center form. Therefore, to meet the basic standards in the low-carbon planning of the layout of facilities, attention should be paid to improving the service equality for residents and the accessibility of facilities, which can help to form a low-carbon facilities layout pattern. The results confirm that the TS-LC-LPSF method has significant effects on reducing travel carbon emissions. However, when using this method, it should be noted that different layout standards need to be set for different types of facilities.
5. Conclusions and Discussion
In this paper, we proposed an optimization method that takes into account the characteristics of residents’ travel behavior preferences for the LPSF to reduce travel-related carbon emissions. It is an efficient and quantitative spatial planning method and tool for low-carbon LPSF. It makes up for the defect where planning designers can only rely on the emission estimation results to compare different planning options and thus develop control measures. Based on this, we applied this method to the medical facilities in Changxing County, Zhejiang Province, China, as an example and the conclusions and discussion are as follows:
(1) Using the TS-LC-LPSF method to optimize the layouts of the medical facilities, the carbon reduction effect of the optimized plan is significant. The carbon reduction effect of the optimized plan is specifically expressed as the total monthly travel-related carbon emissions in Changxing being reduced by 26.10%. The area covered by the higher per capita carbon emissions has shrunk. The carbon reduction potential is reduced by 56.39%, indicating that the coverage of the facilities serving residents has improved. These results confirm the effectiveness of the TS-LC-LPSF in achieving sustainable land use and planning and can provide scientific and reasonable policy recommendations for spatial planning to reduce travel-related carbon emissions.
(2) Under the constraint of minimizing travel-related carbon emissions, the layouts of the optimized plan are more dispersed in space compared with the current situation and are not concentrated in the urban center. It indicates that the layouts of the medical facilities in Changxing County under the low-carbon goal should be distributed in the center and surrounding urban areas in a multi-center form. This is consistent with the conclusion of Wang et al., who agree that the decentralized arrangement of facilities in a multi-center form can improve the accessibility of those facilities, give residents more equal opportunities to use the facilities and be effective in reducing travel carbon emissions [15]. Therefore, the low-carbon spatial layout planning of the public service facilities should focus on improving the accessibility of those facilities as it is beneficial to the formation of a low-carbon layout pattern.
This paper aims to provide innovative technology for a sustainable LPSF from the perspective of spatial planning. It provides scientific suggestions and an operational planning tool for sustainable land-use policy and low-carbon spatial planning. Currently, more and more county-level towns in China are choosing to urbanize at their original locations to ease the pressures on large cities and promote their own development. In the process, the planning of public service facilities is key. Compared with other studies, it was found that existing planners mostly plan for service facilities based on population, economy, and other aspects, ignoring the environmental impact [56]. This could make public services too distant for some residents, leaving residents to use energy-intensive transportation. Other studies that consider environmental impacts encourage more non-motorized travel and shorter travel distances through spatial planning strategies, but this is not guidance for the specific locations of facilities [57]. So, we have proposed a method to guide the specific locations of public service facilities under low-carbon goals in order to provide more targeted and operational suggestions. This method can also be applied to the low-carbon planning of public service facility layouts in other regions and other types of public service facilities (the classification of facility levels and the selection of suitability evaluation indicators need to be analyzed on a case-by-case basis). In addition, A limitation of the study is that the travel characteristics data used in this paper are mainly from questionnaires, which may cause the residents’ perceptions of their travel times to be inaccurate. The collection of large amount of data in the future is likely to greatly improve the accuracy of calculating travel-related carbon emissions.
Author Contributions
Conceptualization, F.Y.; methodology, F.Y., Y.Z. and N.H.; validation, N.H.; investigation, Y.Z.; data curation N.H. and Y.Z.; writing—original draft, N.H.; writing—reviewing and editing, F.Y. and N.H.; visualization, N.H.; supervision, F.Y.; funding acquisition, F.Y. All authors have read and agreed to the published version of the manuscript.
Funding
This research was funded by the National Key Research and Development Plan Project [grant number 2018YFC0704700]; and the National Natural Science Foundation of China [grant number 51878441].
Conflicts of Interest
The authors declare no conflict of interest.
Appendix A
Electric bicycle carbon emission factor = (electricity consumption for 1 km travel × electricity carbon emission factor)/average number of passengers. The electricity carbon emission factor adopted the average power carbon emission factor of East China regional, which was 0.7035 (kg/kWh). Referring to Zhejiang Province Electric Bicycle Announcement Directory, the average electric consumption of 100 km is 1.5 kWh/60 km and the average passenger loading rate is 1.6. So, we obtained the electric bicycle carbon emission factor in Changxing to be 28.14 g CO2/person-km.

Table A1.
Evaluation criteria and results of influencing factors.
| Criteria | Traffic Convenience | Urban Development Level | Population Distribution | Distance from Flammable and Explosive Sites | |||
|---|---|---|---|---|---|---|---|
| Evaluation Indicators | Accessibility | Distance from All Levels of Roads | Town Level | Population Density | Distance from Refueling Stations | Distance from Chemical Companies | Distance from Fireworks Distribution |
| Value | Criteria | Criteria | Criteria | Criteria | Criteria | Criteria | Criteria |
| 5 | 24.79~30.87 min | distance to national and provincial roads ≤ 500 m or distance to county road and village road ≤ 300 m or distance to town road ≤ 250 m or distance to county center road ≤ 200 m | Central area of county: Zhicheng Town, Huaxi Town, Longshan Town, Taihu Town | >30,000 person/km2 | >3000 m | >5000 m | >3000 m |
| 4 | 30.87~36.95 min | distance to national and provincial roads 500 m~1500 m or distance to county road and village road 300~900 m or distance to town road 250~500 m or distance to county center road 200~400 m | Level 2 township: Si’an Town | 10,000–30,000 person/km2 | 1000–3000 m | 4000–5000 m | 1000–3000 m |
| 3 | 36.95~43.02 min | distance to national and provincial roads 3000~5000 m or distance to county road and village road 1500~3000 m or distance to town road 1000~1500 m or distance to county center road 800~1200 m | Level 3 township: Meishan Town, Heping Town | 5000–10,000 person/km2 | 500–1000 m | 3000–4000 m | 500–1000 m |
| 2 | 43.02~49.10 min | distance to national and provincial roads 3000~5000 m or distance to county road and village road 1500~3000 m or distance to town road or distance to county center road 800~1200 m | Ordinary town | 1500–5000 person/km2 | 300–500 m | 2000–3000 m | 300–500 m |
| 1 | 49.10~55.17 min | distance to national and provincial roads > 5000 m or distance to county road and village road > 3000 m or distance to town road > 1500 m or distance to county center road > 1200 m | others | ≤1500 person/km2 | 50–300 m | 1000–2000 m | 100–300 m |
| 0 | / | / | / | / | ≤50 m | ≤1000 m | ≤100 m |
References
- Gautam, S.; Patra, A.K.; Kumar, P. Status and chemical characteristics of ambient PM2.5 pollutions in China: A review. Environ. Dev. Sustain. 2019, 21, 1649–1674. [Google Scholar]
- Gautam, S.; Yadav, A.; Tsai, C.J.; Kumar, P. A review on recent progress in observations, sources, classification and regulations of PM2.5 in Asian environments. Environ. Sci. Pollut. Res. 2016, 23, 21165–21175. Available online: https://ifbic1b13095ec5284139sqvkvoonx9nbk6wpqfiac.eds.tju.edu.cn/10.1007/s11356-016-7515-2 (accessed on 13 July 2022). [CrossRef] [PubMed]
- Alshqaqeeq, F.; Amin Esmaeili, M.; Overcash, M.; Twomey, J. Quantifying hospital services by carbon footprint: A systematic literature review of patient care alternatives. Resour. Conserv. Recycl. 2020, 154, 104560. [Google Scholar] [CrossRef]
- Walmsley, M.R.W.; Walmsley, T.G.; Atkins, M.J.; Kamp, P.J.J.; Neale, J.R.; Chand, A. Carbon emissions pinch analysis for emissions reductions in the New Zealand transport sector through to 2050. Energy 2015, 92, 569–576. [Google Scholar] [CrossRef]
- International Energy Agency (IEA). CO2 Emissions from Fuel Combustion; IEA: Paris, France, 2019; Available online: https://www.iea.org/reports/co2-emissions-from-fuel-combustion-2019 (accessed on 25 June 2021).
- Hankey, S.; Marshall, J.D. Impacts of urban form on future US passenger-vehicle greenhouse gas emissions. Energy Policy 2010, 38, 4880–4887. [Google Scholar] [CrossRef]
- Anderson, W.P.; Kanaroglou, P.S.; Miller, E.J. Urban Form, Energy and the Environment: A Review of Issues, Evidence and Policy. Urban Stud. 1996, 33, 7–35. [Google Scholar] [CrossRef]
- Geurs, K.T.; van Wee, B. Accessibility evaluation of land-use and transport strategies: Review and research directions. J. Transp. Geogr. 2004, 12, 127–140. [Google Scholar] [CrossRef]
- Næss, P. Urban form and travel behavior: Experience from a Nordic context. J. Transp. Land Use 2012, 5, 21–45. [Google Scholar] [CrossRef]
- Dajani, J.S. Cost Studies of Urban Public Services. Land Econ. 1973, 49, 479. [Google Scholar] [CrossRef]
- Zahabi, S.A.H.; Miranda-Moreno, L.; Patterson, Z.; Barla, P.; Harding, C. Transportation Greenhouse Gas Emissions and its Relationship with Urban Form, Transit Accessibility and Emerging Green Technologies: A Montreal Case Study. Procedia-Soc. Behav. Sci. 2012, 54, 966–978. [Google Scholar] [CrossRef] [Green Version]
- Ma, J.; Zhou, S.; Mitchell, G.; Zhang, J. CO2 emission from passenger travel in Guangzhou, China: A small area simulation. Appl. Geogr. 2018, 98, 121–132. [Google Scholar] [CrossRef]
- Papa, E.; Bertolini, L. Accessibility and Transit-Oriented Development in European metropolitan areas. J. Transp. Geogr. 2015, 47, 70–83. [Google Scholar] [CrossRef] [Green Version]
- Lahtinen, J.; Salonen, M.; Toivonen, T. Facility allocation strategies and the sustainability of service delivery: Modelling library patronage patterns and their related CO2-emissions. Appl. Geogr. 2013, 44, 43–52. [Google Scholar] [CrossRef]
- Wang, W.; Zhou, Z.H.; Chen, J.; Cheng, W.; Chen, J. Analysis of Location Selection of Public Service Facilities Based on Urban Land Accessibility. Int. J. Environ. Res. Public Health 2021, 18, 516. [Google Scholar] [CrossRef]
- Li, J.; Lo, K.; Zhang, P.; Guo, M. Consumer travel behaviors and transport carbon emissions: A comparative study of commercial centers in Shenyang, China. Energies 2016, 9, 765. [Google Scholar] [CrossRef] [Green Version]
- Zhang, R.; Matsushima, K.; Kobayashi, K. Can land use planning help mitigate transport-related carbon emissions? A case of Changzhou. Land Use Policy 2018, 74, 32–40. [Google Scholar] [CrossRef]
- Tang, X.F.; Zhang, J.; Xu, P. A multi-objective optimization model for sustainable logistics facility location. Transp. Res. Part D Transp. Environ. 2013, 22, 45–48. [Google Scholar] [CrossRef]
- Hwang, T.; Lee, M.; Lee, C.; Kang, S. Meta-heuristic approach for high-demand facility locations considering traffic congestion and greenhouse gas emission. J. Environ. Eng. Landsc. Manag. 2016, 24, 233–244. [Google Scholar] [CrossRef] [Green Version]
- Liu, Z.; Ma, J.; Chai, Y. Neighbourhood-scale urban form, travel behaviour, and CO2 emissions in Beijing: Implications for low-carbon urban planning. Urban Geogr. 2017, 38, 381–400. [Google Scholar] [CrossRef]
- Jarass, J.; Scheiner, J. Residential self-selection and travel mode use in a new inner-city development neighbourhood in Berlin. J. Transp. Geogr. 2018, 70, 68–77. [Google Scholar] [CrossRef]
- Neutens, T.; Delafontaine, M.; Scott, D.M.; De Maeyer, P. A GIS-based method to identify spatiotemporal gaps in public service delivery. Appl. Geogr. 2012, 32, 253–264. [Google Scholar] [CrossRef] [Green Version]
- Tao, Z.L.; Cheng, Y.; Dai, T.Q.; Rosenberg, M.W. Spatial Optimization of Residential Care Facility Locations in Beijing, China: Maximum Equity in Accessibility. Int. J. Health Geogr. 2014, 13, 33. [Google Scholar] [CrossRef] [PubMed] [Green Version]
- Lira-Barragán, L.F.; Ponce-Ortega, J.M.; Serna-González, M.; El-Halwagi, M.M. An MINLP model for the optimal location of a new industrial plant with simultaneous consideration of economic and environmental criteria. Ind. Eng. Chem. Res. 2011, 50, 953–964. [Google Scholar] [CrossRef]
- Church, R.L.; Scaparra, M.P.; Middleton, R.S. Identifying critical infrastructure: The median and covering facility interdiction problems. Ann. Assoc. Am. Geogr. 2004, 94, 491–502. [Google Scholar] [CrossRef]
- Tao, Z.L.; Zheng, Q.; Kong, H. A Modified Gravity p-Median Model for Optimizing Facility Locations. J. Syst. Sci. Inf. 2019, 6, 421–434. [Google Scholar] [CrossRef]
- Wei, X.; Quan, T. The low-carbon influencing mechanism of spatial characteristic parameters in China’s residential communities. J. Asian Archit. Build. Eng. 2021, 20, 88–100. [Google Scholar] [CrossRef]
- Chen, L.J.; Olhager, J.; Tang, O. Manufacturing facility location and sustainability: A literature review and research agenda. Int. J. Prod. Econ. 2014, 149, 154–163. [Google Scholar] [CrossRef] [Green Version]
- Tao, Z.L.; Cheng, Y.; Dai, T.Q.; Zheng, Q.J. Research progress and prospect of public service facilities layout optimization models. City Plan Rev. 2019, 43, 60–68. [Google Scholar] [CrossRef]
- Fadda, E.; Manerba, D.; Cabodi, G.; Camurati, P.E.; Tadei, R. Comparative analysis of models and performance indicators for optimal service facility location. Transp. Res. Part E Logist. Transp. Rev. 2021, 145, 102174. [Google Scholar] [CrossRef]
- Dai, H.; Mischke, P.; Xie, X.; Xie, Y.; Masui, T. Closing the gap? Top-down versus bottom-up projections of China’s regional energy use and CO2 emissions. Appl. Energy 2016, 162, 1355–1373. [Google Scholar] [CrossRef]
- Selvakkumaran, S.; Limmeechokchai, B. Low carbon society scenario analysis of transport sector of an emerging economy—The aim/enduse modelling approach. Energy Policy 2015, 81, 199–214. [Google Scholar] [CrossRef]
- IPCC. 2006 IPCC Guidelines for National Greenhouse Gas Inventories. 2006. Available online: https://www.ipcc-nggip.iges.or.jp/public/2006gl/chinese/index.html (accessed on 8 December 2020).
- Wang, Z.; Chen, F.; Fujiyama, T. Carbon emission from urban passenger transportation in Beijing. Transp. Res. Part D Transp. Environ. 2015, 41, 217–227. [Google Scholar] [CrossRef]
- Tichavska, M.; Tovar, B. Environmental cost and eco-efficiency from vessel emissions in Las Palmas Port. Transp. Res. Part E Logist. Transp. Rev. 2015, 83, 126–140. [Google Scholar] [CrossRef]
- Zeng, Y.; Tan, X.; Gu, B.; Wang, Y.; Xu, B. Greenhouse gas emissions of motor vehicles in Chinese cities and the implication for China’s mitigation targets. Appl. Energy 2016, 184, 1016–1025. [Google Scholar] [CrossRef]
- Ma, J.; Heppenstall, A.; Harland, K.; Mitchell, G. Synthesising carbon emission for mega-cities: A static spatial microsimulation of transport CO2 from urban travel in Beijing. Comput. Environ. Urban Syst. 2014, 45, 78–88. [Google Scholar] [CrossRef]
- Howitt, O.J.; Revol, V.G.; Smith, I.J.; Rodger, C.J. Carbon emissions from international cruise ship passengers’ travel to and from New Zealand. Energy Policy 2010, 38, 2552–2560. [Google Scholar] [CrossRef]
- Huang, D.; Yu, J.; Shen, S.; Li, Z.; Zhao, L.; Gong, C. A Method for Bus OD Matrix Estimation Using Multisource Data. J. Adv. Transp. 2020, 2020, 5740521. [Google Scholar] [CrossRef]
- Mokhtarian, P.L.; Cao, X. Examining the impacts of residential self-selection on travel behavior: A focus on methodologies. Transp. Res. Part B Methodol. 2008, 42, 204–228. [Google Scholar] [CrossRef] [Green Version]
- Cao, X.; Mokhtarian, P.L.; Handy, S.L. Examining the impacts of residential self-selection on travel behaviour: A focus on empirical findings. Transp. Rev. 2009, 29, 359–395. [Google Scholar] [CrossRef]
- Huff, D.L.; Parameter Estimation in the Huff Model. ArcUser. 2003, Volume 3. Available online: www.esri.com (accessed on 10 October 2019).
- Peeters, D.; Thomas, I. Distance predicting functions and applied location-allocation models. J. Geogr. Syst. 2000, 2, 167–184. [Google Scholar] [CrossRef]
- Hakimi, S.L. Optimum locations of switching centers and the absolute centers and medians of a graph. Oper. Res. 1964, 12, 450–459. [Google Scholar] [CrossRef]
- Zaferanieh, M.; Abareshi, M.; Fathali, J. The minimum information approach to the uncapacitated p-median facility location problem. Transp. Lett. 2022, 14, 307–316. [Google Scholar] [CrossRef]
- Klose, A.; Drexl, A. Facility location models for distribution system design. Eur. J. Oper. Res. 2005, 162, 4–29. [Google Scholar] [CrossRef] [Green Version]
- Møller-Jensen, L.; Kofie, R.Y. Exploiting available data sources: Location/allocation modeling for health service planning in rural Ghana. Geogr. Tidsskr. 2001, 101, 145–153. [Google Scholar] [CrossRef]
- Asadi-Shekari, Z.; Moeinaddini, M.; Zaly Shah, M. A pedestrian level of service method for evaluating and promoting walking facilities on campus streets. Land Use Policy 2014, 38, 175–193. [Google Scholar] [CrossRef]
- Gan, J.; Li, L.; Xiang, Q.; Ran, B. A prediction method of GHG emissions for urban road transportation planning and its applications. Sustainability 2020, 12, 10251. [Google Scholar] [CrossRef]
- Liu, H.; Yan, F.; Tian, H. A vector map of carbon emission based on point-line-area carbon emission classified allocation method. Sustainability 2020, 12, 10058. [Google Scholar] [CrossRef]
- Chai, Y.W.; Xiao, Z.P.; Liu, Z.L. Comparative Analysis on CO2 Emission Per Household in Daily Travel Based on Spatial Behavior Constraints. Sci. Geogr. Sinica 2011, 31, 843–849. [Google Scholar] [CrossRef]
- Lee, A.H.I.; Kang, H.Y.; Hsu, C.F.; Hung, H.C. A green supplier selection model for high-tech industry. Expert Syst. Appl. 2009, 36, 7917–7927. [Google Scholar] [CrossRef]
- He, X.H.; Cao, Z.C.; Zhang, S.L.; Liang, S.M.; Zhang, Y.Y.; Ji, T.B.; Shi, Q. Coordination Investigation of the Economic, Social and Environmental Benefits of Urban Public Transport Infrastructure in 13 Cities, Jiangsu Province, China. Int. J. Environ. Res. Public Health 2020, 17, 6809. [Google Scholar] [CrossRef] [PubMed]
- Garcia-Sierra, M.; van den Bergh, J.C.J.M.; Miralles-Guasch, C. Behavioural economics, travel behaviour and environmental-transport policy. Transp. Res. Part D Transp. Environ. 2015, 41, 288–305. [Google Scholar] [CrossRef]
- Cao, X.; Yang, W. Examining the effects of the built environment and residential self-selection on commuting trips and the related CO2 emissions: An empirical study in Guangzhou, China. Transp. Res. Part D Transp. Environ. 2017, 52, 480–494. [Google Scholar] [CrossRef]
- Shi, Y.; Yang, J.; Shen, P. Revealing the Correlation between Population Density and the Spatial Distribution of Urban Public Service Facilities with Mobile Phone Data. ISPRS Int. J. Geo-Inf. 2020, 9, 38. [Google Scholar] [CrossRef] [Green Version]
- Van Acker, V.; Witlox, F. Car ownership as a mediating variable in car travel behaviour research using a structural eq-uation modelling approach to identify its dual relationship. J. Transp. Geogr. 2010, 18, 65–74. [Google Scholar] [CrossRef] [Green Version]
Figure 1.
The framework of TS-LC-LPSF.
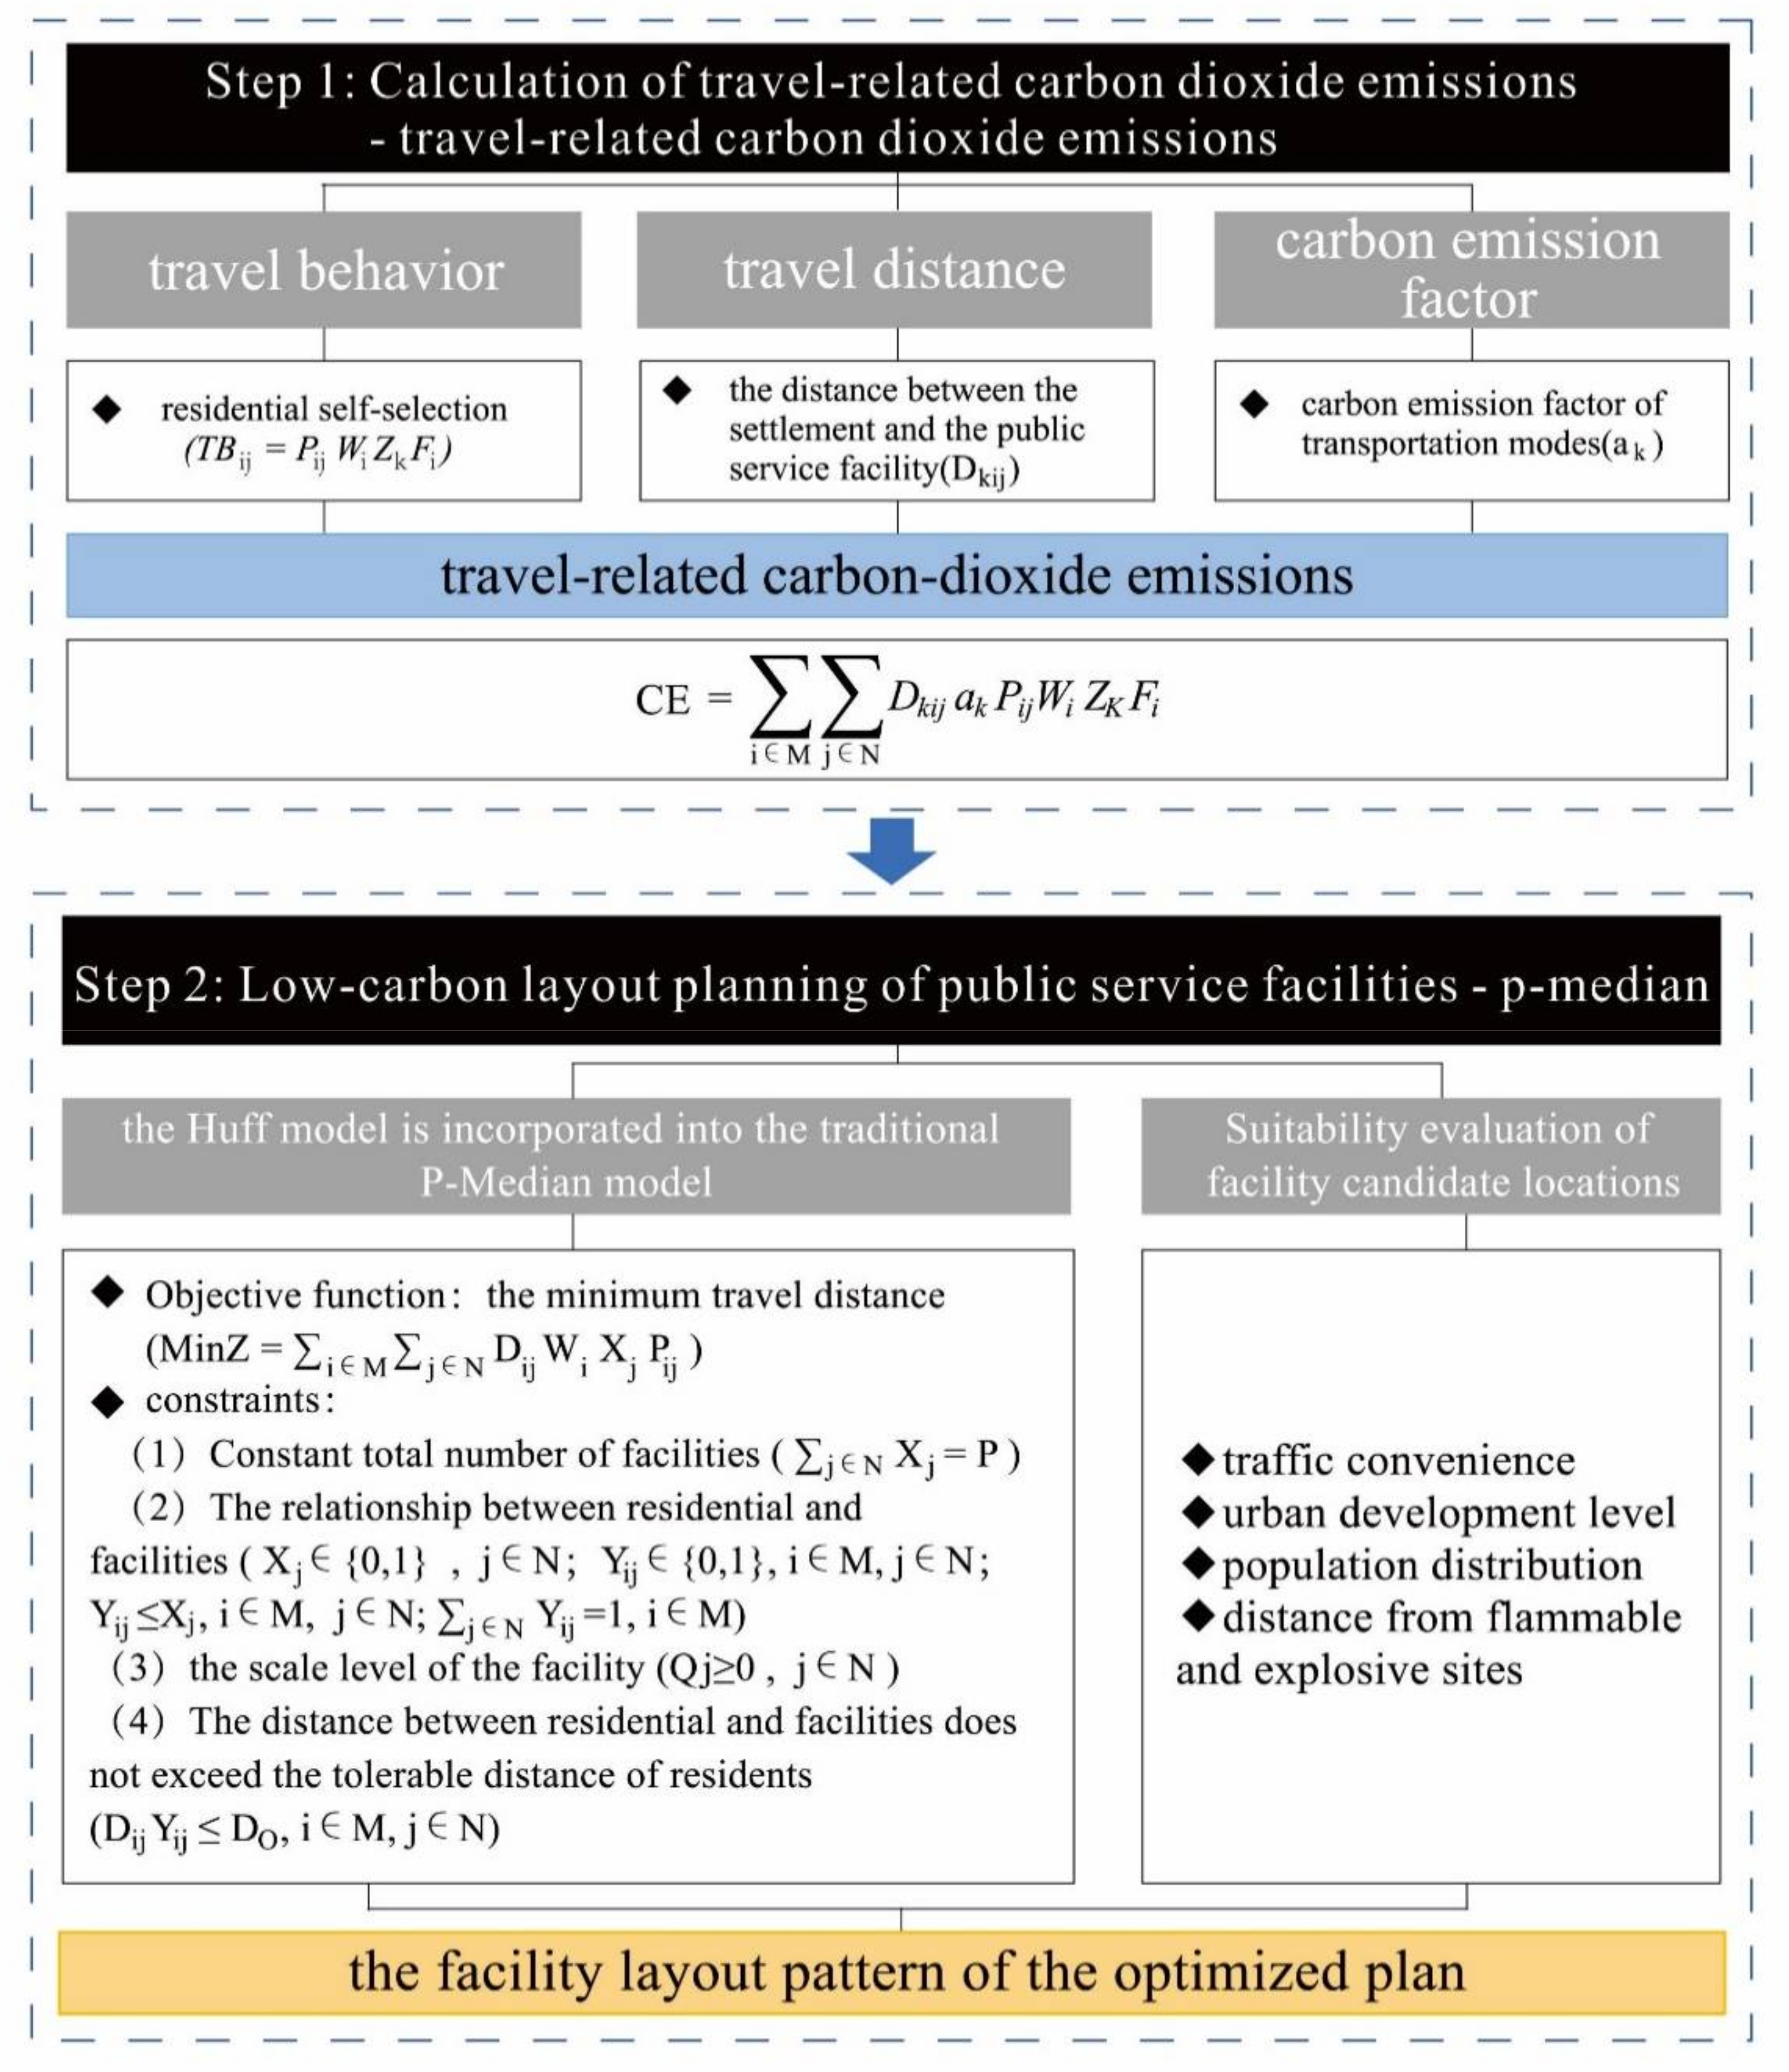
Figure 2.
Process of the TS-LC-LPSF and results.

Figure 3.
Study area.
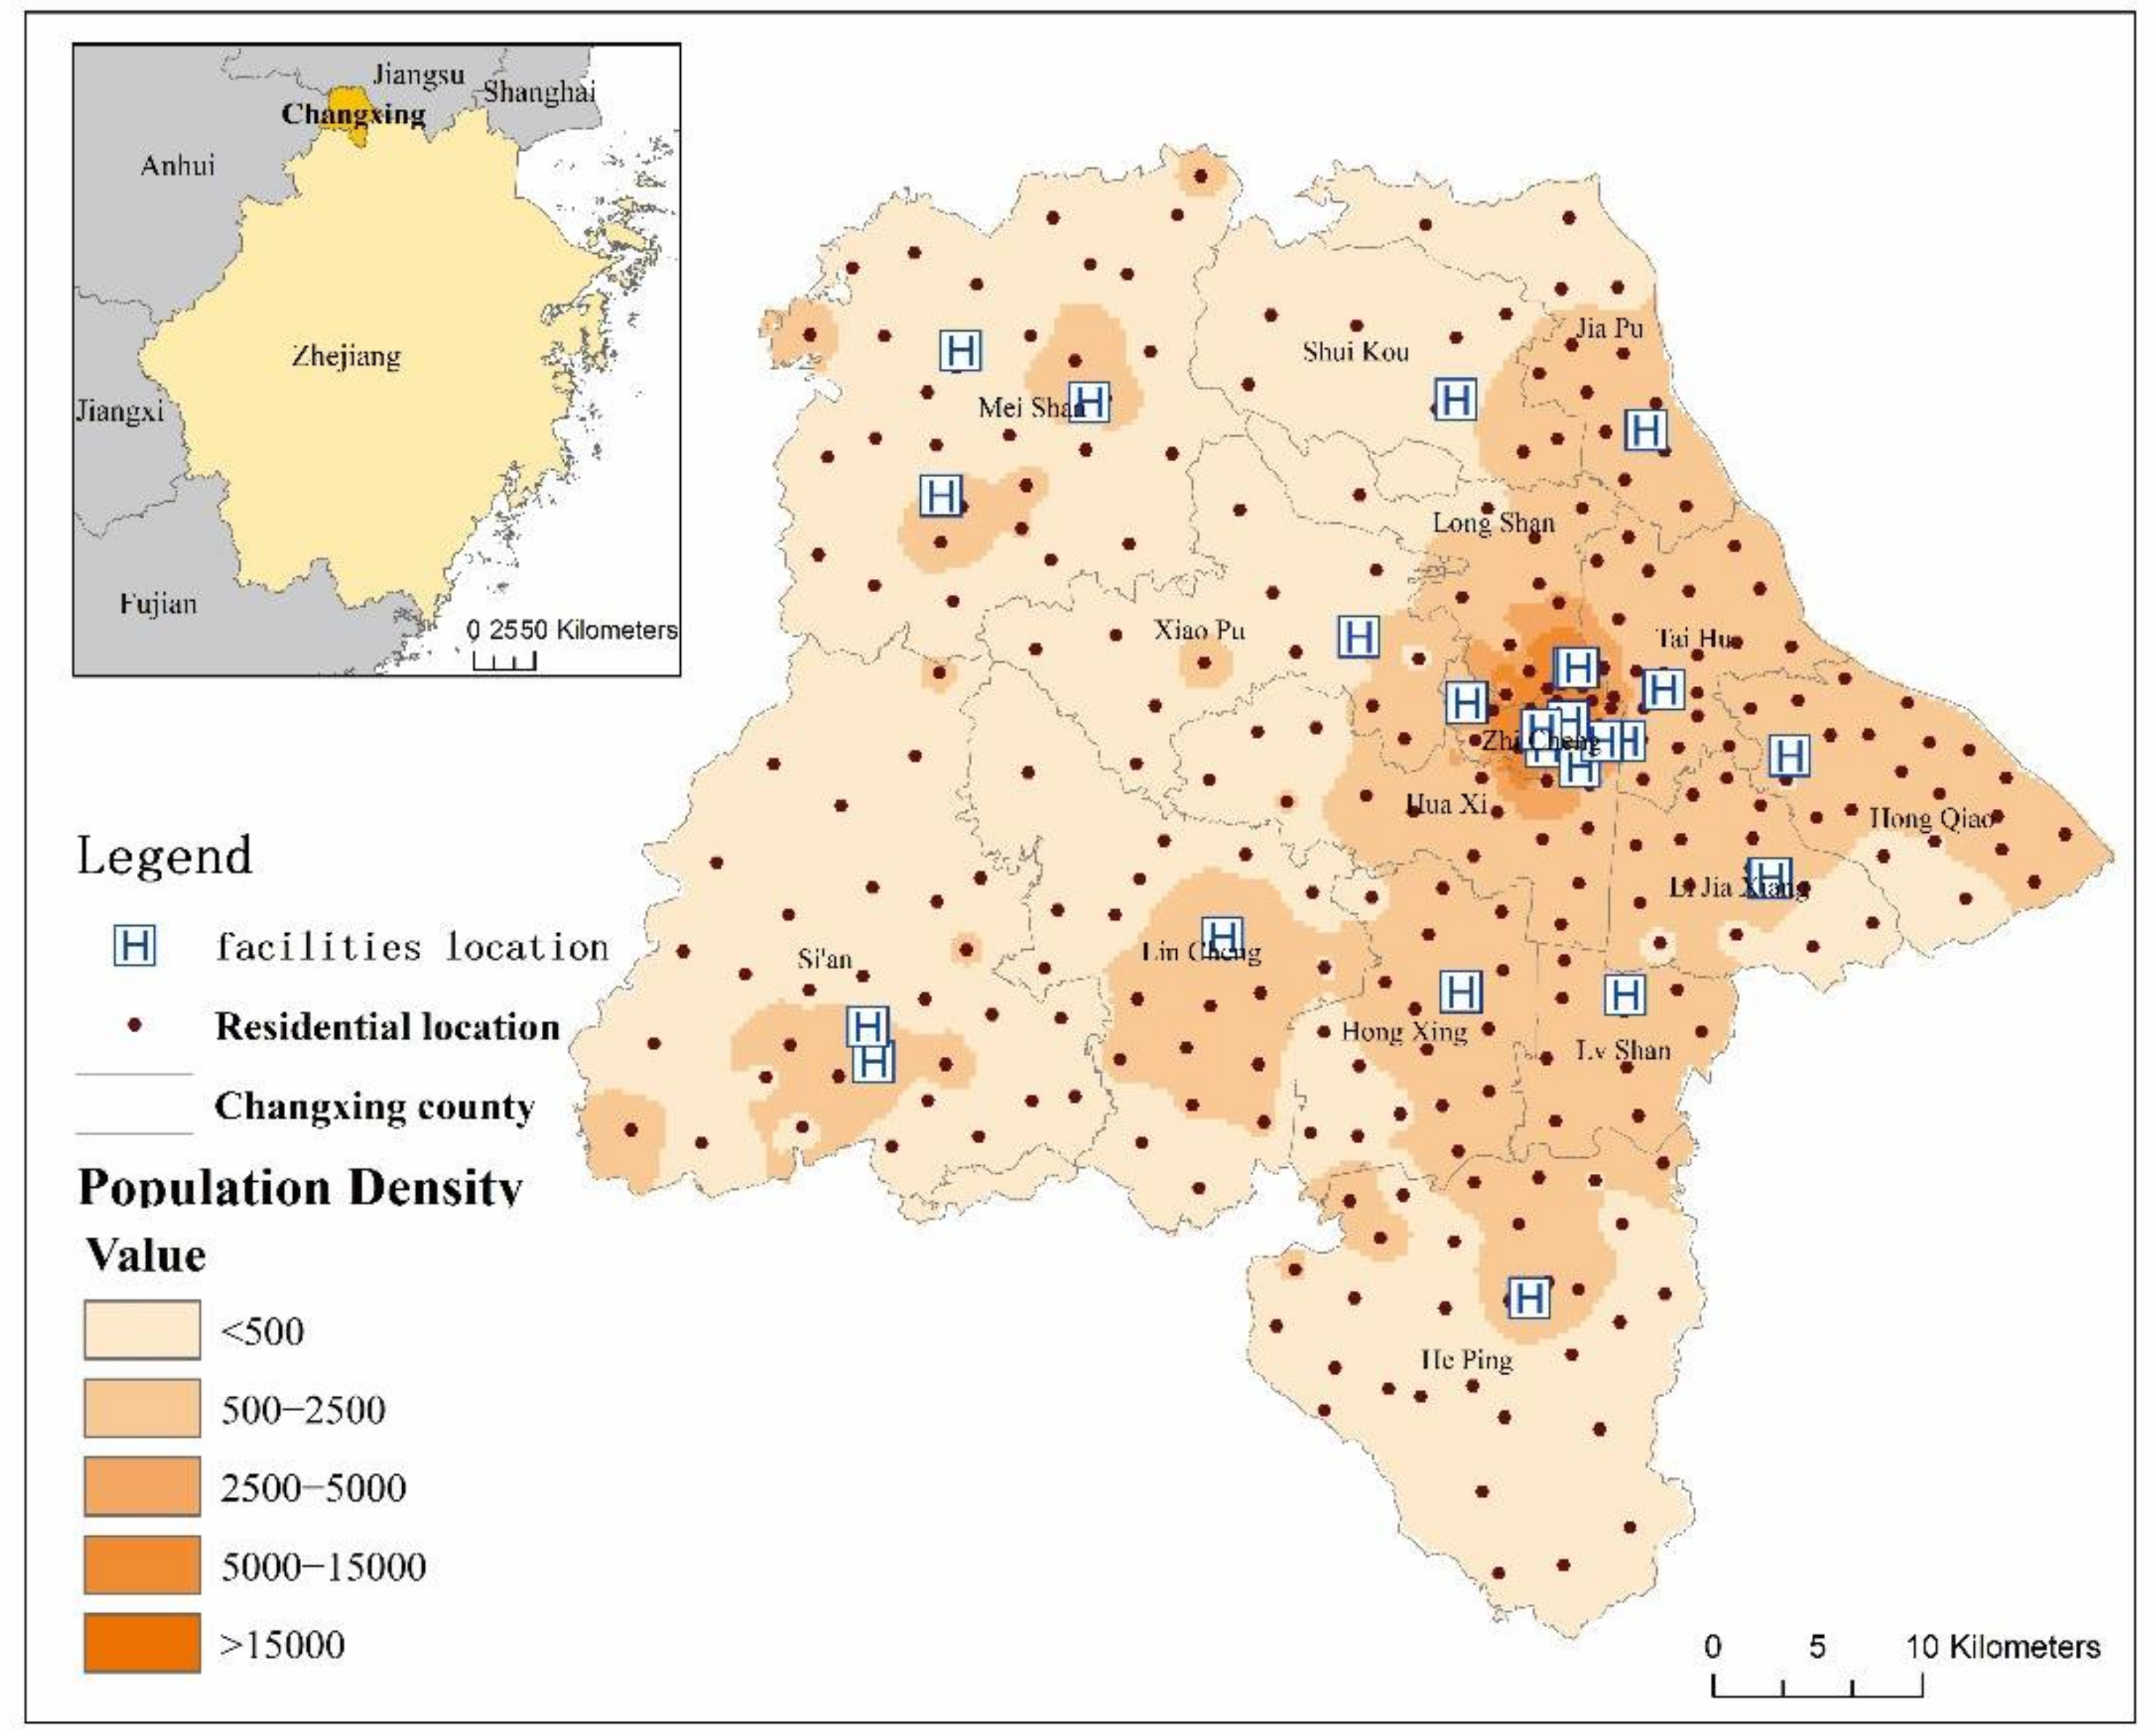
Figure 4.
Three levels of medical facility layouts in Changxing in the current situation.
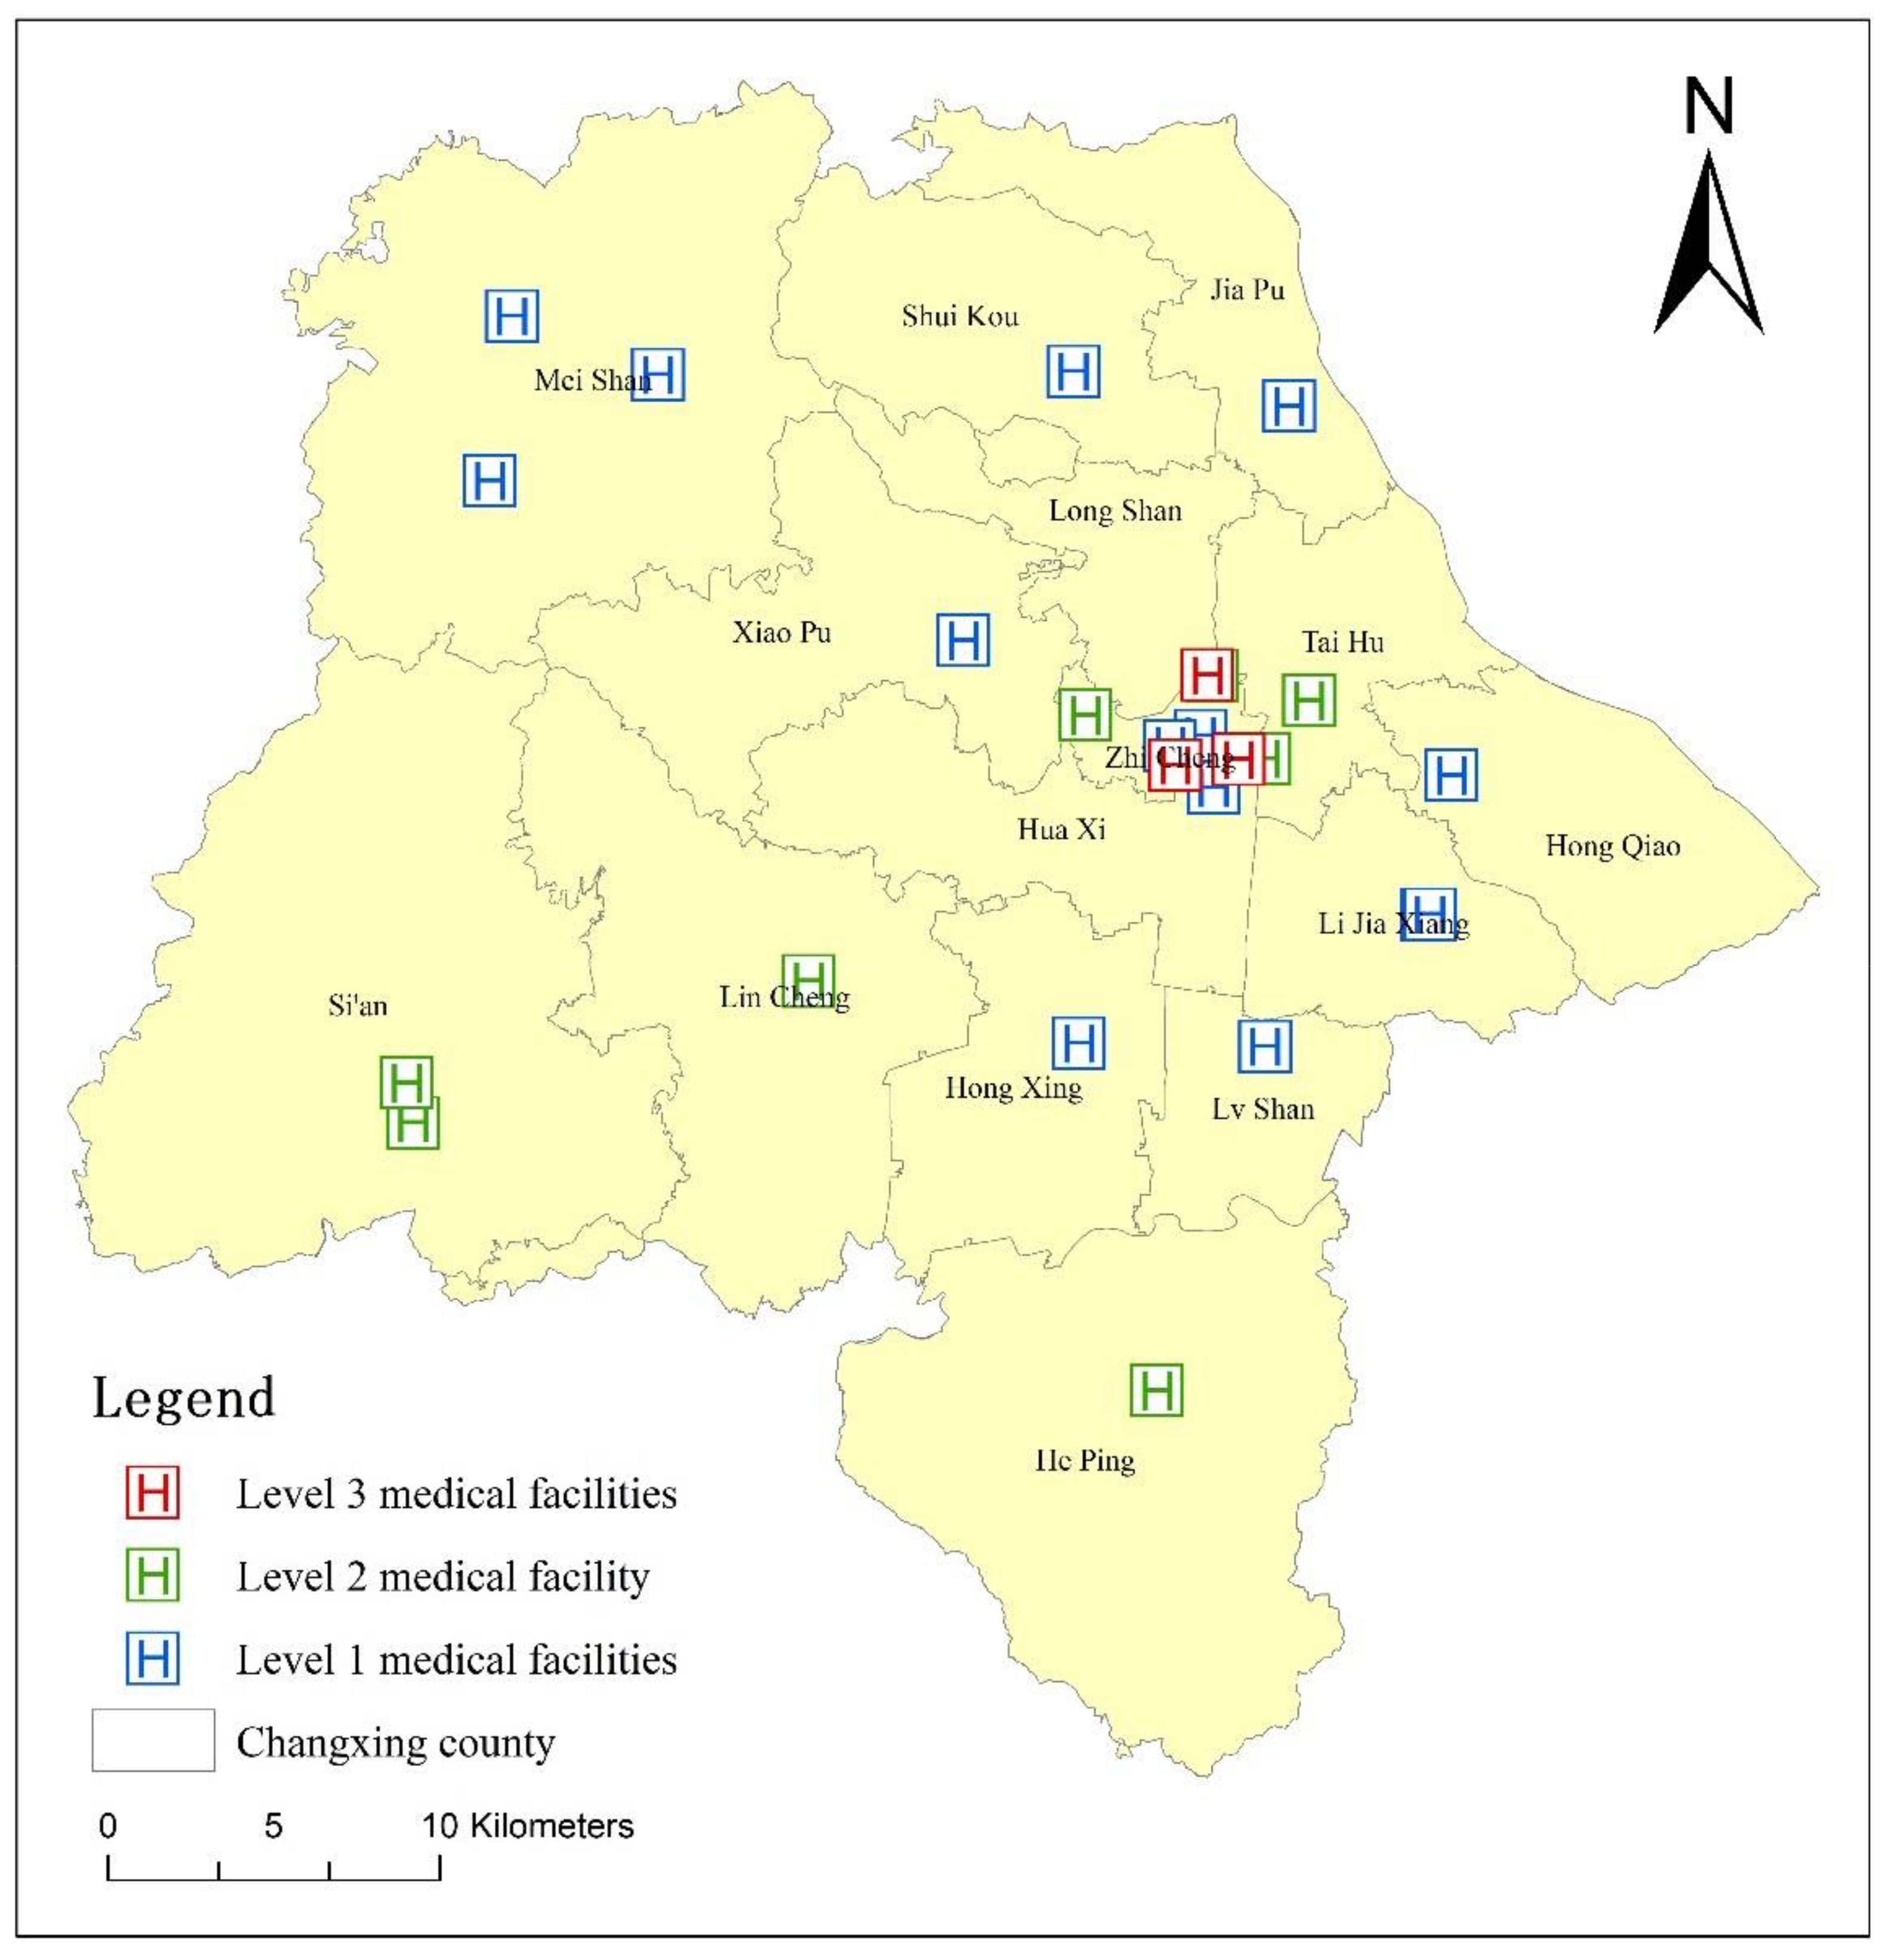
Figure 5.
(a–c) Changes in the locations of medical facilities.

Figure 6.
Changes in the quantitative structure of travel-related carbon emissions.

Figure 7.
Changes in the spatial distribution of per capita carbon emissions (a) current situation (b) optimized plan.
Figure 7.
Changes in the spatial distribution of per capita carbon emissions (a) current situation (b) optimized plan.

Figure 8.
Changes in carbon reduction potential.
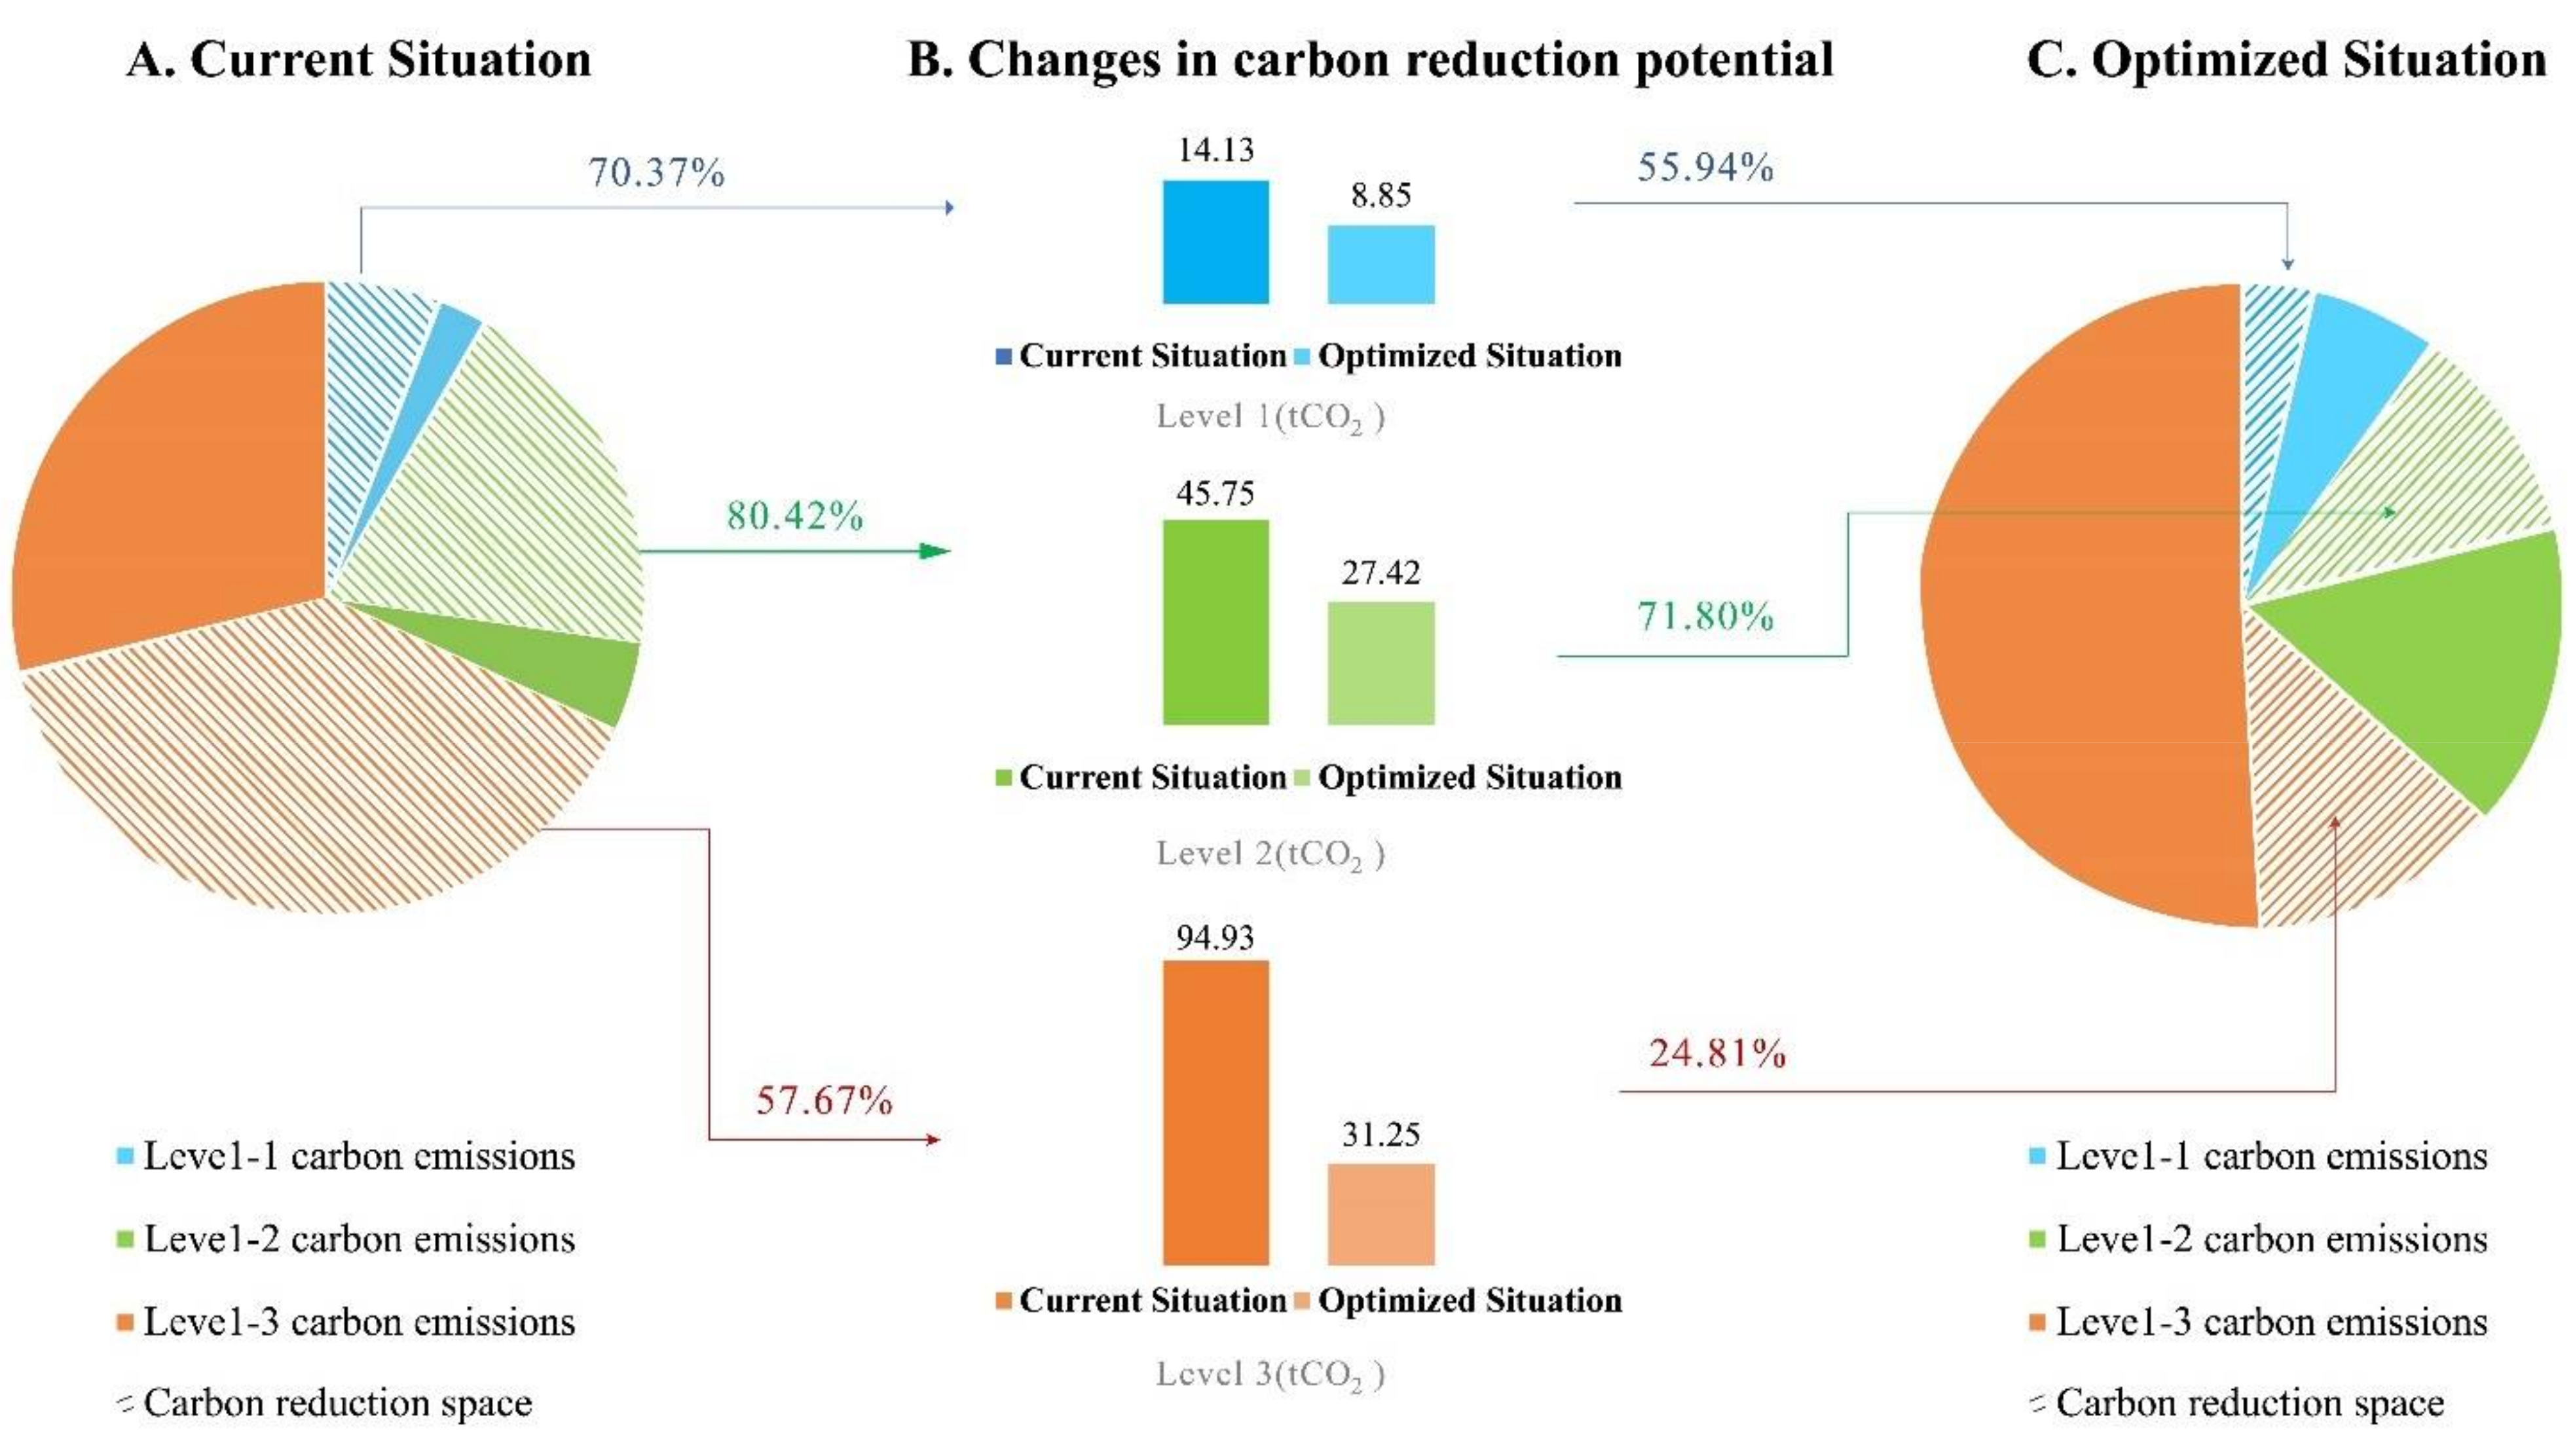
Table 1.
The summary of researches on the relationship between the LPSF and travel carbon emissions.
Table 1.
The summary of researches on the relationship between the LPSF and travel carbon emissions.
| Study Area (Place) | Pollutant Types | Key Observations | Author (Year) |
|---|---|---|---|
| Montreal, Canada | transportation greenhouse gas emissions | For every 10% increase in the accessibility of public service facilities in the built environment, there was a corresponding 5.8% reduction in transportation greenhouse gases. | [11] Zahabi et al. (2012) |
| Guangzhou, China | travel-related CO2 emissions | Poorer accessibility of public service facilities in remote urban areas or newly developed urban areas usually generates more travel-related carbon emissions. | [12] Ma et al. (2018) |
| Helsinki, Finnish | travel-related CO2 emissions | They estimated the travel carbon emissions generated by residents arriving at libraries in the Finnish capital region. | [14] Lahtinen et al. (2013) |
| Four typical counties in China | travel-related CO2 emissions | They calculated the carbon emissions of educational and medical-facility-related trips. | [15] Wang et al. (2021) |
| Shenyang, China | travel-related CO2 emissions | They measured the travel carbon emissions generated by consumers’ travel to commercial centers of different levels in the city of Shenyang. | [16] Li et al. (2016) |
| Changzhou, China | transport-related carbon emissions | Land-use planning can help mitigate transport-related carbon emissions | [17] Zhang et al. (2018) |
| China | CO2 emissions from transport activities | They proposed a multi-objective optimization model based on the classic facility location problem, which maximizes the reliability of services and minimizes CO2 emissions from transport activities. | [18] Tang et al. (2013) |
| Incheon, Republic of Korea | vehicle emissions | They proposed a new location model for high-demand facilities in urban areas with incorporation of the traffic congestion and greenhouse gas emissions costs. | [19] Hwang et al. (2016) |
Table 2.
Datasets used in the analyses.
| Type | Subtype | Value | Source | ||
|---|---|---|---|---|---|
| Travel behavior | Facility level | Level 1 | Level 2 | Level 3 | |
| Tolerance time (min) | 12 | 12 | 25 | The average of the questionnaire results | |
| Tolerance distance (km) | 9.66 | 4.48 | 4.48 | The calculation of the road traffic network datasets | |
| Frequency of travel (times/month) | 0.44 | 0.44 | 0.6 | Questionnaire | |
| Population of residential (104) | 63.32 | Changxing Public Security Bureau | |||
| Spatial data | Locations of medical facilities | 25 medical facilities | https://www.metrodata.cn/ (accessed on 3 March 2020) | ||
| Locations of residentials | 277 residentials | Changxing Construction Bureau | |||
| Road Average speed (km/h) | highway | 80 | Changxing Transportation Bureau | ||
| national road | 45 | ||||
| provincial road | 40 | ||||
| county/township road | 45 | ||||
| county center main road | 15 | ||||
| county center submain road | 15 | ||||
| town road | 25 | ||||
| village road | 35 | ||||
| Carbon emission factor | car | 135 g CO2/person-km | [51] Chai et al., 2011 | ||
| bus | 35 g CO2/person-km | [51] Chai et al., 2011 | |||
| motorcycle | 113.6 g CO2/person-km | TREMOVE model * | |||
| electric bicycle | 28.14 g CO2/person-km | The results of this paper | |||
* Full documentation on TREMOVE II model can be found on www.TREMOVE.ORG (accessed on 25 March 2020).
Table 3.
Candidate location suitability evaluation indicators for medical facilities.
| Evaluation Criteria | Traffic Convenience | Urban Development Level | Population Distribution | Distance from Flammable and Explosive Sites | |||
|---|---|---|---|---|---|---|---|
| Evaluation Indicators | Accessibility | Distance from All Levels of Roads | Town System Level | Population Density | Distance from Refueling Stations | Distance from Chemical Companies | Distance from Fireworks Distribution |
| AHP | 0.3317 | 0.0594 | 0.1229 | 0.4421 | 0.0212 | 0.0199 | 0.0028 |
| Entropy method | 0.0113 | 0.0462 | 0.1422 | 0.6436 | 0.1323 | 0.0127 | 0.0117 |
| Combination | 0.2738 | 0.0752 | 0.1833 | 0.7376 | 0.0955 | 0.0235 | 0.0092 |
Table 4.
Evaluation indicators of the levels of Changxing medical facilities.
| Factors | Variable | Indicator Items |
|---|---|---|
| Health technical personnel | X1 | Number of practicing physicians |
| X2 | Number of practicing assistant physicians | |
| X3 | Number of registered nurses | |
| X4 | Number of pharmaceutical personnel | |
| X5 | Number of inspectors | |
| X6 | Number of imaging staff | |
| X7 | Number of other health technicians | |
| Medical equipment | X8 | Number of beds |
| X9 | Number of managers | |
| Availability of diagnosis and treatment services | X10 | Total number of patients |
| X11 | Number of discharged patients |
Table 5.
Evaluating results of the level of Changxing medical facilities.
| Serial Number | Hospital Name | Service Capacity Composite Score | Grade Delineation |
|---|---|---|---|
| 1 | Changxing People’s Hospital | 10,001.000 | 3 |
| 2 | Changxing Hospital of Traditional Chinese Medicine | 5998.897 | 3 |
| 3 | Medical Health Group Changxing Hospital | 3046.554 | 3 |
| 4 | Changxing Maternal and Child Health Center | 2985.480 | 2 |
| 5 | Changxing Guotai Rehabilitation Hospital | 2527.579 | 2 |
| 6 | Urban community health centers | 2204.076 | 2 |
| 7 | Siuan Township Health Center | 1934.307 | 2 |
| 8 | Changxing Second Hospital | 1856.652 | 2 |
| 9 | Peace Town Health Center | 1773.256 | 2 |
| 10 | Lincheng Health Center | 1621.701 | 2 |
| 11 | Changxing Pheasant State Hospital | 1589.449 | 2 |
| 12 | Jipu Town Health Center | 1165.906 | 1 |
| 13 | Painted Brook Street Health Service Center | 1013.162 | 1 |
| 14 | Hongxingqiao Town Health Center | 1011.859 | 1 |
| 15 | Xiaopu Town Health Center | 616.592 | 1 |
| 16 | Lijiaxiang Town Health Center | 587.295 | 1 |
| 17 | Shuikou Township Health Center | 506.829 | 1 |
| 18 | Lushan Township Health Center | 489.776 | 1 |
| 19 | Hongqiao Township Health Center | 432.515 | 1 |
| 20 | Meishan Township Health Center | 377.918 | 1 |
| 21 | Baekhyan Health Center | 363.325 | 1 |
| 22 | Changxing Minfu Hospital of Traditional Chinese Medicine | 306.782 | 1 |
| 23 | Sopoikan Health Center | 298.035 | 1 |
| 24 | Lee’s Lane Rehabilitation and Care Hospital | 211.679 | 1 |
| 25 | Sanshi Cement Company Staff Hospital | 57.767 | 1 |
Table 6.
Comparison of per capita carbon emissions.
| Per Capita Travel Carbon Emissions by Class | Monthly Average CO2 (kg/Person) | Rate of Reduction in Per Capita CO2 | |
|---|---|---|---|
| Average travel carbon emissions from visits to level 1 medical facilities | current situation | 0.095 | 22.14% |
| optimized plan | 0.074 | ||
| Average travel carbon emissions from visits to level 2 medical facilities | current situation | 0.032 | 32.33% |
| optimized plan | 0.022 | ||
| Average travel carbon emissions from visits level 3 medical facilities | current situation | 0.012 | 16.76% |
| optimized plan | 0.010 | ||
Publisher’s Note: MDPI stays neutral with regard to jurisdictional claims in published maps and institutional affiliations. |
© 2022 by the authors. Licensee MDPI, Basel, Switzerland. This article is an open access article distributed under the terms and conditions of the Creative Commons Attribution (CC BY) license (https://creativecommons.org/licenses/by/4.0/).
Share and Cite
MDPI and ACS Style
Yan, F.; Huang, N.; Zhang, Y. How Can the Layout of Public Service Facilities Be Optimized to Reduce Travel-Related Carbon Emissions? Evidence from Changxing County, China. Land 2022, 11, 1200. https://doi.org/10.3390/land11081200
AMA Style
Yan F, Huang N, Zhang Y. How Can the Layout of Public Service Facilities Be Optimized to Reduce Travel-Related Carbon Emissions? Evidence from Changxing County, China. Land. 2022; 11(8):1200. https://doi.org/10.3390/land11081200
Chicago/Turabian StyleYan, Fengying, Ningyu Huang, and Yehui Zhang. 2022. "How Can the Layout of Public Service Facilities Be Optimized to Reduce Travel-Related Carbon Emissions? Evidence from Changxing County, China" Land 11, no. 8: 1200. https://doi.org/10.3390/land11081200
Note that from the first issue of 2016, this journal uses article numbers instead of page numbers. See further details here.