
Which Factors Influence the Regional Difference of Urban–Rural Residential CO2 Emissions? A Case Study by Cross-Regional Panel Analysis in China

1
Institute of Geographic Sciences and Natural Resources Research, Chinese Academy of Sciences, Beijing 100101, China
2
University of Chinese Academy of Sciences, Beijing 100049, China
3
Guangdong Key Laboratory for Urbanization and Geo-Simulation, School of Geography and Planning, Sun Yat-Sen University, Guangzhou 510275, China
4
Institute of Mountain Hazards and Environment, Chinese Academy of Sciences, Chengdu 610041, China
*
Author to whom correspondence should be addressed.
Land 2022, 11(5), 632; https://doi.org/10.3390/land11050632
Submission received: 14 March 2022
/
Revised: 13 April 2022
/
Accepted: 21 April 2022
/
Published: 25 April 2022
(This article belongs to the Special Issue The Eco-Environmental Effects of Urban Land Use)
Abstract
:Residential CO2 emissions (RCE) are an important component of anthropogenic CO2 emissions. In order to formulate reasonable reduction policies and measures, it is necessary to understand the dynamics of RCE production and the factors that influence it. This paper explores the spatiotemporal evolution characteristics of RCE from the perspectives of eastern, central, and western China, as well as urban–rural areas, and analyzes the factors driving RCE based on the STIRPAT model. The results indicated that between 2010 and 2019 the eastern region contributed the greatest proportion of overall RCE and the central region saw the largest increase. Per capita RCE in urban areas was greater than in rural areas, except in eastern China. The factors affecting RCE showed regional and urban–rural differences. Population size and income per capita were two dominant factors affecting RCE for all regions. The per capita income plays a more important role in developed regions such as eastern regions and eastern urban areas. Urbanization contributed to RCE reduction in the eastern region but promoted RCE in the central and western regions. Energy structure shows a negative effect on RCE, particularly in central urban and western rural areas. Appropriate policies and measures need to be put forward to local conditions. Reduction policies and measures of each region and urban–rural area need to be based on the dominant factors driving CO2 emissions.
1. Introduction
To tackle climate change, the Chinese government is striving to control carbon emissions and to simultaneously increase carbon sinks in order to reach the peak of carbon emissions by 2030 and achieve carbon neutrality by 2060. Studies have shown that the amount of carbon sequestered by terrestrial ecosystems in China has been much smaller than the amount of anthropogenic CO2 emissions during the same periods [1]. Therefore, along with increasing the carbon sequestration capacity of terrestrial ecosystems, reducing anthropogenic CO2 emissions to mitigate climate change is the key strategy for achieving carbon neutrality goals [2].
“Realize modernization by 2035” was proposed in the report of the 19th National Congress of the Communist Party of China. Bringing people’s well-being to a new level is the main goal of the government’s “14th Five-year Plan”. Both modernization and improvement of people’s living standards are based on economic development. How to strike a balance between achieving economic development and mitigating climate change? It’s a key problem that the Chinese government needs to solve.
The residential sector consumes 27% of global energy and contributes 17% of CO2 emissions [3]. Residential CO2 emissions (RCE) therefore make an important contribution to overall CO2 emissions [4,5]. China is the most populous country in the world, reaching a total of 1.47 billion people by the end of 2020. Large-scale population consumes a lot of energy. Residential energy consumption in China accounts for about 25% of total energy consumption [6]. With the rapid growth of China’s economy, residential living standards have been constantly improving. The number of household appliances rose rapidly, which led to an increase in residential energy consumption and corresponding CO2 emissions. Moreover, Chinese per capita CO2 emissions are much lower than those of developed countries in Europe and North America [7]. China’s RCEs still have great potential to increase further.
RCEs are influenced by economic development level, population size, urbanization level, lifestyle, social values, and other factors; demographic and economic indicators are considered as the most effective factors [8,9,10,11,12,13]. Industrialization and urbanization development has been imbalanced in China in the past decades and population and economic activities are concentrated in the economically developed areas. Major urban agglomeration and economic belts enjoy high levels of economic development and shelter large populations. However, central and western China and rural areas carry relatively few people within the wider area. Population spatial distribution characteristics lead to regional differences in RCE [14]. Uneven economic growth and the dramatic changes in the living standards of urban and rural residents have also led to regional and urban–rural differences in RCE [15,16]. RCE research needs to focus on the impact of the development level gap on emissions.
Urban–rural differences exist within the eastern, central, and western regions and characteristics vary from region to region. Recent studies focused solely on regional differences or urban–rural differences [5,16,17,18,19,20,21]. The policies formulated are not comprehensive and are poorly targeted. Carrying out urban–rural RCE research from region to region is conducive to further and accurately analyzing the influencing factors and is conducive to more targeted policy formulation. To fill this gap, this paper analyzes the determinants of urban–rural RCE in eastern, central, and western China, respectively, by the STIRPAT (stochastic impacts by regression on population, affluence, and technology) model. It is of great significance to reduce carbon emissions and to achieve carbon peak and carbon neutrality in the future.
2. Literature Review
Carbon emission and RCE have been hot research issues at home and abroad in recent years [3,13,22,23]. Previous studies have shown the importance of carbon emissions and their main driving factors. Developed countries have shown a promising trend of declining RCE [3]. However, the improvement in living standards triggers consumer demand, thus causing rapid growth in fossil energy requirements, becoming a new source of growth in carbon emissions. Developing countries have become a major contributor to the growth of carbon emissions in the world [9,11].
RCEs are sensitive to regional heterogeneity due to resource endowment, economic development levels, and lifestyles. The Beijing–Tianjin–Hebei region, the Yangtze River Delta, and the Pearl River Delta are the main regions with high CO2 emissions, and they are expanding outward over time [24]. From a provincial perspective, Guangdong, Jiangsu, Hebei, Henan, Zhejiang, and Anhui are the main provinces needing to reduce greenhouse gases in the future, which will account for more than 40% of national carbon emissions by 2040 [25]. Zhao et al., used nighttime light datasets to invert the CO2 emissions of urban residents at the municipal level; the estimated results from which showed that provincial capital cities in central China were the main growth centers, while low-value areas were distributed mainly in western China [26]. Moreover, disparities in RCE continues to grow because the gap between energy intensity and per capita income continues to widen [19].
Spatial distribution characteristics of RCE lead to regional differentiation of the factors driving RCE. Population size and urbanization were the main driving factors of RCE in Beijing Municipality [21], while per capita income was the dominant factor driving the growth of RCE in Tianjin Municipality [27]. The researchers found that increasing RCE in Shanxi [28] and Guangdong Province [29] could be attributed mainly to an increase in per capita income and the number of residents per household. Wang et al., using the input–output model to calculate RCE in the Beijing–Tianjin–Hebei region and also using the structural decomposition method to explore the main factors affecting RCE in the same region, found that CO2 emissions intensity inhibited RCE in Beijing and Tianjin but promoted it in Hebei [30]. Based on an empirical study using a geographically weighted regression model, Wang et al., found that the effect of urbanization on RCE gradually increased from the southeast to the northwest across the country [24]. Wang and Zhao explored the regional differentiation of RCE driving factors based on the STIRPAT model and found that family size increased RCE in eastern China but reduced it in central China [18]. Chang et al., used the Ward clustering method to divide 30 provinces into four types of regions, analyzing the regional differentiation of RCE driving factors based on the STIRPAT model and found that urbanization promoted RCE in regions Ⅲ and Ⅳ but inhibited RCE in regions Ⅰ and Ⅱ. Energy structure had the most significant positive effect on RCE in region Ⅳ [31].
Income is an important factor influencing RCE; consumption patterns varied among residents of different income levels [10]. The income of urban residents in China is significantly higher than that of rural residents and there are significant differences in energy consumption and carbon emissions between urban and rural residents. Studies have shown that the urban sector accounts for the majority of residential energy consumption; urban energy consumption is about three times that of the rural sector [32]. The study on the RCE of urban and rural residents in China’s four municipalities also found similar conclusions; total emissions of urban residents were much larger than that of rural areas, which is the main composition of RCE [33]. Wiedenhofer et al., found that the top wealthy 5% of the urban population were responsible for 19% of RCE in China and 75% of the increase in RCE was due to the growing level of consumption of the urban middle class and the wealthy [34].
Due to the gap in living standards between urban and rural residents, per capita carbon emissions differ between urban and rural areas. Generally, urban per capita emissions are greater than rural carbon emissions [4,18]. The implementation of the rural revitalization strategy in recent years has accelerated rural development and the living standards of rural residents have gradually improved. The gap between urban and rural per capita carbon emissions is gradually narrowing [35]. In some areas, rural carbon emissions per capita are higher than urban ones. The per capita CO2 emissions of Shanghai City are larger in rural areas than in urban areas [33]. It is also found that the per capita carbon emissions in rural areas are higher than those in urban areas in Guangdong Province since 2010 [29]. In the less-developed Jiangxi Province, rural per capita carbon emissions also surpassed urban per capita emissions in 2015 [36].
The above literature mainly discussed the spatial agglomeration characteristics of RCEs, regional differentiation of influencing factors, the contribution of urban and rural sectors to total, per capita RCE’s differences, and changes between urban and rural areas; the existing research provides important reference value. Development gaps of regional and urban–rural are in essence spatial manifestations. Few studies are reported from the urban–rural perspective within regions. This is the research innovation of this paper.
3. Methods and Data
3.1. Methods
3.1.1. Estimating Energy-Related Residential CO2 Emissions
In this paper, RCEs include direct and indirect CO2 emissions. Direct CO2 emissions are those generated by the combustion of fossil fuels within regional boundaries, while indirect CO2 emissions are those generated by the consumption of electricity and heat within regions. The formula for calculating them is as follows [29]:
where represents total CO2 emissions (106 t, Mt), represents direct CO2 emissions (Mt), and represents indirect CO2 emissions (Mt).
Referring to the 2006 IPCC National Greenhouse Gas Inventories, direct CO2 emissions can be calculated using Equation (2) [37]:
where is the energy-related CO2 emissions (Mt), is the th fuel residential energy consumption (104 tons, 108 m3), is the net calorific value of the th energy (TJ), is the carbon content of the low calorific value of the th energy, is the carbon oxidation rate of the th energy, and 44/12 is the conversion coefficient of carbon to CO2. All types of energy in the China Energy Statistical Yearbook were involved. The low calorific value and the unit calorific value carbon content factor of each energy type adopted the actual calculation value of Liu and coworkers [38,39]. In this paper, 17 types of energy were calculated, namely: raw coal, cleaned coal, other washed coal, briquettes, coke, coke oven gas, other gas, other coking products, crude oil, gasoline, kerosene, diesel oil, fuel oil, other petroleum products, liquefied petroleum gas, refinery gas, and natural gas, which includes all the energy used in the residential sector.
Indirect CO2 emissions include mainly energy consumption in the electricity and heating sectors. Electricity consumption and heat supply are multiplied by the corresponding emission coefficients and then added together:
where denotes the indirect CO2 emissions of each province, denotes electricity consumption (108 kW·h), and represents the emission factor of electricity (kg/kW·h). The coefficient uses the regional average electricity emission factor [40]. In this study, the CO2 emissions coefficient of was 110 (kg/GJ), which was obtained by a previous study [33].
3.1.2. STIRPAT Model
The IPAT model was proposed in 1971 in order to analyze the way in which anthropogenic factors affect the environment. Considering that the environment is influenced by three main categories of factors, population, affluence, and technology [41], this relationship can be described as follows:
where I represents the environmental pressure indicator, P represents the total population, A represents affluence, and T represents technology. The IPAT model is very flexible and many different factors can be selected to improve its applicability.
To overcome the unit elasticity assumption within the IPAT model and add randomness for the convenience of empirical analysis, the STIRPAT model was proposed by Dietz and Rosa [42]. The standard STIRPAT model is given by Equation (5):
After taking logarithms, the model can be expressed as follows:
Referring to previous studies, population size, income per capita, urbanization rate, energy intensity, and energy structure were selected into the STIRPAT model:
where i denotes the county samples; , , , , and denote the population, income per capita, urbanization rate, energy intensity, and energy structure, respectively b, c, d, e, f, and g are the coefficients reflecting the importance of P, A, UR, EI, and ES, respectively; e is the error term; and a is a constant. The definitions and measurement units of all variables are shown in Table 1.
3.2. Data
Due to the lack of statistical data for Hong Kong, Macao, Taiwan, and Tibet, the study area was limited to the 30 mainland provinces of China. To reveal the regional differences in CO2 emissions and their driving factors, the study area was divided into three major economic zones: eastern (including Liaoning, Beijing, Tianjin, Hebei, Shandong, Jiangsu, Shanghai, Zhejiang, Fujian, Guangdong, Hainan), central (including Heilongjiang, Jilin, Shanxi, Henan, Hubei, Hunan, Anhui, Jiangxi), and western China (including Guangxi, Sichuan Chongqing, Guizhou, Yunnan, Shaanxi, Gansu, Qinghai, Ningxia, Xinjiang, Inner Mongolia) (Figure 1) [43]. The different levels of energy consumption of the 30 provinces between 2010 and 2019 were obtained from the China Energy Statistical Yearbook (2011–2020) (https://data.cnki.net/Yearbook/Single/N2021050066, accessed on 9 October 2021), and the permanent resident population, urbanization rate, income, energy intensity, and pattern of energy consumption of each province were obtained from the China Statistical Yearbook (2011–2020) (https://data.cnki.net/yearbook/Single/N2020100004, accessed on 9 November 2021). The relevant provincial administrative boundaries map of China was from the Resource and Environmental Science and Data Center of the Chinese Academy of Sciences (https://www.resdc.cn/, accessed on 16 January 2022). The economic indicators were calculated at 2010-comparable prices to avoid the effects of inflation. The research framework is shown in Figure 2.
4. Results
4.1. Patterns of RCE
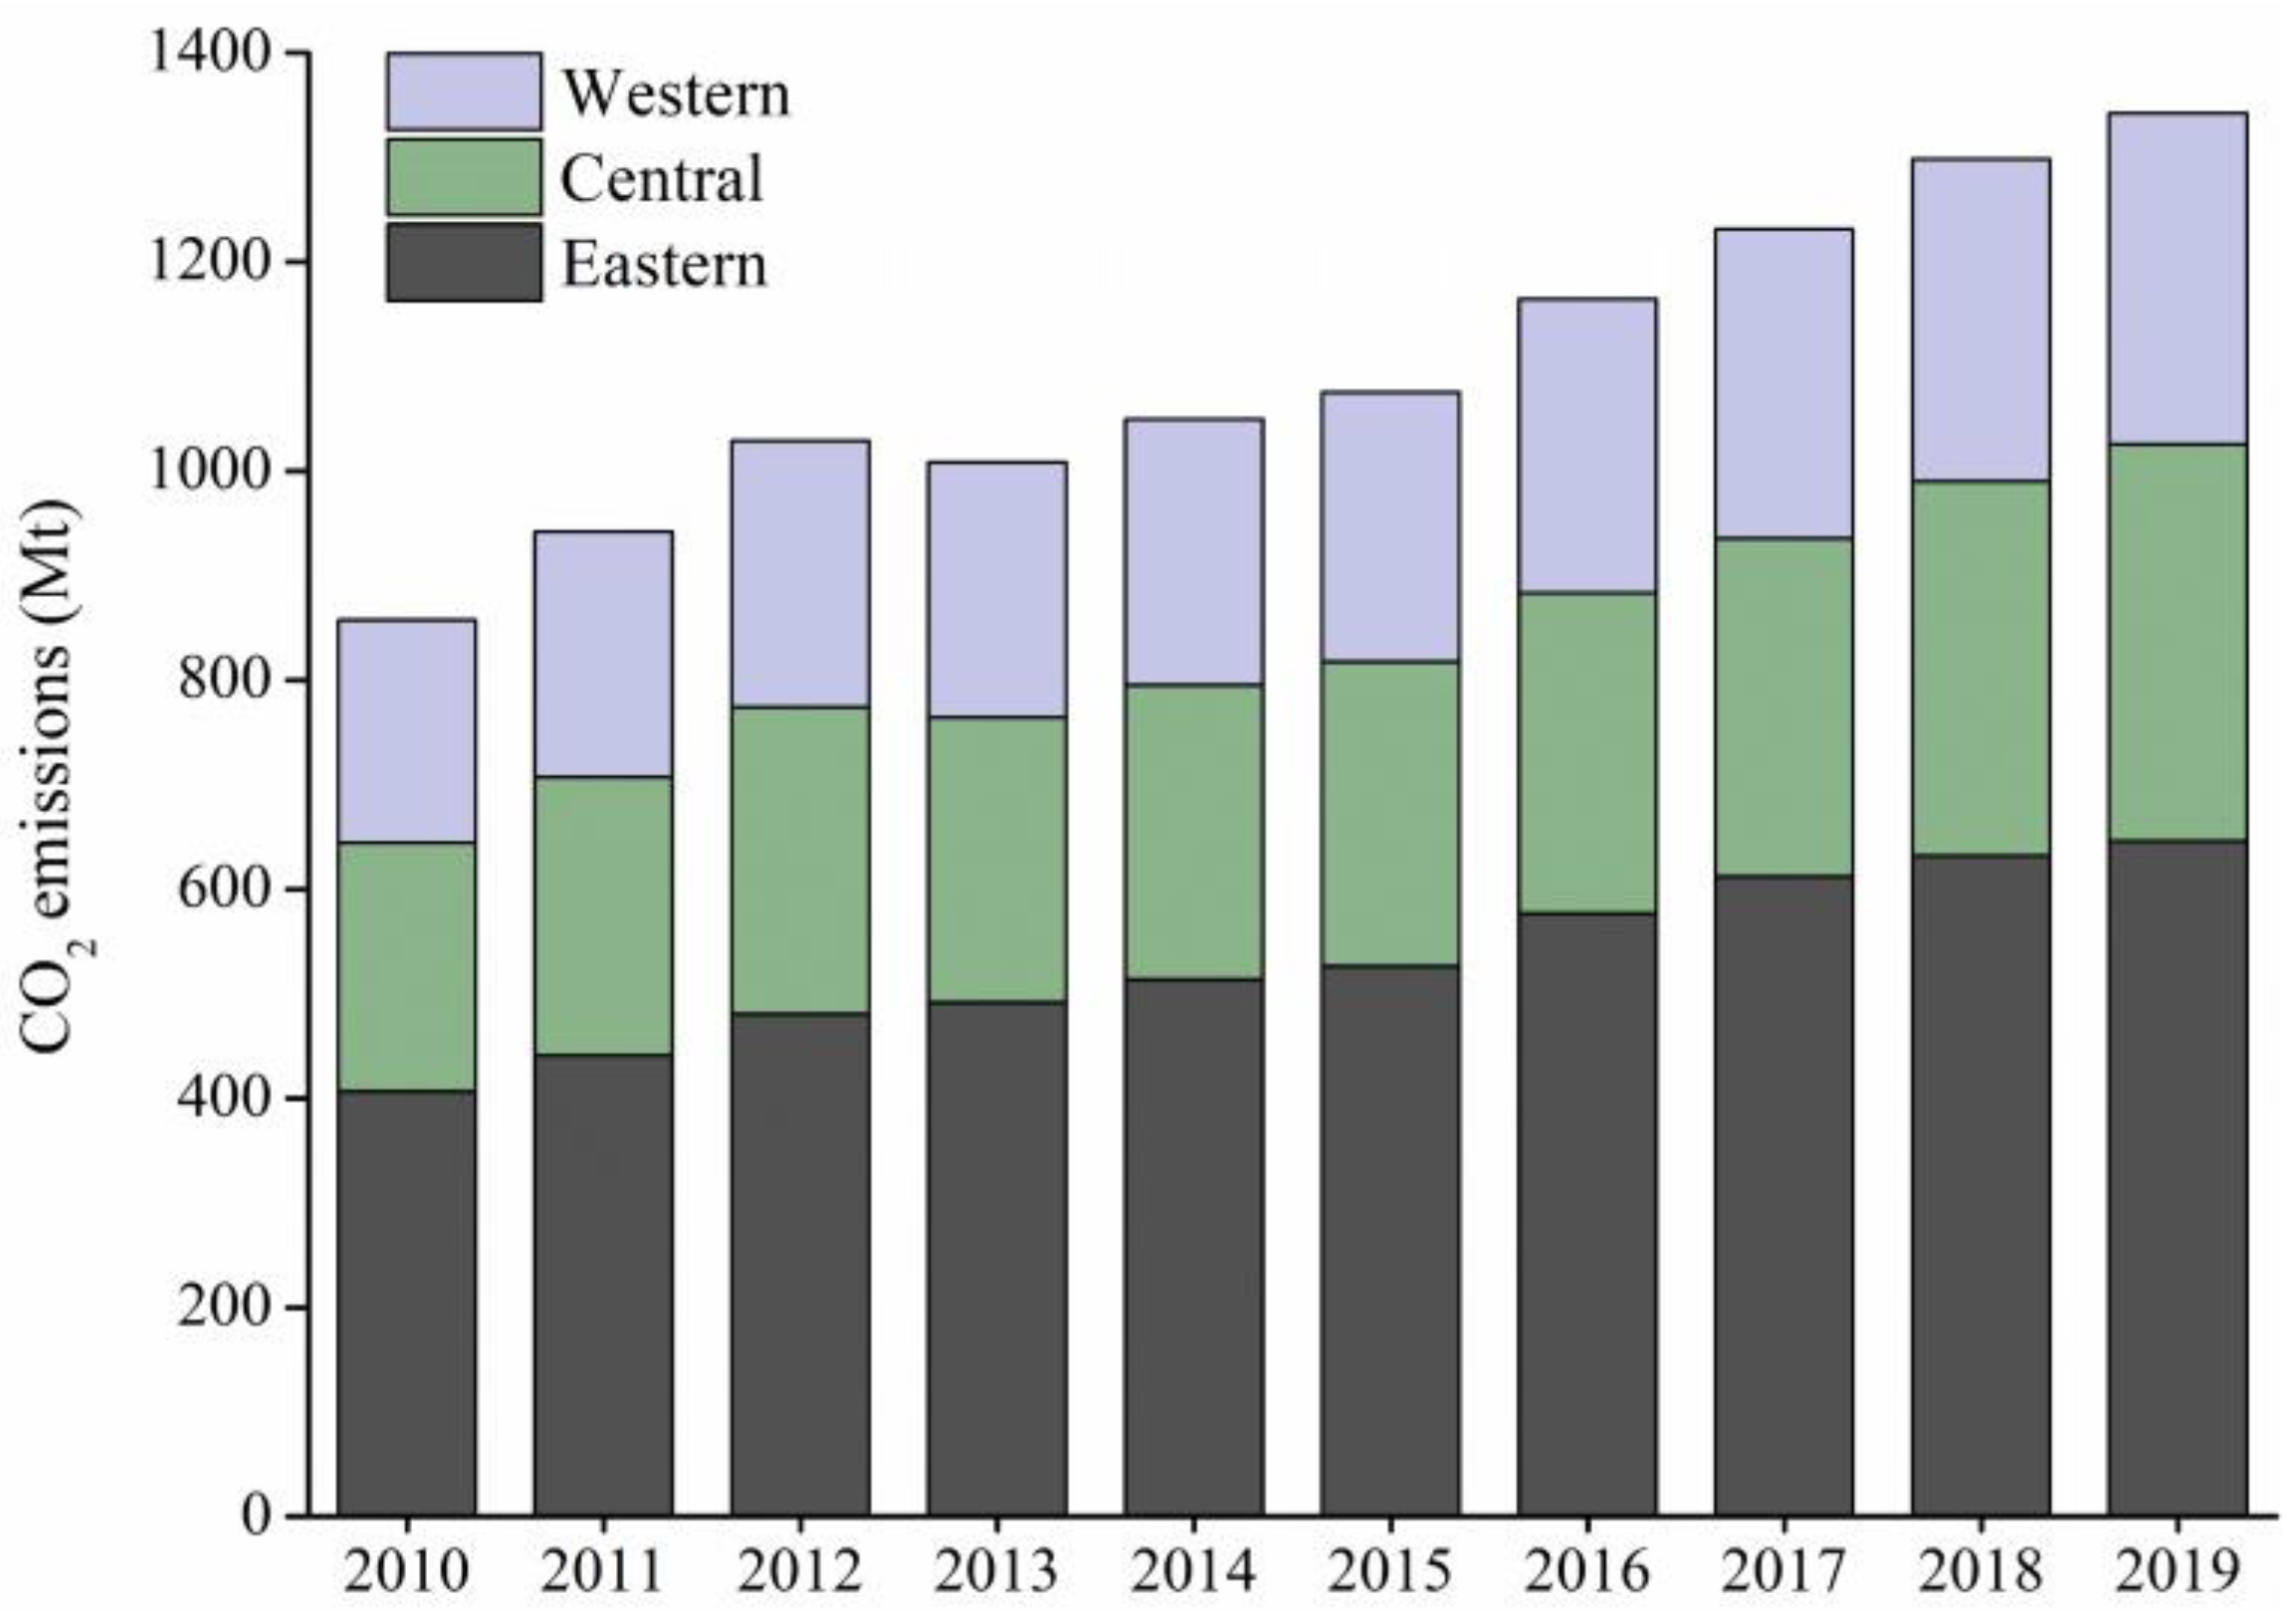
Chinese RCEs have been steadily increasing, with emissions accounting for 857.21 Mt in 2010 but 1342.04 Mt in 2019. National RCE can be divided roughly into two stages according to the annual rate of change. From 2010 to 2012, CO2 emissions increased steadily, decreased in 2013, then continued to increase until the end of the study period (Figure 3). (The Figures show 2010, 2013, 2016, and 2019 in terms of the phased characteristics of RCE growth and the equalization of time intervals.) From a regional perspective, though the RCE in all regions increased overall, the rates of growth presented regional differences. The eastern region was the main contributor to RCE, accounting for the highest proportion of 46.68–49.71%, followed by the central region (26.27–28.53%), and then the western region (23.56–24.94%) during the study period. The incremental increase in RCE of the central region was the largest (59.91%), followed by that of the eastern region (58.86%), and western region (48.44%). At the provincial level, Henan, Anhui, Hunan, and Jiangxi provinces in the central region experienced substantial growth during the study period and RCE in Hainan Province in the eastern region also increased substantially. Among the western provinces, Xinjiang Province increased significantly (Figure 4).
From a national perspective, both urban and rural RCEs have increased. Urban RCE increased from 554.71 Mt in 2010 to 867.41 Mt in 2019. Rural RCE increased from 302.49 Mt in 2010 to 474.63 Mt in 2019. The urban sector was the main contributor to RCE, accounting for approximately 64% of total RCE during the study period. Regionally, urban RCE formed the main component of the three major regions. However, the changes in the proportions of CO2 emissions from the urban and rural sectors in different regions had their own characteristics during the study period. The proportion of RCE of total CO2 emissions in the eastern region was basically stable at 65%. The proportion of urban RCE in the central region decreased the most, from 65.15% in 2010 to 62.93% in 2019. The increase in the proportion of rural RCE in the western region was greatest, from 62.49% in 2010 to 66.14% in 2019.
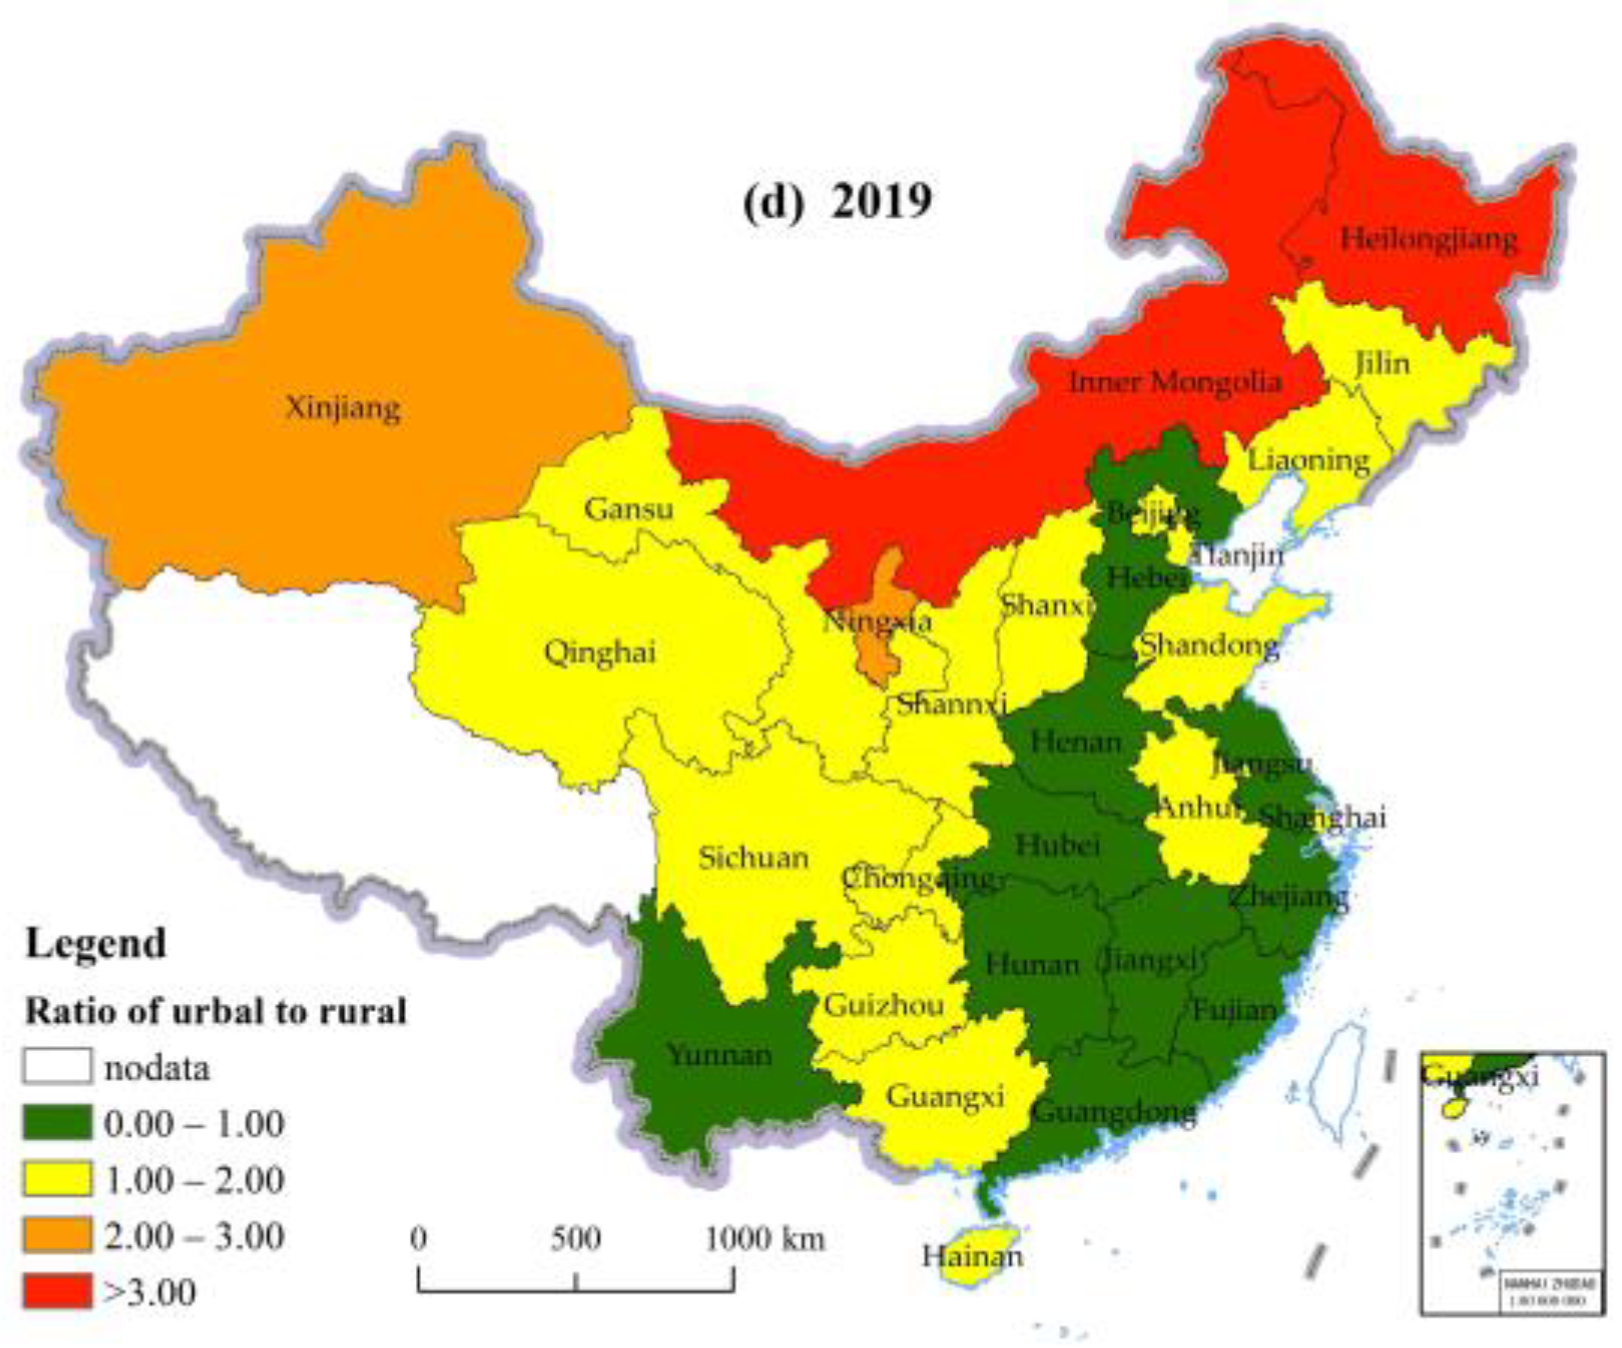
Per capita RCE is used to describe the differences between urban and rural regions. The per capita RCE of urban residents was higher than those of rural residents during the study period at the national level but the gap between urban and rural areas was constantly shrinking. Objectively, the overall living standards of urban residents are higher than those of rural residents. As a consequence of new rural construction and rural revitalization in China, the development of rural areas has been accelerating, the living standards of residents have been continuously increasing, and the gap between urban and rural development levels has been shrinking. Hence, the differences between urban and rural RCEs have been shrinking. It is worth noting that obvious regional differences exist in per capita RCE between urban and rural areas. The rural RCE of the eastern region has been higher than that of urban areas since 2014. Urban RCEs in the central and western regions were significantly greater than those of rural areas. Rural RCE in the central region grew rapidly, narrowing the gap with urban RCE. Although rural RCEs in the western areas increased during the study period, they were still quite a bit lower than those of urban areas (Figure 5). At the provincial level, the per capita RCE of urban areas was larger than those of rural areas for all provinces, though the gap between urban and rural was shrinking. In 2010, the per capita RCE of urban areas in the above ten provinces was more than twice those of rural areas. By 2019, only Inner Mongolia, Heilongjiang, Ningxia, and Xinjiang urban per capita RCEs were more than twice those of rural areas. Xinjiang, Inner Mongolia, Ningxia, and other provinces in the west, Heilongjiang and Jilin in the central, and Liaoning in the east had per capita RCEs greater than those of rural areas (Figure 5).
4.2. Factors Assocaited with Regional Differences of RCE
4.2.1. Unit Root Test
The panel data should take the unit root test before regression to measure its data stationarity in order to avoid the spurious regression phenomenon in the regression analysis of non-stationarity time series. In this study, Levin, Lin, and Chu (LLC) [44], Im, Pesaran, and Shin (IPS) [45], Fisher-ADF, and Fisher-PP tests [46] were employed to test whether the panel unit root exists. The null hypothesis of the above unit test is that a unit root exists, that is, the variables are non-stationary, and the alternative hypothesis is that there is no unit root, that is, the variables are stationary. The panel unit root test results show that a few variables are non-stationary, but all variables become stationary at the 5% significance level after taking first differences in each group (Table 2). The cointegration test is needed to further identify the relationship between RCE and other independent variables.
4.2.2. Cointegration Test
All variables, including P, A, UR, EI, and ES, are stable after taking first differences, but are different from the original sequence in meaning. In order to carry out the regression of the original variable, it is necessary to test the long-term cointegration relationship between these variables through the Pedroni test [47] and the Kao test [48]. As shown in Table 3, there are three statistics of the Pedroni test, namely: panel v-statistic, panel rho-statistic, and group rho-statistic, which accept the null hypothesis of no cointegration relationship in the three regions and urban–rural cases. However, panel PP-statistic, panel ADF-statistic, group PP-statistic, and group ADF-statistic reject the null hypothesis at less than 1% significance level in all the three regions as well as in their urban–rural groups. According to the conclusion of other researchers [49], the panel ADF-statistic is the most decisive. The results of the panel ADF-statistic test show that there is a long-term cointegration relationship between dependent variables and independent variables. In addition, the Kao test obtained a similar conclusion.
4.2.3. Panel Estimation Results
Based on the panel data regression model, it was found that both the fixed-effects model and the random-effects model performed better than ordinary least squares (OLS) regression or a choice of the fixed-effects or random-effects models according to the Hausman test. The random-effects model was used for the eastern, eastern rural, central, central rural, and western urban regions and the fixed-effects model was selected for the eastern urban, central urban, western, and western rural region.
Regional differences exist in the factors driving RCE. Population, per capita income, and energy intensity all promoted RCE in the three regions. Emissions were driven primarily by per capita income in eastern China, with an elasticity coefficient of 0.851, that is, every 1% increase in per capita income resulted in a 0.851% increase in RCE. Population size was also an important factor driving RCE in eastern China, followed by energy intensity, with elasticity coefficients of 0.710 and 0.664, respectively. Urbanization rate and energy structure reduced RCE; urbanization was the main factor with an elasticity coefficient of −0.071, that is, a 1% decrease in urbanization reduced carbon emissions by 0.071%. Energy structure also showed a small negative effect on RCE, but the relationship was not significant (p > 0.05). Unlike those of eastern China, the RCEs of central China were driven mainly by urbanization rate, population size, energy intensity, and per capita income, of which urbanization rate was the most important factor with an elasticity coefficient of 1.354. Energy structure had a significant negative effect on emissions, with an elasticity coefficient of −0.139. The contributions to the RCE were in the following order in western China: population size > urbanization rate > income per capita > energy intensity > energy structure, with elasticity coefficients of 1.973, 0.438, 0.289, 0.275, and −0.066, respectively (Table 4). Energy structure inhibited the growth of RCE.
The results showed that differences existed between urban and rural sectors in the factors driving RCE in the three regions. Per capita income was the major driver of RCE in eastern urban areas, while population size was the dominant driver of rural RCE. Urban and rural RCE in the central region were both driven mainly by population size, while population, per capita income, and energy intensity in rural areas had a similar impact on RCE. The contribution was similar for urban population size and per capita income in the western region urban sector, while rural areas were affected primarily by population size (Table 5).
Although both urban and rural energy intensity contributed to an increase in RCE, energy intensity in the eastern and central regions had a significantly stronger impact in rural areas than in urban areas. In the central region, energy structure had a stronger inhibitory effect on urban RCE than on rural, while the inhibitory effect in western rural areas is stronger than that in urban areas.
5. Discussion
5.1. Gradient Distribution of Regional Development Level
Regional development does not spread evenly across space. Regions with advantages such as resource endowment and geographical conditions tend to take the lead in development. When the regional development gap begins to appear, development level presents gradient distribution. The regions that take the lead in development have large populations and economies. With the economic level of improvement, the living standards of residents also improve simultaneously. The increase in population size brings an increase in energy consumption. In addition, the level of the living demand of residents is constantly rising, which breeds the demand for modern energy and multi-type energy consumption and people are willing to consume more energy [50]. The gap of RCEs gradually exists between developed and less-developed regions.
The above-mentioned gradient regional development exists in the eastern, central, western regions, and urban–rural areas of China. At the regional level, the eastern region is more economically developed due to the priority of opening to the outside world. The eastern region bears the bulk of the population and economic activities in China. Beijing–Tianjin–Hebei, Yangtze River Delta, and Pearl River Delta, the three major urban agglomerations, are all located in the east of the country, which are China’s three major urban agglomerations. Therefore, the CO2 emission of residential energy consumption in the eastern region is significantly higher than that in the central and western regions. Similarly, compared with rural areas, advanced urban areas are the main carrying part of population and economy. Residents’ living standards are higher than those of rural areas, and urban areas are the main contribution area of total emissions.
RCE amounts varied among residents of different income levels due to their lifestyles [10,34]. High-quality living consumption encourages residents to consume more energy and leads to more RCE. The living standards of residents in the eastern region are higher than those in the central and western regions (Figure 6). Energy consumption was basically stable, made up of basic living needs such as lighting, cooking, and bathing. However, electricity consumption and the use of non-essential household appliances in the eastern region increased significantly compared with the central and western regions [43]. An increase in household income stimulated the diversified demand for electrical appliances such as air conditioners, computers, cameras, and microwave ovens, as well as their usage time, resulting in increased RCE from electricity consumption [13]. In addition, higher income levels tended to demand larger-sized houses, which consumed more energy for cooling and heating. In the pursuit of comfort, the need to open windows is often increased, which further increases power consumption [16,51]. Higher incomes increase household private car ownership and frequency of use, increasing energy consumption [16]. Therefore, the impact of per capita income on RCE in the eastern part is more significant. Population size was still the major factor driving RCE in the central and western parts of China, which were less developed economically. These findings are similar to those of other researchers, namely that higher per capita income encourages residents to consume more energy and leads to increased RCE [20,29]; income is also a contributor to RCE in highly urbanized and industrialized regions [52].
From the perspective of urban–rural areas, the RCEs in eastern urban areas were driven mainly by per capita income, while RCEs in rural areas were driven mainly by per capita income and population size. RCEs in the eastern region were driven primarily by per capita income, which is actually a reflection of eastern urban RCEs being driven by per capita income. RCEs in central urban areas were mainly driven by population size, the agglomeration effect brought about by the increase in population size was significant with an elasticity coefficient greater than one, and the impact of population size increase on RCE was greater than its own changes. The rural RCE in the western region was mainly driven by the population size, while urban RCE was driven by both population size and per capita income. The possible reason was that urban residents’ living standards were higher than that of rural areas and the effect of per capita income on RCE was more significant.
5.2. Agglomeration Effect of Urbanization
During the study period of 2010–2019, the Chinese urbanization rate rose from 49.95% to 60.60% (Figure 7). There were two effects of urbanization on RCE. The first effect was that rural populations became urban residents and the nature and levels of living needs increased, which triggered increases in energy consumption and CO2 emissions [50,53]. The second effect was that urbanization had an agglomeration effect on CO2 emissions. High-density buildings reduce the per capita living area, improve the efficiency of infrastructures such as heating and power supply, and improve energy efficiency [50].
Urbanization had an inhibitory effect on RCE in the eastern region during the study period, the possible reasons for which are as follows: first, during 2010–2019, urbanization of the eastern region was at a relatively high level, while the population levels of the main urban areas such as Beijing were stagnant or even declining. Second, per capita CO2 emissions in rural areas in the eastern region were higher than those of urban areas. In the process of urbanization of the eastern region, rural–urban migration by rural residents clearly reduced the per capita energy consumption of the entire region, which benefited energy efficiency. The agglomeration effect of urbanization on RCE dominated, thus reducing RCE.
A gap in residential facilities existed between urban and rural areas in the central and western regions. During the study period, both regions experienced rapid urbanization. The urbanization rate in the central and western regions increased from 46.95% to 57.92%, and 43.16% to 55.29%, respectively, with a considerable number of rural residents migrating to urban areas (Figure 8). Due to improvements in the living environment, energy consumption increased, thus leading to an increase in RCE [50]; thus, the urbanization rate increased the RCE of central and western China. The central region was where the rate of increase in urbanization was greatest. The rural populations in these provinces increasingly moved to the provincial capitals and other cities. The provincial capitals were the main growth points for RCE and thus strongly promoted increasing RCE [26]; therefore, the urbanization rate made the greatest contribution to RCE in the central region during the study period.
5.3. Forced Mechanism of Western Ecological Policy
The Chinese government has issued a series of energy policies since 2013. In regions where heating based on natural gas cannot be achieved, new energy sources such as electricity and solar energy are being used instead. Moreover, various localities have continued to introduce detailed policies to promote the reform of the energy structure of residents’ living conditions. The proportion of coal consumption to total residential energy consumption has been declining [54]. Obvious regional differences exist in the energy consumption structure of different regions of the country. On the whole, the proportion of natural gas and electricity of total residential energy consumption in various regions has been rising (Figure 8). The proportion of clean energy in the western region increased the most, followed by that of the central region, and that of the eastern region.
The initial proportion of clean energy in the study period in the eastern region was relatively high. The eastern region is densely populated and it is difficult to increase the proportion of new energy production, limiting the possibilities for energy structure optimization. In the western region, the initial proportion of clean energy was the lowest. The western region is the major source of clean energy such as solar and wind energy in China and there the optimization of the energy structure was the most obvious. Hence, the energy structure of the western region had the most significant inhibitory effect on RCE.
The western region is the main distribution area of China’s ecological security barrier and there are many natural protected areas. According to the positioning of China’s Major Function Oriented zoning, the ecological zones implement active population exit policies [55]. Furthermore, most of the ecological areas are poor areas in China. In recent years, the implementation of targeted poverty alleviation, rural revitalization policies, and the relocation of poverty-stricken people has accelerated the migration of rural people into urban areas [56,57]. The high share of clean energy in urban residents is conducive to the optimization of energy structure in the western region. In the eastern region, the initial value of the proportion of clean energy is high and the space for energy structure optimization is limited. In the western region, the initial proportion of clean energy is the lowest and the energy structure optimization is the most markable. Therefore, the inhibitory effect of energy structure on RCE is greater in central and western regions.
From the perspective of urban–rural areas, the share was higher of clean energy for urban residents in the western region, but the proportion of clean energy in rural areas increases much more than in urban areas. Rural areas were the main contributors to the energy structure optimization in the western region, therefore the inhibitory effect of rural energy structure on RCE was significantly greater than that of urban areas. In addition, ecological zones actively implement the exit policy of the energy and chemical industry and strictly control the access of heavy industry [53], which limits the use of traditional fossil energy. Furthermore, the development conditions of solar energy, wind energy, and other clean energy in the western region are superior. Residents often use solar and wind energy and other clean energy locally; this effectively optimizes the energy consumption structure.
Contrary to the western region, energy structure optimization in urban areas was more obvious in central China and the increase in the proportion of clean energy in rural areas was relatively low. The proportion of urban energy structure had an obvious inhibitory effect on RCE, which was due to the fact that the implementation of coal-to-natural gas and coal-to-electricity conversion of residential energy has been effective in urban areas in the central region [7]. Compared with rural areas, energy structure optimization had a more significant effect on reducing RCE. In the eastern region, there was little difference in the levels of public infrastructure construction such as urban and rural energy and power supply. The optimization process of urban and rural energy structures was basically synchronized. Energy structure showed an inhibitory effect on both urban and rural RCE and the levels were similar.
During the study period, the energy intensity of all three regions showed a decrease. Inexplicably, however, energy intensity contributed to CO2 emissions. Similar results have been obtained based on STIRPAT model regression [18] and geographically weighted regression (GWR) [24] studies at the provincial scale. A study based on municipal units that employed a spatial econometric model also found that energy intensity contributed positively to RCE [26]. This may have been because energy intensity represents the energy utilization technology level of the social manufacturing industry, residential energy needs belong to basic needs, and resident energy consumption is not greatly affected by the technological level of energy utilization in the manufacturing industry.
The Chinese government should balance the goals of improving people’s living standards and strive to reduce carbon emissions for the goal of carbon neutrality. The realization of multidimensional goals may require more precise adaptive policies to regulate. The results of this study are worthy of attention for decision makers to clarify the priority of RCE control in different areas. According to the total volume and growth rate of RCE in different regions, the central region should be prioritized due to its major contributor to RCE growth. According to different resident life development needs, more RCE quotas could be allocated in less developed areas and reduction policies and measures could be adjusted to local conditions based on the regional and urban–rural differences in the driving factors for CO2 emissions. In the eastern region, especially in urban areas, the per capita income level is the dominant factor for CO2 emissions. Low-carbon consumption should be advocated and urban residents should develop green consumption awareness and adopt a low-carbon lifestyle. In accordance with regulatory control, the process of urbanization should be further promoted and the inhibitory effect of urbanization should be exerted on RCE. In the central and western regions, more attention should be paid to the deployment of urban high-efficiency energy technologies and high-efficiency electrical appliances in the construction of infrastructures such as housing, heating, and power supply. Urbanization that leads to the growth of RCE should be avoided as much as possible. The adjustment of the energy structure should be increased in central rural areas and western urban areas and energy consumption structure from coal to gas/electricity should be further optimized. Due to the threshold effect of clean energy use in low-income households, it is difficult for residents to transition to clean energy in their daily energy consumption [13]. We should focus on low-income households, increase policy inclination, and raise the proportion of clean energy in the residential energy consumption structure.
6. Conclusions
In the paper, RCEs were accounted for from the urban–rural perspective at the provincial level. We investigated the relationship between socioeconomic indicators (population size, urbanization, income per capita, energy intensity, and energy structure) and emissions by the STIRPAT model. We further analyzed the regional and urban–rural differentiation of influencing factors from the gradient distribution of regional development level, the agglomeration effect of urbanization, and the forced mechanism of western ecological policy. The main conclusions of our study are as follows:
- During the study period of 2010–2019, RCE in three regions of China (eastern, central, and western) increased overall, but RCE growth was varied among three regions, with the largest increase (59.91%) being in the central region.
- Regional and urban–rural differences existed in the factors driving RCE. Population size and income per capita were the two dominant factors affecting RCE for all regions. The contribution of per capita income to RCE was greater in developed regions such as eastern regions and eastern urban areas. When per capita income increased 1%, it led to 0.851% and 0.612% growth in RCEs, respectively. Urbanization exerted a negative effect on the RCE in the eastern region, while having a positive effect in the central and western regions. The inhibitory effect of energy structure on RCE decreased in sequence from the central, western, and eastern region, particularly in the central urban and western rural areas.
- The gradient distribution of regional development levels led to differences in RCE characteristics among regions and between urban–rural areas. The agglomeration effect of urbanization in developed regions led to the suppression of RCE, while promoting emissions in less developed areas. Due to industrial policies and poverty alleviation policies, the ecological regions in western China were forced to optimize the energy structure and accelerate the progress of urbanization, which affected RCE.
7. Limitation and Further Research
Although this study has revealed the RCE characteristics of three regions and their internal urban–rural differentiation and further analyzed regional and urban–rural differences of drivers on RCE at the provincial level, the paper is still a preliminary study due to serval limitations. For example, due to data access restrictions—there is a lot of biomass that does not include burning for cooking and heating in rural China—this paper only selected income per capita, population, urbanization, energy structure, and energy intensity; other influencing factors such as household size, age, and structure should be focused on in future research. In addition, the STIRPAT model overlooks the effects of unit geographical location on drivers; therefore, our future research is to examine the spatial effect of influencing factors on RCE by employing spatial econometric models. Furthermore, residents’ living consumption level is rising along with income levels. The wealthy residents are the main contributor of RCE growth, and how to represent high-quality consumption such as culture consumption needs further research.
Author Contributions
Conceptualization, Z.W. and L.H.; Data and methodology, C.L. and Z.W.; software, C.L.; validation, Z.W.; formal analysis, S.W.; investigation, L.H.; resources, Z.W.; data curation, C.L.; writing—original draft preparation, Z.W. and S.W.; writing—review and editing, S.W. and Z.W.; visualization, Z.W.; supervision, Z.W.; project administration, L.H.; funding acquisition, L.H. All authors have read and agreed to the published version of the manuscript.
Funding
This research was funded by Sichuan Science and Technology Program, grant number 2021YFN0131.
Institutional Review Board Statement
Not applicable.
Informed Consent Statement
Not applicable.
Data Availability Statement
The new data created in this study are available on request.
Conflicts of Interest
The authors declare no conflict of interest.
References
- Fang, J.Y.; Yu, G.R.; Liu, L.L.; Hu, S.J.; Chapin, F.S., III. Climate change, human impacts, and carbon sequestration in China. Proc. Natl. Acad. Sci. USA 2018, 115, 4015–4020. [Google Scholar] [CrossRef] [PubMed] [Green Version]
- Zhao, X.; Ma, X.W.; Chen, B.Y.; Shang, Y.P.; Song, M.L. Challenges toward carbon neutrality in China: Strategies and countermeasures. Resour. Conserv. Recycl. 2022, 176, 105959. [Google Scholar] [CrossRef]
- Nejat, P.; Jomehzadeh, F.; Taheri, M.M.; Gohari, M.; Majid, M.Z.A. A global review of energy consumption, CO2 emissions and policy in the residential sector (with an overview of the top ten CO2 emitting countries). Renew. Sustain. Energ Rev. 2015, 43, 843–862. [Google Scholar] [CrossRef]
- Fan, J.L.; Liao, H.; Liang, Q.M.; Tatano, H.; Liu, C.F.; Wei, Y.M. Residential carbon emission evolutions in urban–rural divided China: An end-use and behavior analysis. Appl. Energy 2013, 101, 323–332. [Google Scholar] [CrossRef]
- Shi, Y.Y.; Han, B.T.; Han, L.; Wei, Z.X. Uncovering the national and regional household carbon emissions in China using temporal and spatial decomposition analysis models. J. Clean. Prod. 2019, 232, 966–979. [Google Scholar] [CrossRef]
- Ding, Q.; Cai, W.; Wang, C.; Sanwal, M. The relationships between household consumption activities and energy consumption in chin—An input-output analysis from the lifestyle perspective. Appl. Energy 2017, 207, 520–532. [Google Scholar] [CrossRef]
- Fan, J.L.; Zhang, Y.J.; Wang, B. The impact of urbanization on residential energy consumption in China: An aggregated and disaggregated analysis. Renew. Sustain. Energ Rev. 2017, 75, 220–233. [Google Scholar] [CrossRef]
- Jorgenson, A.K.; Schor, J.B.; Huang, X.; Fitzgerald, J. Income inequality and residential carbon emissions in the United States: A preliminary analysis. Hum. Ecol. Rev. 2015, 22, 93–106. [Google Scholar] [CrossRef]
- Das, A.; Paul, S.K. CO2 emissions from household consumption in India between 1993-94 and 2006-07: A decomposition analysis. Energy Econ. 2014, 41, 90–105. [Google Scholar] [CrossRef]
- Li, J.; Zhang, D.Y.; Su, B. The Impact of Social Awareness and Lifestyles on Household Carbon Emissions in China. Ecol. Econ. 2019, 160, 145–155. [Google Scholar] [CrossRef]
- Serino, M.N.V. Is Decoupling Possible? Association between Affluence and Household Carbon Emissions in the Philippines. Asian Econ. J. 2017, 31, 165–185. [Google Scholar] [CrossRef]
- Soltani, M.; Rahmani, O.; Ghasimi, D.S.M.; Ghaderpour, Y.; Pour, A.B.; Misnan, S.H.; Ngah, I. Impact of household demographic characteristics on energy conservation and carbon dioxide emission: Case from Mahabad city, Iran. Energy 2020, 194, 116916. [Google Scholar] [CrossRef]
- Wang, J.; Li, N.; Huang, M.; Zhao, Y.; Qiao, Y. The challenges of rising income on urban household carbon emission: Do savings matter? J. Clean. Prod. 2021, 326, 129295. [Google Scholar] [CrossRef]
- Qi, W.; Li, G.D. Residential carbon emission embedded in China’s inter-provincial population migration. Energy Policy 2020, 136, 111065. [Google Scholar] [CrossRef]
- Allinson, D.; Irvine, K.N.; Edmondson, J.L.; Tiwary, A.; Hill, G.; Morris, J.; Bell, M.; Davies, Z.G.; Firth, S.K.; Fisher, J.; et al. Measurement and analysis of household carbon: The case of a UK city. Appl. Energy 2016, 164, 871–881. [Google Scholar] [CrossRef] [Green Version]
- Fan, J.L.; Yu, H.; Wei, Y.M. Residential energy-related carbon emissions in urban and rural China during 1996–2012: From the perspective of five end-use activities. Energy Build. 2015, 96, 201–209. [Google Scholar] [CrossRef]
- Zhao, J.; Liu, Q. Examining the Driving Factors of Urban Residential Carbon Intensity Using the LMDI Method: Evidence from China's County-Level Cities. Int. J. Environ. Res. Public Health 2021, 18, 3929. [Google Scholar] [CrossRef] [PubMed]
- Wang, Y.; Zhao, T. Panel estimation for the impacts of residential characteristic factors on CO2 emissions from residential sector in China. Atmos. Pollut. Res. 2018, 9, 595–606. [Google Scholar] [CrossRef]
- Wang, M.; Feng, C. The inequality of China's regional residential CO2 emissions. Sustain. Prod. Consump. 2021, 27, 2047–2057. [Google Scholar] [CrossRef]
- Zhao, X.; Li, N.; Ma, C. Residential energy consumption in urban China: A decomposition analysis. Energy Policy 2012, 41, 644–653. [Google Scholar] [CrossRef]
- Jin, X.; Li, Y.; Sun, D.; Zhang, J.; Zheng, J. Factors Controlling Urban and Rural Indirect Carbon Dioxide Emissions in Household Consumption: A Case Study in Beijing. Sustainability 2019, 11, 6563. [Google Scholar] [CrossRef] [Green Version]
- Todorov, V.; Dimov, I.; Ostromsky, T.; Apostolov, S.; Georgieva, R.; Dimitrov, Y.; Zlatev, Z. Advanced stochastic approaches for Sobol’ sensitivity indices evaluation. Neural Comput. Appl. 2021, 33, 1999–2014. [Google Scholar] [CrossRef]
- Zlatev, Z.; Dimov, I.; Faragó, I.; Georgiev, K.; Havasi, Á. Studying the Influence of Climate Changes on European Ozone Levels. In Proceedings of the International Conference on Large-Scale Scientific Computing, Sozopol, Bulgaria, 7–11 June 2021; Springer: Cham, Switzerland, 2019; pp. 391–399. [Google Scholar]
- Wang, Y.; Zhao, M.; Chen, W. Spatial effect of factors affecting household CO2 emissions at the provincial level in China: A geographically weighted regression model. Carbon Manag. 2018, 9, 187–200. [Google Scholar] [CrossRef]
- Zhao, L.T.; Zhao, T.; Yuan, R. Scenario simulations for the peak of provincial household CO2 emissions in China based on the STIRPAT model. Sci. Total Environ. 2022, 809, 151098. [Google Scholar] [CrossRef]
- Zhao, J.; Ji, G.; Yue, Y.; Lai, Z.; Chen, Y.; Yang, D.; Yang, X.; Wang, Z. Spatio-temporal dynamics of urban residential CO2 emissions and their driving forces in China using the integrated two nighttime light datasets. Appl. Energy 2019, 235, 612–624. [Google Scholar] [CrossRef]
- Cui, C.; Zhao, T.; Wang, Y. Factor analysis of urban residential CO2 emissions in Tianjin: 1995–2014. Int. J. Glob. Warm. 2018, 15, 293–314. [Google Scholar] [CrossRef]
- Zang, X.L.; Zhao, T.; Wang, J.; Guo, F. The effects of urbanization and household-related factors on residential direct CO2 emissions in Shanxi, China from 1995 to 2014: A decomposition analysis. Atmos. Pollut. Res. 2017, 8, 297–309. [Google Scholar] [CrossRef]
- Xie, Z.; Gao, X.; Yuan, W.; Fang, J.; Jiang, Z. Decomposition and prediction of direct residential carbon emission indicators in Guangdong Province of China. Ecol. Indic. 2020, 115, 106344. [Google Scholar]
- Wang, C.; Zhan, J.; Li, Z.; Zhang, F.; Zhang, Y. Structural decomposition analysis of carbon emissions from residential consumption in the Beijing-Tianjin-Hebei region, China. J. Clean. Prod. 2019, 208, 1357–1364. [Google Scholar] [CrossRef]
- Chang, K.L.; Du, Z.F.; Chen, G.J.; Zhang, Y.X.; Sui, L.L. Panel estimation for the impact factors on carbon dioxide emissions: A new regional classification perspective in China. J. Clean. Prod. 2021, 279, 12367. [Google Scholar] [CrossRef]
- Wang, H.K.; Lu, X.; Deng, Y.; Sun, Y.G.; Nielsens, C.P.; Li, Y.F.; Zhu, G.; Bu, M.L.; Bi, J.; McElroy, M.B. China’s CO2 peak before 2030 implied from characteristics and growth of cities. Nat. Sustain. 2019, 2, 748–754. [Google Scholar] [CrossRef]
- Huang, R.; Zhang, S.; Liu, C. Comparing Urban and Rural Household CO2 Emissions-Case from China’s Four Megacities: Beijing, Tianjin, Shanghai, and Chongqing. Energies 2018, 11, 1257. [Google Scholar] [CrossRef] [Green Version]
- Wiedenhofer, D.; Guan, D.B.; Liu, Z.; Meng, J.; Zhang, N.; Wei, Y.M. Unequal household carbon footprints in China. Nat. Clim. Chang. 2017, 7, 75–81. [Google Scholar] [CrossRef] [Green Version]
- Wang, X.R.; Chen, S.Q. Urban–rural carbon footprint disparity across China from essential household expenditure: Survey-based analysis, 2010–2014. J. Environ. Manag. 2020, 267, 110570. [Google Scholar] [CrossRef]
- Yang, Y.; Jia, J.S.; Chen, C.D. Residential Energy-Related CO2 Emissions in China's Less Developed Regions: A Case Study of Jiangxi. Sustainability 2020, 12, 2000. [Google Scholar] [CrossRef] [Green Version]
- Intergovernmental Panel on Climate Change (IPCC). IPCC Guidelines for National Greenhouse Gas Inventories; Institute for Global Environmental Strategies (IGES): Hayama, Japan, 2006. [Google Scholar]
- Liu, Z.; Guan, D.B.; Wei, W.; Davis, S.J.; Ciais, P.; Bai, J.; Peng, S.S.; Zhang, Q.; Hubacek, K.; Marland, G.; et al. Reduced carbon emission estimates from fossil fuel combustion and cement production in China. Nature 2015, 524, 335–346. [Google Scholar] [CrossRef] [Green Version]
- Shan, Y.L.; Huang, Q.; Guan, D.B.; Hubacek, K. China CO2 emission accounts 2016–2017. Sci. Data 2020, 7, 54. [Google Scholar] [CrossRef] [Green Version]
- Ministry of Ecology and Environment of the People’s Republic of China. 2019 Emission Reduction Project China Regional Grid Baseline Emission Factor [Chinese Document]. 2020. Available online: https://www.mee.gov.cn/ywgz/ydqhbh/wsqtkz/202012/t20201229_815386.shtml (accessed on 19 January 2020).
- Ehrlich, P.R.; Holdren, J.P. Impact of population growth. Science 1971, 171, 1212–1217. [Google Scholar] [CrossRef]
- Dietz, T.; Rosa, E.A. Rethinking the environmental impacts of population, Affluence and technology. Hum. Ecol. Rev. 1994, 1, 277–300. [Google Scholar]
- Ke, L.; Lin, B. Impacts of urbanization and industrialization on energy consumption CO2 emissions: Does the level of development matter? Renew. Sustain. Energ Rev. 2015, 52, 1107–1122. [Google Scholar]
- Levin, A.; Lin, C.-F.; Chu, C.-S.J. Unit root tests in panel data: Asymptotic and finite-sample properties. J. Econom. 2002, 108, 1–24. [Google Scholar] [CrossRef]
- Im, K.S.; Pesaran, M.H.; Shin, Y. Testing for unit roots in heterogeneous panels. J. Econom. 2003, 115, 53–74. [Google Scholar] [CrossRef]
- Maddala, G.S.; Wu, S. A comparative study of unit root tests with panel data and a new simple test. Oxf. Bull. Econ. Stat. 1999, 61, 631–652. [Google Scholar] [CrossRef]
- Pedroni, P. Critical values for cointegration tests in heterogeneous panels with multiple regressors. Oxf. Bull. Econ. Stat. 1999, 61, 653–670. [Google Scholar] [CrossRef]
- Kao, C. Spurious regression and residual-based tests for cointegration in panel data. J. Econom. 1999, 90, 1–44. [Google Scholar] [CrossRef]
- Rsal, D.D.K. Comparison of panel cointegration tests. J. Quant. Tech. Econ. 2010, 33, 1–20. [Google Scholar]
- Esfandi, S.; Rahmdel, L.; Nourian, F.; Sharifi, A. The role of urban spatial structure in energy resilience: An integrated assessment framework using a hybrid factor analysis and analytic network process model. Sustain. Cities Soc. 2022, 76, 103458. [Google Scholar] [CrossRef]
- Li, Y.T.; Pizer, W.A.; Wu, L.B. Climate change and residential electricity consumption in the Yangtze River Delta, China. Proc. Natl. Acad. Sci. USA 2019, 116, 472–477. [Google Scholar] [CrossRef] [Green Version]
- Huang, Y.; Matsumoto, K.i. Drivers of the change in carbon dioxide emissions under the progress of urbanization in 30 provinces in China: A decomposition analysis. J. Clean. Prod. 2021, 322, 29000. [Google Scholar] [CrossRef]
- Su, K.; Wei, D.Z.; Lin, W.X. Influencing factors and spatial patterns of energy-related carbon emissions at the city-scale in Fujian province, Southeastern China. J. Clean. Prod. 2020, 244, 118840. [Google Scholar] [CrossRef]
- Wang, J.; Zhong, H.; Yang, Z.; Wang, M.; Kammen, D.M.; Liu, Z.; Ma, Z.; Xia, Q.; Kang, C. Exploring the trade-offs between electric heating policy and carbon mitigation in China. Nat. Commun. 2020, 11, 6054. [Google Scholar] [CrossRef]
- National Development and Reform Commission. The Major Functional Oriented Zoning of China; Chinese People’s Publishing House: Beijing, China, 2015; pp. 36–40.
- Liu, Y.; Guo, Y.; Zhou, Y. Poverty alleviation in rural China: Policy changes, future challenges and policy implications. China Agric. Econ. Rev. 2018, 10, 241–259. [Google Scholar] [CrossRef] [Green Version]
- Liu, Y.; Wang, Y. Rural land engineering and poverty alleviation: Lessons from typical regions in China. J. Geogr. Sci. 2019, 29, 643–657. [Google Scholar] [CrossRef] [Green Version]
Figure 1.
Spatial distribution map of the three regions in China.

Figure 2.
Research and analytical framework.

Figure 3.
RCE of the three study regions in China during 2010–2019.

Figure 4.
Spatial patterns of RCE in China in 2010 (a), 2013 (b), 2016 (c), and 2019 (d) (unit: Mt).
Figure 4.
Spatial patterns of RCE in China in 2010 (a), 2013 (b), 2016 (c), and 2019 (d) (unit: Mt).


Figure 5.
Spatial distribution of ratio of urban to rural per capita RCE in China in 2010 (a), 2013 (b), 2016 (c), and 2019 (d).
Figure 5.
Spatial distribution of ratio of urban to rural per capita RCE in China in 2010 (a), 2013 (b), 2016 (c), and 2019 (d).


Figure 6.
Changes in per capita income of urban and rural residents in the three different regions of China during 2010–2019.
Figure 6.
Changes in per capita income of urban and rural residents in the three different regions of China during 2010–2019.

Figure 7.
Changes in urbanization in China during 2010–2019.

Figure 8.
Changes in the energy structure of urban and rural residents in the three different regions of China during 2010–2019.
Figure 8.
Changes in the energy structure of urban and rural residents in the three different regions of China during 2010–2019.


Table 1.
Description of variables used in the analysis for the periods 2010–2019.
| Variables | Symbol | Definition | Unit |
|---|---|---|---|
| Population size | P | The amount of permanent residents | 104 persons |
| Urbanizaton level | UR | The percentage of the urban population in the total population | % |
| Economic level | A | Income divided by the population at the end of the year | Yuan/person |
| Energy intensity | EI | Energy consumser per constant 2010 yuan GDP | Tons/104 yuan |
| Energy consumption structure | ES | The share of natural gas and electricity consumption over total energy consumption | % |
Table 2.
The panel unit root tests for different groups.
| Variable | Levels | First Difference | ||||||
|---|---|---|---|---|---|---|---|---|
| LLC | IPS | Fisher-ADF | Fisher-PP | LLC | IPS | Fisher-ADF | Fisher-PP | |
| Eastern | ||||||||
| LnP | 0.366 | 2.983 | −0.010 | 8.313 *** | −1.037 ** | 0.224 ** | −1.473 ** | −0.296 ** |
| LnA | −3.556 *** | 4.030 | −2.227 | 4.158 *** | −11.976 *** | −0.347 ** | −0.802 ** | 25.102 *** |
| LnUR | −1.995 ** | 0.577 | 0.3912 | 15.890 *** | −0.475 ** | −0.088 ** | 1.911 ** | 4.591 *** |
| LnEI | −5.701 *** | 2.650 | −2.143 | −1.839 | −6.452 ** | −1.832 ** | −1.241 ** | 4.519 *** |
| LnES | −6.373 *** | −0.230 | −2.285 | −2.432 | −6.831 *** | −3.031 ** | −0.912 ** | 1.844 ** |
| Eastern Urban | ||||||||
| LnP | 18.946 *** | 3.020 *** | 1.083 | −2.242 ** | −3.632 *** | −0.087 ** | −0.014 ** | −0.351 ** |
| LnA | −3.668 ** | −1.784 ** | −2.372 | 8.385 *** | −16.866 *** | −3.549 *** | 60.943 *** | 15.415 *** |
| LnEI | −14.621 *** | −0.203 | −0.474 | 0.611 | −15.197 *** | −2.815 *** | 13.109 *** | 0.369 ** |
| LnES | −11.134 *** | −0.327 | 1.893 ** | 0.424 | −21.196 *** | −2.803 *** | 16.072 *** | 8.347 *** |
| Eastern rural | ||||||||
| LnP | −3.758 *** | 0.173 | 0.369 | 4.736 *** | −4.738 ** | −2.086 ** | 2.009 ** | 1.619 ** |
| LnA | −3.693 *** | −0.526 | −1.741 | 24.498 *** | −10.428 *** | −3.026 *** | 25.685 *** | 39.336 *** |
| LnEI | −4.519 *** | −4.100 *** | 1.771 ** | 6.730 *** | −2.949 *** | −5.009 *** | 2.292 ** | 4.923 *** |
| LnES | −4.182 *** | 1.418 | −1.857 | −0.644 | −3.378 *** | −3.499 *** | 0.302 ** | 8.460 *** |
| Central | ||||||||
| LnP | −5.598 *** | 0.476 | −0.714 | −1.926 | −4.834 *** | −1.699 ** | −0.476 ** | 0.145 ** |
| LnA | −0.782 | 4.421 | −2.076 | 3.809 *** | −0.390 ** | 0.803 ** | −0.170 ** | 18.848 *** |
| LnUR | −12.055 *** | 0.212 | −2.135 | 16.284 *** | −9.074 *** | −1.487 ** | 12.943 *** | 4.225 *** |
| LnEI | −7.736 *** | 0.8628 | −1.187 | 4.761 *** | −15.772 *** | −0.814 ** | 8.683 *** | 5.610 *** |
| LnES | −10.155 *** | −0.027 | 3.567 *** | 3.453 *** | −4.413 *** | −2.414 *** | 10.337 *** | 1.230 ** |
| Central Urban | ||||||||
| LnP | −6.540 *** | −1.074 | −2.040 | 16.163 *** | −18.973 *** | −0.189 ** | 8.403 *** | 1.620 *** |
| LnA | −0.646 | −1.608 * | −1.468 | 18.066 *** | −16.019 *** | −2.726 ** | 49.953 *** | 18.941 *** |
| LnEI | −7.820 *** | −0.752 | 8.213 *** | 15.287 *** | −4.867 *** | −2.495 *** | 4.861 *** | 2.621 *** |
| LnES | −6.680 *** | −0.090 | 3.566 *** | 9.269 *** | −28.4646 ** | −1.865 ** | 12.549 *** | 3.419 *** |
| Central rural | ||||||||
| LnP | −8.404 *** | −0.080 | −2.693 | −1.174 | −0.144 ** | −2.012** | 8.155 *** | 2.204 ** |
| LnA | −3.593 *** | −2.201 ** | −0.339 | 19.204 *** | −20.548 *** | −3.051*** | −0.743 ** | 6.354 *** |
| LnEI | −9.949 *** | −1.151 | 3.645 *** | 3.483 *** | −25.761 *** | −1.582** | 12.637 *** | 1.237 ** |
| LnES | −9.913 *** | −1.165 | 1.202 | 0.681 | −16.732 *** | −2.242** | 11.402 *** | 2.000 ** |
| Western | ||||||||
| LnP | −3.361 *** | 0.476 | −0.714 | −1.926 | −7.577 *** | −2.704 *** | 4.006 *** | 16.095 *** |
| LnA | −2.630 *** | 4.421 | −2.076 | 3.809 *** | −1.882 ** | −2.859 *** | 2.137 ** | 10.768 *** |
| LnUR | −11.043 *** | −1.555 * | −0.456 | 15.459 *** | −11.017 *** | −1.484 ** | 19.435 *** | 2.338 *** |
| LnEI | −3.527 *** | 0.618 | 0.569 | 8.438 *** | −13.225 *** | −2.158 ** | 1.019 ** | 2.657 *** |
| LnES | −4.818 *** | −1.184 | −1.571 | −2.472 | −8.028 *** | −2.968 *** | 9.573 *** | 2.721 *** |
| Western Urban | ||||||||
| LnP | −8.680 *** | −1.890 ** | −0.860 | 10.700 *** | −12.358 *** | −1.965 ** | 12.420 *** | 1.703 ** |
| LnA | 0.459 | 0.050 | 1.459 * | 22.195 *** | −36.073 *** | −3.444 *** | 62.986 *** | 20.129 *** |
| LnEI | −9.942 *** | −1.687 ** | −1.928 | −0.917 | −15.197 *** | −2.815 *** | 13.109 *** | 0.368 ** |
| LnES | −10.365 *** | −1.207 | 3.192 *** | −0.544 | −21.196 *** | −2.803 *** | 16.072 *** | 8.347 *** |
| Western rural | ||||||||
| LnP | −10.286 ** | −0.108 | −1.646 | 2.286 ** | −6.214 *** | −1.407 ** | 16.422 *** | 3.614 *** |
| LnA | −12.095 *** | −2.727 *** | 0.983 | 18.821 *** | −21.879 *** | −3.966 *** | −0.517 ** | 3.543 *** |
| LnEI | −5.166 *** | 2.559 | −1.160 | 0.791 | −8.143 *** | −3.281 *** | 9.629 *** | 0.114 ** |
| LnES | −0.644 | 2.157 | −1.542 | −1.996 | −5.725 *** | −3.137 *** | 2.992 *** | 2.089 ** |
*** p < 0.01, ** p < 0.05, * p < 0.1.
Table 3.
Panel cointegration test results.
| Eastern | Central | Western | ||||||||
|---|---|---|---|---|---|---|---|---|---|---|
| Total | Urban | Rural | Total | Urban | Rural | Total | Urban | Rural | ||
| Pedroni test | Panel v-Statistic | −3.715 | −4.441 | −4.202 | −4.025 | −4.453 | −4.156 | −4.271 | −3.708 | −4.454 |
| Panel rho-Statistic | 2.207 | 2.516 | 1.683 | 1.356 | 2.725 | 4.086 | 3.861 | 3.392 | 4.358 | |
| Panel PP-Statistic | −11.248 * | −19.096 *** | −23.849 *** | −8.941 ** | −6.939 *** | −10.272 *** | −21.344 *** | −20.219 *** | −16.338 *** | |
| Panel ADF-Statistic | −13.942 *** | −15.264 *** | −21.871 *** | −8.364 *** | −6.625 *** | −8.900 *** | −13.254 *** | −17.184 *** | −15.804 *** | |
| Group rho-Statistic | 4.076 | 4.441 | 4.265 | 4.381 | 4.453 | 4.257 | 4.685 | 3.708 | 4.320 | |
| Group PP-Statistic | −14.365 ** | −19.096 *** | −22.908 *** | −9.367 *** | −6.939 *** | −12.241 *** | −19.254 *** | −20.219 *** | −17.647 *** | |
| Group ADF-Statistic | −9.684 *** | −15.264 *** | −17.766 *** | −6.625 *** | −10.691 *** | −17.184 *** | −10.238 *** | |||
| Kao test | ADF stat | −1.761 *** | −2.443 *** | −1.165 *** | −2.645 *** | −3.038 *** | −1.435 ** | −2.216 *** | −1.857 ** | −2.531 *** |
| Residual variance | −0.642 | −0.341 | −1.526 | −1.327 ** | −1.704 ** | 0.089 | −2.156 | -3.141 | −0.881 | |
| HAC variance | 0.257 | −1.223 | −4.632 | −2.147 | −2.719 *** | −1.073 | −2.351 | −3.956 | −2.092 ** | |
*** p < 0.01, ** p < 0.05, * p < 0.1.
Table 4.
Drivers of differences in RCE between the different regions of China during 2010–2019.
| Eastern | Central | Western | |
|---|---|---|---|
| LnP | 0.710 *** | 0.862 *** | 1.973 *** |
| LnA | 0.851 *** | 0.412 *** | 0.289 ** |
| LnUR | −0.071 * | 1.354 *** | 0.438 ** |
| LnEI | 0.664 *** | 0.443 *** | 0.275 *** |
| LnES | −0.026 | −0.139 ** | −0.066 ** |
| P value | 0.3838 | 0.290 | 0.021 |
| Model type | RM | RM | FM |
| R2 | 0.988 | 0.890 | 0.878 |
FM—fixed-effects model; RM—random-effects model. *** p < 0.01, ** p < 0.05, * p < 0.1.
Table 5.
Determinants of RCE in urban and rural regions of China during 2010–2019.
| National | Eastern | Central | Western | |||||
|---|---|---|---|---|---|---|---|---|
| Urban (FM) | Rural (FM) | Urban (FM) | Rural (RM) | Urban (FM) | Rural (RM) | Urban (RM) | Rural (FM) | |
| LnP | 0.39 *** | −0.484 ** | 0.533 ** | 0.984 *** | 1.370 *** | 0.814 *** | 0.465 ** | 0.962 *** |
| LnA | 0.65 *** | 0.456 *** | 0.612 *** | 0.709 *** | 0.415 ** | 0.778 *** | 0.465 ** | 0.641 *** |
| LnEI | 0.229 *** | 0.286 *** | 0.119 * | 0.420 *** | 0.222 ** | 0.707 *** | 0.148 ** | 0.19 * |
| LnES | −0.094 ** | −0.094 ** | −0.118 ** | −0.109 ** | −0.216 ** | −0.065 * | −0.058 | −0.162 * |
| P value | 0.000 | 0.000 | 0.001 | 0.000 | 0.004 | 0.035 | 0.184 | 0.378 |
| R2 | 0.808 | 0.605 | 0.842 | 0.964 | 0.844 | 0.897 | 0.801 | 0.656 |
*** p < 0.01, ** p < 0.05, * p < 0.1.
Publisher’s Note: MDPI stays neutral with regard to jurisdictional claims in published maps and institutional affiliations. |
© 2022 by the authors. Licensee MDPI, Basel, Switzerland. This article is an open access article distributed under the terms and conditions of the Creative Commons Attribution (CC BY) license (https://creativecommons.org/licenses/by/4.0/).
Share and Cite
MDPI and ACS Style
Wang, Z.; Wang, S.; Lu, C.; Hu, L. Which Factors Influence the Regional Difference of Urban–Rural Residential CO2 Emissions? A Case Study by Cross-Regional Panel Analysis in China. Land 2022, 11, 632. https://doi.org/10.3390/land11050632
AMA Style
Wang Z, Wang S, Lu C, Hu L. Which Factors Influence the Regional Difference of Urban–Rural Residential CO2 Emissions? A Case Study by Cross-Regional Panel Analysis in China. Land. 2022; 11(5):632. https://doi.org/10.3390/land11050632
Chicago/Turabian StyleWang, Zheng, Shaojian Wang, Chuanhao Lu, and Lei Hu. 2022. "Which Factors Influence the Regional Difference of Urban–Rural Residential CO2 Emissions? A Case Study by Cross-Regional Panel Analysis in China" Land 11, no. 5: 632. https://doi.org/10.3390/land11050632
Note that from the first issue of 2016, this journal uses article numbers instead of page numbers. See further details here.