
Vulnerability to Flood Risk: A Methodological Proposal for Assessing the Isolation of the Population


Geography Department, University of Malaga, 29071 Malaga, Spain
*
Author to whom correspondence should be addressed.
Land 2022, 11(2), 277; https://doi.org/10.3390/land11020277
Submission received: 23 December 2021
/
Revised: 30 January 2022
/
Accepted: 8 February 2022
/
Published: 11 February 2022
(This article belongs to the Special Issue Land Management in Territorial Planning: Analysis, Appraisal, Strategies for Sustainability Ⅱ)
Abstract
:There are few studies that have developed estimations of the vulnerability of the population to isolation as a result of flood events. The main objective of this study was to provide a methodological proposal that addresses this matter through a series of cartographic instruments. To this purpose, the method was tested in a study area classified as area with significant potential flood risk (ARPSI) in southern Spain. Three methodological proposals were designed to define: (1) the population likely to be isolated within the flood area; (2) the population liable to be isolated by cuts to access roads outside the flood area; (3) the main workplaces involving concentrations of population likely to be isolated. The results demonstrate that the study area has a high degree of vulnerability to the flood risk. The methodological proposal provides detailed results at local level, which is a highly functional tool for flood risk managers. This research shows that, just as in the case of hazard, a deep and detailed knowledge of vulnerability and its consequent problems leads to a better management of flood risk.
1. Introduction
Effective flood risk management involves the consideration of prevention measures [1], with a common mapping diagnosis of sensitive areas and exposed elements. There is a general consensus among the scientific community to parametrize risk based on three factors: hazard, exposure and vulnerability [2]. However, historically, in most of the flood zoning studies, the most commonly used factor for its characterization has been hazard [3,4,5]. Therefore, it is necessary to continue developing the characterization of vulnerability. In this sense, this work is a methodological proposal for zoning the tendency to isolation of areas affected by flooding.
Many flood areas mapped in official cartographies are designed only considering aspects of hazard, but it is common that real floods exceed what is delimited on those official maps. The Campanillas River, in Málaga, in the south of the region of Andalusia (Spain), is another example in this regard. Its final stretch, prior to the confluence with the Guadalhorce River, is delimited as an area with significant potential flood risk (ARPSI according to its Spanish acronym). However, in February and March 2020 a flood reached and exceeded expected levels for 500 year recurrence periods. It is well known that one of the impacts of climate change is atmospheric misalignment and an increase in the frequency of extreme precipitation events [6,7,8]. Therefore, the time series used to make hydrological calculations may be outdated. In addition, the imperfections of hydrological and hydraulic modeling themselves should be considered, which can depend on several factors: both the physical–mathematical calculation models used and the intrinsic complexity of the natural phenomenon. In most cases, the phenomenon is not isolated from other phenomena (e.g., erosion, slope movements, etc.), which are not normally considered in modeling [9,10,11], nor are the anthropogenic elements of the territory (e.g., modified reliefs, vehicles, street furniture, etc.) which interfere with the normal flow, in many cases aggravating the repercussions of these floods [9,11].
In addition, there are human factors that produce different territorial patterns, with variable risk tendencies. Among them, peri-urban areas are some of the most prone to flooding [12]. Castronovo [13] defines them as areas of constant friction, with very active exchanges that are governed by the city, which causes an asymmetric flow of matter and energy. Therefore, the peri-urban particularities of study areas such as the one chosen in this research imply a special propensity for risk. Hence, the characterization of risk should be carried out not only according to the hazard but also the vulnerability of the exposed elements. Some academic papers have focused their efforts on this type of analysis [14,15].
The zoning of flood risk in the region of Andalusia (Spain) has been integrating some aspects related to vulnerability, in line with the trend initiated in recent decades regarding disaster risk management [16,17,18,19,20,21,22,23,24,25,26,27,28,29,30,31,32,33,34,35,36,37,38]. In the specific case of Andalusia, the Flood Prevention Plan in the Andalusian Urban Channels (2002) [39] included, for the first time, measures to control exposure and reduce vulnerability in critical areas. Subsequently, other examples that also gave for the first time an important role to the analysis of vulnerability in other regions of Spain can be cited: PATRICOVA [40] (2003) in the Valencian community, INUNCAT of Catalonia [41] (2006), the Coastal Territorial Planning Plan of the Region of Murcia (2007) [42] (2007), and the PRICAM of Castilla-La Mancha [43].
The official zoning of the flood risk currently in Andalusia is stipulated by the RD 903/2010 of flood risk assessment and management, the promulgation of which is the result of the transposition of Directive 2007/60/EC of the European Parliament, on the assessment and management of flood risks. Under this legislation, there is a risk zoning protocol, the so-called Preliminary Flood Risk Assessment (EPRI), which is based on the designation of all flood-prone areas, which must include a Flood Risk Management Plan (PGRI) and an internal zoning in the ARPSI areas. For these zones detailed studies are required to identify the areas exposed to flood hazards. Some elements linked to vulnerability assessment are considered in the analysis, although in general they are very lax studies and make few demands [44]. Against these types of deficiencies, proposals such as that by Perles et al. [44] are designed to map the vulnerability of a territory to the risk of flooding under the European Flood Directive. Their proposal provides a catalogue of maps aimed at characterizing exposure and vulnerability based on a set of problems. Based on that catalogue, Table 1 shows the maps designed to characterize vulnerability. As can be seen, problem 2 is the isolation of the population.
In relation to the ultimate object of this study, there are relatively few studies that have specifically estimated vulnerability of populations to isolation as a result of flood events. There are some previous studies, both of floods and other natural risks.
- The zoning of exposure to forest fires establishes the first mapping strategies to assess the isolation of populated areas. Many methods to assess the vulnerability of settlements focus on aspects such as accessibility [45,46,47,48,49,50], and specifically, on the possibility of isolation by fire [51,52].
- In the case of the floods in Bangladesh, Lu et al. [55] raise the problem of isolation as one of the most negative consequences of flooding, since this isolation can lead to the cancellation of trips and the selection of other destinations. In order to tackle this problem, they propose the improvement of water infrastructure and education to adapt to floods. In Peru, Thouret et al. [56] also consider the isolation factor for lahars and flash floods at a building scale. To do so, they take into account the distances from each building to the facilities that are required during an emergency (e.g., hospitals or shelters). At the same scale of detail, Fujiki and Laleau [57] test a GIS methodology to identify emergency shelter needed by flood-affected populations. In this case, they combine two indexes, the first an exposure index that involves different variables related to the characteristics of the hazard and its direct physical impacts: flood height, geographical isolation, interruption of public services.
- Finally, there are studies that deal with the vulnerability of road infrastructure, such as those carried out by Othman and Hamid [58], He et al. [59] and Kim et al. The authors of [60] also propose a methodology for the simulation of cut-off areas, making clear in their case the special vulnerability of suburban areas. Finally, other works have advanced modeling solutions to help the management of the road system when a flood event occurs [61,62,63].
The main objective of this study is to offer a methodological proposal for the assessment of vulnerability of the population to the problem of isolation. To this end, the methodology is tested in an ARPSI and its degree of vulnerability can be assessed. As a secondary objective, a cartographic series is designed consisting of three synthetic maps:
- Diagnosis of the population with the possibility of being isolated within the flooded area.
- Diagnosis of the population likely to be isolated by cuts in access roads outside the flood zone.
- Diagnosis of the main workplaces involving concentrations of population likely to be isolated.
2. Materials and Methods
2.1. Study Area
The methodological procedure was tested in an area with a long history of flooding. This is a section of district 9 of Málaga, (Andalusia, Spain) (see Figure 1). This district, a peri-urban area of the city, is comprised of four secondary nuclei: Campanillas, the most important, and other three under its area of functional influence (Huertecilla de Mañas, Colmenarejo and Pilar del Prado). These nuclei are located on the banks of the Campanillas River, a tributary of the Guadalhorce River. The study area is a 289 km2 catchment and the length of the riverbed is 45 km. The progressive urbanization of its riverbanks has increased the risk of flooding in a stretch with recurrent overflows, which cause material and personal damage. The construction of the Casasola reservoir, completed in 2007, has the flood control as one of its objectives, as well as the supply of irrigation water to the surrounding agricultural areas. However, successive floods of the river (2010, 2016 and, doubly, in 2020), as well as the progressive extensions of the urbanized land, have only aggravated the problem.
The study area is a wide floodplain with an average channel slope of 0.4%. It covers 540 ha, of which 157 ha belong to the potentially flooded area. The length is 2.3 km, the minimum width is 600 m and the maximum is 1.2 km. Table 2 shows the flooded area at the urban cores within the study area.
2.2. Elaboration of the Methodological Proposal
The cartographic maps aim to identify the vulnerability of the population living in the study area in a visual and accessible way for public administrations. Firstly, it is necessary to characterize the two major geographical elements to be considered: on the one hand, to estimate the resident population at cadastral plot scale and, on the other hand, the road network, which is one of the elements that is affected by the territorial support. Once the study area and the problems arising from the floods are identified, which affect the territorial functionality by means of roadblocks, the spatial database needs to be created and upgraded so that the territorial analysis is best suited to the reality of the flood phenomenon and its interaction with accessibility.
The main objective of this methodology is to address specific problems of vulnerability to flood risk. In this line, we considered the advances made on specific problems by Perles, Sortino and Cantarero [4]:
- Isolation of the population;
- Disruption of basic territorial services;
- Relief and assistance challenges;
- Risky or unsafe behavior of the population;
- Effects on particularly sensitive goods or sectors of the territory;
- Contamination of parts of the territory and other risks associated with flooding.
This research will instrumentalize and develop the methodology of the problem of isolation of the population, as it is one of the most important problems of vulnerability to the risk of flooding. The choice of this problem stems from the need to reduce the loss of human lives.
The mapping tools developed to address all the population isolation problems are the following:
- Map of population with possibility of being isolated within the flooded area according to its degree of isolation;
- Map of population outside the flood-prone area that may be isolated by roadblocks, depending on their degree of isolation;
- Map of main workplaces involving concentrations of population likely to be isolated (industrial, services) according to their degree of isolation.
For each map, the same methodological procedure has been systematically implemented. First, a spatial database has been created including all the territorial elements involved in flooding, and they have been categorized according to the size of the affected population or the size of the study area. Secondly, the impact caused by the flooding on the selected territorial elements (flooded in situ or with various degrees of isolation) is measured. Finally, a combinatorial matrix is generated to establish the degree of vulnerability of the affected urban elements.
2.3. Sources of Information
In order to optimize the applicability of the cartographic proposal by the public administration or other private entities, such as environmental consultancies, only indicators that can be generated by easily accessible edited sources and general and equivalent information have been selected, in this case, for the whole of the autonomous community of Andalusia. Therefore, some indicators have been discarded, since difficulty in obtaining them means that they are not useful for applied risk management. The sources used for the cartographic catalogue are listed below:
- DERA: Spatial Reference Data of Andalusia. Scale 1:100,000. Year: 2021. This is a cartographic database with a wide range of spatial data. This information is very useful for the selection of potentially affected territorial elements. It has been used in the methodology of the three maps included in the study.
- SIOSE: Land use/land cover information system of Spain. Scale 1:10,000. Year 2007. This special database allows categorizing land uses according to their function (industrial, residential, agricultural, etc.). It has been used in the elaboration of the map methodology of Section 2.4.3.
- CartoCiudad: Road network of Spain. Several scales. Year: 2021. This is a dataset of the urban and interurban road network. It is used to measure the internal connectivity of the nuclei and their interconnectivity. This information is used in the elaboration of the three maps.
- Cadastre: Cadastral electronic site. Variable scale. Year: 2021. Cartographic and alphanumeric information database belonging to the official Spanish Cadastre. The cartographic base of the buildings has been used, which has allowed disaggregating the estimated population per floor. The information has been necessary for the creation of two maps: Section 2.4.1 and Section 2.4.3
- GoogleEarth. Variable scale. Year: 2021. Multi-scale orthophotography service. It has been consulted for photointerpretation. Its Google Street View extension, which provides street-level panoramic views, has also been consulted. These sources have been used in the elaboration and correction of territorial elements of the cartography.
- PNOA: National Aerial Orthophoto Plan of Spain. Year 2021. Orthophotography service. It has been used for photointerpretation and cartographic elaboration.
- Hydrological plans. Variable scale. Years: According to water authorities of the basins. Documents prepared by the water authorities that set out the guidelines to be followed for water management in each river basin. The cartographic bases of flood spots belonging to the flood risk management plan of the Andalusian Mediterranean Basins have been used. This information has been taken into account in the preparation of all the maps.
- INE: Spanish National Statistical Institute. Spanish Continuous Register 2021. Demographic information on the population is extracted from this source. This information is considered in the preparation of maps methodology from Section 2.4.1 and Section 2.4.2
2.4. Structure of the Methodology
Each of the three maps proposed in the vulnerability mapping series complements others to address the problem of isolation of the population from potential flood events. The methodology and functionality of each map is developed below.
2.4.1. Map of the Population Likely to Be Isolated within the Flooded Area According to Its Degree of Isolation
The objective of this map is to generate a tool that estimates the potential population that may be isolated or directly affected by flooding. To this end, it is necessary to quantify the potential population that is directly affected by flood events and therefore needs to be evacuated, or whose houses need to be protected against this phenomenon. For this reason, the analysis is limited to the dwellings located on the ground floor. With regard to the accounting of the potential affected population, all the residents of the buildings in the affected area are considered, as while many of them are not directly affected by the flood, they are temporarily isolated so they may suffer from lack of basic services, food, etc.
- Step 1: Selection of territorial elements involved in the map development.
First, all the buildings in the Cadastre that are affected by the flooded area are selected. This is done by using the GML format files in the ATOM version from the INSPIRE Cadastral Mapping Services. These files contain data fields with the geometry of the plots, the construction units and the number of dwellings that are available within each of them. Therefore, this step provides a spatial database with all the buildings affected by the flood and its corresponding cadastral reference, which will be crucial to be able to annex alphanumeric information to this cartographic database.
Then, in order to count the number of ground floors in each building, we work with the alphanumeric data of the Cadastre, both rustic and urban. This information has different levels of information for the data processing. In this case, the necessary level is the one corresponding to Type 15: Real Estate Registry. From this file, the residential uses are filtered with the codes “00”, “OD” and “UE”. The code “00” includes building construction types and “OD” and “UE” include villa construction types. Once the filter is applied and the ground floor is selected, we proceed to count the cadastral reference of the ground plants, while for each construction it is necessary to remember that a construction contains a cadastral reference and it may include one or many dwellings or buildings.
- Step 2: Selected Territorial Elements and their Degree of Damage by flood
The types of damage are integrated to establish vulnerability levels. On the first level, the population directly affected by the flood on the ground floor and, on the second level, the population isolated at higher floors.
The first step is to estimate the population whose houses are flooded. In order to estimate the total population affected, the potential number of inhabitants per building is considered, by counting the number of dwellings with ground floors per building. The estimation of the population is obtained by multiplying the number obtained in the first step and the average number of existing houses, according to the last available census (2011). The arithmetic mean of the entire household included in the same administrative unit is used to obtain the average number of persons per household in each census section.
In the study area there are two census sections affected, as is shown in Table 3.
To calculate the rest of the isolated population, the number obtained in Step 2 is subtracted from the total population of the entire building.
- Step 3: Establishing the degree of vulnerability of the affected territorial elements.
This is based on the categorization of the number of affected people and their degree of isolation to determine their vulnerability level.
The categorization of the affected population is defined at a building scale, according to the resident population. To create the thresholds, outliers were eliminated using the interquartile range (IQR) formula, which is detailed below:
where: IQR = Q3 − Q1; Q1 = First quartile; Q3 =Third quartile.
Low end outlier = q < Q1 − 3* IQR
Upper end outlier = q > Q3 + 3* IQR
Mean and standard deviation were calculated from the building information.
Therefore, the proposed classification uses the mean and the standard deviation to rank the number of population affected. To this purpose, the following thresholds are set in Table 4.
For the final classification of vulnerability, the degree of isolation is related to the quantity of population affected, as shown in the following matrix (Table 5).
- Very high vulnerability: Buildings with a moderate and a high population of people that are affected by flooding. Additionally, if the number of the affected population is high and it is isolated, they are included in this category.
- High vulnerability: Areas with low population concentration in buildings, but with a maximum degree of isolation due to flooding. This category also includes areas with moderate accumulation of people being isolated and not “flooded”.
- Moderate vulnerability: This category only includes areas with low and isolated population density.
A flow diagram is presented below (Figure 2) as a methodological summary, in which the necessary sources of information and the procedure carried out for the map are presented.
2.4.2. Map of the Population Outside the Flooded Area That May Be Isolated by Roadblocks According to Its Degree of Isolation
The objective of the second map is to define urban cores that may be isolated by flood events. This will require obtaining, on the one hand, the network of roads and streets which are affected by flooding and, on the other hand, the areas connected by those roads, with their population size, in order to be able to estimate vulnerability. In addition, the objective is to determine whether these areas are totally or partially isolated by a flood event, which will define their degree of vulnerability.
- Step 1: Selection of territorial elements involved in the development of the map.
The first step is to select urban cores close and directly connected to the affected area. For the development of this section, it is necessary to investigate the flooded area and the connections with the closest urban cores that depend on it or that are strictly linked to their territorial functioning.
- Step 2: Territorial elements selected and their degree of damage because of flooding.
Once the affected urban cores have been selected, the most up-to-date population data should be obtained from the annual census per population unit. In this case, the data available belong to 2020 and the cores involved are shown in Table 6.
Afterwards, the urban cores are categorized according to the number of the population affected. To create the thresholds, the outliers have been eliminated using the interquartile range (IQR) formula, which is detailed below:
where: IQR = Q3 − Q1; Q1 = First quartile; Q3 =Third quartile.
Low end outlier = q < Q1 − 3* IQR
Upper end outlier = q > Q3 + 3* IQR
Mean and standard deviation were calculated from the sample of urban cores; not only from the affected cores, but also from all the urban cores within the selected municipality have been used, in order to be able to graduate their importance. Table 7 shows how the vulnerability of the cores is categorized according to size.
Before determining the vulnerability of the cores involved, the degree of isolation of those cores must be determined:
Partial isolation: This is defined as the partial isolation of those population centers in which some of their accesses are blocked by flooding. In these cases, alternative accesses are always available, even if this means following longer and more inefficient routes.
Total isolation: This is defined as the total blocking of roads that give access to the urban core, regardless of whether the urban core is flooded.
- Step 3: Establishing the degree of vulnerability of the affected territorial elements.
As shown in Table 8, the combination of the degree of isolation (totally or partially isolated) of the nearby urban cores linked to the area affected by the flood is combined with the categorization of the urban cores according to the population found in each of them.
Very high vulnerability: Urban cores with a medium and a high number of affected people under a total isolation scenario, as well as urban cores with a high number of affected people who are partially isolated.
High vulnerability: Two scenarios are included within this category. On the one hand, low populated areas whose degree of isolation is total, and urban cores with moderate population density and that are partially isolated. In the latter scenario, it must be understood that, despite being only partially isolated, the situation affects a much larger population.
Moderate vulnerability: This category includes areas with low population concentration and a certain degree of partial isolation.
A flow diagram is presented below (Figure 3) as a methodological summary, in which the necessary sources of information and the procedure carried out for the map are presented.
2.4.3. Map of the Main Workplaces with Concentrations of Population Likely to Be Isolated (Industrial, Services) According to Their Degree of Isolation
The objective of this map is to identify all the workplaces (commercial, industrial, public services, etc.) that concentrate population due to the nature of their activity, in order to estimate their vulnerability according to their size and capacity to crowd people, and the degree of isolation of the affected territorial elements.
- Step 1: Selection of territorial units involved in the development of the map.
The first step is to download and select the XML mapping data, in ATOM files, of the buildings within the study area from the INSPIRE Cadastral Mapping Service. The files are processed in Geography Markup Language (GML) format and transformed into shapefile (.shp) formats, so that they can be geoprocessed in GIS.
The urban cores that are linked to the area directly affected by flooding must be selected from the DERA database. This procedure has been carried out through photointerpretation and by investigating the territorial links of the urban cores surrounding the affected area. The selection of urban cores has been based on the possibility that the flood will cut the access roads to the nearby cores, assuming the total or partial isolation of the main work centers located in these adjacent cores.
Finally, once the urban cores have been selected, all the cadastral buildings within them must be selected.
- Step 2: Territorial elements selected and their degree of damage because of flooding.
First, all the land uses of the buildings that are reported in the alphanumeric database of the Cadastre were listed and identified, in order to select which of them belong to the land uses related to work centers. To this end, all the potential land uses of the buildings have been downloaded from the Cadastre, and those land uses linked to working activities have been highlighted, as shown in the following Table 9:
Once the uses related to work activities have been identified, it is necessary to download the alphanumeric data of the selected municipality from the virtual Cadastre, and then select the type 15 category: Real Estate Registry, where all the land uses of the buildings are included.
A database that integrates all the cadastral references that are involved is created. Once the database has been obtained, it should be related to the type 15 category and then, all the affected cadastral references with all the land uses must be selected. After following this procedure, a new general spatial database is generated.
Selections and filters are applied to the spatial database to obtain the types of uses for each cadastral reference within the study area. By following this workflow, it is possible to generate a database with all the potential land uses existing in the study area. It is important to clarify that the same property can have several land uses within a building, so it is important to perform all these steps in order to be able to obtain a coherent and complete spatial database.
- Step 3: Categorization of workplaces.
In this step, the method aims to obtain the surface area of each immovable property and to classify the work centers according to the area occupied by each of them. After fieldwork and research of the different databases, the following thresholds have been established for the classification of immovable property according to its surface area:
- Small workplaces: 0–50 m2,
- Medium-sized workplaces: 50–500 m2,
- Large workplaces: >500 m2.
Depending on the degree of damage generated by the flood, the following three levels are considered.
Flooded: All the workplaces are directly affected by the flood. Since this loss of accessibility is complemented by material damage, it is the most serious situation in terms of establishing the ultimate degree of vulnerability.
Total isolation: Workplaces are outside the flooded area but located within the affected urban core or within the adjacent urban cores and suffering a total blockade of the roads. The situation is critical, as it makes it impossible for these workplaces to function, although it would not imply material losses. It is estimated that this scenario could last an indeterminate period after the catastrophic episode, until access is fully restored.
Partial isolation: The rest of the workplaces are outside the flooded area, but located within the affected urban core or at nearby cores, where some of their access routes are blocked. In these cases, a partial loss of connectivity is generated but does not prevent the access of workers to the affected area. Therefore, these scenarios are harmful, but they do not imply material damage, since they would only cause a malfunction of the urban system during the flood.
- Step 4: Establishing the degree of vulnerability of the affected territorial elements.
The calculation of the degree of vulnerability of workplaces is related to their size, and, therefore, to their importance, but it is also related to the degree of isolation, as shown in the following matrix, Table 10.
Very high vulnerability: Workplaces that are totally flooded and medium or large workplaces with total isolation are considered. In addition, very large workplaces with partial isolation are included in this category.
High vulnerability: This category includes small workplaces totally isolated and medium-sized workplaces partially isolated.
Moderate vulnerability: This includes small workplaces with partial isolation.
A flow diagram is presented below (Figure 4) as a methodological summary, in which the necessary sources of information and the procedure carried out for the map are presented.
3. Results
3.1. Mapping the Population Likely to Be Isolated within the Flooded Area
The final statistical sample, without outliers, was 346 buildings. The results of the affected population and its degree of damage are shown in Table 11:
Based on the established thresholds, the mapping results are analyzed below in Figure 5:
As it can be interpreted from the area shown in blue, it is observed that most of the area covered by the sheet of water is located on the right bank of the river. This area belongs to Campanillas, where the land has been urbanized to the edge of the usual riverbed. The sheet of water covers about 500 m towards Campanillas. This is the most populated area in this stretch of the river, with both single and multi-family houses. Fortunately, the population density is not very high, since the buildings are predominantly single-family, while the multi-family houses have two floors.
In order to be able to analyze in more detail the case of Campanillas, two areas of this core have been magnified (Figure 6 and Figure 7).
In this area of the flooded western edge (Figure 6), a predominantly residential area is observed, with a mixed morphology of single-family and multi-family dwellings. In orange, single-family dwellings are observed, with moderate vulnerability because of the low population. In red, the townhouses that accumulate more population in a smaller area are highlighted. Regarding the multi-family houses, two scenarios can be highlighted. In orange, with violet limits, houses where the affected ground floor is residential and, in gray, those cases in which the ground floors have other land uses, commercial being the most common one. Additionally, by paying attention to the urban fabric, it is observed that vulnerability of multi-family houses ranges from moderate to very high, depending on the number of people affected.
This capture of the affected area closest to the river (Figure 7) shows the predominance of moderate vulnerability as a consequence of horizontal urbanism. Even so, it is also observed that there are more vulnerable multi-family dwellings in the eastern part, close to the river.
3.2. Diagnostic Mapping of the Population Susceptible to Being Isolated by Cuts of Roads Outside the Flooded Area
The final statistical sample, without outliers, was 18 urban cores. The categorization of the urban cores according to their population is shown in Table 12:
Based on the intervals, the degree of vulnerability of the urban cores is analyzed (Figure 8):
Following a decreasing order, Campanillas is the most vulnerable urban core to a potential flood, since the A-7054, which crosses the river in this area, serves as a connection with Málaga City. Therefore, it being cut off would disconnect the affected area and the area that has most of the resources to deal with a natural disaster. In addition, Campanillas is the area with a larger population, which increases its vulnerability to flooding.
In addition, the flooded area would disconnect Campanillas from other villages located on the other side of the river. These villages have a strong link with Campanillas, but the degree of isolation is lower in Huertecilla de Mañas and Pilar del Prado, which would maintain their connection with Málaga City through the secondary road A-7058. For this reason, and due to its small size, its vulnerability is moderate. The scenario is worse in Colmenarejo (to the north), which is not directly affected by floods, but would be isolated by the flooding of the secondary road, so its vulnerability is moderate.
3.3. Mapping of the Main Workplaces with Population Concentrations Likely to Be Isolated
The map of workplaces is analyzed below in Figure 9. In order to observe in greater detail the accuracy of the methodology tested in the study area, areas A and B have been selected:
A quick diagnosis of the areas with the highest concentration of workplaces and their potential isolation can be obtained. In general terms, it also makes it possible to identify the distribution of economic activities by type. It can be observed that at both the southern and northern limits of the flooded right bank (Campanillas) there is a higher concentration of workplaces, while on the left bank, the main conflictive area is located in the isolated urban core to the north of the study area. Then, several snapshot are shown in order to allow observing the information at a larger scale, especially vulnerability. It must be remembered that this methodology is designed to be displayed using a viewer that allows avoiding scale issues of classical maps.
In the case of Colmenarejo (Figure 10), as previously observed, vulnerability lies in the potential isolation situation. Because of their rural nature, the affected workplaces are mainly agricultural (green), although some medium-size and large commercial and industrial activities are also observed, which implies a high vulnerability. On the other hand, it is observed that the density of workplaces is low, which reduces the vulnerability of the area.
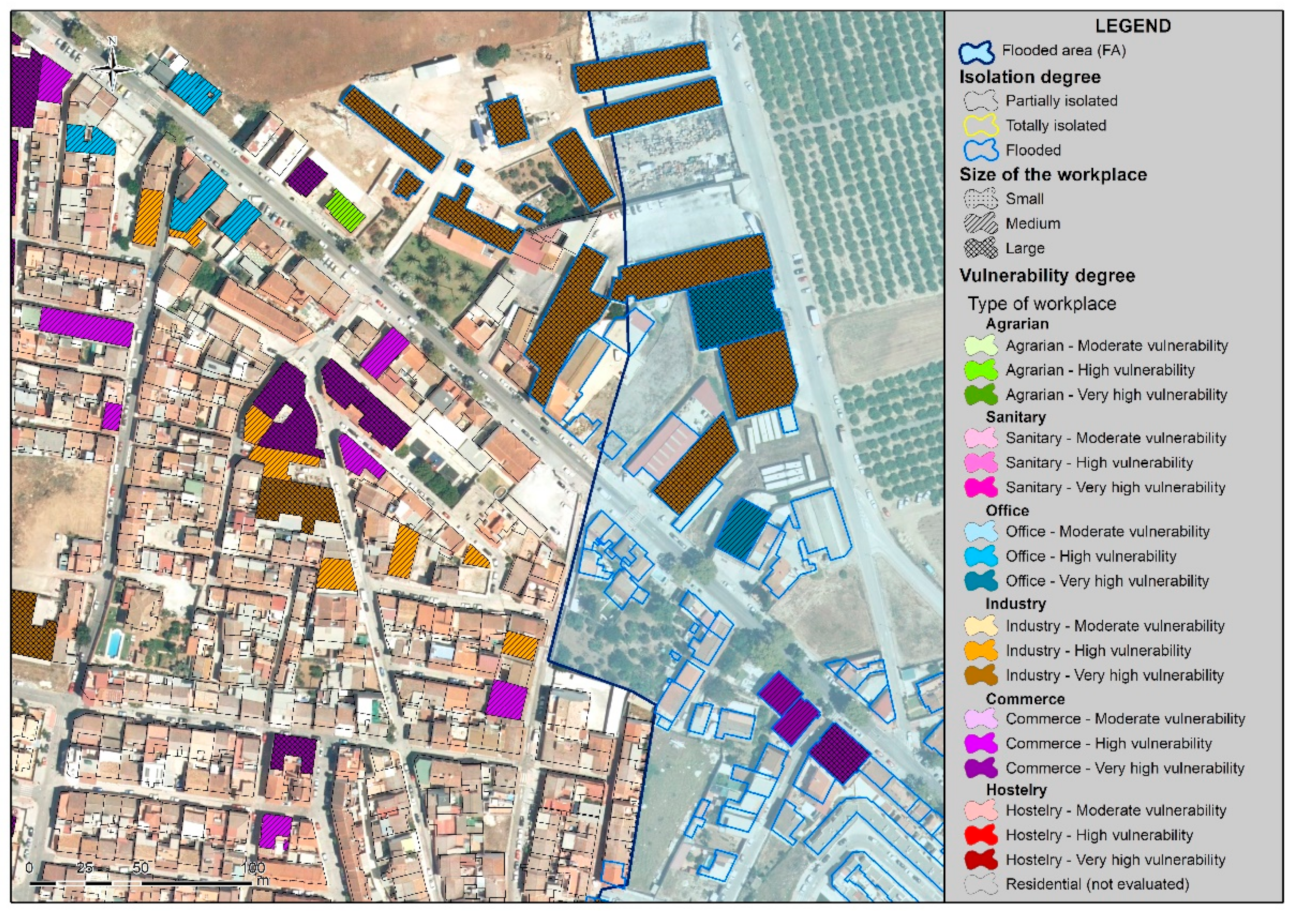
Next to the edge of the flooded area in Campanillas, a high density of workplaces is displayed (Figure 11). To the right of the image, those that are directly affected by the flood, while to the left, those that would suffer only partial accessibility problems, since there are alternative accesses. Medium and large workplaces predominate in all the areas, which increases their vulnerability, and given that Campanillas is a big urban core, economic activities associated with industry, administration and the commercial sector are common.
4. Discussion
The analysis of the results obtained confirms the usefulness of the proposed methodology. Unlike other methods that assess vulnerability to flood hazards at medium and lower scales [64,65,66,67], the scale of the proposed methodology reaches the basic urban unit (building), like some previous studies [68,69,70,71]. In this case, the population is split to estimate more accurately the impact of the flood according to its degree of damage. A distinction is made between those who live on the ground floor, directly affected by flooding, with potential human and material losses, and those who live on the upper floors, who would only be affected by isolation. This phenomenon is reflected in Figure 6 and Figure 7, which show different scenarios that lead to the generation of different degrees of vulnerability of the buildings depending on their location (first floor or any other).
Another contribution of this study compared to other methodologies is the capacity to combine degrees of isolation with population size. The method not only takes into account the size of the population, but also evaluates the accessibility of the urban core, measuring its degree of isolation, which allows combining both variables and improving the estimated vulnerability. This is exemplified in Figure 8, where Colmenarejo is totally isolated, with a medium-sized population, as opposed to Campanillas, which is flooded and partially isolated, but with a larger affected population. Kim [60] conducted a similar analytic study, and obtained similar results in Japan. Previously, other studies more focused on the concept of accessibility than on the degree of isolation were carried out, such as that by Beltrán et al. [49], who analyzed in a simpler way accessibility through the interpretation of aerial images, and classified it as “good” and “moderate or poor”; or the study by Cova [47], who used a GIS to simulate evacuation routes as a measure to assess vulnerability. This approach is closer to reality, since it considers that an urban core can only be highly vulnerable when it is isolated and has a high population size.
Another contribution of the present research is the analysis of workplaces during a flood event. Figure 10 and Figure 11 distinguish between isolated and flooded areas, taking into account the different land uses and associated economic activities. The resident and working population have been split in order to identify different problems of vulnerability, since their needs have to be addressed on a case-by-case basis. Indirectly, it is possible to estimate the problems caused by commuting and the related increase in vulnerability from a risk perspective. Similar mobility problems have been analyzed in other studies, although following a more temporal, rather than spatial perspective [67].
A final contribution of this study is the classification of isolated urban cores based on their residential or working uses, since they have characteristics that induce different degrees of vulnerability. Once established, this methodology proposes to quantify the number of workers in each of the areas classified as isolated. The difficulty lies in the lack of open-access spatial databases to enable the assessment of the workforce, hence the proposal for indirect estimation based on the size of the workplace. The replicability of this methodology could be more accurate where public databases are available, as is the case of the Directorio Estadístico Nacional de Unidades Económicas (DENUE) in Mexico.
The results are categorized according to the degrees of magnitude that fit to the study area. Therefore, the parameters would be different in other study areas, since a new scale would be needed depending on the local data. This problem is highlighted by Perles [4] regarding the studies that address territorial or sectoral vulnerability (physical, social, economic, etc.). In order to deal with this problem, the selected variables must be standardized, something that has been deeply analyzed in social vulnerability studies [31]. The problem in this type of approaches lies in the intrinsic vulnerability to the natural phenomenon: the flood of a river with a large basin is not the same as the flood of a gully. As Birkman and Wisner [28] and Eaking and Luers [72] observed, aspects such as adaptation to the local scale, the selection of common indicators, the weighting of these indicators and the algorithm used for standardization are aspects still to be agreed.
From a cartographic point of view, the results have the advantage of reaching a large scale. In fields such as flood risk management, the use of a large and detailed scale is essential in order to improve the accuracy when interpreting the potential territorial consequences or applying measures that are adapted to the specific vulnerability of the study areas. The format and resolution of the maps ease its addition to any digital viewer, either for displaying (e.g., cartographic viewers) or with a higher level of interaction, such as dashboards that allow multiscale and real-time work and enhance accessibility to authorities and stakeholders. Linked to other risks, some examples of this type of map have been successfully applied, such as in mapping the earthquake that took place in Lorca (Spain) in 2011 [73].
The proposed methodology for assessing vulnerability issues related to the isolation of the population is a proposal for improving the maps of the Andalusian Government for the flood risk management of the Mediterranean Andalusian Basin, required by the EU Water Framework Directive 2007/60/EC. Nevertheless, the addition of this type of detailed map would imply an improvement in the characterization of the vulnerability of the ARPSI used in these studies. In order to verify the contributions of this study, the ARPSI of the Guadalhorce River has been selected, specifically the one of its tributaries, the Campanillas River.
The option of replicating the methodology is determined by the quantity and quality of the geographical spatial database available from public administrations. Within the framework of the European Union, the INSPIRE Directive forces the state members to develop geo-referenced data, enabling the replicability of such methodologies. However, this may be a constraint in developing countries, which lack spatial databases at large scale.
5. Conclusions
It is shown that the area of the Campanillas district has a high degree of vulnerability to the risk of flooding. This peri-urban zone is an area of expansion in which the floodplain of the Campanillas River has been occupied. As a result, as has been verified in this study, the high vulnerability areas due to isolation include buildings used for residential and economic activities.
The methodological proposal provides detailed results at a local scale, so it may be considered as a highly useful tool for flood risk managers. This scale enables them to implement specific measures in each affected area, with the possibility of hierarchically prioritizing the actions, instead of applying generic measures that can lead to an inefficient use of public resources and their inaccurate application.
As previously indicated, within flood risk assessment there is a prevalence of hazard regarding vulnerability. This research shows that, just as in the case of hazard, a deep and detailed knowledge of vulnerability and its associated problems leads to a better management of flood risk. From the flood risk management point of view, it becomes a powerful tool for the implementation of preventive measures that has to be included in local emergency plans. On the other hand, these tools should be integrated into territorial and urban planning, which would mean a conceptual step forward thanks to the addition of vulnerability, and it would avoid the mere characterization of risk only based on hazard values (i.e., flooded area, height of the sheet of water or flow velocity).
The methodology should be subject to a periodic update, taking into account the current trends in climate change, where episodes of torrential rainfall are becoming more intense and frequent and they generate larger flood zones. The occurrence of new flood episodes with a larger sheet of water would require updating the hazard maps and, as a result, the assessment of vulnerability problems that damage the new flooded areas. This scenario not only concerns the proposed method, but also any other proposal related to other natural risk assessments. Another limitation of the methodological proposal lies in the difficulty of assessing the isolation of the population according to their characteristics: age, disability or disease conditions, economic capacity, etc. The Spanish Organic Law 3/2018 of 5 December, on Personal Data Protection, based on the European Directive (EU) 2016/680, prevents access with this scale of detail to demographic and socioeconomic data. Finally, it would be necessary for public administrations to recurrently review the methodology in order to update, improve and adapt it to reality. However, the functioning of public administrations may have limitations, both from an instrumental and economic point of view, which is beyond the scope of this study’s methodological proposal.
This study highlights that the development of tools for the evaluation of the specific issues of vulnerability when facing flood hazard has a high potential both for urban planning and for the integral management of the risk of flood. Although this study focuses on the isolation of the population and its vulnerability to flooding, there are numerous issues related to vulnerability [4] that may be addressed, which would require new methodological tools such as the one proposed and tested in this research.
Author Contributions
J.F.S.B. designed the conceptual approach; designed and developed the methodology; prepared the database and revised and approved the final version of the manuscript. J.F.S.B. and H.C.N. analyzed the data, interpreted the results and were involved in writing the manuscript. H.C.N. and F.J.C.P. were involved in the compilation of previous and current research. All authors have read and agreed to the published version of the manuscript.
Funding
This research received no external funding.
Acknowledgments
The authors would like to thank to the UMA18-FEDERJA-238 project called “Vulnerabilidad de centros docentes andaluces frente a riesgos naturales múltiples (sísmico, movimientos del terreno e inundación). Evaluación integral y propuestas para la gestión de la catástrofe” for administrative and technical support.
Conflicts of Interest
The authors declare no conflict of interest.
References
- Pita López, M.F. Riesgos Catastróficos y Ordenación Del Territorio En Andalucía; Consejería de Obras Públicas y Transportes; Junta de Andalucía: Sevilla, Spain, 1999. [Google Scholar]
- Olcina Cantos, J. Conceptos de Aplicación En El Análisis de Riesgos. In Riesgos Naturales; Ariel: Barcelona, Spain, 2002. [Google Scholar]
- Ribera, L. Los Mapas de Riesgo de Inundaciones: Representación de La Vulnerabilidad y Aportación de Las Innovaciones Tecnológicas. Doc. Análisis Geográfico 2004, 43, 153–171. [Google Scholar]
- Perles Roselló, M.J. Apuntes Para La Evaluación de La Vulnerabilidad Social Frente Al Riesgo de Inundación. Baética. Estud. Arte Geogr. Hist. 2010, 32, 67–87. [Google Scholar]
- Cantarero Prados, F.J.; Oropeza Orozco, O.; Perles Roselló, M.J. Carencias y Necesidades de Investigación Sobre Vulnerabilidad Frente a Las Inundaciones En México. In XV Coloquio Ibérico de Geografía. Retos y Tendencias de la Geografía Ibérica; Asociación de Geógrafos Españoles: Murcia, Spain, 2016; pp. 108–117. [Google Scholar]
- van Aalst, M.K. The Impacts of Climate Change on the Risk of Natural Disasters. Disasters 2006, 30, 5–18. [Google Scholar] [CrossRef] [PubMed]
- Schmidt-Thome, P.; Greiving, S. The response to natural hazards and climate change in Europe. Investig. Geográficas 2009, 49, 23–49. [Google Scholar] [CrossRef] [Green Version]
- Stults, M. Integrating Climate Change into Hazard Mitigation Planning: Opportunities and Examples in Practice. Clim. RISK Manag. 2017, 17, 21–34. [Google Scholar] [CrossRef]
- Cantarero Prados, F.J. Relaciones Entre El Patrón Territorial y La Generación Del Peligro de Inundación. Análisis Comparado de Casos En Málaga (España) y Motozintla (México), Universidad de Málaga. 2013. Available online: https://www.educacion.gob.es/teseo/mostrarRef.do?ref=1036662 (accessed on 3 November 2021).
- Gallegos Reina, A. Caracterización de Cuencas Fluviales Periurbanas Con Riesgo de Inundación En Ámbitos Mediterráneos y Propuesta de Cartografía de Peligrosidad Adaptada, Universidad de Málaga. 2015. Available online: https://www.educacion.gob.es/teseo/mostrarRef.do?ref=1176072 (accessed on 4 November 2021).
- Gallegos Reina, A.; Perles Roselló, M.J. Relationships between Peri-Urbanization Processes and Multi-Hazard Increases: Compared Diachronic Analysis in Basins of the Mediterranean Coast. ISPRS Int. J. Geo Inf. 2021, 10, 759. [Google Scholar] [CrossRef]
- Perles Roselló, M.J.; Mérida Rodríguez, M. Patrón Territorial y Conformación Del Riesgo En Espacios Periurbanos. El Caso de La Periferia Este de La Ciudad de Málaga. Scr. Nova. Rev. Electrónica Geogr. Ciencias Soc. 2010, 14, 199983. [Google Scholar]
- Castronovo, R. La Ocupación del Territorio y Sus Aspectos Ambientales. Análisis de un Sistema Periurbano. In VI Encuentro de Geografía de América Latina; Temas Libres: Buenos Aires, Argentina, 1997; p. 7. [Google Scholar]
- Okunola, O.H.; Bako, A.I. Exploring Residential Characteristics as Determinants of Household Adaptation to Climate Change in Lagos, Nigeria. Int. J. Disaster Resil. Built Environ. 2021. ahead-of-print. [Google Scholar] [CrossRef]
- Spears, E. Reconceptualizing Social Vulnerability in Brunswick, Georgia: Critical Physical Geography and the Future of Sea-Level Rise. Southeast. Geogr. 2021, 61, 357–380. [Google Scholar] [CrossRef]
- UNDRO. Natural Disasters and Vulnerability Analysis. Report of Expert Group Meeting; Office of the United Nations Disaster Relief Coordinator: New York, NY, USA, 1980. [Google Scholar]
- Timmerman, P. Vulnerability, resilience and the collapse of society. In A Review of Models and Possible Climatic Applications; Institute for Environmental Studies, University of Toronto: Toronto, ON, Canada, 1981. [Google Scholar]
- Maskrey, A. Community Based Hazard Mitigation. In Proceedings of the International Conference on Disaster Mitigation Program Implementation, Ocho Rios, Jamaica, 12–16 November 1983. [Google Scholar]
- Cardona, O.D. Enfoque Metodológico Para La Evaluación de La Amenaza, Vulnerabilidad y Riesgo Sísmico. In Memorias del Seminario Nacional Sobre Prevención y Manejo de Catástrofes Naturales; Asociación de Ingenieros Estructurales: Medellín, Columbia, 1986. [Google Scholar]
- Cardona, O.D. Proyecto Integral de Mitigación de Riesgo Sísmico Urbano. In VI Seminario Latinoamericano de Ingeniería Sismo-resistente; Universidad Autónoma Metropolitana: Ciudad de México, México, 1990. [Google Scholar]
- Liverman, D.M. Vulnerability to Global Environmental Change. In Understanding Global Environmental Change: The Contributions of Risk Analysis and Management; Kasperson, R.E., Dow, K., Golding, D., Eds.; Center for Technology, Environment, and Development, Clark University: Worcester, UK, 1990; pp. 27–44. [Google Scholar]
- Cannon, T. Vulnerability Analysis and The Explanation Of “Natural” Disasters. In Disasters, Development and Environment; John Wiley & Sons Ltd.: Hoboken, NJ, USA, 1994; Available online: https://www.researchgate.net/publication/248360551_Vulnerability_Analysis_and_The_Explanation_Of_%27Natural%27_Disasters (accessed on 3 November 2021).
- Cannon, T. Vulnerability Analysis, Livelihoods and Disasters. In RISK21—Coping with Risks Due to Nat. Hazards 21st Century; CRC Press: Boca Raton, FL, USA, 2006; pp. 41–49. [Google Scholar] [CrossRef]
- Blaikie, P.; Cannon, T.; David, I.; Wisner, B. Vulnerabilidad, El Entorno Social, Político y Económico de Los Desastres; Red de Estudios Sociales en Prevención de Desastres en América Latina: Puerto Limón, Costa Rica, 1996. [Google Scholar]
- UNISDR. Living with Risk: A Global Review of Disaster Reduction Initiatives; United Nations Publications: New York, NY, USA, 2004; Volume 1. [Google Scholar]
- UNISDR. Global Assessment Report on Disaster Risk Reduction (2009); United Nations Office for Disaster Risk Reduction: Geneva, Switzerland, 2009; ISBN 9789211320282. Available online: https://www.undrr.org/publication/global-assessment-report-disaster-risk-reduction-2009 (accessed on 6 November 2021).
- UNU-EHS. Expert Working Group on Measuring Vulnerability. Measuring Vulnerability to Natural Hazards; Birkmann, J., Ed.; United Nations University—Institute for Environment and Human Security: Bonn, Germany, 2013. [Google Scholar]
- Birkmann, J.; Wisner, B. Measuring the Unmeasurable: The Challenge of Vulnerability; United Nations University—Institute for Environment and Human Security: Bonn, Germany, 2006; Volume 5, Available online: http://www.ehs.unu.edu/file.php?id=212 (accessed on 5 November 2021).
- Birkmann, J.; Kienberger, S.; Alexander, D.E. Assessment of Vulnerability to Natural Hazards: A European Perspective; Elsevier Inc.: Amsterdam, The Netherlands, 2014. [Google Scholar] [CrossRef]
- Birkmann, J.; Jamshed, A.; McMillan, J.M.; Feldmeyer, D.; Totin, E.; Solecki, W.; Ibrahim, Z.Z.; Roberts, D.; Kerr, R.B.; Poertner, H.-O.; et al. Understanding Human Vulnerability to Climate Change: A Global Perspective on Index Validation for Adaptation Planning. Sci. Total Environ. 2022, 803, 150065. [Google Scholar] [CrossRef]
- Cutter, S.L.; Boruff, B.J.; Shirley, W.L. Social Vulnerability to Environmental Hazards. Soc. Sci. Q. 2003, 84, 242–261. [Google Scholar] [CrossRef]
- Cutter, S.L.; Finch, C. Temporal and Spatial Changes in Social Vulnerability to Natural Hazards. Proc. Natl. Acad. Sci. USA 2008, 105, 2301–2306. [Google Scholar] [CrossRef] [PubMed] [Green Version]
- Cardona, O.D.; Van Aalst, M.K.; Birkmann, J.; Fordham, M.; Mc Gregor, G.; Rosa, P.; Pulwarty, R.S.; Schipper, E.L.F.; Sinh, B.T.; Décamps, H.; et al. Determinants of Risk: Exposure and Vulnerability. Manag. Risks Extrem. Events Disasters to Adv. Clim. Chang. Adapt. Spec. Rep. Intergov. Panel Clim. Chang. 2012, 9781107025066, 65–108. [Google Scholar] [CrossRef] [Green Version]
- Alfieri, L.; Bisselink, B.; Dottori, F.; Naumann, G.; de Roo, A.; Salamon, P.; Wyser, K.; Feyen, L. Global Projections of River Flood Risk in a Warmer World. Earths Futur. 2017, 5, 171–182. [Google Scholar] [CrossRef]
- Lyu, H.-M.; Sun, W.-J.; Shen, S.-L.; Arulrajah, A. Flood Risk Assessment in Metro Systems of Mega-Cities Using a GIS-Based Modeling Approach. Sci. Total Environ. 2018, 626, 1012–1025. [Google Scholar] [CrossRef]
- O’Shea, T.E.; Lewin, J. Urban Flooding in Britain: An Approach to Comparing Ancient and Contemporary Flood Exposure. Nat. Hazards 2020, 104, 581–591. [Google Scholar] [CrossRef]
- Komolafe, A.A.; Awe, B.S.; Olorunfemi, I.E.; Oguntunde, P.G. Modelling Flood-Prone Area and Vulnerability Using Integration of Multi-Criteria Analysis and HAND Model in the Ogun River Basin, Nigeria. Hydrol. Sci. J. 2020, 65, 1766–1783. [Google Scholar] [CrossRef]
- Tate, E.; Rahman, M.A.; Emrich, C.T.; Sampson, C.C. Flood Exposure and Social Vulnerability in the United States. Nat. Hazards 2021, 106, 435–457. [Google Scholar] [CrossRef]
- Consejería de Obras Públicas y Transportes. Decreto 189/2002, de 2 de Julio, Por el que se Aprueba el Plan de Prevención de Avenidas e Inundaciones en Cauces Urbanos Andaluces. BOJA núm. 91 de 3 de Agosto de 2002. Available online: https://www.juntadeandalucia.es/boja/2002/91/5 (accessed on 11 November 2021).
- Generalitat Valenciana. Plan de Acción Territorial de carácter sectorial sobre prevención del Riesgo de Inundación en la Comunitat Valenciana. Acuerdo de 28 de enero de 2003, del Consell de la Generalitat, por el Que Se Aprueba Definitivamente el Plan de Acción Territorial de Carácter Sectorial Sobre Prevención del Riesgo de Inundación en la Comunidad Valenciana. 2003. DOGV num. 4429 de 30 January 2003. 2003. Available online: https://politicaterritorial.gva.es/es/web/planificacion-territorial-e-infraestructura-verde/patricova-plan-de-accion-territorial-de-caracter-sectorial-sobre-prevencion-del-riesgo-de-inundacion-en-la-comunitat-valenciana (accessed on 11 November 2021).
- Generalitat de Cataluña. Plan especial de emergencias por inundaciones de Cataluña (INUNCAT). Acuerdo GOV/14/2015, de 10 de febrero, por el que se aprueba la revisión del Plan especial de emergencias por inundaciones de Cataluña (INUNCAT). Available online: https://noticias.juridicas.com/base_datos/CCAA/ca-l4-1997.html (accessed on 11 November 2021).
- Región de Murcia. Plan de Ordenación Territorial del Litoral de la Región de Murcia. Decreto 57/2004, de 18 Junio, Aprueba las «Directrices y Plan de Ordenación Territorial del Litoral de la Región de Murcia». Consejería Turismo Y Ordenación Del Territorio BO. Región de Murcia 25 junio 2004, núm. 145, Pág. 14167. Available online: https://www.borm.es/services/anuncio/ano/2004/numero/8885/pdf?id=30026 (accessed on 11 November 2021).
- Gobierno de Castilla-La Mancha. Plan Especial de Protección Civil ante el Riesgo de Inundaciones de Castilla La Mancha (PRICAM). Decreto 36/2013, de 04/07/2013, por el que se Regula La Planificación De Emergencias en Castilla-La Mancha y se aprueba la revisión del Plan Territorial de Emergencia de Castilla-La Mancha. Available online: https://www.castillalamancha.es/sites/default/files/documentos/pdf/20150615/memoria_pricam_i_rev._2015.pdf (accessed on 11 November 2021).
- Perles, M.J.; Sortino, J.F.; Cantarero, F. Cartografía de la vulnerabilidad del territorio frente al riesgo de inundación. Propuesta adaptada a la Directiva europea de inundaciones y normativas derivadas. Bol. Asoc. Geógr. Esp. 2017, 75, 341–372. [Google Scholar] [CrossRef] [Green Version]
- Cova, T.J.; Church, R.L. Modelling Community Evacuation Vulnerability Using GIS. Int. J. Geogr. Inf. Sci. 1997, 11, 763–784. [Google Scholar] [CrossRef]
- Cova, T.J.; Johnson, J.P. Microsimulation of Neighborhood Evacuations in the Urban–Wildland Interface. Environ. Plan. 2002, 34, 2211–2229. [Google Scholar] [CrossRef]
- Cova, T.J. Public Safety in the Urban–Wildland Interface: Should Fire-Prone Communities Have a Maximum Occupancy? Nat. Hazards Rev. 2005, 6, 99–108. [Google Scholar] [CrossRef]
- Camia, A.; Varela, V.; Marzano, R.; Eftichidis, G. Spatial Analysis in European Wildland-Urban Interface Environments Using GIS. In Proceedings of the International Scientific Workshop on “Forest Fires in the Wildland-Urban Interface and Rural Areas in Europe: An Integral Planning and Management Challenge”, Athens, Greece, 15–16 May 2003; pp. 185–196. [Google Scholar]
- Beltrán, I.; Ruiz, E.; Sanchez, R.; Pascual, C. A Method to Classify W-UI Situations in Europe: Towards a Common Catalogue. In Proceedings of the International Scientific Workshop on “Forest Fires in the Wildland-Urban Interface and Rural Areas in Europe: An Integral Planning and Management Challenge”, Athens, Greece, 15–16 May 2003; pp. 55–66. [Google Scholar]
- Moraga Peralta, J.C. Forest Fire Risk Assessment in Tempisque River Basin, COSTA RICA. Rev. Geogr. Am. Cent. 2010, 45, 33–64. [Google Scholar]
- Caballero, D. Wildland-Urban Interface Management: A State of the Art. Document EVR1-CT-2002-40028 D-10-01. WARM Project. 2002. Available online: www.eufirelab.org (accessed on 13 November 2021).
- Xanthopoulos, G. Factors Affecting the Vulnerability of Houses to Wildland Fire in the Mediterranean Region. In Proceedings of the International Scientific Workshop on “Forest Fires in the Wildland-Urban Interface and Rural Areas in Europe: An Integral Planning and Management Challenge”, Athens, Greece, 15–16 May 2003; pp. 85–92. [Google Scholar]
- Michael-Leiba, M.; Scott, G.; Baynes, F.; Granger, K. Quantitative Landslide Risk Assessment of Cairns, Australia. In Geotechnical Engineering Meeting Society’s Needs, Proceedings, of the Fourteenth Southeast Asian Geotechnical Conference, Hong Kong, 10–14 December 2001; CRC Press: Boca Raton, FL, USA, 2001; Volumes 1 and 2, pp. 149–154. [Google Scholar]
- Michael-Leiba, M.; Baynes, F.; Scott, G.; Granger, K. Regional Landslide Risk to the Cairns Community. Nat. Hazards 2003, 30, 233–249. [Google Scholar] [CrossRef]
- Lu, Q.C.; Zhang, J.; Peng, Z.R.; Rahman, A.S. Inter-city travel behaviour adaptation to extreme weather events. J. Transp. Geogr. 2014, 41, 148–153. [Google Scholar] [CrossRef]
- Thouret, J.-C.; Enjolras, G.; Martelli, K.; Santoni, O.; Luque, J.A.; Nagata, M.; Arguedas, A.; Macedo, L. Combining Criteria for Delineating Lahar- and Flash-Flood-Prone Hazard and Risk Zones for the City of Arequipa, Peru. Nat. Hazards Earth Syst. Sci. 2013, 13, 339–360. [Google Scholar] [CrossRef]
- Fujiki, K.; Laleau, M. A geographic approach for spatializing emergency sheltering needs in a crisis situation—Case study of a massive evacuation triggered by a major Seine flood in Ile-de-France region. Houille Blanche Rev. Int. De L’eau 2019, 3–4, 75–83. [Google Scholar] [CrossRef] [Green Version]
- Othman, M.H.; Hamid, A.H.A. Impact of Flooding on Traffic Route Choices. SHS Web Conf. 2014, 11, 01002. [Google Scholar] [CrossRef] [Green Version]
- He, Y.; Ma, D.; Xiong, J.; Cheng, W.; Jia, H.; Wang, N.; Guo, L.; Duan, Y.; Liu, J.; Yang, G. Flash flood vulnerability assessment of roads in China based on support vector machine. Geocarto Int. 2021, 1–24. [Google Scholar] [CrossRef]
- Kim, D.; Park, S.; Go, J.; Yeom, C. A Study of Safety Evaluation Based on the Road closure Simulation, and on the Isolation Risk in Times of Disaster. J. Korean Soc. Saf. 2020, 35, 84–93. [Google Scholar]
- Versini, P.-A.; Gaume, E.; Andrieu, H. Application of a Distributed Hydrological Model to the Design of a Road Inundation Warning System for Flash Flood Prone Areas. Nat. Hazards Earth Syst. Sci. 2010, 10, 805–817. [Google Scholar] [CrossRef]
- Qiao, Y.; Medina, R.A.; McCarthy, L.M.; Mallick, R.B.; Daniel, J.S. Decision Tree for Postflooding Roadway Operations. Transp. Res. Rec. 2017, 2604, 120–130. [Google Scholar] [CrossRef]
- Pyatkova, K.; Chen, A.S.; Butler, D.; Djordjevic, S. Modelling Road Transport Congestion Due to Flooding. In New Trends in Urban Drainage Modelling, Proceedings of the UDM 2018, Palermo, Italy, 23–26 September 2018; Springer: Berlin/Heidelberg, Germany, 2019; pp. 517–521. [Google Scholar] [CrossRef]
- Hien, H.M.; Trung, T.N.; Looijen, W.; Hulsbergen, K. Flood vulnerability analysis and mapping in Vietnam. In Geo-Information for Disaster Management; Springer: Berlin/Heidelberg, Germany, 2005; pp. 67–83. [Google Scholar]
- Aragón-Durand, F. Urbanisation and flood vulnerability in the peri-urban interface of Mexico City. Disasters 2007, 31, 477–494. [Google Scholar] [CrossRef] [PubMed]
- Aroca-Jiménez, E.; Bodoque, J.M.; Antonio García, J.; Díez-Herrero, A. Construction of an integrated social vulnerability index in urban areas prone to flash flooding. Nat. Hazards Earth Syst. Sci. 2017, 17, 1541–1557. [Google Scholar] [CrossRef] [Green Version]
- Camarasa, A.M.; López-García, M.J.; Soriano, J. Cartografía de Vulnerabilidad Frente a Inundaciones En Llanos Mediterráneos. Caso de Estudio Del Barranc de Carraixet y Rambla de Poyo. Ser. Geográfica 2008, 14, 75–91. [Google Scholar]
- Joyce, J.M.; Scott, M.S.; Cooperative, E.S.R.G. An Assessment of Maryland’s Vulnerability to Flood Damage; Maryland Department of the Environment: Baltimore, MD, USA, 2005. [Google Scholar]
- Castañeda, S.; Guardado, R. Análisis de la vulnerabilidad en áreas de inundación del territorio de Sagua de Tánamo, provincia de Holguín, Cuba. Mapping. 2008, 127, pp. 16–18. Available online: http://www.mappinginteractivo.com/plantilla-ante.asp?id_articulo=1334 (accessed on 4 November 2021).
- García Concha, A.; Domínguez Sánchez, C.; Sánchez Quispe, S.T.; Huape Aguilar, J.M. Aplicación de una Metodología Para la Obtención de Mapas de Inundación en El Caso de Salamanca, Guanajuato, México. In Actas del XXII Congreso Nacional de Hidráulica Acapulco; Academia.edu: Chilpancingo, Guerrero, México, 2012. [Google Scholar]
- Ávila García, P.; Pérez Monroy, A. Pobreza Urbana y Vulnerabilidad en la Ciudad de Morelia. In Urbanización, Sociedad y Ambiente. Experiencias en Ciudades Medias; Vieyra, A., Larrazabal., A., Eds.; Centro de Investigaciones en Geografía Ambiental (CIGA) e Instituto Nacional de Ecología y Cambio Climático: Morelia, Mexic, 2014; p. 293. [Google Scholar]
- Eakin, H.; Luers, A.L. Assessing the vulnerability of social-environmental systems. Annu. Rev. Environ. Resour. 2006, 31, 365–394. [Google Scholar] [CrossRef] [Green Version]
- Martínez, F. Plataforma Informática Para la Coordinación de Equipos de Evaluación de Vulnerabilidad y Daños en Grandes Emergencias. In Proceedings of the XIV Jornadas Internacionales de la Universidad Málaga Sobre Seguridad, Emergencias y Catástrofes, Málaga, Spain, 28–30 October 2020. [Google Scholar]
Figure 1.
Location of the study area. The map on the left shows, in blue, the potentially flooded surface of the Campanillas River as it passes through the study area.
Figure 1.
Location of the study area. The map on the left shows, in blue, the potentially flooded surface of the Campanillas River as it passes through the study area.
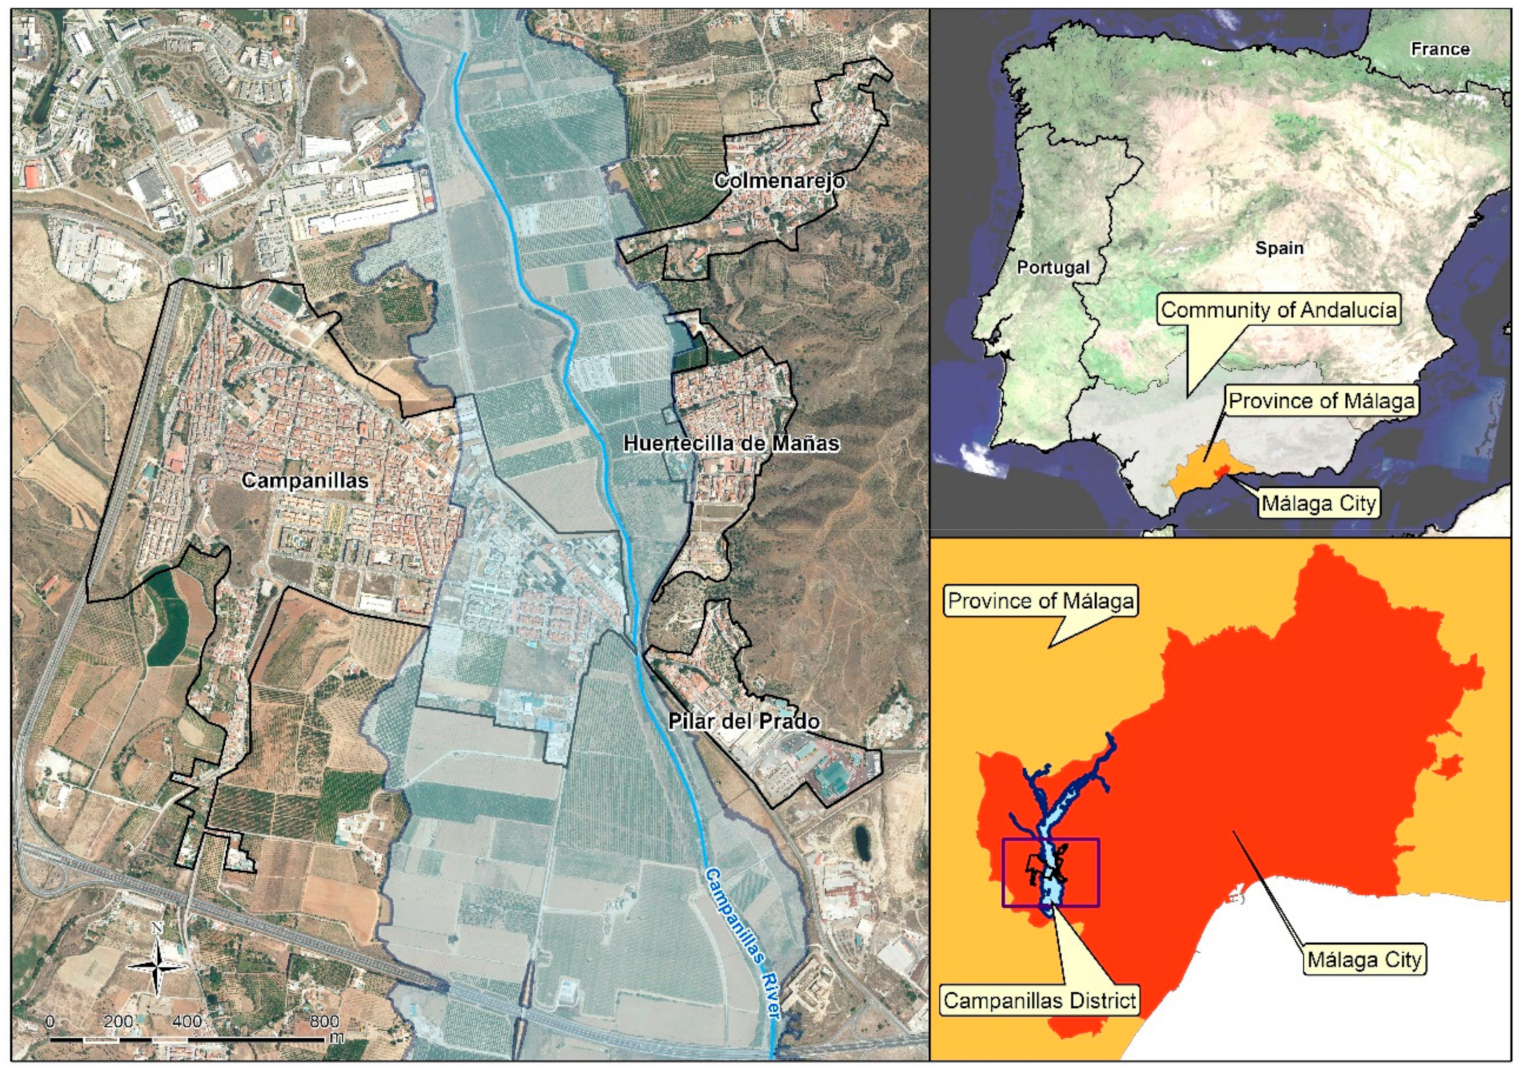
Figure 2.
Flow chart of the methodology followed for the map entitled “Population likely to be isolated inside and outside the flooded area according to its isolation level”.
Figure 2.
Flow chart of the methodology followed for the map entitled “Population likely to be isolated inside and outside the flooded area according to its isolation level”.
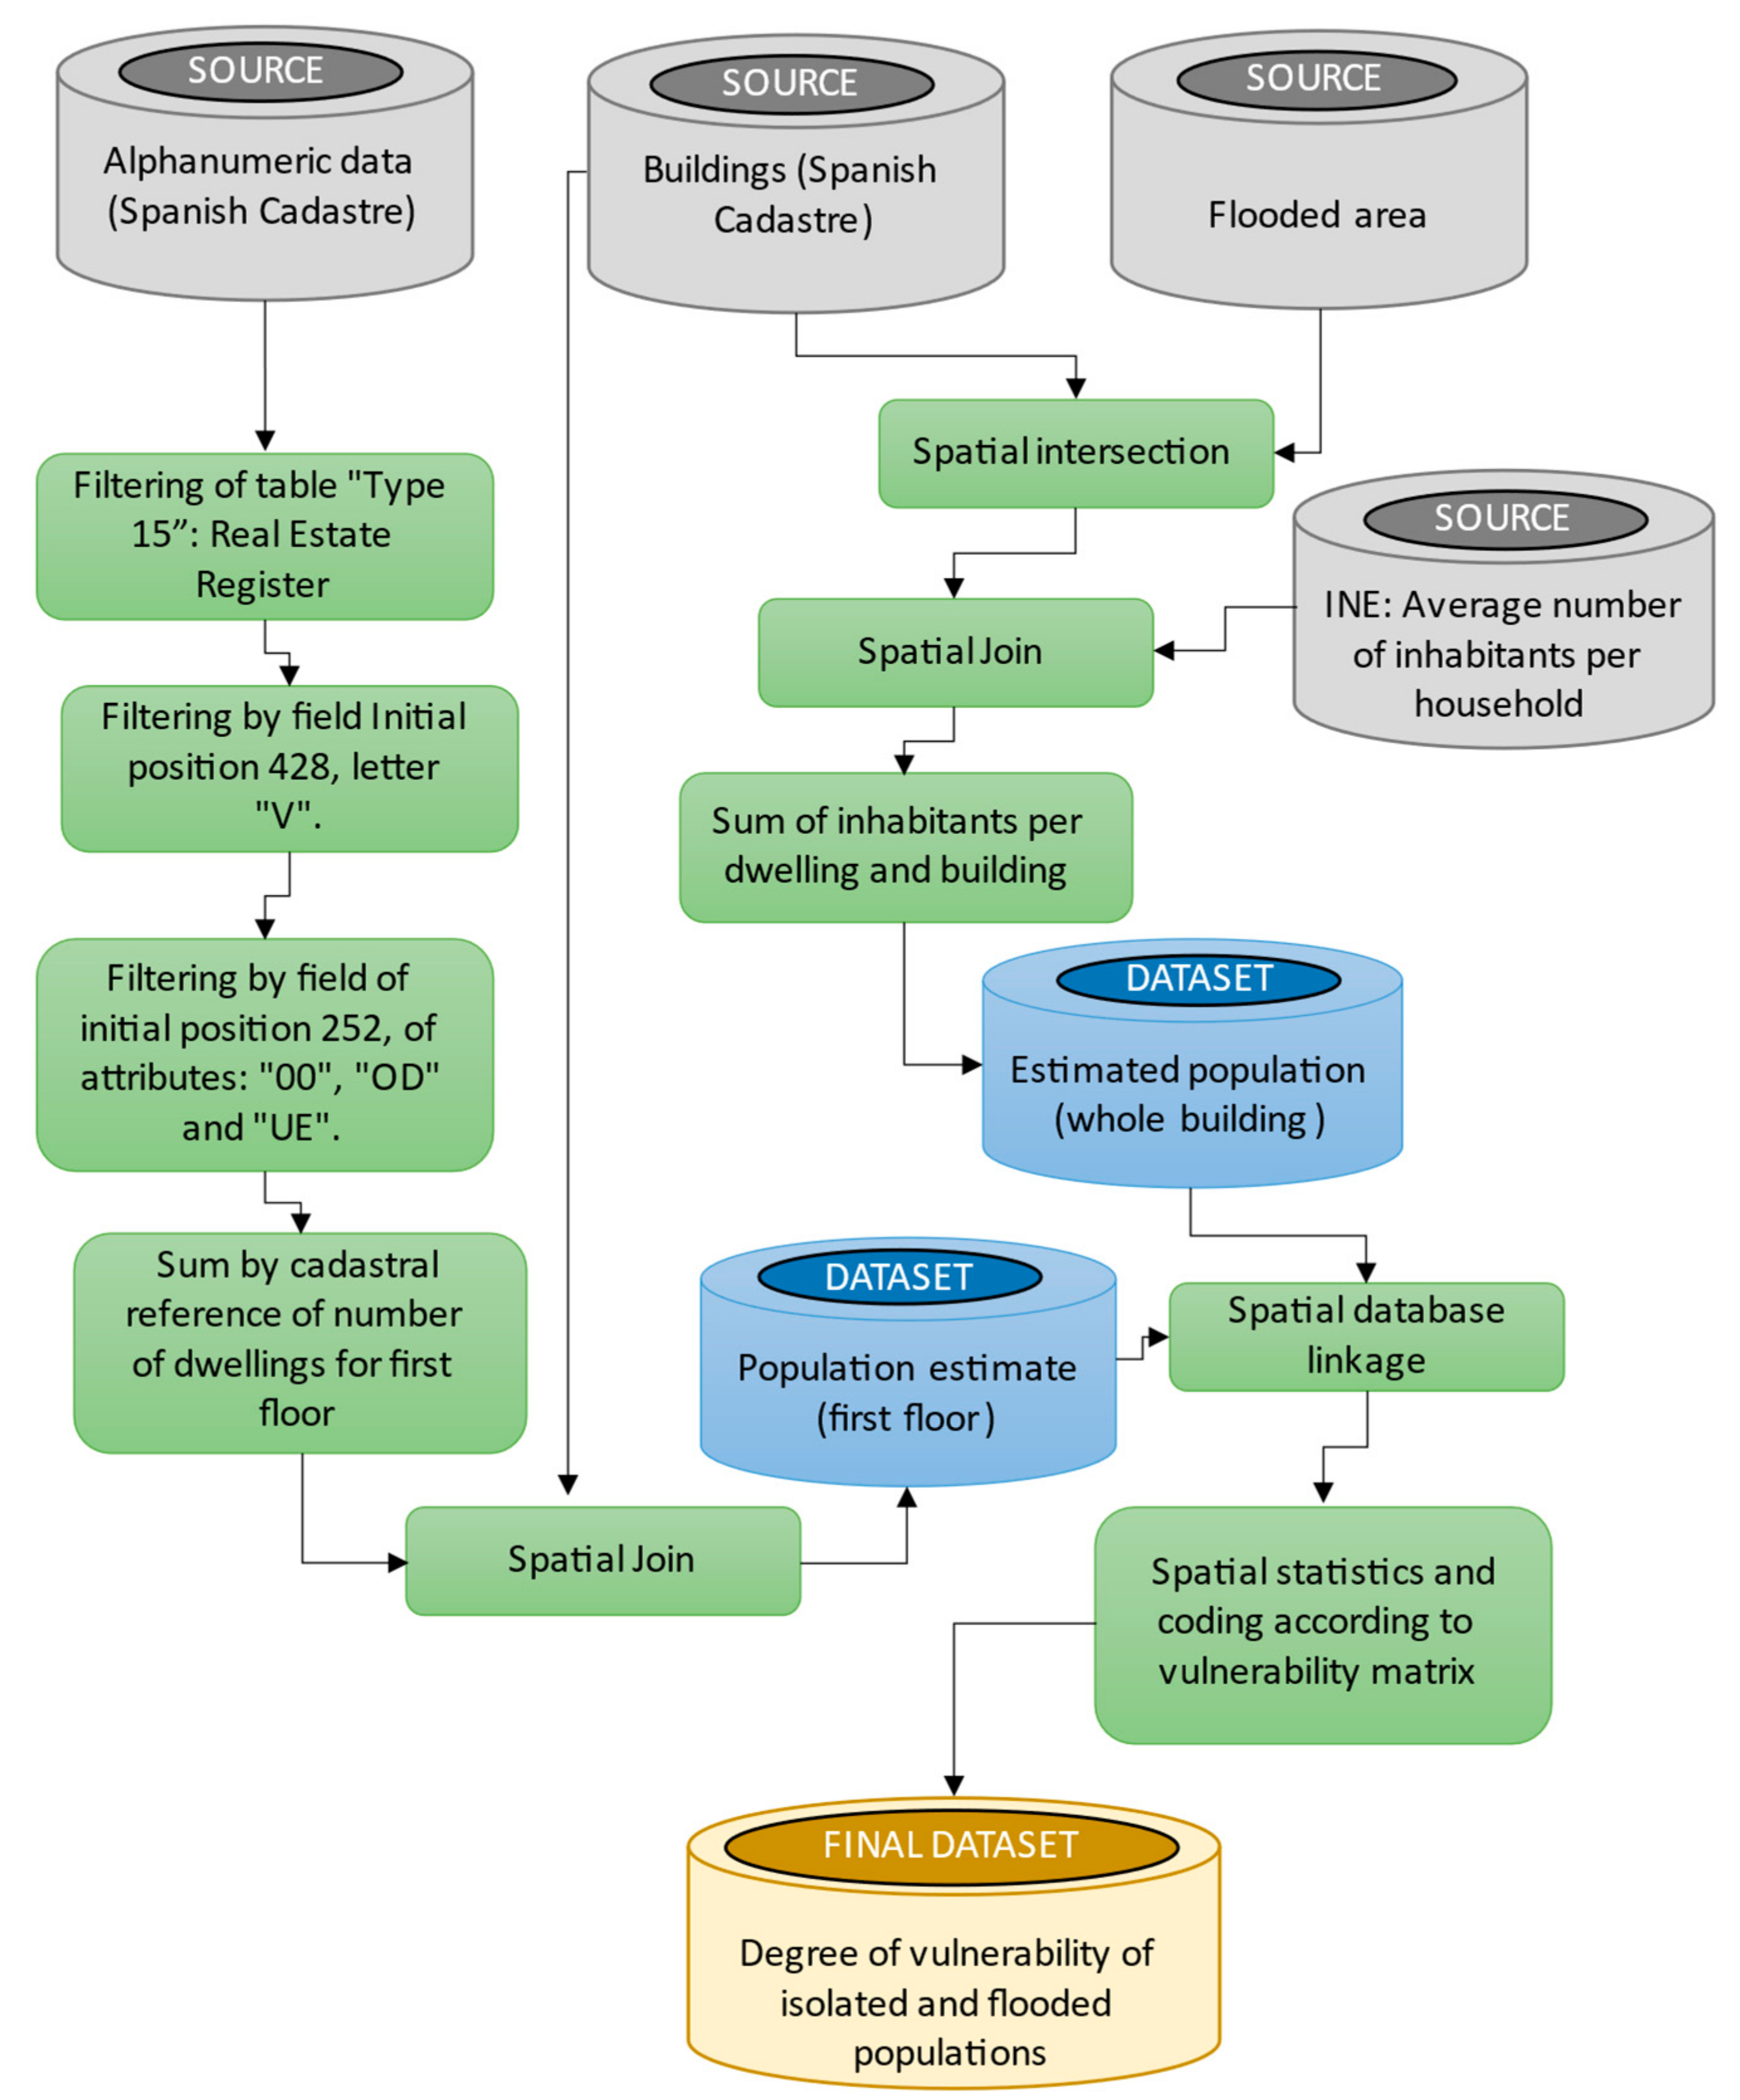
Figure 3.
Flow chart of the methodology developed for the map entitled “Population outside the flooded area that may be isolated by cuts in access roads, according to its degree of isolation”.
Figure 3.
Flow chart of the methodology developed for the map entitled “Population outside the flooded area that may be isolated by cuts in access roads, according to its degree of isolation”.
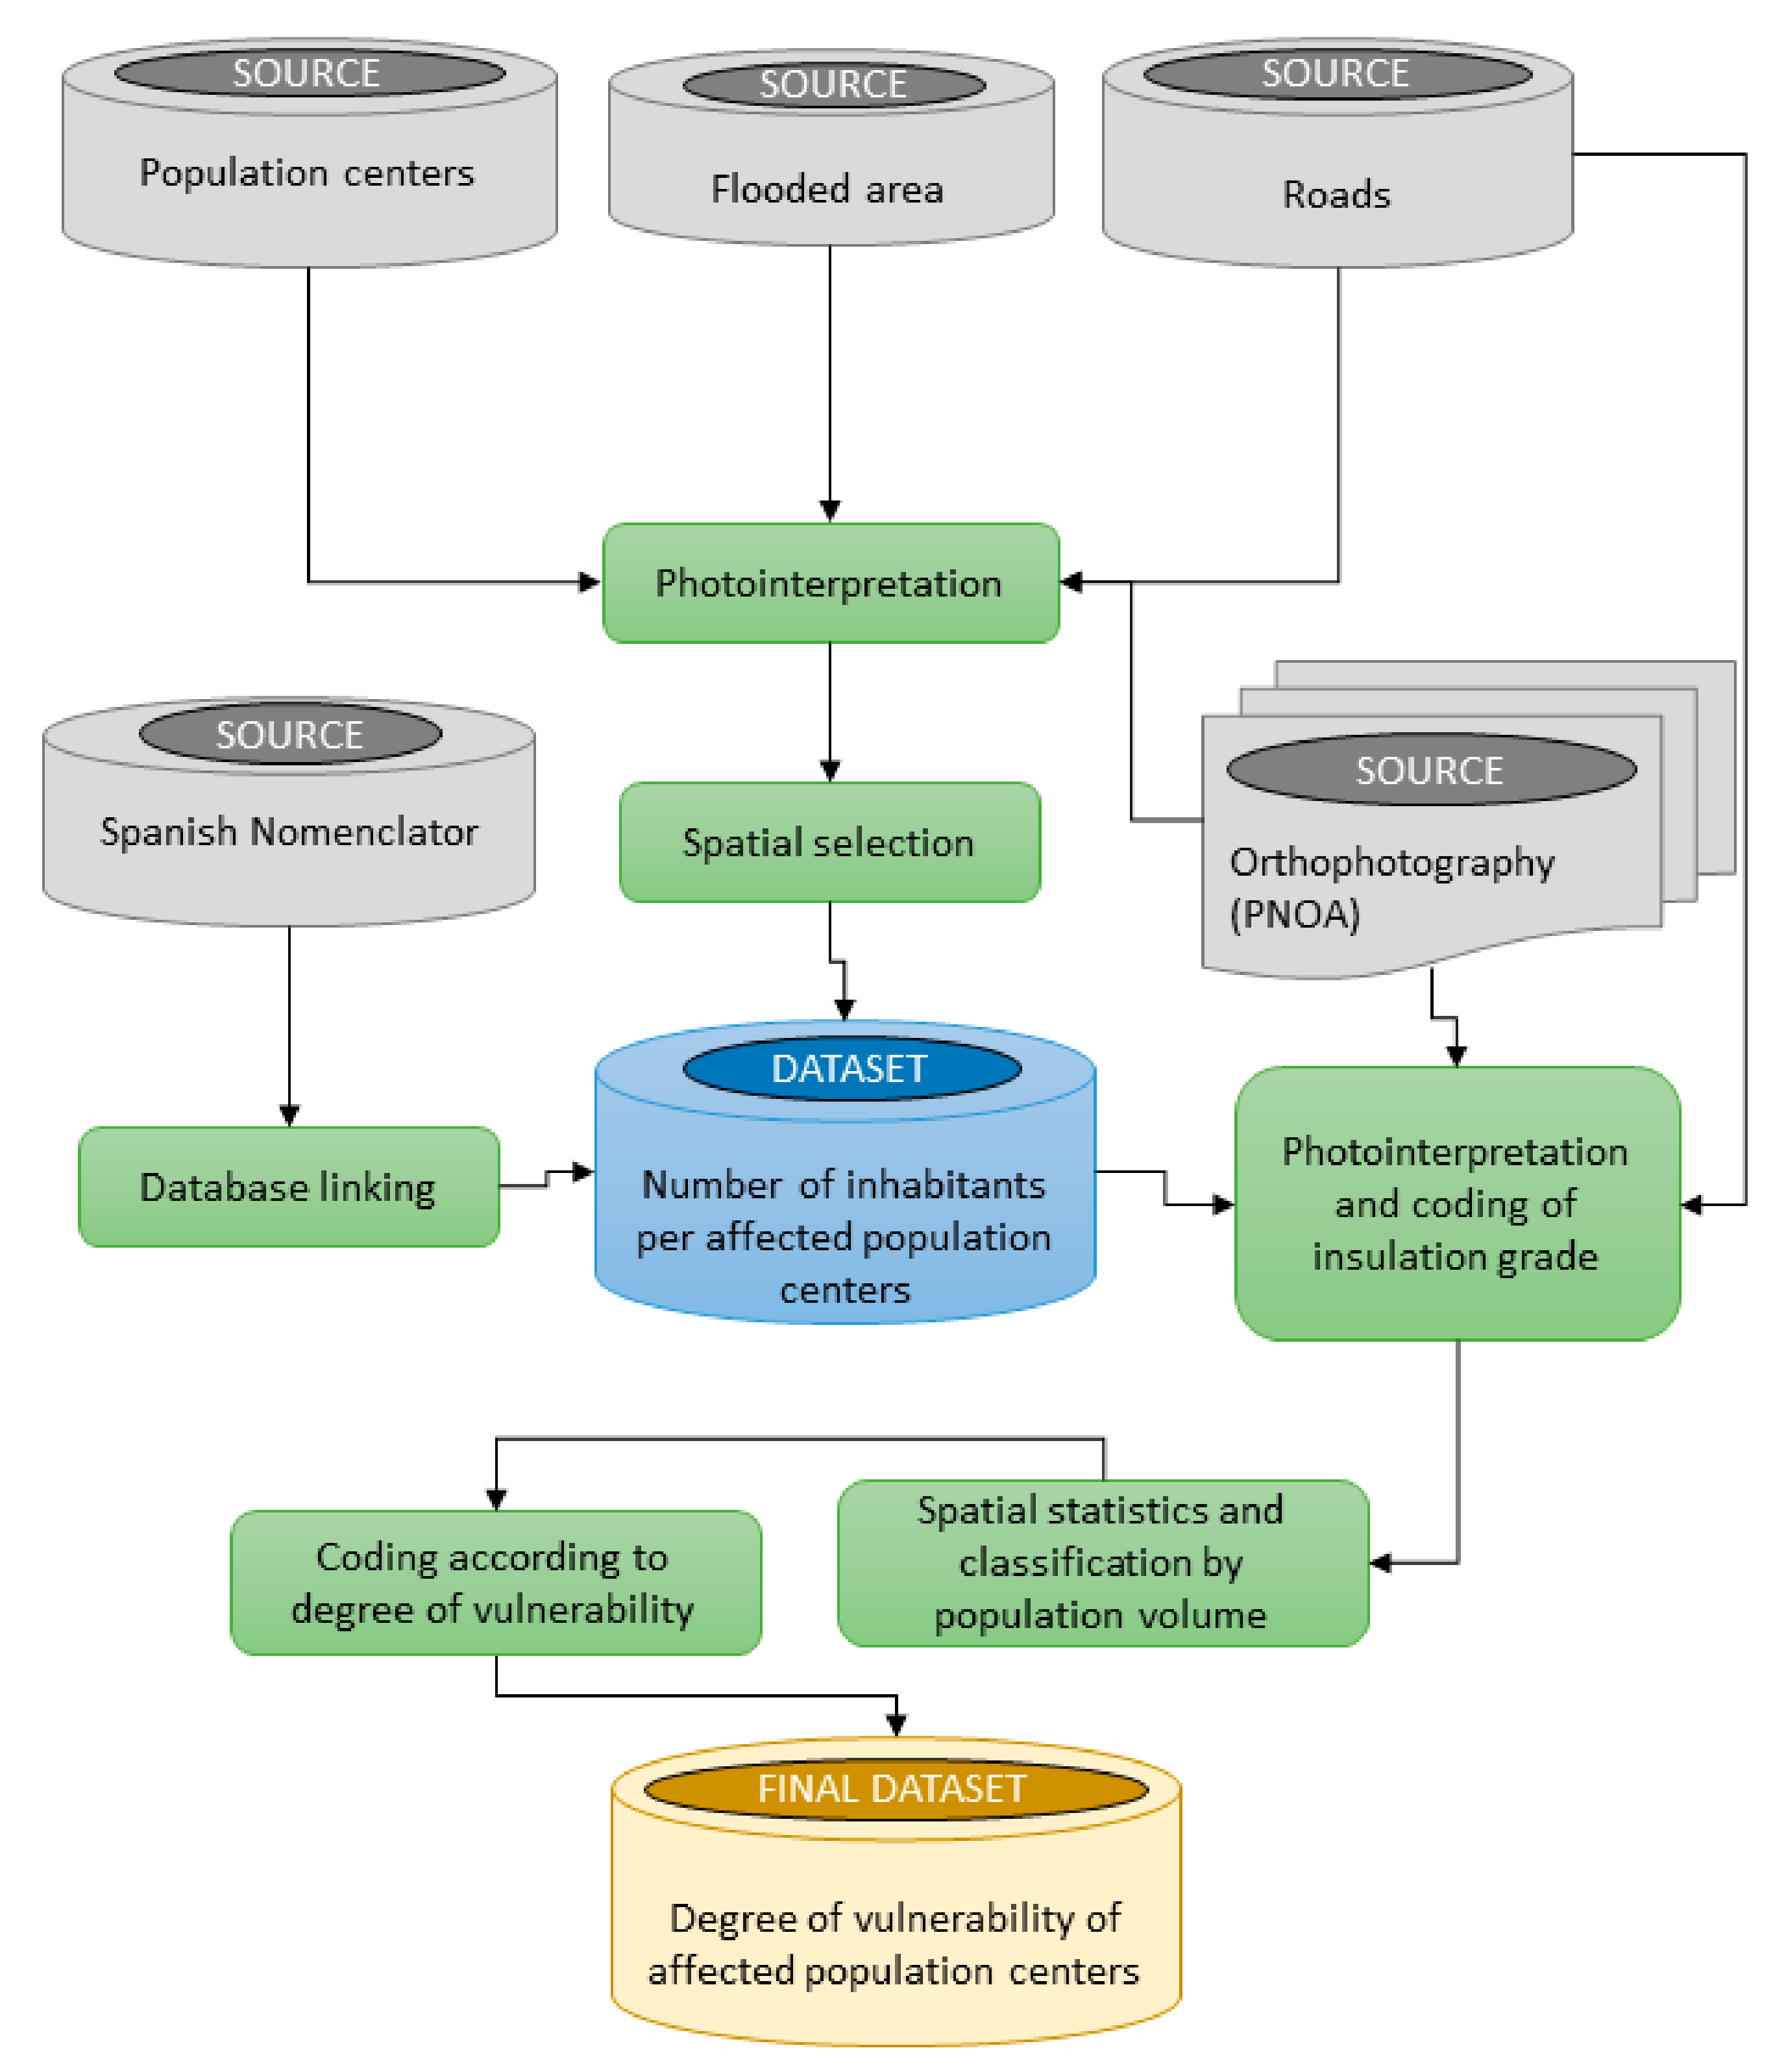
Figure 4.
Flow chart of the methodology developed for the map entitled “Main workplaces with concentrations of population likely to be isolated (industrial, services) according to their degree of isolation”.
Figure 4.
Flow chart of the methodology developed for the map entitled “Main workplaces with concentrations of population likely to be isolated (industrial, services) according to their degree of isolation”.
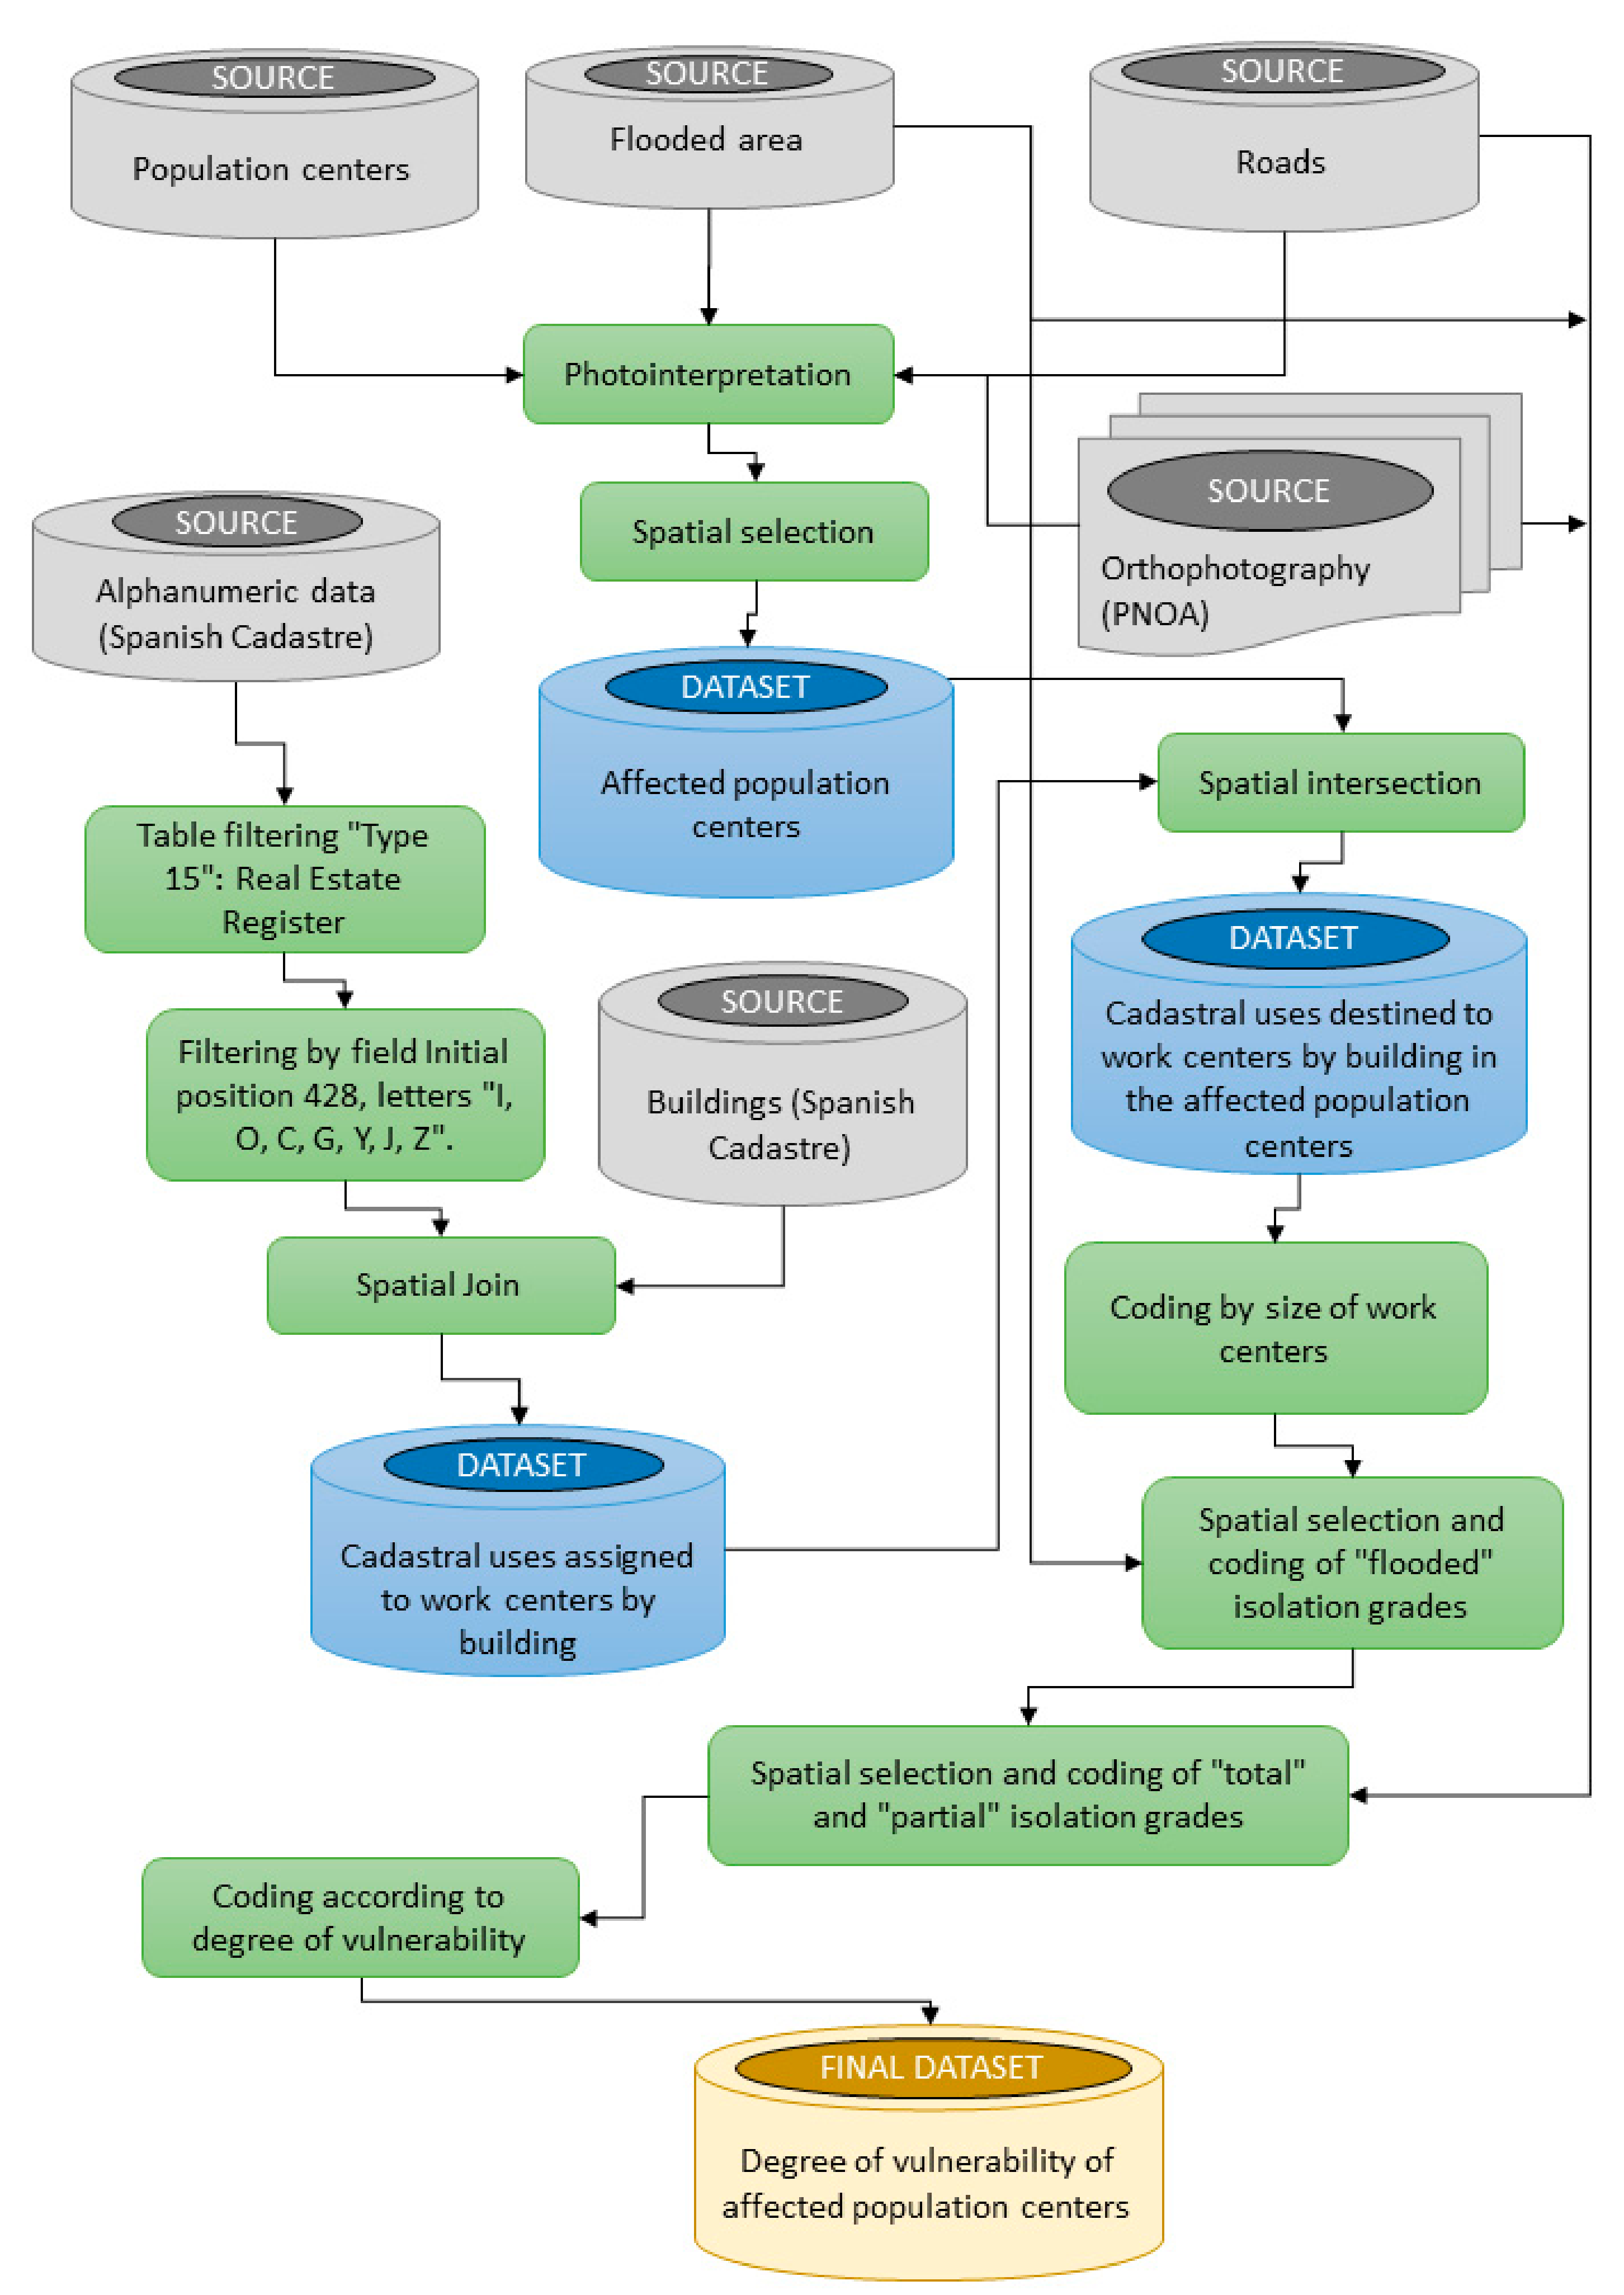
Figure 5.
Diagnostic map of the population likely to be isolated within the flood area. Boxes A and B indicate zooms that are developed below.
Figure 5.
Diagnostic map of the population likely to be isolated within the flood area. Boxes A and B indicate zooms that are developed below.
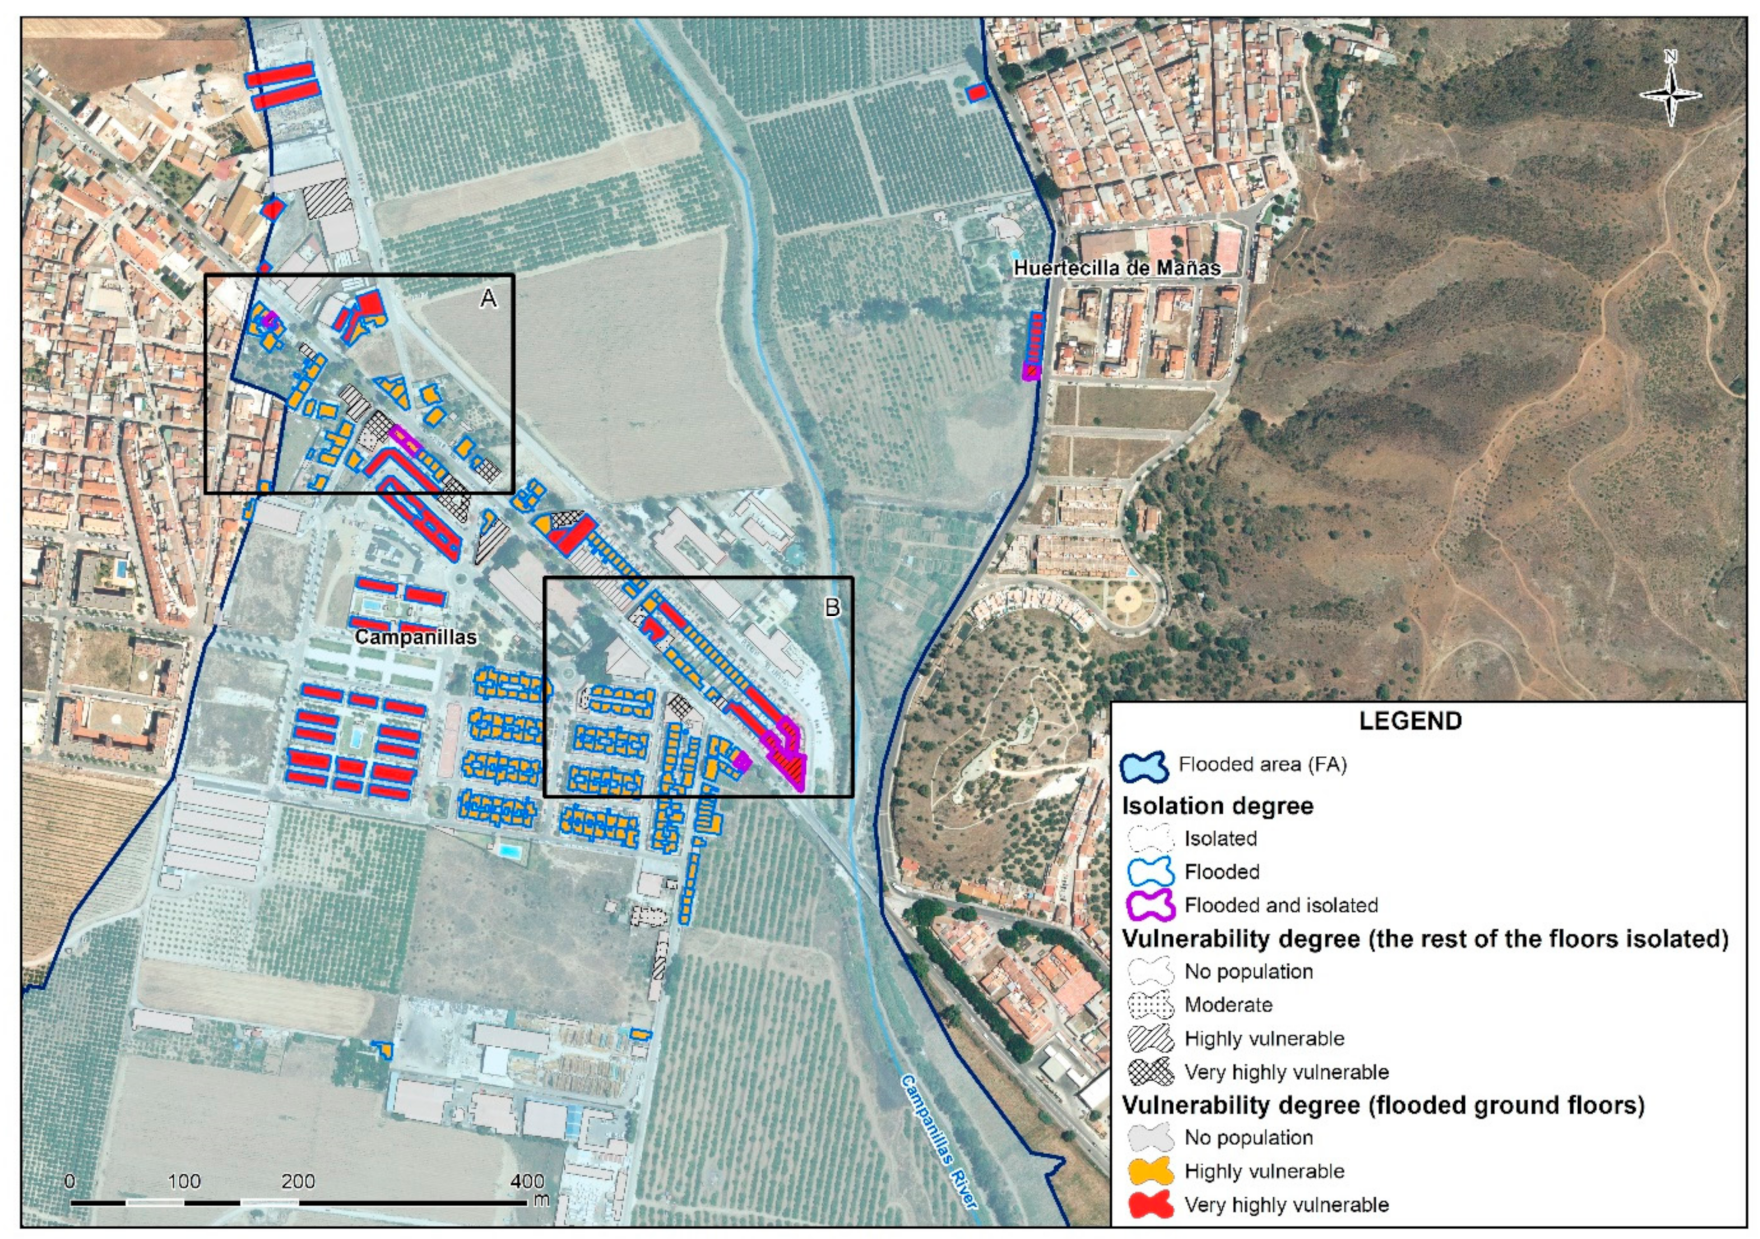
Figure 6.
Zoom A on the diagnostic map of the population with the possibility of being isolated within the flooded area.
Figure 6.
Zoom A on the diagnostic map of the population with the possibility of being isolated within the flooded area.
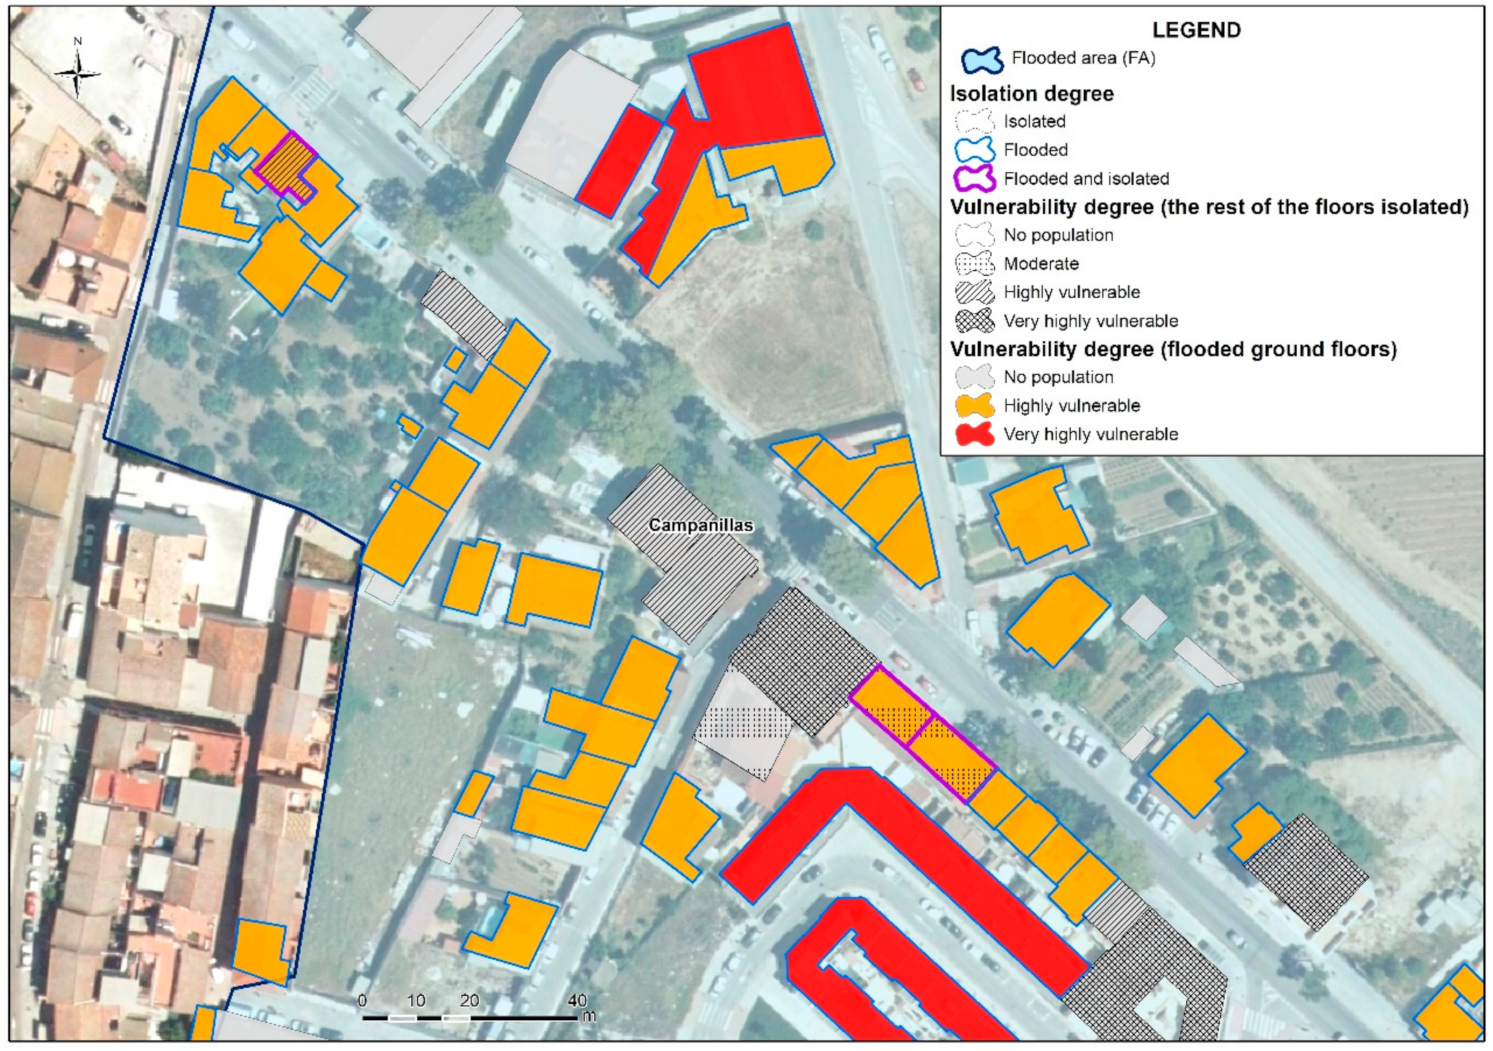
Figure 7.
Zoom B on the diagnostic map of the population with the possibility of being isolated within the flooded area.
Figure 7.
Zoom B on the diagnostic map of the population with the possibility of being isolated within the flooded area.
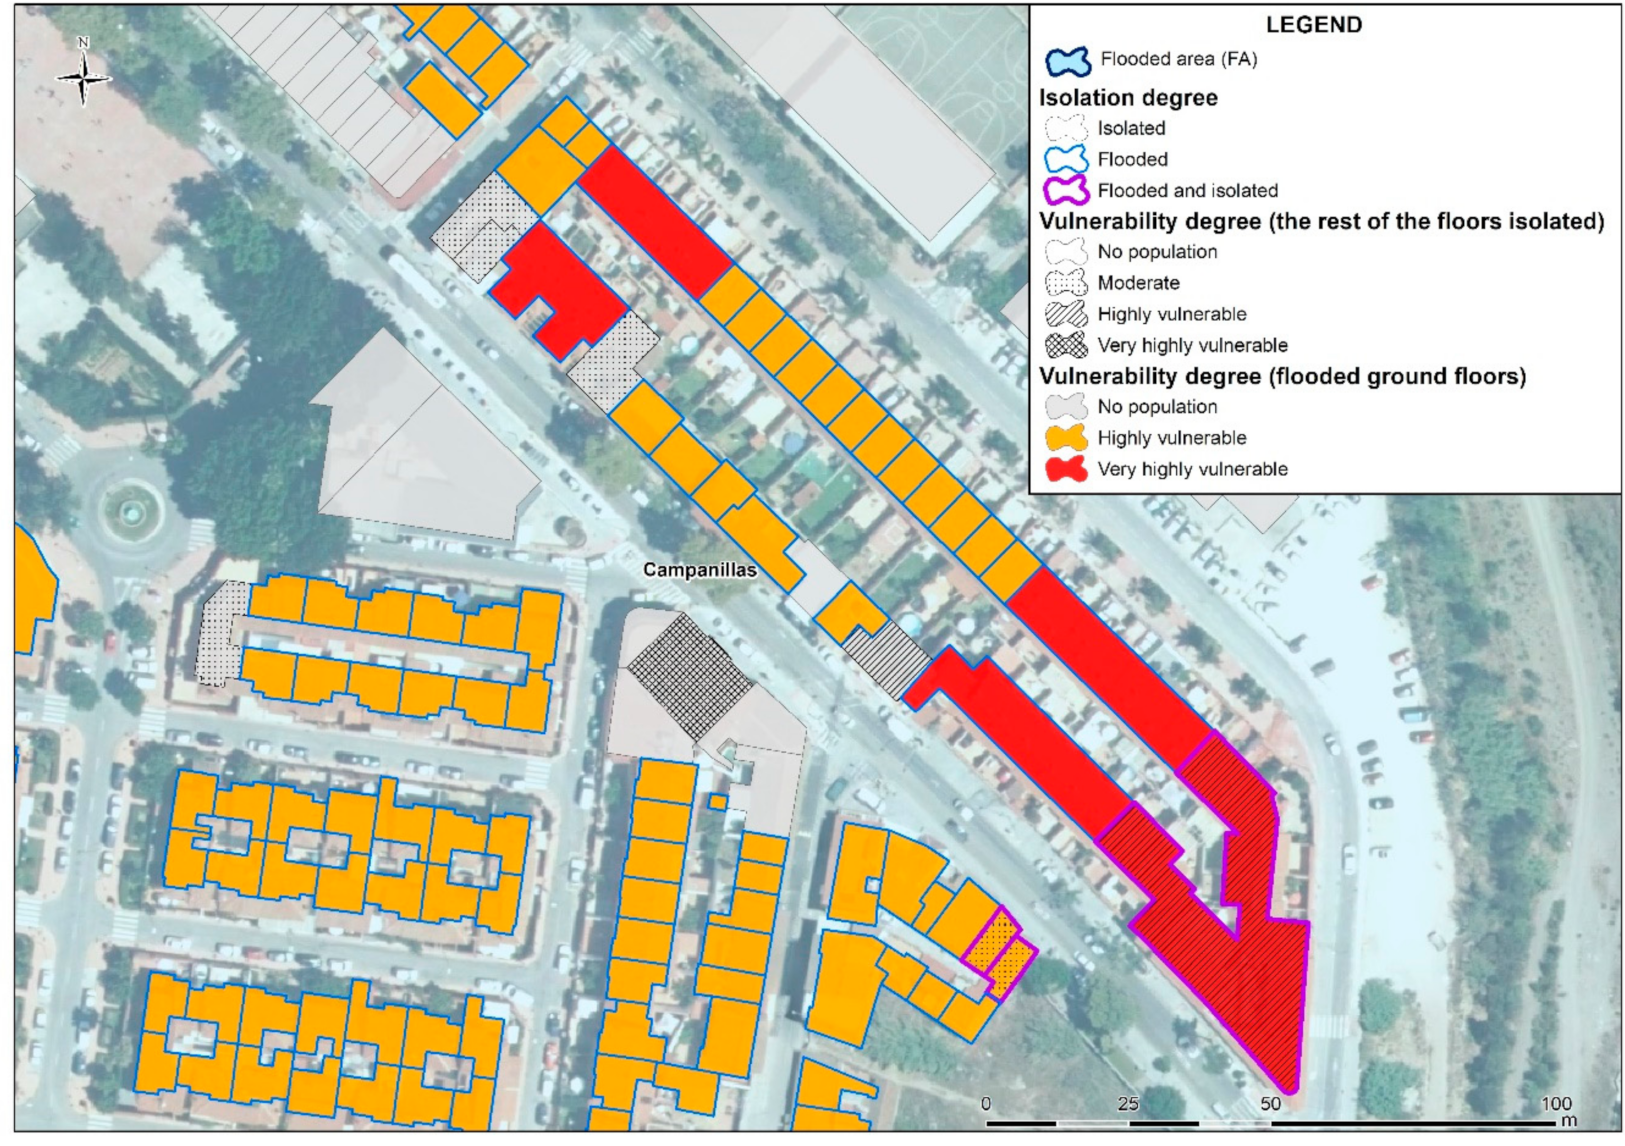
Figure 8.
Diagnostic map of the population likely to be isolated by cuts of roads outside the flooded area.
Figure 8.
Diagnostic map of the population likely to be isolated by cuts of roads outside the flooded area.
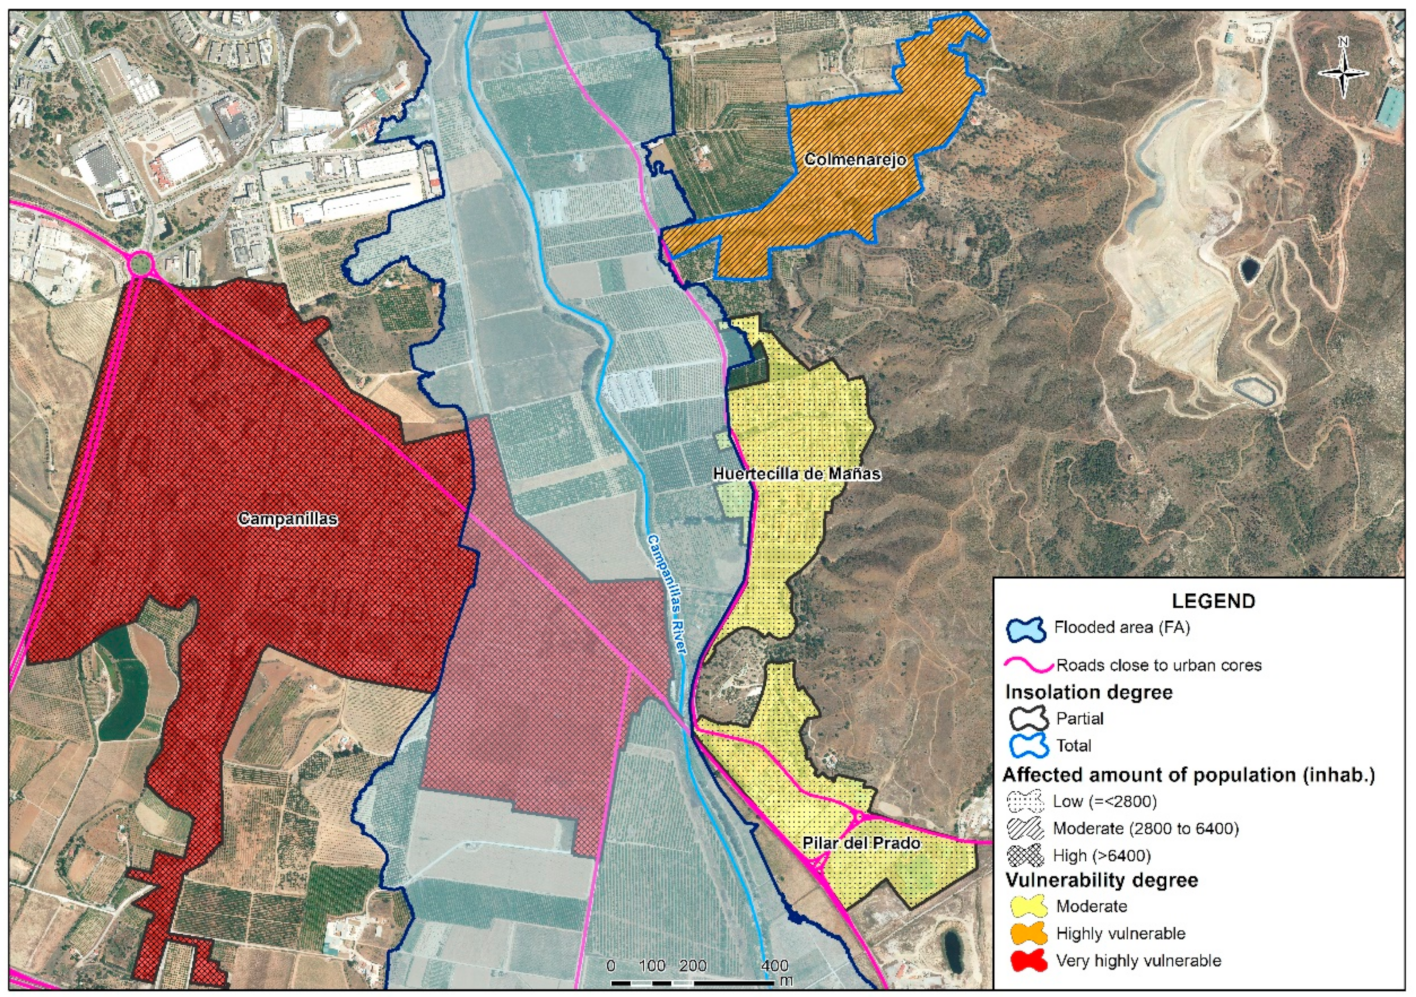
Figure 9.
Diagnostic map of the main workplaces with population concentrations likely to be isolated. Boxes A and B indicate zooms that are developed below.
Figure 9.
Diagnostic map of the main workplaces with population concentrations likely to be isolated. Boxes A and B indicate zooms that are developed below.
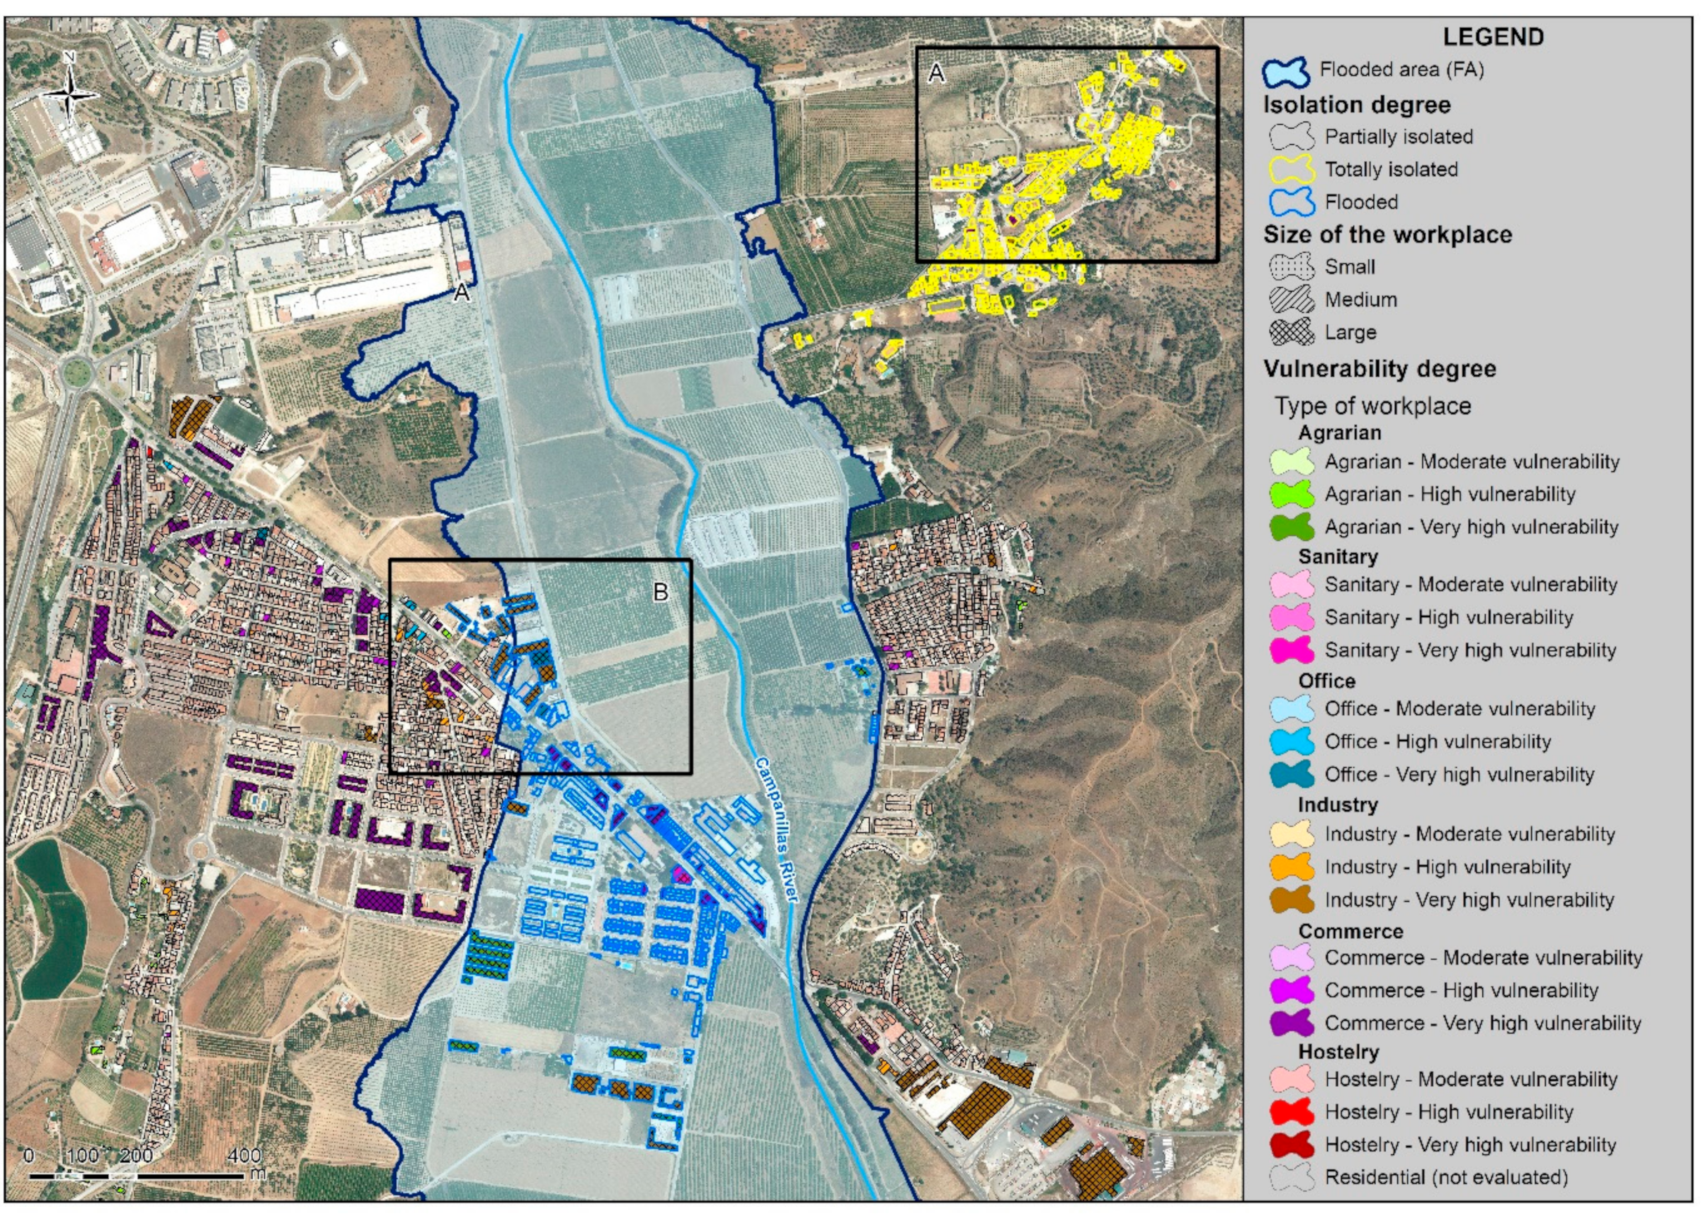
Figure 10.
Zoom A on the diagnostic map of the main workplaces with population concentrations likely to be isolated.
Figure 10.
Zoom A on the diagnostic map of the main workplaces with population concentrations likely to be isolated.

Figure 11.
Zoom B on the diagnostic map of the main workplaces with population concentrations likely to be isolated.
Figure 11.
Zoom B on the diagnostic map of the main workplaces with population concentrations likely to be isolated.

Table 1.
Proposal of the main issues to be addressed in the characterization of the vulnerability of people and goods to floods. Source: own creation from Perles, Sortino and Cantarero 2017.
Table 1.
Proposal of the main issues to be addressed in the characterization of the vulnerability of people and goods to floods. Source: own creation from Perles, Sortino and Cantarero 2017.
| Maps | Issues |
|---|---|
| Maps focus on solving issues related to vulnerability against hazard | Disruption of basic territorial services |
| Isolation of the population | |
| Relief and assistance challenges | |
| Risky or unsafe behavior of the population Information needs | |
| Effects on particularly sensitive goods or sectors of the territory | |
| Contamination and other flood-related hazards affecting parts of the territory | |
| Maps based on solving issues related to vulnerability, loss and recovery capacity | High replacement cost of property loss |
| Specific challenges for post-impact recovery |
Table 2.
Potentially flooded surface areas of the population centers analyzed.
| Population Unit | Urban Area (ha) | Flooded Area (ha) | Flooded Area (%) |
|---|---|---|---|
| Campanillas | 118.5 | 33.50 | 28.3 |
| Colmenarejo | 17.8 | 0.01 | 0.05 |
| Huertecilla de Mañas | 16.8 | 1.17 | 6.97 |
| Pilar del Prado | 14.9 | 0.00 | 0 |
Table 3.
Census sections involved.
| Census Section Code | Average Household Size by Census Section |
|---|---|
| 2906708064 | 1.52 inhab/home |
| 2906708064 | 2.71 inhab/home |
Table 4.
Threshold considered to establish the degree of vulnerability.
| Criteria for the Classification of Affected Population | Degree of Population Affected |
|---|---|
| Mean − 1 standard deviation | Low |
| Mean + 1 standard deviation | Moderate |
| Mean + 2 standard deviation | High |
Table 5.
Vulnerability degree.
| Estimation of the Population Affected per Building | ||||
|---|---|---|---|---|
| Low | Medium | High | ||
| High vulnerability | Very high vulnerability | Very high vulnerability | Flooded in situ | Degree of isolation |
| Moderate vulnerability | High vulnerability | Very high vulnerability | Isolated | |
Table 6.
Urban cores per population unit.
| Province | Municipality | Population Unit | Total Population |
|---|---|---|---|
| 29 Málaga | 067 Málaga | 000101 Campanillas | 7303 |
| 29 Málaga | 067 Málaga | 000103 Colmenarejo | 760 |
| 29 Málaga | 067 Málaga | 000104 Huertecilla de Mañas | 1587 |
| 29 Málaga | 067 Málaga | 000105 Pilar del Prado | 398 |
Table 7.
Delimitation of thresholds to establish the degree of vulnerability.
| Criteria for the Classification of Urban Cores | Categorization of Urban Cores According to Their Population Size |
|---|---|
| Mean − 1 standard deviation | Low |
| Mean + 1 standard deviation | Moderate |
| Mean + 2 standard deviation | High |
Table 8.
Degree of vulnerability.
| Gradation of Affected Population | ||||
|---|---|---|---|---|
| Low | Medium | High | ||
| High vulnerability | Very high vulnerability | Very high vulnerability | Totally isolated | Degree of isolation |
| Moderate vulnerability | High vulnerability | Very high vulnerability | Partially isolated | |
Table 9.
Classification of land uses in buildings.
| Code | Use |
|---|---|
| A | Warehouse—Parking |
| V | Residential |
| I | Industrial |
| O | Offices |
| C | Commercial |
| K | Sporting |
| T | Performing arts |
| G | Leisure and hospitality |
| Y | Health and wellness |
| E | Cultural |
| R | Religious |
| M | Urbanization and landscaping works, undeveloped land |
| P | Singular building |
| B | Farm warehouse |
| J | Agrarian industrial |
| Z | Agrarian |
The land uses considered in the analysis are highlighted in orange.
Table 10.
Degree of vulnerability.
| Size of the Workplace | ||||
|---|---|---|---|---|
| Small | Medium | Large | ||
| Very high vulnerability | Very high vulnerability | Very high vulnerability | Flooded in situ | Degree of isolation |
| High vulnerability | Very high vulnerability | Very high vulnerability | Totally isolated | |
| Moderate vulnerability | High vulnerability | Very high vulnerability | Partially isolated | |
Table 11.
Classification thresholds according to the size of the population affected by building.
| Mean (±) Standard Deviation | Classification Thresholds | Number of Population Affected |
|---|---|---|
| Mean (2.5 inhab./building) −1 standard deviation (3.5 inhab./building) | ≤2.5 inhab./building | Low |
| Mean (2.5 inhab./building) +1 standard deviation (3.5 inhab./building) | 2.5–6 inhab./building | Moderate |
| Mean (2.5 inhab./building) +2 standard deviation (7 inhab./building) | >6 inhab./building | High |
Table 12.
Categorization of urban cores according to their total population.
| Criteria for the Classification of Urban Cores | Categorization of Urban Cores According to Population Size |
|---|---|
| Mean (2800) − 1 standard deviation (3600) ≤ 2800 inhab. | Low |
| Mean (2800) + 1 standard deviation (3600) = 2800 to 6400 inhab. | Moderate |
| Mean (2800) + 2 standard deviation (7200) ≥ 6400 inhab. | High |
Publisher’s Note: MDPI stays neutral with regard to jurisdictional claims in published maps and institutional affiliations. |
© 2022 by the authors. Licensee MDPI, Basel, Switzerland. This article is an open access article distributed under the terms and conditions of the Creative Commons Attribution (CC BY) license (https://creativecommons.org/licenses/by/4.0/).
Share and Cite
MDPI and ACS Style
Sortino Barrionuevo, J.F.; Castro Noblejas, H.; Cantarero Prados, F.J. Vulnerability to Flood Risk: A Methodological Proposal for Assessing the Isolation of the Population. Land 2022, 11, 277. https://doi.org/10.3390/land11020277
AMA Style
Sortino Barrionuevo JF, Castro Noblejas H, Cantarero Prados FJ. Vulnerability to Flood Risk: A Methodological Proposal for Assessing the Isolation of the Population. Land. 2022; 11(2):277. https://doi.org/10.3390/land11020277
Chicago/Turabian StyleSortino Barrionuevo, Juan Francisco, Hugo Castro Noblejas, and Francisco José Cantarero Prados. 2022. "Vulnerability to Flood Risk: A Methodological Proposal for Assessing the Isolation of the Population" Land 11, no. 2: 277. https://doi.org/10.3390/land11020277
Note that from the first issue of 2016, this journal uses article numbers instead of page numbers. See further details here.