Abstract
Soil compaction (SC) is a major threat for agriculture in Europe that affects many ecosystem functions, such as water and air circulation in soils, root growth, and crop production. Our objective was to present the results from five short-term (<5 years) case studies located along the north–south and east–west gradients and conducted within the SoilCare project using soil-improving cropping systems (SICSs) for mitigating topsoil and subsoil SC. Two study sites (SSs) focused on natural subsoil (˃25 cm) compaction using subsoiling tillage treatments to depths of 35 cm (Sweden) and 60 cm (Romania). The other SSs addressed both topsoil and subsoil SC (˃25 cm, Norway and United Kingdom; ˃30 cm, Italy) using deep-rooted bio-drilling crops and different tillage types or a combination of both. Each SS evaluated the effectiveness of the SICSs by measuring the soil physical properties, and we calculated SC indices. The SICSs showed promising results—for example, alfalfa in Norway showed good potential for alleviating SC (the subsoil density decreased from 1.69 to 1.45 g cm−1) and subsoiling at the Swedish SS improved root penetration into the subsoil by about 10 cm—but the effects of SICSs on yields were generally small. These case studies also reflected difficulties in implementing SICSs, some of which are under development, and we discuss methodological issues for measuring their effectiveness. There is a need for refining these SICSs and for evaluating their longer-term effect under a wider range of pedoclimatic conditions.
1. Introduction
Soil compaction (SC) is a form of physical degradation due to the disruption of soil micro- and macro-aggregates, which are deformed, reduced in volume, or destroyed under pressure. Compaction is a “hidden” threat that occurs belowground and is one of eight European soil threats [1], affecting as much as 18 to 36% of croplands [2,3]. There are several consequences of SC because of its influence on many important soil functions. For example, it can negatively affect physical soil properties, such as gas permeability and water infiltration and storage [4,5]. This hampers the ecological function of the soil, leading to reduced soil fertility and crop production [6,7,8]. Furthermore, SC problems can reduce water infiltration and, in addition to causing problems with runoff and erosion, the soil workability may be reduced due to high water content, and the crops may not be able to explore the entire growing season (e.g., delayed seeding date) [9,10,11]. In this regard, the climate and the expected climate changes are important; for example, Northern Europe may be subject to increasing precipitations and wetter conditions during the growing season [12]. Indeed, soil compaction is one of the main reasons for stagnating yields [10,13]. A study also showed that even if SC does not necessarily lead to a reduction in yields, it can cause considerable amounts of extra costs not only for the farmers but also for society [14].
There are several common reasons for SC in most European countries. Compaction may occur in both the topsoil (i.e., arable layer) and subsoil layers (i.e., below the arable layer) due to pressure from the passage of machinery and repeated trampling of grazing animals, or occur naturally from previous geological periods during the initial ground formation under land ice. Subsoil compaction is also associated with in-furrow ploughing, during which tractor wheels that are in direct contact with the subsoil transmit the pressure to deeper soil horizons, especially when using heavy machinery under wet and sub-optimal soil conditions [15]. Unlike topsoils, subsoils are not loosened annually, and compaction may become cumulative [16,17]. Another feature regarding the SC of subsoil is the formation of a plough pan layer that results from repeated ploughing and is less permeable for roots and limits water flow and gaseous exchange. Ruser et al. [18] report that compaction can become almost irreversible once it reaches the threshold of the pre-consolidation stress (i.e., the index of soil load-bearing capacity).
Even though certain climatic conditions and processes (i.e., drying/wetting or freezing/thawing and shrinking cycles) can be effective in counteracting the SC of clayey soils [19,20], these processes are mostly absent on silty soils, making them especially susceptible to subsoil compaction [21]. While ploughing is effective for loosening up compaction of the upper soil layers, there is a lack of measures for persistently loosening up the subsoil [22]. There is a need for developing strategies to avoid subsoil SC and to stabilise and improve subsoil structure. For example, plant roots can be effective for loosening up subsoil, a strategy referred to as “bio-drilling” where roots modify the soil structure by pushing aside soil particles, thereby creating large pores that improve both hydraulic conductivity and gas flow [23,24,25,26]. Cresswell and Kirkegaard [27] defined bio-drilling as the creation of bio-pores by deeply penetrating taproots as low-resistance pathways for the roots of a succeeding crop. For this purpose, alfalfa, forage radish, or oilseed crops, which are known for having deep taproot systems, may be efficient for improving the soil structure even deeper in the soil profile [24,28,29]. However, the understanding of optimising the effect of bio-drilling crops through appropriate management remains limited, and their effects on crop yields vary with climatic conditions [29].
Mechanical subsoil loosening, referred to as deep loosening, deep ripping, or subsoiling, is a common practice to loosen up dense soil layers below the topsoil [30,31]. Subsoil loosening can decrease penetration resistance and bulk density [32] and increase infiltration [33], root development [34], and crop yield [35,36,37]. There is a need for loosening subsoil under optimal soil moisture conditions. When the soil is too wet and loose, the soil might be smeared and compacted [38,39]. When the soil is too dry, thick clods are formed [39]. Furthermore, the benefits of subsoiling are often not long-lasting due to re-compaction by the overburden topsoil and field operations [40,41,42]. However, when combining mechanical subsoil loosening with the addition of organic materials into the subsoil, loosening may last for several years [43,44].
Great efforts have been made to quantify SC, which is needed both for identifying SC problems and for evaluating the effectiveness of mitigating strategies. For instance, Huber et al. [45] suggested the following indicators: soil bulk density, air and water permeability, mechanical resistance, and a visual assessment of the soil structure and rooting. The proposed indicators involve several common measurements, such as bulk density and penetration resistance. However, suitable definitions of critical limit values linked to crop impairment are difficult to define. A number of penetration resistance threshold values above which rootability is impaired [46] can be found. They range between 1 and 2 MPa or higher [47,48,49,50,51,52,53,54] and are strictly linked to pedoclimatic conditions and soil management (e.g., tillage vs. no-tillage). Similarly, for SC characterization, Håkansson [8] suggested an index of the degree of compaction (DC). The DC index represents the bulk density-to-reference density ratio and is considered detrimental for crop development when it exceeds 87% [8]. Although the DC is a fast and easy index, two issues have recently been raised—the identification of the correct reference bulk density is not obvious and the 87% threshold seems to not be applicable for all pedoclimatic conditions [55].
Compaction is one of the threats included in the EU “SoilCare” project (soil care for profitable and sustainable crop production in Europe). This project addressed the use of different soil-improving cropping systems (SICS) involving both the crop type and rotation, as well as specific management techniques aiming to improve soil quality and functions (http://soilcare-project.eu/, accessed on 1 January 2022). In this paper, we present the main outcomes from five case studies within the SoilCare project using different SICSs to counteract compaction. The study sites (SSs) were located in five European countries, where we investigated different innovative strategies for mitigating SC under various soil and climatic conditions. The SICSs involved different types of tillage, including subsoiling and various deep-rooted bio-drilling crops.
2. Materials and Methods
All SICSs had a common objective—to counteract soil compaction. They were located in five countries along the north-to-south and east-to-west gradients from Norway to Romania (Figure 1 and Supplementary Materials, Table S1).
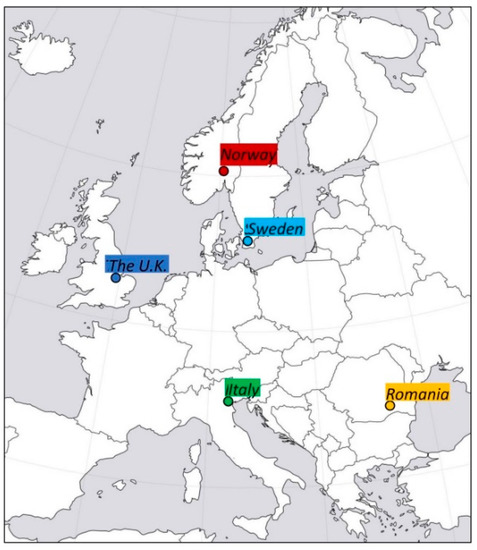
Figure 1.
Location of the five study sites involved in the present study.
The SICSs examined in each country for alleviating topsoil and subsoil SC comprised the use of various deep-rooting crops and different types of tillage operations, including subsoiling (Table 1). At all SSs, the SICSs were compared with a reference standard practice, and both topsoil and subsoil samplings were made at different depths according to the soil characteristics for each of the experiments (Supplementary Materials, Table S2). Although exactly the same measurements were not performed at all SSs (as detailed below), some were similar for all SSs. This allowed us to make a generic analysis and identify the relationships with soil properties using the three SC indices described in Section 2.4.

Table 1.
Soil-improving cropping systems (SICS) applied at the five study sites (SSs) and the reference standard practice at each site.
2.1. Norway
2.1.1. Experimental Design
The Norwegian SS investigated soil compaction alleviation by using bio-drilling crops. The soil was characterised by poor natural drainage and medium erosion risk. This field has been under cultivation for several decades and the site was drained. In the early summer of 2015, a multiple wheel-by-wheel approach was used for establishing the initial compaction with a tractor and trailer combination passing across the plots ten times, with a total weight of 17 Mg and resulting in a wheel load of 2.8 Mg for the trailer tandem axles (compacted “C” plot). This is a typical wheel load for small- and medium-sized farms in Norway and representative of other machinery, such as a combine harvester. There was little precipitation the days before the compaction treatment and none during it, resulting in workable conditions and higher soil moisture tension in the topsoil and subsoil (−25 and −63 kPa, respectively) than assumed at the field capacity (−10 kPa) while wheeling. The site was used for yield studies until 2017; for further details, please see the work of Seehusen et al. [56]. Thereafter, four different rotation treatments were applied during a 4-year period—(1 and 2) oilseed (Brassica rapa L. ssp. Oleifera) and barley (Hordeum vulgare L.) rotation, (3) barley monoculture, (4) alfalfa (Medicago sativa L.) monoculture. The experimental design was a split plot with two replicates, with the compaction level as the splitting factor (compacted “C” vs. reference “R” plot) and the rotation treatment (1 to 4) as the main plot factor. Crops were grown in 5 × 1.5 m plots for a total of 16 plots, that is, four rotations × two compaction levels (compacted vs. uncompacted) × two replicates.
All plots were subject to spring ploughing at 25 cm beginning in 2015 (after the compaction) except for the plots with perennial alfalfa. The ploughing was assumed to be effective for alleviating compaction and aligning the root effects, and therefore, only the topsoils from Treatments 3 and 4 were sampled in 2020. Management practices (seeding, fertiliser, and tillage) were done in the same way as the surrounding fields.
2.1.2. Soil Sampling, Field Measurements, and Laboratory Analysis
Undisturbed cylinder cores (100 cm−3) were collected at both 10–20 and 40–50 cm depth in 2015 (n = 4–5 per depth) and 2020 (n = 4 per treatment and depth) for soil physical analysis. The soil bulk density (BD) was determined gravimetrically by weighing the soil before and after drying for 24 h at 105 °C. In 2015, the BD represented the field conditions at sampling, while in 2020, it represented the BD at −3 kPa. The water retention was studied in both years by first saturating the samples and then draining them at different matric potentials (−3, −50, and −1500 kPa in 2015, and −2, −10, −100, and −150 kPa in 2020). In the latter year, the wilting point (−1500 kPa) was calculated using a pedotransfer function [57]. The pore size distribution was derived from the water retention curves (details in Seehusen et al. [56]). The air capacity was measured assuming a field capacity of −10 kPa by measuring the airflow through the soil samples at a pressure of 2 kPa [58]. Saturated hydraulic conductivity (Ks) was determined with the hood permeameter method [59] on saturated soil samples in 2015, while in 2020, it was derived from the air permeability according to Riley’s pedotransfer functions [57] (for further details, see Seehusen et al. [60]).
In 2015, the data from the compaction trial were analysed using the R statistical software package (2014) (details in Seehusen et al. [56]). In 2020, the data for the Norwegian SS were analysed using general linear models and Fisher tests in Minitab 19. Comparisons between the values from 2015 and 2020 were done by two-sample t-tests and confidence intervals. The results after Treatments 1–4 from 2020 of the reference plot (no compaction) were compared with the reference values from 2015, and the results after Treatments 1–4 from 2020 of the earlier compacted plot were compared with the values of the compacted plot from 2015.
2.2. Sweden
2.2.1. Experimental Design
The SS in Sweden is located at a farm in southern Sweden, where the subsoil is naturally compacted (1.7–1.9 g cm−3) due to its formation under land ice and the root growth of crops is restricted to the topsoil, with hardly any roots below 30 cm [61,62]. The site has been under cultivation for at least a century and is tile-drained. The experiment consisted of a pilot study starting in September 2018 that investigated the possibility of improving the upper subsoil through the supply of undecomposed organic material in combination with a mechanical subsoil loosening. A randomised block design (12 plots, 6 × 20 m) with four replicates was established, involving three treatments—(a) a control treatment, (b) loosening of the subsoil (to a depth of about 35 cm) without the incorporation of organic material, and (c) loosening of the subsoil with the incorporation of undecomposed straw pellets at amounts of about 25 Mg ha−1. Subsoiling and straw incorporation were performed using adapted HE-VA sub-tiller equipment at a speed of 1 km per hour to 24–35 cm depth. Straw pellets were pumped from a tank mounted on the front of the tractor and injected under pressure into the upper subsoil through oval openings in metal pipes welded behind each vertical bill. The loosening of the subsoil and the addition of straw pellets was performed only once (in 2018). Thereafter, normal tillage practices, including mouldboard ploughing to 25 cm, were applied in all plots. Crop fertilisation followed the local recommendations. Winter wheat (Triticum aestivum L.) and sugar beet (Beta vulgaris L.) yields were recorded in the 2019 and 2020 growing seasons, respectively.
2.2.2. Soil Sampling, Field Measurements, and Laboratory Analysis
In 2019, at the end of the winter wheat heading (growth stage Z60 according to the Zadoks scale), a soil profile description was conducted in one plot per treatment. The portions of the upper subsoil (24–35 cm) volume and surface affected by subsoiling and the presence of roots were visually evaluated. A more detailed soil sampling was done in 2020 about six weeks before harvest within a small area in the middle of each plot that was kept free from sugar beet plants starting around mid-summer. In this area, a soil pit 65–75 cm long and 25 cm wide was dug, and six undisturbed soil cylinders (7.2 cm diameter, 5 cm height) were taken at 10–15 cm depth, as well as six at 28–33 cm depth, by placing the cylinders one after the other in a row at a spacing of about 5 cm between each. Before removing the cylinders from the 28–33 cm depths, six penetration resistance (PR) tests were collected along the row with cylinders. On the same occasion, a soil profile for the control plots (only) was obtained using an auger sampling with depths divided into increments of 0–20, 20–22.5, 22.5–25, 25–27.5, 27.5–30, 30–35, and 35–40 cm. Each increment was analysed for the total C and N, and the pH and soil texture were measured in the 0–20 cm layer and in a combined sample for the 25–40 cm depth.
The soil moisture content and dry soil bulk density were determined from each of the cylinders. Each of the cylinder samples was also passed through a 2-mm sieve, and the occurrence of gravel and small stones (i.e., particles >2 mm) was determined by measuring both their weight and volume fraction. Thereafter, the total C and N concentrations were measured by dry combustion, and the pH (water) was determined for each sample from the 28–33 cm depth; only a pooled sub-sample for the 0–15 cm depth was retained for these analyses.
All statistical analyses were done with the GLM Procedure in SAS software (SAS Institute, Cary, NC, USA). The means were compared using Fisher’s least significant difference (LSD) when the F-value in ANOVA was statistically significant (p < 0.05).
2.3. United Kingdom
2.3.1. Experimental Design
The United Kingdom SS is located at the Allerton Project—a 300 ha mixed arable and livestock research, demonstration, and education Farm. The experiment aimed to examine the alleviation of compaction by using tillage. The experiment started in October 2017 at the Allerton Project. This SS historically used a wheat–rape (Brassica napus L.) rotation with a “break” spring crop, and over the last ten years, had a reduction in tillage, going from a plough-based system to direct drilling. Soil compaction was artificially created by driving a tractor (Massey Ferguson 7720, approx. 8 tons total weight) across the area, ensuring a tractor tyre was running over the whole plot twice. Directly afterwards, measurements with a penetrometer verified the degree of compaction, showing the average compaction was 15% higher to a depth of 45 cm, with the highest compaction (+32%) occurring at 7.5 cm depth. The experimental design was a randomised complete block design with 3 replicates involving a total of 6 plots (9 m wide and 40 m long). The ploughing system (20 cm depth) was compared with a no-cultivation direct-drilled control treatment. Following the fall cultivations in 2017, winter barley grew across all plots and was harvested in July 2018. The compaction and treatments were repeated in October 2018, keeping the same plot structure, and faba beans (Vicia faba L.) were planted across all plots and harvested in September 2019. In March 2020, spring wheat was planted across all plots and harvested in October 2020.
2.3.2. Soil Sampling, Field Measurements, and Laboratory Analysis
The measurements of BD and penetration resistance (PR) were split into topsoil (0–25 cm), which was within the cultivation depth of the plough, and subsoil (>25 cm), which was below the depth of cultivation. PR measurements were conducted in 2020 after crop drilling in May using a field penetrometer (Field Scout, SC900) to a depth of 45 cm, with 10 measurements taken per plot and averaged. The bulk density was also measured in May 2020 using a soil cylinder (196 cm3) in the topsoil and subsoil layers. The soil was dried for 48 h at 105 °C and weighed to calculate the bulk density. Soil samples were also collected from the topsoil layer and the particle size distribution and soil organic carbon were analysed. Infiltration was measured using the double ring method (outer ring diameter of 53 cm, inner ring diameter of 28 cm diameter, water depth of 24 cm). Both rings were partially buried in the soil and the outer ring was kept topped up with water to prevent lateral leaking. Once the water loss reached a stable rate, the water loss from the inner ring was recorded over time and converted to saturated hydraulic conductivity (Ks). The crop yield was measured at harvest each year by taking a reading from the combine after each plot was harvested.
Differences between treatments were analysed using Genstat version 18. A general linear model was used, with blocking treated as a random effect in all analyses. Where topsoil and subsoil measurements were both included in the analysis, a split-plot design was used, with the sample depths of the split-plot and treatment (plough vs. direct-drill) as the main plot effects.
2.4. Italy
2.4.1. Experimental Design
The Italian SS aimed to prevent soil SC by combining no-tillage and cover crops. In the area, the shallow water table ranged from about 0.5–1.5 m in late winter to early spring to 1–2 m in summer. The experiment has been ongoing since 2018 and has a split-plot design (12 plots in total, 12 m wide × 85 m long) with two replicates, two levels of tillage intensity (main plot), and three levels of soil cover (sub-plot). The no-tillage (NT) system based on sod seeding was compared with the conventional practice (CT) based on mouldboard ploughing to 30 cm, followed by disk-harrowing to 15 cm. The main crop was maize (Zea mays L.), while during fall, the soil remained bare (BS) or was covered with cover crops, for example, winter wheat (WW) or tillage radish (Raphanus sativus L.) (TR), which are characterised by fibrous and taproot root systems, respectively. Subsurface band fertilisation was applied at sowing in NT, while side-dressing fertiliser was followed by hoeing in the CT treatment. Pesticide applications depend on the crop requirements but were the same for all the plots.
2.4.2. Soil Sampling, Field Measurements and Laboratory Analysis
Soil samples were collected before seedbed preparation in spring 2020 from the topsoil (i.e., tilled layer) and subsoil (i.e., below the tilled layer), as reported in the Supplementary Materials, Table S2. Undisturbed soil cores (7 cm in diameter, 60 cm in height) were collected with a hydraulic sampler and cut to extract the 0–20 and 40–60 cm soil layers. Remoulded soil samplings were collected at the same depth for chemical–physical analysis. PR measurements were performed up to 60 cm depth before tillage operation (at the end of February), with a digital cone penetrometer (Eijkelkamp, Giesbeek, The Netherlands) with a base area of 2 cm2 and an apex angle of 30°. Undisturbed soil cores were oven-dried at 105 °C for 24 h to calculate the volumetric water content (VWC) and BD using the core method [63]. Remoulded soil samples were air-dried, sieved at 2 mm, and analysed for particle size distribution according to the methods by Bittelli et al. [64] and the soil organic carbon concentration (SOC). On-field soil hydraulic properties were measured inside each plot using a double-ring infiltrometer (inner ring diameter of 60 cm, outer ring diameter of 80 cm) according to the methods by Parr and Bertrand [65]. The hydraulic conductivity (Ks) and sorptivity were calculated by applying Philip’s infiltration equations [66]. At the end of the growing season, the maize grain yield was collected at the commercial moisture content from four representative areas (2 m2) in each plot and then dried at 65 °C until a constant weight was obtained to determine the dry weight.
The data were analysed by applying a linear mixed-effect model based on the restricted maximum likelihood estimation method considering tillage, soil covering, and their interaction as fixed and block as random factor. Post-hoc pairwise comparisons of the least-squares means were performed using the Tukey method to adjust for multiple comparisons (p < 0.05). Statistical analyses were performed with SAS software (SAS Institute Inc. Cary, NC, USA), 5.1 version.
2.5. Romania
2.5.1. Experimental Design
The Romania SS is located in an area characterised by natural subsoil compaction. The experiment consisted of a pilot study established in March 2018, and its aim was to mitigate natural SC by tillage. The experimental design was a split plot (36 plots, 6 × 33 m) with three blocks and involving four treatments—(TR1) mouldboard ploughing with furrow inversion to 25 cm depth, (TR2) subsoiling to 60 cm by ripping and disking to 12 cm depth, (TR3) a control treatment with 2-times disking, and (TR4) chiselling to 25 cm depth with furrow inversion. All treatments were repeated every year. The testing of tillage treatments also involved three rotations with deep-rooting leguminous crops. Only the main effect of the tillage treatments on the soil physical properties is reported here.
2.5.2. Soil Sampling, Field Measurements and Laboratory Analysis
Soil physical and chemical parameters were measured in all plots during the three years of the experiment. For this, disturbed soil samples were collected in autumn after crop harvesting for soil water-stable aggregates (WSA) ˃250 um, and undisturbed soil cores (100 cm3 volume) were sampled at 10–20 cm and 40–50 cm depths for soil physical analyses (Ks and BD).
The content of water-stable aggregates (in % g/g) was measured by the Henin–Feodoroff method based on wet sieving (SR EN ISO 10930:2012). The Ks was determined according to the steady-state falling head method (Romanian standard: STAS 7184/15–91). The BD was gravimetrically determined by weighing the soil core samples before and after drying for 24 h at 105 °C (SR EN ISO 11272:2017).
The data obtained for the soil properties measured at the Romanian SS were analysed by one-way repeated measure ANOVA considering either the soil tillage or year as the tested factor. Post-hoc pairwise comparisons of the least-squares means were performed using the Tukey method to adjust for multiple comparisons (p < 0.05). All statistical analyses were performed with OriginLab 6.1 software (Origin Lab Corporation, Northampton MA, USA).
2.6. Soil Compactions Indices
The effects of the SICSs across the different SSs were investigated using three soil compaction indices—degree of compaction (DC), relative normalised density (RND), and air-filled porosity (AFP). The DC was calculated as follows:
where BD is the bulk density and BDref is the reference bulk density. The BDref was calculated according to Equation (12) reported by Keller and Håkansson [67], as follows:
where OM is the soil organic matter. The RND index was derived from the ratio between the BD and the critical bulk density (BDcrit), the latter being 1.6 g cm−3 for soils with clay < 16.7% or calculated with the following equation for soils with clay > 16.7% [68]:
The air-filled porosity (AFP) at the sampling was calculated as the difference between the total porosity and the volumetric water content.
3. Results and Discussion
3.1. Norway
In the topsoil, there were no significant differences in the BD, TPV, or AC between the treatments in 2020 or between years, with average values of 1.35 g cm−3, 47.6%, and 10.8%, respectively. Similarly, there were no significant differences between the treatments for Ks and air permeability in 2020. However, for both treatments, the Ks and air permeability were significantly lower in 2020 compared to 2015 (Supplementary Table S3).
In the subsoil, multiple wheeling in 2015 led to a significant increase in BD, with 1.69 g cm−3 in C as compared to 1.59 g cm−3 in the R plots (Table 2). Five years after the compaction event, the BD was still significantly higher in the C than in the R plots in 2020, with the exception of Treatments 2 and 4. In the uncompacted R plot, the BD in 2020 was significantly decreased compared to 2015 for all treatments, from 1.59 to 1.45 g cm−3. In the C plot, the BD was also significantly reduced after 5 years for Treatment 4 (1.45 g cm−3), reaching the same level as Treatment 4 in the uncompacted R plot (1.44 g cm−3). There was also a trend towards a reduction in the BD after 5 years for Treatment 2, from 1.69 to 1.55 g cm−3. Compared to the topsoil (Supplementary Materials, Table S3), the BDs in the subsoil for the R plot were about 20 and 10% higher in 2015 and 2020, respectively (Table 2). The subsoil TPV significantly decreased by about 6% in 2015 following the compaction event (Table 2). In 2020, there were no significant treatment effects on the TPV, which was 45.5% on average. However, both Treatment 1 (+5.1%) and Treatment 4 (+7.0%) led to a significant increase in the TPV on the C plots in 2020 compared to 2015.
Table 2.
Subsoil (30–40 cm) bulk density (BD), total pore volume (TPV), air capacity (AC), saturated hydraulic conductivity (Ks), and air permeability (Air perm) in uncompacted reference and compacted plots at the Norwegian study site in 2015 and for the different treatments in these plots in 2020. Treatments 1, 2: oilseed rape–barley rotation; Treatment 3: barley monoculture; Treatment 4: alfalfa monoculture.
In contrast, multiple wheeling in 2015 had no significant effect on the subsoil AC. In the uncompacted R plot, the AC was an average of 5.81% after 5 years and there were no significant differences between the treatments, while in the C plot, Treatment 3 presented the lowest increase of all treatments in 2020 (from 3.38 to 5.26%). With the exception of Treatment 3 on the R plot and Treatment 1 on the C plot, the AC values significantly increased during the research period, from 3.4 to 5.9% on average across treatments.
Similarly to the TPV, soil compaction in 2015 did not lead to a significant reduction in either the saturated hydraulic conductivity or air permeability (Table 2). In 2020, Ks followed a similar pattern to air permeability since it was estimated using a pedotransfer function based on air permeability. In both the R and C plots, there were no significant differences between the treatments in 2020 in either the Ks or air permeability, which were 0.15 m day−1 and 1.2 um2 on average, respectively. Compared to 2015, there was a significant reduction in Ks by 5.40 ×10⁻³ m day−1 in the C plots for Treatment 3, while there was a significant reduction in the air permeability for Treatments 1–3 in the C plot, with an average of 23.9 um2. Compared to the topsoil (Table 2), there were very large differences regarding both the Ks and air permeability in the subsoil for the R plot in 2015 and 2020.
There was only a significant difference between the same treatment in the R and C plots in 2020 for BD (Treatments 1 and 3) and not for any of the other soil physical properties (data not shown).
3.2. Sweden
The soil visual assessment showed that the straw was not mixed with the subsoil in rows but located at the bottom of the subsoil rows created by the bills in the subsoiling + straw treatment (Figure 2a). Indeed, the two subsoiling treatments forced the topsoil into the subsoil, forming distinct rows, while the subsoil moved into the topsoil irregularly (Figure 2a). However, subsoiling affected only a portion of the upper subsoil layer (24–35 cm) below the topsoil. We evaluated that the volume of the subsoil affected by the subsoiling treatments varied between 36 and 40% and that the surface of the subsoil affected varied between 42 and 49%. Analysis of the soil profile samples for the control plots that characterised the experimental site more precisely showed that the sand, silt, and clay contents were 62, 27, and 11%, and 64, 27, and 9% in the topsoil and subsoil layers, respectively.

Figure 2.
(a) Illustration (top) and photo (bottom) of a Swedish soil profile used for evaluating the effects of the subsoiling + straw treatment. (b) Changes in the penetration resistance with depth in 2020, a metric used for evaluating the effects of subsoil loosening and loosening + straw incorporation treatments at the Swedish study site. The vertical line (2.5 MPa) indicates the critical limit for root penetration. Data are mean values of six measurements made across treatment stripes covering a width of about 40 cm in each experimental plot.
As shown by the visual assessment for the presence of roots in 2019, which was done by counting the number of roots along a 10-cm line at two depths in the topsoil (10 and 20 cm) and in the subsoil (30 cm), there were more roots present in the subsoiling treatments at the 30 cm depth. Meanwhile, there were almost no roots present in the subsoil for the control treatment, and the subsoiling + straw treatment also appeared to improve the number of roots at all three depths compared to the control (Supplementary Materials, Table S4). The mean maximum root penetrations into the subsoil (>24 cm) were about 4 cm in the control and 11 cm in the subsoiling treatments. The maximum penetrations were more variable for the subsoiling treatments since among the six measurements made within each plot, some presented values similar to those for the control, but some values were much deeper, indicating the measurements were sometimes penetrating the subsoil rows created by the bills (data not shown). The measurements in the control plots almost never exceeded 6 cm. The changes in the soil penetration resistance with depth in 2020 showed a mean maximum (i.e., exceeding the 2.5 MPa critical limit for root penetration) rooting depth of about 28 cm in the control, almost 30 cm in the subsoiling alone, but much deeper at around 40 cm for the subsoiling + straw treatments (Figure 2b).
There were no significant differences between the SOCs in the topsoil (10–15 cm) and the subsoil (28–33 cm) cylinder soil samples (Supplementary Materials, Table S4). The soil total C/N ratios, as well as the pH values in the top- and subsoils, were also not significantly different between treatments at around 10.0 and 6.0, respectively.
Compared to the subsoiling + straw treatment, the BD was significantly higher in the topsoil in the subsoiling treatment. It was higher also in the subsoil compared to the control (Supplementary Materials, Table S4). However, when correcting the BD for the presence of gravel and stones [69], which varied between 6.1 and 8.3%, there were no significant differences between the treatments in either the top- or subsoils. Since this site had a naturally compacted subsoil with high soil densities, we were restricted to using smaller cylinders than usual (i.e., 204 vs. 408 cm−3), which provided less precise and more variable measurements. The experimental site was also heterogeneous, and there was a negative correlation between the SOC contents and the BDs (Supplementary Materials, Figure S1). This may have contributed to the differences because the subsoil SOC content in the control was slightly higher than for the subsoiling treatments, even if not significant.
3.3. United Kingdom
The soil BD was not affected by the compaction alleviation treatment and showed no significant difference between the treatments in the topsoil or subsoil layers. Nevertheless, a trend of lower BDs was observed under the direct-drilling treatment in both the topsoil (1.46 g cm−3 ± 0.073 vs. 1.52 g cm−3 ± 0.086) and the subsoil (1.43 g cm−3 ± 0.17 vs. 1.64 g cm−3 ± 0.029). A significant (p = 0.007) sample depth × compaction alleviation treatment interaction was observed for the PR results, with the treatments ranked as follows: plough topsoil < direct-drilling topsoil < plough subsoil < direct-drilling subsoil (Figure 3). Overall, the PR was significantly lower in the plough plots (p < 0.001) and significantly higher in the subsoil compared to the topsoil (p < 0.001). In the subsoil, the PR exceeded the 2.5 MPa limit in about 30% of the measurements but did not exceed it in any in the topsoil.

Figure 3.
Penetration resistance (PR) in topsoil (0–25 cm) and subsoil (25–45 cm) in ploughed and control direct-drilled (dd) plots at the UK study site.
The measurements of the SOCs in the topsoil showed no significant differences between treatments (plough: 2.85% ± 0.70; control dd: 2.85% ± 0.80). The measurements of Ks also showed no significant differences between treatments (plough: 1.28 × 10⁻² m s−1 ± 5.22 × 10⁻³, control dd: 1.53 × 10⁻² m s−1 ± 6.25 × 10⁻³).
3.4. Italy
The BD was not affected by agronomic management neither in the topsoil nor in the subsoil despite a tendency for denser topsoil being observed in the NT compared to the CT plot (1.43 vs. 1.35 g cm−3). The topsoil PR was affected by both tillage and soil covering, where the NT was 5% higher than the CT plot (1.05 vs. 0.82 MPa) (Figure 4). At the same depth, the PR had a lower value in the BS (0.85 MPa) compared to the WW (1.06 MPa). Contrarily, in the subsoil, the PR was not affected by the agronomic management. PR observations were always < 2.5 MPa for the topsoil, while 33% of the measurements exceeded that limit for the subsoil. No significant treatment effects were found.

Figure 4.
Topsoil (0–20 cm) penetration resistance (PR) as affected by soil cover (a) and tillage (b) at the Italian study site. Different letters indicate a significant difference according to the Tukey test at p < 0.05. BS: bare soil; TR: tillage radish; WW: winter wheat; CT: conventional tillage; NT: no-tillage in VWC, SOC content, or stock.
Tillage affected the hydraulic parameters. Indeed, the sorptivity (p = 0.05) increased almost five-fold under NT management. The Ks, despite not significant with a p < 0.05, showed a three-fold value for the NT compared to the CT (Supplementary Materials, Figure S2). For further details, see Supplementary Materials, Table S5.
3.5. Romania
For the BD in the topsoil (10–20 cm), throughout all three years of the Romanian experiment, the mean value in the subsoiling treatment (TR2) ranged from 1.28 to 1.32 g cm−3 and was always significantly different from the other treatments, which had higher values between 1.42 to 1.48 g cm−3 (Figure 5a). With the exception of the control treatment (TR3), where no significant differences in BD occurred between the years, the BD was significantly lower in 2020 compared to 2018 for all treatments (Supplementary Materials, Figure S3a).
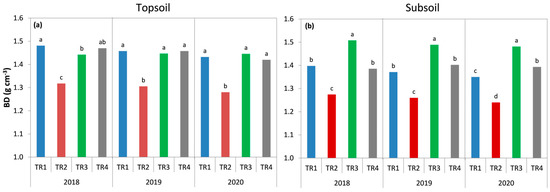
Figure 5.
Bulk density (BD) in topsoil (10–20 cm) (a) and subsoil (40–50 cm) (b) as affected by different tillage systems during the three years of the Romanian experiment. Different letters represent statistically significant differences according to the Tukey post-hoc test at p < 0.05. TR1: mouldboard ploughing with furrow inversion to 25 cm depth; TR2: subsoiling to 60 cm + disking to 12 cm depth; TR3: control treatment with 2-times disking; TR4: chiselling to 25 cm depth with furrow inversion.
For the BD in the subsoil (40–50 cm), the results follow the same trend as for the topsoil regarding the subsoiling treatment and always had significantly lower values over all three years (Figure 5b). The control treatment also presented a significantly higher BD during each year of the study compared to the other three treatments. The bulk density in the subsoil was significantly lower in 2020 compared to 2018 for both the subsoiling and control treatments, but no significant differences were observed for the other two treatments (Supplementary Materials, Figure S3b).
The tillage treatments significantly affected the WSA in the topsoil throughout the 3 years of the experiment (Supplementary Materials, Figure S4a), with subsoiling (TR2) always exhibiting the highest WSA (23.9, 28.9, and 29.3% for 2018, 2019, and 2020, respectively) with respect to all other treatments (mean values across treatments of 17.0, 17.9, and 17.7% for 2018, 2019, and 2020, respectively). Except for 2018, the control (T3) always had a significantly lower percentage of WSA. The WSA remained the same during the study period for all treatments except for subsoiling, where the aggregation was significantly higher in 2019 and 2020 (Supplementary Materials, Figure S5a). The tillage treatments also significantly affected the Ks over all three studied years and were always 4 to 5 times higher for the subsoiling treatment (Supplementary Materials, Figure S4b). Differences in the Ks for other treatments only occurred in 2018, where TR2 (202 ×=10−8 m s−1) ˃ TR4 (74 × 10−8 m s−1) ˃ TR3 and TR1 (60 × 10−8 m s−1). Only TR1 and TR2 differed between the years, with lower values of Ks in 2018 compared to the other years (Supplementary Materials, Figure S5b).
3.6. Soil Compaction Indices and Crop Yield
Generally, SC is considered to impair crop performance [70]. In the present study, the crop yield was only affected by the adopted SICS for the Romanian SS, a site predisposed to natural subsoil compaction as well as having a plough pan at 30 cm, which restricted the rooting depth. Compared to the other tillage types, the main effect of conducting subsoiling every year always gave the best crop performances after 3 years, with yields of 5.8, 1.6, and 3.4 Mg of dry matter ha−1 for maize, soybean, and spring barley, respectively. There were no significant effects of the SICSs on crop yields at the other SSs (data not shown).
In contrast to the Romanian SS, the Swedish SS only applied the subsoiling operation once, and there were no significant differences in yields between the treatments throughout the experimental period. Subsoiling did not affect the whole area but only a portion of it (i.e., distinct subsoil rows), in which roots would theoretically be able to grow deeper and take up more water and nutrients by exploring a greater volume of soil. This trial differed in this respect from the other types of experimental treatments that affected the whole area. Thus, the measured yields of the whole field represent a weighted mean value of the treated and untreated subsoil volumes. Conceptually, calculating yields as the weighted mean of the affected and unaffected subsoil may be a more reasonable indicator of the effect of subsoil loosening. To illustrate this, we recalculated the measured relative winter wheat yield (2019) of the whole area compared to the control for the subsoiling treatments (Figure 6). This was done by scaling the two subsoiling treatments by factors of 100/38 and 100/45, considering they affected either 38% of the subsoil volume or 45% of the subsoil surface, respectively.
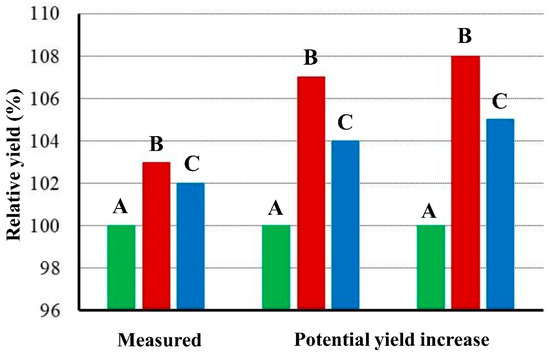
Figure 6.
The measured relative winter wheat yield for the subsoiling (B) and subsoiling + straw (C) treatments compared to the control (A) in 2019 (left columns) at the Swedish site. Assuming that the whole (100%) subsoil was affected, and not only a portion of the subsoil surface (45%) or subsoil volume (38%), the potential yield increase is proportionally higher (middle and right columns).
To predict the possible effect of SC on crop performances, a few indices can be adopted [8,67,71,72]. A combined indicator of critical conditions in the soil (e.g., PR, porosity, and gas exchange) is the degree of compactness (DC), defined as the ratio of bulk density-to-reference density [8]. A threshold of 87% has been suggested as critical for root growth and crop development [8,67]. At the five SSs, the DC ranged from a minimum of 56% to a maximum of 124% (Figure 7a). The Norwegian SS exhibited the highest DC, which always exceeded the 87% threshold in both the topsoil and subsoil. On average, values in the subsoil were higher in the compacted compared to the reference plots (113 vs. 101%) (Figure 8b). At the Swedish SS, the DC was always <87%, averaging at 75 and 81% for the topsoil and subsoil, respectively (Figure 7a). For the UK SS, the DC averaged at 81%, with small variation between the topsoil and subsoil (Figure 7a). The DC limit exceeded the threshold of 87% for about one-third of the observations at the UK SS. At the Italian SS, the DC was higher for the no-tillage plots compared to the conventionally tilled plots (88 vs. 81% in the topsoil and 103 vs. 100% in the subsoil) (Figure 8a,b). At the Romanian SS, 47% (topsoil) and 25% (subsoil) of the measurements exceeded the DC limit but with lower magnitudes, where the maximum recorded DC was 90% (Figure 7a). At this site, a DC of >87% was frequently found in the topsoil under ploughing, chiselling, and disking, while this was only the case for the subsoil under disking (Figure 8a,b).
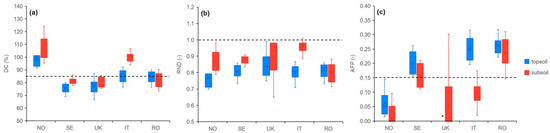
Figure 7.
Box and whisker plots of degree of compactness (DC) (a), relative normalised density (RND) (b), and air-filled porosity (AFP) (c) in topsoil and subsoil at the five study sites. N: Norway; SE: Sweden; UK: United Kingdom; IT: Italy; RO: Romania. The box delimits values from low to high (from the 25th percentile to 75th percentile). Inside the box, the median and mean are indicated by a line and an X, respectively. The whiskers represent the minimum and maximum values in the range. * data not shown for the UK topsoil due to high frequencies of zero values.
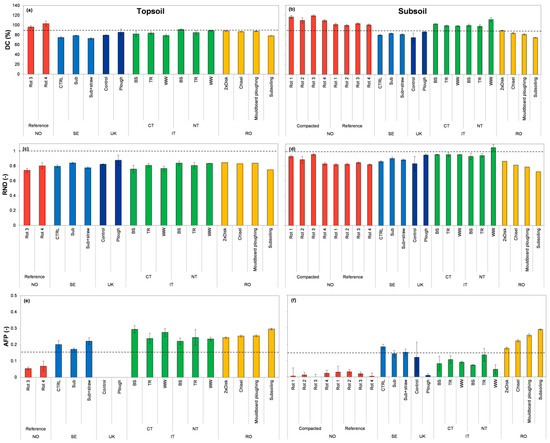
Figure 8.
Degree of compaction (a,b), relative normalised density (c,d), and air-filled porosity (e,f) across the study sites (N: Norway; SE: Sweden; UK: United Kingdom; IT: Italy; RO: Romania) for topsoil (a,c,e) and subsoil (b,d,f). The dotted horizontal lines indicate an 87% degree of compactness, relative normalised density = 1, and air-filled porosity = 0.15, which represent suggested limits for good crop growth. The values shown are the mean and standard error. Rot 1, 2: oilseed rape–barley rotation; Rot 3: barley monoculture; Rot 4: alfalfa monoculture (N). CTRL: control treatment; Sub: subsoiling; Sub + straw: subsoiling + straw (SE). Control: direct-drilled treatment; Plough: ploughing system (UK). CT: conventional tillage; NT: no-tillage; BS: bare soil; TR: tillage radish; WW: winter wheat (IT). TR1: mouldboard ploughing with furrow inversion to 25 cm depth; TR2: subsoiling to 60 cm + disking to 12 cm depth; TR3: control treatment with 2-times disking; TR4: chiselling to 25 cm depth with furrow inversion (RO). For further details on adopted treatments, see Section 2. Materials and Methods.
The relative normalised density (RND), sometimes referred to as the degree of “overcompaction”, is a texture-modified expression of density that might be useful to compare the state of compactness across differently textured soils [68]. Soil is defined as compacted when the RND > 1. In this study, the RND ranged from 0.65 to 1.09 across all the SSs (Figure 7b). The Norwegian SS always exhibited an RND of < 1.0 in the subsoil, with a higher value for the artificially compacted (0.90) plots compared to the reference plot (0.83) (Figure 8c,d). Similarly, the Swedish SS showed RND values in the subsoil below the suggested limit, being lower in the subsoiling + straw plot (0.78) compared to the subsoiling plot alone (0.84) (Figure 8c,d). At the UK SS, the RND ranged from a minimum of 0.65 to a maximum of 0.99 (Figure 7b). At the Italian SS, the RND was lower in the topsoil than in the subsoil (0.80 vs. 0.96), and the RND in the subsoil was only above 1 in the treatment with a winter wheat cover crop in the no-tillage system (Figure 8c,d). At the Romanian SS, the RND was always <1, with higher values in the topsoil associated with disking, chiselling, and ploughing (0.84, on average) compared to subsoiling (0.75), while the RND values in the subsoil of the different treatments ranked as follows: disking (0.87) < chiselling (0.81) < ploughing (0.79) < subsoiling (0.73) (Figure 8c,d).
In compacted soils, the soil–root contact may be very close, and reduced porosity could result in reduced soil aeration [73]. Therefore, the AFP may also be a useful index to estimate the compaction impact on crop growth. Except for tolerant crops, the ideal AFP is in the 10–15% range [74]. In the present study, the AFP ranged from values close to zero in the UK and some of the Norwegian treatments to a maximum of 0.32 found at both the Italian and Romanian SSs (Figure 7c). Higher topsoil values compared to the subsoil were found at both the Norwegian (0.06 vs. 0.01) and Italian SSs (0.25 vs. 0.09), while small differences between the soil layers were found at the Swedish (0.18 on average) and Romanian SSs (0.25 on average) (Figure 7c). At the latter SS, the AFP was affected by the tillage treatments in both the topsoil and subsoil, following the opposite trend observed for the RND (Figure 8e,f). Lower values in the topsoil were associated with disking, chiselling, and ploughing (0.25 on average) compared to subsoiling (0.30), while the AFP values for the subsoil of the different treatments ranked as follows: subsoiling (0.29) > ploughing (0.25) > chiselling (0.22) > disking (0.18) (Figure 8e,f).
Although roots may benefit from soil cracks and pre-existing bio-macro-pores [75], to fully exploit the soil, matrix roots must be able to explore the intra-aggregate space [76]. It is generally recognised that a root can either penetrate a soil aggregate or be deflected along its surface depending on the soil strength [72]. A total root growth decrease and impaired crop yield are observed when the PR exceeds a soil-specific limit, which typically ranges from 1 MPa [51] to 2 MPa or greater [47,48,49,50,51,52,53]. In this study, only the Swedish, UK, and Italian SSs directly measured the PR in the field. At the Swedish SS, the PR measurements in the subsoiling + straw incorporation treatment showed values below 2.5 MPa down to about 40 cm depth, while the control and subsoiling alone treatments showed values ˃2.5 MPa higher up in the soil profile (Figure 2b). Indeed, visual assessments for the presence of roots and maximum penetration (Supplementary Materials, Table S4) indicated that subsoiling had a positive impact on both the root growth and rooting depth at this site. At the UK and Italian SSs, soils under no-tillage presented higher PR values than the ploughed treatments, with at least 30% of the subsoils exceeding 2.5 MPa, which might impair root-growing conditions.
With the exception of the Romanian SS, there was no relationship (data not shown) between the crop yield and the SC indicators (i.e., DC, RND, AFP, and PR). At this SS, we found a 2% yield reduction for every percentage of DC increase or every unit of AFP decrease (Figure 9). This implies that in passing from a DC of 83% (average of Romanian soils) to 87% (DC limit for crop growth according to Håkansson [8]), a 7% reduction in the crop yield might be a possible scenario for this SS, irrespective of the crop type. The response of the crop yield to different levels of SC is usually considered parabolic, with low production in loosened soil, high yields at an optimal degree of soil compaction, and lower yields for compacted soils [77]. Only the descending part of this parabolic relationship may have been observed at the Romanian SS, and it is possible that the optimal DC for crop production in its fine-textured soil might be located at a DC lower than 87% [6].
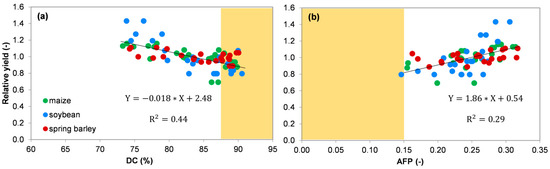
Figure 9.
Linear regressions between relative crop yield (yield-to-average yield ratio) and degree of compaction (DC) (a) and air-filled porosity (AFP) (b) at the Romanian study site. The regression equation and R2 values are shown. Yellow areas represent the zone with DC ˃ 87% and AFP < 0.15.
3.7. Soil Compaction and SICS with Tillage
The relationship between SC and tillage has been thoroughly investigated, especially in northern [16,78,79] compared to central [80] and southern Europe [81]. It is generally recognised that topsoil compaction might be mitigated using annual soil loosening with conventional tillage practices such as mouldboard ploughing, while subsoil compaction has proven to be persistent and difficult to recover and sometimes requires more specialised tillage operations [82].
In this study, all countries except Norway involved different intensities of tillage for mitigating topsoil and subsoil compaction. Inversion tillage through mouldboard ploughing was adopted in the UK (to 20 cm depth), Italy (to 30 cm depth), and Romania (to 25 cm depth). The UK and Italian SSs also included no-tillage (i.e., direct-drilling) treatments. Subsoiling treatments were used at the Romanian SS (to 60 cm depth) and in Sweden (to 35 cm depth), the latter with and without the injection of organic materials. Lower-intensity tillage (i.e., reduced or no-tillage) is considered to improve soil structural stability and, therefore, theoretically, tillage practices prevent SC [83]. On the contrary, high-intensity tillage might produce an unstable soil structure more prone to soil compaction. Disking is one of the less conservative soil aggregate tillage practices, often resulting in a greater proportion of micro-aggregates (2–250 µm) but a lower proportion of macro-aggregates (>250 µm) [84]. At the Romanian SS, the treatment with 2-times disking (TR3) decreased the topsoil BD but showed the lowest proportions of WSA and Ks together with the highest DC and RND and the lowest AFP. These findings suggest that despite providing suitable conditions for crop establishment, disking can make the soil more prone to SC due to greater soil structure instability. Mouldboard ploughing inversion tillage is considered responsible for soil aggregate fragmentation [85], although this negative effect on soil structure may be counteracted by increasing organic C inputs to the soil from crop residues or the incorporation of organic amendments [86]. At the Romanian SS, the results suggest that mouldboard ploughing inversion tillage had a less negative effect on the WSA compared to 2-times disking (Supplementary Materials, Figure S4a).
No-tillage or direct drilling is usually considered a more sustainable agronomic practice [87,88] because it is thought to be less harmful to soil biota, and by keeping the crop residues at the soil surface, it reduces the risk of soil erosion [89]. Verhulst et al. [90] found a greater proportion of large macro-aggregates (>2000 µm) and macro-aggregates (250–2000 µm) under no-tillage compared to conventionally-tilled soils, confirming both the positive effect of tillage absence and crop residue retention. The UK and Italian SSs show somewhat opposite results when comparing the effects of no-tillage and direct-drilling against inversion tillage with mouldboard ploughing, with both the DC and RND being higher under no-tillage and direct drilling in Italy but not in the United Kingdom. Derpsch [91] identified four phases after the adoption of no-tillage—an “initial phase” (0–5 years), when crop residues are expected to be low due to lower yields and with no measurable changes in the SOC while the soil starts rebuilding aggregates; a “transition phase” after 5 to 10 years, when crop residues and SOCs are expected to increase, although these changes are accompanied by higher SC; improvements are expected only after 10–20 years during the “consolidation phase” followed by the “maintenance phase”, characterised by stabilised agro-ecological conditions. Six et al. [92] found that for drier climates before a positive trend occurs, no-tillage could even have a negative effect on the SOC during the first 5–10 years. According to this classification, the Italian soil was in the initial phase and experienced SC, while the UK soil was reaching the end of the transition phase (around 10 years after the first adoption), showing improved soil conditions. Different soil types and their interactions with agronomic practices may explain the differences between these two SSs. The Italian SS is mainly formed from Calcisols and Cambisols (WRB, 2006), with low SOC content (<1.0%) and far from equilibrium, having a silty texture and poor aggregate stability [93]. Piccoli et al. [81,94] previously postulated that the limited amount of non-complexed SOC available for interaction with clay minerals and the low clay-to-silt ratio could prevent the formation of a resilient structure that goes beyond the adopted agronomic management. In contrast, the higher clay and SOC (2.88%) contents at the UK SS might have fostered an improved soil structure by ensuring high stability of the macro-pores [95], better exploiting the benefits related to no-tillage.
Subsoiling is primarily aimed at counteracting subsoil SC and does not disturb the soil surface unless it is associated with another tillage operation. At the Romanian SS, subsoiling was associated with shallow disking (to 12 cm depth), while the plots with the subsoiling and subsoiling + straw treatments at the Swedish SS were subjected to the same conventional tillage as for the control plots (i.e., mouldboard ploughing to 25 cm depth and normal seedbed preparations). The hypothesis for the Swedish SS, which is naturally compacted, was that the incorporation of organic material, in addition to subsoiling alone, would stimulate biological activity and lead to the stabilisation of the soil structure at a lower density, enabling roots to grow deeper. The results show a positive impact on root growth and rooting depth, particularly for the subsoiling + straw treatment, and partly confirm this hypothesis. However, when corrected for gravel and stones, there was no significant effect on the BD (Supplementary Materials, Table S4). The subsoiling treatment at the Romanian SS was aimed at counteracting the natural compaction and preventing the formation of a plough pan layer. At this site, both the topsoil and subsoil BD were significantly improved with subsoiling, as also reflected in the SC indices, and subsoiling had a positive effect on the topsoil WSA and Ks (Figure 5 and Supplementary Materials, Figure S4).
A stronger response to subsoiling at the Romanian SS compared to the Swedish SS was probably related to the frequency of subsoiling. It occurred only once in Sweden, whereas it was repeated every year during the Romanian experiment. However, it may also relate to the clay, silt, and SOC, as discussed in a meta-analysis by Schneider et al. [89]. They suggested that for many soils with a clay-to-silt ratio of <0.3, subsoiling might result in a complete collapse of the natural soil structure and SC instead of loosening, while for soils with a clay content of ˃20%, subsoiling may have a better possibility of lowering the BD and increasing the macro-porosity. The clay content was twice as high at the Romanian SS as at the Swedish site and the clay-to-silt ratio was 1.5, while this ratio was 0.34 in the Swedish subsoil. In fact, the response to the SICSs was faster at the UK and Romanian SSs compared to those in Italy and Sweden. This may be related to the high clay contents at the former sites (31 and 44%, respectively), which were much lower at the latter SSs (18 and 10%, respectively). Furthermore, high silt (58%) and sand (63%) contents characterise the Italian and Swedish SSs, and these inherent soil properties may partly explain the lower responsiveness to SICSs. The dynamics also differ between the topsoil and the subsoil; the former is more often subject to external factors (e.g., meteorological conditions), while the latter mostly follows natural dynamics (e.g., pedofauna activity). The results from the Italian SS agree with this reasoning, as there was a relationship between the PR (as an index of soil strength) and the fine silt + clay particles (0–20 µm), relating to the SOC protection against microbial degradation [96] only in the subsoil (p < 0.01 and 0.65 R2) and not in the topsoil (Figure 10). In this subsoil, a 10% increase in soil fines reflected a PR reduction of 0.6 MPa among the studied range.
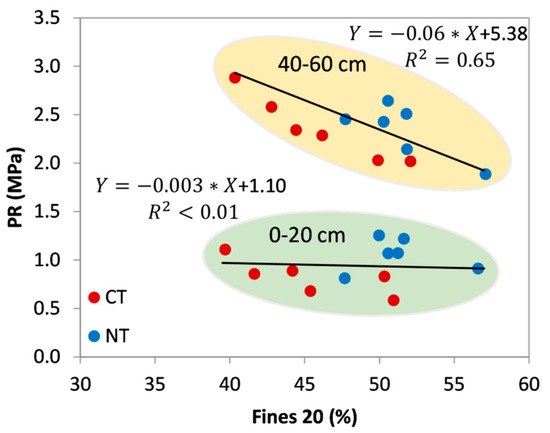
Figure 10.
Scatterplot of fines 20 (% of particles below 20 µm) against penetration resistance (PR) at the Italian study site. Linear interpolation equations and their coefficient of determination (R2) are also indicated for topsoil (0–20 cm) and subsoil (40–60 cm).
3.8. Soil Compaction and SICS with Deep-Rooted Bio-Drilling Crops
Another possibility for mitigating SC at deeper horizons or under no-tillage management is the adoption of deep-rooted crops, which may be either cash (e.g., alfalfa) or cover crops (e.g., tillage radish, mustard). Two SSs tested the effect of crops with a taproot apparatus—Norway (oilseed and alfalfa) and Italy (tillage radish).
Despite a relatively low machinery weight, multiple wheeling in 2015 led to subsoil compaction at the Norwegian SS [56], with increased BD and decreased TPV compared to the uncompacted reference plot (Table 2). In the topsoil, the presence of alfalfa (plots not ploughed) shows comparable results to Treatment 3 (barley monoculture), which was ploughed each year (Supplementary Materials, Table S3), suggesting that the alfalfa was equally effective at loosening the topsoil compared to ploughing. In 2015, the BD in the subsoil often exceeded 1.5–1.6 g cm−3, which represents a threshold for root growth [97]. All subsoil BD observations in 2015 were classified as “very compact” according to Pagliai et al. [98], while in 2020, all values could be classified as “compact”, suggesting that the SC mitigation occurred during the five years after the compaction event. In particular, this was evident in Treatment 4 (alfalfa), where the Ks was improved compared to 2015. More specifically, the subsoil Ks under the alfalfa treatment was frequently higher than the proposed limit for good soil functioning (e.g., 0.10 m day−1) [22]. On the contrary, the same Ks threshold was undercut for all the other plots except for Treatment 2 in the compacted plots, confirming how subsoil compaction may be long-lasting [99]. Alfalfa was efficient at reducing the subsoil BD and restoring the TPV in the compacted plots, which were on the same level in 2020 as the uncompacted reference plot in 2015. These results are similar to other studies (e.g., [24,100]), showing that alfalfa, especially if grown over several years, is efficient for restoring soil structure. Effects on other parameters, such as air permeability and water infiltration, were less clear due to both higher data variability and a methodological issue. In fact, during the sampling operations, the alfalfa was still growing, and the living roots blocked the bio-pores (data not shown). Consequently, positive effects on the soil structure (e.g., improvements in AC and water and airflow) might be more recognisable over time, after the roots have decomposed [101].
Furthermore, oilseed crops are known to have deep-growing taproots that efficiently loosen up the soil structure [29], but contrary to that observed for alfalfa, the oilseed established only poorly at the Norwegian SS mostly due to a short growing season at this high latitude. Therefore, the root system was not well established, and this crop was not effective at loosening the soil or mitigating SC.
At the Italian SS, using the deep-rooted tillage radish cover crop during the winter season was not reflected in soil improvements, either in terms of SC mitigation (e.g., BD, DC, and RND) or in terms of soil functioning (e.g., Ks). Only the PR test suggested a trend for higher soil strength in changing from bare to covered soil (Figure 4a). As mentioned for Norway, a methodological issue might have impaired the results for the tillage radish crop in Italy due to incomplete taproot decomposition during sampling since it was necessary to take measurements for the PR and Ks prior to the following field operations (i.e., in early spring before tillage and seedbed preparation for the main crop, maize). The higher temperature during the subsequent maize growing season may have promoted complete root degradation and, in turn, fostered improved soil functioning. Indeed, in higher density soils, the presence of a few vertical macro-pores may dominate structure dynamics and soil functions (e.g., water infiltration and gas exchange) [94,102] and possibly counteract the negative effects of increased BD and soil strength. Moreover, the bio-macro-pores left by tillage radish provide low resistance paths for the subsequent cash crop roots [103]. Bio-drilling with cover crops was previously demonstrated to be more effective for topsoil under no-tillage management than with conventional tillage because bio-pores can persist and function for a longer time without tillage [104]. Nevertheless, in subsoil below the tillage depth, root-derived bio-pores might also persist even if shallower tillage occurred.
Beyond its correlation with compaction, the overall impact of bio-drilling on cash crop yields varies with climate conditions [29], improving crop performances under highly rainy climates (e.g., tropical) [105] and reducing yields in semiarid environments [106]. The response of crop yields to bio-drilling might also be dependent on the number of years since its first adoption [29]. The first year of bio-drilling adoption may not result in a boosted crop yield, while after several years, a more positive effect can be expected [107,108]. Finally, bio-drilling crops may contribute to SOC formation by providing more above- and belowground C inputs to the soil, in addition to the crop residues from the main crop [109]. Particularly because they have an important and deep root system, and compared to aboveground biomass, root-derived C is about twice as efficient in the C input conversion into stable SOC. However, changes in the SOC occur slowly and become measurable only after longer periods (˃5 to 10 years) [110,111].
4. Future Prospects and Conclusions
Strategies to avoid SC, stabilise soil structure, and loosen up compacted layers are clearly needed. Many conventional tillage practices are effective in loosening topsoil SC, but measures to counteract subsoil SC are scarce [22]. The use of deep-rooted bio-drilling cash and cover crops showed potential for being applicable in European countries. At the Norwegian SS, a cash crop such as alfalfa had good potential for mitigating both topsoil and subsoil SC. However, in using a cover crop such as tillage radish, the Italian SS did not obtain the expected positive outcome for SC. Both SSs experienced methodological difficulties in evaluating the effectiveness of these mitigating strategies. For practical reasons, some measurements could not be conducted at the optimum time and the presence of actively growing bio-drilling crop roots hampered the evaluation of water infiltration and hydraulic conductivity. Further studies are needed for investigating and identifying suitable crop varieties, as shown at the Norwegian SS, where it was difficult to establish the oilseed bio-drilling crop because of a short growing season at this high latitude. This highlights the need for optimising the management and crop growth of bio-drilling species for different pedoclimatic conditions. There is also a need for policymakers to address the economical dimension, as farmers need financial support for adopting deep-rooted bio-drilling cash or cover crops. For example, alfalfa involves low production costs, but it is difficult to find a profitable market, and all types of relevant cover crops are not necessarily covered by current subsidies.
The two case studies with SICSs involving subsoiling were found to be efficient for improving both SC and crop yields only at the Romanian SS. However, it was also found that applying subsoiling every year was time and energy consuming, and the financial benefit for farmers is questionable. There is a need for further evaluating if the subsoiling at this SS could be done only periodically, such as every 3 or 4 years. At the Swedish SS, subsoiling was only done once and using pilot-scale equipment that is still under development. Although there was an improved rooting depth with subsoiling, and a lowering of the PR with the subsoiling treatment with the incorporation of organic material into the upper subsoil, there was no significant effect on crop production. There is a need for long-time studies with this equipment on other crop and soil types, to test other sources of organic materials and, in particular, to examine the effects of repeated subsoiling treatments over time.
The responsiveness of the SICSs investigated in these case studies appeared to be at least partially influenced by inherent soil properties, such as texture, as illustrated by the different responses to no-tillage observed at the UK and Italian SSs. The effect of climate was not evaluated directly since exactly the same SICS was not present at a sufficiently large number of SSs. However, the effect of climate is not negligible. Furthermore, the effect of future climate change might vary between European regions. In northern Europe, greater precipitation is expected during the growing season [12,82], which will lead to a reduction in workable days for field operations [20,112]. The use of heavy machinery under future sub-optimal conditions may further increase the risk for SC, especially in the subsoil [15]. Soil compaction may reduce water infiltration [6,113], which may shorten the growing season and thereby increase the risk of leaching and erosion [9,10,11]. It is also expected that wetter growing seasons might give greater yield reductions due to subsoil compaction than the drier seasons [114].
In southern Europe, a higher frequency of dry days during the growing season is predicted [82]. Since compacted soil may suffer from poor rooting conditions during drought [114], this could increase the demand for freshwater for irrigation [115]. Deep tillage can be an effective measure to mitigate drought stress and improve the resilience of crops under climate change scenarios in soils by creating a more stable soil structure and alleviating root-restricting layers [89].
The case studies on different SICSs for mitigating SC showed encouraging results as well as several difficulties relating to their implementation and evaluation. Some were pilot studies and need more technical development, and all were short-term studies. More research is needed to refine these SICSs and evaluate their long-term effects at more SSs covering a wider range of pedoclimatic conditions.
Supplementary Materials
The following are available online at www.mdpi.com/article/10.3390/land11020223/s1, Table S1: study sites description, Table S2: sampling depth, Table S3: topsoil results at the Norwegian study site, Table S4: results at the Swedish study site, Table S5: statistics at the Italian study site, Figure S1: relationship between soil organic carbon and dry soil bulk density at the Swedish study site Figure S2: saturated hydraulic conductivity at the Italian study site, Figure S3: bulk density at the Romanian study site, Figure S4: water-stable aggregates and saturated hydraulic conductivity by treatment at the Romanian study site, Figure S5: water-stable aggregates and saturated hydraulic conductivity by year at the Romanian study site.
Author Contributions
Conceptualization, I.P. and M.A.B.; formal analysis, I.P., T.S., J.B., O.V., I.C., A.B., G.B., H.K., T.K., F.S., C.S., F.C. and M.A.B.; investigation, I.P., T.S., J.B., O.V., I.C., A.B., G.B., H.K., T.K., F.S., C.S., F.C. and M.A.B.; data curation, I.P., T.S., J.B., O.V., I.C., A.B., G.B., H.K., T.K., F.S., C.S., F.C. and M.A.B.; writing—original draft preparation, I.P. and M.A.B.; writing—review and editing, I.P., T.S., J.B., O.V., I.C., A.B., G.B., H.K., T.K., F.S., C.S., F.C., I.S.P., A.A. and M.A.B. All authors have read and agreed to the published version of the manuscript.
Funding
The research leading to these results received funding from the European Union HORIZON2020 Programme for Research, Technological Development, and Demonstration under grant agreement No. 677407 (SOILCARE Project). Martin A. Bolinder also received financial support provided by the Swedish Farmers’ Foundation for Agricultural Research, grant number O-18-23-141.
Institutional Review Board Statement
Not applicable.
Informed Consent Statement
Not applicable.
Data Availability Statement
The data that support the findings of this study are available from the corresponding author upon reasonable request.
Acknowledgments
Sølve Stiauren, Norwegian Agricultural Extension Service (NLR Øst), Kirkenær Norway took care of all the Norwegian practical fieldwork (except soil sampling) in the research field. The Italian study site wishes to acknowledge Riccardo Polese for his contribution to the field experiment. We wish to thank T. Ingelsson (farmer and consultant) for his contribution in adapting the subsoiling equipment used for the Swedish SS, and the Swedish Rural Economy and Agricultural Society for their help in managing the experiment. We acknowledge the technical and administrative personnel, and the many work package members and stakeholders for their efforts and insights. In particular, we thank Rudi Hessel (coordinator) for his leadership throughout the SoilCare project. More information on other SSs and SICSs, methodologies, and fact sheets as well as on other aspects, such as socio-cultural and economic dimensions, can be found at https://www.soilcare-project.eu, last accessed on 1 January 2022.
Conflicts of Interest
The authors declare no conflict of interest.
References
- Jones, A.; Panagos, P.; Barcelo, S.; Bouraoui, F.; Bosco, C.; Dewitte, O.; Gardi, C.; Hervás, J.; Hiederer, R.; Jeffery, S.; et al. The State of Soil in Europe: A Contribution of the JRC to the European Environment Agency’s Environment State and Outlook Report—SOER 2010; Europeran Union: Luxembourg, 2012. [Google Scholar]
- Crescimanno, G.; Lane, M.; Owens, P.; Rydel, B.; Jacobsen, O.; Düwel, O.; Böken, H.; Berényi Üveges, J.; Castillo, V.; Imeson, A. Final Report, Working Group on Soil Erosion, Task Group 5: Links with Organic Matter and Contamination Working Group and Secondary Soil Threats; European Commission: Brussels, Belgium, 2004. [Google Scholar]
- Van Camp, L.; Bujarrabal, B.; Gentile, A.; Jones, R.J.A.; Montanarella, L.; Olazábal, C.; Selvaradjou, S. Reports of the Technical Working Groups Established under the Thematic Strategy for Soil Protection. Vol. IV: Contamination and Land Management; Office for Official Publications of the European Communities: Luxembourg, 2004. [Google Scholar]
- Lipiec, J.; Hatano, R. Quantification of compaction effects on soil physical properties and crop growth. Geoderma 2003, 116, 107–136. [Google Scholar] [CrossRef]
- Lipiec, J.; Simota, C. Role of soil and climate factors in influencing crop responses to soil compaction in Central and Eastern Europe. Dev. Agric. Eng. 1994, 11, 365–390. [Google Scholar]
- Arvidsson, J.; Håkansson, I. Response of different crops to soil compaction-Short-term effects in Swedish field experiments. Soil Tillage Res. 2014, 138, 56–63. [Google Scholar] [CrossRef]
- Horn, R.; Fleige, H. Risk assessment of subsoil compaction for arable soils in Northwest Germany at farm scale. Soil Tillage Res. 2009, 102, 201–208. [Google Scholar] [CrossRef]
- Håkansson, I. A method for characterizing the state of compactness of the plough layer. Soil Tillage Res. 1990, 16, 105–120. [Google Scholar] [CrossRef]
- Hartmann, P.; Zink, A.; Fleige, H.; Horn, R. Effect of compaction, tillage and climate change on soil water balance of Arable Luvisols in Northwest Germany. Soil Tillage Res. 2012, 124, 211–218. [Google Scholar] [CrossRef]
- Keller, T.; Sandin, M.; Colombi, T.; Horn, R.; Or, D. Historical increase in agricultural machinery weights enhanced soil stress levels and adversely affected soil functioning. Soil Tillage Res. 2019, 194, 104293. [Google Scholar] [CrossRef]
- Rogger, M.; Agnoletti, M.; Alaoui, A.; Bathurst, J.C.; Bodner, G.; Borga, M.; Chaplot, V.; Gallart, F.; Glatzel, G.; Hall, J.; et al. Land use change impacts on floods at the catchment scale: Challenges and opportunities for future research. Water Resour. Res. 2017, 53, 5209–5219. [Google Scholar] [CrossRef] [Green Version]
- Olesen, J.E.; Bindi, M. Consequences of climate change for European agricultural productivity, land use and policy. Eur. J. Agron. 2002, 16, 239–262. [Google Scholar] [CrossRef]
- Colombi, T.; Keller, T. Developing strategies to recover crop productivity after soil compaction—A plant eco-physiological perspective. Soil Tillage Res. 2019, 191, 156–161. [Google Scholar] [CrossRef]
- Graves, A.R.; Morris, J.; Deeks, L.K.; Rickson, R.J.; Kibblewhite, M.G.; Harris, J.A.; Farewell, T.S.; Truckle, I. The total costs of soil degradation in England and Wales. Ecol. Econ. 2015, 119, 399–413. [Google Scholar] [CrossRef]
- Batey, T. Soil compaction and soil management—A review. Soil Use Manag. 2009, 25, 335–345. [Google Scholar] [CrossRef]
- Berisso, F.E.; Schjønning, P.; Keller, T.; Lamandé, M.; Etana, A.; De Jonge, L.W.; Iversen, B.V.; Arvidsson, J.; Forkman, J. Persistent effects of subsoil compaction on pore size distribution and gas transport in a loamy soil. Soil Tillage Res. 2012, 122, 42–51. [Google Scholar] [CrossRef]
- Schjønning, P.; Lamandé, M.; Berisso, F.E.; Simojoki, A.; Alakukku, L.; Andreasen, R.R. Gas Diffusion, non-Darcy air permeability, and computed tomography images of a clay subsoil affected by compaction. Soil Sci. Soc. Am. J. 2013, 77, 1977. [Google Scholar] [CrossRef]
- Ruser, R.; Flessa, H.; Russow, R.; Schmidt, G.; Buegger, F.; Munch, J.C. Emission of N2O, N2 and CO2 from soil fertilized with nitrate: Effect of compaction, soil moisture and rewetting. Soil Biol. Biochem. 2006, 38, 263–274. [Google Scholar] [CrossRef]
- Bamgbopa, O.S. Investigation of shrinkage and cracking in clay soils under wetting and drying cycles. Int. J. Eng. Res. Technol. 2016, 5, 283–320. [Google Scholar]
- Seehusen, T.; Mordhorst, A.; Riggert, R.; Fleige, H.; Horn, R.; Riley, H. Subsoil compaction of a clay soil in South-East Norway and its amelioration after 5 years. Int. Agrophys. 2021, 35, 145–157. [Google Scholar] [CrossRef]
- Horn, R.; Domzzał, H.; Słowińska-Jurkiewicz, A.; van Ouwerkerk, C. Soil compaction processes and their effects on the structure of arable soils and the environment. Soil Tillage Res. 1995, 35, 23–36. [Google Scholar] [CrossRef]
- Lebert, M.; Böken, H.; Glante, F. Soil compaction—Indicators for the assessment of harmful changes to the soil in the context of the German Federal Soil Protection Act. J. Environ. Manag. 2007, 82, 388–397. [Google Scholar] [CrossRef]
- Löfkvist, J.; Whalley, W.R.; Clark, L.J. A rapid screening method for good root-penetration ability: Comparison of species with very different root morphology. Acta Agric. Scand. Sect. B-Soil Plant 2007, 55, 120–124. [Google Scholar] [CrossRef]
- Uteau, D.; Pagenkemper, S.K.; Peth, S.; Horn, R. Root and time dependent soil structure formation and its influence on gas transport in the subsoil. Soil Tillage Res. 2013, 132, 69–76. [Google Scholar] [CrossRef]
- Colombi, T.; Braun, S.; Keller, T.; Walter, A. Artificial macropores attract crop roots and enhance plant productivity on compacted soils. Sci. Total Environ. 2017, 574, 1283–1293. [Google Scholar] [CrossRef] [Green Version]
- Kautz, T.; Lüsebrink, M.; Pätzold, S.; Vetterlein, D.; Pude, R.; Athmann, M.; Küpper, P.M.; Perkons, U.; Köpke, U. Contribution of anecic earthworms to biopore formation during cultivation of perennial ley crops. Pedobiologia 2014, 57, 47–52. [Google Scholar] [CrossRef]
- Cresswell, H.P.; Kirkegaard, J.A. Subsoil amelioration by plant-roots—The process and the evidence. Soil Res. 1995, 33, 221–239. [Google Scholar] [CrossRef]
- Chen, G.; Weil, R.R. Penetration of cover crop roots through compacted soils. Plant Soil 2010, 331, 31–43. [Google Scholar] [CrossRef]
- Zhang, Z.; Peng, X. Bio-tillage: A new perspective for sustainable agriculture. Soil Tillage Res. 2021, 206, 104844. [Google Scholar] [CrossRef]
- Abadi Ghadim, A.; Kingwell, R.; Pannell, D. An economic evaluation of deep tillage to reduce soil compaction on crop-livestock farms in Western Australia. Agric. Syst. 1991, 37, 291–307. [Google Scholar] [CrossRef]
- Díaz-Zorita, M. Effect of deep-tillage and nitrogen fertilization interactions on dryland corn (Zea mays L.) productivity. Soil Tillage Res. 2000, 54, 11–19. [Google Scholar] [CrossRef]
- Varsa, E.G.; Chong, S.K.; Abolaji, J.O.; Farquhar, D.A.; Olsen, F.J. Effect of deep tillage on soil physical characteristics and corn (Zea mays L.) root growth and production. Soil Tillage Res. 1997, 43, 219–228. [Google Scholar] [CrossRef]
- Raper, R.L.; Bergtold, J.S. In-row subsoiling: A review and suggestions for reducing cost of this conservation tillage operation. Appl. Eng. Agric. 2007, 23, 463–471. [Google Scholar] [CrossRef]
- Getahun, G.T.; Kätterer, T.; Munkholm, L.J.; Parvage, M.M.; Keller, T.; Rychel, K.; Kirchmann, H. Short-term effects of loosening and incorporation of straw slurry into the upper subsoil on soil physical properties and crop yield. Soil Tillage Res. 2018, 184, 62–67. [Google Scholar] [CrossRef]
- Hamza, M.A.; Anderson, W.K. Responses of soil properties and grain yields to deep ripping and gypsum application in a compacted loamy sand soil contrasted with a sandy clay loam soil in Western Australia. Aust. J. Agric. Res. 2003, 54, 273–282. [Google Scholar] [CrossRef]
- Adcock, D.; McNeill, A.M.; McDonald, G.K.; Armstrong, R.D.; Adcock, D.; McNeill, A.M.; McDonald, G.K.; Armstrong, R.D. Subsoil constraints to crop production on neutral and alkaline soils in south-eastern Australia: A review of current knowledge and management strategies. Aust. J. Exp. Agric. 2007, 47, 1245–1261. [Google Scholar] [CrossRef]
- Jakobs, I.; Schmittmann, O.; Schulze Lammers, P. Short-term effects of in-row subsoiling and simultaneous admixing of organic material on growth of spring barley (H. vulgare). Soil Use Manag. 2017, 33, 620–630. [Google Scholar] [CrossRef]
- Soane, G.C.; Godwin, R.J.; Marks, M.; Spoor, G. Crop and soil response to subsoil loosening, deep incorporation of phosphorus and potassium fertilizer and subsequent soil management on a range of soil types: Part 2: Soil structural conditions. Soil Use Manag. 1987, 3, 123–130. [Google Scholar] [CrossRef]
- Schulte-Karring, H.; Haubold-Rosar, M. Subsoiling and deep fertilizing with new technique as a measure of soil conservation in ag agriculture, viniculture and forestry. Soil Technol. 1993, 6, 225–237. [Google Scholar] [CrossRef]
- Larney, F.J.; Fortune, R.A. Recompaction effects of mouldboard ploughing and seedbed cultivations on four deep loosened soils. Soil Tillage Res. 1986, 8, 77–87. [Google Scholar] [CrossRef]
- Johnson, B.S.; Erickson, A.E.; Voorhees, W.B. Physical conditions of a lake plain soil as affected by deep tillage and wheel traffic. Soil Sci. Soc. Am. J. 1989, 53, 1545–1551. [Google Scholar] [CrossRef]
- Håkansson, I.; Grath, T.; Olsen, H. Influence of machinery traffic in Swedish farm fields on penetration resistance in the subsoil. Swedish J. Agric. Res. 1996, 26, 181–187. [Google Scholar]
- Gill, J.S.; Clark, G.J.; Sale, P.W.; Peries, R.R.; Tang, C. Deep placement of organic amendments in dense sodic subsoil increases summer fallow efficiency and the use of deep soil water by crops. Plant Soil 2012, 359, 57–69. [Google Scholar] [CrossRef]
- Gill, J.S.; Sale, P.W.G.; Peries, R.R.; Tang, C. Changes in soil physical properties and crop root growth in dense sodic subsoil following incorporation of organic amendments. Field Crop. Res. 2009, 114, 137–146. [Google Scholar] [CrossRef]
- Huber, S.; Prokop, G.; Arrouays, D.; Banko, G.; Bispo, A.; Jones, R.J.A.; Kibblewhite, M.G.; Lexer, W.; Möller, A.; Rickson, R.J.; et al. Environmental Assessment of Soil for Monitoring: Volume I Indicators and Criteria; OPOCE: Luxembourg, 2008; ISBN 9789279097089. [Google Scholar]
- Colombi, T.; Herrmann, A.M.; Vallenback, P.; Keller, T. Cortical cell diameter is key to energy costs of root growth in wheat. Plant Physiol. 2019, 180, 2049–2060. [Google Scholar] [CrossRef] [PubMed] [Green Version]
- Blanchar, R.W.; Edmonds, C.R.; Bradford, J.M. Root growth in cores formed from fragipan and B2 horizons of hobson soil. Soil Sci. Soc. Am. J. 1978, 42, 437–440. [Google Scholar] [CrossRef]
- Cockroft, B.; Barley, K.; Greacen, E. The penetration of clays by fine probes and root tips. Soil Res. 1969, 7, 333–348. [Google Scholar] [CrossRef]
- de Moraes, M.T.; Debiasi, H.; Carlesso, R.; Franchini, J.C.; da Silva, V.R. Critical limits of soil penetration resistance in a rhodic Eutrudox. Rev. Bras. Ciência Do Solo 2014, 38, 288–298. [Google Scholar] [CrossRef] [Green Version]
- Ehlers, W.; Köpke, U.; Hesse, F.; Böhm, W. Penetration resistance and root growth of oats in tilled and untilled loess soil. Soil Tillage Res. 1983, 3, 261–275. [Google Scholar] [CrossRef]
- Imhoff, S.; Kay, B.D.; da Silva, A.P.; Hajabbasi, M.A. Evaluating responses of maize (Zea mays L.) to soil physical conditions using a boundary line approach. Soil Tillage Res. 2010, 106, 303–310. [Google Scholar] [CrossRef]
- Kay, B.D.; Hajabbasi, M.A.; Ying, J.; Tollenaar, M. Optimum versus non-limiting water contents for root growth, biomass accumulation, gas exchange and the rate of development of maize (Zea mays L.). Soil Tillage Res. 2006, 8, 42–54. [Google Scholar] [CrossRef]
- Taylor, H.M.; Roberson, G.M.; Parker, J.J. Soil strength-root penetration relations for medium- to coarse-textured soil materials. Soil Sci. 1966, 102, 18–22. [Google Scholar] [CrossRef]
- Groenevelt, P.H.; Grant, C.D.; Semetsa, S. A new procedure to determine soil water availability. Aust. J. Soil Res. 2001, 39, 577–598. [Google Scholar] [CrossRef]
- Piccoli, I.; Lazzaro, B.; Furlan, L.; Berti, A.; Morari, F. Examining crop root apparatus traits in a maize-soybean-winter wheat rotation under conservation agriculture management. Eur. J. Agron. 2021, 122, 126171. [Google Scholar] [CrossRef]
- Seehusen, T.; Riggert, R.; Fleige, H.; Horn, R.; Riley, H. Soil compaction and stress propagation after different wheeling intensities on a silt soil in South-East Norway. Acta Agric. Scand. Sect. B Soil Plant Sci. 2019, 69, 343–355. [Google Scholar] [CrossRef]
- Riley, H. Estimation of physical properties of cultivated soils in south east Norway from readily available information, no. 25. Norw. J. Agric. Sci. 1996, 25–51. [Google Scholar]
- Green, R.D.; Fordham, S.J. A Field Method for Determining Air Permeability in Soil; Ministry of Agriculture, Fisheries and Food: London, UK, 1975.
- Hartge, K.H. Saturated hydraulic conductivity measurement at soil core samples and its evaluation. Soil Technol. 1993, 6, 115–121. [Google Scholar]
- Seehusen, T.; Børresen, T.; Rostad, B.I.; Fleige, H.; Zink, A.; Riley, H. Verification of traffic-induced soil compaction after long-term ploughing and 10 years minimum tillage on clay loam soil in South-East Norway. Acta Agric. Scand. Sect. B 2014, 64, 312–328. [Google Scholar] [CrossRef]
- Carlgren, K.; Mattsson, L. Swedish soil fertility experiments. Acta Agric. Scand. Sect. B Soil Plant Sci. 2001, 51, 49–76. [Google Scholar] [CrossRef]
- Kirchmann, H.; Eriksson, J. Properties and Classification of Soils of the Swedish Long-Term Fertility Experiments II. Sites at Örja and Orup. Acta Agric. Scand. Sect. B Soil Plant Sci. 1993, 43, 193–205. [Google Scholar] [CrossRef]
- Grossman, R.B.; Reinsch, T.G. 2.1 Bulk density and linear extensibility. In Methods of Soil Analysis: Part 4 Physical Methods; Dane, J.H., Topp, C.G., Eds.; Soil Science Society of America: Madison, WI, USA, 2002; pp. 201–228. [Google Scholar]
- Bittelli, M.; Andrenelli, M.C.; Simonetti, G.; Pellegrini, S.; Artioli, G.; Piccoli, I.; Morari, F. Shall we abandon sedimentation methods for particle size analysis in soils? Soil Tillage Res. 2019, 185, 36–46. [Google Scholar] [CrossRef]
- Parr, J.F.; Bertrand, A.R. Water infiltration into soils. Adv. Agron. 1960, 12, 311–363. [Google Scholar]
- Philip, J.R. The theory of infiltration: 4. Sorptivity and algebraic infiltration equations. Soil Sci. 1957, 84, 257–264. [Google Scholar] [CrossRef]
- Keller, T.; Håkansson, I. Estimation of reference bulk density from soil particle size distribution and soil organic matter content. Geoderma 2010, 154, 398–406. [Google Scholar] [CrossRef]
- van den Akker, J.J.H.; Hoogland, T. Comparison of risk assessment methods to determine the subsoil compaction risk of agricultural soils in the Netherlands. Soil Tillage Res. 2011, 114, 146–154. [Google Scholar] [CrossRef]
- Poeplau, C.; Reiter, L.; Berti, A.; Kätterer, T. Qualitative and quantitative response of soil organic carbon to 40 years of crop residue incorporation under contrasting nitrogen fertilisation regimes. Soil Res. 2017, 55, 1–9. [Google Scholar] [CrossRef] [Green Version]
- Arvidsson, J.; Håkansson, I. A model for estimating crop yield losses caused by soil compaction. Soil Tillage Res. 1991, 20, 319–332. [Google Scholar] [CrossRef]
- Munkholm, L.J.; Hansen, E.M.; Olesen, J.E. The effect of tillage intensity on soil structure and winter wheat root/shoot growth. Soil Use Manag. 2008, 24, 392–400. [Google Scholar] [CrossRef]
- Whiteley, G.M.; Dexter, A.R. The behaviour of roots encountering cracks in soil. Plant Soil 1984, 77, 141–149. [Google Scholar] [CrossRef]
- Van Noordwijk, M.; Kooistra, M.J.; Boone, F.R.; Veen, B.W.; Schoonderbeek, D. Root-soil contact of maize, as measured by a thin-section technique—I. Validity of the method. Plant Soil 1992, 139, 109–118. [Google Scholar] [CrossRef]
- Lipiec, J.; Håkansson, I. Influences of degree of compactness and matric water tension on some important plant growth factors. Soil Tillage Res. 2000, 53, 87–94. [Google Scholar] [CrossRef]
- McKenzie, B.M.; Bengough, A.G.; Hallett, P.D.; Thomas, W.T.B.; Forster, B.; McNicol, J.W. Deep rooting and drought screening of cereal crops: A novel field-based method and its application. Field Crop. Res. 2009, 54, 165–171. [Google Scholar] [CrossRef]
- Hirth, J.R.; McKenzie, B.M.; Tisdall, J.M. Ability of seedling roots of Lolium perenne L. to penetrate soil from artificial biopores is modified by soil bulk density, biopore angle and biopore relief. Plant Soil 2005, 272, 327–336. [Google Scholar] [CrossRef]
- Håkansson, I.; Lipiec, J. A review of the usefulness of relative bulk density values in studies of soil structure and compaction. Soil Tillage Res. 2000, 53, 71–85. [Google Scholar] [CrossRef]
- Lamandé, M.; Schjønning, P. Transmission of vertical stress in a real soil profile. Part I: Site description, evaluation of the Söhne model, and the effect of topsoil tillage. Soil Tillage Res. 2011, 114, 57–70. [Google Scholar] [CrossRef]
- Schjønning, P.; Thomsen, I.K. Shallow tillage effects on soil properties for temperate-region hard-setting soils. Soil Tillage Res. 2013, 132, 12–20. [Google Scholar] [CrossRef]
- Romero-Ruiz, A.; Linde, N.; Baron, L.; Solazzi, S.G.; Keller, T.; Or, D. Seismic signatures reveal persistence of soil compaction. Vadose Zone J. 2021, 20, e20140. [Google Scholar] [CrossRef]
- Piccoli, I.; Furlan, L.; Lazzaro, B.; Morari, F. Examining conservation agriculture soil profiles: Outcomes from northeastern Italian silty soils combining indirect geophysical and direct assessment methods. Eur. J. Soil Sci. 2020, 71, 1064–1075. [Google Scholar] [CrossRef]
- Schjønning, P.; van den Akker, J.J.H.; Keller, T.; Greve, M.H.; Lamandé, M.; Simojoki, A.; Stettler, M.; Arvidsson, J.; Breuning-Madsen, H. Driver-Pressure-State-Impact-Response (DPSIR) analysis and risk assessment for soil compaction-A European perspective. Adv. Agron. 2015, 133, 183–237. [Google Scholar]
- Chamen, T.; Alakukku, L.; Pires, S.; Sommer, C.; Spoor, G.; Tijink, F.; Weisskopf, P. Prevention strategies for field traffic-induced subsoil compaction: A review: Part 2. Equipment and field practices. Soil Tillage Res. 2003, 73, 161–174. [Google Scholar] [CrossRef]
- Barzegar, A.R.; Hashemi, A.M.; Herbert, S.J.; Asoodar, M.A. Interactive effects of tillage system and soil water content on aggregate size distribution for seedbed preparation in Fluvisols in southwest Iran. Soil Tillage Res. 2004, 78, 45–52. [Google Scholar] [CrossRef]
- Pirmoradian, N.; Sepaskhah, A.R.; Hajabbasi, M.A. Application of fractal theory to quantify soil aggregate stability as influenced by tillage treatments. Biosyst. Eng. 2005, 90, 227–234. [Google Scholar] [CrossRef]
- Alcántara, V.; Don, A.; Well, R.; Nieder, R. Deep ploughing increases agricultural soil organic matter stocks. Glob. Chang. Biol. 2016, 22, 2939–2956. [Google Scholar] [CrossRef]
- Soane, B.D.; Ball, B.C.; Arvidsson, J.; Basch, G.; Moreno, F.; Roger-Estrade, J. No-till in northern, western and south-western Europe: A review of problems and opportunities for crop production and the environment. Soil Tillage Res. 2012, 118, 66–87. [Google Scholar] [CrossRef] [Green Version]
- Sartori, F.; Piccoli, I.; Polese, R.; Berti, A. A multivariate approach to evaluate reduced tillage systems and cover crop sustainability. Land 2021, 11, 55. [Google Scholar] [CrossRef]
- Schneider, F.; Don, A.; Hennings, I.; Schmittmann, O.; Seidel, S.J. The effect of deep tillage on crop yield—What do we really know? Soil Tillage Res. 2017, 174, 193–204. [Google Scholar] [CrossRef]
- Verhulst, N.; Govaerts, B.; Verachtert, E.; Mezzalama, M.; Wall, P.C.; Chocobar, A.; Deckers, J.; Sayre, K.D. Conservation agriculture, improving soil quality for sustainable production systems? In Advances in Soil Science: Food Security and Soil Quality; CRC Press: Boca Raton, FL, USA, 2010; pp. 137–208. ISBN 139781439800584. [Google Scholar]
- Derpsch, R. No-tillage and conservation agriculture: A progress report. In No-Till Farming Systems; Goddard, T., Zoebisch, M.A., Gan, Y.T., Ellis, W., Watson, A., Sombatpanit, S., Eds.; World Association of Soil and Water Conservation: Bangkok, Thailand, 2008; pp. 7–39. ISBN 9789748391601. [Google Scholar]
- Six, J.; Ogle, S.M.; Breidt, F.J.; Conant, R.T.; Mosiers, A.R.; Paustian, K. The potential to mitigate global warming with no-tillage management is only realized when practised in the long term. Glob. Chang. Biol. 2004, 10, 155–160. [Google Scholar] [CrossRef] [Green Version]
- Dal Ferro, N.; Cocco, E.; Lazzaro, B.; Berti, A.; Morari, F. Assessing the role of agri-environmental measures to enhance the environment in the Veneto Region, Italy, with a model-based approach. Agric. Ecosyst. Environ. 2016, 232, 312–325. [Google Scholar] [CrossRef]
- Piccoli, I.; Schjønning, P.; Lamandé, M.; Furlan, L.; Morari, F. Challenges of conservation agriculture practices on silty soils. Effects on soil pore and gas transport characteristics in North-eastern Italy. Soil Tillage Res. 2017, 172, 12–21. [Google Scholar] [CrossRef]
- Alaoui, A.; Lipiec, J.; Gerke, H.H. A review of the changes in the soil pore system due to soil deformation: A hydrodynamic perspective. Soil Tillage Res. 2011, 115–116, 1–15. [Google Scholar] [CrossRef]
- Hassink, J. The capacity of soils to preserve organic C and N by their association with clay and silt particles. Plant Soil 1997, 191, 77–87. [Google Scholar] [CrossRef]
- Entrup, N.L.; Oehmchen, J. Lehrbuch des Pflanzenbaues. Band 2: Kulturpflanzen; Entrup, N.L., Oehmchen, J., Eds.; AgroCooncept GmbH: Bonn, Germany, 2000; ISBN 378620117X. [Google Scholar]
- Pagliai, M.; Vignozzi, N.; Pellegrini, S. Soil structure and the effect of management practices. Soil Tillage Res. 2004, 79, 131–143. [Google Scholar] [CrossRef]
- Etana, A.; Håkansson, I. Swedish experiments on the persistence of subsoil compaction caused by vehicles with high axle load. Soil Tillage Res. 1994, 29, 167–172. [Google Scholar] [CrossRef]
- Pagenkemper, S.K.; Puschmann, D.U.; Peth, S.; Horn, R. Investigation of time dependent development of soil structure and formation of macropore networks as affected by various precrop species. Int. Soil Water Conserv. Res. 2014, 2, 51–66. [Google Scholar] [CrossRef] [Green Version]
- Wahlström, E.M.; Kristensen, H.L.; Thomsen, I.K.; Labouriau, R.; Pulido-Moncada, M.; Nielsen, J.A.; Munkholm, L.J. Subsoil compaction effect on spatio-temporal root growth, reuse of biopores and crop yield of spring barley. Eur. J. Agron. 2021, 123, 126225. [Google Scholar] [CrossRef]
- Piccoli, I.; Schjønning, P.; Lamandé, M.; Zanini, F.; Morari, F. Coupling gas transport measurements and X-ray tomography scans for multiscale analysis in silty soils. Geoderma 2019, 338, 576–584. [Google Scholar] [CrossRef]
- Williams, S.M.; Weil, R.R. Crop cover root channels may alleviate soil compaction effects on soybean crop. Soil Sci. Soc. Am. J. 2004, 68, 1403–1409. [Google Scholar] [CrossRef]
- Çerçioğlu, M.; Anderson, S.H.; Udawatta, R.P.; Alagele, S. Effect of cover crop management on soil hydraulic properties. Geoderma 2019, 343, 247–253. [Google Scholar] [CrossRef]
- Calonego, J.C.; Raphael, J.P.A.; Rigon, J.P.G.; Oliveira Neto, L.d.; Rosolem, C.A. Soil compaction management and soybean yields with cover crops under no-till and occasional chiseling. Eur. J. Agron. 2017, 85, 31–37. [Google Scholar] [CrossRef] [Green Version]
- Nielsen, D.C.; Lyon, D.J.; Higgins, R.K.; Hergert, G.W.; Holman, J.D.; Vigil, M.F. Cover crop effect on subsequent wheat yield in the central great plains. Agron. J. 2016, 108, 243–256. [Google Scholar] [CrossRef] [Green Version]
- Acuña, J.C.M.M.; Villamil, M.B. Short-term effects of cover crops and compaction on soil properties and soybean production in Illinois. Agron. J. 2014, 106, 860. [Google Scholar] [CrossRef]
- Blanco-Canqui, H.; Shaver, T.M.; Lindquist, J.L.; Shapiro, C.A.; Elmore, R.W.; Francis, C.A.; Hergert, G.W. Cover crops and ecosystem services: Insights from studies in temperate soils. Agron. J. 2015, 107, 2449–2474. [Google Scholar] [CrossRef] [Green Version]
- Bolinder, M.A.; Crotty, F.; Elsen, A.; Frac, M.; Kismányoky, T.; Lipiec, J.; Tits, M.; Tóth, Z.; Kätterer, T. The effect of crop residues, cover crops, manures and nitrogen fertilization on soil organic carbon changes in agroecosystems: A synthesis of reviews. Mitig. Adapt. Strateg. Glob. Chang. 2020, 256, 929–952. [Google Scholar] [CrossRef]
- Kätterer, T.; Bolinder, M.A.; Berglund, K.; Kirchmann, H. Strategies for carbon sequestration in agricultural soils in northern Europe. Acta Agric. Scand. Sect. A—Anim. Sci. 2012, 62, 181–198. [Google Scholar] [CrossRef]
- Smith, P. How long before a change in soil organic carbon can be detected? Glob. Chang. Biol. 2004, 10, 1878–1883. [Google Scholar] [CrossRef]
- Seehusen, T.; Waalen, W.; Hoel, B.; Uhlen, A.K.; Persson, T.; Strand, E. Landbruket i Møte Med Klimaendringen—Effekter av Endret Klima og Behov for Tilpasninger- Norsk Kornproduksjon—Vedlegg til Hovedrapporten: Utredninger om Landbrukets Utfordringer i Møte Med Klimaendringene—Fagnotater Som Underlag for Arbeidsgruppens; Landbruks og Matdepartement: Oslo, Norway, 2016. [Google Scholar]
- Alaoui, A.; Rogger, M.; Peth, S.; Blöschl, G. Does soil compaction increase floods? A review. J. Hydrol. 2018, 557, 631–642. [Google Scholar] [CrossRef]
- Liu, H.; Colombi, T.; Jäck, O.; Keller, T.; Weih, M. Effects of soil compaction on grain yield of wheat depend on weather conditions. Sci. Total Environ. 2022, 807, 150763. [Google Scholar] [CrossRef] [PubMed]
- Vörösmarty, C.J.; Green, P.; Salisbury, J.; Lammers, R.B. Global water resources: Vulnerability from climate change and population growth. Science 2000, 289, 284–288. [Google Scholar] [CrossRef] [PubMed] [Green Version]
Publisher’s Note: MDPI stays neutral with regard to jurisdictional claims in published maps and institutional affiliations. |
© 2022 by the authors. Licensee MDPI, Basel, Switzerland. This article is an open access article distributed under the terms and conditions of the Creative Commons Attribution (CC BY) license (https://creativecommons.org/licenses/by/4.0/).