1. Introduction
The marginalization of abundant areas due to the progressive increase in social, material, economic, and infrastructural vulnerability is a complex phenomenon that requires an urgent response, one which can no longer be postponed [
1,
2,
3,
4,
5,
6,
7,
8].
The 2030 Agenda for Sustainable Development [
9] provides general measures on less developed areas with reference to “Goal 11: Make cities and human settlements inclusive, safe, resilient and sustainable”, and in particular, targets 11.1, 11.2, 11.4, 11.6, 11.a and 11.c [
10].
The European Commission, with Europe 2020 [
11], promotes “smart, sustainable and inclusive growth” and greater economic and social policy coordination between the European Union and member states. Inclusive growth must promote an economy with a high employment rate, and must foster social and territorial cohesion.
Moving in this direction is the long-term vision for the EU’s rural areas [
12], an initiative that creates a new momentum for rural areas, home to 30 percent of the EU’s population, building on new opportunities created by the EU’s green and digital transitions and on lessons learned from the experience of the pandemic effects of COVID-19 [
13,
14].
The Commission’s communication proposes a negotiation among citizens and other stakeholders in rural areas to create a rural pact and rural action plan aimed at making them stronger, more connected, resilient, and prosperous.
Laws have been enacted in Italy to support weak areas, such as Law No. 97 “New Provisions for Mountain Areas” of 31 January 1994, for the preservation and enhancement of mountain areas, which are of preeminent national interest” [
15]; Law No. 158 “Measures for the support and enhancement of small municipalities, as well as provisions for the redevelopment and recovery of the historic centers of the same municipalities” of 6 October 2017 [
16], aims to support, through incentives for development, small municipalities, although, to date, it has been cumbersome to implement. In order to facilitate better implementation of the policies proposed by Law No. 158, the Italian Ministry of the Interior issued the Decree of 10 August 2020, namely “Definition of parameters for determining the types of small municipalities eligible for funding under Law No. 158” of 6 October 2017 [
16].
The report “Historic Centers and the Future of the Country” by the National Association of Historic Artistic Centers (NAHAC) and the Center for Economic and Social Research of the Building Market (CESRBM) [
17] provides an analysis of the vulnerability/resilience ratio of the 109 historic centers of the Italian capital province, using the rankings of the main 8000 Census indices [
18] processed by National Institute of Statistics (NIS) on population dynamics, household composition, aging of residents, integration of foreigners, housing adequacy and employment.
Comparisons of key demographic indices on the built heritage and economic activities at the scale of the historic center, municipal area and related values at the national scale are offered in the report. This study identified some guidelines aimed at the defense of historic centers, their preservation and enhancement, highlighting the urgency of defining a national policy to support the regions and municipalities, and the ineffectiveness of some of the instruments aimed at small historic centers in inland areas proposed by the previously mentioned Law No. 97.
In Italy, the National Strategy for Inner Areas (NSIA), which has been promoted by the Agency for Territorial Cohesion since 2013, provides support measures for territories affected by structural processes of depopulation and abandonment (1077 Italian municipalities, and just over 2 million inhabitants) [
19].
The NSIA supports fragile territories, distant from the main centers of supply of essential services and too often left to their own devices, which, however, cover a total of 60 percent of the entire surface area of the national territory, 52% of the municipalities and 22 percent of the population.
In terms of financial support for actions to support weak areas, several packages have been introduced over time.
The legislative package on cohesion policy 2014–2020 (Italy, England, France) introduces important changes: strengthened coordination of the programming of the four EU funds linked to the Common Strategic Framework 2014–2020 in a single strategy document, and close coherence with the goals of the Europe 2020 “Strategy for Smart, Inclusive and Sustainable Growth“ [
20]. Following this, the 2021–2027 Partnership Agreement strengthened the use of European Development and Investment Funds (EIS) in pursuit of the Union’s Strategy for Smart, Sustainable and Inclusive Growth [
21].
The Italian National Recovery and Resilience Plan (NRRP) funded by the European Union-NextGeneration EU, with reference to the implementation to Mission No. 5 “Inclusion and Cohesion” [
22] has provided funding of 100–400 million euros from the Fund for Development and Cohesion (FSC) for “special interventions for territorial cohesion”, “National Strategy for Inner Areas, and “strengthening of community social services and infrastructure”.
The goal is to provide social services to at least two million citizens residing in inland areas, including at least 900,000 in southern regions, for which a minimum share of 40% of the total investment is reserved.
The amount of funding allocated for inland areas in Italy represents an important opportunity to be able to significantly promote their protection, conservation, and enhancement [
23].
Funding will be disbursable based on the characterization of inland areas proposed by the Interministerial Committee for Economic Planning and Sustainable Development (ICEPSD).
The map of inland areas is an important knowledge base for strategy planning and intervention planning.
In this regard, ICEPSD has updated the first version of the map of inland areas from 2014, with a new version that is from 2020, which will support the Partnership Agreement 2021–2027.
The beneficiaries of funding will be all municipalities identified as intermediate, peripheral or ultra-peripheral areas in the proposed new mapping.
The cognitive support produced by ICEPSD is based on a characterization of inland areas with reference to the distance matrix, centers of service provision, demographic indicators, and some indicators of socio-economic and structural condition of the territories. It, in classifying areas into pole, belt, peripheral, and ultra-peripheral primarily based on the distance matrix and the level of services offered, provides cognitive support for the development of the National Strategy of Inland Areas, which may be incapable of detecting the residual values of territory. As a consequence of this, it may be unable to detect the residual resilience of these areas [
24,
25], contributing to the selection of inefficient strategies for them.
If the basic tool for promoting the implementation of specific policies and for allocating funding is unable to capture the values and/or dis-values of areas [
25], it could contribute to making the former ineffective and the latter inefficient.
In order to improve the cognitive support for the development of strategies to support weak areas, the research from a critical analysis of the ICEPSD classification of inland areas proposes to develop one from the perspective of an axiological approach.
This approach is aimed at interpreting the values and/or dis-values of abandoned areas in order to explore their residual worth and support decisionmakers in the complex process of reinterpreting their values [
26].
In this regard, the research will propose a new cognitive framework of the geography of abandonment, i.e., a new map of the phenomenon based on the representation in QGIS of an index of abandonment estimated in this study for the inland areas of Sicily, Italy.
The index will be constructed based on the characterization of the main forms of territorial capital, namely, human, urban, economic, infrastructural, natural, cultural, and environmental capital. Given the numerosity of the indicators, in order to arrive at the most representative set of indicators, and thus to reduce the complexity of the representation of the different forms of territorial capital, a methodological approach widely used in the literature for this purpose will be used, namely, Principal Component Analysis [
27,
28,
29,
30,
31]. The abandonment index will be estimated as an aggregate weighted sum of the components identified as a result of Principal Component Analysis (PCA) [
4] implemented on the values of the different forms of territorial capital of weak areas.
The paper is organized in the following sections:
Section 2 proposes a survey of the phenomenon of abandonment;
Section 3 introduces the case study: Area Classification in the National Strategy for Inland Areas;
Section 4 illustrates the methodological approach;
Section 6 proposes some reflections on the results, i.e., the abandonment map based on the aggregate index estimated in this study and some comparisons with the classification of areas for the National Strategy of Inner Areas; it then identifies the limits and the lines of future development of this research;
Section 7 proposes a summary of the proposed research.
2. A Survey of the Phenomenon of Abandonment
Abandonment, obsolescence, indifference, and disaffection pervade many aspects of our existence. They affect spaces, landscapes, territories, artifacts, emotions, technology, consumer goods, lifestyles, and thoughts. The rapid evolution of contemporary culture increasingly results in the loss of usefulness, wear and tear, and outgrowth of places, landscapes, and territories generating the condition of abandonment and obsolescence [
32,
33].
The condition of abandonment can be characterized in several manners: a physical sense, i.e., when one leaves a place; virtual when it is the result of a mental and affective process; social when territories are characterized by the progressive reduction of personal services and the concentration of phenomena, such as poverty, unemployment, low education, etc.; functional as a result of the divestment of activities and functions; and political as a result of inefficient or deliberately inequitable economic-social planning and governance in favor of some territories or portions of territories and to the detriment of others. An example of the latter point could be the weakening of the welfare state, which has resulted in the dismantling of important territorial principles due to the state’s inability to keep them alive because of the progressive loss of population or the absence of an adequate level of infrastructure to support them.
The process that leads to abandonment in most cases is multi-dimensional in nature, i.e., several concurring causes generate it.
Today, more than 50% of the world’s population lives in urban areas, and several studies predict that this percentage will increase to 75%.
The migration of population to urban areas at the expense of less urbanized areas, a shift brought about by increased job opportunities and service provision, climate change or natural disasters, is of a significant magnitude that is expected to grow in the coming years.
The concentration of populations, functions, services, technologies, and knowledge in coastal or urbanized areas at the expense of rural and inland areas has resulted in an asymmetry of territorial values, with strong polarization toward the former and abandonment in the latter [
34]. While the attractiveness of urban areas is an advantage from the standpoint of territorial competitiveness, this is leading to strong pressures that have contributed to an imbalance in urban values.
In fact, urban areas, as a result of this, are more exposed to the effects related to climate change, such as those due to the generation of heat islands [
35] and are affected by real environmental emergencies such as those generated by a progressive decrease in area quality and the problematic issue of waste management [
36,
37,
38].
The UN World Urbanization Prospects 2018 report highlights the worsening phenomenon of land abandonment [
39]. The current geography of land abandonment, according to this report, is that about two-thirds of the world’s population by 2050 will dwell in large cities, especially in countries such as India, China, and Nigeria [
40]. Their locational choice will be dictated by increased access to services, education, and employment [
41].
The most populated urban territories currently are North America (82%), South America (81%), Europe (74%) and Oceania (68%) [
42,
43,
44].
About 50% of the world’s population resides in cities with fewer than 500,000 inhabitants, while 1 in 8 people live in one of 33 cities with more than 10 million.
Four types of depopulating regions (
shrinking regions) have been identified in Europe (
Figure 1): industrial areas in economic decline, mainly in Western Europe; peripheral depopulated areas typical of Northern Europe; areas that have experienced or are experiencing political transformations such as those in Eastern Europe; and rural areas in Southern Europe that are structurally weak with sharply declining fertility rates [
45,
46,
47,
48,
49].
In Europe, population decline is associated with internal migration, so that from the 1960s onward, the population has become increasingly concentrated in the major urban centers, while the more inland, rural areas are losing ground [
51].
In addition, many European cities are undergoing a reduction in their populations, giving rise to the phenomenon of
shrinking cities [
52,
53,
54,
55,
56,
57] (
Figure 2 and
Figure 3).
Data on population decline, old-age index, birth rate, and registry de-registrants provide a mapping for Europe of the extent of the phenomenon of abandonment at the territorial and urban scale [
59].
In Europe, between 2001 and 2020, the EU population (with reference to EU27) increased from 429 million to 447 million, a growth rate of 4 percent, although in 2020 [
60], there was the highest rate of the population over 65 years old compared to the population aged 15–64 years old, at 32%; the number of live births in the EU has declined at a relatively constant rate from 2001 to 2020 [
61].
In Italy between 2020 and 2021, the population decreased by 0.6 percent; this figure was definitely affected by the COVID-19 pandemic; the rate of over-65s compared to the population aged 15–64 is 37% [
61], about five percentage points above the European average. Overall in 20 years the percentage of older Europeans has risen from representing 22.5% of the population to 32 percent [
62]; the number of live births has experienced decreases of 25% between 2001 and 2020 [
63]; the number of people cancelled from the civil registry for foreign countries has grown by 16.1 percent compared to 2018 [
64].
During the period from 2010 to 2019, immigration of both foreign nationals (from within and outside the EU) and nationals returning to their country of origin increased in all member states except Italy, where immigration decreased during the same period.
Data show a higher level of quality of life in small Italian municipalities than in large cities, but they continue to depopulate in favor of urban areas [
65].
In recent years, small municipalities have lost more than 74,000 inhabitants [
66]. The entire south of Italy along with Genoa and parts of Piedmont are expected to lose population, while Emilia Romagna, Trentino and the Milan metropolitan area are expected to grow [
67].
In Sardinia, National Institute of Statistics (NIS) data show a decrease in population over the past 60 years of more than 73,000 in inland municipalities, while it has grown by 293,000 in coastal municipalities. In the next 50 years, Sardinia will have 340,000 fewer inhabitants, most of which will be lost from inland municipalities [
68].
The phenomenon of abandonment results in underutilization of all forms of territorial capital, namely, human, urban, economic, infrastructure, cultural, natural, and environmental capital [
69,
70,
71,
72,
73,
74].
The need to identify a new development process capable of interconnecting abandoned and marginalized areas with dense, attractive and congested areas meets the need for a rebalancing necessary for an improved functioning of the territorial system as a whole [
75,
76,
77,
78].
In fact, the urban areas, strong, dominant, catalysts of flows of “matter (natural resources), energy (labor) and information (technology)” have progressively extracted more and more from the weak areas, transforming them into “environment” in the Luhmanian sense [
79,
80].
As a result of this, weak areas have been dominated and ousted from both urban and land systems.
Urban areas now increasingly need to integrate weak areas for a twofold reason: because new flows of matter, energy and information [
81,
82] will have to support their development, and because they will have to manage their carrying capacity to improve their internal resilience [
25,
83,
84,
85,
86,
87,
88,
89,
90,
91,
92].
The human, urban, natural, cultural-historical, infrastructural, and economic heritage characterized by people, housing, buildings, hamlets, resources, infrastructure and services, the small productive fabric [
93] of weak areas, turns out to be in most cases looted, debased and abandoned. The heritage complex of a territory should contribute to the formation of its identity. It should represent the infrastructure supporting the very existence of a territory and that is a precondition for its development. The marginalization of weak areas and disaffection with the heritage complex that within them work together to generate the crisis of local identity and territories.
Identity is a complex issue, especially in a society such as the contemporary one marked by major upheavals and the great crises of this time, such as climate, pandemic, wars, poverty, injustice [
94], and multidimensional and value dissimilarities. A reinterpretation of individual, collective and territorial identities could support overcoming these crises and promote development in contemporary societies.
In this perspective, the complex heritage of weak areas can become a resource, an opportunity for territories [
95].
A reinterpretation of territorial values could reverse the gradual process that has led to disaffection and loss of identity, promoting a process of affection and renewed identity capable of interconnecting weak areas and urban areas. The creation of a territorial system in which weak areas can be included would promote not only their recovery but also the development and enhancement of urban areas. The perspective of an axiological approach [
96,
97] to support this study is instrumental in detecting territorial values and/or disvalues in order to support their reinterpretation.
3. Materials
The inland areas selected by the proposed classification for the NSIA are seventy-two, comprising a total of 1077 municipalities, covering approximately 2,072,718 inhabitants [
19].
Inland areas are the most peripheral Italian municipalities in terms of access to essential services (e.g., health, education, and mobility). For the characterization of inland areas, “pole” municipalities are identified as a priority, i.e., those municipalities that offer the following services (alone or together with their neighbors):
Higher education: an upper secondary school offered with at least one high school (scientific or classical) and either a technical or a vocational institute;
Health services: at least one hospital with a Level I Emergency Department of Acceptance (EDA);
Rail transportation services: a railway station of at least silver type, corresponding to medium-small facilities.
The data base supporting the NSIA classification contains not only information on instrumental criteria for characterizing “pole” areas, but also those on resident population, housing density per square kilometer, and some structural indicators, service supply indicators, service demand indicators, and social context indicators. A description of the indicators supporting the NSIA classification has been provided in
Appendix A.
Municipalities are classified as “belt”, “intermediate”, “peripheral”, and “ultra-peripheral”, that is, with levels of peripherality gradually increasing with distance from the “pole” municipality.
In February 2022, ICEPSD updated this methodological framework, further refining the tool that serves to monitor the peripherality of the different territories that make up the country.
For the new classification, the basic approach has remained unchanged; in particular, the criterion for identifying the “pole” is the services present, but the distances from the “pole” for identifying the different types of inland areas have been reshaped, and metropolitan cities have not been assigned a priori to the “pole” category, as had happened (although for very few cases) in the 2014 classification. There are 389 municipalities that fall under the NSIA classification for the nine metropolitan areas of Sicily (
Figure 4).
They are characterized by 14 “pole” municipalities (4% of the total), 65 “belt” (17% of the total), 119 “intermediate” (31% of the total), 157 “peripheral” (40% of the total) and 34 “ultra-peripheral” (9 percent of the total). Intermediate, peripheral, and ultra-peripheral areas account for 80% of those falling under this classification. These areas cover a territory with an area of 19,541 square kilometers, in which 2,312,007 inhabitants reside. The percentage of municipalities falling in the NSIA classification (
Figure 5) for the different metropolitan cities shows a greater concentration of the ultra-peripheral, peripheral, and intermediate typology for Messina, the absence of municipalities in the ultra-peripheral typology for Caltanissetta and Syracuse, and of municipalities falling in only intermediate areas for Ragusa.
With reference to land area, there is a greater extension of the ultra-peripheral type in the metropolitan cities of Messina and Enna, of the peripheral type in the metropolitan area of Caltanissetta, and of the intermediate type in the metropolitan area of Ragusa (
Figure 6).
There is a greater concentration of the resident population in the ultra-peripheral type in the metropolitan areas of Enna, in the peripheral type in the metropolitan area of Caltanissetta, and following almost at the same percentage of population, the metropolitan areas of Trapani, Palermo, Messina, and Agrigento, and in the intermediate type for the metropolitan area of Ragusa (
Figure 7).
In summary, the NSIA classification identifies the most disadvantaged territory as a consequence of the number of municipalities falling in the peripheral and ultra-peripheral areas, by the extension of these areas, and by the percentage of population residing in the metropolitan area of Messina; the least disadvantaged territory with reference to the presence of only one type of area, the intermediate one, characterized by slight marginality, by its extension and by the percentage of population residing the metropolitan area of Ragusa. In terms of least disadvantage, after Ragusa is the metropolitan area of Syracuse.
The NSIA classification certainly represents a good cognitive base to support the enhancement of the territories characterized by abandonment; it has been instrumental in identifying the plan of needs, the order of priorities, the supporting policy, strategies, and funding. The different levels of remoteness/peripherality, in order to best achieve the set goal, require specific efforts of policies, from the ordinary one to rethink the organization of services (schools and health) even in the most distant, often mountainous territories, to the additional one based on conditionality, multi-level governance, participation and linkage to the result.
We question whether the cognitive framework proposed by the NSIA classification, one developed from the perspective of an approach to marginality substantiated by distance from attractive poles and the level of service provision, can effectively support the development of appropriate policies and strategies for abandonment territories. Geographic distance is certainly an important aspect of a geography of abandonment, but it is not exhaustive. In fact, an area could be economically strong or culturally/environmentally relevant even if it is far from the main attractor, or it could be economically weak and poorly culturally/environmentally relevant even if it is close to the main attractor.
Also, it must be remembered that the level of service provision is a condition that arises from political choices, in some cases short-sighted or oriented by the hegemonic power of the strong city, or characterized by selective ignorance, generating fractures and inequality between city and territory and favoring the progressive deterioration of the latter in favor of the former. In the perspective of an axiological approach of abandoned areas, one aimed at interpreting their values and/or disvalues, the definition of a cognitive process aimed at detecting the residual capacity of worth and supporting the process of reinterpreting value is an important issue [
98].
From this perspective, the cognitive framework should integrate all the components of territorial capital that represent the value and valence capacity of these areas. In this regard, we propose a cognitive process of inland areas (i.e., a mapping of the phenomenon of abandonment), aimed at generating their mapping based on the values of the different components of the forms of territorial capital. In this regard, in the following section we will introduce the different forms of territorial capital that we consider relevant to this study.
5. Results
Data on indicators for different forms of territorial capital were extracted from the official databases previously referred to, and an instrumental geo-database was constructed for them for the analyses that will lead to the definition of an index of abandonment and a mapping of the abandonment phenomenon.
5.1. Cluster of Municipalities Based on Quartiles of Indicator Values of Different Forms of Territorial Capital
The indicators selected for characterizing the different components of territorial capital were normalized and with QGIS support, cluster maps of municipalities were generated based on the quartiles of these indicators. This made it possible to highlight the performance of each municipality for the different indicators of the different forms of territorial capital. The municipalities for which the analysis was conducted are those that fall within the Intermediate, Peripheral and Ultra-peripheral areas in the NSIA classification.
Clusters of municipalities based on quartiles of indicators on human capital and cultural capital are shown in
Figure 9. In the box in
Figure 9 and for all the figures that will be presented subsequently regarding the indicator maps for the different forms of territorial capital, the Pelagic Islands are shown.
With reference to the first quartile,
Figure 9 shows: the presence of small clusters of municipalities predominantly falling in the north-central area of Sicily for HC1, HC2, and HC3; clusters of municipalities predominantly falling in the south-eastern area of Sicily for HC4, and HC5; clusters of municipalities predominantly falling in the south-central area of Sicily for HC6; clusters of municipalities predominantly falling in the eastern area of Sicily for HC7; clusters of municipalities predominantly falling in the north-eastern area of Sicily for HC8; clusters of municipalities predominantly falling in the north-central area of Sicily for HC9; clusters of municipalities predominantly falling in the eastern area of Sicily for HC10; clusters of municipalities predominantly falling in the north-central area of Sicily for HC11 and HC12; clusters of municipalities predominantly falling in the northeastern area of Sicily for HC13; clusters of municipalities predominantly falling in the southern and east-central areas of Sicily for HC14; and small clusters of municipalities predominantly falling in the north-central and northeastern areas of Sicily for HC15 and HC16.
With reference to the second quartile,
Figure 9 shows: the presence of clusters of municipalities predominantly falling in the north-central area of Sicily for HC1, HC2, and HC3; clusters of municipalities predominantly falling in the east-central area of Sicily for HC4, HC5, HC6, and HC7; clusters of municipalities predominantly falling in the north-eastern area of Sicily for HC8; clusters of municipalities predominantly falling in the central and eastern areas of Sicily for HC9; small clusters of municipalities predominantly falling in the central-northern area of Sicily for HC10; clusters of municipalities predominantly falling in the southeastern area of Sicily for HC11; clusters of municipalities predominantly falling in the central and southeastern areas of Sicily for HC12; small clusters of municipalities predominantly falling in the central and southeastern areas of Sicily for HC13 and HC14; and clusters of municipalities predominantly falling in the central-northern and northeastern areas of Sicily for HC15 and HC16.
With reference to the third quartile,
Figure 9 shows: the presence of small clusters of municipalities falling in the central area of Sicily for HC1; clusters of municipalities predominantly falling in the central area of Sicily for HC2, HC3, HC4, HC5, and HC6; clusters of municipalities predominantly falling in the south-central area of Sicily for HC7 and HC8; small clusters of municipalities falling in the central area of Sicily for HC9; clusters of municipalities predominantly falling in the central and eastern areas of Sicily for HC10 and HC11; clusters of municipalities predominantly southern and central-eastern areas of Sicily for HC12; clusters of municipalities predominantly falling in the central and eastern-southern areas of Sicily for HC13; small clusters of municipalities predominantly falling in the central-northern area of Sicily for HC14; and clusters of municipalities predominantly falling in the central and northern-eastern areas of Sicily for HC15 and HC16.
With reference to the fourth quartile,
Figure 9 shows: the presence of clusters of municipalities predominantly falling in the south-central and eastern areas of Sicily for HC1 and HC2; clusters of municipalities predominantly falling in the south-eastern and north-western areas of Sicily for HC3; clusters of municipalities predominantly falling in the central-northern area of Sicily for HC4, HC5, HC6, and HC7; clusters of municipalities predominantly falling in the central-southern area of Sicily for HC8; clusters of municipalities predominantly falling in the southern and northeastern areas of Sicily for HC9; clusters of municipalities predominantly falling in the central and northeastern area of Sicily for HC10; clusters of municipalities predominantly falling in the eastern area of Sicily for HC11 and HC12; clusters of municipalities predominantly falling in the central-southern area of Sicily for HC13; clusters of municipalities predominantly falling in the northern and southeastern areas of Sicily for HC14; and clusters of municipalities predominantly falling in the central-southern and eastern areas of Sicily for HC15 and HC16.
With reference to the first quartile,
Figure 9 shows the presence of clusters of municipalities predominantly falling in the north-central area and partially in the southern area of Sicily for CC1; small clusters of municipalities predominantly falling in the central and southeastern areas of Sicily for CC2; clusters of municipalities falling in almost all of Sicily except the metropolitan area of Trapani and (partially) in those of Agrigento, Ragusa and Palermo for CC3; and clusters of municipalities falling in almost all of Sicily for CC4 and CC5.
With reference to the second quartile,
Figure 9 shows: no clusters of municipalities for CC1; small clusters of municipalities mainly falling in the north-central area of Sicily for CC2; small clusters of municipalities mainly falling in the west-central area of Sicily for CC3; no clusters of municipalities for CC4 and CC5.
With reference to the third quartile,
Figure 9 shows: the presence of small clusters of municipalities falling in the central area of Sicily for CC1; small clusters of municipalities predominantly falling in the central area of Sicily for CC2; small clusters of municipalities predominantly falling in the central-western area of Sicily for CC3; and no clusters of municipalities for CC4 and CC5.
With reference to the fourth quartile,
Figure 9 of small clusters of municipalities falling in almost the entire territory of Sicily with a higher concentration in the central-southern-eastern area for CC1 and CC2; clusters of municipalities predominantly falling in the northern area of Sicily for CC3; two small clusters of municipalities falling in the metropolitan cities of Palermo and Catania for CC4; and small clusters of municipalities falling in almost the entire territory of Sicily for CC5.
With reference to the first quartile,
Figure 10 shows clusters of municipalities predominantly falling in the south-eastern area of Sicily for UC1; small clusters of municipalities predominantly falling in the east-central area of Sicily for UC2, UC3, and UC4; clusters of municipalities predominantly falling in the central area of Sicily for UC5; clusters of municipalities predominantly falling in the north-central and east-central areas of Sicily for UC6; small clusters of municipalities falling mainly in the southern and eastern areas of Sicily for UC7, UC8; small clusters of municipalities falling mainly in the north-central area of Sicily for UC9; clusters of municipalities falling mainly in the eastern area of Sicily for UC10; clusters of municipalities falling mainly in the southern and eastern areas of Sicily for UC11; clusters of municipalities falling mainly in the eastern area of Sicily for UC12; clusters of municipalities predominantly falling in the central-northern area of Sicily for UC13; clusters of municipalities predominantly falling in the central area of Sicily for UC14; clusters of municipalities predominantly falling in the central and northern-eastern area of Sicily for UC15; small clusters of municipalities predominantly falling in the central-northern area of Sicily for UC16; clusters of municipalities predominantly falling in the central and southern-eastern areas of Sicily for UC17; clusters of municipalities predominantly falling in the central-eastern area of Sicily for UC18; small clusters of municipalities predominantly falling in the central-northern area of Sicily for UC19; small clusters of municipalities predominantly falling in the eastern area of Sicily for UC20; small clusters of municipalities predominantly falling in the central-northern and southern areas of Sicily for UC21; small clusters of municipalities predominantly falling in the central area of Sicily for UC22.
With reference to the second quartile,
Figure 10 shows: the presence of clusters of municipalities predominantly falling in the north-central area of Sicily for UC1; small clusters of municipalities predominantly falling in the northern and southern areas of Sicily for UC2; small clusters of municipalities predominantly falling in the eastern area of Sicily for UC3, UC4 and UC5; clusters of municipalities predominantly falling in the central area of Sicily for UC6, UC7 and UC8; small clusters of municipalities predominantly falling in the central area of Sicily for UC9 and UC10; small clusters of municipalities predominantly falling in the southern area of Sicily for UC11; clusters of municipalities predominantly falling in the central area of Sicily for UC12, UC13, and UC14; no municipalities in the second quartile for UC15; and small clusters of municipalities predominantly falling in the north-central area of Sicily for UC16, UC17, UC18, UC19, UC20, UC21, and UC22.
With reference to the third quartile,
Figure 10 shows: no municipalities in the third quartile for UC1; small clusters of municipalities predominantly falling in the central area of Sicily for UC2, UC3, UC4, and UC5; small clusters of municipalities predominantly falling in the southern area of Sicily for UC6; small clusters of municipalities predominantly falling in the central area of Sicily for UC7, UC8, UC9, UC10, and UC11; small clusters of municipalities predominantly falling in the southern and eastern area of Sicily for UC12; small clusters of municipalities predominantly falling in the eastern area of Sicily for UC13; small clusters of municipalities predominantly falling in the central area of Sicily for UC14; no municipalities in the second third for UC15; small clusters of municipalities predominantly falling in the central area of Sicily for UC16, UC17, UC18, UC19, UC20, UC21, and UC22.
With reference to the fourth quartile,
Figure 10 shows: no municipalities in the second quartile for UC1; clusters of municipalities predominantly falling in the central and northeastern areas of Sicily for UC2, UC3 and UC4; clusters of municipalities predominantly falling in the eastern and southwestern areas of Sicily for UC5; small clusters of municipalities predominantly falling in the eastern area of Sicily for UC6; clusters of municipalities predominantly falling in the eastern and central coastal areas of Sicily for UC7, UC8, and UC9; small clusters of municipalities predominantly falling in the central and eastern-northern coastal areas of Sicily for UC10; clusters of municipalities predominantly falling in the central and eastern-northern coastal areas of Sicily for UC11 and UC12; clusters of municipalities predominantly falling in the central and eastern coastal areas of Sicily for UC13; clusters of municipalities predominantly falling in the eastern coastal area of Sicily for UC14; small clusters of municipalities predominantly falling in the southern and eastern coastal areas of Sicily for UC15; clusters of municipalities predominantly falling in the central-eastern area of Sicily for UC16; clusters of municipalities predominantly falling in the central-northern area of Sicily for UC17 and UC18; clusters of municipalities predominantly falling in the eastern area of Sicily for UC19; clusters of municipalities predominantly falling in the central area of Sicily for UC20; clusters of municipalities predominantly falling in the central-eastern and southern-western areas of Sicily for UC21; and clusters of municipalities predominantly falling in the central area of Sicily for UC22.
With reference to the first quartile,
Figure 11 shows the presence of clusters of municipalities predominantly falling in the central area of Sicily for EC1; small clusters of municipalities predominantly falling in the north-eastern and south-central areas of Sicily for EC2, EC3, and EC4; clusters of municipalities predominantly falling in the north-eastern and south-eastern area of Sicily for EC5; clusters of municipalities predominantly falling in the central and southeastern area of Sicily for EC6; small clusters of municipalities predominantly falling in the north-eastern area of Sicily for EC7 and EC8; and small clusters of municipalities predominantly falling in the central and north-eastern areas of Sicily for EC9 and EC10.
With reference to the second quartile,
Figure 11 shows clusters of municipalities predominantly falling in the central area of Sicily for EC1; small clusters of municipalities predominantly falling in the central and southern areas of Sicily for EC2; clusters of municipalities predominantly falling in the central and southeastern areas of Sicily for EC3; clusters of municipalities predominantly falling in the central and northeastern areas of Sicily for EC4; clusters of municipalities predominantly falling in the north-eastern area of Sicily for EC5; clusters of municipalities predominantly falling in the central and south-eastern areas of Sicily for EC6; small clusters of municipalities predominantly falling in the central area of Sicily for EC7; and clusters of municipalities predominantly falling in the central and north-eastern areas of Sicily for EC8, EC9 and EC10.
With reference to the third quartile,
Figure 11 shows: the presence of small clusters of co-municipalities predominantly falling in the central area of Sicily for EC1, EC2, EC3, EC4, and EC5; small clusters of municipalities predominantly falling in the central and eastern-southern areas of Sicily for EC6; clusters of municipalities predominantly falling in the central and eastern areas of Sicily for EC7 and EC8; small clusters of municipalities predominantly falling in the central area of Sicily for EC9; and clusters of municipalities predominantly falling in the central and eastern-southern areas of Sicily for EC10.
With reference to the fourth quartile,
Figure 11 shows: the presence of clusters of municipalities predominantly falling in the southern and northeastern areas of Sicily for EC1; small clusters of municipalities predominantly falling in the central area of Sicily for EC2, EC3, and EC4; clusters of municipalities predominantly falling in the central-southern area of Sicily for EC5; clusters of municipalities predominantly falling in the north-central area of Sicily for EC6; clusters of municipalities predominantly falling in the central and southern areas of Sicily for EC7; clusters of municipalities predominantly falling in the south-central area of Sicily for EC8; and clusters of municipalities predominantly falling in the east-central area of Sicily for EC9 and EC10.
With reference to the first quartile,
Figure 12 shows: the presence of clusters of municipalities predominantly falling in the central-southern and eastern areas of Sicily for IC1; small clusters of municipalities falling mainly in the central area of Sicily for IC2; clusters of municipalities predominantly falling in the eastern and western areas of Sicily for IC3; clusters of municipalities predominantly falling in the central-southern and eastern areas of Sicily for IC4; clusters of municipalities falling predominantly in the north-eastern and southern areas of Sicily for IC5; clusters of municipalities falling predominantly in the eastern area of Sicily for IC6; clusters of municipalities falling predominantly in the north-central area of Sicily for IC7; clusters of municipalities falling in almost all of Sicily except the metropolitan area of Trapani and partially in those of Agrigento, Ragusa and Palermo for IC8, IC9, IC10 and IC11; small clusters municipalities predominantly falling in the southern, north-central and east-central areas of Sicily for IC12; clusters of municipalities predominantly falling in the south-central and northeastern areas of Sicily for IC13; clusters of municipalities falling in almost all of Sicily except the metropolitan area of Trapani and partially in those of Agrigento, Ragusa and Palermo for IC14; clusters of municipalities predominantly falling in the south-central and northeastern areas of Sicily for IC15; clusters of municipalities predominantly falling in the north-central and eastern area of Sicily for IC16; small clusters of municipalities falling predominantly in the central and northeastern areas of Sicily for IC17; clusters of municipalities falling predominantly in the central and southern area of Sicily for IC18 and IC19; small clusters of municipalities falling predominantly in the central and southeastern areas of Sicily for IC20; and clusters of municipalities falling in almost all of Sicily except the metropolitan area of Trapani and partially in those of Agrigento, Ragusa and Palermo for IC21.
With reference to the second quartile,
Figure 12 shows: clusters of municipalities predominantly falling in the central and eastern areas of Sicily for IC1; small clusters of municipalities predominantly falling in the central area of Sicily for IC2; clusters of municipalities predominantly falling in the central-western and eastern areas of Sicily for IC3; clusters of municipalities predominantly falling in the central area of Sicily for IC4; small clusters of municipalities predominantly falling in the north-central area of Sicily for IC5; small clusters of municipalities predominantly falling in the north-western area of Sicily for IC6; clusters of municipalities predominantly falling in the central and southern areas of Sicily for IC7; clusters of municipalities predominantly falling in the southern and northern area of Sicily for IC8; no municipalities falling in the second quartile for IC9, IC10, and IC11; no municipalities falling in the second quartile for IC12; clusters of municipalities falling in the central and eastern area of Sicily for IC13; no municipalities falling in the second quartile for IC14, IC15, and IC16; clusters of municipalities predominantly falling in the central-northern and southern areas for IC17; small clusters of municipalities predominantly falling in the central area for IC18 and IC19; small clusters of municipalities predominantly falling in the central-western and eastern-northern areas of Sicily for IC20; and no municipalities falling in the second quartile for IC21.
With reference to the third quartile,
Figure 12 shows: the presence small clusters of municipalities predominantly falling in the central area of Sicily for IC1; small clusters of municipalities predominantly falling in the central and north-eastern areas of Sicily for IC2, IC3 and IC4; clusters of municipalities predominantly falling in the central and eastern-southern areas of Sicily for IC5; small clusters of municipalities predominantly falling in the central and eastern areas of Sicily for IC6; small clusters of municipalities predominantly falling in the central and southern-eastern areas of Sicily for IC7; small clusters of municipalities predominantly falling in the northern-eastern area of Sicily for IC8; no municipalities in the third for IC9, IC10 and IC11; clusters of municipalities predominantly falling in the central-southern area of Sicily for IC12; small clusters of municipalities predominantly falling in the central-southern and eastern areas of Sicily for IC13; no municipalities in the third for IC14; clusters of municipalities predominantly falling in the central-western and eastern areas of Sicily for IC15; no municipalities in the third for IC16; small clusters of municipalities predominantly falling in the central-southern area of Sicily for IC17; small clusters of municipalities predominantly falling in the northern-eastern and southern-western areas of Sicily for IC18; small clusters of municipalities predominantly falling in the northern area of Sicily for IC19; small clusters of municipalities predominantly falling in the central-eastern area of Sicily for IC20; and no municipalities in the third for IC21.
With reference to the fourth quartile,
Figure 12 shows: clusters of municipalities predominantly falling in the north-central, south-eastern and west-central areas of Sicily for IC1; clusters of municipalities predominantly falling in the southern and eastern areas of Sicily for IC2; clusters of municipalities predominantly falling in the central area of Sicily for IC3; clusters of municipalities predominantly falling in the central-northern area of Sicily for IC4; clusters of municipalities predominantly falling in the central-southern area of Sicily for IC5; clusters of municipalities predominantly falling in the central-southern and northeastern areas of Sicily for IC6; small clusters of clusters of municipalities predominantly falling in the northern-eastern and southern areas of Sicily for IC7; small clusters of municipalities predominantly falling in the northern-eastern area of Sicily for IC8; small clusters of municipalities predominantly falling in the southern-western area of Sicily for IC9; small clusters of municipalities predominantly falling in the central area of Sicily for IC10; small clusters of municipalities predominantly falling in the central and eastern areas of Sicily for IC11; small clusters of municipalities predominantly falling in the central and northeastern areas of Sicily for IC12; small clusters of municipalities predominantly falling in the central and eastern areas of Sicily for IC13; small clusters of municipalities predominantly falling in the southern-eastern and northern area of Sicily for IC14; and clusters of municipalities predominantly falling in the central-eastern and northwestern area of Sicily for IC15; clusters of municipalities predominantly falling in the central and southern areas of Sicily for IC16 and IC17; small clusters of municipalities predominantly falling in the northern-eastern and central-western areas of Sicily for IC18 and IC19; clusters of municipalities predominantly falling in the central-eastern area of Sicily for IC20; and small clusters of municipalities predominantly falling in the northern-eastern and southern areas of Sicily for IC21.
With reference to the first quartile,
Figure 13 shows: the presence of clusters of municipalities predominantly falling in the central and northeastern areas of Sicily for NC1; small clusters of municipalities predominantly falling in the central and northeastern areas of Sicily for NC2; clusters of municipalities falling in almost all of Sicily with the exception of the Trapani metropolitan area and partially in those of Agrigento, Catania, Messina, Palermo, and Ragusa for NC3; clusters of municipalities predominantly falling in the central and southeastern central areas of Sicily for NC4; and small clusters of municipalities predominantly falling in the northern, eastern, and south-central area of Sicily for NC5.
With reference to the second quartile,
Figure 13 shows: no municipalities falling in the second quartile NC1; clusters of municipalities falling throughout Sicily with a lower concentration in the metropolitan cities of Agrigento, Palermo, Ragusa, and Trapani and NC2; no municipalities falling in the second quartile for NC3; clusters of municipalities falling in the central and southeastern areas of Sicily for NC4; and small clusters of municipalities predominantly falling in the northern, eastern, and south-central areas of Sicily for NC5.
With reference to the third quartile,
Figure 13 shows: no municipalities falling in the second quartile for NC1; no municipalities falling in the third quartile for NC2 and NC3; clusters of municipalities falling in the eastern area of Sicily for NC4; and small clusters of municipalities predominantly falling in the southern and north-central areas of Sicily for NC5.
With reference to the fourth quartile,
Figure 13 shows: clusters of municipalities predominantly falling in the southern-eastern area of Sicily for NC1 and NC2; small clusters of municipalities predominantly in the metropolitan cities of Messina and Catania for NC3; clusters of municipalities in the eastern and northwestern areas of Sicily for NC4; and small clusters of municipalities predominantly falling in the central and eastern areas of Sicily for NC5.
With reference to the first quartile,
Figure 13 shows: clusters of municipalities predominantly falling in the central and southern areas of Sicily for EVC1 and EVC2; clusters of municipalities predominantly falling in the eastern and central-western areas for EVC3; small clusters of municipalities predominantly falling in the eastern and central areas of Sicily for EVC4 and EVC5; clusters of municipalities predominantly in the north-central and east-south areas for EVC6, EVC7 and EVC8; small clusters of municipalities predominantly falling in the eastern, south-central and north-western areas of Sicily for EVC9; and small clusters of municipalities predominantly falling in the coastal area of Sicily for EVC10.
With reference to the second quartile,
Figure 13 shows: the presence of small clusters scattered predominantly in the central area of Sicily for EVC1; small clusters of municipalities scattered predominantly in the north-central and south-central areas of Sicily for EVC2; clusters of municipalities falling predominantly in the central area of Sicily for EVC3; small clusters of municipalities predominantly falling in the north-central and eastern areas of Sicily for EVC4 and EVC5; no municipalities falling in the second quartile for EVC6, EVC7, and EVC8; small clusters of municipalities predominantly falling in the central and eastern area of Sicily for EVC9; and small clusters of municipalities predominantly falling in the south-central and eastern areas of Sicily for EVC10.
With reference to the third quartile,
Figure 13 shows: the presence of clusters of municipalities predominantly falling in the northern and central-eastern areas of Sicily for EVC1; small clusters of municipalities scattered predominantly in the northern-eastern and southern-eastern areas of Sicily for EVC2; small clusters of municipalities of municipalities falling predominantly in the central and northern-eastern areas of Sicily for EVC3; small clusters of municipalities in the central and eastern areas of Sicily for EVC4; the presence of clusters of municipalities falling in the central and northeastern areas of Sicily for EVC5; small clusters of municipalities predominantly falling in the central area of Sicily for EVC6; no municipalities falling in the second quartile for EVC7 and EVC8; small clusters of municipalities predominantly falling in the central and eastern areas of Sicily for EVC9; and small clusters of municipalities predominantly falling in the central-southern and eastern areas of Sicily for EVC10.
With reference to the fourth quartile,
Figure 13 shows: the presence of clusters of municipalities predominantly in the eastern area of Sicily for EVC1; clusters of municipalities predominantly falling in the northern and eastern areas of Sicily for EVC2; clusters of municipalities predominantly falling in the central-western and north-central-eastern areas of Sicily for EVC3; clusters of municipalities predominantly falling in the central area of Sicily EVC4; clusters of municipalities predominantly falling in the southern and north-central areas of Sicily for EVC5; clusters of municipalities predominantly falling in the southern and east-central areas of Sicily for EVC6; small clusters of municipalities predominantly falling in the southern, west-central, and east-central areas of Sicily for EVC7 and EVC8; clusters of municipalities predominantly falling in the eastern and west-central areas of Sicily for EVC9; clusters of municipalities falling in the central area of Sicily for EVC10.
5.2. Comparison of Clusters of Municipalities Based on the Quartiles of Territorial Capital Indicators and the Types of Areas in the NSIA Classification
Clusters of municipalities with reference to indicator quartiles for different forms of territorial capital were compared with the different types of areas proposed by the NSIA classification, particularly with peripheral, intermediate, and ultra-peripheral areas.
Municipalities, according to the NSIA classification, are characterized on the basis of their marginality, graded with reference to certain socio-economic indicators and distance from the reference pole.
The analysis proposed in this study is based on the indicators representing the level/value of different forms of territorial capital, and also including those supporting the NSIA classification, including distance to the pole, and shows substantial differences in municipalities clustered based on indicator performance and the characterization of municipalities by levels of marginality.
With reference to the types of areas in the NSIA classification, the intermediate one is characterized by lower marginality, and therefore municipalities falling under it should show the best indicator performance, the ultra-peripheral one the worst performance, and the peripheral one an intermediate performance between the two.
Comparing the performance of the indicators of territorial capital forms for the nine metropolitan areas in Sicily and the types of areas in the NSIA classification, it is possible to always highlight municipalities belonging to the clusters by quartiles that fall into the different types of NSIA areas.
An example may better clarify what we have noticed. We highlight in this section the comparison between clusters of municipalities based on quartiles of human and natural capital indicators, and the NSIA classification (
Figure 14), and propose the same comparison for indicators of all other forms of capital in
Appendix A.2.
With reference to the HC1 indicator, the municipalities for the different metropolitan areas of Sicily falling in the fourth quartile are those characterized by a higher level/value of the indicator; we would have expected to find these municipalities among those characterized by less marginality, but this is not the case, as the municipalities belonging to this cluster can be classified according to NSIA as intermediate, peripheral and ultra-peripheral areas.
From this, it is possible to highlight that even municipalities with high HC1 performance may fall with reference to NSIA classification into areas characterized by high marginality, such as ultra-peripheral areas.
Again, with reference to HC1, we detect the highest percentage of municipalities falling in the third quartile of the indicator that with reference to the NSIA classification fall in ultra-peripheral areas, which are characterized by high marginality. In addition, there is a high percentage of municipalities falling in the second and first quartiles of the indicator that with reference to NSIA fall in intermediate and peripheral areas, thus characterized by low or medium marginality.
In general, for all indicators considered to characterize the different forms of capital it is possible to find that the municipalities in the quartile clusters can always be classified according to the three types of NSIA areas. From this it is possible to show that in most cases high performance of indicators could correspond to high marginality for NSIA classification, or, vice versa, low performance of indicators could correspond to low marginality, and again medium-low and medium-high performance of indicators could correspond to low, medium, and high marginality.
The absence of total convergence between the classifications, the NSIA one, and the one with reference to clusters of municipalities on the basis of quartiles of indicators for different forms of capital, highlights the former’s inability to be able to capture the values of different areas.
The approach underlying the attribution in a certain level of marginality to areas proposed by the NSIA classification fails to capture the distinctiveness of their values and/or dis-values. There is a risk that it provides a mapping of abandonment incapable of adequately supporting the planning of interventions aimed at reducing their marginalization and promoting the development of strategies aimed at enhancing the areas.
In this regard, this research proposes a new mapping of abandonment based on an index estimated with reference to the values and/or dis-values of indicators of different forms of territorial capital.
5.3. Principal Component Analysis of Territorial Capital Indicators
We selected 89 indicators for the characterization of different forms of territorial capital. Given the presence of many interrelated variables, PCA can be used. PCA was conducted with the help of SPSS statistical software, and it is instrumental in reducing the dimension and arriving at the estimation of the abandonment index more efficiently.
With the help of the statistical software, the non-rotated solution was produced and then the rotated solution using the Rotation-Varimax method with Kaiser normalization, and the components were selected based on the screen plot (
Figure 15).
The rotated solution was obtained after 34 iterations and identified 27 components that in total explained 73.5 % of the total variance (
Table A1 in
Appendix B).
For each component, based on the variables in it, we gave a name. The 27 components and their designations are given below:
PC1 (HC2, HC3, UC13, UC14, IC8) called Attractiveness 1;
PC2 (HC1, UC6, EC9, IC17) called Attractiveness 2;
PC3 (EC2, EC3, EC4, EC8, IC1) called Economy 1;
PC4 (HC6, HC14) called Economy 2;
PC5 (IC6, IC16, CC1) called Facilities 1;
PC6 (UC21, IC13, IC15) called Facilities 2;
PC7 (EC10, NC1, NC2, NC4) called Natural heritage and agricultural activity;
PC8 (UC7, UC8, UC11) called Urbanization 1;
PC9 (IC2, IC4, IC5) called Mobility;
PC10 (HC9, HC11, HC12) called Foreigners;
PC11 (NC3, CC2, CC3, CC4) called Cultural heritage;
PC12 (UC9, UC15, IC3) called Functional mix;
PC13 (EVC1, EVC2, EVC6, EVC7, EVC8) called Hydraulic and seismic hazards;
PC14 (HC4, HC5, HC7, UC1, IC18, EVC9) called Population and urbanization;
PC15 (HC15, HC16) called Education;
PC16 (EVC3, EVC4, EVC5) called Landslide Hazard;
PC17 (UC12, UC16, UC17) called Dwellings 1;
PC18 (UC17, IC12) called Facilities 3;
PC19 (UC4, UC18, UC20, UC22, EVC10) called Urbanization 2;
PC20 (IC10, IC11, IC20) called Facilities 4;
PC21(HC8, HC13) called Employment 1;
PC22 (HC10, EC6) called Employment 2;
PC23 (IC9, IC21, CC5) called Facilities 5;
PC24 (UC3, UC5, UC19) called Dwellings 2;
PC25 (UC10, EC1, EC5, EC7) called Economy 3;
PC26 (IC7, IC14, IC19) called Transport;
PC27 (UC2, NC5) called Urban and agricultural land use.
The PCA made it possible to reduce the number of variables representing the different forms of territorial capital from 87 to 27. The new variables considered next in the analysis are: Attractiveness 1, Attractiveness 2, Economy 1, Economy 2, Facilities 1, Facilities 2, Natural heritage and agricultural activity, Urbanization 1, Mobility, Foreigners, Cultural heritage, Functional mix, Hydraulic and seismic hazards, Population and urbanization, Education, Landslide Hazard, Dwellings 1, Facilities 3, Urbanization 2, Facilities 4, Employment 1, Employment 2, Facilities 5, Dwellings 2, Economy 3, Transport, and Urban and agricultural land use.
5.4. Estimated Aggregate Index of Abandonment-
Based on the components identified with the help of the PCA and through Equation (1) previously presented, the abandonment index was estimated for the marginal areas of Sicily
Based on this calculation, all Sicilian municipalities under study were ranked, i.e., those falling in the intermediate, peripheral, and outermost NSIA areas. The ranking of the municipalities is shown in
Table A2 in
Appendix B. The clusters of municipalities based on quartiles, for the different metropolitan areas in Sicily are presented in
Table A3 in
Appendix B. Based on the quartiles of the estimated abandonment index, four classes of abandonment were defined, low, medium, medium-high and high. Municipalities falling into the fourth quartile are those characterized by a low level of abandonment, those falling into the third quartile are characterized by a medium level of abandonment, those falling into the second quartile are characterized by a medium-high level of abandonment, and those falling into the first quartile are characterized by a high level of abandonment.
Figure 16 shows the number of municipalities for the nine Sicilian metropolitan cities that fall into the different classes of abandonment.
Figure 16 shows a high number of municipalities falling in the high
class for the metropolitan cities of Palermo and Messina. The latter also has the highest number of municipalities falling in the medium-high
class. From this it can be inferred that these two metropolitan cities are those most affected by the phenomenon of abandonment. The Ragusa metropolitan area is the only one that has no municipalities in the medium-high and high class.
In order to highlight the areas most affected by the phenomenon of abandonment, a map of clusters of municipalities defined on the basis of quartiles of the abandonment index was produced with QGIS (
Figure 17).
The map shows clusters of municipalities with a low level of abandonment in the central-eastern and western areas of Sicily; clusters of municipalities with a medium level of abandonment in the central and northeastern areas of Sicily; clusters of municipalities with a medium-high level of abandonment in the central and northeastern areas of Sicily; and clusters of municipalities with another level of abandonment in the central-northern area of Sicily. The abandonment mapping produced in this study on the basis of the estimated abandonment index will be compared in the following section with those of inland areas according to SNAI. The purpose is to highlight the convergences and divergences of the two classifications. The purpose of this comparison is to test whether abandonment mapping, i.e., the cognitive support of abandonment adopted so far, is able to effectively support policies and strategies aimed at reducing and containing this phenomenon.
6. Discussion
By comparing the two maps, the one of the classifications of inland areas according to SNAI and the one obtained as a result of this study on the basis of the estimated abandonment index in the perspective of an axiology of weak areas, marked differences can be highlighted.
In the map according to the NSIA classification (
Figure 18a) the ultra-peripheral areas highlighted by the darker gray color, to which correspond the areas characterized by the highest level of marginality, fall in the central and northern areas of Sicily, the Pelagic islands, and the island of Pantelleria and Salina. In the new map (
Figure 18b) the areas characterized by an
belonging to the high class, highlighted by darker gray, fall in the central and northern areas of Sicily. Between the two maps there is a convergence for the location of the areas affected by the phenomenon of abandonment, but divergences with reference to the extent of the areas affected, more extensive in the case of the new map and a different characterization for the Pelagic islands, the island of Pantelleria and Salina.
In the map according to the NSIA classification (
Figure 18a) the peripheral areas highlighted by gray, to which correspond the areas characterized by an intermediate level of marginality, affect large portions of the Sicilian territory mainly in the central, eastern-northern, and western-northern areas and in the southern areas of Sicily, the Aeolian and Egadi islands. In the new map (
Figure 18b) the areas characterized by an
belonging to the medium-high class, highlighted by gray, fall in the central and northern areas of Sicily, the Aeolian and Egadi islands. Between the two maps there is still a convergence for the location of the areas affected by the abandonment phenomenon, as well as divergences with reference to the extent of the areas affected, which are smaller in the case of the new map and a different characterization of the Aeolian and Egadi.
In the map according to the NSIA classification (
Figure 18a) the intermediate areas highlighted by the light gray color, to which correspond the areas characterized by a low level of marginality, cover large portions of the Sicilian territory, mainly in the central and eastern areas of Sicily. In the new map (
Figure 18b) the areas characterized by an
belonging to the medium class, are highlighted by lighter gray, and fall in the central area of Sicily, the Pelagic and Egadi islands. Between the two maps there is still a partial convergence for the location of the areas affected by the phenomenon of abandonment with reference to the central areas, but also divergences with reference to the extent of the areas affected, smaller in the case of the new map and a different characterization of the Pelagic and Egadi islands.
Based on the fourth class of
, i.e., the low class, highlighted by very light gray, the new map (
Figure 18b) highlights extensive portions of Sicilian territory predominantly falling in the eastern, southern and northern areas, the island of Pantelleria and the Aeolian Islands. These areas are identified in the NSIA classification as intermediate and peripheral, while the former characterization could be considered congruent with the low class of
, the latter certainly highlights a discordance between the two maps.
Going into more detail, a comparison of the percentages of municipalities between the two classifications, the one with reference to
, and the NSIA classification, reveals strong divergences. The municipalities falling in the fourth quartile of
, and thus belonging to the high class of abandonment, in the NSIA classification can be classified as intermediate, peripheral, and ultra-peripheral areas, as is highlighted in
Figure 19a. In particular, it is noted that: the metropolitan cities of Agrigento, Enna and Messina are characterized by municipalities that can be classified in the three types of NSIA areas; the metropolitan cities of Caltanissetta, Catania and Palermo are characterized by municipalities that can be classified in two types of NSIA areas; and the metropolitan cities of Syracuse and Trapani are characterized by municipalities that according to the NSIA belong to the peripheral area for the former and to the intermediate area for the latter.
This detects a divergence, in that areas with profoundly different levels of marginality for the NSIA classification fall in the same class of high. More importantly, it is possible to highlight municipalities with high levels of marginality, such as those falling in the ultra-peripheral areas of the NSIA classification, while falling in the fourth quartile in the estimated index. This highlights a criticality of the NSIA classification in detecting the actual status in terms of marginality of municipalities.
A convergence between the two classifications is detectable for the Ragusa metropolitan area, which for the NSIA classification is characterized only by intermediate areas and for which no municipality falling in high can be detected.
The same divergences can be detected by comparing the NSIA classification with that for
Medium-high, Medium and Low (
Figure 19a–d). Again, the only convergence detected between the two classifications still concerns the Ragusa metropolitan area, for which there are absent municipalities falling in the
Medium-high class, and present municipalities falling in the Medium and High class, considering the latter range of values likely to be similar to those of an intermediate area, which is the only type of area provided for Ragusa in the SNAI classification.
For the Region of Sicily, four areas have been identified for which an area strategy has been identified in order to counter the phenomenon of abandonment and promote measures aimed at territorial rebalancing. The proposed supporting policies are place-based and provide directions for promoting the SDGs [
9] in these areas. The strategies are mainly based on Citizen Empowerment for Health, Active Land Protection, Renewable Energy Production, Rural System Development, Supporting Local Businesses and Crafts to Promote Employment, Enhancing Territorial Accessibility and Mobility, Improving Tourism Supply, Reducing Digital Device, Promoting Local Community Participation, Community Services and Social Infrastructure, Enhancing Human Capital, Partnerships, Sustainable Communities [
148,
149].
The four areas identified according to the NSIA classification of inland areas are Calatino, Madonie, Nebrodi and Val Simeto. These areas are characterized by the territorial contiguity of municipalities that have joined the Framework Program Agreements. The different areas include municipalities that can be classified according to NSIA as intermediate areas, peripheral and ultra-peripheral, and in some cases, as in the case of the Madonie and the Val di Simeto even those falling within the belt areas. For example, with reference to the case of the Nebrodi area strategy (
Table 8), it includes nineteen municipalities falling within the Messina metropolitan area. The municipalities in the Messina metropolitan area adhering to the Framework Agreement with reference to the NSIA classification are characterized: four as intermediate areas, thirteen as peripheral areas, and two as ultra-peripheral areas. With reference to the abandonment index estimated in this study, four of them fall in the first quartile; eleven in the second quartile; three municipalities fall in the third quartile and only one municipality falling in the quartile.
Again, as in all the other areas identified, the municipalities participating in the area strategy are characterized by territorial contiguity. They belong to the same territorial sub-area as the metropolitan area of Messina.
The NSIA Classification can be seen as a cognitive tool to support networking among municipalities, in this case supported the identification of a mix of municipalities characterized by different levels of marginality, in which 21 percent fall in intermediate areas, 685 in peripheral areas and 11 percent in ultra-peripheral areas. The network selected in this case integrates municipalities with strongly marked marginalities, others with less marked marginalities, and still others with small marginalities. If strategies were effectively selected for this network, it could foster those complementarities among municipalities capable of generating a territorial unity that could achieve greater enhancement than a single municipality could achieve.
The classification according to the index of abandonment estimated in this study developed from the perspective of an axiological approach highlights, in a more pronounced way the possibility of generating a network on the basis of the complementarity of municipalities. For the case of the Nebrodi area, we show that 21% of the municipalities fall in the first quartile of , 58% in the second quartile of , 16% in the third quartile and 5% in the fourth quartile of . Again, a main pole is detected, which is represented by the municipality or municipalities with the highest perfomance on the base are connected those with progressively worse performance thus defining the network.
According to this perspective, the measure of the values and/or disvalues of municipalities, i.e., the measure of their residual worthiness identified in the index is possible to more effectively support the selection of municipalities that will be able to fall within a functional area and to support the creation of a network. Classification on the basis of the abandonment index will be able to support the decision maker in identifying an area unit and creating specific development strategies.
The mapping of inland areas proposed by NSIA represents the official cognitive tool to counter the marginalization and abandonment of territories. Italy among European countries is the first country that has produced a reconnaissance of the state of abandonment of the territory, proposing a unified framework to develop strategies to counter this phenomenon. This mapping is the basis for the allocation of financial resources provided in Mission 5, Component 3, Investment 1 of the Italian National Recovery and Resilience Plan (NRP) [
22]. It represents the financial tool to support the implementation of policies aimed at reducing social distress and fragility, increasing the number of service recipients, increasing the quality of supply, and facilitating connections and accessibility to territories and services.
In Europe, other countries have promoted policies aimed at territorial rebalancing and finding funding to support it. For example, France a promoted in 2014 “
Revitalisation des centres-bourges” [
150] which represents the first national program aimed at intervening in the imbalances that affected small and medium-sized cities, which until then had been excluded from national urban policies that were mainly directed at
grandes villes. Later, in order to improve the level of policy implementation with reference to the peculiarities of the areas of action, France proposed other programs such as the “
Action Coeur de Ville” in 2018 [
151], which is aimed at improving the living conditions of the inhabitants of medium-sized centers and consolidating the leading role of these centers in the development of the territory. In 2020, France proposed the program “
Petites villes de demain” nel 2020 [
152], aimed at improving the living conditions of the inhabitants of small towns and surrounding areas by supporting communities in identifying dynamic trajectories for their ecological transition.
Other countries, such as Switzerland, adopted a New Regional Policy (NRP) in 2008 [
153] to support mountain and border regions and rural areas, promoting improved hard and soft location factors of regions, promotion of innovation, value creation and competitiveness in a sustainable way [
154,
155,
156,
157].
In this way, the NRP contributes to the creation and retention of jobs in the targeted areas, to compensate for regional disparities, and to maintain decentralized settlement structures in Switzerland. The NRP also promotes European territorial cooperation in line with the Interreg, ESPON, URBACT and INTERACT programs [
158].
In Spain, the issue of depressed areas due to their depopulation and socio-economic decline was initially addressed by some regions, such as Castilla-La Mancha, which in 2016 approved the definition of five geo-graphic areas with specific development needs [
159], as well as the initiation of procedures for the implementation of integrated territorial investments, i.e., tools to facilitate support for integrated actions in an area, allowing the combination of funding related to different thematic objectives and various operational programs supported by the various European Structural and Investment Funds (EIFs).
Subsequently, the Spanish Council of Ministers on March 29, 2019 approved the General Guidelines for a National Strategy to Address the Demographic Challenge by mapping demographic depopulation, aging, and the effects of population fluctuation and setting the following goals [
160]: ensure full territorial connectivity; ensure adequate provision of basic services to the entire population; incorporate demographic impact and perspective in the preparation of laws, plans and investment programs; regulatory and administrative simplification, for small municipalities; enhance the image and reputation of territories most affected by demographic risks; strengthen public-private collaboration; and align the Strategy’s action lines with the achievement of the Sustainable Development Goals and Agenda 2030.
Other interventions in favor of marginal areas are being planned in Spain under the impetus of a debate on the subject (which is quite heated), such as the program “El plan de España para evitar la despoblación rural”, which is still being structured.
The mapping of inland areas proposed by NSIA to support the development of strategies aimed at combating abandonment of territories is a tool that as highlighted in this study has ample room for improvement. In this regard, our proposal for a new mapping based on an abandonment index moves in the direction of improving the formation of a knowledge base of the phenomenon of abandonment, instrumental in identifying strategies and improving the effectiveness of policies.
The main limitations of this study are mostly due to the quality of the data used in the analysis, which although extracted from official datasets, unfortunately refer to different periods. This factual criticality is also detectable for the data used to develop the NSIA classification of inland areas.
With this in mind, we will estimate the abandonment index again in the future once NSIA makes data on the 2021 Permanent Population and Housing Census available.
But more significantly, possible developments of this study will address the question of how this cognitive tool can support decision makers in generating the network of municipalities and supporting strategies in order to achieve more effective implementation of policies in favor of a rebalancing of the territory [
161,
162,
163].
Future studies will look at the potential of this approach in supporting a territorial values-network-based pattern that can be developed with the support of network analysis, neural network or specific genetic algorithms, aimed at optimizing the selection of areas, strategies and improving the allocation of budgets to those areas.
The estimation of an abandonment index for marginal areas was developed from the perspective of a formative model, in which individual indicators are seen as the “cause” of the latent variable.
PCA for the construction of formative composite indices, as highlighted by Mazzotta and Pareto [
164], is a good approach, as it is a powerful tool for complexity reduction and supports data visualization by supporting the researcher in identifying units of analysis with the same characteristics and allows for comparing empirical dimensions (factors) with theoretical dimensions (pillars) while highlighting redundant indicators [
165].
Future developments in the estimation of an abandonment index for marginal areas will concern the estimation of weights for the aggregation of the different components. A sensitivity analysis of the index based on the different approaches to estimating the weights may improve its estimation. Further development may concern uncertainty analysis (UA) [
166].
7. Conclusions
The marginalization of areas due to progressively increasing social, material, economic, and infrastructural vulnerability is a phenomenon that afflicts many countries today and is growing rapidly [
167,
168]. The 2030 Agenda highlighted the need to identify measures to support the least developed areas, particularly with reference to Goal 11 of the SDGs [
9].
Under the impetus of the sustainability goals set by the 2030 Agenda, there has been a growing awareness among researchers and policymakers that this issue is no longer deferrable, and that it will have to be addressed while being aware of the complexity of the phenomenon. The debate on the issue of abandonment has developed mainly from the perspective of characterizing the phenomenon of abandonment, resulting in actions to measure its magnitude and determine its causes, and on identifying strategies and measures to counter it, and the related sources of funding to be allocated. In this perspective, Italy has equipped itself with a cognitive tool created by the Interministerial Committee for Economic Planning and Sustainable Development, namely the map of inland areas, aimed at to measure the extent and determine the causes of the phenomenon; an operational tool aimed at combating the phenomenon of abandonment aimed at identifying the strategies and interventions to be developed within the framework of the National Strategy for Inland Areas; and a financial tool aimed at supporting the implementation of the specific measures identified, namely the NRRP.
In this study starting from a critical analysis of the NSIA classification of inland areas, we have proposed a new cognitive tool of the phenomenon of abandonment, developed from the perspective of an axiological approach of marginal areas, which led to a mapping of the phenomenon of abandonment on the basis of an index of abandonment . This index was defined on the basis of the value of the different forms of territorial capital of marginal areas, i.e., with reference to human, urban, economic, infrastructure, natural, cultural, and environmental capital. Given the large number of indicators of territorial capital, in order to arrive at the most representative set of indicators, and thus to reduce the complexity of representing the different forms of capital, it was necessary to resort to Principal Component Analysis. The latter supported the identification of twenty-seven components for the characterization of the abandonment index, which was estimated as an aggregate weighted sum of the different components.
The mapping of the abandonment index on QGIS made it possible to identify a new cognitive tool of the abandonment phenomenon, capable of highlighting the values and/or dis-values of areas. The map provides clusters of municipalities based on quartiles of estimated index values. Mapping, in identifying the residual worthiness of areas, can be used for the development of strategies to support their resilience, improve the effectiveness of policies, and promote the efficient use of financial resources to be allocated. It, as amply evidenced in the proposed comparisons with the NSIA classification, can identify itself as a more effective cognitive tool to support the development of strategies to reduce abandonment and promote rebalancing. Certainly, in order to improve the result, we have arrived at, the limitations of this study will have to be overcome.
These limitations are mostly related to the quality of the data, which due to difficulties related to their retrievability refer to different periods, is an issue that can be resolved as soon as NIS makes available the data on the 2021 Permanent Population and Housing Census. Possible developments of this study will address the question of how this cognitive tool can support decision-makers in generating the network of municipalities and identifying strategies, supporting more effective implementation of policies aimed at reducing territorial imbalances.
Subsequent work, therefore, will address the potential of this approach to support a territorial values network-based pattern that can be developed with the support of network analysis, neural networks or specific genetic algorithms aimed at optimizing the selection of areas and strategies and improving the allocation of budgets to different areas.


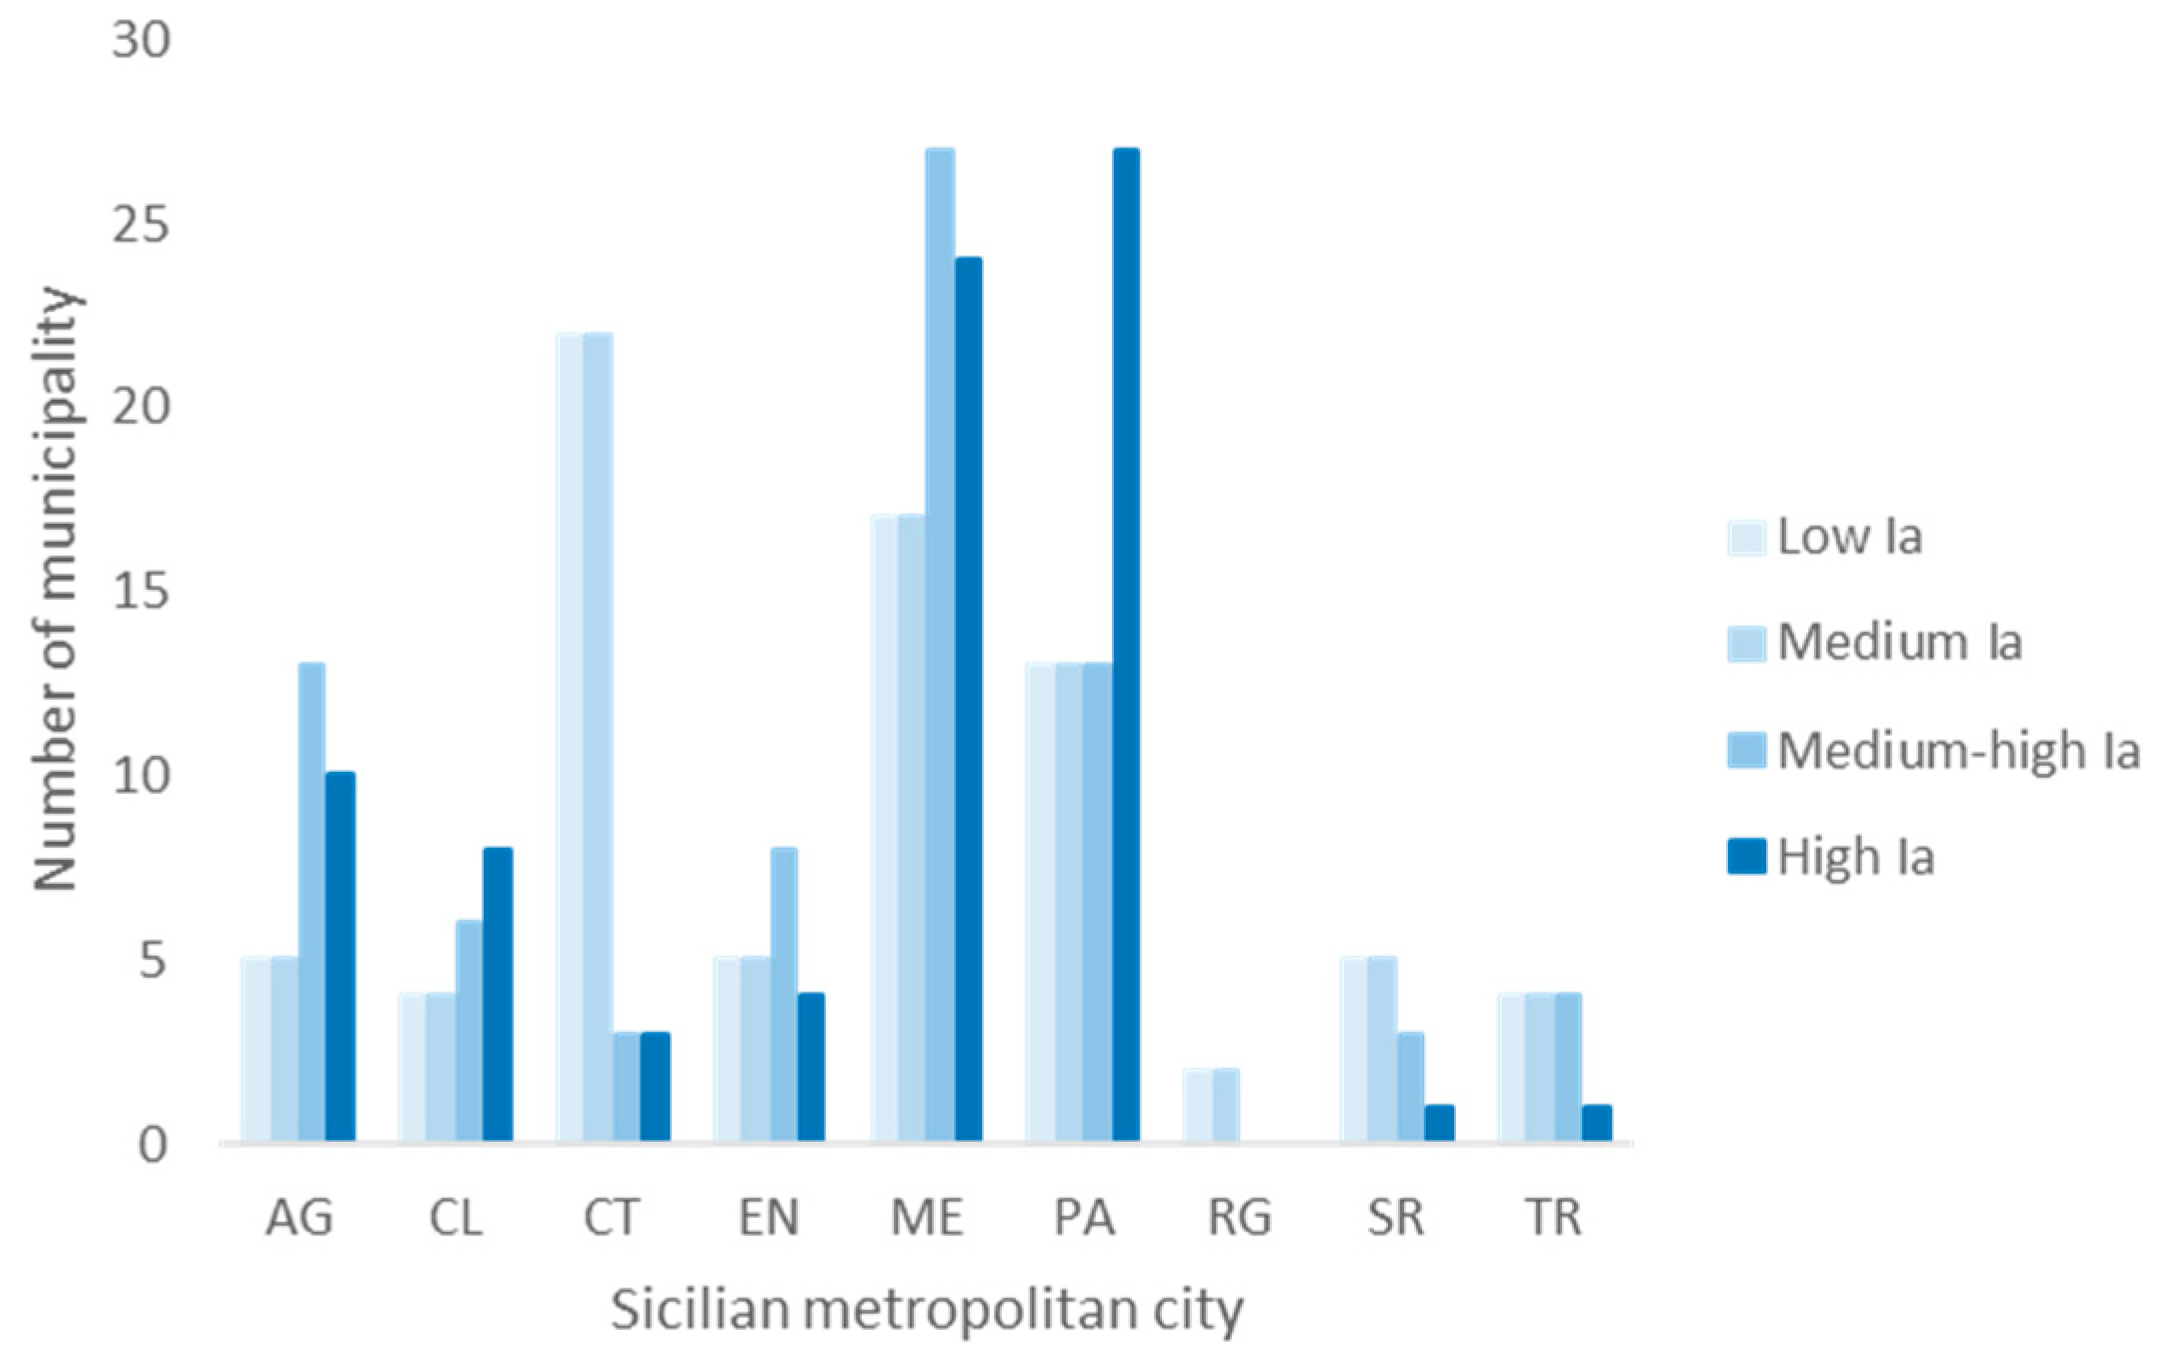


