


Characterization of Land-Cover Changes and Forest-Cover Dynamics in Togo between 1985 and 2020 from Landsat Images Using Google Earth Engine

 ,
,  ,
, 
Abstract
:1. Introduction
2. Study Area and Data Used
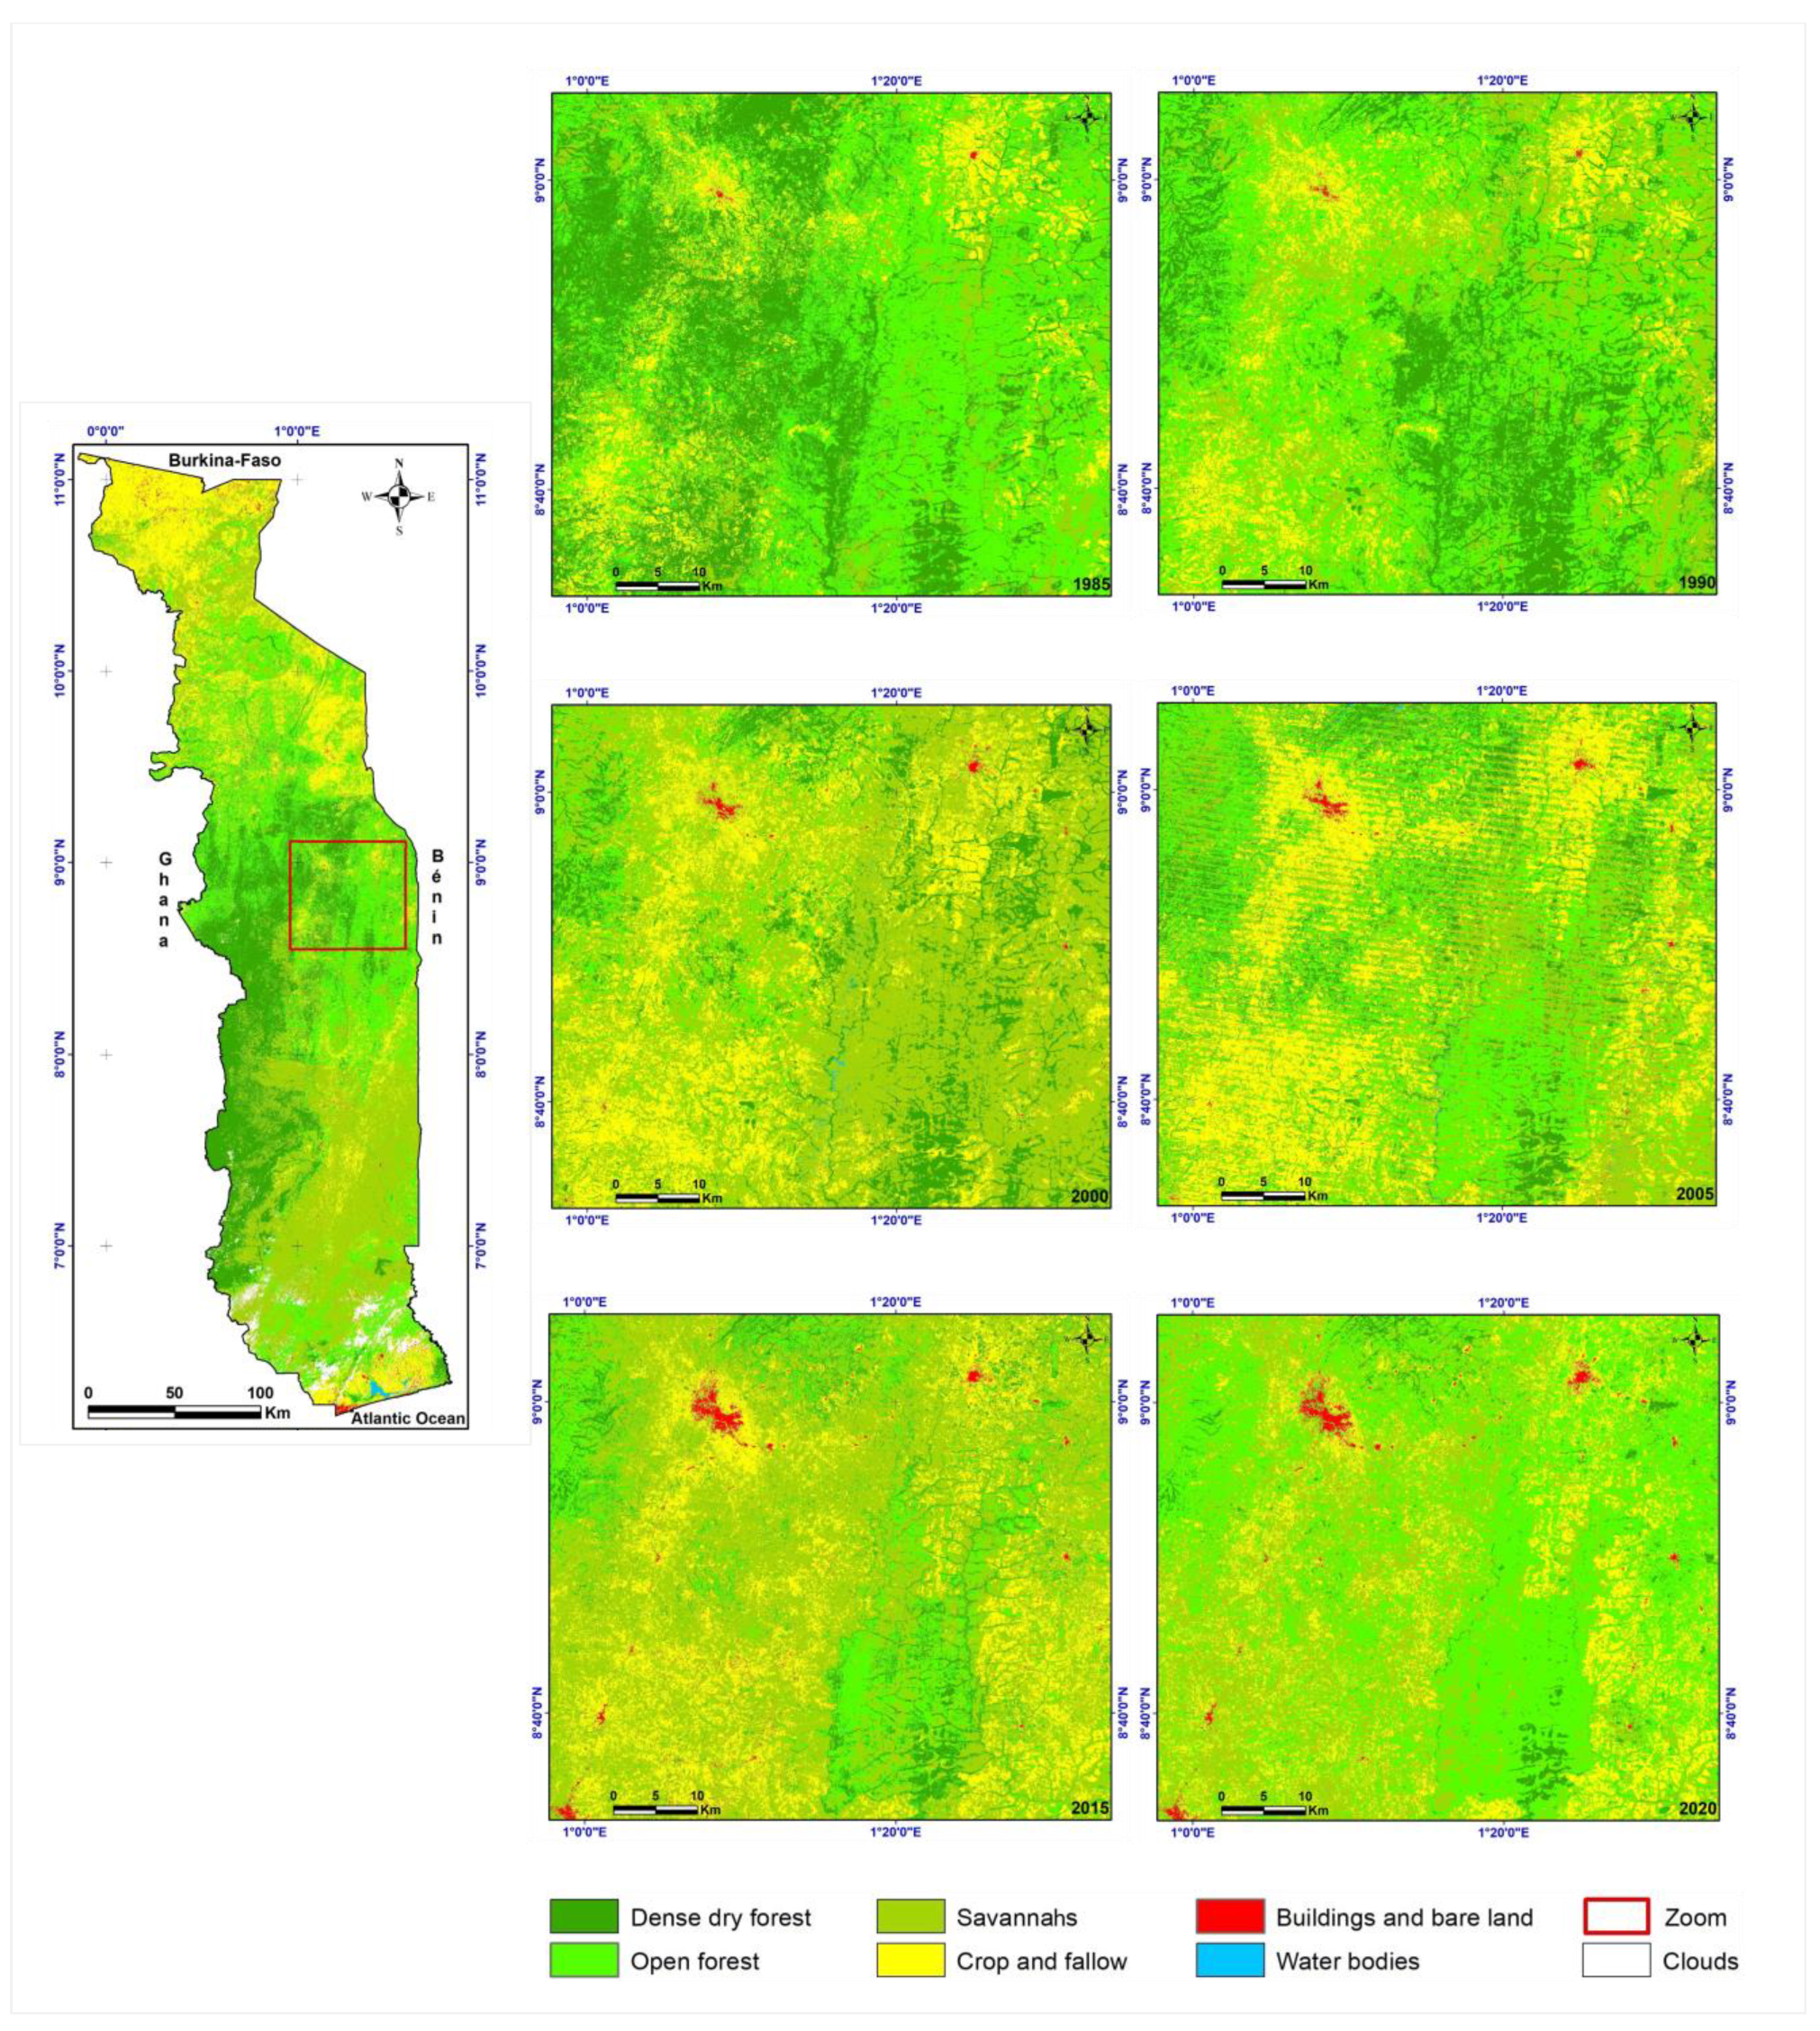
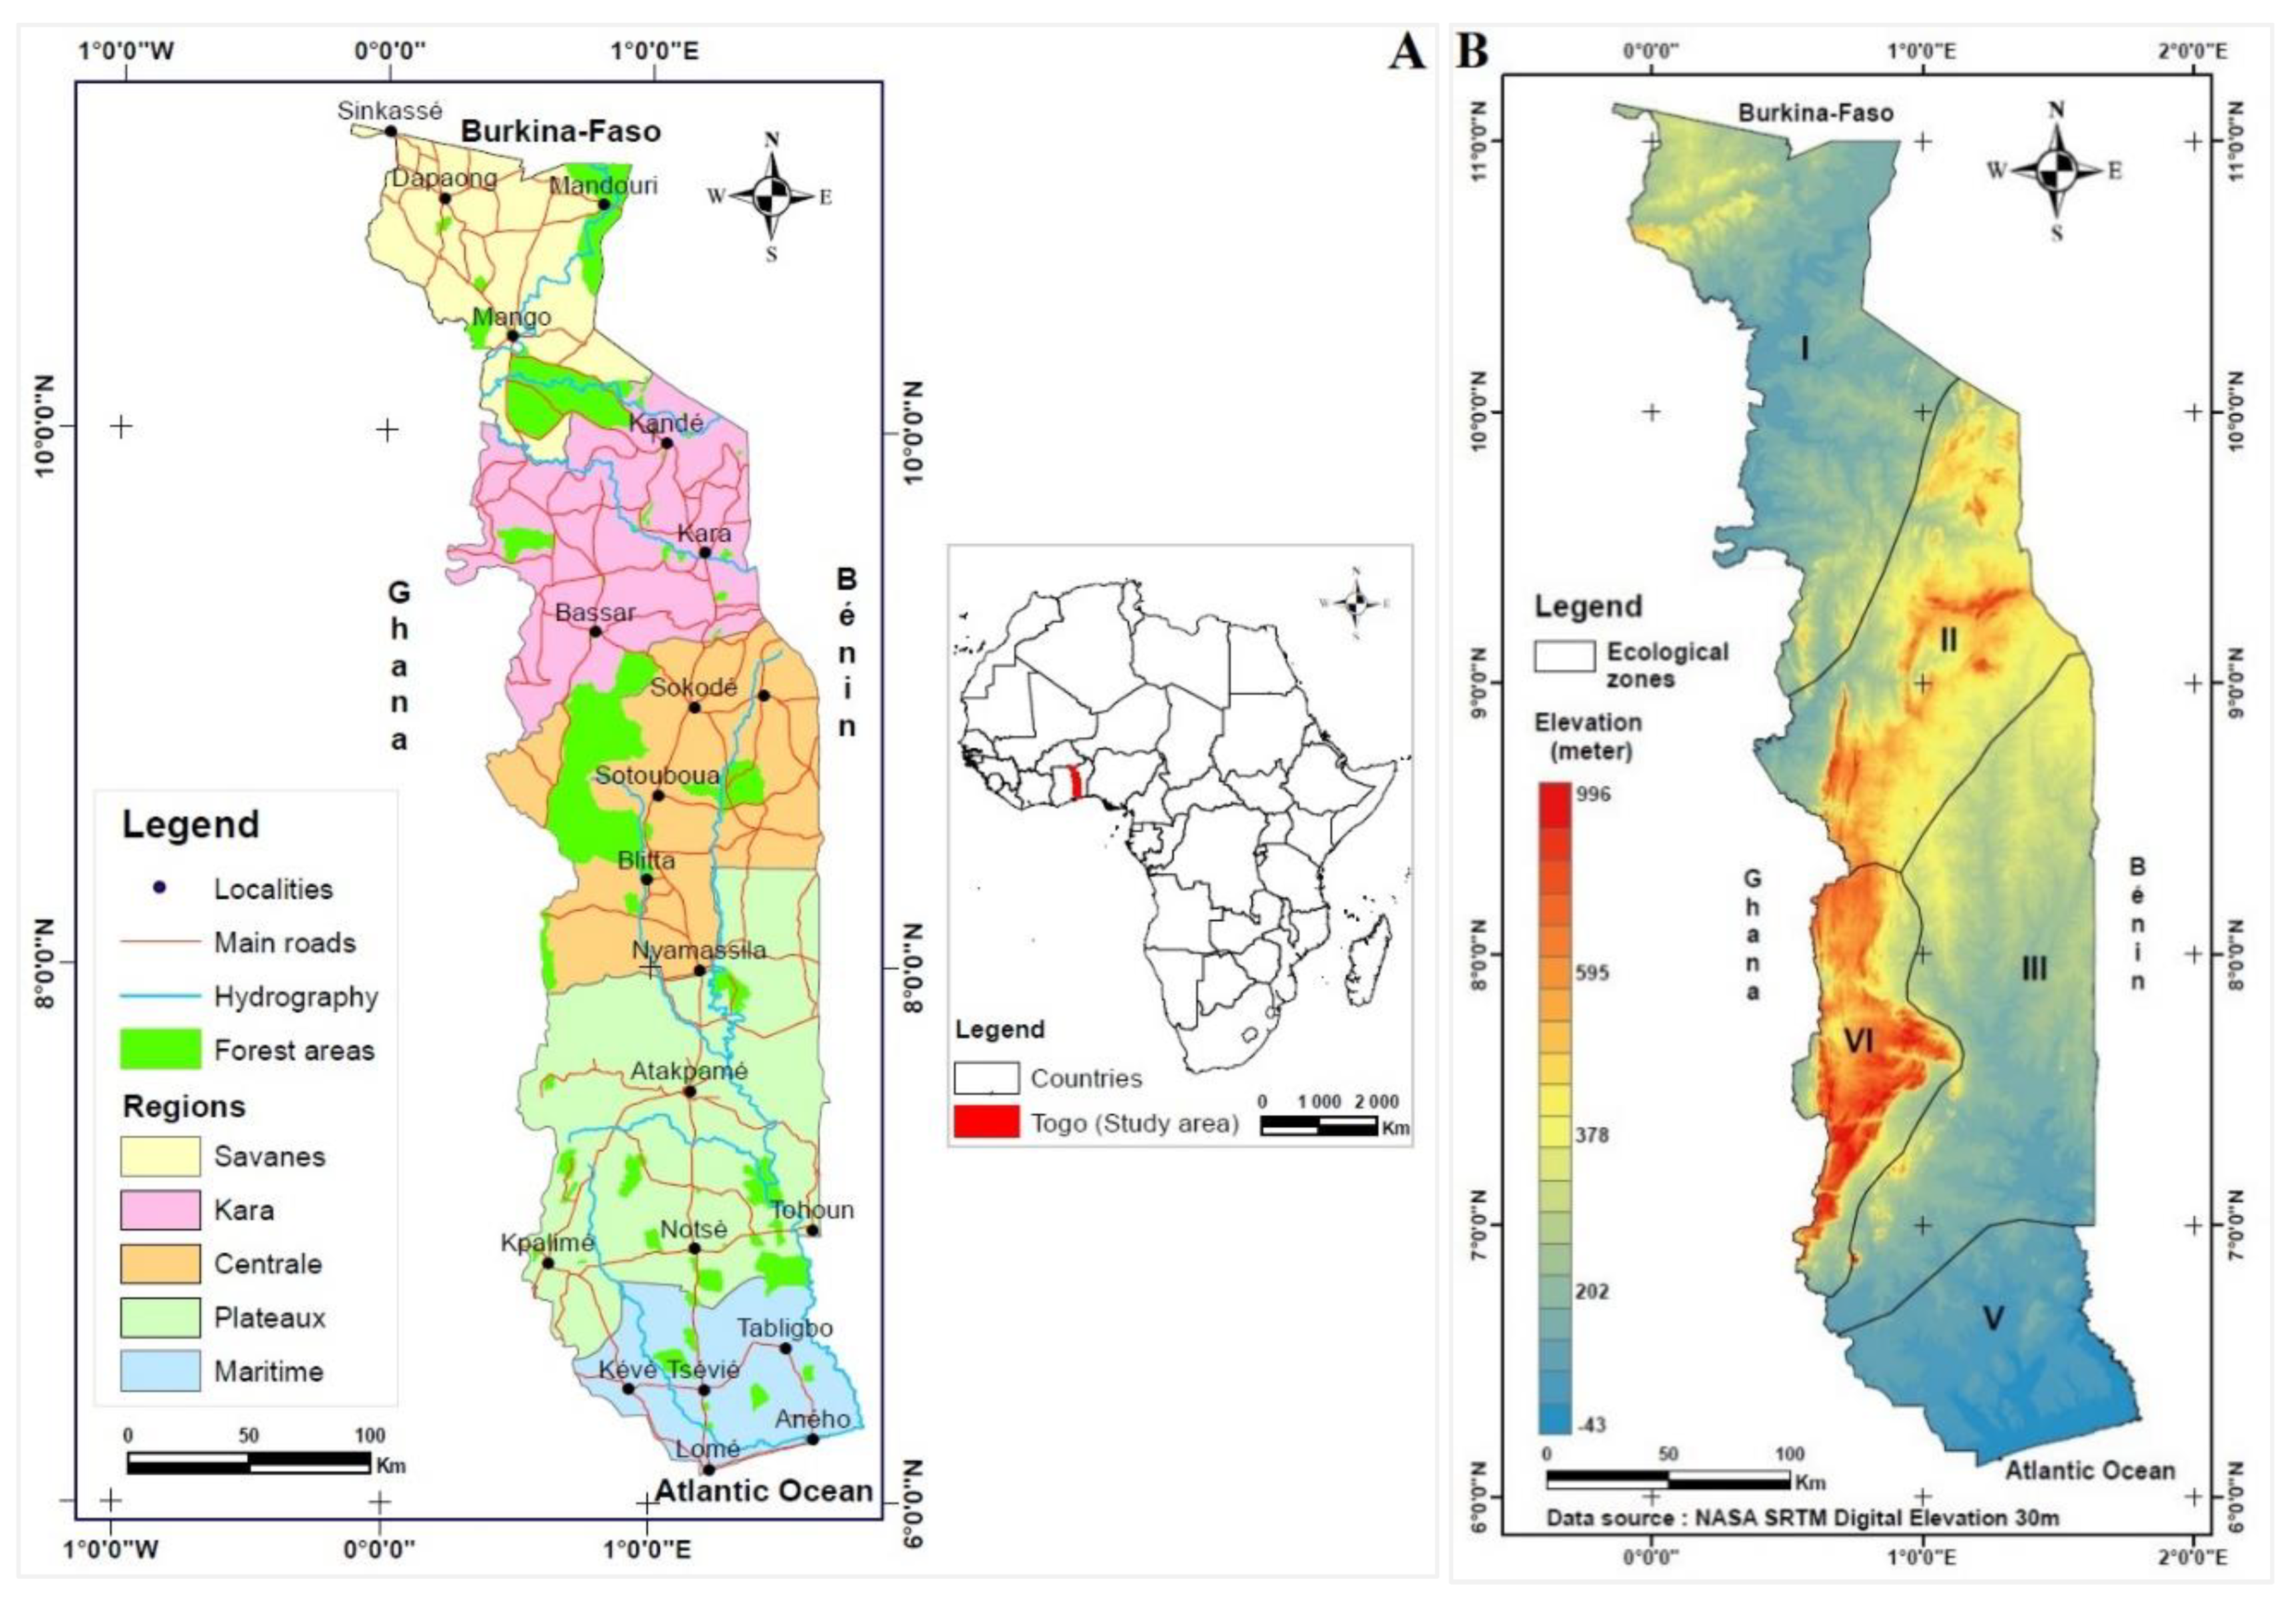
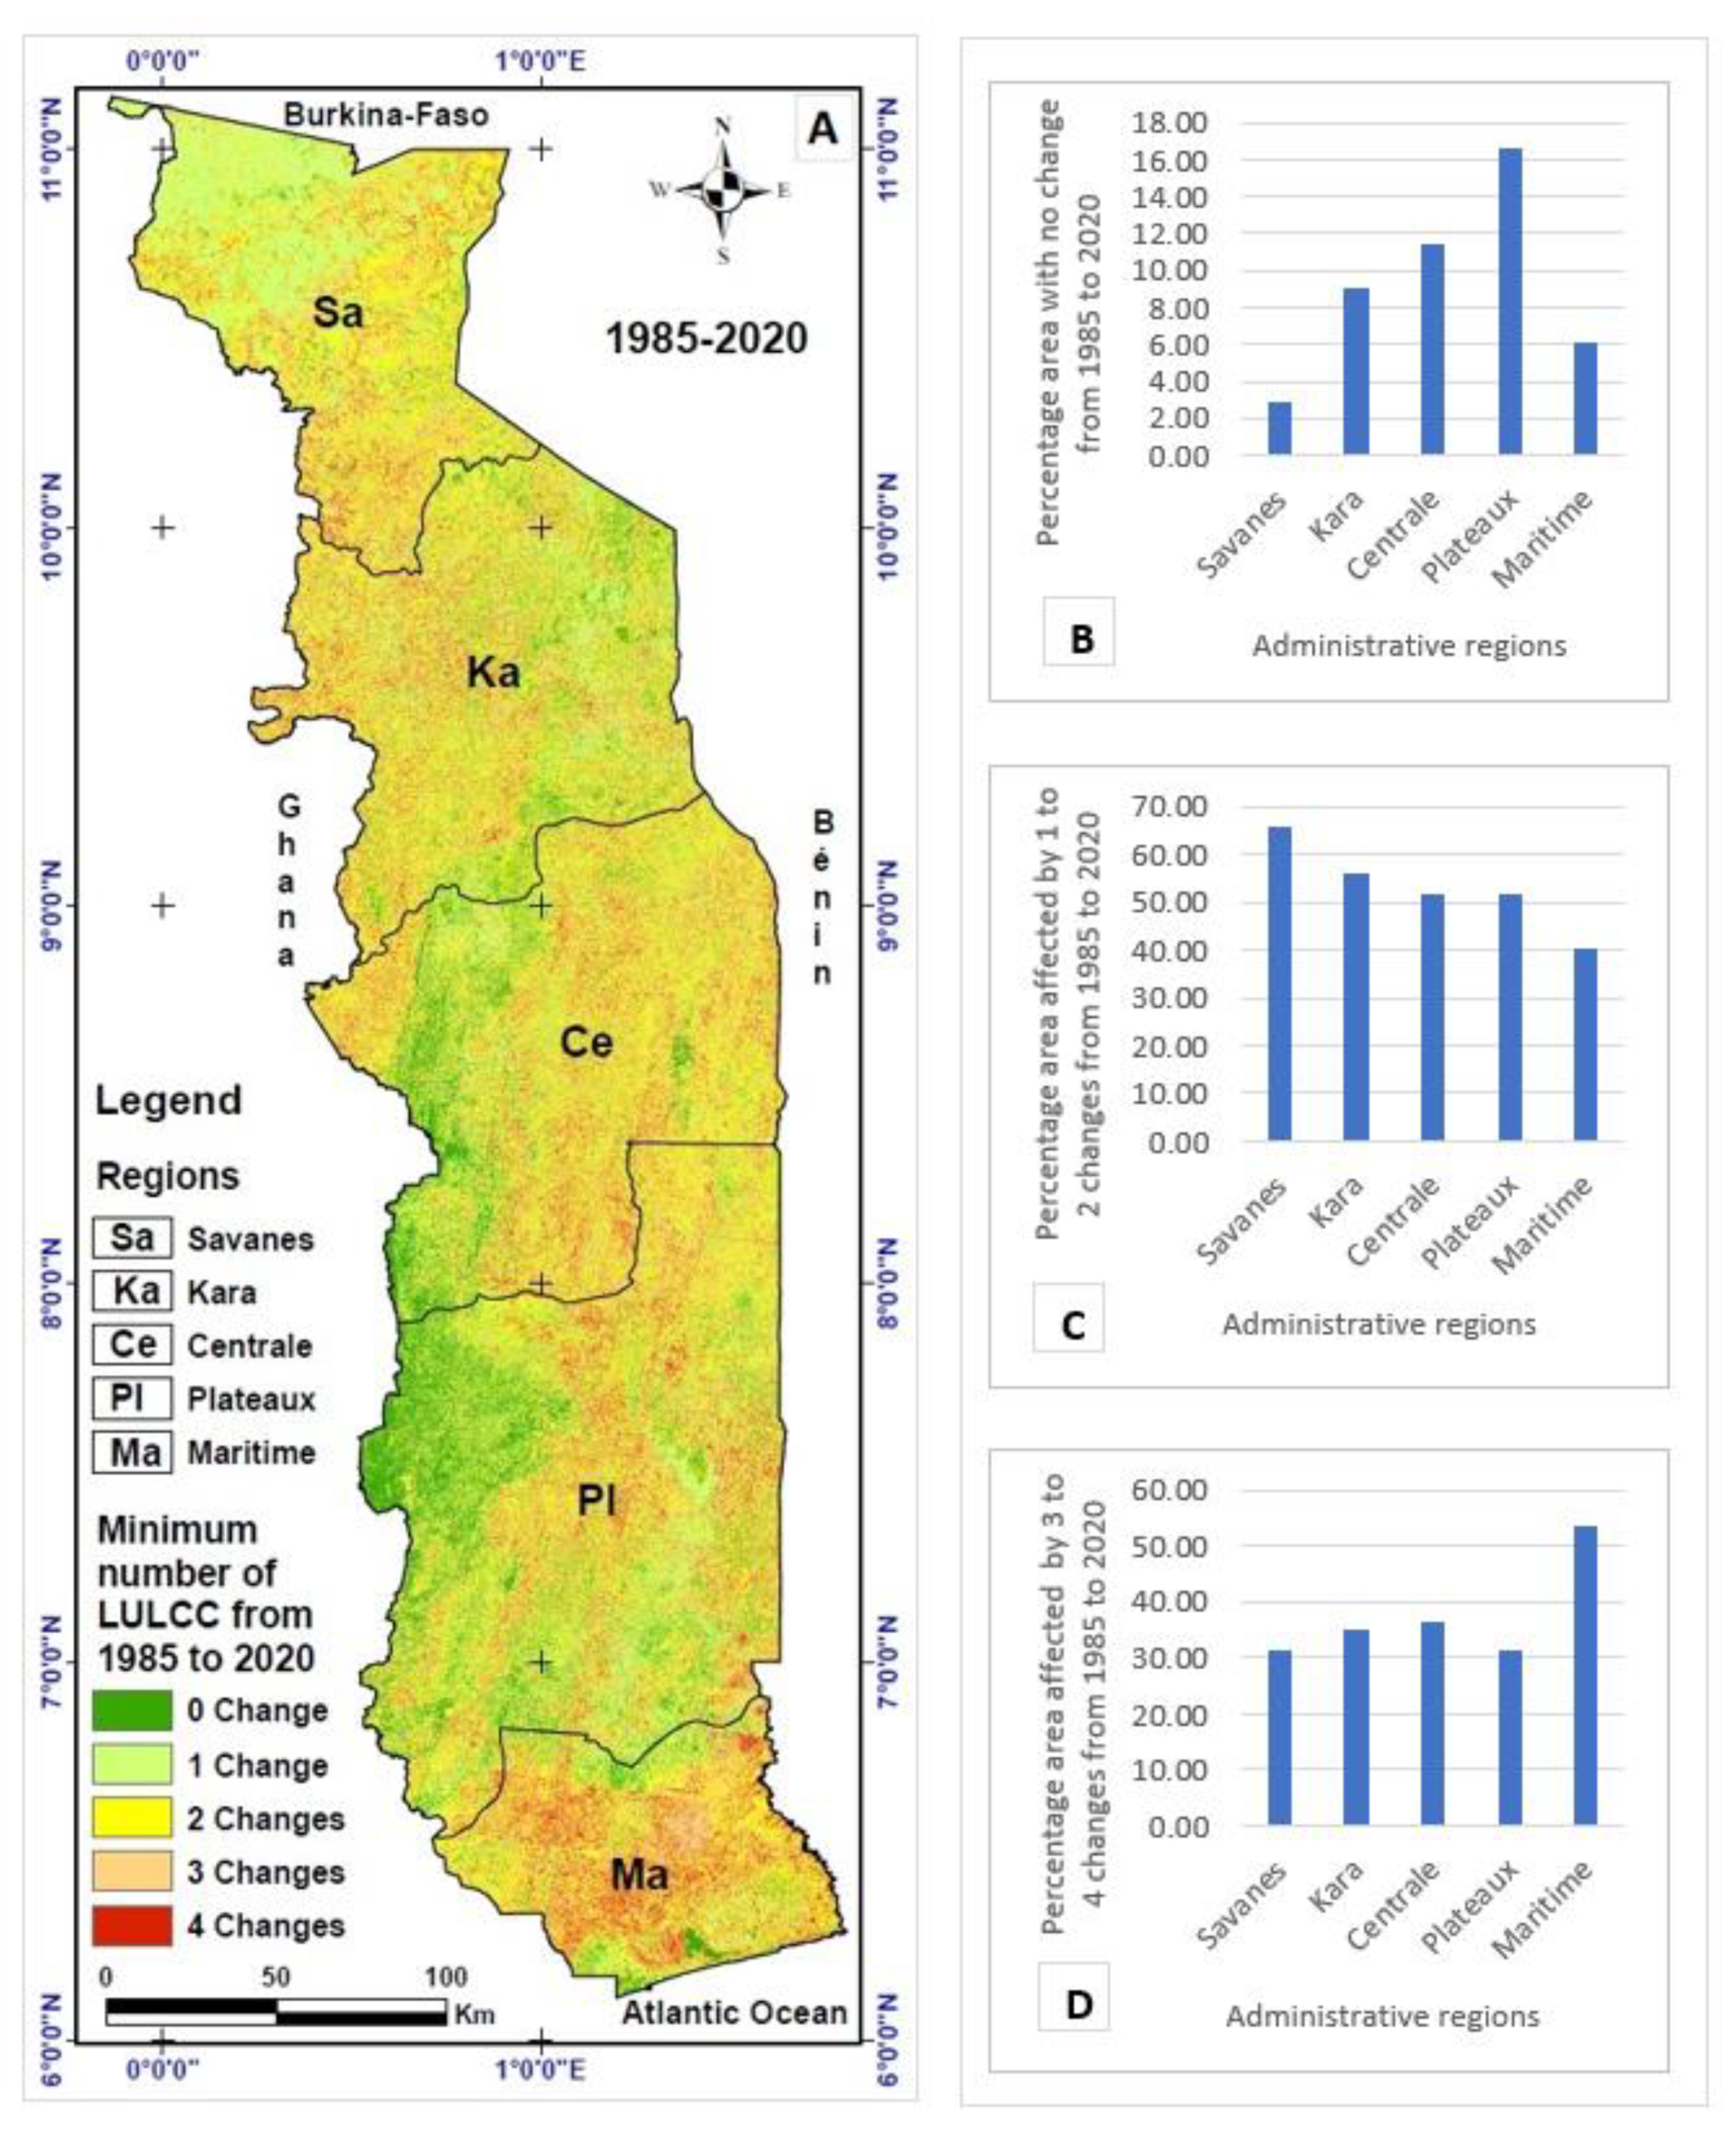
2.1. Study Area
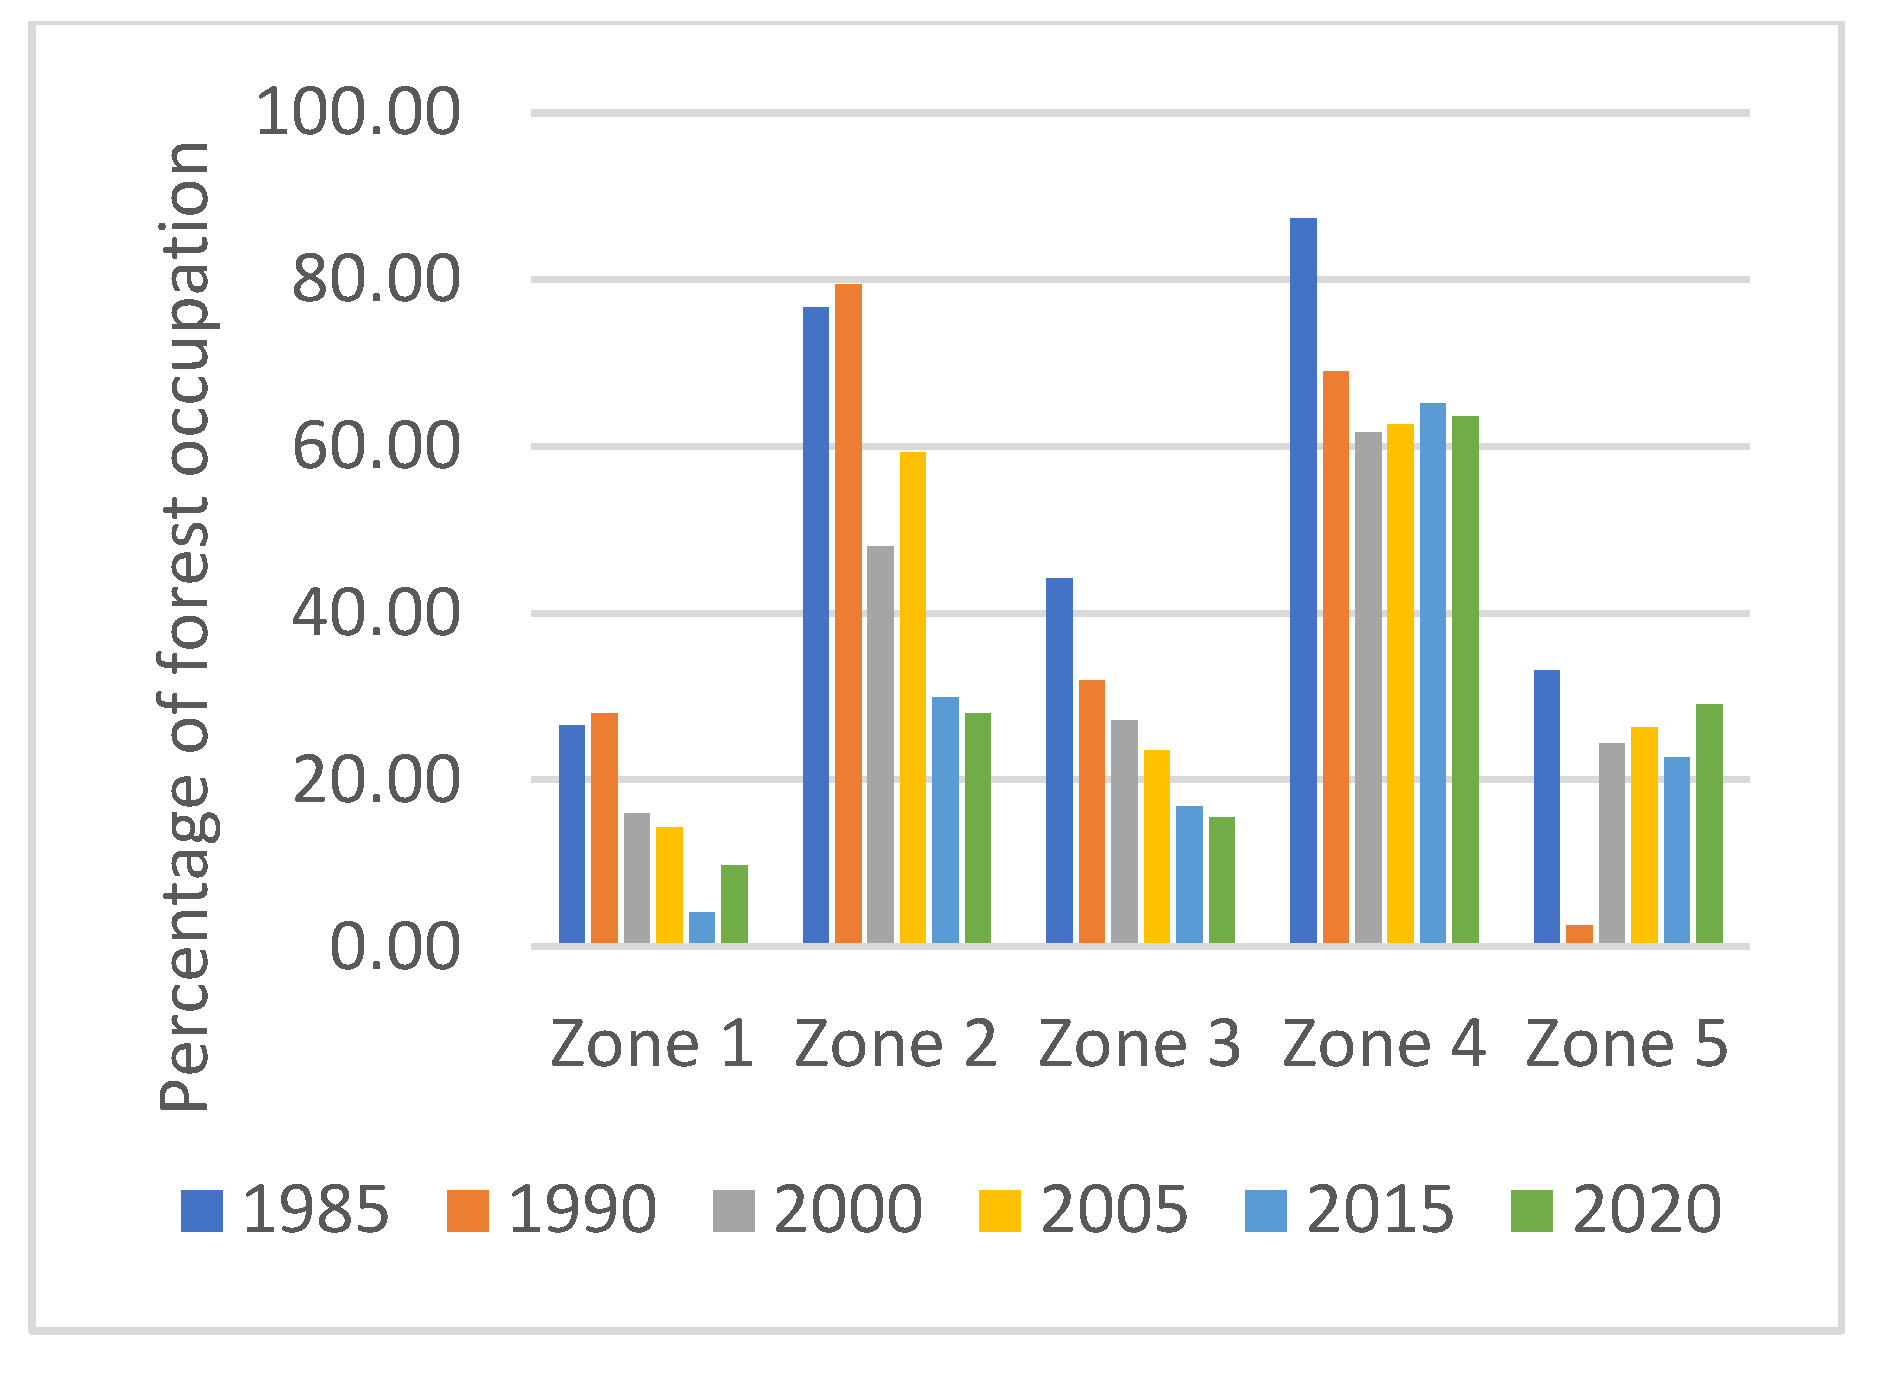
- Zone I (or Northern Plains Zone): This zone extends from the Dapaong peneplain to the southern limit of the Volta Basin, approximately following the Bendjeli-Kpessidè axis. This area is essentially dominated by agro-ecosystems; however, there are relic mosaics of savannahs, dry forests, degraded riparian forests, and swamp vegetation adjacent to the hydrographic network. The main spontaneous ligneous species found in this zone are Vitellaria paradoxa, Anogeisus leiocarpus, Borassus aethiopum, Parkia biglobosa, Balanites aegyptiaca, Lannea microcarpa, and Detarium microcarpa. The natural ecosystems of this area are highly degraded (80%), given the strong propensity of the inhabitants to practice unsustainable cultivation (68%) and fuel wood exploitation (28%). The zone is heavily disturbed by vegetation fires (40%), which have then been followed by extensive grazing (28%) [34].
- Zone II (or Northern Mountains Zone): This zone encompasses the Northern Mountain Range and extends between 8° and 10° N northeast under the influence of a Sudanian mountain climate. This zone is dominated by agrosystems, yet dry forests, open forests, and savannah mosaics can be found. Its main spontaneous ligneous species are Parkia biglobosa, Vitellaria paradoxa, Nauclea latifolia, Daniellia oliveri, Elaeis guineensis, Piliostigma thonningii, Terminalia laxiflora, and Isoberlinia doka. In this zone, natural ecosystems are also degraded (58%) and heavily disturbed by extensive grazing (31%), followed by vegetation fires (25%), floods (19%), and transhumance (seasonal livestock relocation, 17%). Activities such as working crop fields (41%), logging (22%), and grazing (20%) strongly contribute to ecosystem degradation [34].
- Zone III (or Central Plains Zone): This zone occupies the Benin-Togolese plain east of the Atakora Mountain Chain; it is characterized by a Guinean Lowland climate and is dominated by a diversity of agrosystems. This matrix of agroforestry parks combines patches of mosaic savannah, semi-deciduous forest, and degraded riparian formations. This zone is characterized by the following main spontaneous ligneous species: Daniellia oliveri, Parkia biglobosa, Vitellaria paradoxa, Pterocarpus erinaceus, Anogeissus leiocarpus, and Adansonia digitata. The natural ecosystems of this agro-ecological zone are 96% degraded. This degradation of ecosystems is the consequence of the exploitation of wood energy (46%) and cultivation practices (41%) and is not very sustainable. Ecosystems in this zone are strongly disturbed by vegetation fires (31%), transhumance (31%), and erosion (24%) [34].
- Zone IV (or Southern Zone of the Togo Mountains): This zone corresponds to the southern portion of the Togo Mountains. It has a sub-equatorial climate with a rainy season. Its main spontaneous ligneous species are Cola gigantea, Millettia thoningii, Morinda lucida, Sterculia tragacantha, Antiaris fricana, Holarrhena floribunda, and Margaritaria dioscoidea. Today, it is the domain par excellence of agroforestry that is interspersed with semi-deciduous forests and mosaics of Guinean savannah. The natural ecosystems of the southern zone of the Togo Mountains are highly degraded (70%), given that they are heavily disturbed by vegetation fires (55%), often followed by extensive grazing (15%), and logging (10%). Activities such as working the crop fields (59%) and logging (18%) contribute to the substantial degradation of ecosystems [34].
- Zone V (or Southern Coastal Zone): This zone corresponds to the country’s coastline with a sub-equatorial climate with two rainy seasons. The very degraded natural environment is strongly dominated by agrosystems, with relic mosaics of savannahs, halophytic or swampy grasslands, and mangroves. The main spontaneous ligneous species found there are Lonchocarpus sericeus, Parkia biglobosa, Piliostigma thonningii, Dialium guineense, Holarrhena floribunda, Bridelia ferruginea Millettia thonningii, and Vitellaria paradoxa. These natural ecosystems are highly degraded (85%) due to cultivation practices (59%) and the unsustainable exploitation of wood energy (18%) and urbanization (10%). Lands in the Coastal Zone have been heavily disturbed by vegetation fires (55%), which are often followed by extensive grazing (15%), and transhumance, woodcutting, and flooding (5%) [34].
2.2. Data Used
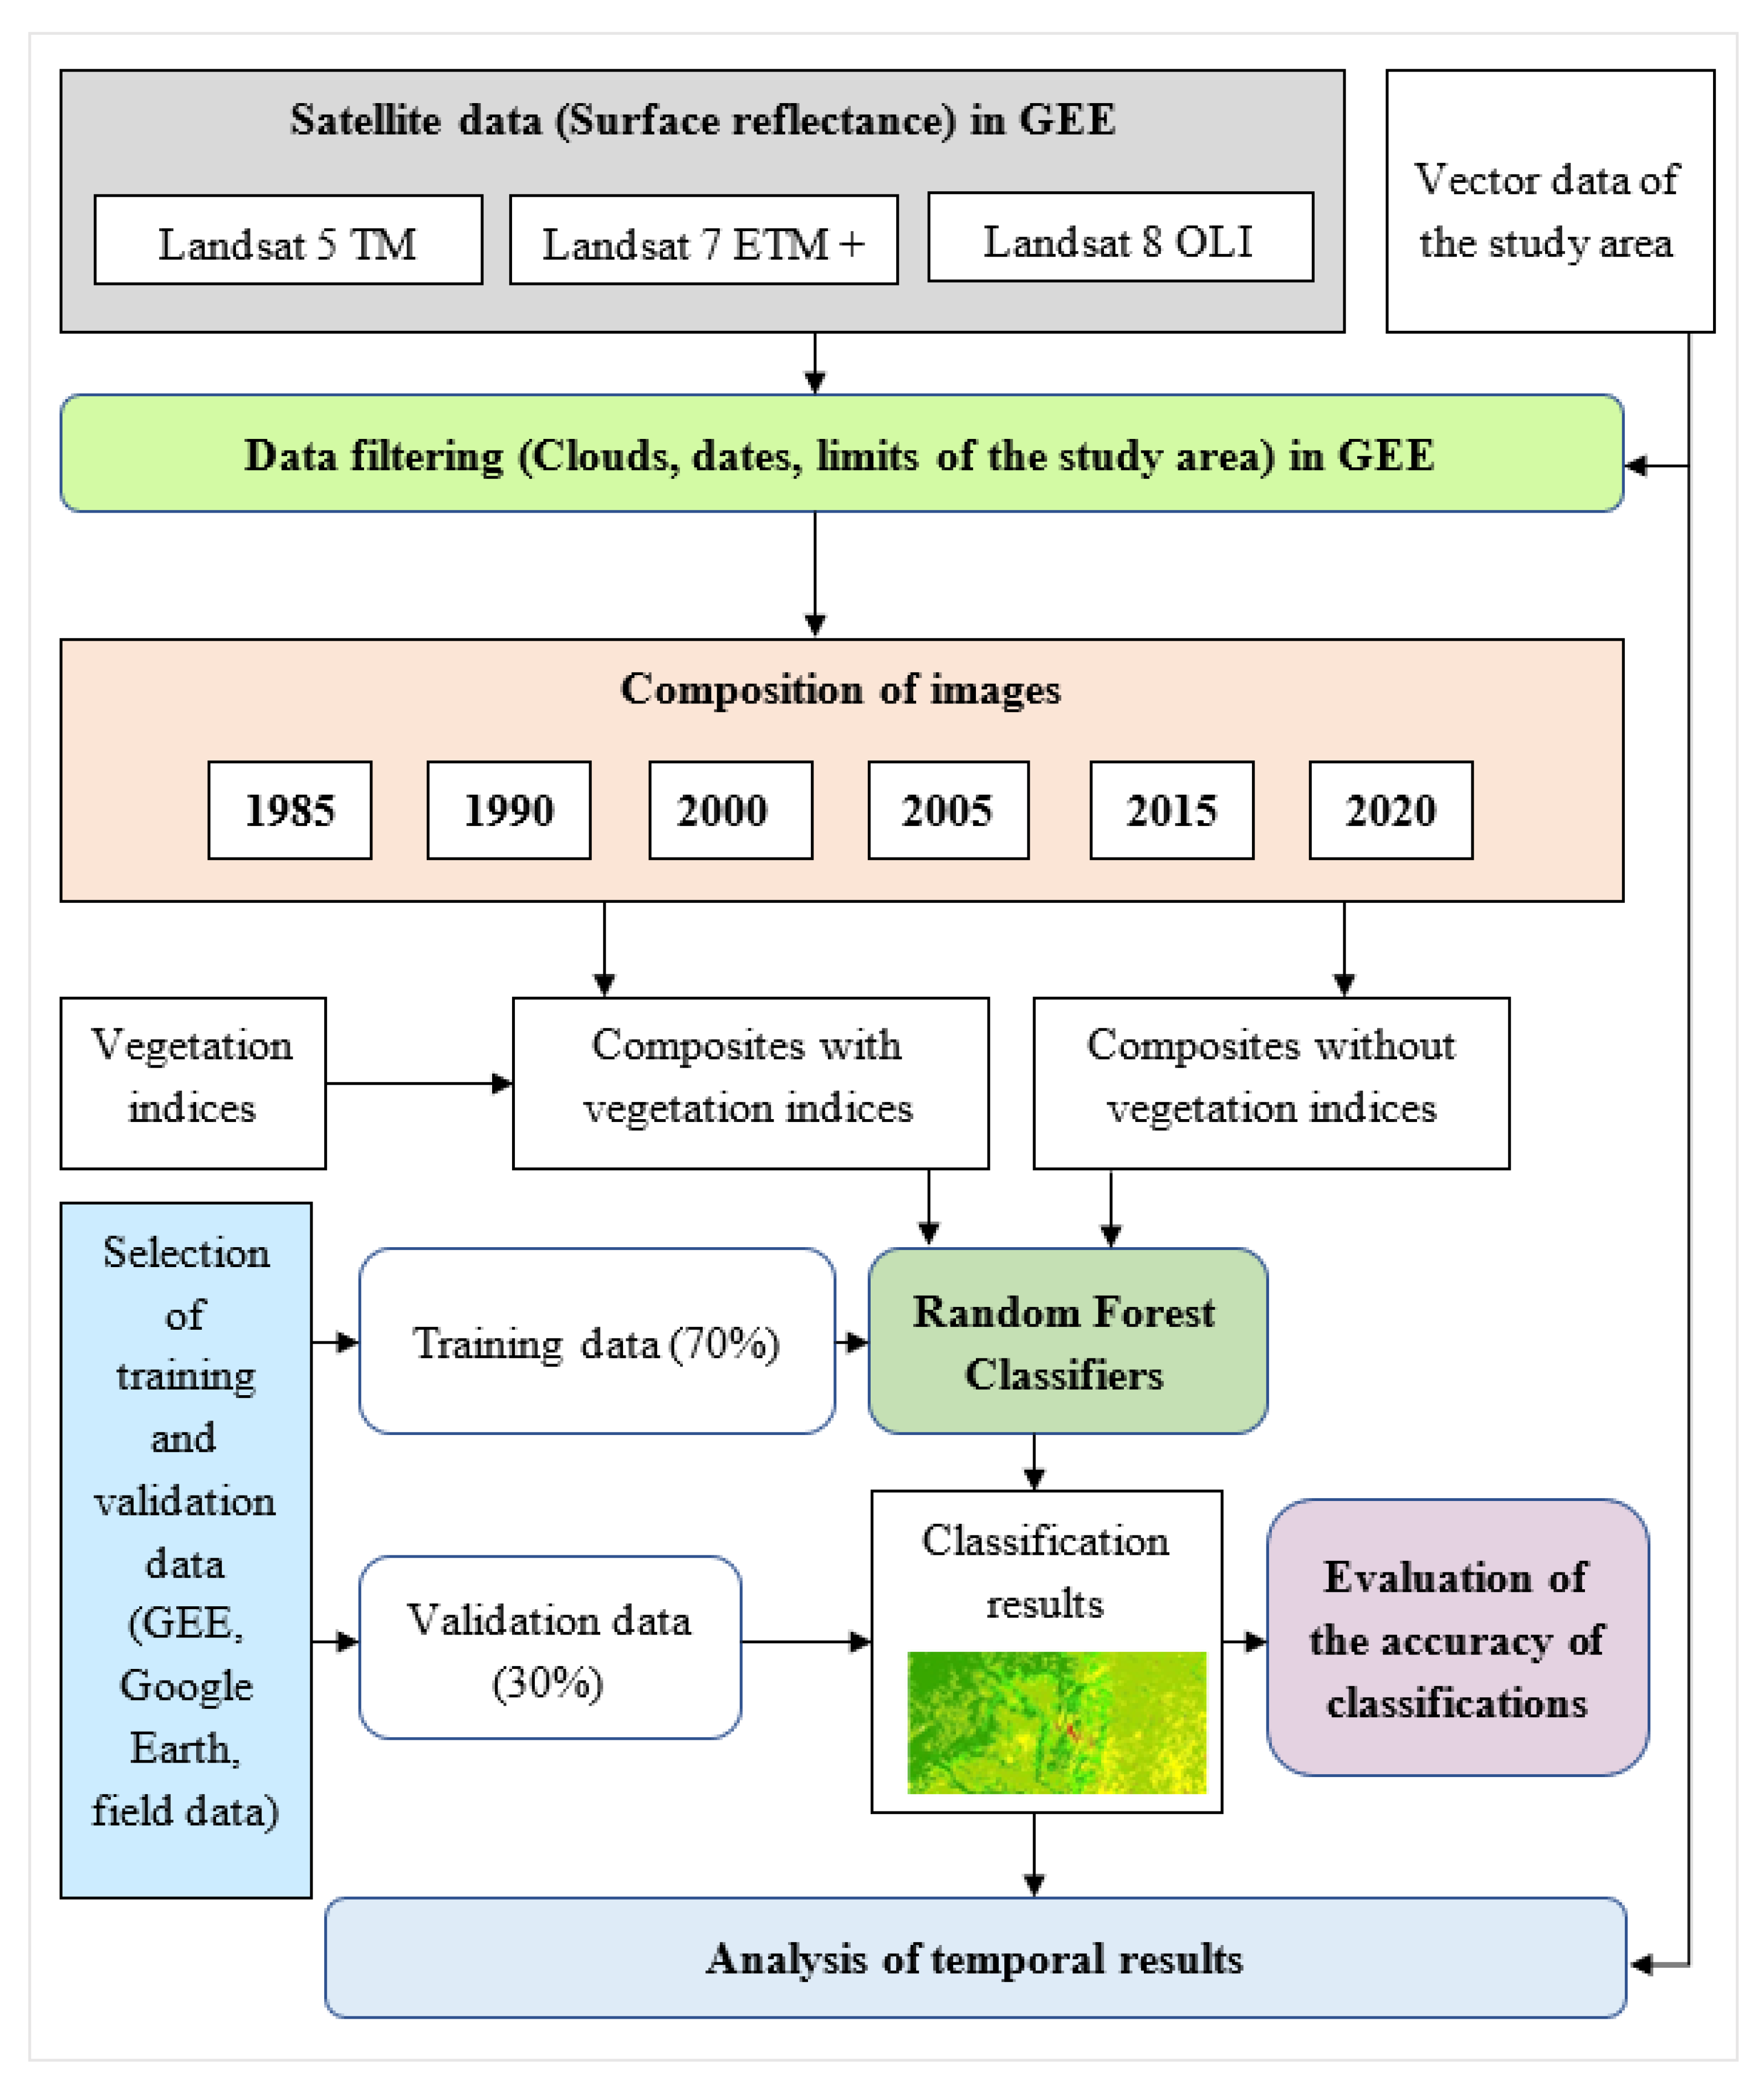
3. Methodology
3.1. Selection and Pre-Processing of Satellite Images
3.2. Selection of Training and Validation Data
3.3. Image Classification and Evaluation of Accuracy
4. Results
4.1. Assessing the Accuracy of Image Classifications
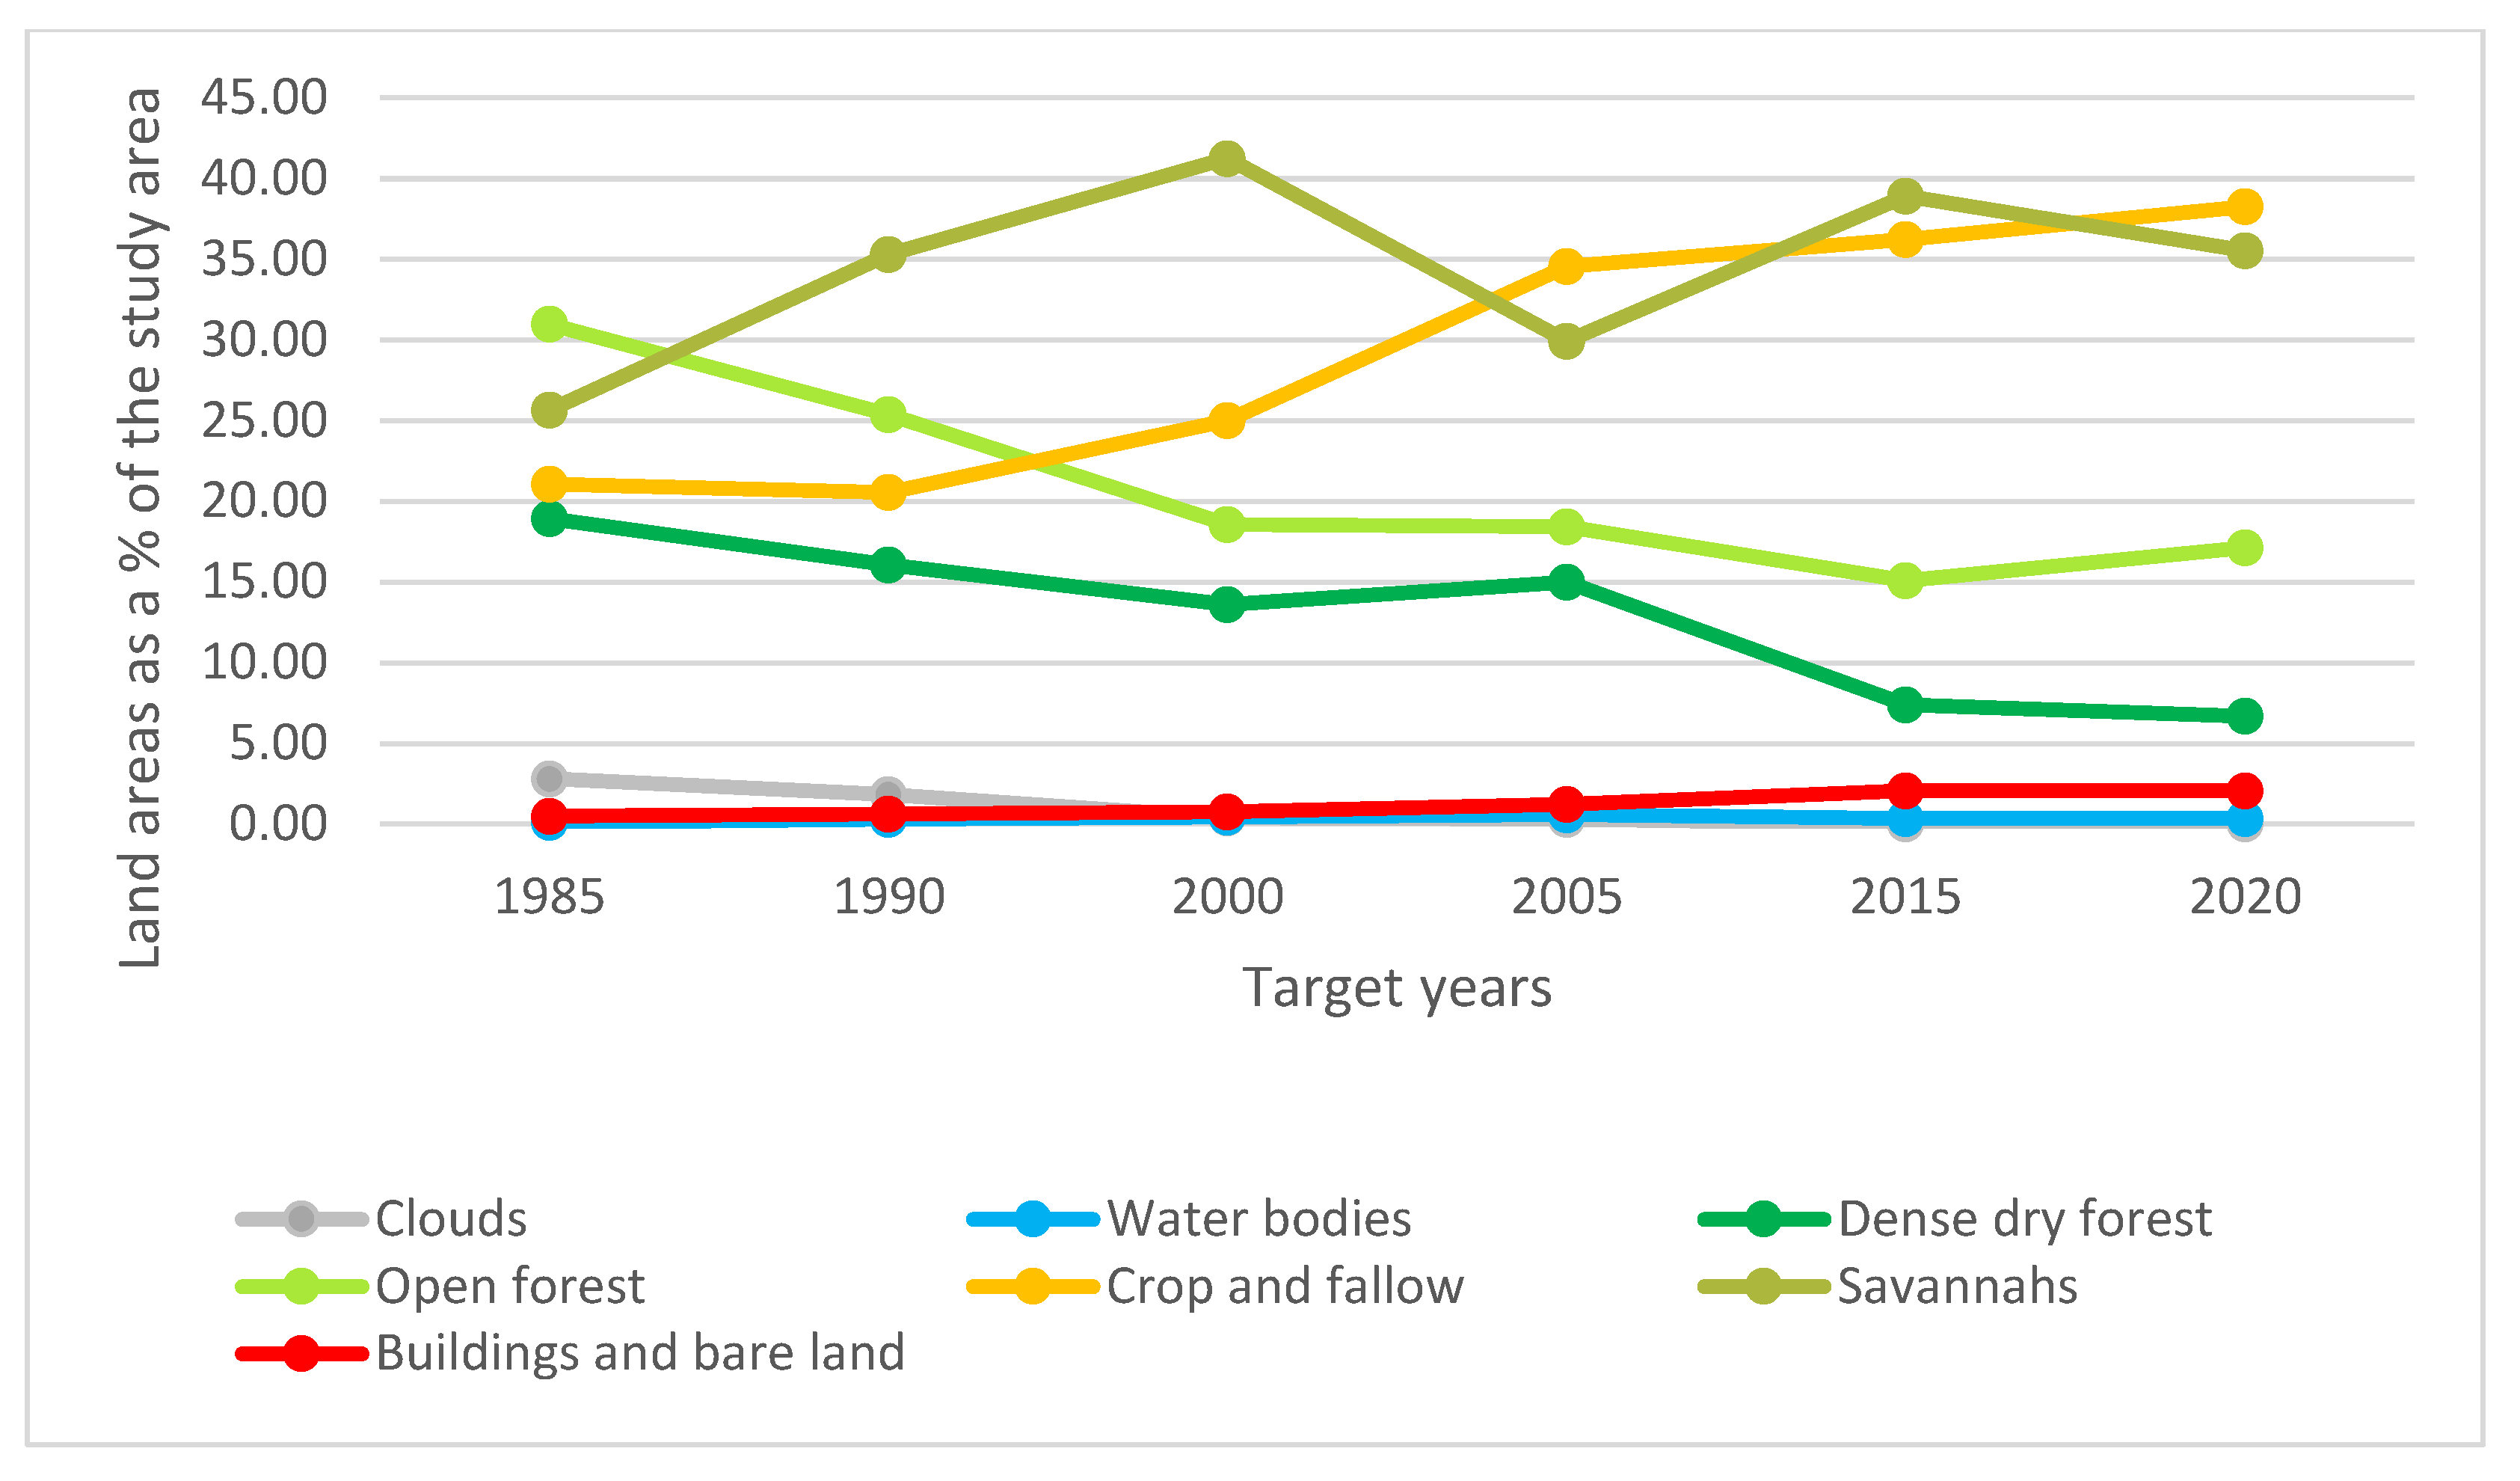
4.2. Distribution of Land Cover
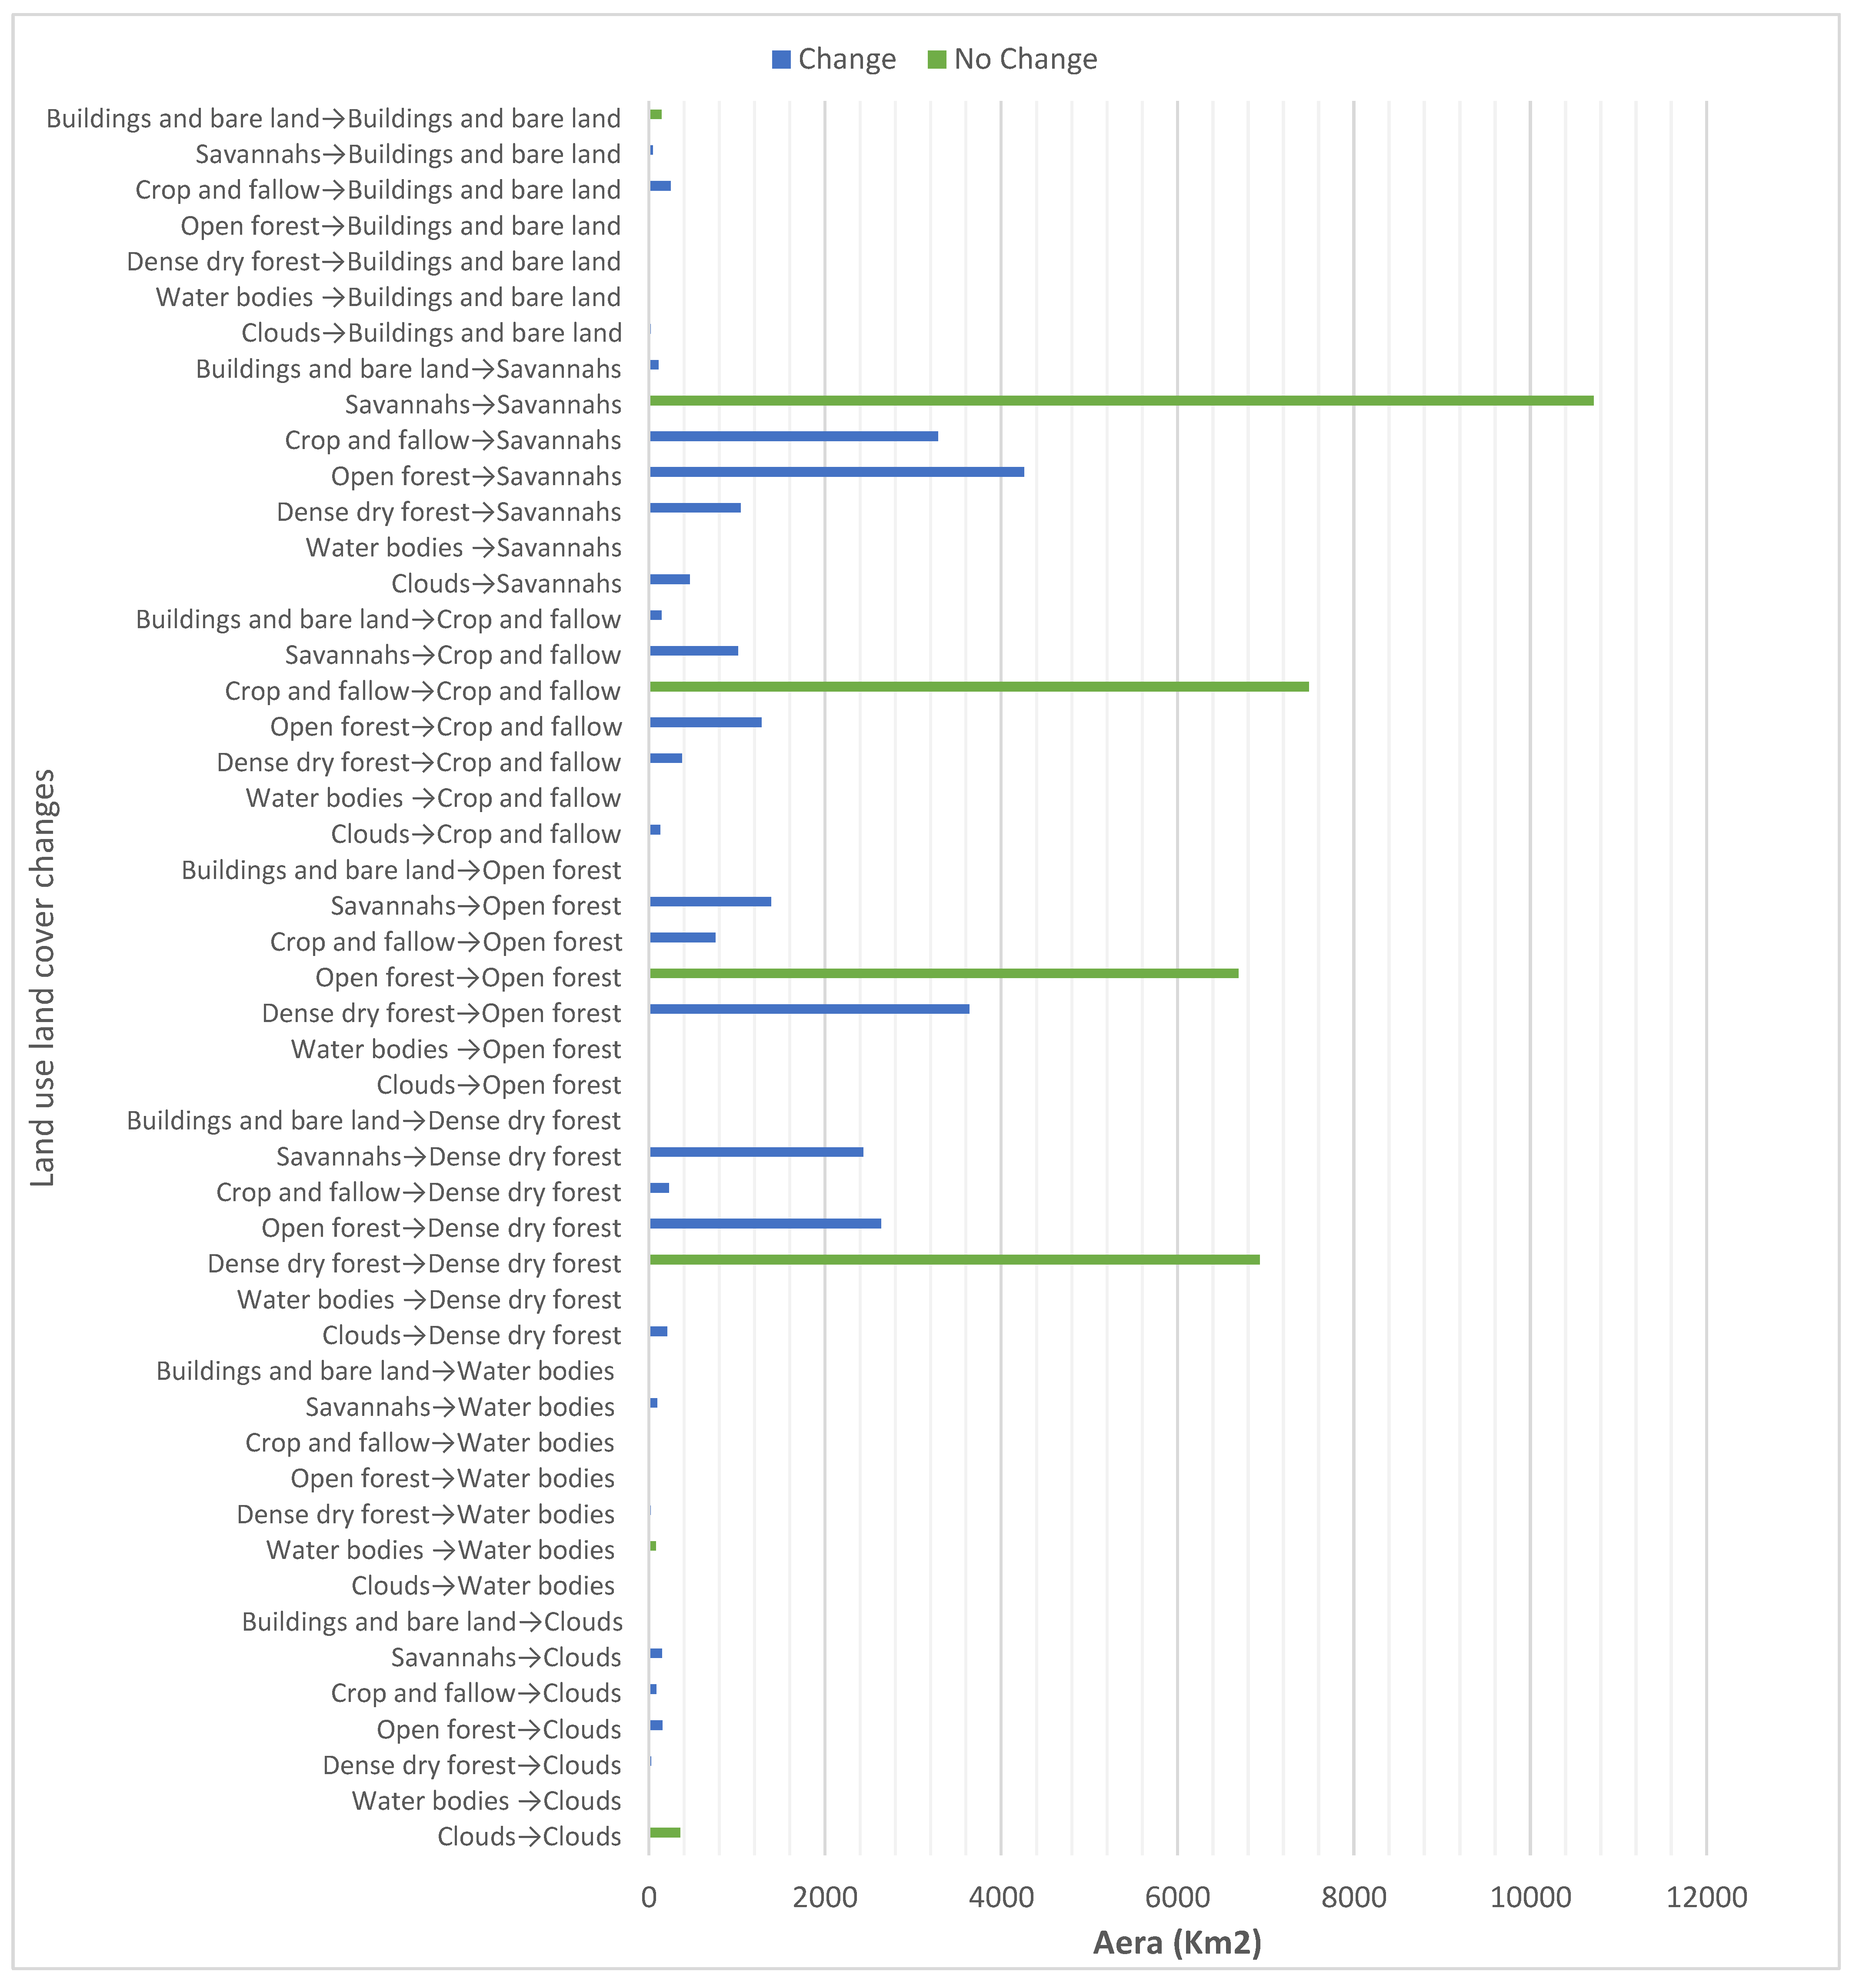
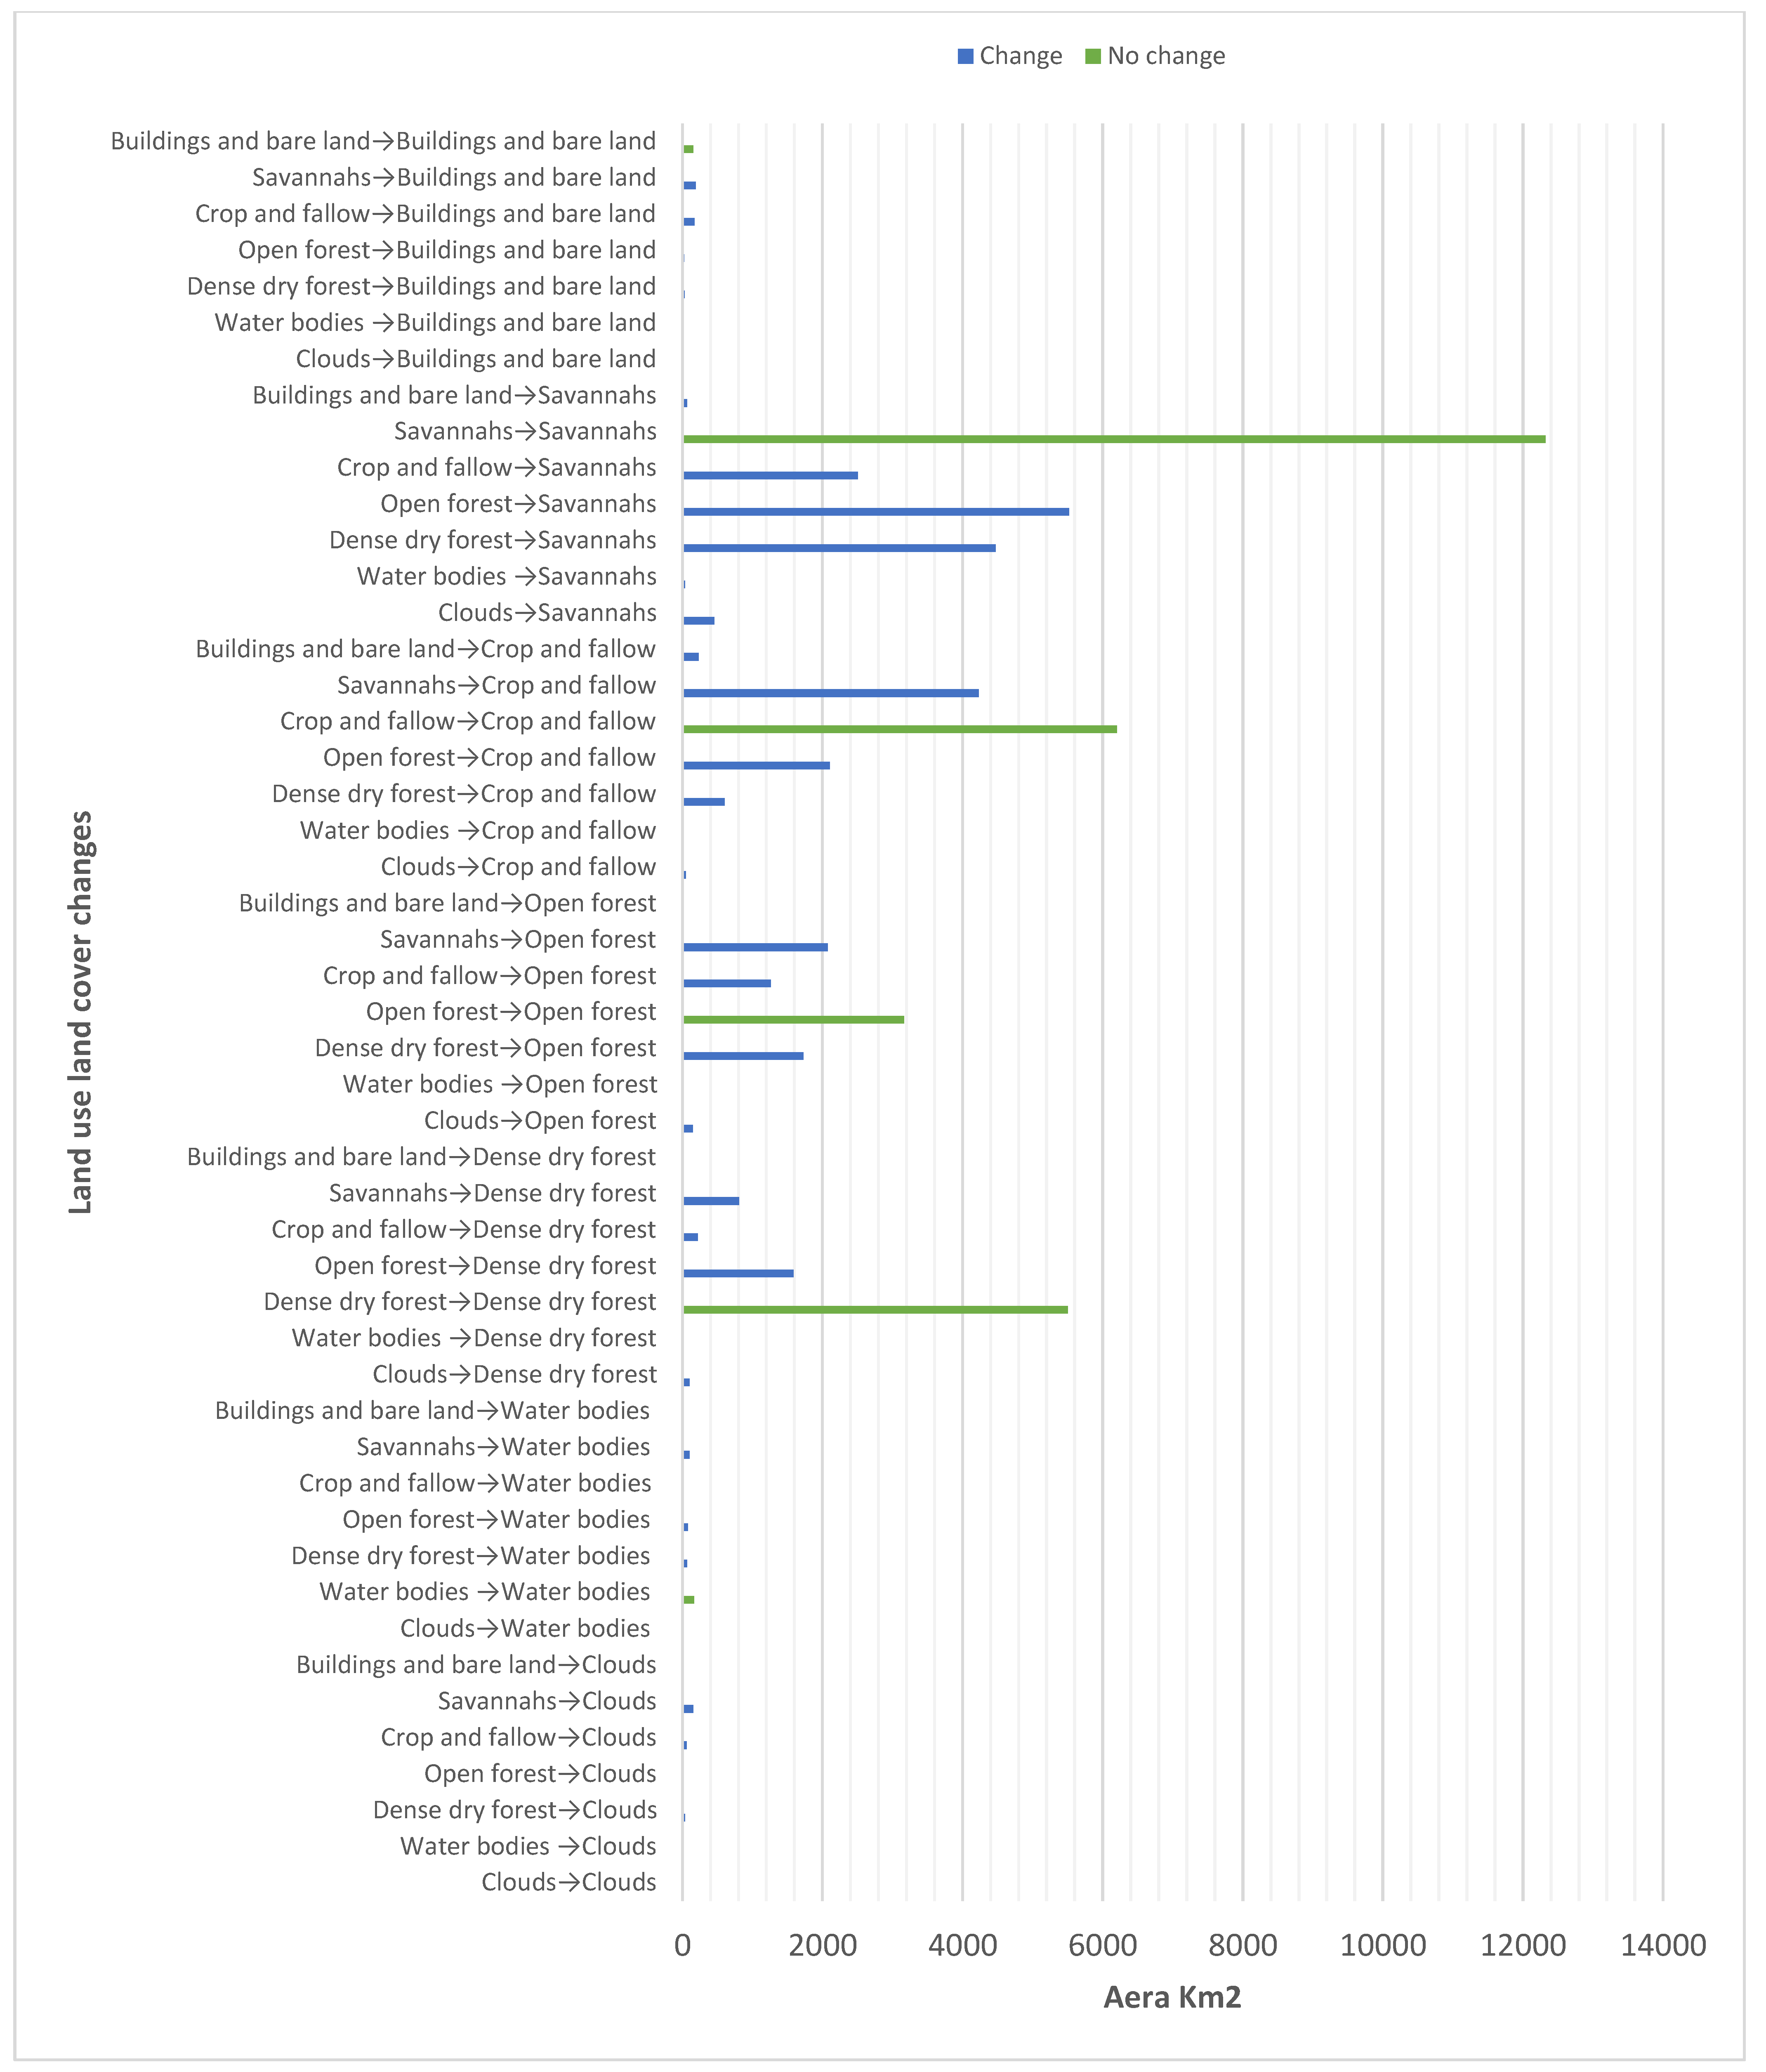
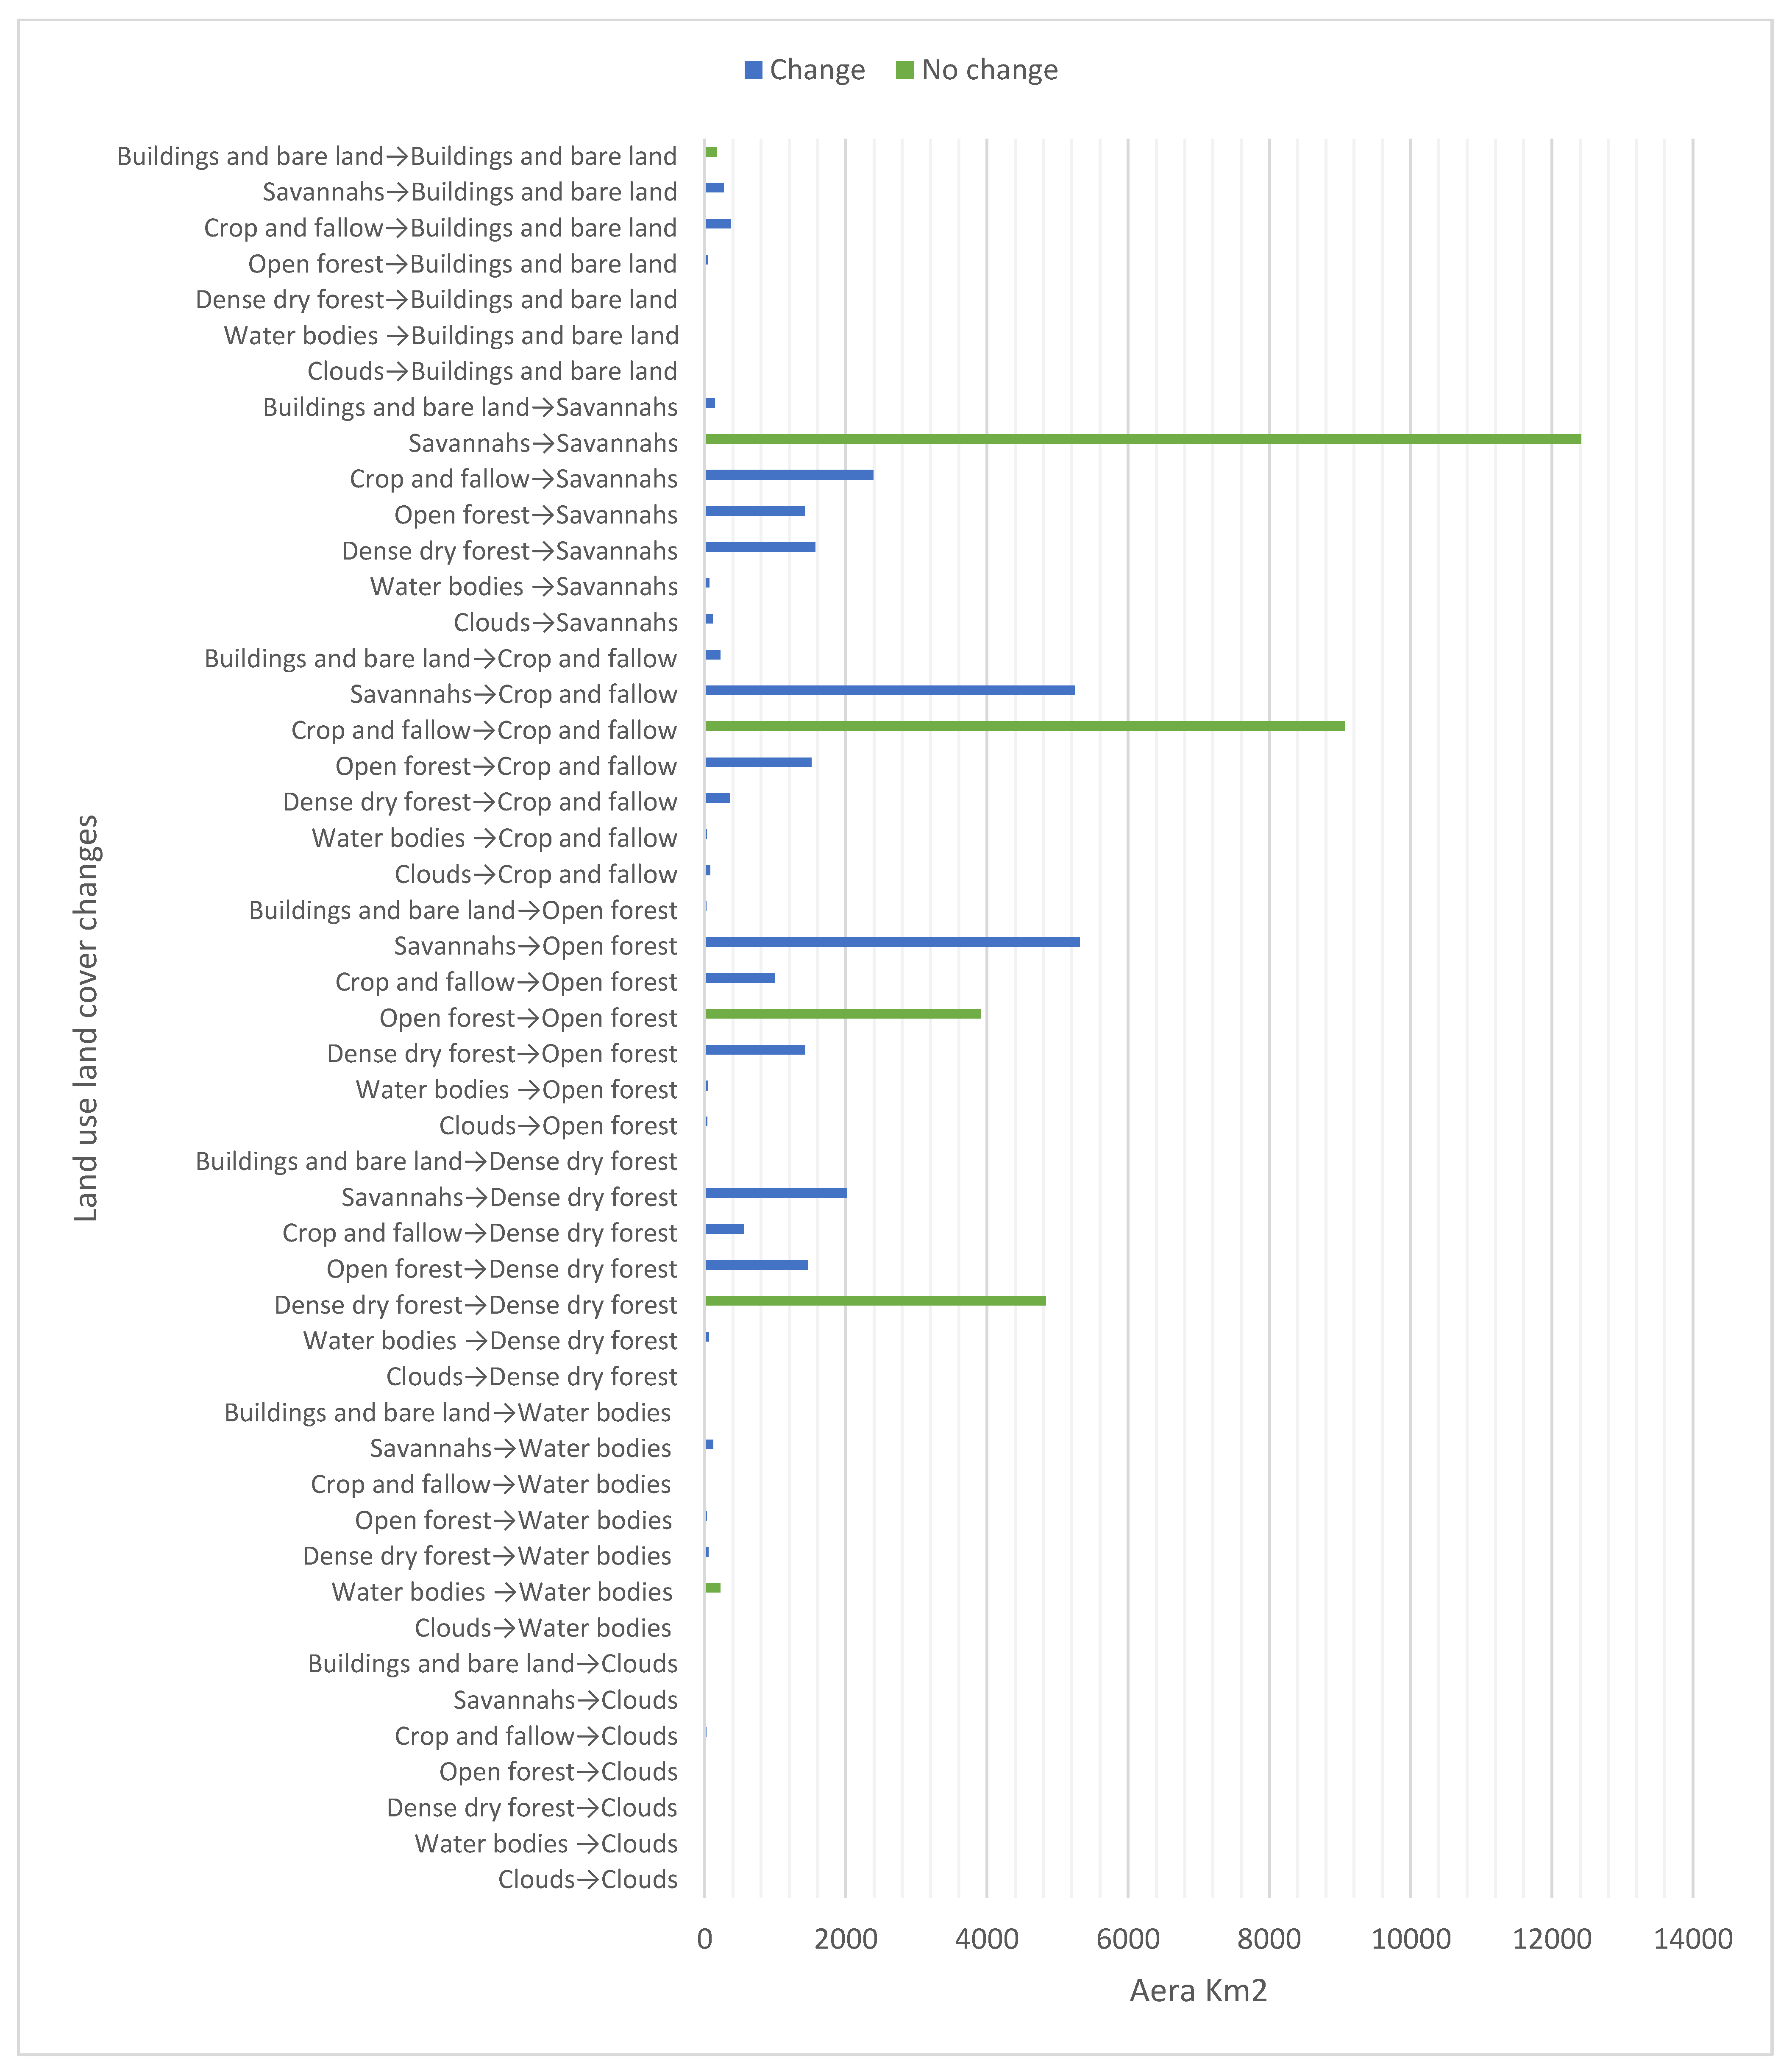
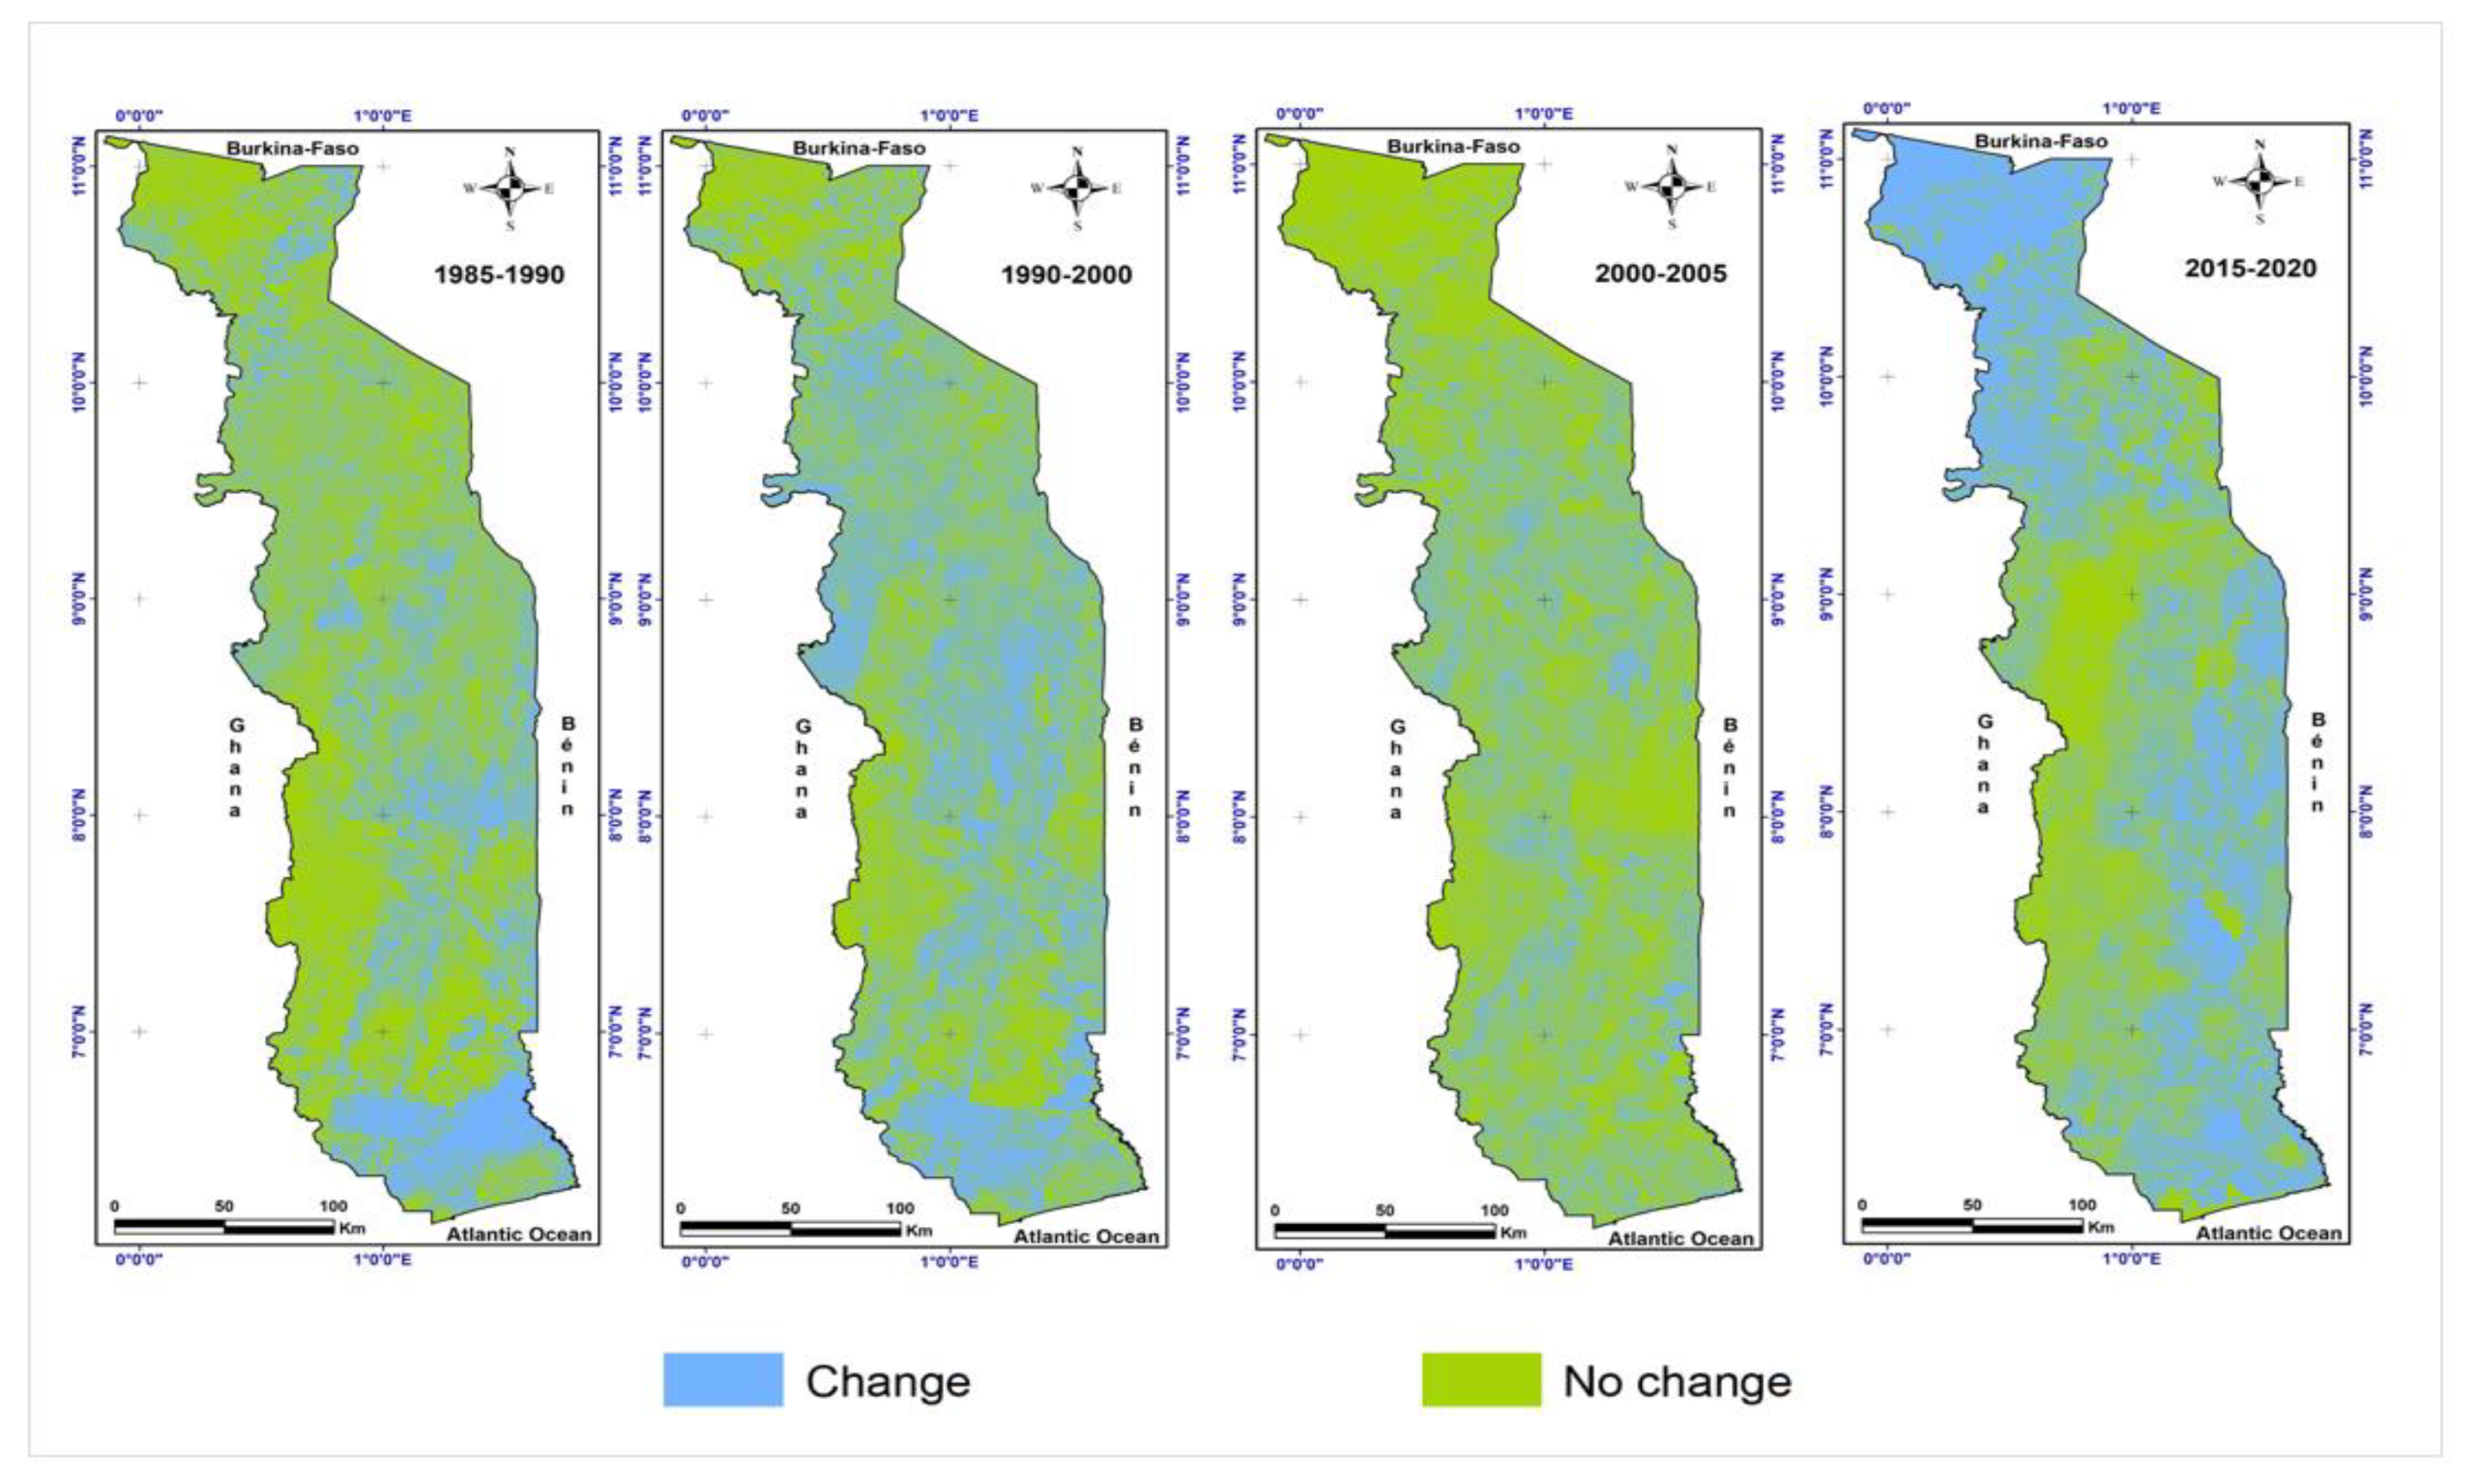
4.3. Land-Cover Conversions
4.4. Evolution of Forest Cover
4.5. Land-Cover Changes at the Administrative Regions Scale
5. Discussion
5.1. Quality of Results from Composite Image Classifications
5.2. Land-Cover Changes
5.3. Advantages and Limitations of the Method Used
6. Conclusions
Author Contributions
Funding
Institutional Review Board Statement
Informed Consent Statement
Data Availability Statement
Acknowledgments
Conflicts of Interest
Appendix A

| Clouds | Water | Dense Dry Forest | Open Forest | Crops + Fallows | Savannah | Bldg. + Soil | Producer Accuracy | |
|---|---|---|---|---|---|---|---|---|
| Clouds | 25,986 | 0 | 0 | 0 | 0 | 147 | 0 | 0.99 |
| Water | 0 | 8805 | 1 | 0 | 0 | 14 | 2 | 1.00 |
| Dense dry forest | 0 | 0 | 129,893 | 3690 | 249 | 138 | 0 | 0.97 |
| Open forest | 0 | 0 | 7144 | 26,071 | 1390 | 138 | 0 | 0.75 |
| Crops + fallows | 171 | 0 | 167 | 570 | 123,841 | 893 | 2649 | 0.97 |
| Savannah | 1053 | 0 | 30 | 174 | 1715 | 117,812 | 818 | 0.97 |
| Bldg. + Soil | 297 | 0 | 72 | 111 | 3974 | 1523 | 46,131 | 0.89 |
| User Accuracy | 0.94 | 1.00 | 0.95 | 0.85 | 0.94 | 0.98 | 0.93 | |
| Overall Accuracy | 0.95 | |||||||
| Kappa | 0.93 | |||||||
Appendix B
| Classes | Accuracy | p-Value |
|---|---|---|
| Water | UA | 0.000 |
| PA | 0.001 | |
| Dense dry forest | UA | 0.000 |
| PA | 0.001 | |
| Open forest | UA | 0.000 |
| PA | 0.001 | |
| Crops + fallows | UA | 0.000 |
| PA | 0.000 | |
| Savannah | UA | 0.001 |
| PA | 0.000 | |
| Bldg. + soil | UA | 0.000 |
| PA | 0.000 |
Appendix C
Conversion of Land-Cover Classes
Appendix D
| Years | Classes | Zone I | Zone II | Zone III | Zone IV | Zone V | Total |
|---|---|---|---|---|---|---|---|
| 1985 | Dense dry forest | 878.81 | 3977.56 | 1491.35 | 4192.75 | 182,06 | 10,722.53 |
| Open forest | 3039.83 | 5253.77 | 5634.57 | 1392.29 | 2227,29 | 17,547.75 | |
| Forest areas | 3918.64 | 9231.32 | 7125.92 | 5585.04 | 2409.35 | 28,270.28 | |
| %/Country | 6.91 | 16.29 | 12.57 | 9.86 | 4.25 | 49.89 | |
| %/Zone | 26.47 | 76.60 | 44.17 | 87.37 | 33.07 | ||
| 1990 | Dense dry forest | 542.65 | 3054.40 | 1562.54 | 3752.49 | 183.18 | 9095.25 |
| Open forest | 3599.47 | 6522.88 | 3592.65 | 659.38 | 4.25 | 14,378.62 | |
| Forest areas | 4142.12 | 9577.28 | 5155.19 | 4411.86 | 187.43 | 23,473.88 | |
| %/Country | 7.31 | 16.90 | 9.10 | 7.79 | 0.33 | 41.42 | |
| %/Zone | 27.98 | 79.47 | 31.95 | 69.02 | 2.57 | ||
| 2000 | Dense dry forest | 370.09 | 2463.65 | 1407.70 | 3316.65 | 146.87 | 7704.97 |
| Open forest | 1989.39 | 3313.71 | 2967.11 | 621.64 | 1624.10 | 10515.96 | |
| Forest areas | 2359.48 | 5777.36 | 4374.81 | 3938.29 | 1770.98 | 18,220.92 | |
| %/Country | 4.16 | 10.19 | 7.72 | 6.95 | 3.13 | 32.15 | |
| %/Zone | 15.94 | 47.94 | 27.12 | 61.61 | 24.30 | ||
| 2005 | Dense dry forest | 392.21 | 3148.15 | 1577.43 | 3228.93 | 158.92 | 8505.64 |
| Open forest | 1714.80 | 3996.35 | 2206.50 | 770.48 | 1751.55 | 10,439.68 | |
| Forest areas | 2107.01 | 7144.50 | 3783.93 | 3999.41 | 1910.47 | 18,945.32 | |
| %/Country | 3.72 | 12.61 | 6.68 | 7.06 | 3.37 | 33.43 | |
| %/Zone | 14.23 | 59.28 | 23.45 | 62.57 | 26.22 | ||
| 2015 | Dense dry forest | 145.76 | 1025.65 | 752.59 | 2136.58 | 126.13 | 4186.70 |
| Open forest | 463.68 | 2578.21 | 1957.75 | 2028.74 | 1521.27 | 8549.65 | |
| Forest areas | 609.44 | 3603.86 | 2710.34 | 4165.31 | 1647.40 | 12,736.35 | |
| %/Country | 1.08 | 6.36 | 4.78 | 7.35 | 2.91 | 22.48 | |
| %/Zone | 4.12 | 29.90 | 16.80 | 65.16 | 22.61 | ||
| 2020 | Dense dry forest | 128.64 | 975.70 | 365.86 | 2076.96 | 238.12 | 3785.27 |
| Open forest | 1313.22 | 2395.81 | 2136.68 | 1987.47 | 1876.52 | 9709.70 | |
| Forest areas | 1441.85 | 3371.51 | 2502.53 | 4064.43 | 2114.63 | 13,494.97 | |
| %/Country | 2.54 | 5.95 | 4.42 | 7.17 | 3.73 | 23.81 | |
| %/Zone | 9.74 | 27.98 | 15.51 | 63.59 | 29.02 | ||
| Ecological Zone areas | 14,805.30 | 12,051.40 | 16,133.60 | 6392.10 | 7286.50 | 56,668.90 | |
Appendix E
References
- Nunes, L.J.R.; Meireles, C.I.R.; Pinto Gomes, C.J.; Almeida Ribeiro, N.M.C. Forest Contribution to Climate Change Mitigation: Management Oriented to Carbon Capture and Storage. Climate 2020, 8, 21. [Google Scholar] [CrossRef] [Green Version]
- Cardil, A.; de-Miguel, S.; Silva, C.A.; Reich, P.B.; Calkin, D.; Brancalion, P.H.S.; Vibrans, A.C.; Gamarra, J.G.P.; Zhou, M.; Pijanowski, B.C.; et al. Recent Deforestation Drove the Spike in Amazonian Fires. Environ. Res. Lett. 2020, 15, 121003. [Google Scholar] [CrossRef]
- Laumonier, Y.; Edin, A.; Kanninen, M.; Munandar, A.W. Landscape-Scale Variation in the Structure and Biomass of the Hill Dipterocarp Forest of Sumatra: Implications for Carbon Stock Assessments. For. Ecol. Manag. 2010, 259, 505–513. [Google Scholar] [CrossRef]
- Gogoi, A.; Ahirwal, J.; Sahoo, U.K. Plant Biodiversity and Carbon Sequestration Potential of the Planted Forest in Brahmaputra Flood Plains. J. Environ. Manag. 2021, 280, 111671. [Google Scholar] [CrossRef]
- Kundu, K.; Halder, P.; Mandal, J.K. Forest Cover Change Analysis in Sundarban Delta Using Remote Sensing Data and GIS. In Intelligent Computing Paradigm: Recent Trends; Mandal, J.K., Sinha, D., Eds.; Studies in Computational Intelligence; Springer Singapore: Singapore, 2020; pp. 85–101. ISBN 9789811373343. [Google Scholar]
- FAO and UNEP. The State of the World’s Forests 2020: Forests, Biodiversity and People; The State of the World’s Forests (SOFO); FAO and UNEP: Rome, Italy, 2020; ISBN 978-92-5-132419-6. [Google Scholar]
- Chen, Y.-Y.; Huang, W.; Wang, W.-H.; Juang, J.-Y.; Hong, J.-S.; Kato, T.; Luyssaert, S. Reconstructing Taiwan’s Land Cover Changes between 1904 and 2015 from Historical Maps and Satellite Images. Sci. Rep. 2019, 9, 12. [Google Scholar] [CrossRef] [Green Version]
- Deo, R.K.; Russell, M.B.; Domke, G.M.; Andersen, H.-E.; Cohen, W.B.; Woodall, C.W. Evaluating Site-Specific and Generic Spatial Models of Aboveground Forest Biomass Based on Landsat Time-Series and LiDAR Strip Samples in the Eastern USA. Remote Sens. 2017, 9, 598. [Google Scholar] [CrossRef] [Green Version]
- Olorunfemi, I.E.; Olufayo, A.A.; Fasinmirin, J.T.; Komolafe, A.A. Dynamics of Land Use Land Cover and Its Impact on Carbon Stocks in Sub-Saharan Africa: An Overview. Environ. Dev. Sustain. 2021, 24, 40–76. [Google Scholar] [CrossRef]
- Angelsen, A.; Brockhaus, M.; Sunderlin, W.D.; Verchot, L.V. Analyse de la REDD+ Les Enjeux et les Choix; CIFOR: India Nishiya, Momono, 2013; ISBN 978-602-1504-00-0. [Google Scholar]
- Minh, D.H.T.; Ndikumana, E.; Vieilledent, G.; McKey, D.; Baghdadi, N. Potential Value of Combining ALOS PALSAR and Landsat-Derived Tree Cover Data for Forest Biomass Retrieval in Madagascar. Remote Sens. Environ. 2018, 213, 206–214. [Google Scholar] [CrossRef]
- Mitchell, A.L.; Rosenqvist, A.; Mora, B. Current Remote Sensing Approaches to Monitoring Forest Degradation in Support of Countries Measurement, Reporting and Verification (MRV) Systems for REDD+. Carbon Balance Manag. 2017, 12, 9. [Google Scholar] [CrossRef] [Green Version]
- Folega, F.; Zhang, C.; Zhao, X.; Wala, K.; Batawila, K.; Huang, H.; Dourma, M.; Akpagana, K. Satellite Monitoring of Land-Use and Land-Cover Changes in Northern Togo Protected Areas. J. For. Res. 2014, 25, 385–392. [Google Scholar] [CrossRef]
- Akakpo, K.M.; Quensière, J.; Gadal, S.; Kossi, A.; Kokou, K. Caractérisation et Dynamique Spatiale de La Couverture Végétale Dans Les Aires Protégées Du Togo: Étude Par Télédétection Satellitaire de La Forêt Classée de Missahoé Dans La Région Des Plateaux. Rev. Int. De Géomatique Aménagement Et Gest. Des Ressour. 2017, 1, 181–194. [Google Scholar]
- Atsri, H.K.; Konko, Y.; Cuni-Sanchez, A.; Abotsi, K.E.; Kokou, K. Changes in the West African Forest-Savanna Mosaic, Insights from Central Togo. PLoS ONE 2018, 13, e020399. [Google Scholar] [CrossRef] [Green Version]
- Polo-Akpisso, A.; Wala, K.; Soulemane, O.; Folega, F.; Akpagana, K.; Tano, Y. Assessment of Habitat Change Processes within the Oti-Keran-Mandouri Network of Protected Areas in Togo (West Africa) from 1987 to 2013 Using Decision Tree Analysis. Science 2020, 2, 1. [Google Scholar] [CrossRef] [Green Version]
- Badjana, H.M.; Helmschrot, J.; Selsam, P.; Wala, K.; Flügel, W.-A.; Afouda, A.; Akpagana, K. Land Cover Changes Assessment Using Object-Based Image Analysis in the Binah River Watershed (Togo and Benin). Earth Space Sci. 2015, 2, 403–416. [Google Scholar] [CrossRef] [Green Version]
- Diwediga, B.; Agodzo, S.; Wala, K.; Le, Q.B. Assessment of Multifunctional Landscapes Dynamics in the Mountainous Basin of the Mo River (Togo, West Africa). J. Geogr. Sci. 2017, 27, 579–605. [Google Scholar] [CrossRef]
- Koumoi, Z.; Boukpessi, T.; Kpedenou, K.D. Principaux Facteurs Explicatifs de La Dynamique de l’occupation Du Sol Dans Le Centre-Togo: Apport Des SIG et Des Statistiques Spatiales. Rev. Ivoir. Géographie Savanes 2017, 3, 252–273. [Google Scholar]
- Koglo, Y.S.; Gaiser, T.; Agyare, W.A.; Sogbedji, J.M.; Kouami, K. Implications of Some Major Human-Induced Activities on Forest Cover Using Extended Change Matrix Quantity and Intensity Analysis Based on Historical Landsat Data from the Kloto District, Togo. Ecol. Indic. 2019, 96, 628–634. [Google Scholar] [CrossRef]
- Folega, F.; Woegan, Y.A.; Marra, D.; Wala, K.; Batawila, K.; Seburanga, J.L.; Zhang, C.; Peng, D.; Zhao, X.; Akpagana, K. Long Term Evaluation of Green Vegetation Cover Dynamic in the Atacora Mountain Chain (Togo) and Its Relation to Carbon Sequestration in West Africa. J. Mt. Sci. 2015, 12, 921–934. [Google Scholar] [CrossRef]
- Mastro, P.; Masiello, G.; Serio, C.; Pepe, A. Change Detection Techniques with Synthetic Aperture Radar Images: Experiments with Random Forests and Sentinel-1 Observations. Remote Sens. 2022, 14, 3323. [Google Scholar] [CrossRef]
- Mahdianpari, M.; Jafarzadeh, H.; Granger, J.E.; Mohammadimanesh, F.; Brisco, B.; Salehi, B.; Homayouni, S.; Weng, Q. A Large-Scale Change Monitoring of Wetlands Using Time Series Landsat Imagery on Google Earth Engine: A Case Study in Newfoundland. GIScience Remote Sens. 2020, 57, 1102–1124. [Google Scholar] [CrossRef]
- Phan, T.N.; Kuch, V.; Lehnert, L.W. Land Cover Classification Using Google Earth Engine and Random Forest Classifier—The Role of Image Composition. Remote Sens. 2020, 12, 2411. [Google Scholar] [CrossRef]
- Souza, C.M.; Shimbo, J.Z.; Rosa, M.R.; Parente, L.L.; Alencar, A.A.; Rudorff, B.F.T.; Hasenack, H.; Matsumoto, M.; Ferreira, L.G.; Souza-Filho, P.W.M.; et al. Reconstructing Three Decades of Land Use and Land Cover Changes in Brazilian Biomes with Landsat Archive and Earth Engine. Remote Sens. 2020, 12, 2735. [Google Scholar] [CrossRef]
- Gorelick, N.; Hancher, M.; Dixon, M.; Ilyushchenko, S.; Thau, D.; Moore, R. Google Earth Engine: Planetary-Scale Geospatial Analysis for Everyone. Remote Sens. Environ. 2017, 202, 18–27. [Google Scholar] [CrossRef]
- Arévalo, P.; Olofsson, P.; Woodcock, C.E. Continuous Monitoring of Land Change Activities and Post-Disturbance Dynamics from Landsat Time Series: A Test Methodology for REDD+ Reporting. Remote Sens. Environ. 2020, 238, 111051. [Google Scholar] [CrossRef]
- REDD+ Togo. Plan D’actions de Mise En Oeuvre de La Stratégie Nationale de Réduction Des Émissions Dues à La Déforestation et à La Dégradation Des Forêts (REDD+) 2020–2029; Coordination Nationale REDD+ du Togo: Lomé, Togo, 2020. [Google Scholar]
- INSEED et AFRISTAT. Enquête Régionale Intégrée Sur l’Emploi et Le Secteur Informel; 2017; Institut National de la Statistique et des Etudes Economiques et Démographiques et AFRISTAT: Lomé, Togo; Bamako, Mali, 2019; p. 73. [Google Scholar]
- PANA. Plan d’Action National d’Adaptation Au Changement Climatique; Ministère de l’Environnement et des Ressources Forestières (MERF): Lomé, Togo, 2009; p. 113. [Google Scholar]
- REDD+ Togo. Définition et Calcul Du Taux National de Défloration Annuel Du Togo Entre 1990 et 2015; Coordination Nationale REDD+ du Togo: Lomé, Togo, 2018. [Google Scholar]
- REDD+ Togo. Étude Sur Les Causes et Conséquences de La Déforestation et La Dégradation Des Forets Au Togo et Identification Des Axes d’intervention Appropries; Coordination Nationale REDD+ du Togo: Lomé, Togo, 2018. [Google Scholar]
- Ern, H. Die Vegetation Togos. Gliederung, Gefährdung, Erhaltung. Willdenowia 1979, 9, 295–312. [Google Scholar]
- MEDDPN. Analyse Cartographique de l’occupation Des Zones Agroécologiques et Bassins de Concentration Des Populations Au Togo, Folega F., Consultant Sous Ordre de La Coordination Nationale Sur Les Changements Climatiques; MEDDPN: Lomé, Togo, 2019; p. 66. [Google Scholar]
- Brabant, P.; Darracq, S.; Egué, K.; Simonneaux, V.; Aing, A.; Auberton-Habert, E. Togo: État de Dégradation Des Terres Résultant Des Activités Humaines (Note Explicative de La Carte Au 1: 500 000 Des Indices de Dégradation). In Notice Explicative; Éditions de I’ORSTOM: Paris, France, 1996; p. 66. ISBN 2-7099-1 348-8. [Google Scholar]
- Atakpama, W.; Amegnaglo, K.; Afelu, B.; Folega, F.; Batawila, K.; Akpagana, K. Biodiversité et biomasse pyrophyte au Togo. Vertigo 2019, 19, 22. [Google Scholar] [CrossRef]
- Alboabidallah, A.; Martin, J.; Lavender, S.; Abbott, V. Using Landsat-8 and Sentinel-1 Data for Above Ground Biomass Assessment in the Tamar Valley and Dartmoor. In Proceedings of the 2017 9th International Workshop on the Analysis of Multitemporal Remote Sensing Images (MultiTemp), Bruges, Belgium, 27–29 June 2017; IEEE: Piscataway Township, NJ, USA, 2017; pp. 1–7. [Google Scholar]
- Wulder, M.A.; Loveland, T.R.; Roy, D.P.; Crawford, C.J.; Masek, J.G.; Woodcock, C.E.; Allen, R.G.; Anderson, M.C.; Belward, A.S.; Cohen, W.B.; et al. Current Status of Landsat Program, Science, and Applications. Remote Sens. Environ. 2019, 225, 127–147. [Google Scholar] [CrossRef]
- Hu, Y.; Hu, Y. Land Cover Changes and Their Driving Mechanisms in Central Asia from 2001 to 2017 Supported by Google Earth Engine. Remote Sens. 2019, 11, 554. [Google Scholar] [CrossRef] [Green Version]
- Xie, S.; Liu, L.; Zhang, X.; Yang, J.; Chen, X.; Gao, Y. Automatic Land-Cover Mapping Using Landsat Time-Series Data Based on Google Earth Engine. Remote Sens. 2019, 11, 3023. [Google Scholar] [CrossRef] [Green Version]
- Griffiths, P.; van der Linden, S.; Kuemmerle, T.; Hostert, P. A Pixel-Based Landsat Compositing Algorithm for Large Area Land Cover Mapping. IEEE J. Sel. Top. Appl. Earth Obs. Remote Sens. 2013, 6, 2088–2101. [Google Scholar] [CrossRef]
- Zhu, Z.; Woodcock, C.E. Continuous Change Detection and Classification of Land Cover Using All Available Landsat Data. Remote Sens. Environ. 2014, 144, 152–171. [Google Scholar] [CrossRef] [Green Version]
- Hermosilla, T.; Wulder, M.A.; White, J.C.; Coops, N.C.; Hobart, G.W. Disturbance-Informed Annual Land Cover Classification Maps of Canada’s Forested Ecosystems for a 29-Year Landsat Time Series. Can. J. Remote Sens. 2018, 44, 67–87. [Google Scholar] [CrossRef]
- Giovos, R.; Tassopoulos, D.; Kalivas, D.; Lougkos, N.; Priovolou, A. Remote Sensing Vegetation Indices in Viticulture: A Critical Review. Agriculture 2021, 11, 457. [Google Scholar] [CrossRef]
- Sozzi, M.; Kayad, A.; Marinello, F.; Taylor, J.; Tisseyre, B. Comparing Vineyard Imagery Acquired from Sentinel-2 and Unmanned Aerial Vehicle (UAV) Platform. Oeno One 2020, 54, 189–197. [Google Scholar] [CrossRef] [Green Version]
- Li, Y.; Zhao, Z.; Xin, Y.; Xu, A.; Xie, S.; Yan, Y.; Wang, L. How Are Land-Use/Land-Cover Indices and Daytime and Nighttime Land Surface Temperatures Related in Eleven Urban Centres in Different Global Climatic Zones? Land 2022, 11, 1312. [Google Scholar] [CrossRef]
- Khan, M.S.; Ullah, S.; Chen, L. Comparison on Land-Use/Land-Cover Indices in Explaining Land Surface Temperature Variations in the City of Beijing, China. Land 2021, 10, 1018. [Google Scholar] [CrossRef]
- Xue, J.; Su, B. Significant Remote Sensing Vegetation Indices: A Review of Developments and Applications. J. Sens. 2017, 2017, 1353691. [Google Scholar] [CrossRef] [Green Version]
- McFeeters, S.K. The Use of the Normalized Difference Water Index (NDWI) in the Delineation of Open Water Features. Int. J. Remote Sens. 1996, 17, 1425–1432. [Google Scholar] [CrossRef]
- Vaudour, E.; Gomez, C.; Lagacherie, P.; Loiseau, T.; Baghdadi, N.; Urbina-Salazar, D.; Loubet, B.; Arrouays, D. Temporal Mosaicking Approaches of Sentinel-2 Images for Extending Topsoil Organic Carbon Content Mapping in Croplands. Int. J. Appl. Earth Obs. Geoinf. 2021, 96, 102277. [Google Scholar] [CrossRef]
- Xu, N.; Tian, J.; Tian, Q.; Xu, K.; Tang, S. Analysis of Vegetation Red Edge with Different Illuminated/Shaded Canopy Proportions and to Construct Normalized Difference Canopy Shadow Index. Remote Sens. 2019, 11, 1192. [Google Scholar] [CrossRef] [Green Version]
- Chen, Y.; Cao, R.; Chen, J.; Liu, L.; Matsushita, B. A Practical Approach to Reconstruct High-Quality Landsat NDVI Time-Series Data by Gap Filling and the Savitzky–Golay Filter. ISPRS J. Photogramm. Remote Sens. 2021, 180, 174–190. [Google Scholar] [CrossRef]
- Huang, S.; Tang, L.; Hupy, J.P.; Wang, Y.; Shao, G. A Commentary Review on the Use of Normalized Difference Vegetation Index (NDVI) in the Era of Popular Remote Sensing. J. For. Res. 2021, 32, 1–6. [Google Scholar] [CrossRef]
- Özelkan, E. Water Body Detection Analysis Using NDWI Indices Derived from Landsat-8 OLI. Pol. J. Environ. Stud. 2020, 29, 1759–1769. [Google Scholar] [CrossRef]
- Rikimaru, A.; Roy, P.S.; Miyatake, S. Tropical Forest Cover Density Mapping. Trop. Ecol. 2002, 43, 39–47. [Google Scholar]
- Zheng, Y.; Tang, L.; Wang, H. An Improved Approach for Monitoring Urban Built-up Areas by Combining NPP-VIIRS Nighttime Light, NDVI, NDWI, and NDBI. J. Clean. Prod. 2021, 328, 129488. [Google Scholar] [CrossRef]
- Nyland, K.E.; Gunn, G.I.; Shiklomanov, N.N.; Engstrom, R.A.; Streletskiy, D. Land Cover Change in the Lower Yenisei River Using Dense Stacking of Landsat Imagery in Google Earth Engine. Remote Sens. 2018, 10, 1226. [Google Scholar] [CrossRef] [Green Version]
- Tian, S.; Zhang, X.; Tian, J.; Sun, Q. Random Forest Classification of Wetland Landcovers from Multi-Sensor Data in the Arid Region of Xinjiang, China. Remote Sens. 2016, 8, 954. [Google Scholar] [CrossRef] [Green Version]
- Wingate, V.R.; Phinn, S.R.; Kuhn, N.; Bloemertz, L.; Dhanjal-Adams, K.L. Mapping Decadal Land Cover Changes in the Woodlands of North Eastern Namibia from 1975 to 2014 Using the Landsat Satellite Archived Data. Remote Sens. 2016, 8, 681. [Google Scholar] [CrossRef] [Green Version]
- Zurqani, H.A.; Post, C.J.; Mikhailova, E.A.; Schlautman, M.A.; Sharp, J.L. Geospatial Analysis of Land Use Change in the Savannah River Basin Using Google Earth Engine. Int. J. Appl. Earth Obs. Geoinf. 2018, 69, 175–185. [Google Scholar] [CrossRef]
- Fernández-Delgado, M.; Cernadas, E.; Barro, S.; Amorim, D. Do We Need Hundreds of Classifiers to Solve Real World Classification Problems? J. Mach. Learn. Res. 2014, 15, 3133–3181. [Google Scholar]
- Zhang, D.-D.; Zhang, L. Land Cover Change in the Central Region of the Lower Yangtze River Based on Landsat Imagery and the Google Earth Engine: A Case Study in Nanjing, China. Sensors 2020, 20, 2091. [Google Scholar] [CrossRef] [PubMed] [Green Version]
- Probst, P.; Boulesteix, A.-L. To Tune or Not to Tune the Number of Trees in Random Forest. J. Mach. Learn. Res. 2017, 18, 6673–6690. [Google Scholar]
- Oshiro, T.M.; Perez, P.S.; Baranauskas, J.A. How Many Trees in a Random Forest? In Proceedings of the Machine Learning and Data Mining in Pattern Recognition, New York, NY, USA, 30 August–3 September 2011; Perner, P., Ed.; Springer: Berlin/Heidelberg, Germany, 2012; pp. 154–168. [Google Scholar]
- Probst, P.; Wright, M.N.; Boulesteix, A.-L. Hyperparameters and Tuning Strategies for Random Forest. WIREs Data Min. Knowl. Discov. 2019, 9, e1301. [Google Scholar] [CrossRef] [Green Version]
- Guo, L.; Ma, Y.; Cukic, B.; Singh, H. Robust Prediction of Fault-Proneness by Random Forests. In Proceedings of the 15th International Symposium on Software Reliability Engineering, Saint-Malo, France, 2–5 November 2004; pp. 417–428. [Google Scholar]
- Gislason, P.O.; Benediktsson, J.A.; Sveinsson, J.R. Random Forests for Land Cover Classification. Pattern Recognit. Lett. 2006, 27, 294–300. [Google Scholar] [CrossRef]
- Bernard, S.; Adam, S.; Heutte, L. Dynamic Random Forests. Pattern Recognit. Lett. 2012, 33, 1580–1586. [Google Scholar] [CrossRef] [Green Version]
- Kulkarni, A.; Lowe, B. Random Forest Algorithm for Land Cover Classification. Comput. Sci. Fac. Publ. Present. 2016, 4, 58–63. [Google Scholar]
- Lind, A.P.; Anderson, P.C. Predicting Drug Activity against Cancer Cells by Random Forest Models Based on Minimal Genomic Information and Chemical Properties. PLoS ONE 2019, 14, e0219774. [Google Scholar] [CrossRef]
- MERF. Rapport Inventaire Forestier National Du Togo 2015–2016; Ministère de l’Environnement et des Ressources Forestières (MERF): Lomé, Togo, 2016; p. 79. [Google Scholar]
- Verma, P.; Raghubanshi, A.; Srivastava, P.K.; Raghubanshi, A.S. Appraisal of Kappa-Based Metrics and Disagreement Indices of Accuracy Assessment for Parametric and Nonparametric Techniques Used in LULC Classification and Change Detection. Model. Earth Syst. Environ. 2020, 6, 1045–1059. [Google Scholar] [CrossRef]
- Petropoulos, G.P.; Kalivas, D.P.; Georgopoulou, I.A.; Srivastava, P.K. Urban Vegetation Cover Extraction from Hyperspectral Imagery and Geographic Information System Spatial Analysis Techniques: Case of Athens, Greece. J. Appl. Remote Sens. 2015, 9, 096088. [Google Scholar] [CrossRef]
- Tang, H.; Hu, Z. Research on Medical Image Classification Based on Machine Learning. IEEE Access 2020, 8, 93145–93154. [Google Scholar] [CrossRef]
- Congedo, L. Semi-Automatic Classification Plugin: A Python Tool for the Download and Processing of Remote Sensing Images in QGIS. J. Open Source Softw. 2021, 6, 3172. [Google Scholar] [CrossRef]
- Puyravaud, J.-P. Standardizing the Calculation of the Annual Rate of Deforestation. For. Ecol. Manag. 2003, 177, 593–596. [Google Scholar] [CrossRef]
- Lopes, M.; Frison, P.-L.; Crowson, M.; Warren-Thomas, E.; Hariyadi, B.; Kartika, W.D.; Agus, F.; Hamer, K.C.; Stringer, L.; Hill, J.K.; et al. Improving the Accuracy of Land Cover Classification in Cloud Persistent Areas Using Optical and Radar Satellite Image Time Series. Methods Ecol. Evol. 2020, 11, 532–541. [Google Scholar] [CrossRef]
- Feyisa, G.L.; Meilby, H.; Fensholt, R.; Proud, S.R. Automated Water Extraction Index: A New Technique for Surface Water Mapping Using Landsat Imagery. Remote Sens. Environ. 2014, 140, 23–35. [Google Scholar] [CrossRef]
- Wijedasa, L.S.; Sloan, S.; Michelakis, D.G.; Clements, G.R. Overcoming Limitations with Landsat Imagery for Mapping of Peat Swamp Forests in Sundaland. Remote Sens. 2012, 4, 2595–2618. [Google Scholar] [CrossRef] [Green Version]
- Masiello, G.; Cersosimo, A.; Mastro, P.; Serio, C.; Venafra, S.; Pasquariello, P. Emissivity-Based Vegetation Indices to Monitor Deforestation and Forest Degradation in the Congo Basin Rainforest. In Proceedings of the Remote Sensing for Agriculture, Ecosystems, and Hydrology XXII, Online, 20 September 2020; SPIE: Bellingham, WA, USA, 2020; Volume 11528, pp. 125–138. [Google Scholar]
- Dong, J.; Xiao, X.; Menarguez, M.A.; Zhang, G.; Qin, Y.; Thau, D.; Biradar, C.; Moore, B. Mapping Paddy Rice Planting Area in Northeastern Asia with Landsat 8 Images, Phenology-Based Algorithm and Google Earth Engine. Remote Sens. Environ. 2016, 185, 142–154. [Google Scholar] [CrossRef] [PubMed]


| Sensors | Composite Target Years | Composite Image Acquisition Period | Admissible Cloud Threshold | Number of Images that Were Concerned |
|---|---|---|---|---|
| Landsat 5 | 1985 | 1983-01-01 to 1986-12-31 | 10% | 57 |
| Landsat 5 | 1990 | 1987-10-01 to 1988-03-31 1988-10-01 to 1989-03-31 1989-10-01 to 1990-03-31 1990-10-01 to 1991-03-31 1991-10-01 to 1992-03-31 1992-10-01 to 1992-12-31 | 10% | 49 |
| Landsat 7 | 2000 | 1999-04-16 to 2002-12-31 | 10% | 95 |
| Landsat 7 | 2005 | 2003-01-01 to 2007-12-31 | 20% | 322 |
| Landsat 8 | 2015 | 2013-01-01 to 2017-12-31 | 10% | 265 |
| Landsat 8 | 2020 | 2018-01-01 to 2020-12-31 | 10% | 171 |
| Acronym | Designation | Equation | References |
|---|---|---|---|
| NDVI | Normalized Difference Vegetation Index | [44,45] | |
| NDBI | Normalized Difference Built-up Index | [46,47] | |
| NDWI | Normalized Difference Water Index | [48,49] | |
| BSI | Bare Soil Index | [50,51] |
| LULC Categories | Description |
|---|---|
| Dense dry forest | Dense semi-deciduous forests, plantations, gallery forests, and agroforests |
| Open forest | Forests with open canopies and wooded savannahs |
| Savannahs | Tree savannahs, shrubby savannahs, and grassy savannahs |
| Crop and fallow | Areas with crops and abandoned agricultural land |
| Buildings and bare land | Infrastructure related to human settlements and commercial centers, roads, burnt or turned soil, and mining quarry |
| Water bodies | Continental water surfaces (lake, lagoon, water, dam, and river) |
| Clouds | Surface covered by clouds and their shadows |
| Image Composite | Accuracy | Clouds | Water | Dense Dry Forest | Open Forest | Crops + Fallow | Savannah | Bldg. + Soil | OA | K |
|---|---|---|---|---|---|---|---|---|---|---|
| 1985 | UA | 0.94 | 1.00 | 0.95 | 0.85 | 0.94 | 0.98 | 0.93 | 0.95 | 0.93 |
| PA | 0.99 | 1.00 | 0.95 | 0.75 | 0.97 | 0.97 | 0.89 | |||
| 1990 | UA | 1.00 | 0.99 | 0.94 | 0.95 | 0.92 | 0.93 | 0.99 | 0.96 | 0.95 |
| PA | 1.00 | 0.99 | 0.95 | 0.95 | 0.95 | 0.97 | 0.92 | |||
| 2000 | UA | 0.94 | 0.96 | 0.95 | 0.97 | 0.95 | 0.94 | 0.97 | 0.96 | 0.95 |
| PA | 0.97 | 1.00 | 0.95 | 0.94 | 0.96 | 0.96 | 0.92 | |||
| 2005 | UA | 0.78 | 0.99 | 0.50 | 0.81 | 0.83 | 0.97 | 0.84 | 0.91 | 0.86 |
| PA | 0.77 | 1.00 | 0.95 | 0.83 | 0.87 | 0.92 | 0.73 | |||
| 2015 | UA | 1.00 | 0.95 | 0.65 | 0.90 | 0.95 | 0.97 | 0.98 | 0.96 | |
| PA | 1.00 | 0.98 | 0.83 | 0.93 | 0.90 | 0.95 | ||||
| 2020 | UA | 1.00 | 0.96 | 0.29 | 0.89 | 0.90 | 0.98 | 0.93 | 0.91 | |
| PA | 1.00 | 0.99 | 0.58 | 0.87 | 0.89 | 0.91 |
| Image Composite | Accuracy | Clouds | Water | Dense Dry Forest | Open Forest | Crops + Fallow | Savannah | Bldg. + Soil | OA | K |
|---|---|---|---|---|---|---|---|---|---|---|
| 1985 | UA | 0.92 | 1.00 | 1.00 | 0.84 | 0.95 | 0.97 | 0.91 | 0.94 | 0.93 |
| PA | 0.99 | 1.00 | 0.97 | 0.76 | 0.96 | 0.96 | 0.89 | |||
| 1990 | UA | 0.99 | 0.99 | 0.95 | 0.95 | 0.92 | 0.93 | 0.98 | 0.96 | 0.95 |
| PA | 1.00 | 0.99 | 0.95 | 0.85 | 0.95 | 0.96 | 0.93 | |||
| 2000 | UA | 0.94 | 0.97 | 0.95 | 0.97 | 0.95 | 0.94 | 0.96 | 0.96 | 0.95 |
| PA | 0.96 | 1.00 | 0.97 | 0.95 | 0.95 | 0.96 | 0.92 | |||
| 2005 | UA | 0.78 | 0.99 | 0.52 | 0.82 | 0.83 | 0.97 | 0.84 | 0.91 | 0.86 |
| PA | 0.75 | 1.00 | 0.98 | 0.82 | 0.87 | 0.93 | 0,73 | |||
| 2015 | UA | 1.00 | 0.97 | 0.62 | 0.90 | 0.97 | 0.96 | 0.98 | 0.96 | |
| PA | 1.00 | 0.98 | 0.79 | 0.92 | 0.90 | 0.96 | ||||
| 2020 | UA | 1.00 | 0.95 | 0.25 | 0.90 | 0.91 | 0.98 | 0.93 | 0.91 | |
| PA | 1.00 | 1.00 | 0.50 | 0.88 | 0,89 | 0.93 |
| Year | LULC | Clouds | Water | Dense Dry Forest | Open Forest | Crops + Fallows | Savannah | Bldg. + Soil | Total |
|---|---|---|---|---|---|---|---|---|---|
| 1985 | Sup. (km2) | 1592.42 | 50.73 | 10,722.53 | 17,547.75 | 11,940.55 | 14,533.13 | 281.79 | 56,668.90 |
| Sup. (%) | 2.81 | 0.09 | 18.92 | 30.97 | 21.07 | 25.65 | 0.50 | 100.00 | |
| 1990 | Sup. (km2) | 1029.65 | 163.44 | 9095.25 | 14,378.62 | 11,641.92 | 20,012.41 | 347.62 | 56,668.90 |
| Sup. (%) | 1.82 | 0.29 | 16.05 | 25.37 | 20.54 | 35.31 | 0,61 | 100.00 | |
| Conv. (km2) | −562.77 | 112.70 | −1627.27 | −3169.13 | −298.63 | 5479.28 | 65.83 | ||
| Conv. (%) | −35.30 | 222.10 | -15.20 | −18.10 | −2.50 | 37.70 | 23.40 | ||
| 2000 | Sup. (km2) | 211.48 | 256.37 | 7704.97 | 10,515.96 | 14,179.42 | 23,379.66 | 421.06 | 56,668.90 |
| Sup. (%) | 0.37 | 0.45 | 13.60 | 18.56 | 25.02 | 41.26 | 0.74 | 100.00 | |
| Conv. (km2) | −818.17 | 92.94 | −1390.29 | −3862.67 | 2537.50 | 3367.25 | 73.44 | ||
| Conv. (%) | −79.50 | 56.90 | −15.30 | −26.90 | 21.80 | 16.80 | 21.10 | ||
| 2005 | Sup. (km2) | 176.23 | 332.72 | 8505.64 | 10,439.68 | 19,577.14 | 16,956.20 | 681.29 | 56,668.90 |
| Sup. (%) | 0.31 | 0.59 | 15.01 | 18.42 | 34.55 | 29.92 | 1.20 | 100.00 | |
| Conv. (km2) | −35.25 | 76.35 | 800.67 | −76.27 | 5397.73 | −6423.46 | 260.23 | ||
| Conv. (%) | −16.70 | 29.8 | 10.40 | −0.70 | 38.10 | −27.50 | 61.80 | ||
| 2015 | Sup. (km2) | 0.00 | 196.67 | 4186.70 | 8549.65 | 20,522.50 | 22,045.29 | 1168.10 | 56,668.90 |
| Sup. (%) | 0.00 | 0.35 | 7.39 | 15.09 | 36.21 | 38.90 | 2.06 | 100.00 | |
| Conv. (km2) | −176.23 | −136.05 | −4318.94 | −1890.04 | 945.36 | 5089.09 | 486.81 | ||
| Conv. (%) | −100.00 | −40.90 | −50.80 | −18.10 | 4.80 | 30.00 | 71.50 | ||
| 2020 | Sup. (km2) | 0.00 | 192.02 | 3785.27 | 9709.70 | 21,677.56 | 20,146.17 | 1158.19 | 56,668.90 |
| Sup. (%) | 0.00 | 0.34 | 6.68 | 17.13 | 38.25 | 35.55 | 2.04 | 100.00 | |
| Conv. (km2) | 0.00 | −4.66 | −401.43 | 1160.05 | 1155.06 | −1899.12 | −9.91 | ||
| Conv. (%) | 0.00 | −2.37 | −9.59 | 13.57 | 5.63 | −8.61 | −0.85 | ||
| 1985-2020 | Sup. (km2) | 0.00 | 192.02 | 3785.27 | 9709.70 | 21,677.56 | 20,146.17 | 1158.19 | 56,668.90 |
| Sup. (%) | 0.00 | 0.34 | 6.68 | 17.13 | 38.25 | 35.55 | 2.04 | 100.00 | |
| Conv. (km2) | −1592.42 | 141.28 | −6937.26 | −7838.06 | 9737.01 | 5613.04 | 876.40 | ||
| Conv. (%) | −100.00 | 278.47 | −64.70 | −44.67 | 81.55 | 38.62 | 311.01 |
| Year | Area (km2) | Forest Area (% of Togo) | r (% y−1) | R (km2 y−1) |
|---|---|---|---|---|
| 1985 | 28,270.28 | 49.89 | ||
| 1990 | 23,473.88 | 41.42 | −3.72 | 959.28 |
| 2000 | 18,220.92 | 32.15 | −2.53 | 525.30 |
| 2005 | 18,945.32 | 33.43 | 0.78 | −144.88 |
| 2015 | 12,736.35 | 22.48 | −3.97 | 620.90 |
| 2020 | 13,494.97 | 23.81 | 1.16 | −151.72 |
| 1985–2020 | −2.11 | 422.15 |
Publisher’s Note: MDPI stays neutral with regard to jurisdictional claims in published maps and institutional affiliations. |
© 2022 by the authors. Licensee MDPI, Basel, Switzerland. This article is an open access article distributed under the terms and conditions of the Creative Commons Attribution (CC BY) license (https://creativecommons.org/licenses/by/4.0/).
Share and Cite
Kombate, A.; Folega, F.; Atakpama, W.; Dourma, M.; Wala, K.; Goïta, K. Characterization of Land-Cover Changes and Forest-Cover Dynamics in Togo between 1985 and 2020 from Landsat Images Using Google Earth Engine. Land 2022, 11, 1889. https://doi.org/10.3390/land11111889
Kombate A, Folega F, Atakpama W, Dourma M, Wala K, Goïta K. Characterization of Land-Cover Changes and Forest-Cover Dynamics in Togo between 1985 and 2020 from Landsat Images Using Google Earth Engine. Land. 2022; 11(11):1889. https://doi.org/10.3390/land11111889
Chicago/Turabian StyleKombate, Arifou, Fousseni Folega, Wouyo Atakpama, Marra Dourma, Kperkouma Wala, and Kalifa Goïta. 2022. "Characterization of Land-Cover Changes and Forest-Cover Dynamics in Togo between 1985 and 2020 from Landsat Images Using Google Earth Engine" Land 11, no. 11: 1889. https://doi.org/10.3390/land11111889
APA StyleKombate, A., Folega, F., Atakpama, W., Dourma, M., Wala, K., & Goïta, K. (2022). Characterization of Land-Cover Changes and Forest-Cover Dynamics in Togo between 1985 and 2020 from Landsat Images Using Google Earth Engine. Land, 11(11), 1889. https://doi.org/10.3390/land11111889