1. Introduction
Land surface temperature (LST) and air temperature (T
air) are useful for assessing and mapping earth surface and near-surface thermal conditions using information related to sensible and latent heat fluxes [
1]. In urban environments, increased impervious surfaces, reduced vegetated areas with canopy cover, and atmospheric pollution affect the local LST and T
air [
2]. As a result, heat absorption from numerous types of urban surfaces and anthropogenic activities lead to urban heat island (UHI) effects with rising LST and T
air [
3]. Therefore, examining the temporal and spatial changes of LST and T
air is commonly used to study the impact and footprint of UHI caused by urbanization [
4,
5,
6].
T
air is often measured through weather stations. Canopy cover, wind, humidity, and other atmospheric properties affect the local T
air at each station, and vegetated land cover distributions influence T
air with its microclimatic effects, along with rapid cool and warm air advections [
7]. Although T
air measured at sparse weather stations often has high accuracy and temporal frequencies, its application in assessing UHI is dependent upon its location and the surrounding surface characteristics. For example, measuring T
air at airport locations found no evidence of correlation with population accumulation [
8], while using in situ stations located within urban centers provides contrasting results [
9].
Satellite-based LST provides comprehensive earth surface temperature data at different spatial resolutions, with different temporal resolutions. Comparing with ground-based T
air, satellite-based LST has the advantage of detailed spatial coverage, although its temporal resolution is often limited. For example, the most commonly used Moderate Resolution Imaging Spectroradiometer (MODIS) LST data often have a coarse spatial resolution of 1 km with daily overpass frequency, which would reveal intra-annual dynamics and overall patterns throughout large areas [
10]. However, its coarse spatial resolution often results in mixed pixels, containing more than one land cover in heterogenous landscapes [
11,
12]. Alternatively, finer spatial resolution sensors, such as Landsat 7 Enhanced Thematic Mapper (ETM+), have the ability to resolve complex land cover patterns, reduce mixed pixels, add surface detail, and validate coarse resolution maps [
13]. Although many satellite-based LST products are available, there seems to be few direct comparisons of different LST products at local regional levels.
Previous studies have compared ground-measured T
air with satellite-based LST at global and continental scales [
14,
15,
16]. By comparing the LST from MODIS, AVHRR, and (A)ATSR, researchers have found that MODIS LST has the highest agreement with T
air [
15,
17,
18]. Vegetation, land cover, terrain, and seasonality would impact the correlation between MODIS LST and T
air [
15,
16,
19,
20,
21]. However, most of those studies are based on MODIS or similar coarse resolution-based LST products, not on fine-resolution LST products such as Landsat ETM+, especially at the local scale. Limited studies have been conducted to investigate the relationship between surface temperature from Landsat TM and T
air during winter nights [
22]. In UHI studies, the sparse T
air measures from limited weather stations cannot provide the detailed spatial variation and change of urban thermal surface. Therefore, fine-resolution LST products would provide an additional dimension for understanding the temperature variability in an urban setting. In addition, the recent availability of using Google Earth Engine (GEE) to simplify methods of obtaining LST from Landsat imagery makes an extensive LST comparison acquired at different scales easily accessible.
This study is intended to compare LST products derived from Landsat 7 and MODIS and examine the impact of seasonality and land cover on the relationship between LST and Tair at a local scale. The key questions addressed in this study are: (1) What is the difference between LST data derived from MODIS at 1 km resolution and Landsat 7 ETM+ at 30 m resolution? (2) How does the seasonality, land cover, and spatial resolution impact the relationship between satellite-derived LST and Tair at a local scale?
2. Materials and Methods
2.1. Study Area
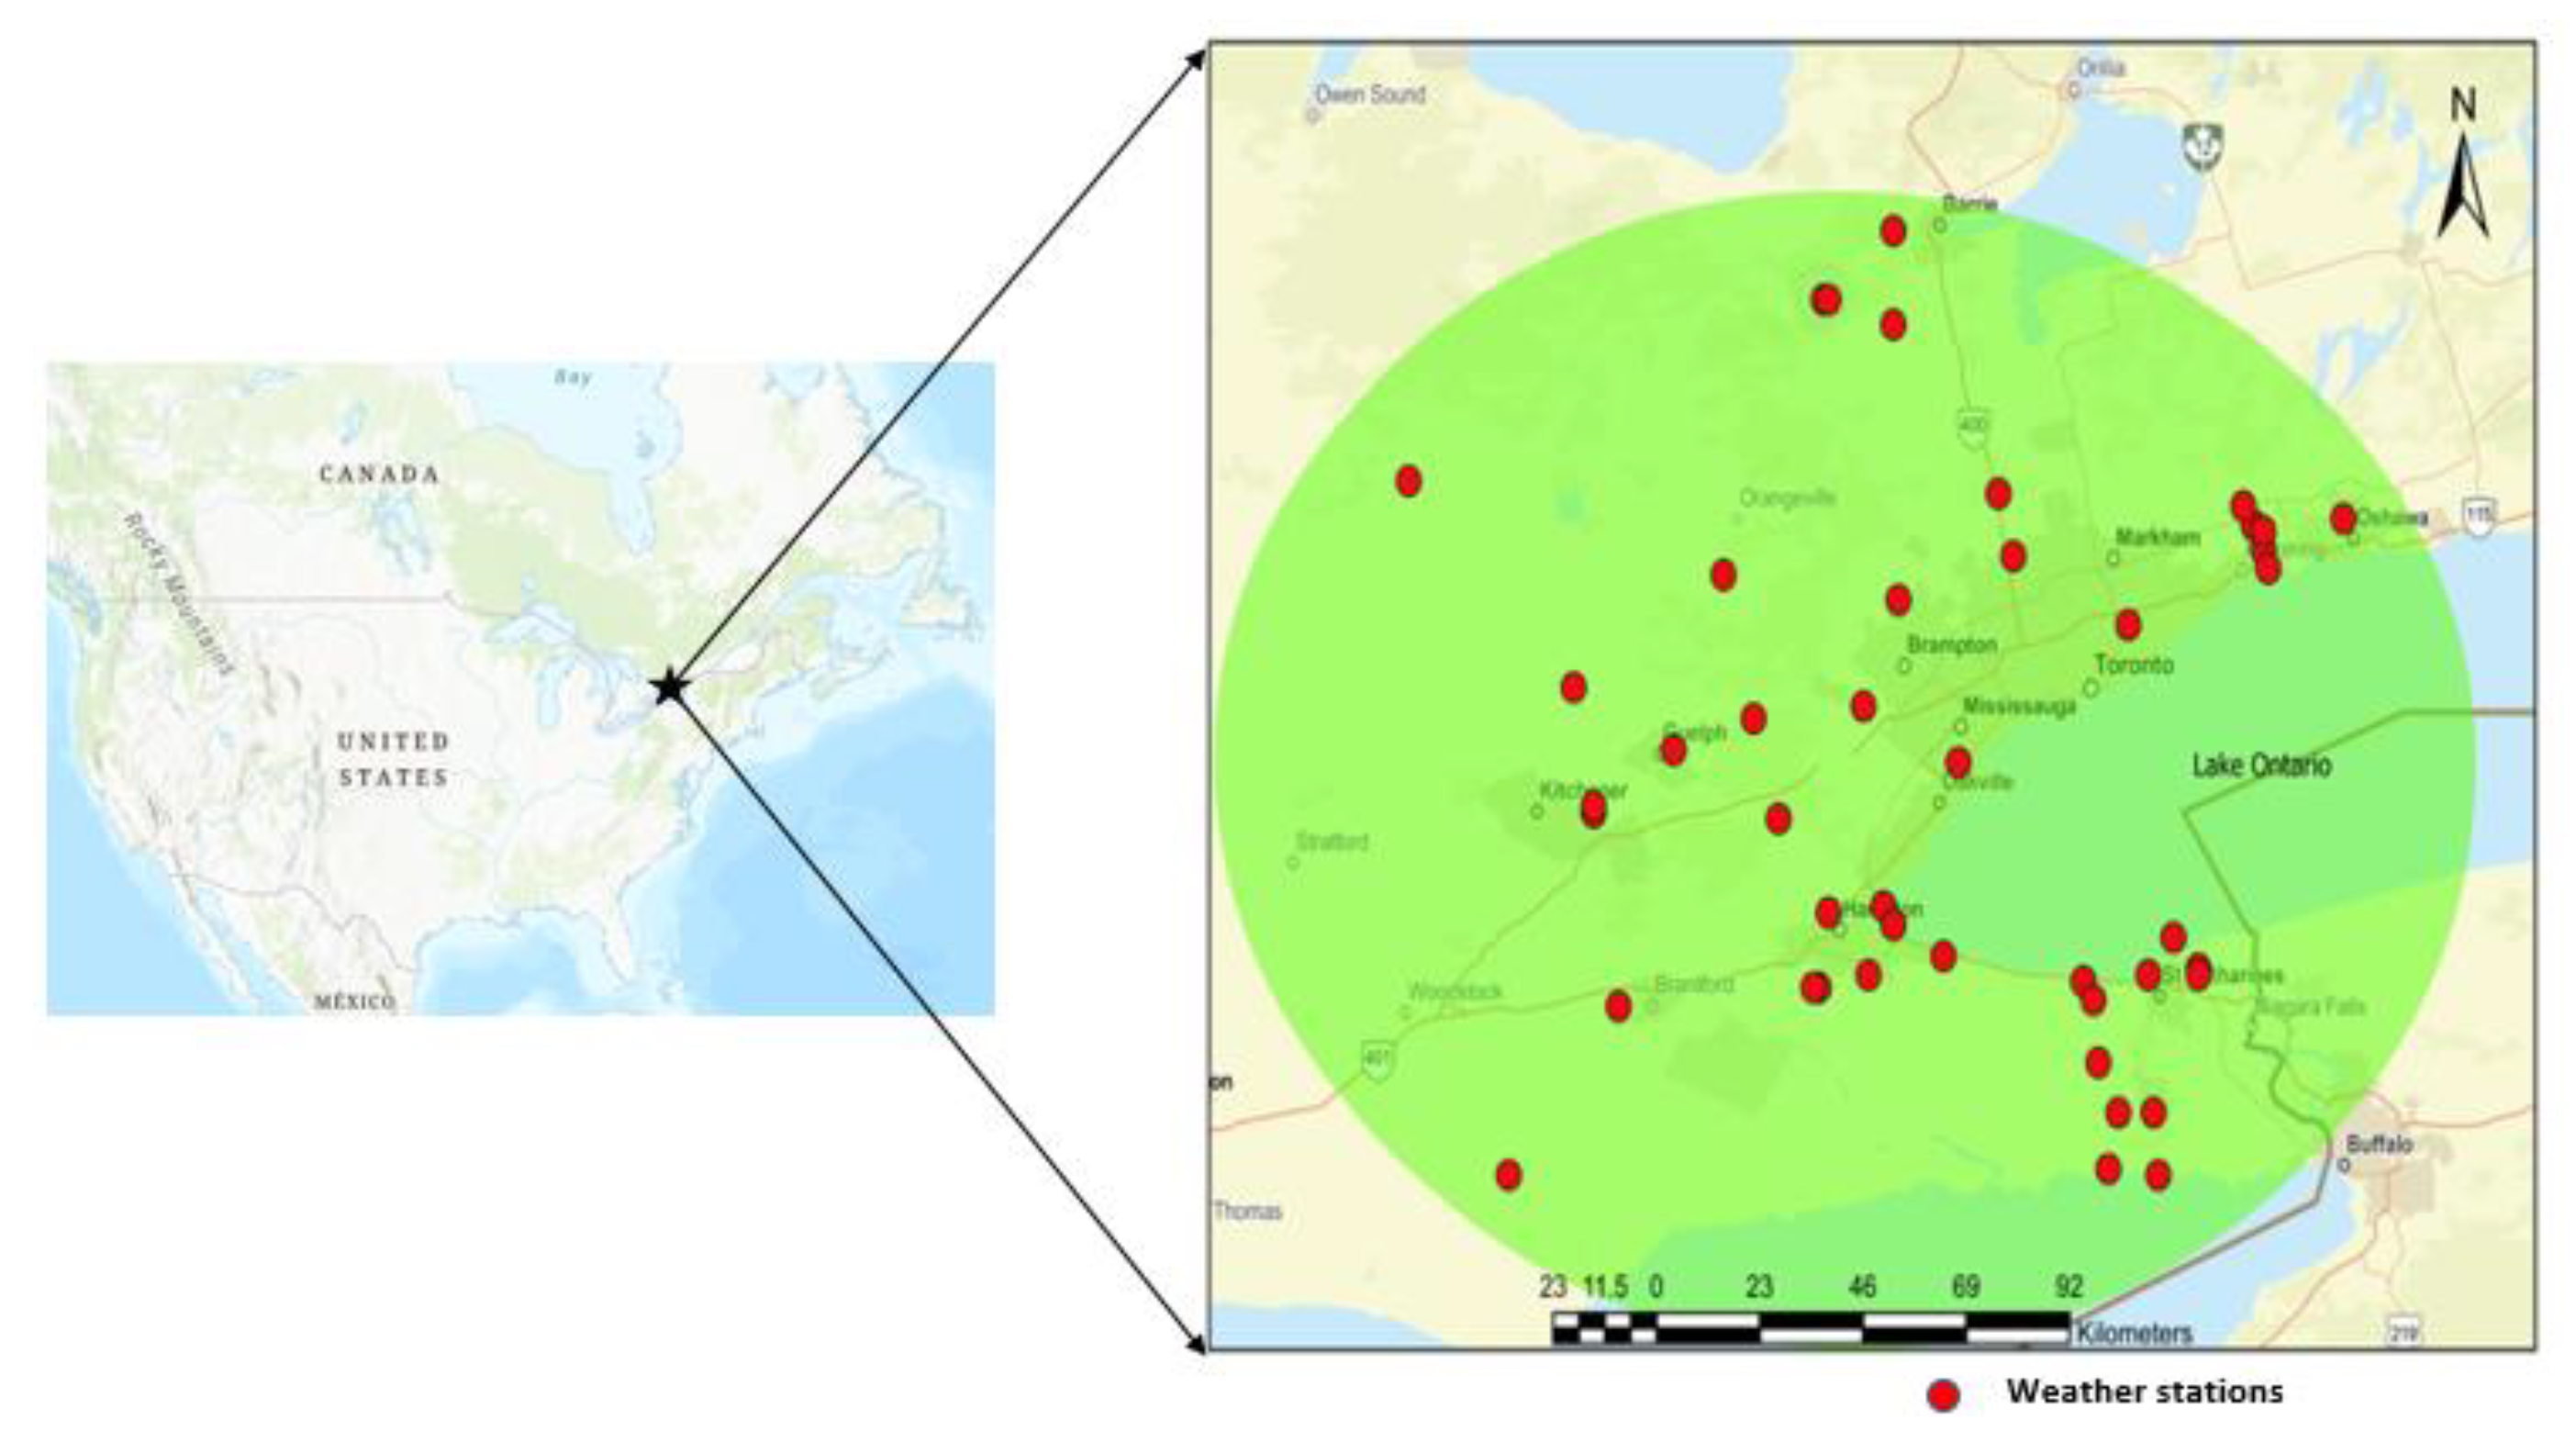
Milton, Ontario, Canada, is used as the central point to determine the study area. Milton is the fastest-growing community in Ontario, and the sixth overall throughout Canada amongst the most rapidly urbanizing communities nationwide. To study the relationship of satellite-based LST and T
air, we need to collect ground air temperature data from weather stations. To maximize availability of in situ data from weather stations near GTA and its surrounding area, a 100 km buffer around its urban core was used as the study area, as shown in
Figure 1. There are 46 weather stations located in the study area (marked in red dots in
Figure 1) and included in the analysis.
The area has a population greater than 7 million people, representative of the most populated area in Canada. It has a humid continental climate with short spring and autumn seasons. The annual average temperature of the region is around 9 °C, and the annual average precipitation is around 830 mm. Precipitation in all months is quite consistent, with mainly snow during the winter. The average minimum temperatures in December January, February, and March are below zero, with the average minimum temperature of around −7 °C in January and February. From the end of March, the temperature rises, and usually reaches to the average maximum temperatures of 24 °C, 27 °C, and 26 °C in June, July, and August, and then declines. Average maximum temperatures in the summer can range from 23 °C to 31 °C, with moderate to high humidity due to the lake effect. Snow can fall in early spring or late fall, but usually melts quickly in spring and fall.
2.2. In Situ Meteorological Data
Hourly Tair data was acquired from the Climate Services department of the Government of Canada’s Ministry of Environment and Climate Change. The metadata for each weather station, such as the geographical coordinates, instrument parameters, and station ID, were also obtained. In order to maximize the database, all stations within the study area, including the ones which were only temporarily operational and contain data gaps, are included.
For use in a daytime comparison with LST products, the data collected at the nearest hour to the time of acquisition for all products from each satellite platform was used. The LST data derived from Landsat 7 ETM+ products within the area were all obtained within twenty minutes of 16:00. The fluctuations with the overpass time of each of the MODIS platforms results in far more complex comparisons. Both satellites capture daily data throughout a 2.5 h overpass window over the Milton area. In order to present data at the nearest hour to the overpass time of each satellite, the MODIS Terra data is compared with the 10:00, 11:00, and 12:00 Tair measurements, while the Aqua data is compared to the 12:00, 13:00, and 14:00 data. In addition, due to the processing employed to derive the level 2 MODIS LST data, both platforms are also compared with the daily average and maximum Tair data.
2.3. Land Cover Data
Raster and vector land cover maps were provided by the Southern Ontario Land Resource Information System (SOLRIS). An accuracy assessment conducted in the same area as this analysis has an overall accuracy of 93%, captured by fuzzy error assessment results [
23]. The version 3.0 SOLRIS package includes a raster dataset (with all of the land cover designations), a vector land cover changes dataset, and a land cover class corrections dataset (including class updates, accuracy assessment results, and transformations) with a 15 m spatial resolution [
24].
Simplified land cover classifications are used to reduce the quantity of different land covers to five categories (Forested, Wetland, Lakeside, Agricultural, and Urban) (
Table 1). ‘Wetland’ refers to any surface where the water table is either seasonally or permanently at, near, or above the substrate surface [
24]. Any weather station adjacent to a large water body is classified as “lakeside”.
Table 1 displays how the classifications are simplified into five main land cover categories.
2.4. Remote Sensing Data
Imagery was collected from MODIS and Landsat TM sensors with different spatial and temporal resolutions, obtainable product levels, and processing requirements. Both remote sensing products use similar variables related to T
air, such as albedo, LST, and normalized difference vegetation index (NDVI) [
25].
2.4.1. MODIS LST
Selection of MODIS as coarse resolution sensors for the comparison is based on data availability, product accuracy, and an established foundation of land cover analysis reports. Consisting of two platforms launched in a similar time period as Landsat 7 ETM+ (although the Aqua platform was released in 2002), MODIS products can provide high accurate LST data, with spatial representativeness being a limiting factor [
14,
15,
26,
27,
28].
MOD11A1 and MYD11A1 are level 3 LST products from the MODIS Terra and Aqua platforms on a 1200 × 1200 pixel grid, with an exact spatial resolution of 0.928 × 0.928 km in the Sinusoidal projection. LST pixel values are generated using the split-window algorithm (SWA) with clear-sky conditions and are averaged in areas with overlapping pixels with overlapping areas of weight [
29]. Its advertised one-day temporal resolution is optimistic based on the availability of clear-sky distribution. Since the thermal infrared (TIR) bands on the MODIS sensors are unable to penetrate clouds, any pixel experiencing cloudy interference must be skipped [
30].
Both satellite platforms operate on a sun-synchronous orbit [
15]. Based on the estimates provided by the NASA LaRC Satellite Overpass Predictor (
https://cloudsway2.larc.nasa.gov/cgi-bin/predict/predict.cgi, accessed in 30 August 2020), the overpass times at the selected location for the Terra platform range between 10:00 and 12:30 and 12:00 to 14:30 for Aqua in the local Eastern Standard Time.
2.4.2. Landsat 7-Derived LST
Landsat 7 ETM+ was the ideal choice for finer resolution LST data. It is a major leap forward from its predecessors, with multispectral spatial resolutions ranging from its 15 m panchromatic band to the 60 m TIR band [
31]. Reference [
1] presents an innovative method using the Statistical Mono-Window Algorithm (SMW) in Google Earth Engine to simplify the calculations needed to derive LST by reducing the amplitude of data required for time series analyses. Access to the algorithm is simply introduced through the use of the JavaScript function “require(…)”, thus eliminating the necessity to download bulk quantities of data. To retain data consistency, no interpolation was performed following the failure of the Landsat 7 scan line corrector, resulting in pixilation loss.
To access LST, the surface reflectance is calculated from the radiative transfer for atmospheric data using the Landsat Ecosystem Disturbance Adaptive Processing System Algorithm [
1]. A cloud mask is applied to eliminate interference. Data from the Advanced Spaceborne Thermal Emission and Reflection Radiometer Global Emissivity Dataset (ASTER) is spectrally adjusted and modified accounting for phenology and snow coverage using shortwave infrared Landsat data [
32]. The SMW algorithm used within the [
1] code presents two options for achieving LST, the direct application of instantaneous ASTER emissivity corrected values or the inclusion of NDVI-based corrections. With the latter option, the coarse TIR band can be resampled with an enhanced spatial resolution from NDVI and surface emissivity to generate LST [
33]. For the purposes of understanding the influence which NDVI has upon LST, both methods are implemented.
2.5. Analysis Methods
The first step involves the data extraction from all meteorological stations collecting hourly data within the study area, from 1 January 2000 to 31 December 2019. From each station, all 16:00 data was used for comparison with the Landsat 7 ETM+-derived LST data. Since the time of the data acquired from both MODIS platforms ranges from 10:00 to 14:30, every hour’s temperature recordings within the range are used, relative to its corresponding satellite. The daily mean and maximum Tair measurements are also incorporated due to the SWA processing techniques for acquiring LST. A 100 m buffer is implemented surrounding each weather station to determine the dominant land cover from SOLRIS data. All stations classified under each surface type are grouped together.
Based on the provided longitude and latitude data from each weather station, all MODIS (Terra and Aqua) and Landsat 7 LST data are extracted for the time series analysis. Among all the Tair and LST data extracted, only the data that exists when in situ measurements and remote sensing data were simultaneously collected are utilized for comparison. The quantity of Tair and LST observations pairs within each analysis is included in Tables 3–7.
To better compare the satellite-based LST and Tair, each year is divided into two parts, representing the changing land surface distribution amongst seasons (summer and winter). Rather than utilizing the four traditional seasons, each year only uses two to describe the changing land surface characteristics due to the short spring and fall seasons. The warmer portion of the year, referred to as “summer” (days 100–290), ranges from mid-spring (April 9/10) to mid-autumn (October 16/17), and the colder portion (named “winter” in reference to days 1–99 and 291–366) indicates the rest of the year. The summer content is largely unaffected by snow or ice coverage and is representative of vegetation growth and increased solar radiation, as opposed to the winter.
Linear regression analyses are conducted based on geographical variables land cover type for summer and winter days and performed through R. The results are compared using R2 values, root-mean square error (RMSE), bias, and the number of observations. All remote sensing data are acquired and processed in Google Earth Engine.
An additional comparison between satellites excludes Tair measurements. Several large areas with land cover consistently within each category are selected and aggregated. Within each land cover designation, 70 points are randomly selected accessing the mean temperature within a 50 m homogenous buffer. The mean LST measurements from each category and platform are compared to determine the quantity and quality of the variations of data.
3. Results
As a result of the vastly different temporal resolutions amongst the remote sensing platforms, there is far less T
air data to compare with the Landsat 7 LST. The validity of all analyses is based on
p-values and the R
2 values, which measure the quantity of variance in the dependent variable explained through the independent variable [
34]. All regression results from these analyses produced statistically significant
p-values, with a few exceptions (all of which are related to the small quantity of LST data to compare with wetlands T
air measurements due to the limited quantity of stations on or near wetlands). In addition, the RMSE and bias were included to further understand the distribution of residuals and real values [
25]. The bias refers to subtracting the LST by T
air, or in the Landsat 7/MODIS comparison, MODIS LST minus Landsat 7 LST.
Table 2 summarizes the regression analysis results based on all pairs in winter days and summer days. In general, there are higher R
2 values in the winter days compared with the corresponding values in summer days, indicating a stronger relationship in all comparisons in winter than in the summer. The correlations are slightly higher between T
air and Terra LST than Aqua LST, although this difference is not significant at all. The slight difference in correlations during the different time is not significant, indicating the similar trend of different temperature measurements when compared with LST. LST from Terra with T
air recorded at 12:00 provides the strongest overall relationship with either of the MODIS missions, with an R
2 value of 0.79. The Landsat 7 NDVI-derived LST’s relationship with T
air is a marginal improvement, with RMSE of 4.16 and an R
2 value of 0.81, slightly higher than ASTER-derived data. In contrast, the summer data in
Table 2 correlations are far less robust. Comparisons with MODIS data have R
2 values as high as 0.45, while the Landsat 7 LST overall data comparison is slightly weaker, with R
2 values of 0.35.
Amongst the two Landsat 7 LST datasets, the results are very similar. NDVI corrections produce marginally improved R2 and RMSE values; however, the bias is weaker.
Table 3,
Table 4,
Table 5,
Table 6 and
Table 7 list the R
2 values, RMSE, and biases from regression analysis between LSTs and T
air for stations located in five land cover types respectively, along with the number of pairs used in the analysis. The summer and winter analyses developed differing conclusions regarding the land cover in which strongest relationships between LST and T
air exist. In the summer, the wetland surfaces had the most robust correlations, with MODIS at R
2 values as high as 0.69 (Terra and the daily maximum T
air) and the smallest RMSE. Meanwhile, both Landsat 7 LST measurements failed to collect enough data from stations located near wetlands. With the other land covers, R
2 and RMSE results between fine-resolution LST data and T
air were only slightly weaker than MODIS relationships with forested and lakeside stations compared to larger deviations with agriculture and urban.
With the winter comparisons, Landsat 7 LST showed stronger correlation with Tair than MODIS LSTs; however, they are only marginally better in agricultural and urban areas. Forested weather stations’ data during the cold season exhibit the largest deviation in variance explained through Landsat 7 LST (R2 values of 0.67 without NDVI) over the highest MODIS R2 values of 0.50. All other land covers yield similar comparisons, with slight improvements when NDVI corrections are applied to calculate LST.
The number of observations with Landsat 7 is a continuous issue throughout the analysis. Wetlands results with Landsat 7 are insufficient throughout both seasons. Although conclusions can be drawn with forested land covers, the quantity of winter observations limits the validity.
With the scaled LST analysis excluding Tair, the relationships are marginally stronger with the MODIS Terra platform and Landsat 7 with NDVI across both seasons and every land cover. Much like the Tair comparisons, the winter has significantly stronger correlations, with the only exception being open water land covers.
Winter results in
Table 3,
Table 4,
Table 5,
Table 6 and
Table 7 show that fine-resolution LST with NDVI corrections and coarse resolution data from MODIS Terra have the strongest relationship based on every conducted measurement. For summer results, Landsat 7 LST using NDVI has an improved relationship, with R
2 values ranging from 0.74 to 0.91, with Terra. Relationships over water bodies provided the strongest summer R
2 and RMSE (0.91 and 1.98, respectively) results between Landsat 7 and the Terra sensor.
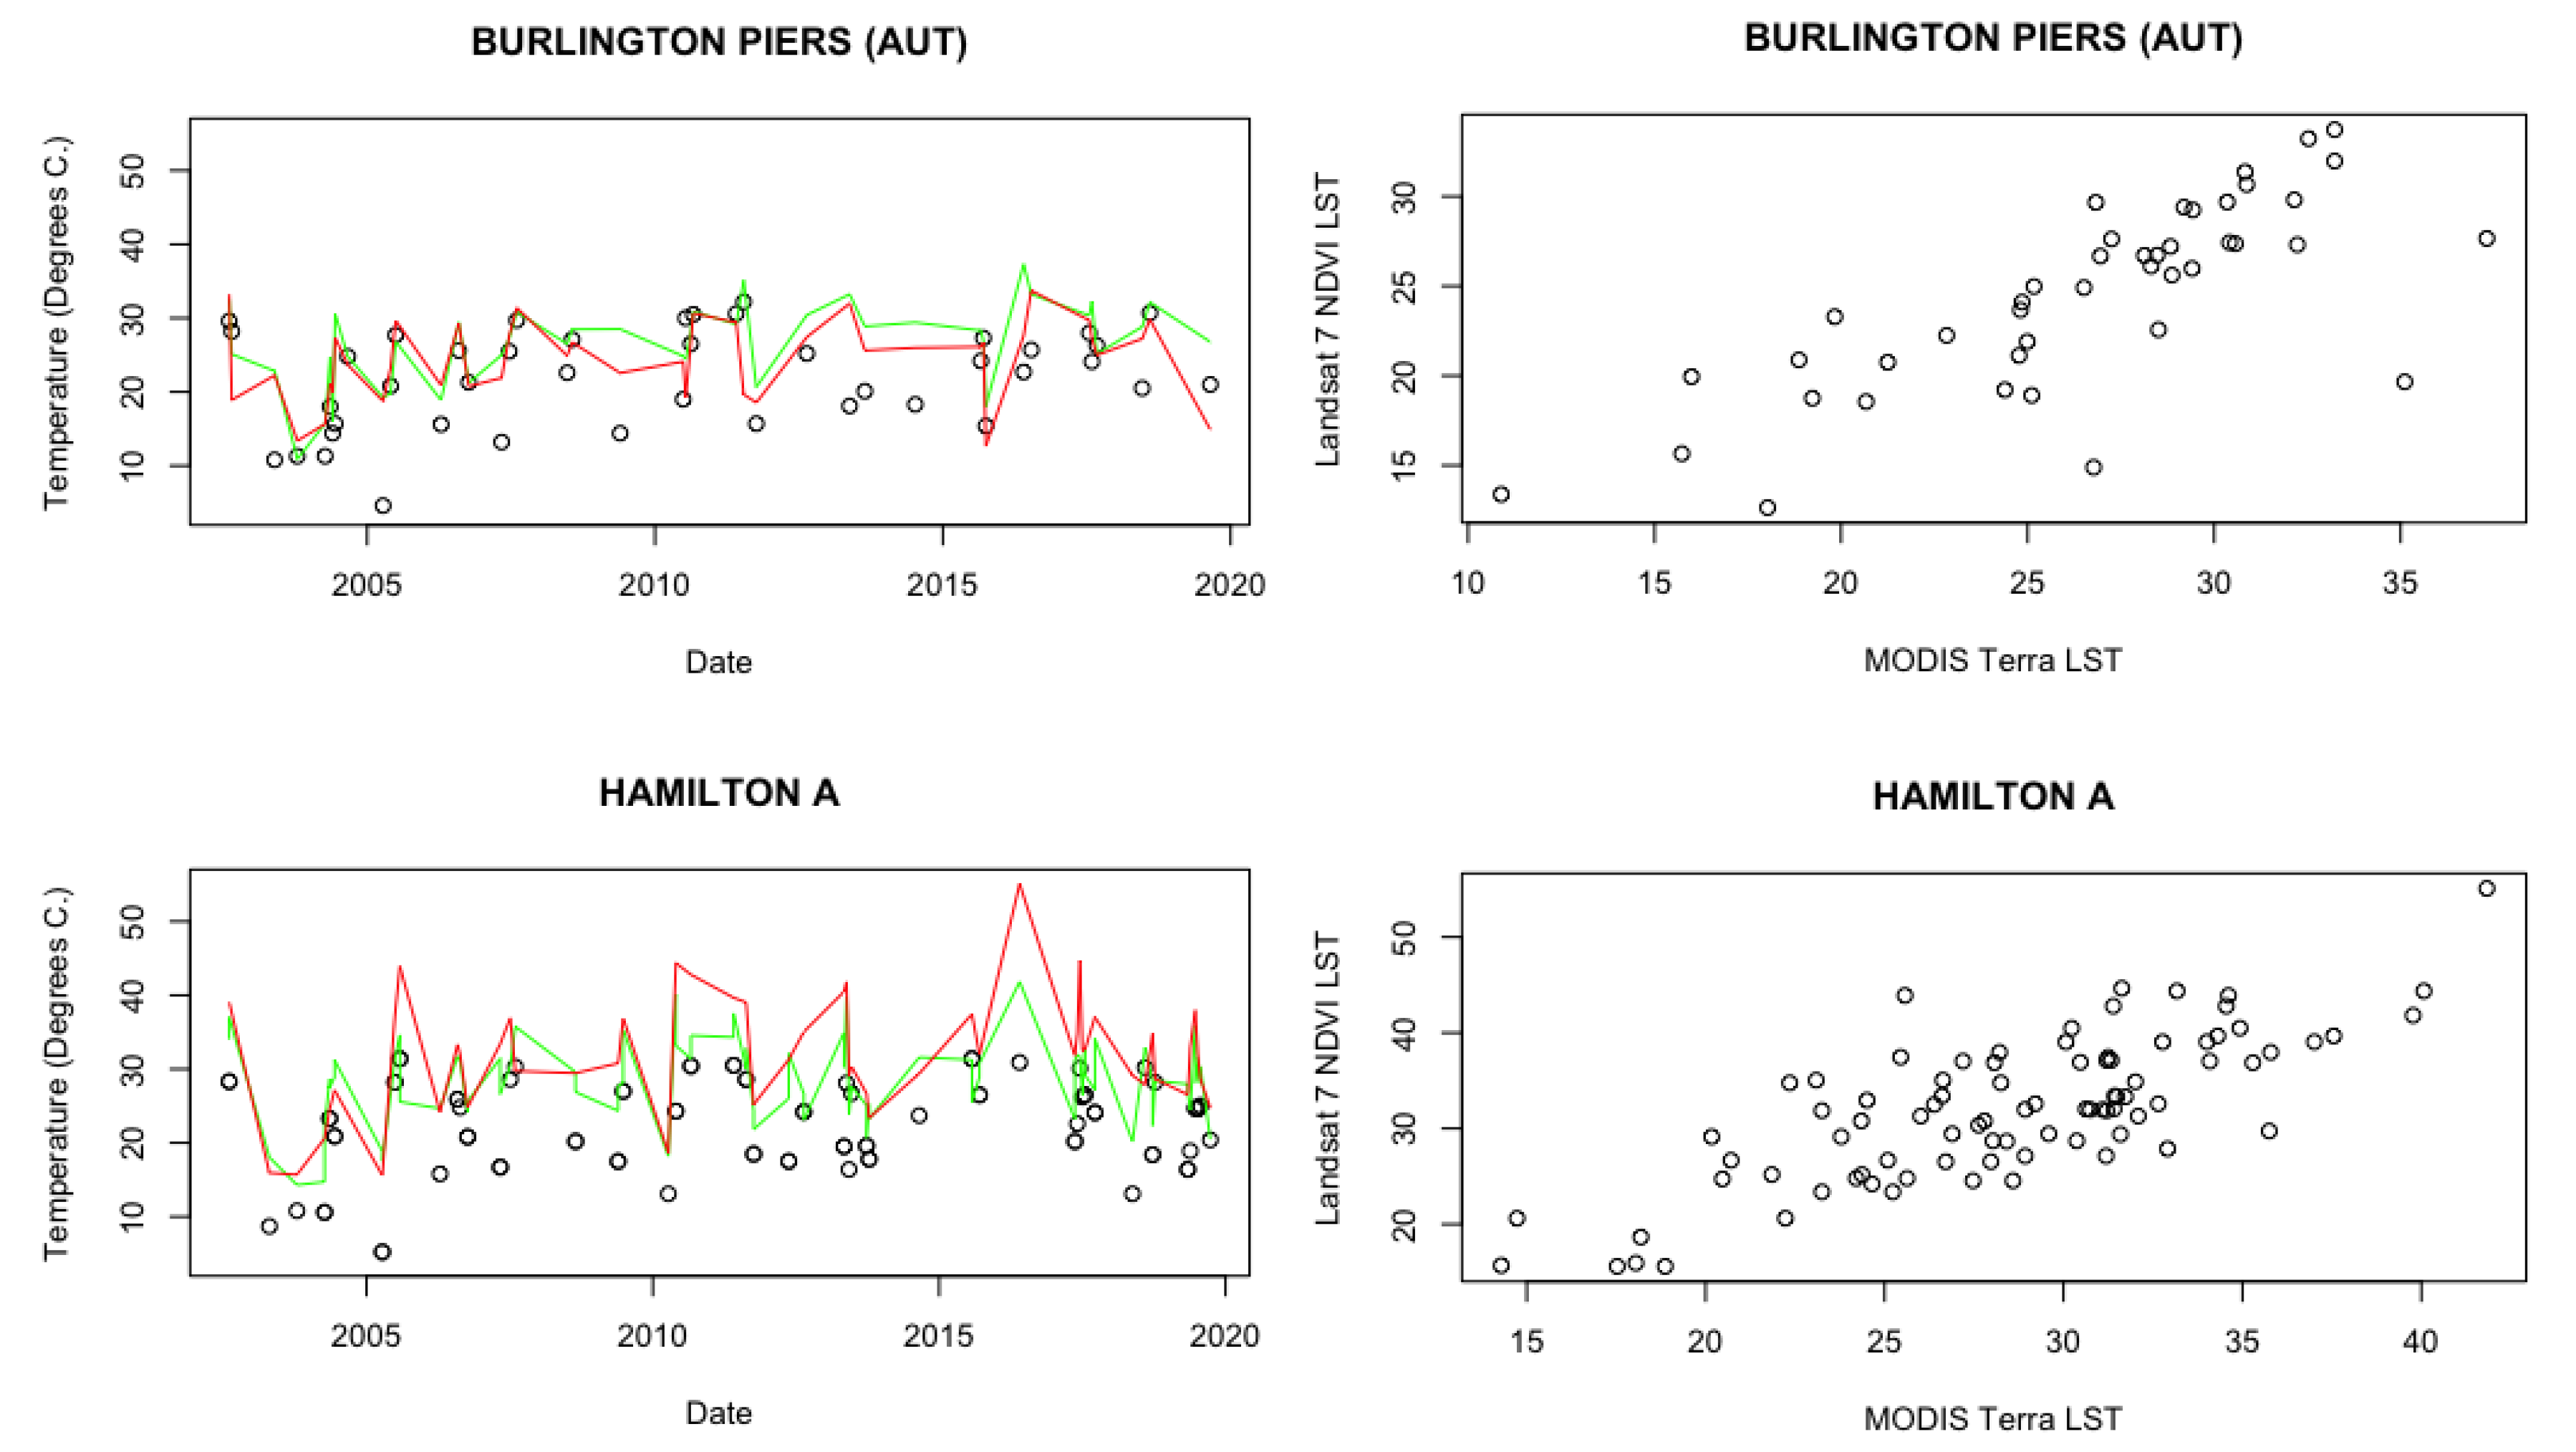
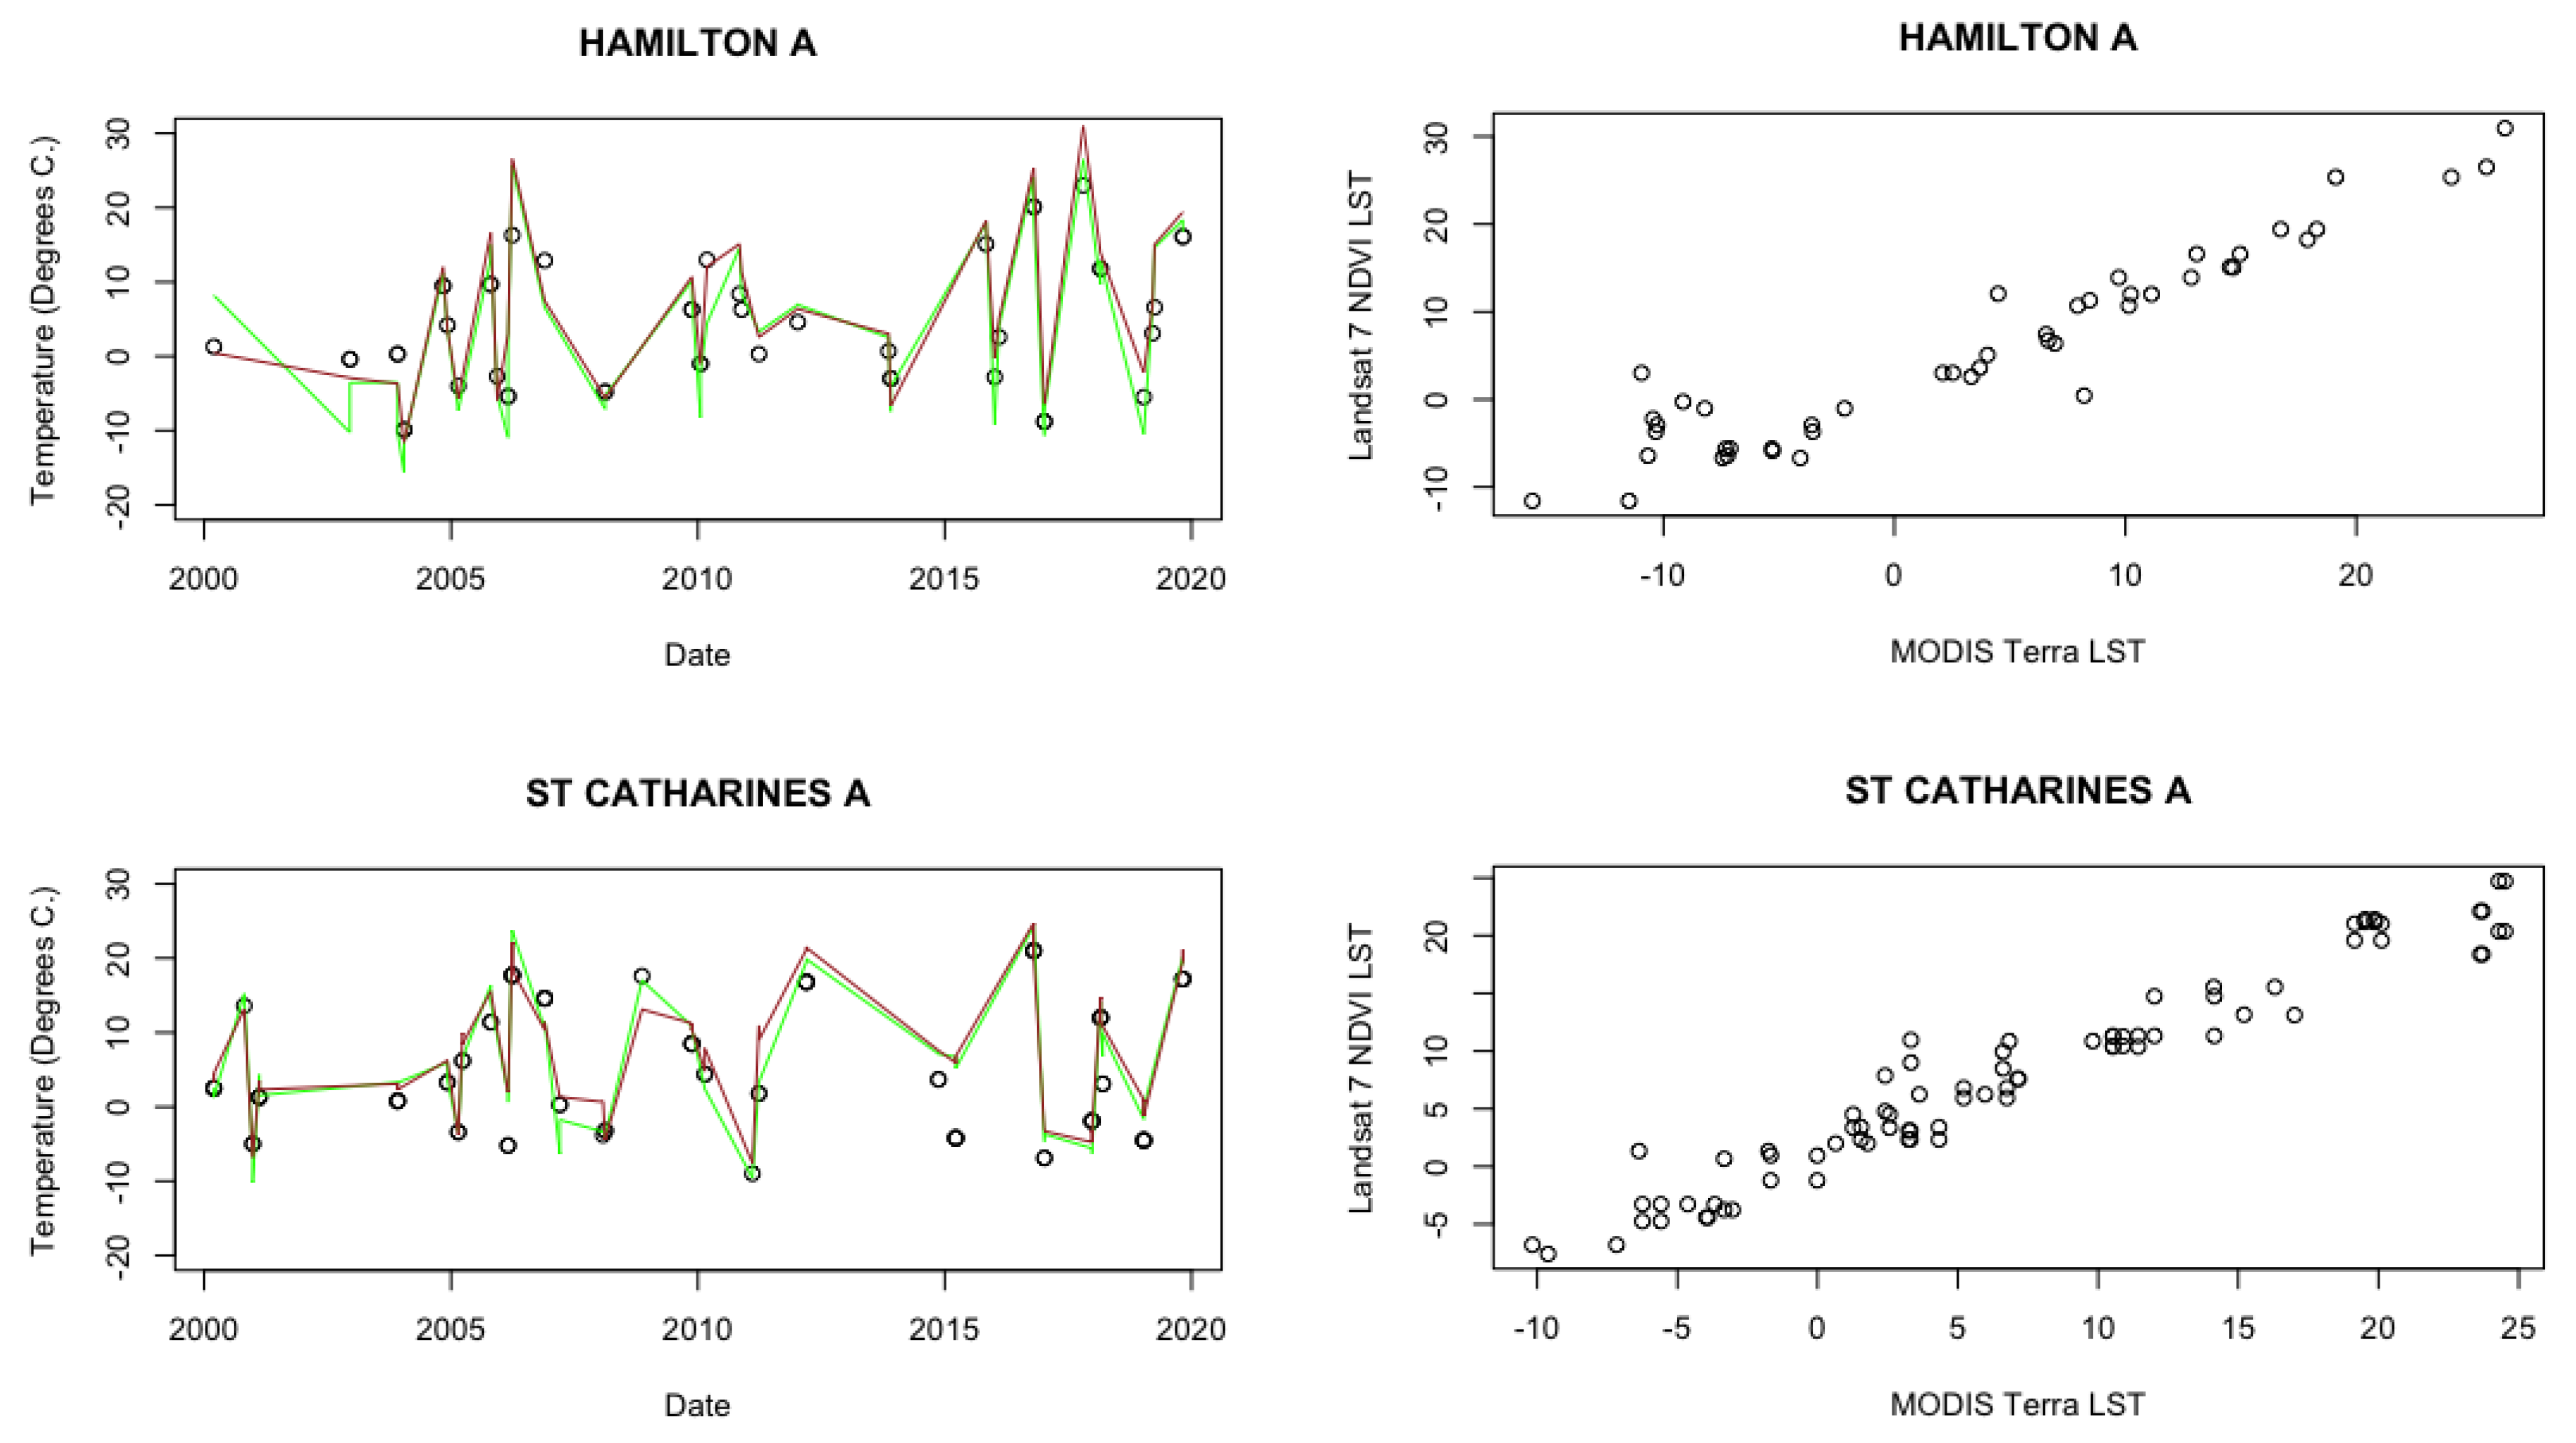
A visual analysis of the plots for individual weather stations was necessary to ensure that the temperature variations and patterns throughout each season in each year are followed closely. Although some stations have far more data than others, certain parameters are required to complete a thorough visual examination. T
air station dates which contain data recorded from both remote sensing platforms are used for the analysis.
Figure 2 displays patterns that Landsat 7 (with NDVI corrections) LST data has with MODIS Aqua LST and the daily mean T
air recordings during the summer, and
Figure 3 has a similar comparison except with MODIS Terra LST during the winter. Although the satellite-produced LST data differs from the ground T
air data, winter patterns appear more aligned. Comparing the scatterplots in
Figure 2 and
Figure 3, it is also clear that the summer LST has more mismatching between coarse-resolution MODIS and fine-resolution Landsat LSTs than the winter LSTs for both stations, indicating that the winter’s ability to smooth heterogenous surfaces presented stronger relationships with both LST and T
air over land cover.
4. Discussion
A major obstacle confronted in this analysis relates to the vastly different quantities of imagery available from each satellite platform. The 16-day revisit cycle for the Landsat 7 satellite limits the availability of data to compare and analyze with MODIS and T
air. Both MODIS platforms calculate the LST based on clear-sky pixel coverage, masking clouds with the cloud mask algorithm [
29]. The strongest correlations between MODIS and specific T
air hours varies based on the range of overpass times and SWA methods used to achieve LST. With Landsat 7-derived LST, only 479 observations are possible (provided every overpass occurs during a clear sky) at each location throughout the provided time frame compared to the near daily results optimistically attainable from MODIS.
4.1. Impact of Seasonality
The results based on time of year remain consistent with previous research comparing MODIS results with T
air. The authors of [
16] noted the much stronger relationship that MODIS LST has in the winter (daytime and nighttime) when compared with the summer daytime (the nighttime results were stronger due to lacking a solar radiation variable), with fluctuations based on ecological context. Other researchers [
21] concluded that the relationships between surface temperature and air temperature were the strongest during late summer and autumn, and the weakest during winter and early spring in complex mountainous regions of Nevada. Stronger relationships between LST and T
air are found in winter than summer with both scales in this study. Extensive snow and ice cover in the winter can cause more homogeneity of land cover, except forest land. Surface conditions, changes to the soil moisture content, and heterogeneity of the surrounding land covers can play a major role in determining the variations in the summer days.
Winter seasonal energy exchanges heavily affect the comparisons in this study. The albedo consistency varies based on low-temperature snow coverage over agriculture, grassland, near-surface shrubbery, and diversified canopy cover, with heterogenous types of forest life [
35]. The impact is limited to the spatial resolution each sensor possesses and the ecosystems surrounding the study site. In addition, due to the time frame of the winter analysis (mid-October to mid-April), discrepancies can occur due to the varying degrees of snow coverage throughout the time interval. A temperature bias happens as the year progresses from the winter solstice, resulting in stronger solar radiation [
36]. The necessity to encompass the entire period of each year where snow cover is possible enhances the ability to identify the true relationship LST has with T
air, regardless of circumstances.
Overall, the finer scale LST products with NDVI corrections retained the strongest relationships with Tair. With an R2 value of 0.81 (slightly higher than with coarse sensors) and RMSE of 4.16 (slightly lower than with coarse sensors), the winter’s ability to homogenize the surrounding environment increases the reliability of surface temperature to determine near-surface temperatures. The relationship difference between coarse- and fine-resolution sensors is minor, with the exception of in situ stations surrounded by forested surfaces. Finer resolution LST and Tair have R2 values between 0.60 and 0.67, compared to 0.50 with coarse-resolution LST.
The summer comparisons lead to alternative results with each land cover and scale. Surface temperatures are high with non-evaporating surfaces and lower with water bodies due to the radiant reflection. The reflected solar radiation on the impervious pixels can strongly impact the LST, especially at a finer scale. Vegetated covers also have low radiant temperature as a result of a reduction in heat stored in the soil from transpiration [
37]. Overall, coarse-resolution LST data possess the strongest R
2 and RMSE results, especially with the MODIS Terra platform. Agricultural and urban stations have the largest difference in relationship between coarse and fine resolutions, while lakeside, forested stations displayed minor improvements.
The diversity of temperatures across each land cover poses strong catalysts for how the remote sensing-derived LST relates to T
air, depending on scale. Each biome maintains its own unique set of physical, climatological, botanical, and animal habitat characteristics, which cause variances that are not expressed through simple temperature observations and predictions [
16]. The diversity of variables within dense and sparse vegetation during the growing season affect the temperature on the ground and in the air above it. Comparing the coarse spatial resolution of MODIS to the much finer Landsat 7 data, the additional environmental factors can cause fluctuations, especially with agriculture and urban surfaces.
4.2. Land Cover Impact
The impact of land cover on land surface temperature has been widely recognized [
12,
37,
38,
39,
40]. Different land cover types have different degrees of absorption of solar radiation, evaporation rate, heat storage, etc., and thus impact LST. Variations dependent on land cover type imply discrepancies based on vegetation cover, impervious surface distribution, and soil type. Bare lands absorb lower amounts of heat and reflect high radiation, leading to an increase in LST, while vegetative lands decrease LST. Areas with a lower surface albedo are more likely to result in a greater overestimation of daytime temperature in satellite images than areas with a higher surface albedo [
28]. This is reflected in the weaker relationship at lakeside stations with larger RMSE results.
The phenology of a land cover can also have a major impact upon the temperature variations. For example, summer results in vegetated areas with increased canopy coverage provided stronger results with Landsat 7.
MODIS has advantages over finer spatial resolution sensors as it subsumes the detail throughout heterogenous urban and vegetated areas across broad geographical extents [
12]. The precision useful with Landsat 7 LST analyses in the summer serves as a disadvantage when compared with in situ observations due to the increased likelihood of variables affecting T
air outside of the 30 m resolution pixels. For example, the RMSE values in
Table 3,
Table 4,
Table 5,
Table 6 and
Table 7 and the
Figure 2 patterns display how MODIS sensors have improved abilities for determining LST more closely aligned with T
air. Opposing results occur throughout the homogenously transformed surfaces during the winter season, with finer spatial resolutions yielding superior results expressed through R
2 and RMSE values.
Defining an exact location within pixels of either 1 km or 30 m spatial resolutions challenges the ability to acquire specified temperatures for that location. Although this issue exists with each land cover classification, the lakeside stations are the most problematic. Its issues are reduced in the winter, with snow cover affecting the spectral reflectance over water in a similar manner to land; however, complications are exposed in the summer time frame. In addition to the provided coordinates for each station not being detailed enough to have their locations precisely georeferenced, the proximity to the large Ontario Lake water body and proportion of land surfaces incorporated into the pixels affects the classification with MODIS calculations more than Landsat 7. The open space over water bodies may also increase humidity- and wind-related elements, which affect Tair observations.
The forested in situ station’s Tair relationship with coarse-resolution LST revealed the only instance where summer produced a stronger seasonal relationship. Due to the dense flora, the Canadian winter is unable to completely homogenize the forest environment. The canopy density produces low R2 values in the winter, which finer resolutions can marginally improve upon. Considering the strong results in the LST regression analysis based on scale, forested land covers inhabit variables, relevant to vegetation density and height, affecting air, which snow coverage fails to smooth at coarse resolutions.
The linear regression analyses between LST scales produced robust results, especially over forested and wetland pixels (compared with the Tair analyses which lacked sufficient data). In contrast to the limited number of observations at each weather station for comparisons with Landsat, Terra data produced far more results with superior variance and reliability in each regression analysis. The application of 70 randomly selected points for scaled LST comparisons allowed for more complete representations with land covers where in situ stations were seldomly placed. The summer comparison between Landsat 7 (with NDVI) and Terra delivered the strongest R2 and RMSE results, especially over water (due to its homogeneity) and forests.
In the winter, the factors which affect the variance in summer LST, such as solar radiation, vegetation growth, surface roughness, and albedo, are reduced. Water is the land cover with the most variation and highest bias amongst the two platforms, with vastly different spatial resolutions (which contrasts summer results). The stronger relationship within water pixels in the summer is due to homogeneity with both fine and coarse spatial resolutions. Winter provides more variance with LST at a coarser scale.
4.3. ASTER-Derived Emissivity Values vs. NDVI-Corrected Values
The minor differentiation amongst the two methods of deriving LST from Landsat 7 imagery is definitive for this region. The only category in which NDVI-corrected values are not superior is around lakeside and forested in situ stations. NDVI LST data have a significantly stronger relationship with forested Tair in the summer. In contrast, ASTER LST values had an R2 improvement of 0.0732 in the winter. The only other instance is with lakeside stations during the summer. Otherwise, NDVI-corrected LST maintains a dominance. NDVI plays a stronger role with summer data due to the influx of vegetation across each land cover. In the winter, even with snow coverage and a major reduction of vegetation life, the results continue to reveal the necessity for NDVI corrections on the ASTER emissivity values.
5. Conclusions
This study evaluates the correlations between LST products from different MODIS platforms, Landsat 7, and ground Tair measurements, and analyzes the impact of seasonality and land cover on the consistency of these relationships at a local scale. It was found that MODIS LST from Terra had stronger relationships with Landsat 7 LST than those from Aqua. Tair at the satellite over passing time does not show significantly different correlations from other Tair measurements. When compared to Tair measurements from calendar days 100 to 290, success with coarse-resolution LST products is reflective of previous research. MODIS imagery maintained overall R2 values between 0.41 and 0.45, while Landsat 7 results were 0.35 with a weaker RMSE. For the remainder of the year, Landsat 7 is more highly correlated with overall R2 value as high as 0.81, while MODIS data is between 0.71 and 0.79 with similar RMSE.
Individual land covers produce much more varied results based on phenology, albedo, and moisture content on the heterogenous land surfaces during the summer. As a result, the summer conditions for a finer resolution satellite do not account for the greater variety of variables present in heterogenous surfaces. The differences in variances explained through coarse- and fine-resolution satellite imagery with Tair over lakeside and forested stations are marginally smaller (R2 difference within 0.08) compared to agriculture and urban surfaces. In addition, coarse-resolution LST explains more variance in Tair at forested locations during summer due to the winter’s inability to homogenize the landscape due to dense flora content.
When comparisons based on the surrounding land covers for each in situ observation were conducted, Landsat 7-derived LST concluded with R2 values between 0.03 and 0.15 lower than MODIS in summer. Results with agricultural and urban in situ stations provided the most variations between air measurements and different LST scales. This emphasizes the disadvantage for using satellites with a finer spatial resolution during the summer due to a greater availability of heterogenous factors over sparse vegetation and low-density impervious spaces. Further assessment is needed on the atmospheric variability in a variety of environments based on the radiation, atmospheric contents, and surface biomass factors.
The availability of weather stations in or near wetlands was a limitation in the LST comparisons made with Tair. For Landsat 7 data, 1 to 5 observations are entirely insufficient to make a distinction on its accuracy. Future exploration of the relationship with Tair stations may provide greater insight on the correlation with fine-resolution LST located at wetlands.


