Article

Effects of Deforestation over the Cerrado Landscape: A Study in the Bahia Frontier

by
Tainá Oliveira Assis
1,*,
Maria Isabel Sobral Escada
2 and
Silvana Amaral
2
1
Pós-Graduação em Ciência do Sistema Terrestre, Instituto Nacional de Pesquisas Espaciais (INPE), Granja-CEP, São José dos Campos 2337-010, Brazil
2
Divisão de Observação da Terra e Geoinformática (DIOTG), Coordenação Geral de Ciências da Terra (CGCT), Instituto Nacional de Pesquisas Espaciais (INPE), Granja-CEP, São José dos Campos 2337-010, Brazil
*
Author to whom correspondence should be addressed.
Land 2021, 10(4), 352; https://doi.org/10.3390/land10040352
Submission received: 31 December 2020 / Revised: 10 February 2021 / Accepted: 13 February 2021 / Published: 1 April 2021
(This article belongs to the Special Issue Monitoring Brazilian Natural and Human-Modified Landscapes)

Abstract

:
The losses in the Brazilian Cerrado raise the need to understand the border regions between human activities and Cerrado remnants. This work aims to answer the questions: How does the landscape change in a deforestation area in the Brazilian Cerrado, and where do the losses of native Cerrado occur in the landscape context? We chose the Cerrado of Bahia, an area of the agricultural frontier, and used landscape metrics, and land use and land cover data from 2013 and 2020, to quantify the changes in the landscape. We built a typology of landscape patterns to classify and characterize the Cerrado landscapes, based on the landscape metrics, and land use and land cover data from TerraClass Cerrado 2013. From these parameters, a decision tree classifier enabled the classification of the landscape types. Then, we used the yearly deforestation data from PRODES Cerrado to obtain the native cover and the landscape metrics for 2020. The predominant landscape in 2013 was the Intermediate Stage of Fragmentation (32.53%), followed by the Initial Stage of Fragmentation (31.26%), Consolidated Pasture (16.4%), Consolidated Agriculture (9.78%), Mixed Landscapes (5.59%) and Native Cerrado (4.70%). The continuous Cerrado borders on areas in an initial and intermediate stage of fragmentation, putting pressure on the native area. The losses in native cover do not occur in consolidated landscapes or inside the continuous Cerrado. Instead, there is a process of vegetation conversion over the landscapes in the initial and intermediate stages of fragmentation, and landscapes where the matrix is heterogeneous. These factors signal the need to preserve the contiguous fragments of Cerrado.

1. Introduction

Economic interests as well as socioeconomic aspects, such as increased demographic density, together with programs to encourage the development and construction of highways, agriculture, and cattle activities can work as drivers of the agricultural frontier expansion and deforestation in tropical biomes [1,2,3]. The Tropical Savanna Biomes (TGB— Tropical Grassy Biomes) are the biomes that include savannas and grasslands. Those biomes are under pressure due to land cover changes that affect biodiversity and biogeochemical cycles [4]. Inserted in this context, the Cerrado, or the Brazilian Savanna, also faces deforestation impacts over its native area [5].
The Cerrado is an open domain biome with the most representative extension in South America, and due to its number of species, endemism (approximately 4,800), and threat suffered by these areas it is considered a “biodiversity hotspot” [6,7]. In addition to its biodiversity importance, the Cerrado is highly relevant for the balance of biogeochemical cycles, maintained by their fire regimes. Also, this region is important for its high population concentration (approximately 46 million inhabitants) and the expressive agricultural production in its territory (approximately 17.43 Mha of the three main products, soy, corn, and cotton, in 2014) [4,8]. The region known as MATOPIBA that corresponds to the states of Maranhão, Tocantins, Piauí, and Bahia had a population estimated at 5.9 million people and produced approximately 2.2 Mha of soy, corn, and cotton in 2016 [8].
Until 2013, the Cerrado lost approximately 50% of its native cover to human use [9]. Recent data also show that the biome still presents areas of agricultural expansion over native vegetation in its interior [10]. Between August 2019 and July 2020, 7340 km² of native vegetation was removed, an increase of 13% concerning the losses observed in the previous 12 months (6483 km²) [11]. Some studies report that the losses in Cerrado native cover are increasing fragmentation [12,13]. The losses in the native cover in Cerrado have also been reported to affect the carbon stock and the biodiversity in this biome [14]. This process can be aggravated with the expansion of agriculture in addition to weak policies of conservation [13,15,16].
Currently, the Cerrado scenario presents a low number of areas destined for conservation. Agricultural expansion motivated by speculation in land prices, lack of a policy to control the losses of native cover, and incentives for agribusiness as an economic model will lead to a reduction in the number of native remnants and a decrease in connectivity in the landscape [17]. In contrast, removing the pressure over native areas would allow connectivity in the landscape to be maintained, or restored by the regeneration of native Cerrado [18]. Maintaining the landscape with a greater number of remnants and high connectivity is essential for maintaining biodiversity [19]. The Cerrado has a large number of threatened species, 307 species on the Red List [7], and the immediate threat to native vegetation due to losses from agricultural expansion. In addition to these factors, the Cerrado still contributes to environmental services, maintaining soil moisture and carbon cycling [18,20].
The conversion of native areas into anthropogenic land covers can result in a fragmented landscape with sparse remnants of native vegetation, distributed within a mosaic with a predominance of anthropic land coverages. The fragmentation process over the original vegetation results in a decrease in patch areas and an increase in edge areas and the number of patches [21]. The habitat loss and consequent fragmentation due to this process have a negative effect on biodiversity, but the fragmentation per se, which means in the same habitat amount, has a mostly null effect on biodiversity [22,23,24]. However, the null effect of fragmentation per se on biodiversity is not a consensus in the literature [25,26,27]. Despite this controversy about the effects of fragmentation, the measure of losses in native cover and fragmentation per se must be in the landscape scale [22].
The choice of the most appropriate scale to represent the landscape mosaic should consider the gains and losses to observe the object of analysis on a local and global scale [28,29]. Local-scale allows for the production of accurate local information but also makes it difficult to generalize the results found due to local particularities. On the other hand, in landscape mosaics studies, local scale can hide the heterogeneity of the landscape. A global-scale analysis enables broader approaches, but it is more susceptible to inaccuracies due to the suppression of elements that are not visible in their representation [30].
It has been well-recorded that the Cerrado is losing its native areas over the years and that agricultural lands are increasing [11,31]. An increase in fragmentation of native Cerrado has also been reported over the years [12]. However, it is fundamental to understand where, considering the landscape structure, this process is preferably occurring, and how it relates with the landscape context to develop policies in both preventing the impact and promoting conservation. It is also utterly important to verify if the losses in native cover are increasing the fragmentation in order to establish a protection mechanism not only to continuous native cover but also to small patches [32]. Considering the presented context, this work poses the following specific questions: How does the deforestation process change the landscape structure (or landscape patterns) in the Brazilian Cerrado, and where do the losses of native Cerrado occur in the landscape context? We used these questions to describe the methodology and results. To answer these questions, we considered the Cerrado located in the western region of the state of Bahia—a representative area of the active agricultural expansion frontier. We used landscape metrics, and land use and land cover (LULC) data from 2013 and 2020 to quantify the changes in the landscape. Then, we proposed a typology of landscape patterns to classify and characterize the Cerrado landscapes and to understand where the processes of change are occurring. We quantified and discussed the changes for each landscape pattern in the study region, from 2013 to 2020.

2. Materials and Methods

2.1. Study Area

The study area is the Cerrado biome in the state of Bahia, with a total area of 151,167 km², corresponding to approximately 27% of its entire territory (Figure 1). The region has an average annual rainfall of 1500 mm and an average annual temperature of 24 °C [33]. Deep soils predominate in the region, a pedological characteristic that added to the geomorphological formation of the plateau and makes the region propitious to the development and mechanization of agriculture [33]. In 2020, the region concentrated 919.15 km2 of deforestation increment [11]. According to TerraClass Cerrado data [9], the study area has a predominance of natural vegetation that totals 66.78% of the area. The second and third most representative uses of the study area are, respectively, pastures (16.17%) and croplands, considering annual and perennial croplands (14.82%).

2.2. Database

We used the TerraClass Cerrado LULC map, referring to 2013, as the base for the development of the landscape typology for the study area. The TerraClass Cerrado project (an INPE, EMBRAPA, IBAMA, UFU, and UFG partnership) provides data on land use and land cover from Landsat 8 satellite images and takes 6.25 hectares as the minimum mapping area. This project used a semi-automatic classifier combined with visual interpretation to map the classes: annual croplands, perennial croplands, pastures, forestry, mosaic of occupation, urban, mining, bare soil, natural, natural without vegetation, water, and non-identified (clouds and burned areas) [9].
In the absence of a recent LULC mapping compatible with the TerraClass Cerrado of 2013, we adopted an alternative approach to map and quantify the effect of deforestation over the Cerrado landscape. Thus, we used maps provided by PRODES Cerrado to quantify the changes in the native cover of the Cerrado from 2013 to 2020. PRODES Cerrado is a project whose objective is mapping the deforestation inside the Cerrado biome. Its first mapping product is referred to the year 2000, and it mapped the land cover classes: native vegetation, anthropic, water, and not observed (clouds and shadows). Since then, every year, PRODES maps the increment in anthropic areas, considering as anthropic those areas of deforestation, regardless of the intended use [34]. PRODES Cerrado deforestation mapping results in a yearly increment of deforestation, always taking the previous year as the reference. The data is obtained using as sources images from TM/Landsat5, ETM+/Landsat7, OLI/Landsat8, and LISS-III/RESOURCESAT2, and the minimum mapping area is 1 ha.

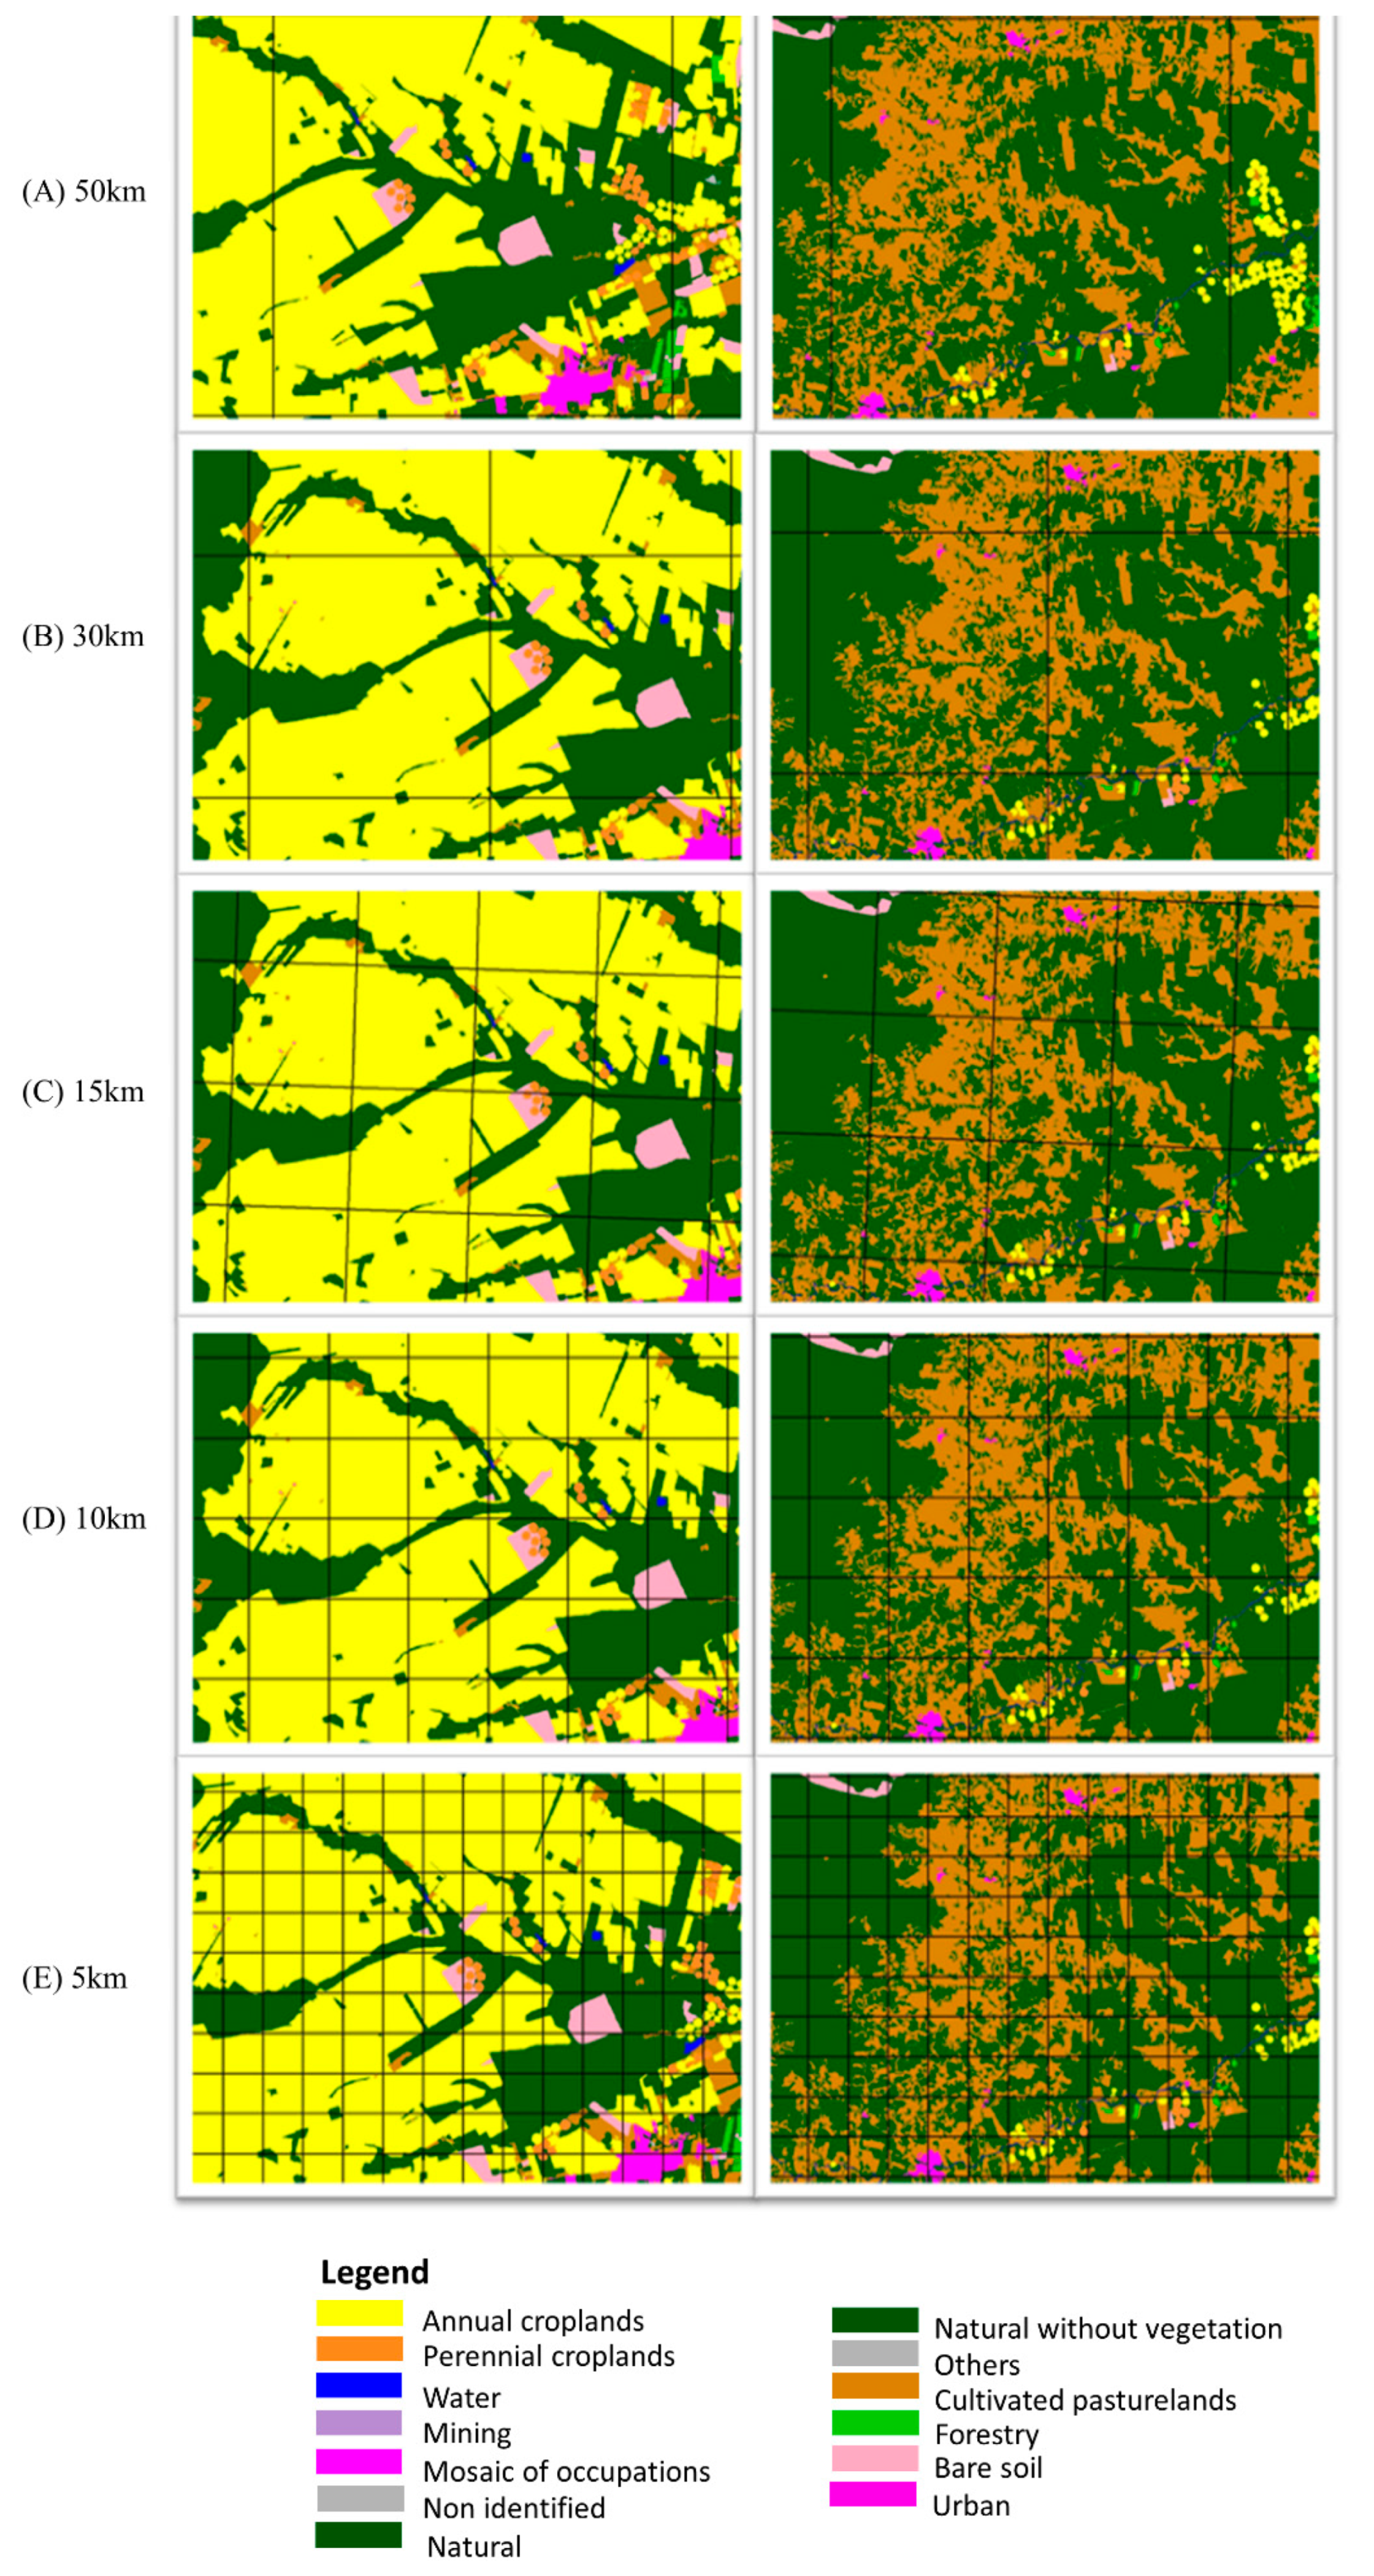
2.3. How Does the Intense Deforestation Process Change the Landscape Structure (or Landscape Patterns) in the Brazilian Cerrado?

To answer this question, we first quantified the native Cerrado cover (class natural) in the LULC map from 2013 and 2020 in the study area. To quantify the Cerrado native cover in 2020, we subtracted the deforestation of 2013 to 2020 from the class natural on the TerraClass Cerrado map from 2013 and used the new map obtained with the results of the class natural as a reference to 2020. Then, we computed landscape metrics of fragmentation for 2013 and 2020 to verify if the changes in the amount of Cerrado native cover increased the fragmentation in the area. We chose as fragmentation metrics the number of natural patches (Patches Number), the total edge (Total Edge), and the mean of patch size (Mode Area). The choice of these fragmentation metrics (Patches Number, Total Edge, and Mode Area) followed Fahrig, 2017 [23], who stated that these are the best metrics to measure fragmentation because it is possible to control their relationship to habitat amount. We used the vector data to obtain all metrics using the ArcGIS Desktop. The Patches Number is the sum of natural patches in the whole study area. The Total Edge is the sum of the natural patches perimeters in the whole study area. Finally, we obtained the Mode Area value, calculating the area of each natural patch, and then obtained the mode value for the study area.

2.4. Where Do the Losses of Cerrado Native Cover Occur in the Landscape Context?

To answer this question, we used the LULC map first as a reference to build the landscape typology, and then as input to classify the region. Next, we characterized each landscape type by computing landscape metrics over the LULC map, using all classes from TerraClass Cerrado 2013. After we classified the landscape in types, we quantified the changes in the Cerrado native cover in each type using the 2020 map. A detailed description is provided in the following subtopics.

2.4.1. Landscape Typology and Description

We built a regular grid for the study area, in which we considered each cell grid as a landscape unit. To choose the best scale, we assessed the scale necessary to analyze the object of this study, as suggested by Meentemeyer, 1989 [28]: the landscape patterns. We chose a cell size in which most cells had some level of heterogeneity, ensuring that the patches of Cerrado native cover, the object of this study, were present in most of them, making it possible to characterize the Cerrado fragmentation process in each land mosaic category. This choice considered the scale of analysis in greater detail, involving an analysis of the landscape structure and composition. The empirical (visual) process enables not only the analysis of the dimensions of the features of interest present in the LULC map but also includes the criteria of cell homogeneity concerning the structure and composition of the landscape. This way, we defined the cell size empirically from the analysis of the polygons of interest where it was possible to observe the distinct patterns of different classes, and the patch sizes, present in the landscape. For the empirical analysis, we selected two cuts in the study area (Figure 1) to analyze the different scales (Figure 2). The choice of these areas was appropriate to obtain different patterns in the landscape.
Evaluating cell sizes with sides 5 × 5 km, 10 × 10 km, 15 × 15 km, 30 × 30 km, and 50 × 50 km, (Figure 2), we found that 15 × 15 km was the most appropriate cell size. It is possible to observe in Figure 2 that even though the biggest cell sizes (50 km and 30 km) allowed for the proper representation of the pattern of large polygons (right side), they are not appropriate to represent small polygons (left side), because they generalize the land cover patterns in those landscapes. Conversely, the smallest cell sizes (5 km and 10 km) are not able to detect heterogeneity in landscapes with large polygons (right side). Thus, we chose the intermediate cell size (15 km) because it was able to detect the landscape heterogeneity with large and small polygons. Considering this, we built the grid with cells of 15 km × 15 km for the study area. Each grid cell contained land use and cover classes from the LULC TerraClass Cerrado mapping. This procedure aims to redistribute the LULC data to a cellular space considering a homogeneous matrix of cells.
For the typology, we defined the types a priori based on the land cover class patterns observed and their frequency in the landscape. Considering the predominant type of coverage in the cell, we defined five typologies: Consolidated Agriculture (AC), Initial Stage of Fragmentation (FI1), Intermediate Stage of Fragmentation (F12), Native Cerrado (NC), Consolidated Pasture (PC), and Mixed Landscape (PM), as presented and described in Figure 3.
From the proposed typology, we collected samples of each landscape type. From those, 66% of the samples were training samples and 34% were test samples. Then, we classified the region using the Decision Tree in GeoDMA [35]. The C5.0 Decision Tree from GeoDMA used in this study is the implementation of the Quinlan’s C5.0 Algorithm. This supervised classification method uses attributes in the training records to assemble a tree, ignoring cases with bad or unknown classes. We did not establish initial limit parameters for decisions among classes for the samples; we selected the training samples visually and we used them to classify the cells. The landscape metrics thresholds define each branch of the tree, resulting in the distinction of classes and the classification of the typology map.
To build the decision tree and to classify the region, we used as attributes the following landscape metrics, obtained from the LULC map from TerraClass Cerrado: the percentage of each class (annual croplands, perennial croplands, pastures, forestry, mosaic of occupation, urban, mining, bare soil, natural, natural without vegetation, water, and non-identified), the number of natural patches (Patches Number), the total length of the edge of the natural patches (Total Edge) and the mode value of the natural patch size inside the cell (Mode Area). To obtain the percentage of each class, we used the total area of each class inside each cell divided by the total cell area. The Patches Number is the sum of natural patches inside each cell. The Total Edge is the sum of the natural patches perimeters inside the cell. Finally, we obtained the Mode Area, calculating the area of each natural patch in the cell, and then computed the mode value for the cell. We used the vector data to obtain all metrics using the ArcGIS Desktop.
We chose these fragmentation metrics (Patches Number, Total Edge, and Mode Area) following Fahrig, 2017 [23], who stated that these are the best metrics to measure fragmentation because it is possible to control their relationship to habitat amount. After classification, the selected test samples from each class were used to verify the mapping accuracy by calculating the Kappa Index based on the confusion matrix. After the classification, we used the metrics to describe each type of landscape.

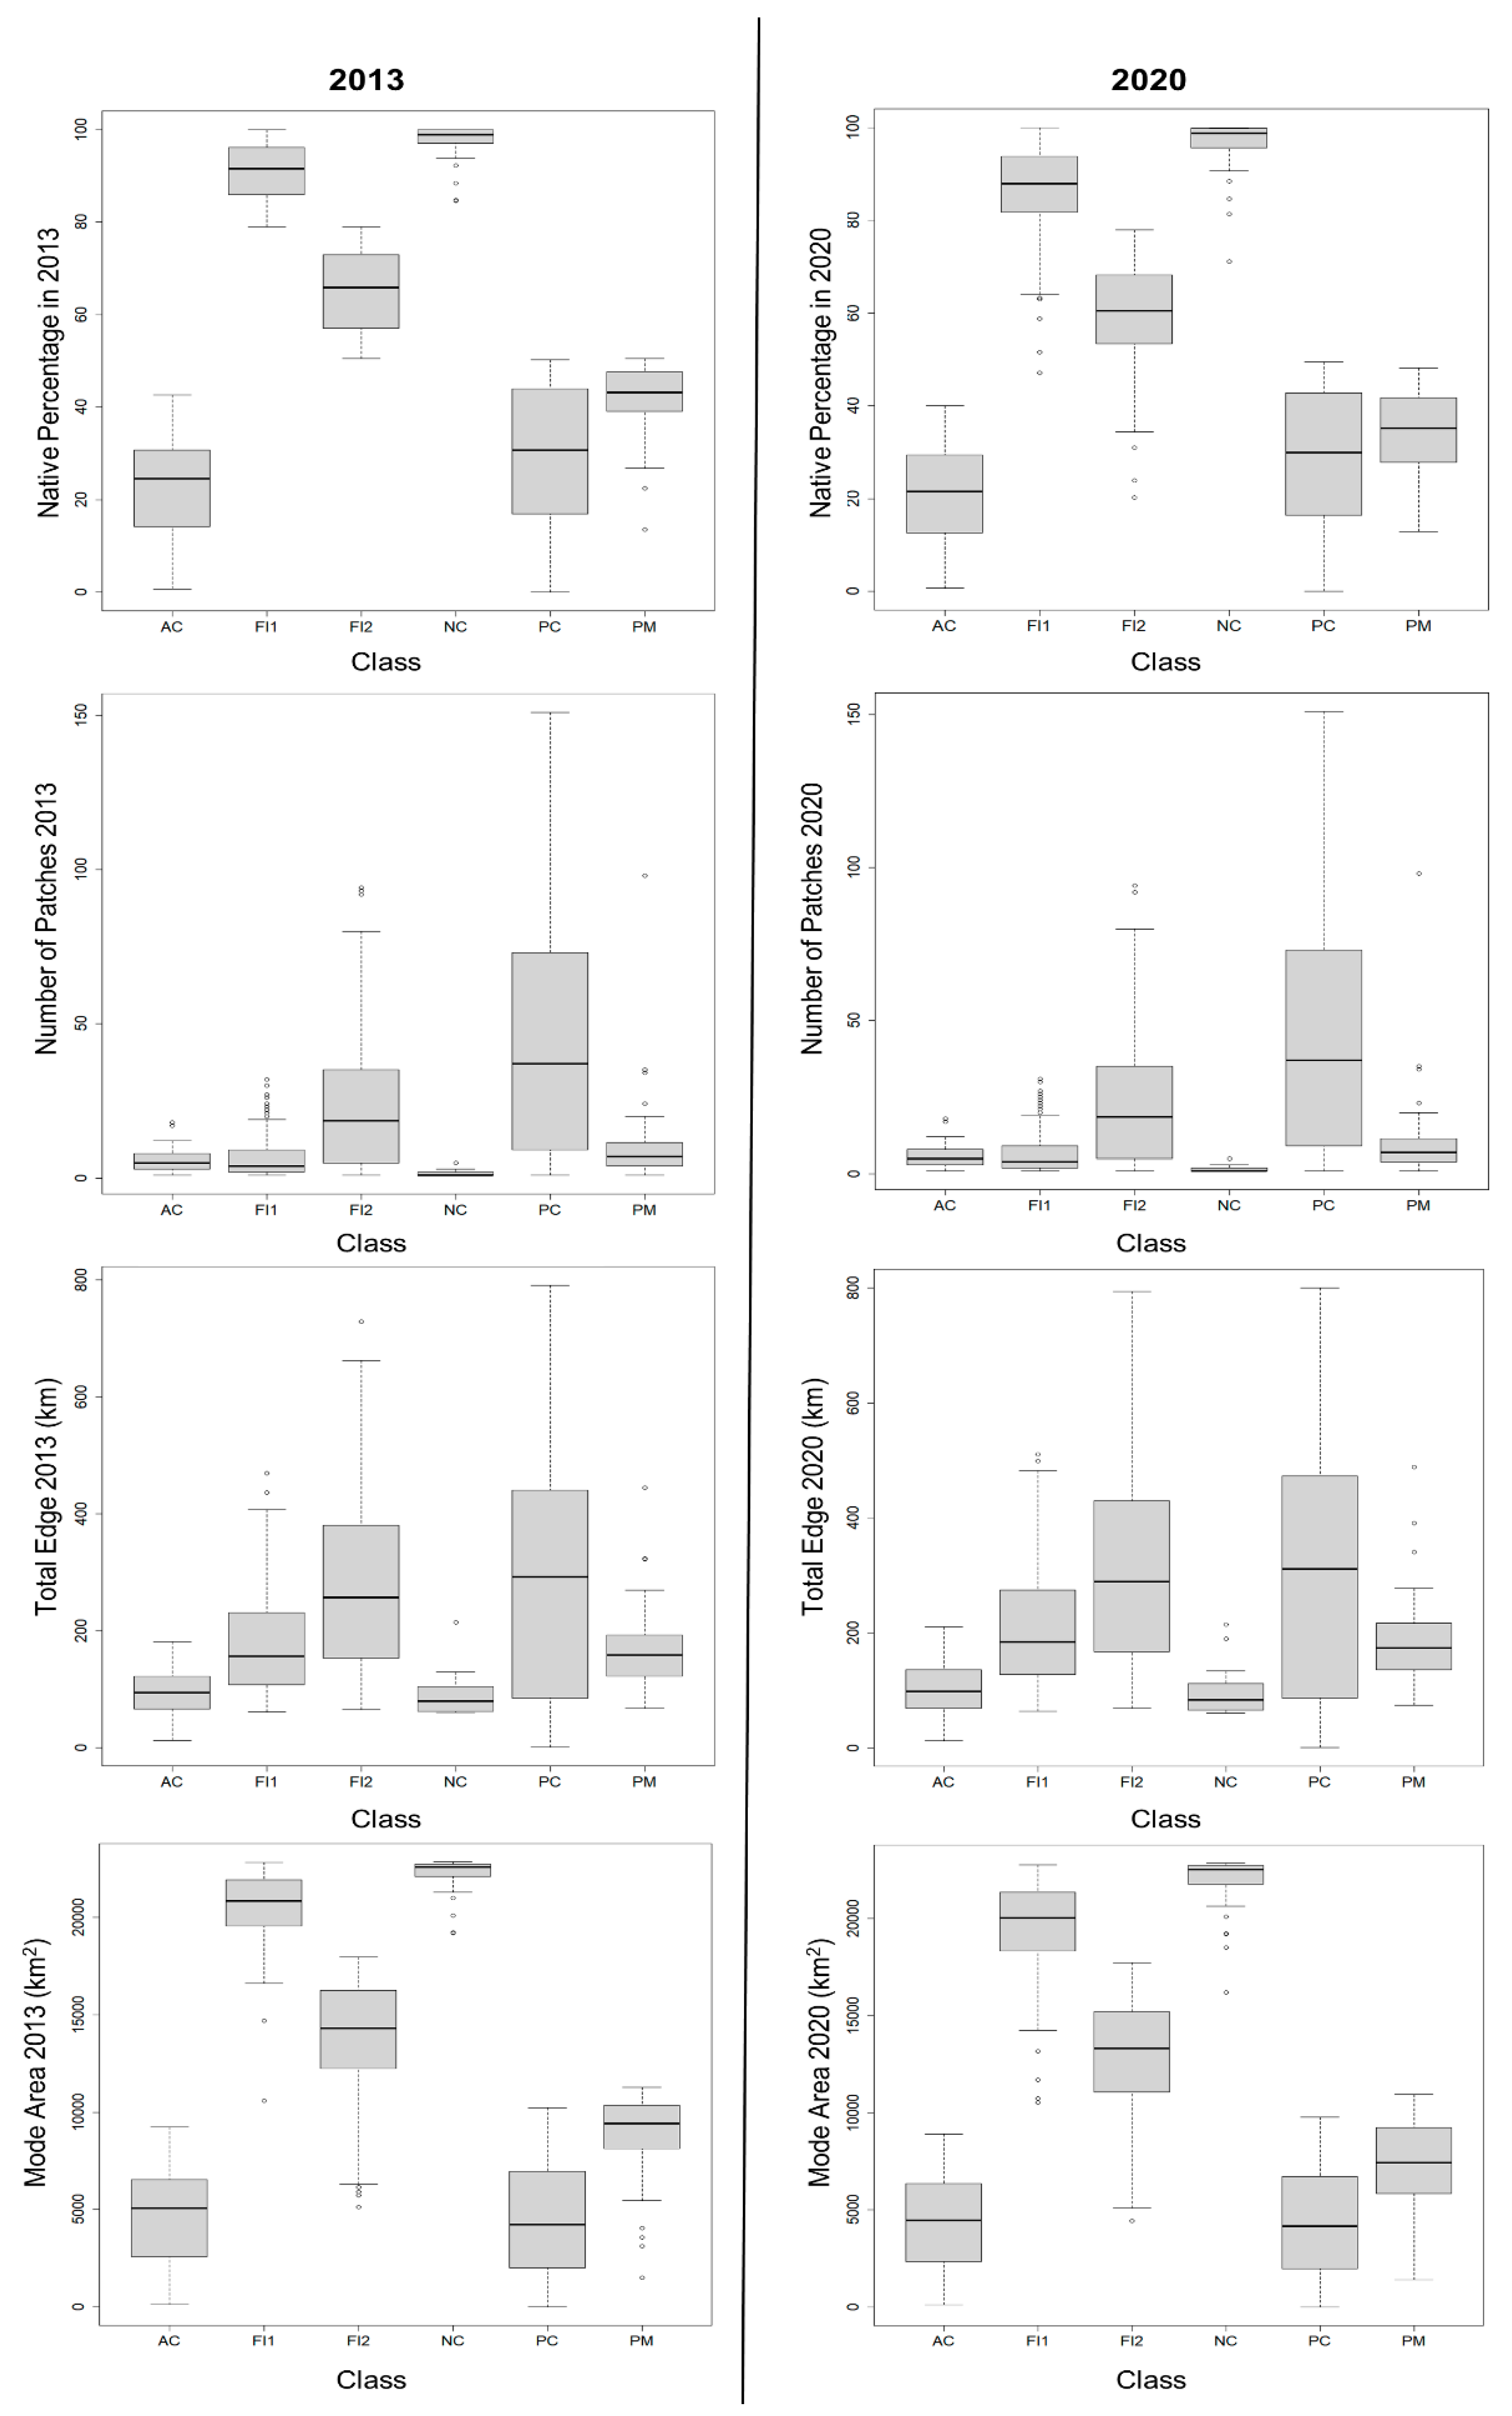
2.4.2. Landscape Changes in Cerrado Native Area

To characterize the landscape changes from 2013 to 2020, we used the yearly deforestation map from 2013 to 2020 provided by PRODES Cerrado and subtracted from the class natural of the LULC map of TerraClass Cerrado to obtain the Cerrado native cover in 2020. Using the Cerrado native cover of 2020, we computed the metrics, previously defined, to characterize the landscape structure for each type from the classification obtained in 2013: the percentage of Cerrado native cover (Percentage Native Area), Patches Number, Total Edge, and the Mode Area.
To verify how the Cerrado landscape changed between 2013 and 2020, we performed a statistical analysis to compare the Cerrado native cover in each type of landscape (AC, FI1, FI2, NC, PC, and PM) in 2013 and 2020. First, we used the Shapiro-Wilk to test the data normality. After testing normality, we used the T-test for parametric data and Wilcoxon test for non-parametric data, to test if the Percentage of Native Areas were different inside each landscape type between 2013 and 2020. When we found a difference in the Percentage of Native Area, we also tested the difference for each metric (Patches Number, Total Edge, and Mode Area) between 2013 and 2020, using the same tests.

3. Results

3.1. How Does the Intense Deforestation Process Change the Landscape Structure (or Landscape Patterns) in the Brazilian Cerrado?

From 2013 to 2020, the percentage of native cover decreased by 3.85% in the Cerrado biome in the state of Bahia. In 2013, the percentage of Cerrado native cover in the study was 66.78% (102,086.41 km2) and it decreased to 62.93% (96,193.81 km2) in 2020. The Mode Area decreased from 8.09 km2 in 2013 to 8.43 km2 in 2020. We observed a decrease in the Number of Patches from 2013 (11,464) to 2020 (11,402). The Total Edge increased from 128,246.63 km in 2013 to 147,133.07 km in 2020.

3.2. Where Do the Losses of Cerrado Native Cover Occur in the Landscape Context?

The decision tree used the percentage of Cerrado native cover (natural class) in each cell as the first attribute to separate the types. In the first branch were the cells in which the percentage of natural was <= 56.48 %. In the first branch, when the percentage of annual croplands was <= 1.92 % the cells were classified as PC; cells with the percentage of annual croplands > 1.92 % and 56.44 % were classified as PM; and cells with the percentage of annual croplands > 56.44 % were classified as AC. The second branch separated those cells where the percentage of natural class in each cell was > 56.48 %. When the percentage of natural was <= 84.0% the cells were classified as FI2; when the percentage of natural was > 84.0% and < = 0.02% the cells were classified as FI1; and when the percentage of natural was > 0.02% the cells were classified as NC (Figure 4).
In the study area, the predominant landscape in 2013 was FI2 (32.53%), followed by FI1 (31.26%), PC (16.4%), AC (89.78%), PM (5.59%), and NC (4.70%) (Figure 5). Based on test samples, the general map accuracy was 88.2%, and the confusion matrix is presented in Table 1.
The percentage of Cerrado native cover was higher inside NC, followed by FI1, FI2, PM, PC, and AC for 2013 and 2020. The Total Edge and the Number of Patches were higher inside PC, FI2, PM, and FI1, followed by AC, in both years. The Mode Area was higher inside NC, followed by FI1, FI2, and PM. PC and AC had the smallest Mode Area. We also observed this pattern in 2013 and 2020 (Figure 6).
From the results of the Wilcoxon test (W) and T-test (T and p-values), when comparing the difference in the native percentage of the Cerrado between the years 2013 and 2020, the classes FI1 (W = 37502, p-value = 4.351 × 10⁻⁶), FI2 (W = 41703, p-value = 9.408 × 10⁻⁸), and PM (W = 1476, p-value = 1.311 × 10⁻⁵) showed significative differences in Native Cerrado percentages. The classes NC (W = 770, p-value = 0.3579), AC (W = 770, p-value = 0.3579), and PC (W = 8448, p-value = 0.513) did not show a difference in the native percentage of the Cerrado between the years 2000 and 2013.
We tested the difference in the landscape between 2013 and 2020 for FI1, FI2, and PM because they showed differences in the percentage of Native Cerrado (Table 2). There was no significative difference in the Number of Patches in FI1 (W = 30388, p-value = 0.934), FI2 (W = 32918, p-value = 0.929), or PM (W = 970, p-value = 0.990) between 2013 and 2020. There was significative difference in Total Edge in the landscapes FI1 (W = 25056, p-value = 0.001) and F12 (W = 28592, p-value = 0.012), while there was no significative difference in Total Edge for the landscapes PM (W = 844, p-value = 0.304) between 2013 and 2020. The Mode Area was significative different in FI1 (W = 37152, p-value = 1.233 × 10⁻⁵), FI2 (t = 4.1624, df = 510, p-value = 3.696 × 10⁻⁵), and PM (W = 1392, p-value = 0.0003221) between 2013 and 2020.

4. Discussion

The Cerrado native areas are dominant in most of the Bahia Cerrado region in both the observed years, 2013 and 2020. However, the native cover decreased over time and therefore, we observed a decrease of the Mode Area, a decrease in the Number of Patches, and an increase of Total Edge in the whole area. Answering our first question, the deforestation processes affect the landscape structure in the study area by reducing the size and number of patches and increasing the amount of edge in the area. This result highlights the importance of this region to preserve the biome, since the Cerrado native cover is still dominant in the region, the opposite found for the entire biome [19].
The losses in the native cover in the northern Cerrado have been reported in other studies [31,36], but the typology map made it possible to understand in the finest resolution where the losses in Cerrado native cover are happening and to relate them to landscape patterns. Our typology map showed that NC occupies approximately 4.7% of the whole area. This result means that most of the landscape has, at some level, the presence of anthropic activity. Answering the question of where the losses of native Cerrado occur in the landscape context, we observed that the losses in the Cerrado native cover were significative in the Initial (F1) and Intermediate Stage of Fragmentation (FI2), and Mixed Landscape (PM). These three types of landscape together correspond to approximately 69.38 % of the study area. We also noticed that, except for PM, the losses of native Cerrado were concentrated in FI1 and FI2, the immediate border with NC (Figure 5). PM was the only landscape type with an anthropogenic matrix where the losses in the Cerrado native cover were significative. This can be explained by the fact that among the types with an anthropogenic matrix (AC, PC, and PM), PM had the highest percentage of Cerrado native cover in 2013.
It is common for a process of habitat loss to be associated with habitat fragmentation by increasing the patches number and the total edge and decreasing the patches sizes [21]. Even though regions classified as FI1, FI2, and PM presented a lower percentage of Cerrado native cover in the landscape in 2020 than in 2013, this was not followed by an increase in the Patches Number inside them. Surprisingly, this metric was similar for both years. However, the losses in the Cerrado native cover showed the strongest effect in the patches size. We observed that the losses in the Cerrado native cover affected the area of the patches, reducing them over time, but it did not affect the number of patches in the landscape. The pattern of increasing the Total Edge happened inside the FI1 and FI2 types but did not occur in PM. Even though all areas analyzed (FI1, FI2, and PM) presented significative differences in patch size, the loss of area can have different effects on a patch’s shape [37]. This fact can explain such a difference in the response of Total Edge to losses in area for those landscapes.
The LULC map highlighted two regions bordering the Cerrado: the livestock frontier advancing from the east side, as observed by PC type, and agriculture crops, or AC type, from the west side (Figure 5B). In consolidated landscapes, PM has higher values of Mode Area than AC and PC. This means that when the anthropogenic matrix is not dominated by one land use in the study area, the patches are bigger than in a homogeneous landscape Considering the fragmentation metrics, we found that PC has the highest values of Number of Patches and Total Edge.
These findings indicate that landscapes with a pastures matrix are more fragmented than landscapes with a croplands matrix. This pattern of higher fragmentation inside landscapes with a pastures matrix is different from a study in the Cerrado in the Goiás state in 2009 [12] that found high fragmentation rates in landscapes with a croplands matrix. Compared to the pastures matrix (PC), we found fewer patches of Cerrado inside landscapes with a croplands matrix (AC)), as observed by the metric Number of Patches (Figure 6). This is probably because mechanized agriculture requires large and continuous lands to occur, limiting the Cerrado areas to places where the slope and hydrography does not allow for the use of machinery [38].
After considering the amount of Native Cerrado and fragmentation, another fact to consider is the matrix heterogeneity. This is important because different matrix cover has different degrees of obstruction to native species movement [39]. This factor is aggravated by the present homogeneity in the matrix inside the consolidated areas (AC, PC, and PM), in which, the type of matrix is less varied. This can be seen from the fact that among the landscape types with an anthropogenic matrix (PC, AC, and PM), the class Mixed Landscape (PM) is the type with the lowest area representativeness in the study site.
We could observe that the losses in native cover of the Cerrado do not occur in consolidated landscapes (AC and PC) or inside the continuous areas of Cerrado (NC). Instead, it appeared to be a process that occurs over the landscapes with a higher percentage of Cerrado native cover and some amount of land use inside it. We could also observe this by the fact that AC, PC and, NC did not have a significative difference in the percentage of native cover. Today, the Cerrado has only 6.5% of its total area inside protected areas, allowing losses over its native area [16].
As far as we observed, the conversion of native cover resulted in a reduction in the Mode Area and an increase of Total Edge in the area, but it did not show a difference in the Number of Patches. This finding means that the losses of native cover are happening by reducing the size of large patches and not by removing the small ones, a process different from that reported for the Atlantic Rainforest, as an example [40]. This evidence plays an important role in designing conservation policies, by understanding the patterns of native cover loss and fragmentation [25].

5. Conclusions

The Cerrado landscape in the state of Bahia has a higher percentage of areas at an early stage of fragmentation than areas at more advanced stages. However, because of anthropic use, the region of consolidated occupation presents a low density of Cerrado patches. These findings urge the need to preserve the few contiguous fragments of this biome that have the function of preserving its natural processes.
The dominance of a single type of anthropic matrix, annual croplands, or pastures over extensive areas is evident. This matrix homogeneity reduces the permeability of the landscape in the consolidated areas. Therefore, the importance of maintaining patches of native vegetation is once again emphasized.
Cerrado deforestation in Bahia also has a particular landscape pattern of natural vegetation loss. These losses are reducing large patches inside landscapes with initial and intermediate levels of fragmentation and inside landscapes with a heterogeneous matrix. Understanding the patterns of native cover loss and fragmentation is essential when designing conservation policies for Cerrado.
Finally, this article also provides a methodological contribution towards the construction of typologies—a useful tool to assess diverse landscapes, enabling us to compare heterogeneous environments or temporal evolution. From the classification of landscape patterns, one can assess fragmentation by analyzing their metrics and identifying differences in the landscape patterns. This type of approach under the landscape bias may be key to understanding the ecology of species since the spatial configuration of the remnants can determine the flow of individuals and the persistence of populations in a fragmented environment.

Author Contributions

Conceptualization, T.O.A., M.I.S.E., and S.A.; methodology, T.O.A., M.I.S.E. and S.A.; software, T.O.A.; validation, M.I.S.E. and S.A.; formal analysis, T.O.A.; investigation, T.O.A., M.I.S.E., and S.A.; resources, S.A.; data curation, S.A.; writing—original draft preparation, T.O.A.; writing—review and editing, M.I.S.E. and S.A.; visualization, M.I.S.E. and S.A.; supervision, S.A.; project administration, S.A.; funding acquisition, S.A. All authors have read and agreed to the published version of the manuscript.

Funding

This research was funded by Fundação de Amparo à Pesquisa do Estado de S. Paulo (FAPESP), grant number 2017/20011-8 and Pessoal de Nível Superior (CAPES), Finance Code 001.

Data Availability Statement

TerraClass Cerrado 2013 data available at http://www.dpi.inpe.br/tccerrado/ (accessed date 21 January 2021). PRODES Cerrado data available at: http://cerrado.obt.inpe.br/ (accessed date 21 January 2021).

Acknowledgments

The authors are thankful to Fundação de Amparo à Pesquisa do Estado de S. Paulo–FAPESP to supporting the project (2017/20011-8). We also acknowlege de Coordenação de Aperfeiçoamento de Pessoal de Nível Superior (CAPES), Finance Code 001.

Conflicts of Interest

The authors declare no conflict of interest. The funders had no role in the design of the study; in the collection, analyses, or interpretation of data; in the writing of the manuscript, or in the decision to publish the results.

References

  1. Metzger, J.P. Conservation issues in the Brazilian Atlantic forest. Biol. Conserv. 2009, 142, 1138–1140. [Google Scholar] [CrossRef]
  2. Laurance, W.F.; Sayer, J.; Cassman, K.G. Agricultural expansion and its impacts on tropical nature. Trends Ecol. Evol. 2014, 29, 107–116. [Google Scholar] [CrossRef]
  3. Espírito-Santo, M.M.; Leite, M.E.; Silva, J.O.; Barbosa, R.S.; Rocha, A.M.; Anaya, F.C.; Dupin, M.G.V. Understanding patterns of land-cover change in the Brazilian Cerrado from 2000 to 2015. Philos. Trans. R. Soc. B Biol. Sci. 2016, 371, 20150435. [Google Scholar] [CrossRef] [Green Version]
  4. Lehmann, C.E.R.; Parr, C.L. Tropical grassy biomes: Linking ecology, human use and conservation. Philos. Trans. R. Soc. B Biol. Sci. 2016, 371, 20160329. [Google Scholar] [CrossRef] [Green Version]
  5. Klink, C.A.; Machado, R.B. Conservation of the Brazilian Cerrado. Conserv. Biol. 2005, 19, 707–713. [Google Scholar] [CrossRef]
  6. Myers, N.; Mittermeier, R.A.; Mittermeier, C.G.; Da Fonseca, G.A.; Kent, J. Biodiversity hotspots for conservation priorities. Nature 2000, 403, 853–858. [Google Scholar] [CrossRef] [PubMed]
  7. Brasil. Lista Nacional Oficial de Espécies da Fauna Ameaçada de Extinção. Portaria no 444, de 17 de dezembro de 2014. Ministério do Meio Ambiente. Diário União 2014, 245, 121–126. Available online: http://www.icmbio.gov.br/portal/images/stories/biodiversidade/fauna-brasileira/avaliacao-do-risco/PORTARIA_N?_444_DE_17_DE_DEZEMBRO_DE_2014.pdf (accessed on 29 March 2018).
  8. Bolfe, É.L.; Victória, D.D.C.; Contini, E.; Bayma-Silva, G.; Spinelli-Araujo, L.; Gomes, D. Matopiba em crescimento agrícola Aspectos territoriais e socioeconômicos. Rev. Política. Agrícola. 2016, 24, 38–62. Available online: https://seer.sede.embrapa.br/index.php/RPA/article/view/1202/1025 (accessed on 20 December 2020).
  9. de Mattos Scaramuzza, C.A.; Sano, E.E.; Adami, M.; Bolfe, E.L.; Coutinho, A.C.; Esquerdo, J.C.D.M.; Maurano, L.E.P.; Narvaes, I.S.; Oliveira Filho, F.J.B.; Rosa, R.; et al. Land-use and land-cover mapping of the Brazilian Cerrado based mainly on Landsat-8 satellite images. Revista Brasileira de Cartografia. Rev. Bras. Cartogr. 2017, 69, 1041–1051. [Google Scholar]
  10. Beuchle, R.; Grecchi, R.C.; Shimabukuro, Y.E.; Seliger, R.; Eva, H.D.; Sano, E.; Achard, F. Land cover changes in the Brazilian Cerrado and Caatinga biomes from 1990 to 2010 based on a systematic remote sensing sampling approach. Appl. Geogr. 2015, 58, 116–127. [Google Scholar] [CrossRef]
  11. Coordenação Geral de Observação da Terra Indpe. Prodes—Incremento Anual de Área Desmatada no Cerrado Brasileiro. 2020. Available online: http://www.obt.inpe.br/cerrado (accessed on 20 December 2020).
  12. Carvalho, F.M.; De Marco, P.; Ferreira, L.G. The Cerrado into-pieces: Habitat fragmentation as a function of landscape use in the savannas of central Brazil. Biol. Conserv. 2009, 142, 1392–1403. [Google Scholar] [CrossRef]
  13. Francoso, R.D.; Brandao, R.A.; Nogueira, C.C.; Salmona, Y.B.; Machado, R.B.; Colli, G.R. Habitat loss and the effectiveness of protected areas in the Cerrado Biodiversity Hotspot. Nat. Conserv. 2015, 13, 35–40. [Google Scholar] [CrossRef] [Green Version]
  14. Coelho, A.J.P.; Magnago, L.F.S.; Matos, F.A.R.; Mota, N.M.; Diniz, É.S.; Meira-Neto, J.A.A. Effects of anthropogenic disturbances on biodiversity and biomass stock of Cerrado, the Brazilian savanna. Biodivers. Conserv. 2020, 29, 3151–3168. [Google Scholar] [CrossRef]
  15. Rosa, C.A. Savannah for sale: Is there hope for neotropical biodiversity on private, Brazilian properties? Anim. Conserv. 2020, 1–2. [Google Scholar] [CrossRef]
  16. Ganem, R.S.; Drummond, J.A.; Franco, J.L.D.A. Conservation policies and control of habitat fragmentation in the Brazilian Cerrado biome. Ambient Soc. 2013, 16, 99–118. [Google Scholar] [CrossRef] [Green Version]
  17. Strassburg, B.B.N.; Brooks, T.; Feltran-Barbieri, R.; Iribarrem, A.; Crouzeilles, R.; Loyola, R.; Latawiec, A.E.; Filho, F.J.B.O.; Scaramuzza, C.A.D.M.; Scarano, F.R.; et al. Moment of truth for the Cerrado hotspot. Nat. Ecol. Evol. 2017, 1, 99. [Google Scholar] [CrossRef] [PubMed]
  18. Stan, K.; Sanchez-Azofeifa, A.; Espírito-Santo, M.; Portillo-Quintero, C. Simulating Deforestation in Minas Gerais, Brazil, under Changing Government Policies and Socioeconomic Conditions. PLoS ONE 2015, 10, e0137911. [Google Scholar] [CrossRef]
  19. Barreto, L.; Van Eupen, M.; Kok, K.; Jongman, R.H.; Ribeiro, M.C.; Veldkamp, A.; Hass, A.; Oliveira, T.G. The impact of soybean expansion on mammal and bird, in the Balsas region, north Brasilian Cerrado. J. Nat. Conserv. 2012, 20, 374–383. [Google Scholar] [CrossRef]
  20. Batlle-Bayer, L.; Batjes, N.H.; Bindraban, P.S. Changes in organic carbon stocks upon land use conversion in the Brazilian Cerrado: A review. Agric. Ecosyst. Environ. 2010, 137, 47–58. [Google Scholar] [CrossRef]
  21. Fahrig, L. Effects of Habitat Fragmentation on Biodiversity. Annu. Rev. Ecol. Evol. Syst. 2003, 34, 487–515. [Google Scholar] [CrossRef] [Green Version]
  22. Fahrig, L.; Arroyo-Rodríguez, V.; Bennett, J.R.; Boucher-Lalonde, V.; Cazetta, E.; Currie, D.J.; Eigenbrod, F.; Ford, A.T.; Harrison, S.P.; Jaeger, J.A.; et al. Is habitat fragmentation bad for biodiversity? Biol. Conserv. 2019, 230, 179–186. [Google Scholar] [CrossRef] [Green Version]
  23. Fahrig, L. Ecological Responses to Habitat Fragmentation Per Se. Annu. Rev. Ecol. Evol. Syst. 2017, 48, 1–23. [Google Scholar] [CrossRef]
  24. Fahrig, L. Habitat fragmentation: A long and tangled tale. Glob. Ecol. Biogeogr. 2018, 28, 33–41. [Google Scholar] [CrossRef]
  25. Fletcher, R.J.; Didham, R.K.; Banks-Leite, C.; Barlow, J.; Ewers, R.M.; Rosindell, J.; Holt, R.D.; Gonzalez, A.; Pardini, R.; Damschen, E.I.; et al. Is habitat fragmentation good for biodiversity? Biol. Conserv. 2018, 226, 9–15. [Google Scholar] [CrossRef] [Green Version]
  26. Miller-Rushing, A.J.; Primack, R.B.; Devictor, V.; Corlett, R.T.; Cumming, G.S.; Loyola, R.; Maas, B.; Pejchar, L. How does habitat fragmentation affect biodiversity? A controversial question at the core of conservation biology. Biol. Conserv. 2019, 232, 271–273. [Google Scholar] [CrossRef]
  27. Püttker, T.; Crouzeilles, R.; Almeida-Gomes, M.; Schmoeller, M.; Maurenza, D.; Alves-Pinto, H.; Pardini, R.; Vieira, M.V.; Banks-Leite, C.; Fonseca, C.R.; et al. Indirect effects of habitat loss via habitat fragmentation: A cross-taxa analysis of forest-dependent species. Biol. Conserv. 2020, 241. [Google Scholar] [CrossRef]
  28. Meentemeyer, V. Geographical perspectives of space, time, and scale. Landsc. Ecol. 1989, 3, 163–173. [Google Scholar] [CrossRef]
  29. Turner, M.G. Landscape Ecology: The Effect of Pattern on Process. Annu. Rev. Ecol. Syst. 1989, 20, 171–197. [Google Scholar] [CrossRef]
  30. Seppelt, R.; Lautenbach, S.; Volk, M. Identifying trade-offs between ecosystem services, land use, and biodiversity: A plea for combining scenario analysis and optimization on different spatial scales. Curr. Opin. Environ. Sustain. 2013, 5, 458–463. [Google Scholar] [CrossRef]
  31. Alencar, A.; Shimbo, J.Z.; Lenti, F.; Marques, C.B.; Zimbres, B.; Rosa, M.; Arruda, V.; Castro, I.; Ribeiro, J.P.F.M.; Varela, V.; et al. Mapping Three Decades of Changes in the Brazilian Savanna Native Vegetation Using Landsat Data Processed in the Google Earth Engine Platform. Remote. Sens. 2020, 12, 924. [Google Scholar] [CrossRef] [Green Version]
  32. Fahrig, L. Why do several small patches hold more species than few large patches? Glob. Ecol. Biogeogr. 2020, 29, 615–628. [Google Scholar] [CrossRef] [Green Version]
  33. Spera, S.; Reatto, A.; Martins, É.; Correia, J.; Cunha, T. Solos areno-quarzosos no Cerrado: Problemas, características e limitação ao uso. Embrapa Cerrados 1999, 7, 1–48. [Google Scholar]
  34. Brito, A.; Valeriano, D.D.M.; Ferri, C.; Scolastrici, A.; Sestini, M. Metodologia da Deteccao do Desmatamento no Bioma Cerado: Mapeamento de Areas Antropizadas Com Imagens de Media Resolucao Especial. 2018. Available online: http://cerrado.obt.inpe.br/wp-content/uploads/2019/08/report_funcate_metodologia_mapeamento_bioma_cerrado.pdf (accessed on 21 January 2021).
  35. Körting, T.S.; Fonseca, L.M.G.; Câmara, G. GeoDMA—Geographic Data Mining Analyst. Comput. Geosci. 2013, 57, 133–145. [Google Scholar] [CrossRef] [Green Version]
  36. de Oliveira, S.N.; de Carvalho Júnior, O.A.; Gomes, R.A.T.; Guimarães, R.F.; McManus, C.M. Landscape-fragmentation change due to recent agricultural expansion in the Brazilian Savanna, Western Bahia, Brazil. Reg. Environ. Chang. 2017, 17, 411–423. [Google Scholar] [CrossRef]
  37. Forman, R.T.T. Land Mosaics: The Ecology of Landscapes and Regions; Cambridge University Press: Cambridge, UK, 1995; ISBN 978-0-521-47462-7. [Google Scholar]
  38. Martinelli, L.A.; Naylor, R.; Vitousek, P.M.; Moutinho, P. Agriculture in Brazil: Impacts, costs, and opportunities for a sustainable future. Curr. Opin. Environ. Sustain. 2010, 2, 431–438. [Google Scholar] [CrossRef]
  39. Prevedello, J.A.; Vieira, M.V. Does the type of matrix matter? A quantitative review of the evidence. Biodivers. Conserv. 2009, 19, 1205–1223. [Google Scholar] [CrossRef]
  40. Ribeiro, M.C.; Metzger, J.P.; Martensen, A.C.; Ponzoni, F.J.; Hirota, M.M. The Brazilian Atlantic Forest: How much is left, and how is the remaining forest distributed? Implications for conservation. Biol. Conserv. 2009, 142, 1141–1153. [Google Scholar] [CrossRef]
Figure 1. Study area–Cerrado biome in the state of Bahia, Northeastern Brazil with altimetry.
Land 10 00352 g001
Figure 2. TerraClass 2013 land use and land cover (LULC) map in the study area and different cell size: (A) 50 km; (B) 30 km; (C) 15 km; (D) 10 km; (E) 5 km. On the left, a region with a predominance of large LULC areas, and the right, a region with a predominance of small LULC areas.
Land 10 00352 g002
Figure 3. Landscape typology of patterns observed in the study region from the composition and arrangement of TerraClass Cerrado land use and land cover patterns.
Land 10 00352 g003
Figure 4. Decision tree used to classify the Cerrado landscape classes in the state of Bahia. Consolidated Agriculture (AC), Initial Stage of Fragmentation (FI1), Intermediate Stage of Fragmentation (F12), Native Cerrado (NC), Consolidated Pasture (PC), and Mixed Landscape (PM).
Land 10 00352 g004
Figure 5. Land use and land cover in Bahia according to TerraClass Cerrado 2013 data, and classification of landscape typologies in the Cerrado of Bahia. (A) Land use and land cover map in Bahia in 2013 according to TerraClass Cerrado: LULC map in the state of Bahia according to TerraClass Cerrado 2013 data. (B) Natural and anthropic cover map in Bahia in 2020 according to PRODES Cerrado: the map shows the natural cover and all anthropic covers represented by the class anthropic in 2020 according to PRODES Cerrado. (C) Landscape types in Bahia: Typology map in the state of Bahia obtained from the decision tree classification.
Land 10 00352 g005
Figure 6. Boxplot of the metrics Native percentage of Cerrado, Patches Number, Total Edge, and Mode Area for each landscape type (AC, FI1, FI2, NC, PC and, PM), in 2013 and 2020.
Land 10 00352 g006
Table 1. Confusion matrix of training samples and test samples used to classify the landscape typology of the Bahia Cerrado region.
Size = 6 Size = 6
Errors = 1 (0.9 %)Errors = 2 (3.8 %)
Training Sample Evaluation (n = 109)Test Sample Evaluation (n = 53)
ACFI1FI2NCPCPMACFI1FI2NCPCPM
AC14 13
FI1 21 6
FI2 17 9 1
NC 20 7
PC 20 7
PM1 161 9
Table 2. Results of the metrics inside FI2 in 2013 and 2020 average values: Percentage of Native cover, Number of Patches, Total Edge, and Mode Area.
Landscape PatternLandscape MetricYear 2013Year 2020
FI1Percentage of Native cover (%)63.4459.87
Number of Patches6.196.24
Total Edge (km)213.67238.66
Mode Area (km2)20,850.7420,029.29
FI2Percentage of Native cover (%)65.2160.43
Number of Patches22.9722.82
Total Edge (km)275.70310.34
Mode Area (km2)14,323.7113,328.54
PMPercentage of Native cover (%)41.5034.21
Number of Patches11.0911.00
Total Edge (km)169.58184.12
Mode Area (km2)9431.917435.12
Note: Mean from all cells.
Publisher’s Note: MDPI stays neutral with regard to jurisdictional claims in published maps and institutional affiliations.

