Article

Agricultural Land Use Change in Chongqing and the Policy Rationale behind It: A Multiscale Perspective

1
College of Architecture and Urban Planning, Tongji University, Shanghai 200092, China
2
School of Geography and Planning, Sun Yat-sen University, Guangzhou 510275, China
3
School of Geography and Remote Sensing, Guangzhou University, Guangzhou 510006, China
*
Author to whom correspondence should be addressed.
Land 2021, 10(3), 275; https://doi.org/10.3390/land10030275
Submission received: 30 January 2021 / Revised: 1 March 2021 / Accepted: 4 March 2021 / Published: 8 March 2021

Abstract

:
Agricultural land resources have been the central issue for the Chinese government in its attempts to secure food and agricultural sustainability. Yet strict land use control does not protect the agricultural land from erosion by urban expansion. Identifying the specific patterns and mechanisms of the agricultural land conversion, thus, is critical for land management and related decision making. Based on the annual nominal 30 m land use/land cover datasets (called CLUD-A), this study goes below the national/regional level to examine agricultural land conversion in Chongqing from a multiscale perspective. At the metropolis and its subdivision’s scales, the volume of the conversion area has been generally increasing, from 122.40 km2 in 1980–1990, 162.26 km2 in 1990–2000, and 706.14 km2 in 2000–2010, to 684.83 km2 in 2010–2015. Such a conversion in the main city area and its surroundings far outweighed that in the rural outskirts, as 68.9% (1990–2000), 92.2% (2000–2010), and 82.7% (2010–2015) of the conversion happened in the former. Moreover, values of Gini coefficients and coefficient of variation (CV) based on the county/district scale (Gini [0.46, 0.64], CV [0.69, 0.99] throughout the four periods) are much lower than those based on the town/village scale (Gini [0.88, 0.94], CV [3.18, 4.47] throughout the four periods), suggesting the uneven extent of spatial distribution of the agricultural land conversion trickles down along with the downscale of administration: the lower the administrative level, the more severe the unbalance. The policy rationale behind this transition is also discussed. This research argues for tangible approaches to a sustainable rural-urban transformation.

1. Introduction

Disentangling how and why land use has changed has long been the primary task in research on sustainable land use science [1,2]. Given the known knowledge on urban expansion, agricultural transition, and deforestation, scholars argue for additional research on subtle changes in subcategories of land use to guarantee food security, natural protection, and environmental protection [3,4]. Subtle changes deserving of attention include the intensity of agricultural land use [5], variation of land use configuration in space across different time periods, and the competing uses of land to support human survival. The major challenge for sustainable land use is the increasing demand to feed and accommodate a growing population with limited land resources [6,7]. This is especially true in China where only 8% of the world’s agricultural land has fed 22% of the total population on earth.
Yet another unneglected truth is that China has been one of the few major countries that has experienced fluctuating shrinkage of agricultural land for the past few decades [8,9]. According to statistical data from China’s Ministry of Agriculture and Rural Affairs and Ministry of Natural Resources, though the amount of loss varied across different years (e.g., the years 1985 and 2003 witnessed peaks of over 1.0- and 2.5-million-hectare net losses while the losses in other years were much lower), agricultural land has overall been decreasing since the 1980s. From 2000 to 2010, among the top 10 countries measured by their total agricultural land area, China is the only one which experienced a loss of agricultural land, decreasing by 0.95% [8]. Almost in the same period, however, an analysis of land use/land cover (LULC) data reveals that agricultural land has increased across the globe overall and many countries have expanded their agricultural land for feeding increasing populations, at the cost of grassland and forests [10,11]: during 1982–2011, countries in Oceania (East Australia increased by 50–60%), South America (especially its southeast areas such as East Brazil and North Argentina increased by 40–50%), North America (Alaska increased by 50–60%) witnessed substantial expansions of agricultural land, while Botswana in south Africa alone increased by 80–90% during the same period [10]. This makes China an interesting case study to unravel what conversion happened to agricultural land and how such conversion took place. Indeed, agricultural land resources have been the central issue for the Chinese government as it sought to secure food and agricultural sustainability. Unlike in Eastern Europe and Central Asia where a considerable amount of arable land is poorly disposed or discarded, China has launched a series of policies to protect agricultural land, e.g., the “1.8 billion mu redline” policy to defend prime agricultural land. Nevertheless, the unprecedented scale and speed of urbanization has imposed tremendous pressures on land demand. Urbanization requires massive infrastructural construction that leads to distinct urban land expansion rates far outweighing that of the urban population [12]. A substantial increase of the expanded urban surface land occurs by encroaching on a large amount of agricultural land, threatening the border of permanent prime agricultural land and leading to the extensive, unsustainable use of land [13,14].
Notably, researchers also found that such a conversion of agricultural land to construction land was uneven across different geographies, from global [8,9,10,11,15], continental/transnational [16], national [17,18,19], and regional [20,21,22,23], to urban or even lower levels [24,25,26], and also varied across different time periods [10,11,21]. They argue that ‘scale’ matters and multiscale analysis is necessary for in-depth examinations [27,28]. Thus, this research adds the time and scale dimensions to explore how agricultural land has been converted to other types of land, especially the construction land in China. As an accustomed term in geography, ‘scale’ is neutrally treated as a metric of physical space and a pregiven or fixed container for human activities [29], but when it comes to analysis, the meaning of ‘scale’ may vary and at best adaptively fits different circumstances or contexts. In a figure or picture regardless of socioeconomic factors or administrative boundaries, it may refer to the width of a pixel or area of a polygon [30]. Taking population or economic density into account, it can represent statistical spatial units differing from the legal states, cities, or counties, such as the metropolitan statistical area (MSA) in the U.S. [31]. Considering demarcations of administrative power, ‘scale’ can also link to the bureaucratic hierarchical systems and point at jurisdictions administered by villages, townships, prefectures, or provincial and national governments, corresponding to the national (guojia ji) level, provincial/ministry level (sheng-bu ji), prefecture/department level (di-ting ji), county/division level (xian-chu ji), and township/section level (xiang-ke ji). The third type of ‘scale’ is particularly helpful to understand the spatial distribution status in the context of China where administrations and policies have tremendously influenced land and spatial change [32,33]. However, existing research on agricultural land use change is preoccupied with the national/regional scale [19,34,35]. For instance, Zhong and Qian [35] discussed the impacts of the top-down quota-oriented agricultural land preservation planning for the intensive utilization of urban land in China in association with the National General Land Use Plan (1997–2010). Ge and Long [19] examined the characteristics of agricultural land transition and its influence on grain production at the national level against the backdrop of China’s urban-rural transformation. Zuo and Zhang [34] traced the transition and patterns of cropland in northwest China from 1980 to 2010 and clearly observed a net increase in built-up land due to agricultural land conversion. However, the nature of changes of agricultural land that take place at the lower level, e.g., the county/district levels and the intra-urban scale, remains inadequately understood. Indeed, one scale of certain activity is not in isolation with that at other scales. Adopting a multiscale perceptive, therefore, is needed to reveal mutual imbrications of all scales and necessitate a more comprehensive understanding of social activities in a space. An in-depth understanding at the sub-national or sub-regional level is also essential because valid control and guidance on land use requires detailed information on multiple scales, providing evidence for better land management [36].
The uneven rule of agricultural land change also applied to China, though there has been a general decreasing trend since the 1980s [8,9]. The east coast area that developed was early has experienced a rapid loss of agricultural land, which was much more intensive than in central and west China during 1981–1990. But as time went by, policy tilted towards the central and western areas, where preventing agricultural land from encroaching onto other forms of land turned to be an increasing challenge due to the growing demand for land to accommodate larger populations, as well as the increasing need for food to feed them. Though the agricultural outputs were greatly improved by institutional reforms such as the household responsibility system in the late 1970s [37] to reduce this pressure, most of the farming structure in western China is still small-scale, fragmented, and far from being mechanized for agricultural productivity improvements [38]. The labor-intensive agricultural production mode is fragile, as urban growth has led to massive migrations from rural to urban areas that depletes the rural workforce in the villages. This is because small scale farming is far less competitive with urban activities in term of economic returns. Instead of forming a virtuous circle, the highly efficient urban production mode has harmed the less efficient production of agricultural land through policies of rural-urban land transfers. Identifying the rate, intensity, location, and mechanisms of this conversion, thus, helps with land management and related decision making.
Located in western China, Chongqing is an intriguing case for the study of how and why agricultural land was converted into construction land, given its fast urbanization rate, wide range of rural areas, diverse agricultural land structure, and varied urbanization and economic development levels. Before Chongqing was upgraded, the city was urged by the provincial government of Sichuan to annex several poverty-stricken districts and counties to its own jurisdiction. Consequently, socioeconomic development in Chongqing since the 1990s has bared a strong characteristic of the urban-rural dichotomy. For a long time, having the rural areas catch up has been an important task for local leaders. Intense policies have been approved and applied to Chongqing and profound rural-urban transformation has taken place in this large metropolis. The objective of this study is to develop an analytical route for better understanding the intra-urban land conversion from a multiscale perspective based on China’s peculiar spatial and administrative framework. In particular, via the case of Chongqing, it aims to: (1) link the multiscale analysis to China’s administrative structure and city’s spatial layout at an intra-urban level of urban-rural coexistence; (2) quantify the patterns of the agricultural land conversion, measure the uneven extent of spatial distribution, and identify the implications of the results at different scales under the multiscale framework; (3) compare results of the study area with other regions and discuss major policies related to the agricultural land conversion.

2. Research Method

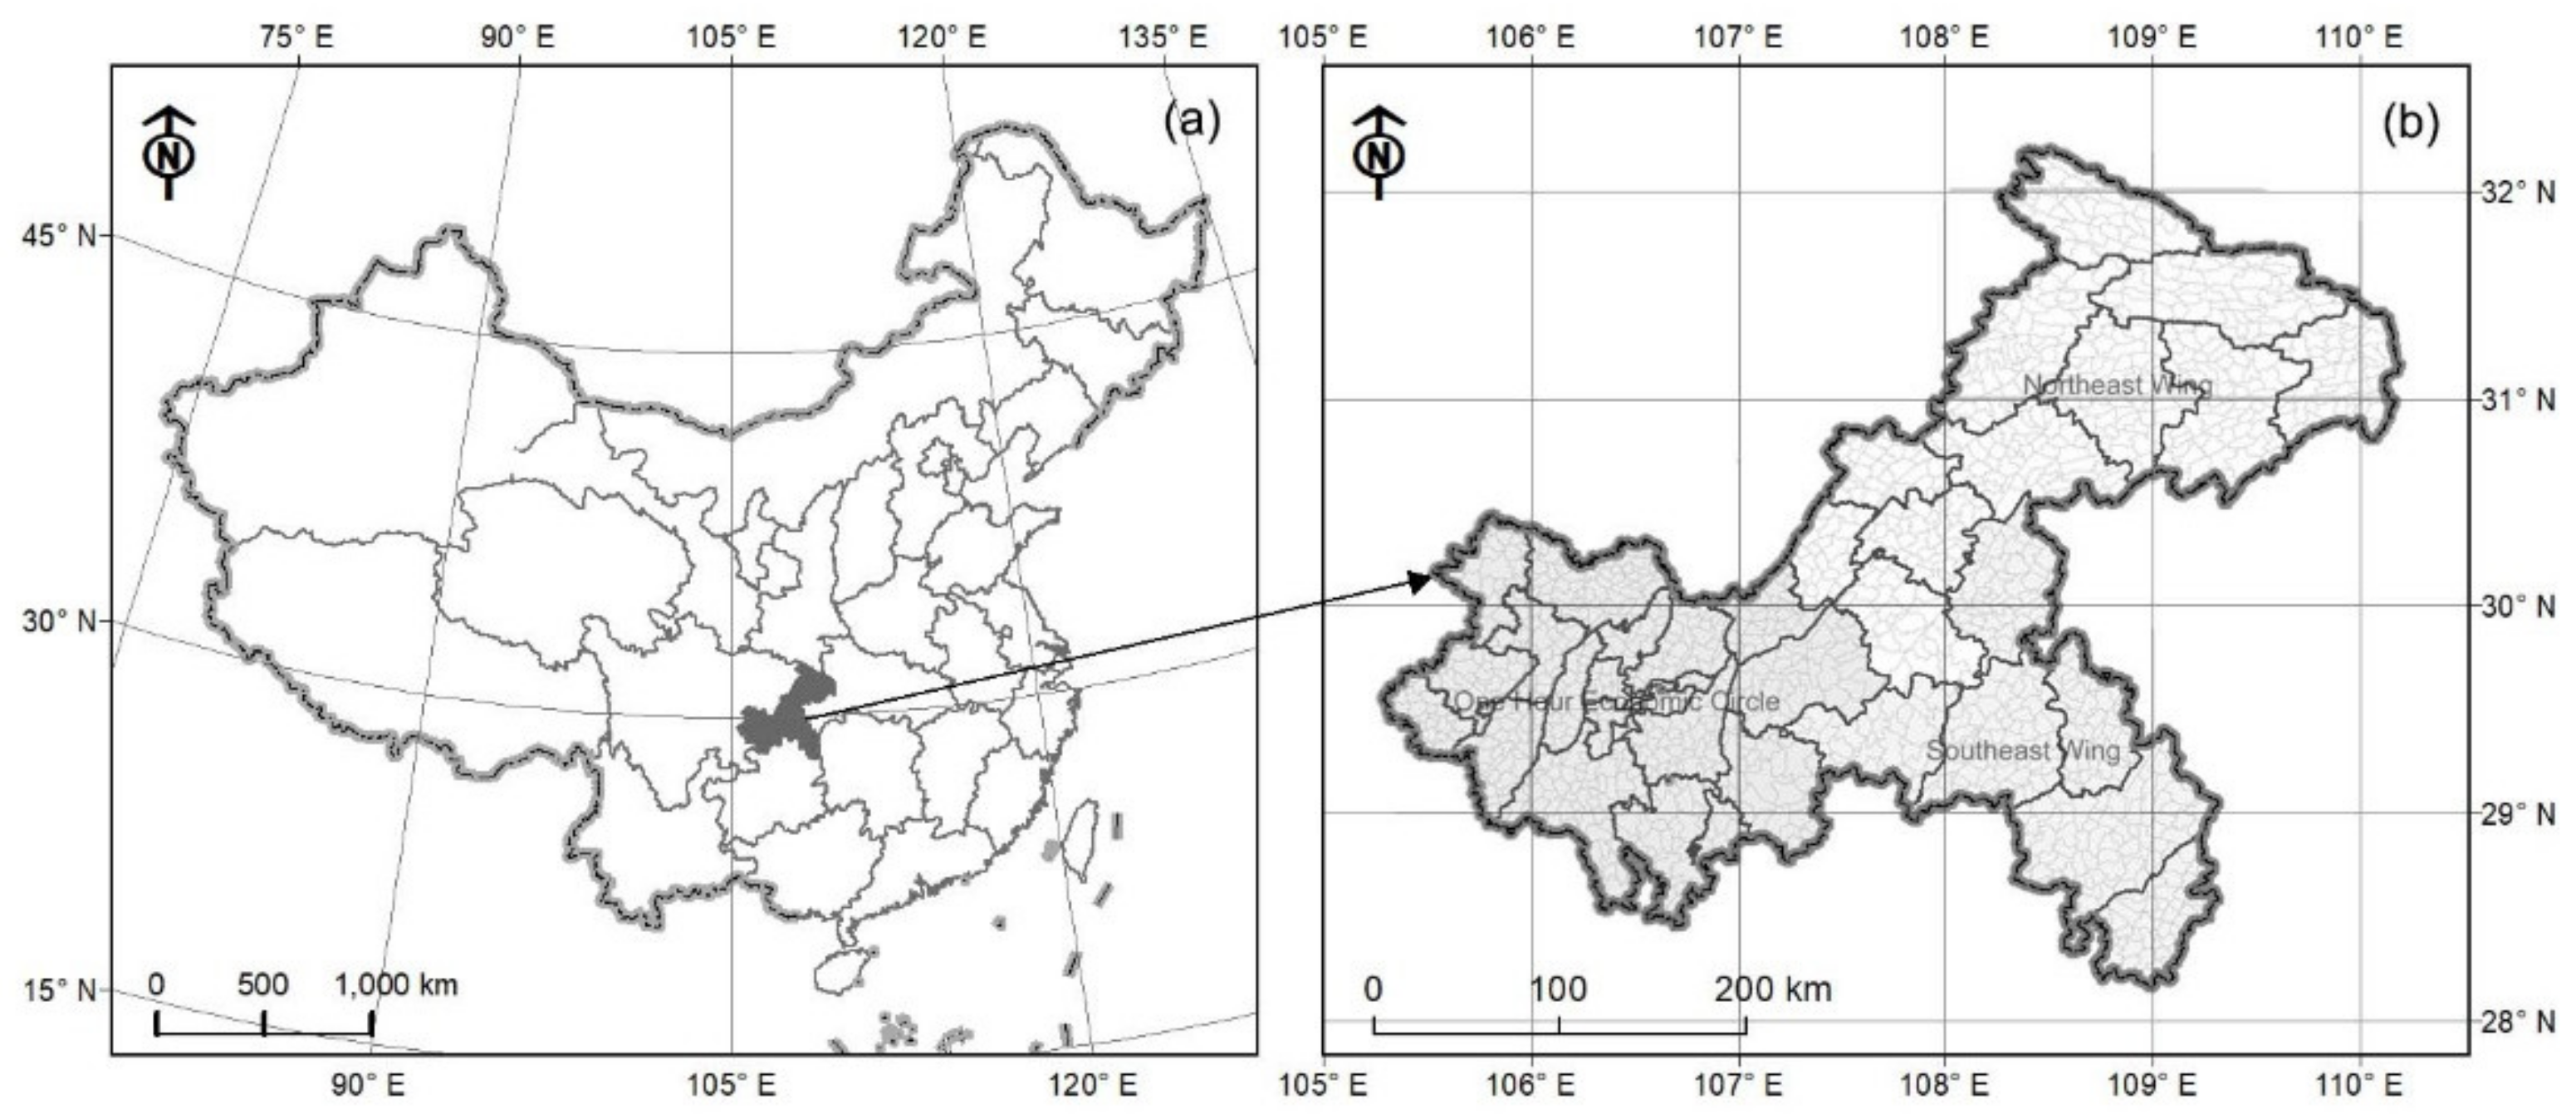
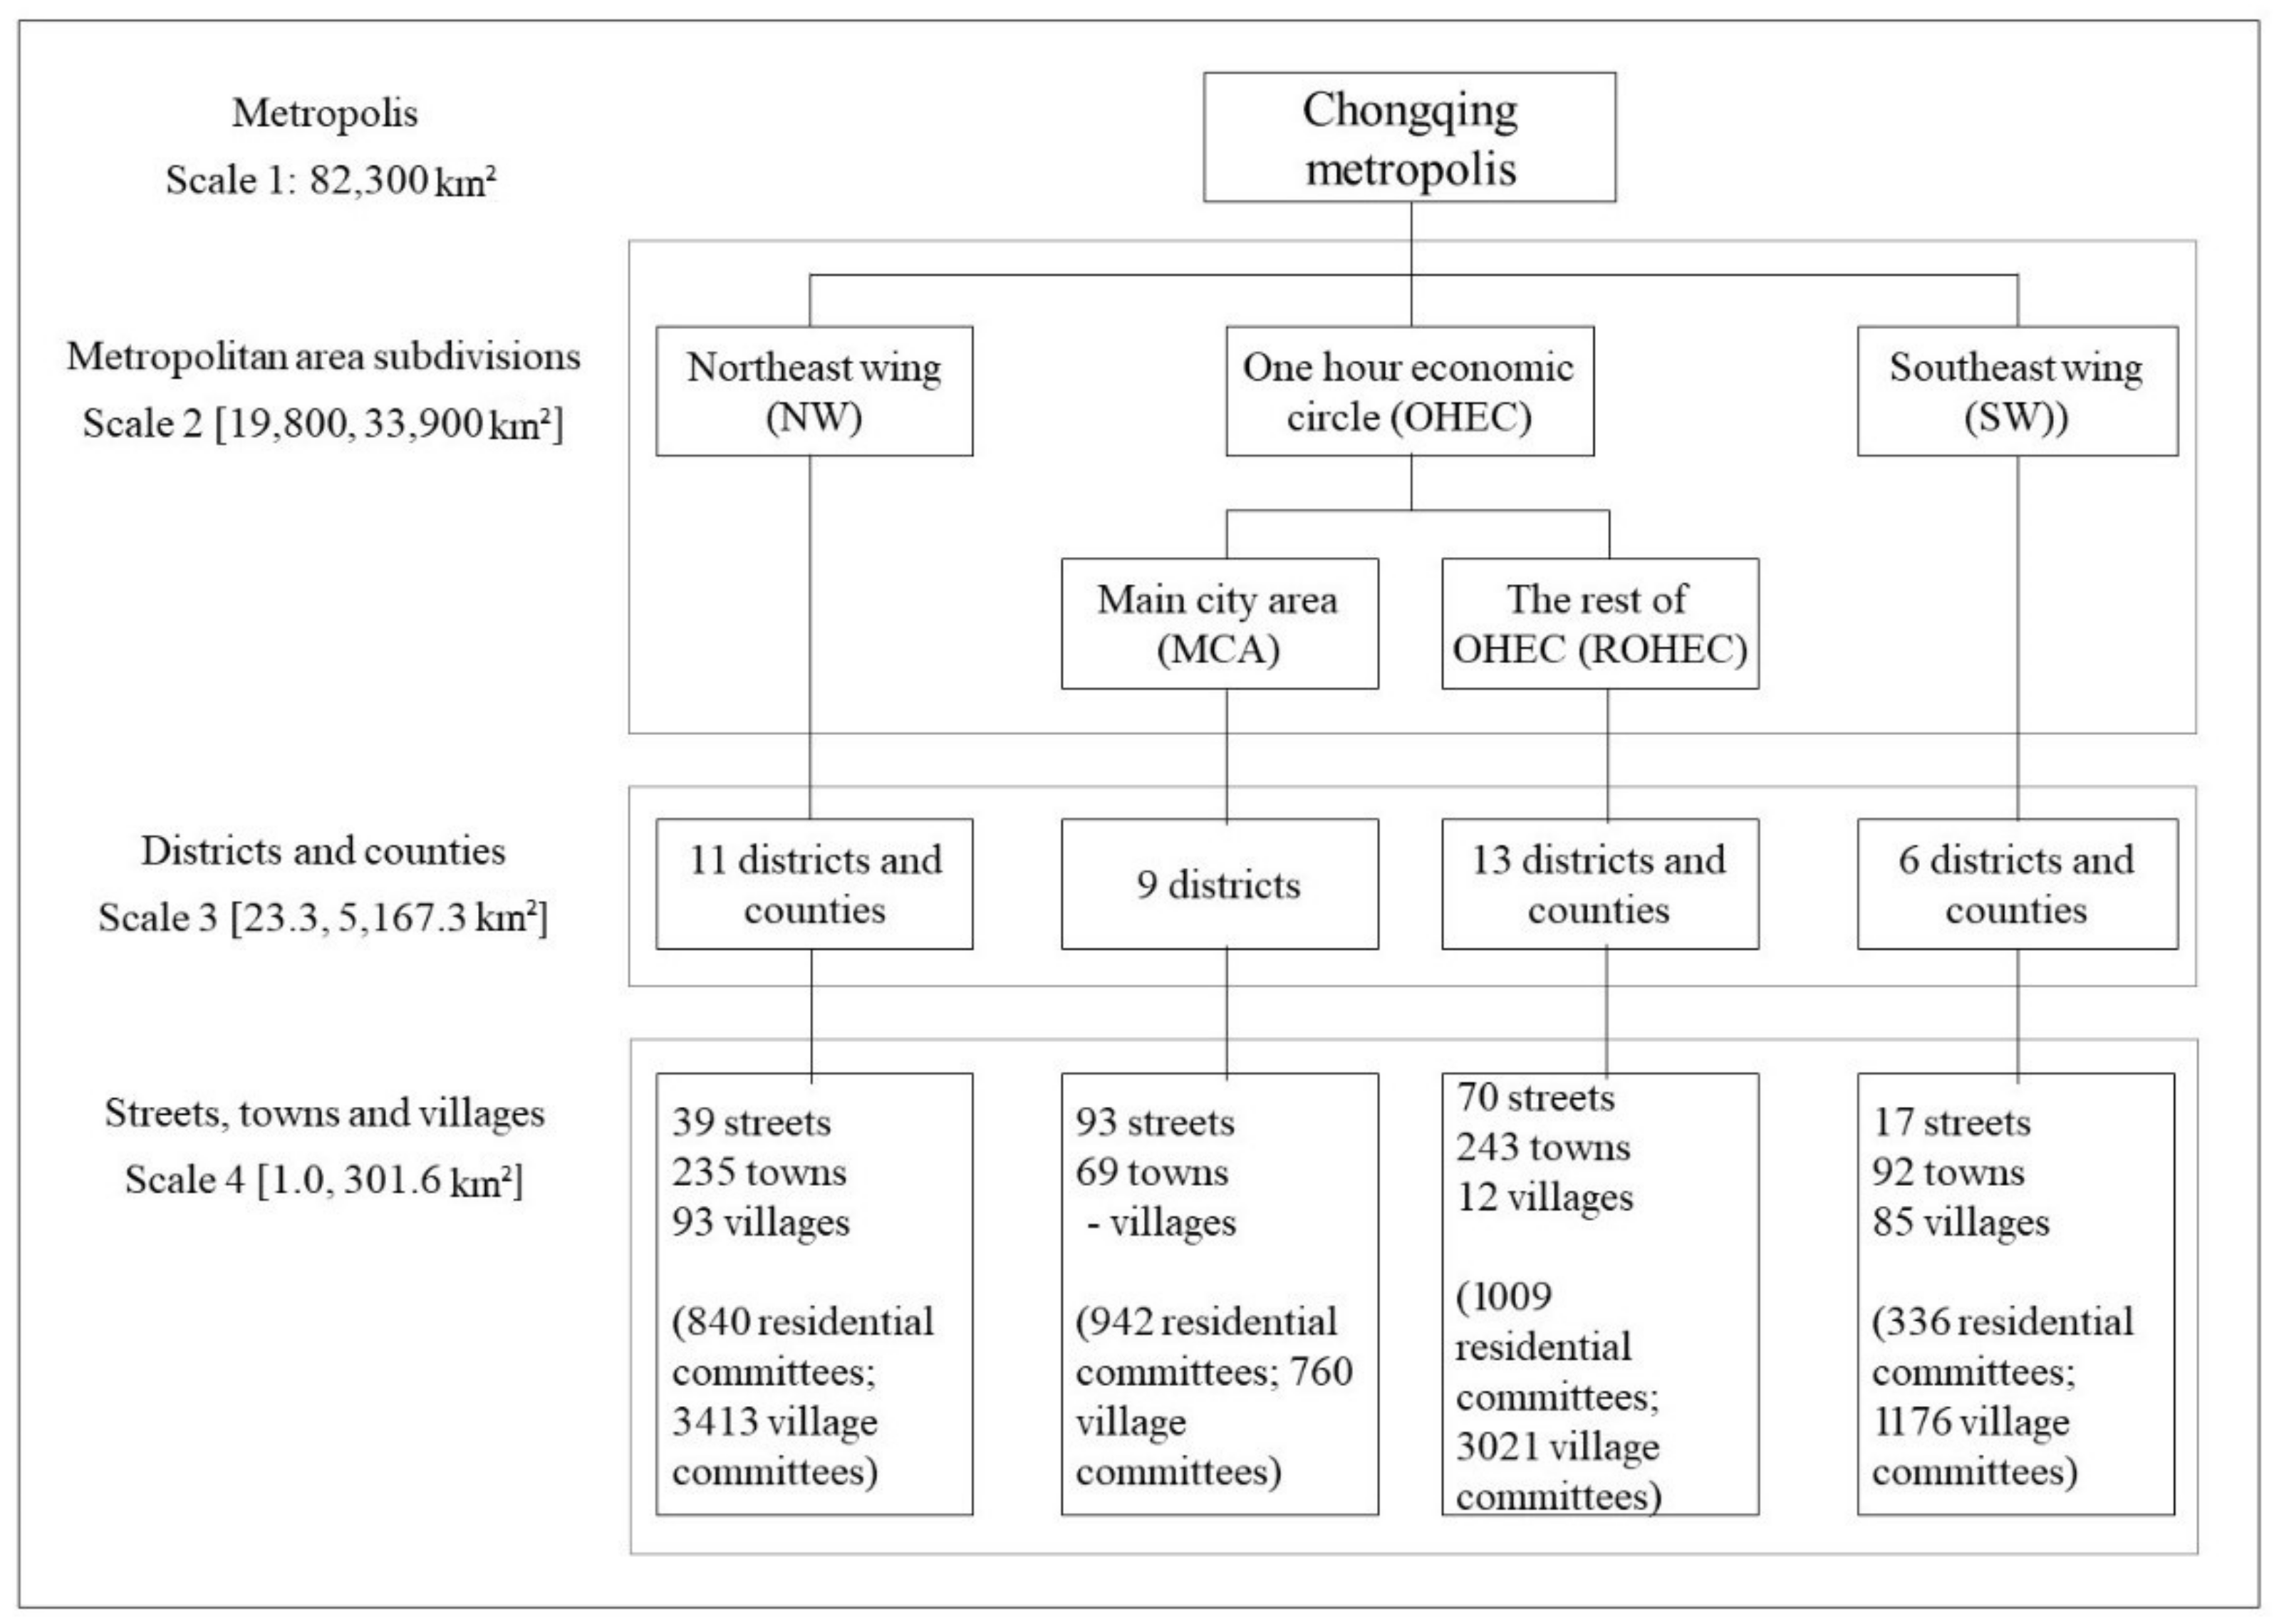
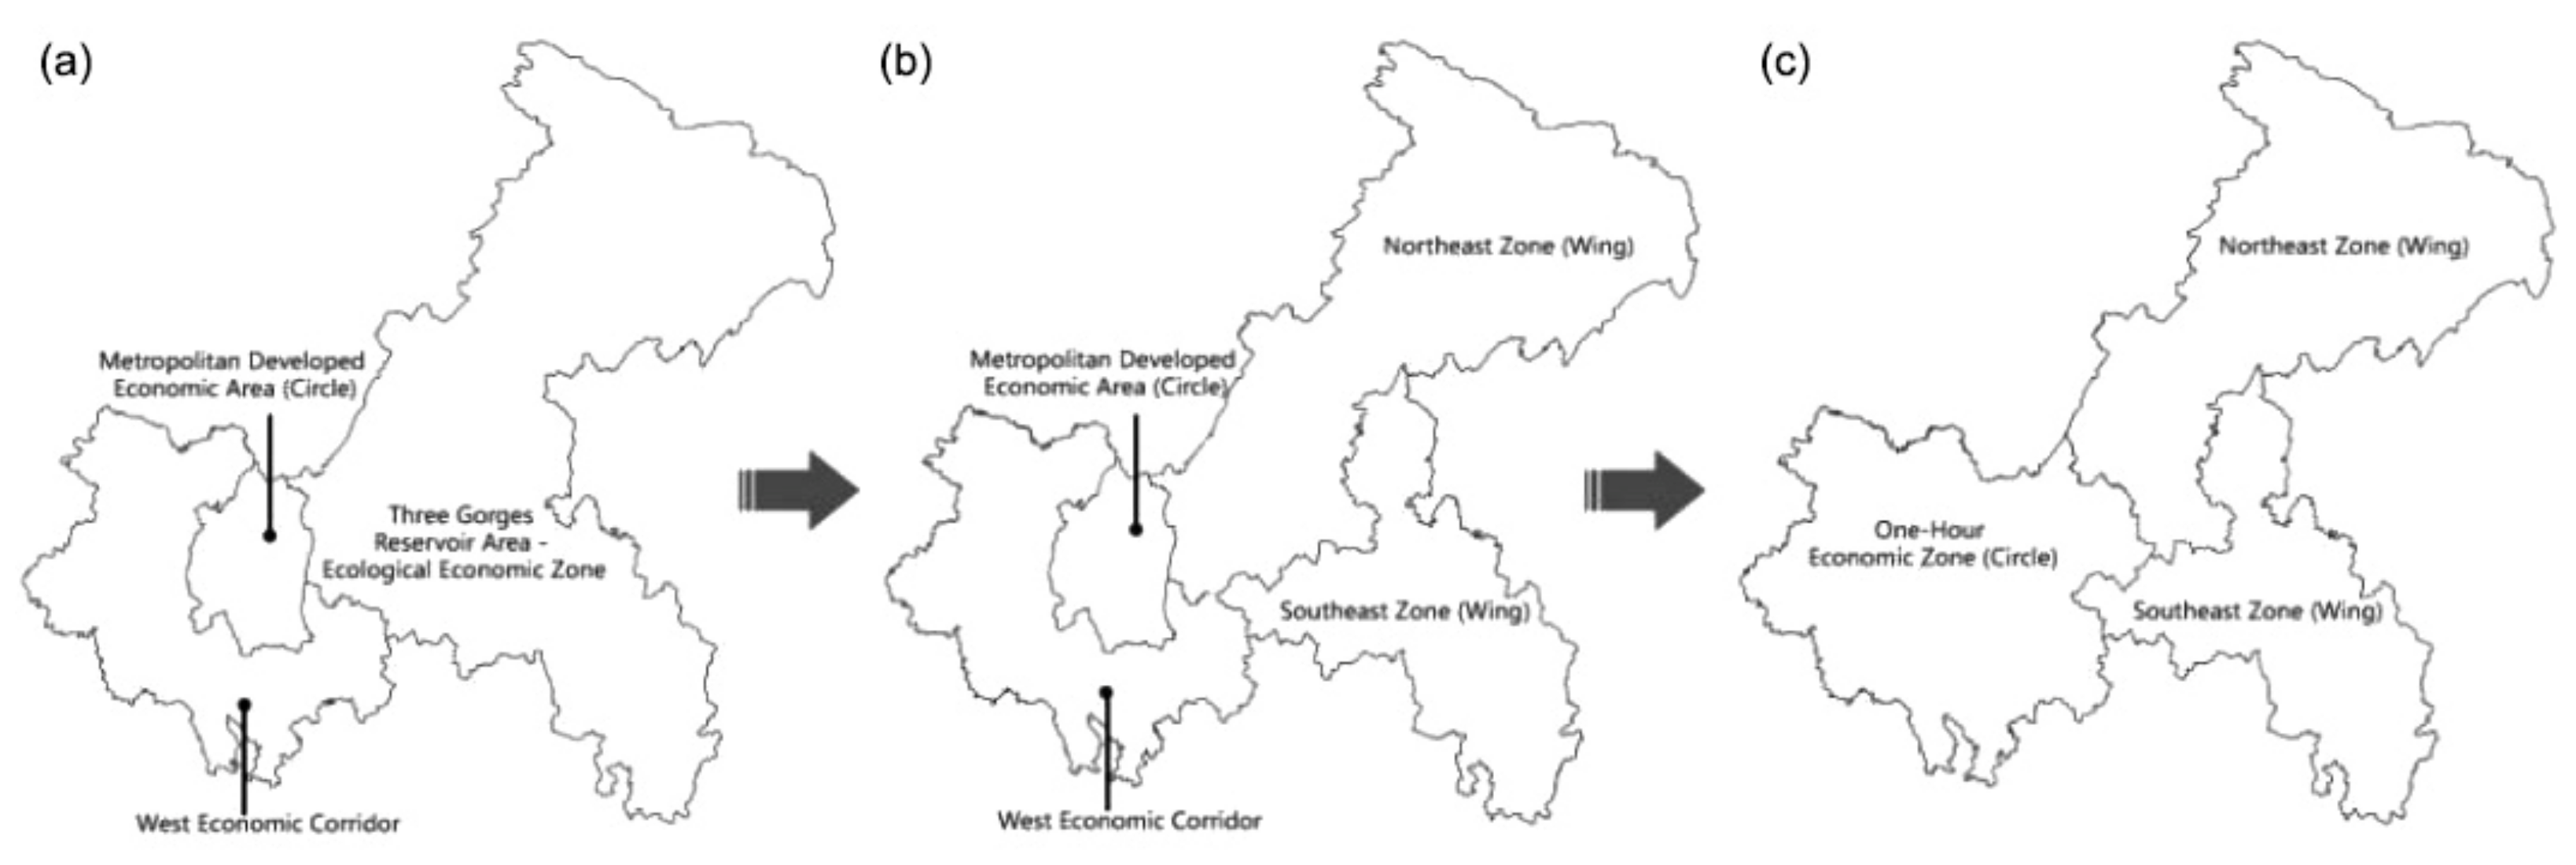
2.1. Area of Research and Its Administrative Multiscale Structure

Chongqing is one of the central cities identified in the national urban system planning. Located in the junction of the Yangtze River and Baokun Railway in the national strategic “two horizontal and three vertical” layout (Figure 1), it is the fulcrum of the Silk Road and Yangtze River Economic Belts and props up the Great Western Development. With the highest per capita disposable income of urban households among western regions, Chongqing was assigned to take the lead in building up a “moderately prosperous society” and nurturing new growth engines in western China [39]. This national campaign demonstrates an affirmative role played by the central government in dictating territorial development (Lu and Deng, 2011), and this is the first time since China’s Third Front Development that inland areas were selected for industrial development and upgrades [40]. As one of the largest metropolises in China, the Chongqing metropolis’ area is around 82,300 thousand km2 (scale 1 in Figure 2) and is comprised of the one-hour economic circle (OHEC) encompassing the main city area (MCA, the urban functional core/development area) and the other areas (ROHEC, the urban development new area), the northeast wing (NW) of the ecological conservation development area, and the southeast wing (SW) of the ecological protection area (scale 2 in Figure 2). The spatial framework was developed through rounds of spatial strategies proposed by the municipal government to coordinate urban-rural development after 1997 (Figure 3). The first was the “Three Economic Zones” (3EZs) strategy (Figure 3a) aimed at aligning the traditional urban core area—known as “Metropolitan Developed Economic Circle”, comprising of the most developed 9 districts and the 12 districts and counties near the urban core—known as the “West Economic Corridor”—and the remaining rural region—known as the “Three Gorges Reservoir Area—Ecological Economic Zone” (Wanzhou, Fulin, and Qianjiang). The 3EZ framework integrated the entire metropolitan area but lacked specific coordination among the different zones. After the enactment of the 10th Five-Year Plan, the “Partition of Four Economic Zones (2003–2020)” strategy (Figure 3b) was proposed. Unlike the master plan (1996–2020) focusing on migration of the Three Gorges, this strategy paid close attention to economic development, social stability, and environmental protection of the “Three Gorges Reservoir Area—Ecological Economic Zone” which was further partitioned into the “Northeast Zone (Wing)” and “Southeast Zone (Wing)” to address economic disparities in less developed areas. In 2007, Chongqing was designated as the pilot reform city for coordinated urban-rural development. The local bureau officially proposed the “one circle, two wings” spatial strategy (Figure 3c) in China’s first urban-rural master plan (Chongqing, 2007–2020): “one circle” refers to the “one-hour economic circle (OHEC)” of the enlarged “West Economic Corridor” and “two wings” refer to the northeast wing (NW) centered on Wanzhou City and the southeast wing (SW) centered on Qianjiang City. The main objective of the “two wings” was to fix surplus labor without causing ecological damage. These strategies have significantly influenced the land use transition, especially that of the agricultural land, in Chongqing. Spatial framework at this scale serves as the basis for analysis of volumes, rates, and trends of agricultural land use conversion to construction land in Chongqing. Administrative districts/counties (scale 3 in Figure 2) and streets/towns/villages (scale 4 in Figure 2) at lower scales under this framework provide spatial units for mapping and measuring the degree of unevenness of the conversion distribution. Analysis of all four scales helps a comprehensive and in-depth understanding of intra-urban level agricultural land use change.

2.2. Data Collection and Analysis

A 30 m resolution remote sensing Land-Use/cover Dataset (called CLUD-A) produced by a Chinese research team [41] was consulted to collect data and produce LULC maps in Chongqing (Figure 4). The CLUD-A combines China’s Land-Use/cover Dataset (CLUD) which provides unprecedented detail of land use change in 1980, 1995, 2000, 2005, 2010, and 2015 at 30-m resolution with the Moderate Resolution Imaging Spectroradiometer (MODIS) and AVHRR GIMMS datasets to develop annual LULC datasets from 1980 to 2015. It distinguishes agricultural land, forest, grassland, waters, built-up land, and unused land (unused land refers to sand, Gobi, saline land, marshland, barren land, and other land that is not used until the mapping time) and is convincing for analysis as validation of the data proven by field trip shows around 94.3% accuracy of land cover of the first-level six categories in 1980, 1995, 2000, 2005, 2010, and 2015 [18]. Considering data accuracy and the accelerated conversion rate as time went by, this research prolonged the interval in the early stage and selected the years 1980, 1990, 2000, 2010, and 2015 for study. Efforts were made to address the limitations of the remote sensing technology. For instance, considering the spectral variation of land cover change, the BFAST algorithm was used for monitoring disturbances using time-series data and identifying the change time during each period [41]. Initial statistics reveals that in spite of the construction land increase, agricultural land accounts the most changes throughout 1980 to 2015, followed by forest and grass (Table 1). Further exploration on agricultural land use, thus, is worthy of study. To achieve this, approaches tracing sources and flow of land, indexes evaluating the rate and intensity of land change, and coefficients measuring the degree of imbalance of spatial distribution should be introduced.

2.2.1. Tracing Sources and Flow of Agricultural Land

Tracing sources and flows of agricultural land helps to identify the quantities of land conversion from and out of agricultural land, which is how agricultural land is lost or gained from other types of land. Based on the absolute value extracted from the CLUD-A dataset, the rate of conversion was calculated to eliminate the areal impact of different land types [42,43]:
A L l o s s   i , j = A L i , j Δ A L i × 100 % ;   A L g a i n   i , j = A L i , j Δ A L j × 100 % ,   i j
A L N l o s s   i , j = A L j , i A L i , j / A L . i A L i . × 100 % ,   i j
where A L l o s s i , j is the ratio of areas converted from agricultural land to land use type j ( A L i , j ) to the total areas of all types of land converted from agricultural land in year I ( Δ A L i ) . A L g a i n   i , j is the ratio of areas of land use type i converted to agricultural land ( A L i , j ) to the total areas of all types of land converted to agricultural land in year j ( Δ A L j ). Here j refers to the column number and i refers to the line number in the land conversion matrix. Both A L l o s s i , j and A L g a i n   i , j are contribution rates of land use of certain type converted out of or to agricultural land. A L N l o s s   i , j refers to the net conversion rate of agricultural land contributed by land use type j, calculated as the ratio of net converted area from land use type j to agricultural land ( A L j , i A L i , j ) to the total net converted areas to agricultural land in year i ( A L . i A L i . ).

2.2.2. Evaluating the Rate and Intensity of Land Change

The annual land use change rate and standardized annual land use change rate [44] are often used for evaluating the speed and pace of land change. This research, thus, proposed the annual conversion rate (ACRa) and standardized annual conversion rate (ACRs, eliminating the impact of size) of agricultural land to construction land to evaluate the agricultural land conversion speed in different time periods and in different districts/counties or town/villages. Scores of ACRa were divided into nine scales at the district/county level, showing of extremely low [0, 0.1], very low [0.1, 0.2], low [0.2, 0.3], slightly low [0.3, 0.5], moderate [0.5, 1], slightly high [1, 2], high [2, 5], very high [5, 10] and extremely high [>10] rates, and nine scales at the town/village level, showing extremely low [0, 0.0005], very low [0.0005, 0.001], low [0.001, 0.005], slightly low [0.005, 0.01], moderate [0.01, 0.05], slightly high [0.05, 0.1], high [0.1, 0.5], very high [0.5, 1] and extremely high rate [>1].
Another indicator of land change intensity is also diversely used [44,45,46,47]. In a study about the Plum Island Ecosystems site in northeastern Massachusetts, USA, three levels of intensity analysis were conducted, examining how land change can vary across time intervals, how land change affects different land categories, and how such changes differ between categories [45]. A similar approach of intensity analysis was applied in a study of land changes in the Jiulong River watershed in southeast China [46]. This research introduced intensity analysis at these time interval levels, proposing an intensity index for the conversion of agricultural land to construction land (ALCI), calculated as the proportion of converted area from agricultural land to construction land to the total area. The equation is:
ALCI i ,   t 1 t 2 = A L A i t 2   A L A i t 1 S A i × Δ t × 100 %
A L A i t 1 and A L A i t 2 refer to the areas of agricultural land in district/county i at the times of t1 and t2. S A i is the total area of district/county i (district/county scale) or town/village i (town/village scale). Scores of ALCI were divided into nine scales at the district/county level, representing conversion intensities of extremely low [0, 0.1], very low [0.1, 0.2], low [0.2, 0.5], slightly low [0.5, 1], moderate [1, 2], slightly high [2, 5], high [5, 10], very high [10, 20], and extremely high [>20], and nine scales at the town/village level, showing intensities of extremely low [0, 0.005], very low [0.005, 0.01], low [0.01, 0.05], slightly low [0.05, 0.1], moderate [0.1, 0.5], slightly high [0.5, 1], high [1, 10], very high [10, 20], and extremely high [>20].

2.2.3. Measuring the Degree of Spatial (Im)balance of Land Change

The Lorenz curve is a graphical representation of the distribution of income or wealth proposed by Max O. Lorenz. It plots percentiles of the population on the horizontal axis based on income or wealth. A perfect equal incomes distribution would be a line at 45 degrees. When using the Lorenz curve, the Gini coefficient then refers to the ratio of the area between the diagonal and the curve and the area of the whole triangle under the diagonal [48]. To quantify the equilibrium degree of conversion in absolute sense, this study charted the Lorenz curves and computed the Gini coefficients in different time periods at both the districts/counties and town/villages levels. For doing this, absolute value of the conversion in each district/county or town/village was arranged from small to large. The horizontal axis refers to the accumulative percentage of the number of districts/counties or towns/villages, while the vertical axis refers to the accumulative percentage of agricultural land conversion.
The coefficient of variation (CV), also known as relative standard deviation (RSD), represents a statistical measure of the dispersion of data points in a data series around the mean. As a relative equilibrium index, CV is used to measure the relative spatial (im)balance of annual transition amount of agricultural land to construction land, and was calculated to supplement the (in)equality analysis of agricultural land use conversion [42,49]:
C V i j = S D i j   M N i j   × 100 %
where CVij represents the value of arable land use transition to construction land in district/county i (or town/village i) during time period j, SDij and M N i j are the standard deviation of transition in district/county i (or town/village i) during time period j. Values of the CV relate to whether and how balance the set of data is spatially distributed.

3. Result: A Multiscale Perspective on Agricultural Land Change

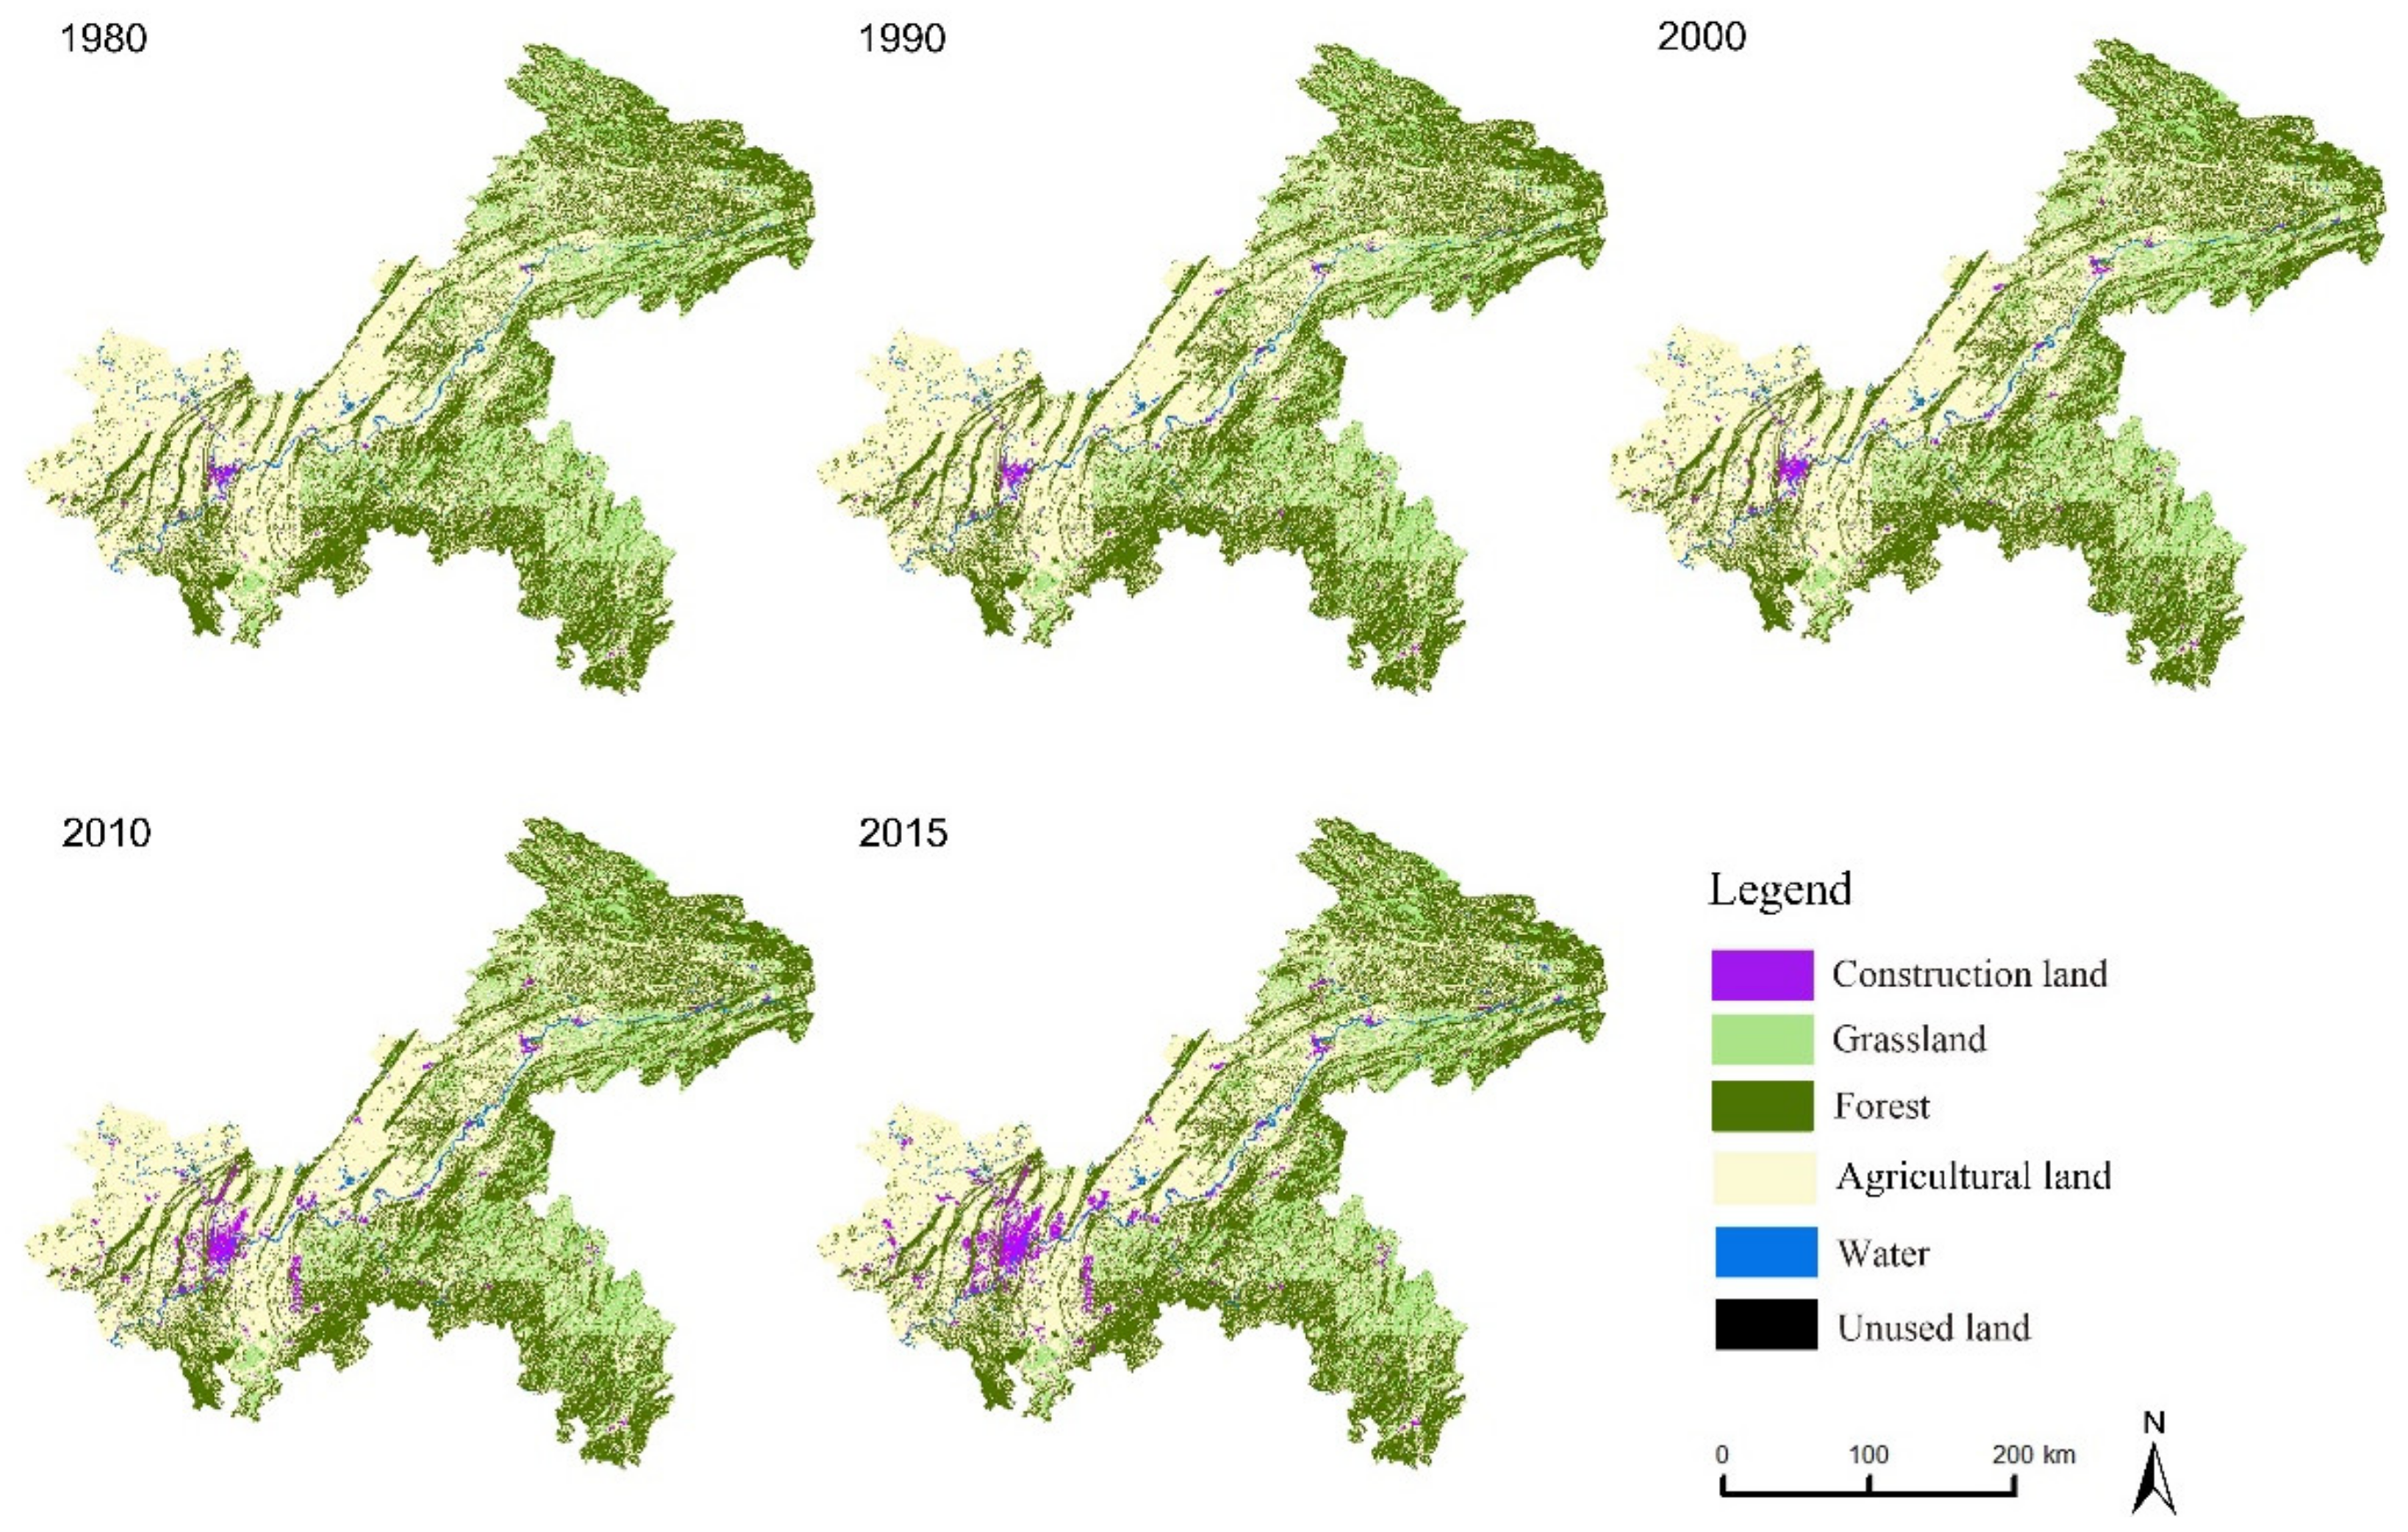
3.1. Agricultural Land Loss More Than the Gain in Chongqing Metropolis

To capture the general patterns of LULC in Chongqing, the source and flow of agricultural land conversion with other types of land including forests, grassland, waters, built-up land, and unused land in Chongqing during 1980–1990, 1990–2000, 2000–2010, and 2010–2015 were calculated (Table 2). From 1980 to 2015, agricultural land generally experienced a great loss and was mainly converted to built-up areas. In Table 2, the negative value implies the loss of agricultural land to the corresponding type of land use; the positive value refers to the gain of agricultural land from the corresponding type of land use. Overall, from 1980 to 2015, the loss of agricultural land was much greater than its gain, with a net loss of 2142.41 km2. The main source of agricultural land is grassland, converting a 128.18 km2 area, followed by forests (converting 83.88 km2) and few built-up land (converting 2.21 km2) and water areas (converting 2.00 km2). The conversion from unused land is minimal. The majority of lost agricultural land (roughly 1675.67 km2) transitioned to become built-up land and subsequently to forests (440.93 km2), grassland (148.87 km2), waters (93.99 km2), and negligible unused land. Forests were the main source of agricultural land in 1980–1990 and 1990–2000, contributing 68.93% and 71.55% of all the conversion to agricultural land. Conversion to agricultural land reached a peak of 151.37 km2 in 2000–2010 and grassland contributing 74.12% of the conversion became the main source during this period. Meanwhile, gains of agricultural land decreased to almost nil in 2010–2015 and built-up land accounted for 90.91% of the sources for conversion. This indicates that though the motivation for agricultural land conversion is insufficient, the policies of “Provisions on Land Reclamation” and “Linking the Increase in Land Used for Urban Construction with the Decrease in Land Used for Rural Construction” have been beneficial. The lost areas were almost converted into built-up land. However, a considerable transition of agricultural land to forests (361.73 km2) was noticed in 2000–2010. This effectively reflects the achievement of “converting agricultural land to forest” in the late 1990s and early 2000s. Grassland and forests provide the main sources of agricultural land. Conversion of waters and unused land is a less obvious option. At the subdivision scale of the Chongqing metropolitan area, throughout all the four periods, almost all the districts and counties lost agricultural land, except the four most remote rural counties located in two wings: Chengkou, Shizhu Youyang, and Xiushan, which gained slight amounts of agricultural land in 1990–2000 and 2000–2010.

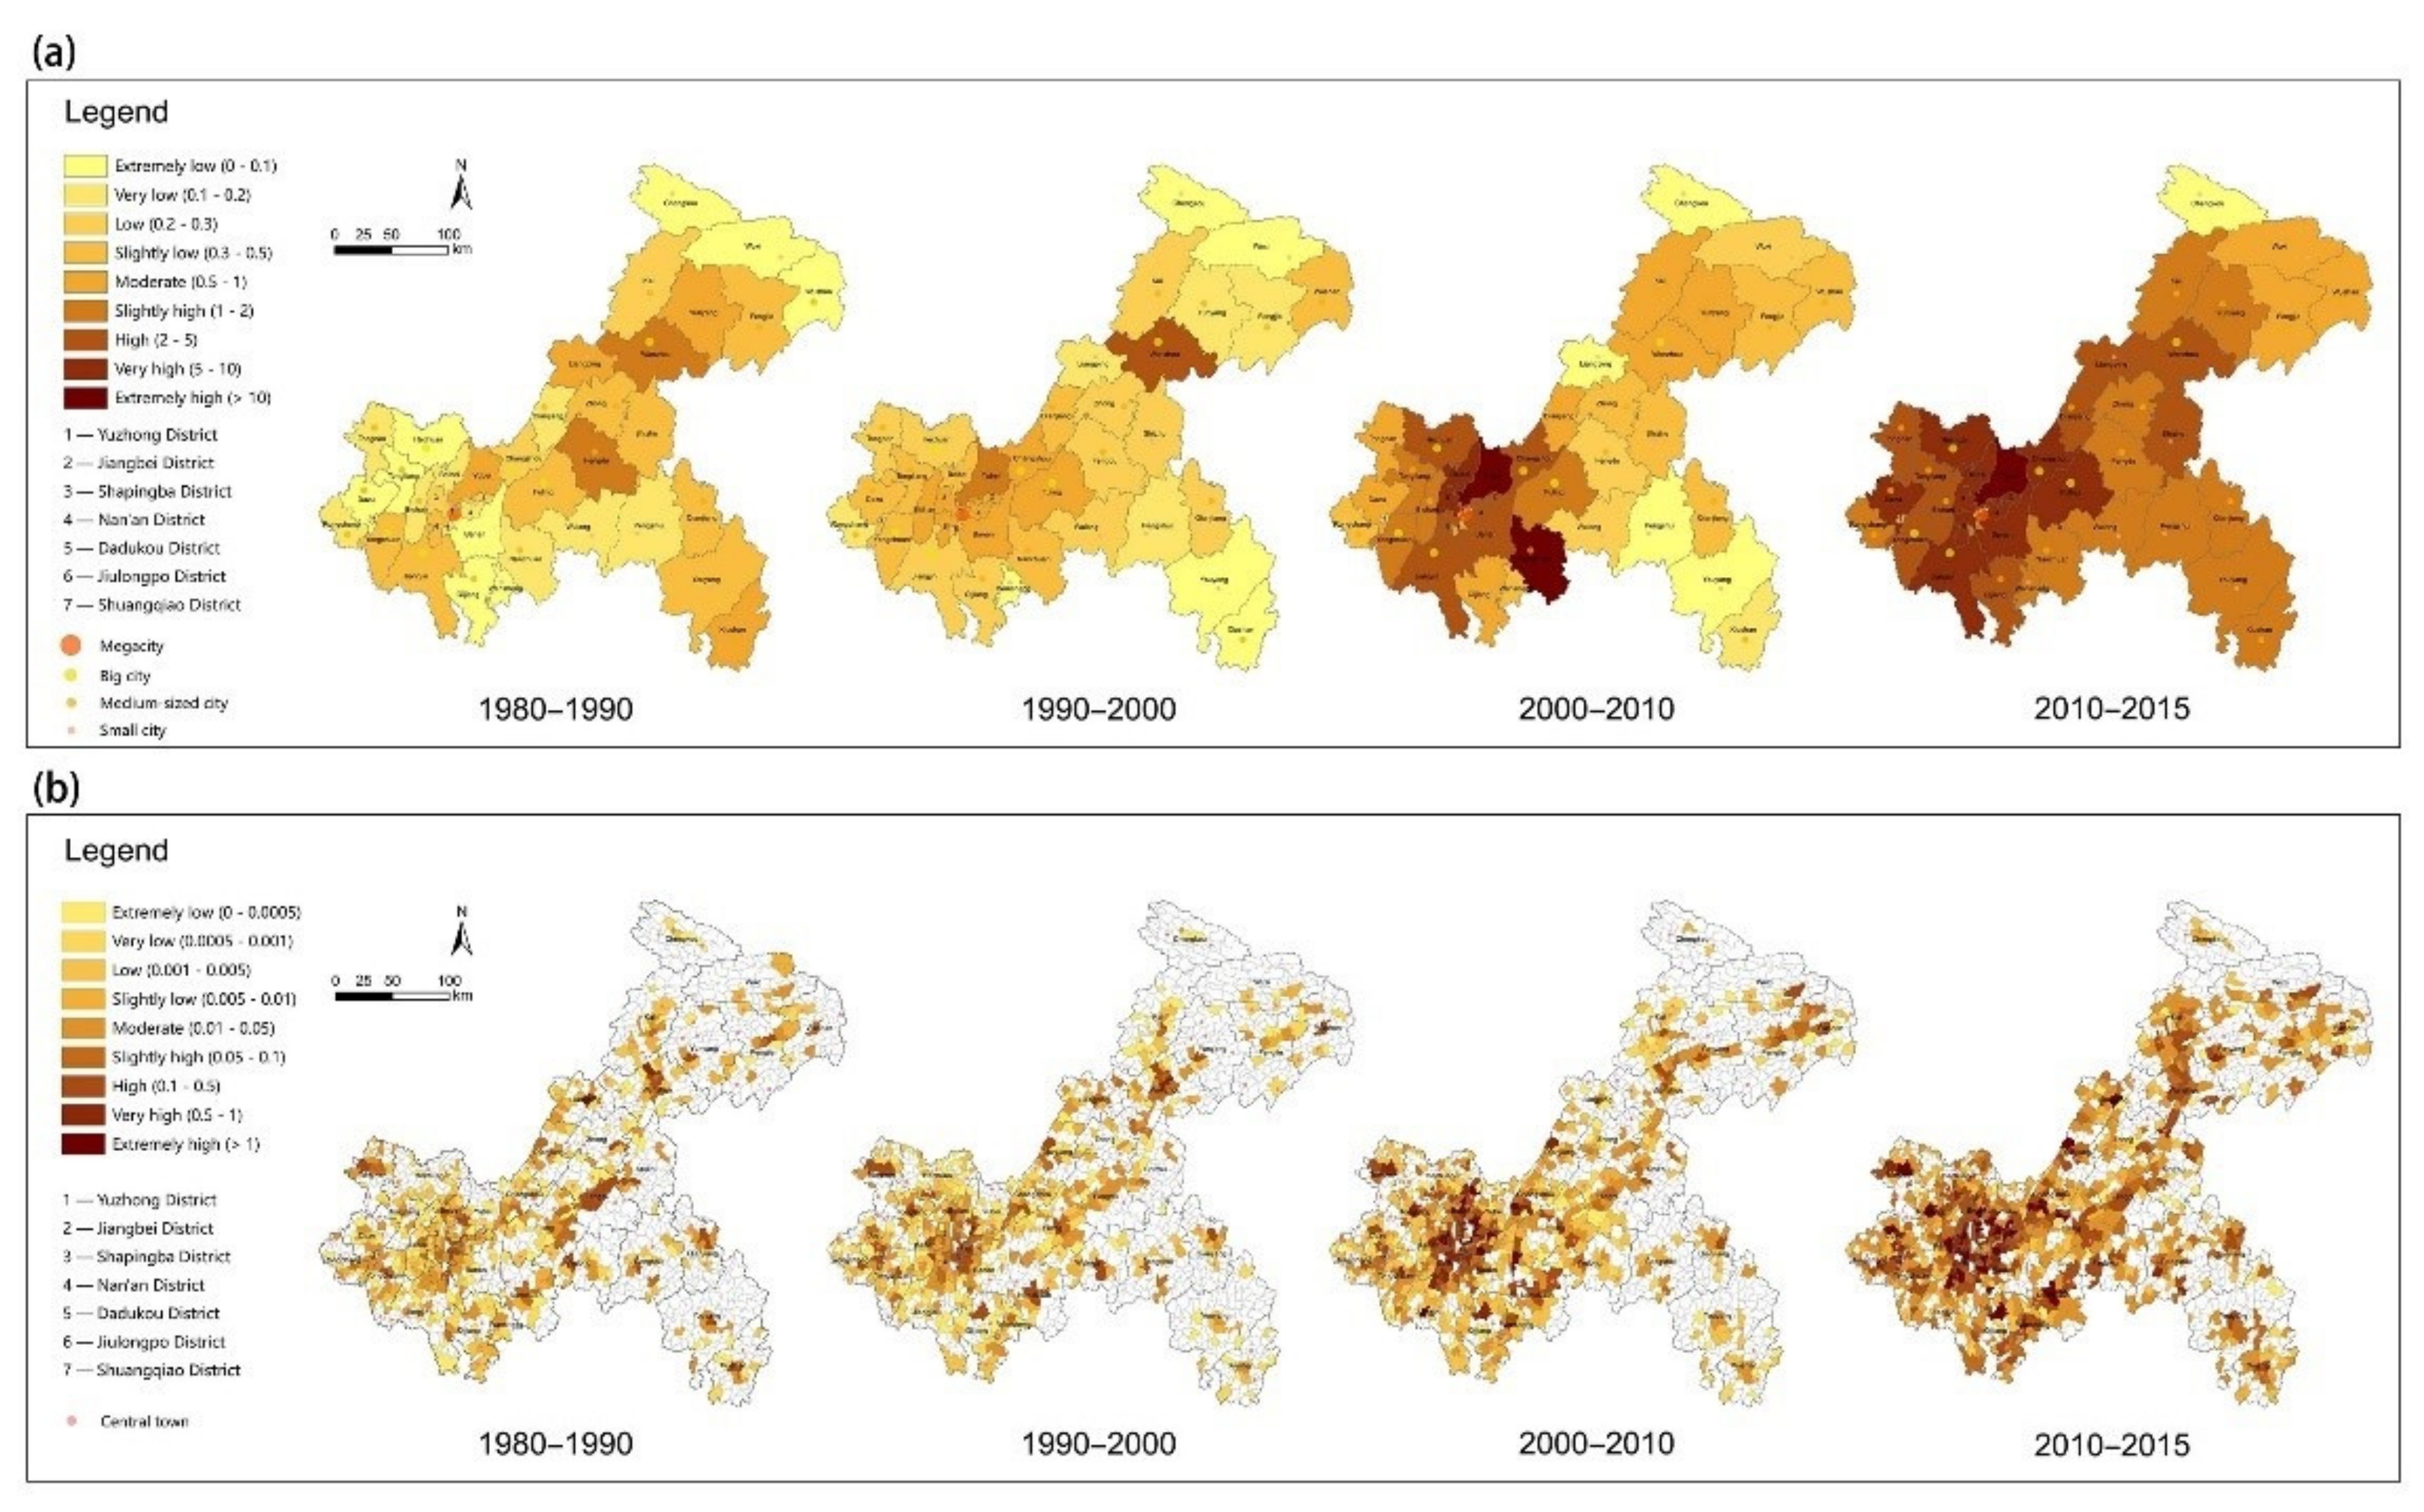
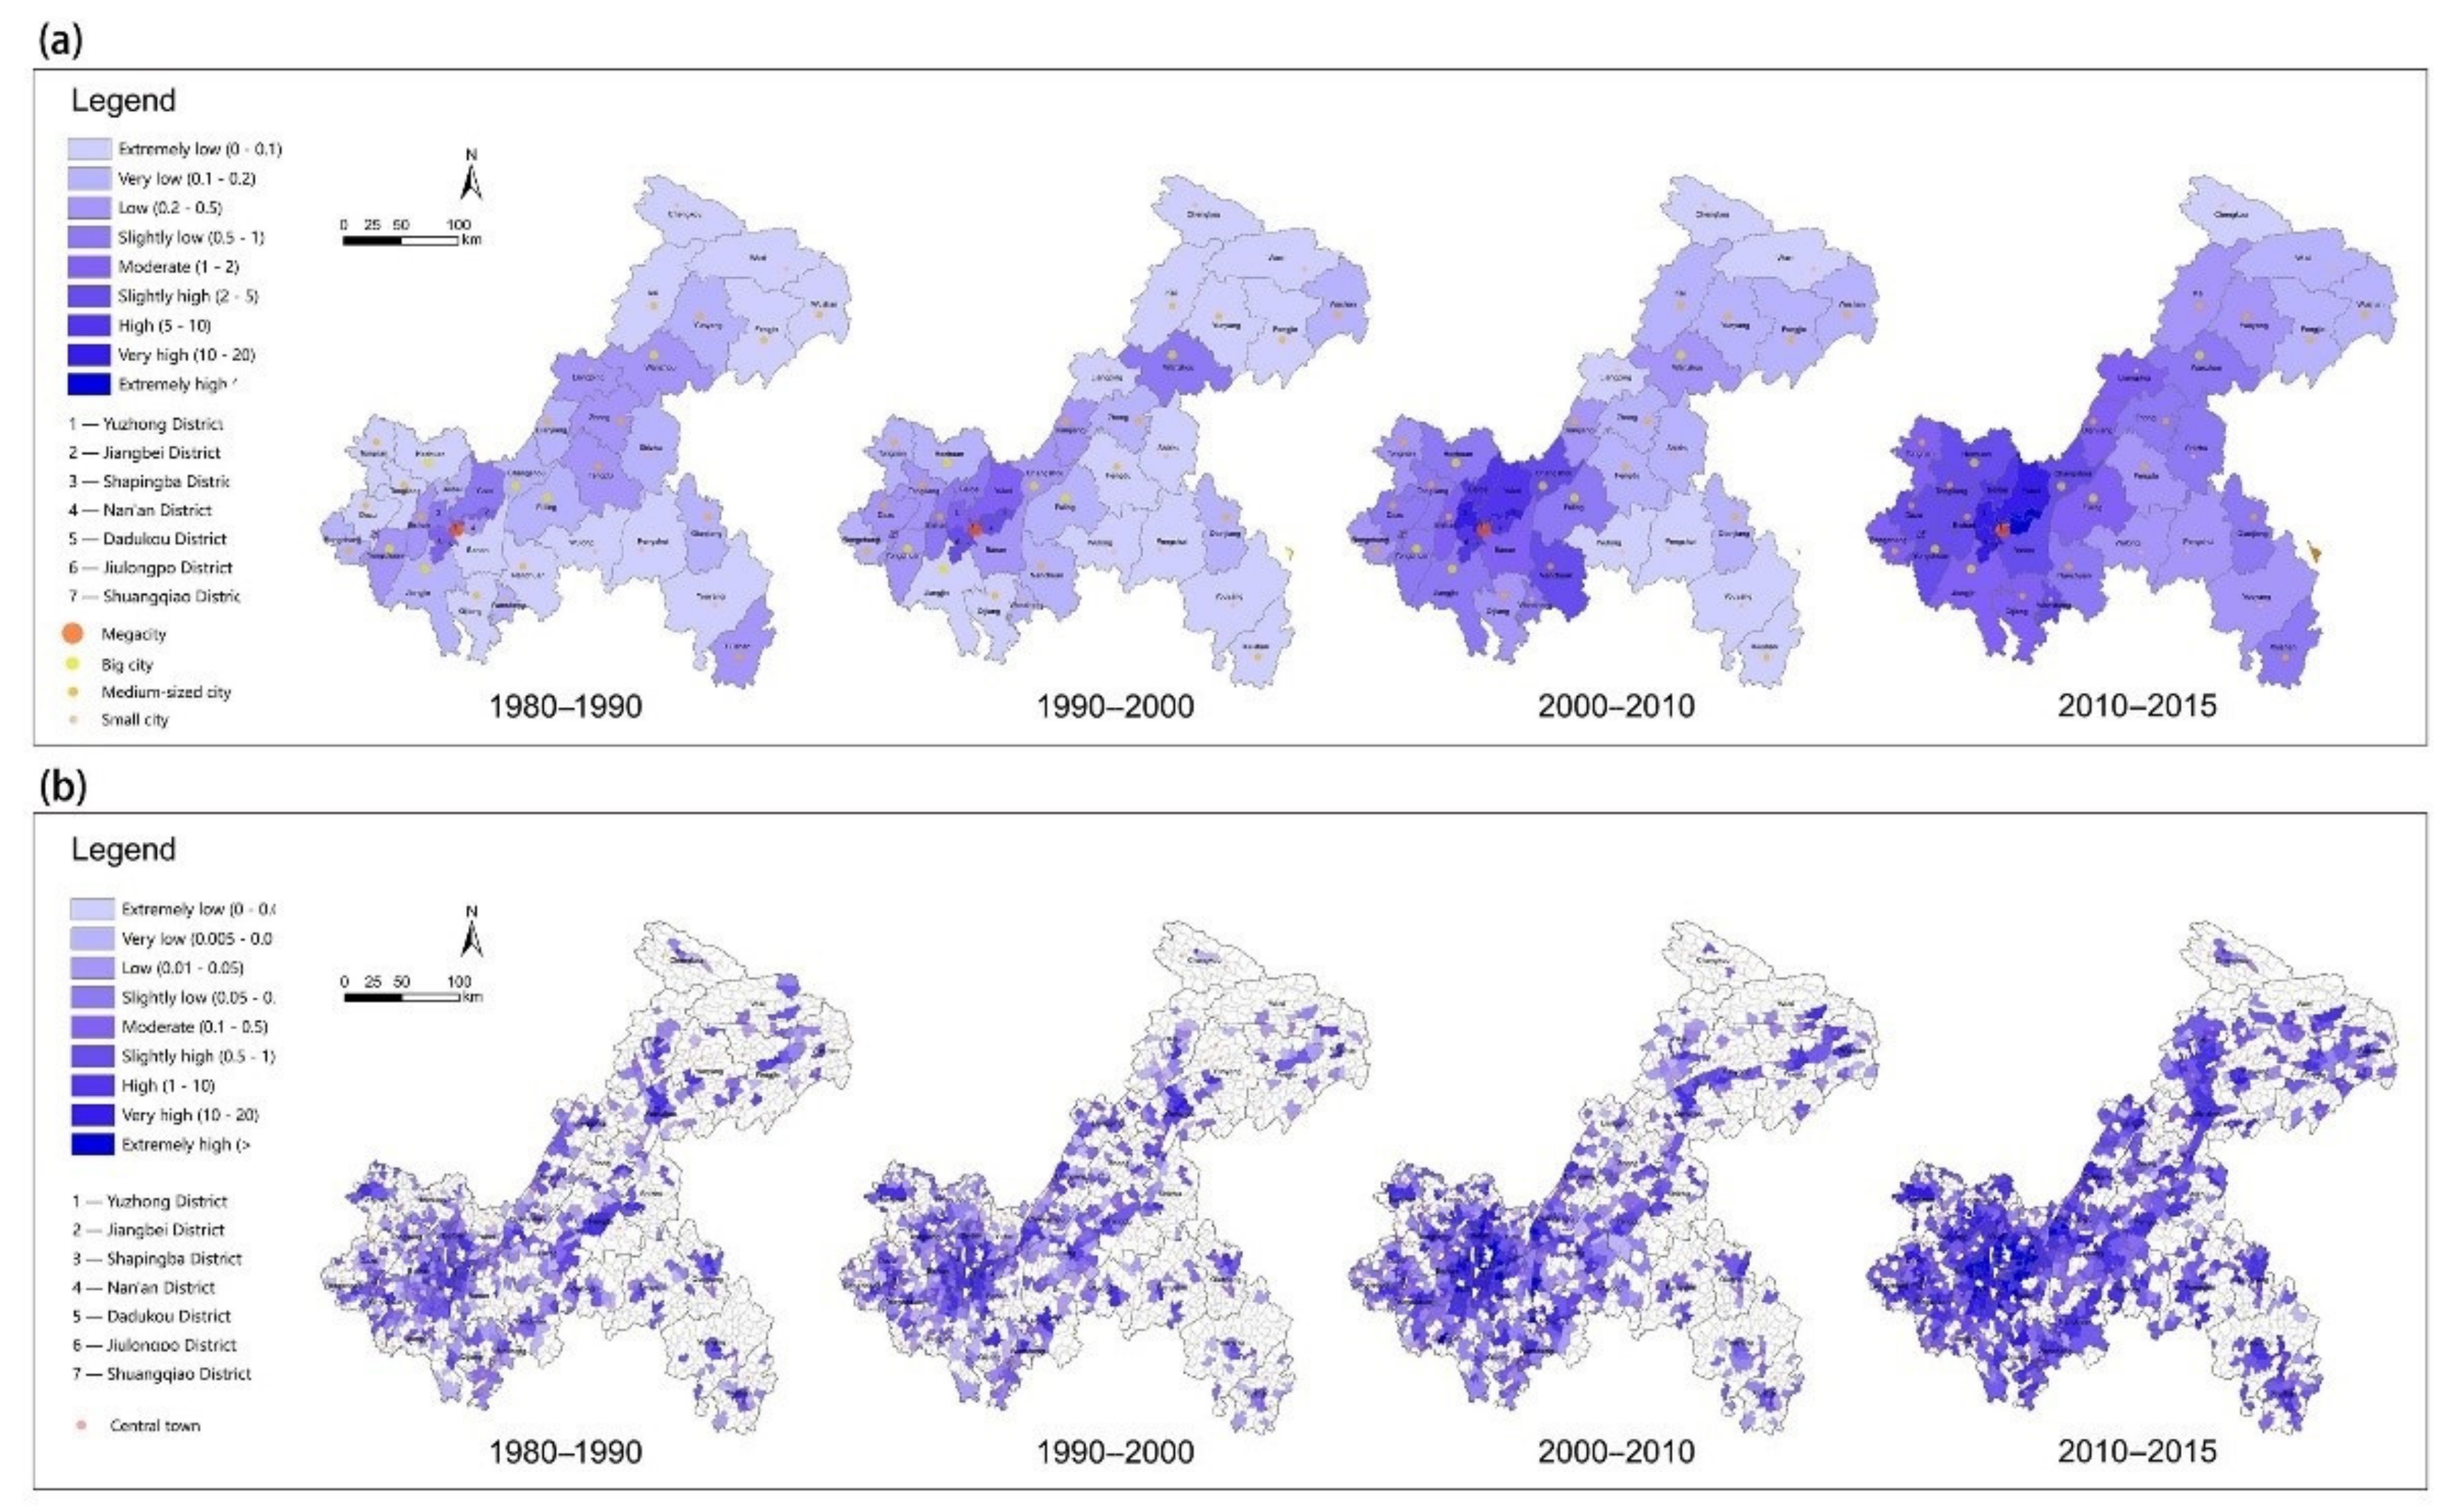
3.2. Accelerated Conversion in OHEC and Intense Change in Planned Key Nodes

Analysis of the rate and intensity of agricultural land change has revealed an accelerated conversion in OHEC and more intense changes in planned central cities and towns than in ordinary areas. The annual converted area of agricultural land to construction land increased from 1980 to 2015. In the period of 2010–2015, conversion reached the peak of 141.00 km2 per year (705.00 km2 in total). In 2000–2010, the loss speed of agricultural land also substantially reached 112.58 km2 per year (1125.80 km2 in total). The loss of agricultural land was much less notable earlier in 1980–1990 (206.03 km2) and 1990–2000 (171.84 km2). ACRs are similar to those of ACRa, reaching up to 3.74‰ in 2010–2015, 2.92‰ in 2000–2010, and much lower to 0.36% in 1990–2000 and 0.44% in 1980–1990.
MCA, the core area of OHEC, has experienced a great loss of agricultural land and distinct gains in construction land since 2000. In MCA, Yubei district alone has obtained 19.7 sq.km each year during 2010 and 2015 and 10.32 sq.km each year during 2000 and 2010 from agricultural land. Other districts in the MCA also had visible increase of construction land that transited from agricultural land: the annul transition of most districts fell between 5 to 10 sq.km each year in 2010–2015 and 205 sq.km each year in 2000–2010. The only two exceptions are Yuzhong and Dadukou, the former was fully urbanized without agricultural land and the latter’s transition area was merely around 1 sq.km each year from 2000 to 2015. During 2000–2010, the loss speed of agricultural land notably reached 112.58 km2 per year (1125.80 km2 in total) where 62.72% was converted to construction land, most of the conversion happened in the OHEC. At the metropolitan scale, loss of agricultural land was much less common but was still notable in earlier times during 1980–1990 (206.03 km2) and 1990–2000 (171.84 km2), when around 59.3% and 94.4% were converted to construction land.
Mapping of ACRa shows contrasted spatial patterns between the two wings and OHEC (Figure 5). At the district and county scale, districts in OHEC generally had more conversion than the those in NW and SW. Jiangbei, Nan’an, Jiulongpo, Shapingba, Yubei and Dadukou in the MCA are top six districts experiencing over 1% conversion rate per year during 2010 and 2015, and the conversion during the rest period is also notable. In 1990–2000 and 2000–2010, almost all the districts and counties have lost agricultural land which transited to construction land, yet four most remote rural counties located in two wings—Chengkou, Shizhu Youyang, and Xiushan—slightly gained agricultural land. At the town and village scale, in the two wings area, actual conversion of arable land to construction land only happened in a few towns and villages where far more towns and villages (with no colors inside) barely grew. For instance, Chengkou, the furthest county 334 km away from the central city of Chongqing, only had few towns/villages, e.g., Gaoyan town, Fuxing street, and Longtian village, that gained construction land at the expense of agricultural land during the 35 years. At the town/village level, as construction seldom happened in many places, some of the intensity values denote zero. Mapping of ALCI revealed a similar pattern to that of ACRa (Figure 6). Areas experiencing extremely high conversion intensity were streets in the MCA, especially during 2010–2015 and 2000–2010. Areas of nil growth are primarily distributed in the two wings, where only a few significant towns and villages around the county center had visible growth. In addition, if one were to compare both maps of ACRa and ALCI with the planned urban system planning in the Chongqing master plan (2007–2020) (Figure 5 and Figure 6), one can find that after the 1990s, the more significant the cities or towns that were planned, the more intensely the agricultural land changed. That is, the planned key nodes, viz. the mega/big/medium sized cities and central towns, generally experienced greater loss of agricultural land, and this was especially true during 2010 and 2015.

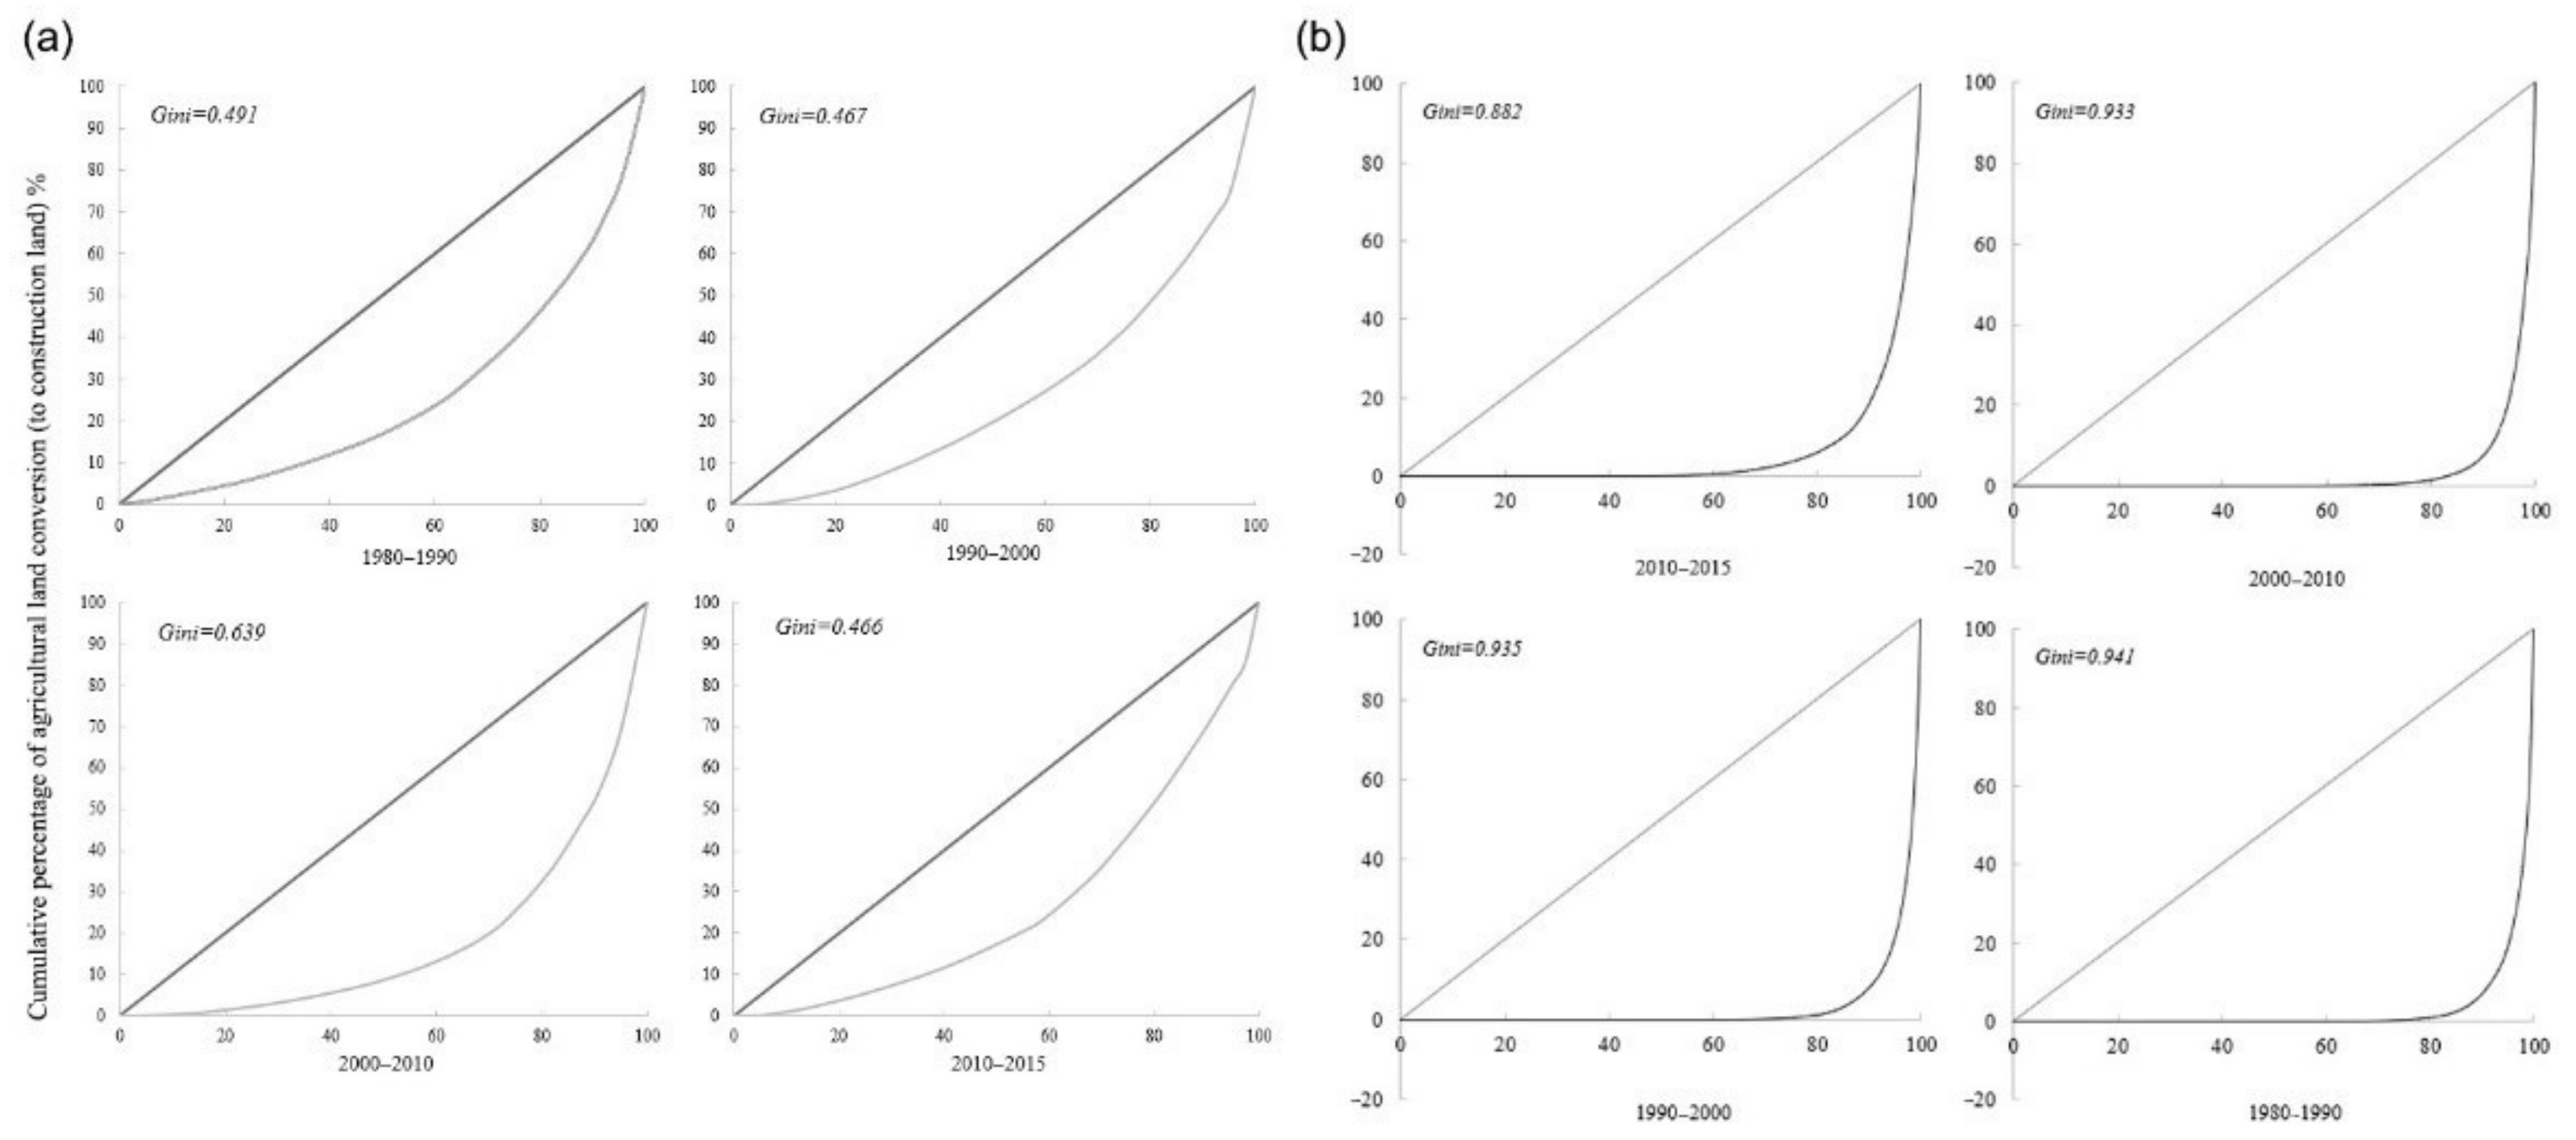
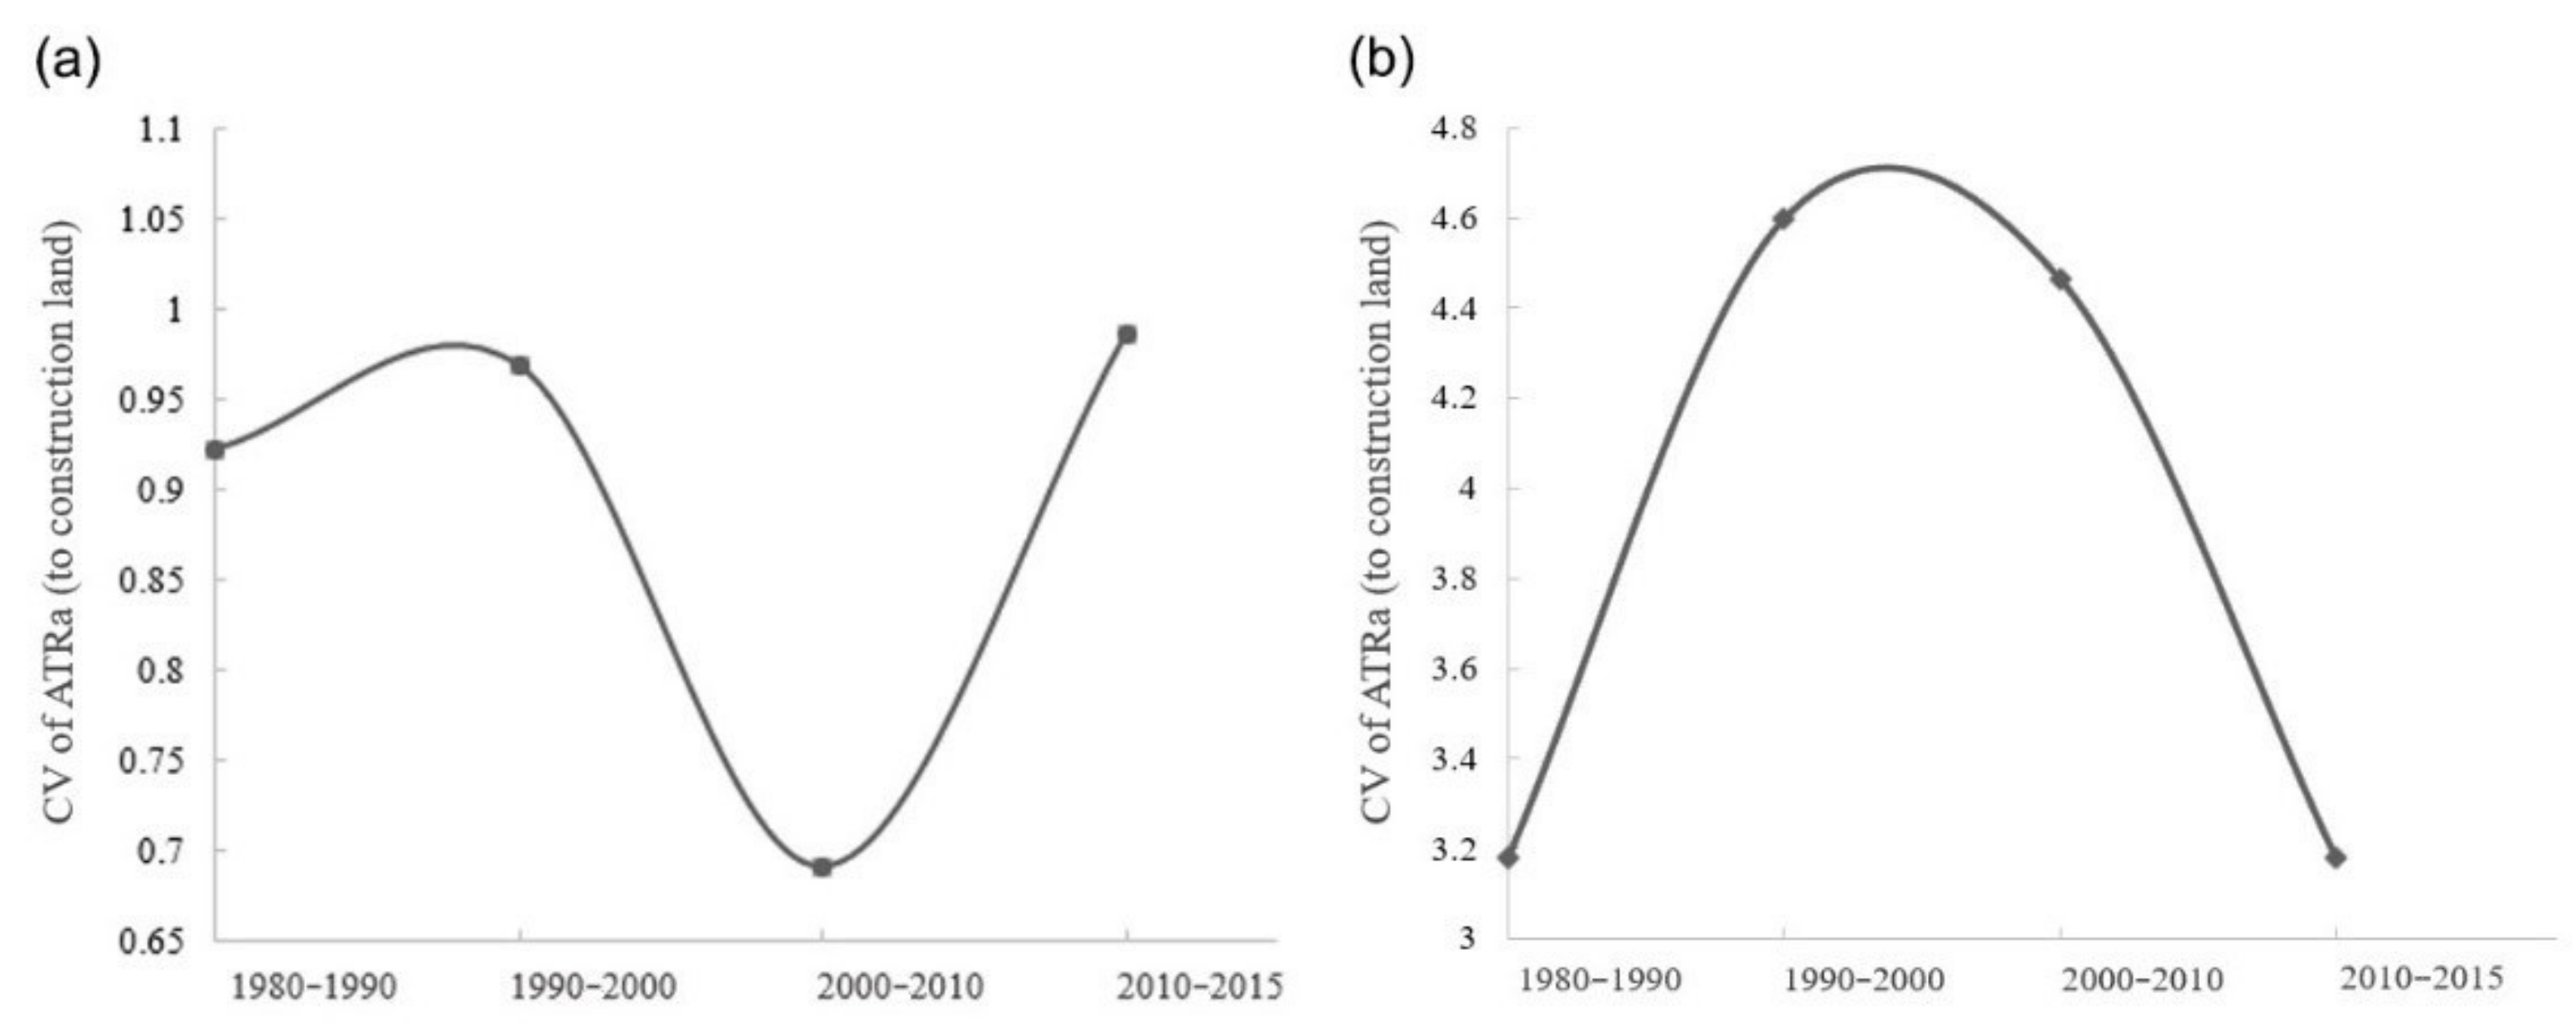
3.3. Disequilibrium at Town/Village Scale Far Outweighed That at District/County Scale

The measurement of the equilibrium degree of agricultural land change quantitatively revealed that spatial distribution of conversion from agricultural land to construction has been much more uneven at the town/village scale than that at the district/county scale. As Gini coefficients and CV are permutationally invariants where the same value may tell very different, either dispersed or agglomerated, spatial patterns, Figure 5 and Figure 6 serve as the base maps for analysis in this section. Gini coefficients unveiling the absolute extent of spatial distribution of the agricultural transition to construction land are calculated to advance the recognition of spatiotemporal variation. This calculation is conducted at two scales: the county/district level and the town/village level. During 1980–1990, 1990–2000, 2000–2010, and 2010–2015, values of Gini coefficients were 0.941, 0.935, 0.933, and 0.882 based on town/village spatial units and were 0.491, 0.467, 0.639 and 0.466 based on county/district spatial units. The results indicate that a prominent uneven distribution of agricultural land uses s transition to construction land in four periods in Chongqing, with Gini coefficients in all four periods surpassing 0.46 at all scales. Yet, it also reveals that the transitions from agricultural land to construction land at the town/village level are much more unequal than those at the county/district level. As shown by the Lorenz Curve (Figure 7), trends of spatial unevenness of agricultural land use transition to construction land are different between the two scales. At the county/district level, spatial inequality was most obvious in 2000–2010 with Gini coefficient reaching 0.639 but at the town/village level, the most uneven period was 2010–2015 with the Gini coefficient as high as 0.941 at that time.
Calculation of CV (Figure 8) reveals a similar result as the Gini coefficients. During 1980–1990, 1990–2000, 2000–2010, and 2010–2015, the obtained values of CVs are 3.181, 4.465, 4.597, and 3.181 based on town/village spatial units and are 0.923, 0.969, 0.691, and 0.987 based on county/district spatial units. With all the CV scores surpassing 0.65, an unbalanced transition of agricultural land to construction land was uncovered. The lowest value of CVs was in 2000–2010 at the county/district level (0.69), implying that underwent a relatively balanced transition of agricultural land to construction land during this time period. From 1980 to 2015, the county/district level CVs score is much lower than the town/village level CVs score and the two scaled CVs exhibited a quite different trend. The imbalance of agricultural land use transition to construction land reached the highest level in 2010–2015 at the county/district level, with a CV of 0.99, and in 1990–2000 at the town/village level, with a CV of 4.59.

4. Conclusions and Discussion

The study endeavored to develop a multiscale understanding of how and why agricultural land converted to construction land (Table 3). Through the case of Chongqing, the study unveiled that:
(1) From 1980 to 2015, a large amount of agricultural land was lost and primarily converted to construction land; in the meantime, an inflow of agricultural land also happened occasionally, mainly from grassland and forests;
(2) Such a conversion has accelerated and is most visible in the OHEC area, especially the MCA, and intensity of the conversion exhibits a similar spatial pattern;
(3) Calculation of Gini coefficients indicated a highly unequal distribution of agricultural land transitioning to construction land in four periods in Chongqing, with scores in all periods exceeding 0.46 at both scales. Yet, it also revealed that the transition from agricultural land to construction land at the town/village level is much more unequal than at the county/district level, reflecting the inherently uneven spatial patterns of agricultural land use transition within different counties or districts.
From a national perspective, Chongqing’s agricultural land change displays distinctive patterns and has been steered and influenced by both macro and local policies related to rural-urban transformation, which are discussed below.

4.1. Comparing Agricultural Land Change in Chongqing with Other Areas

Results of analysis on agricultural land change in Chongqing displayed a distinctive pattern compared with its counterparts, losing agricultural land faster than the national average. Since the 1990s, the agricultural land area has been relatively stable in China, with a slight increase from 1.77 million km2 to 1.79 million km2 that occurred until 2015 [50]. Yet, different from the nation’s annual increase rate of 0.03%, Chongqing’s agricultural land was reduced by 1970.2 km2, while the annual decrease rate was 5.0% in the same period. In particular, the nation has gained 2.8 million km2 of agricultural land in 1990–2000, while Chongqing has lost 140.06 km2 in the meantime. It is worth noting that the increased agricultural land was mainly in northwest basin plateau areas such as the northern Tarim Basin, Junggar Basin, and Yili River Valley Plain etc., while in highly urbanized areas such as the Pearl River Delta, even more agricultural land was lost, with a decrease by 1432.65 km2 or 9.5% in 1990–2000 [51]. As the east coastal area has a higher urbanization rate and a more advanced economy, the middle Yangtze River agglomeration and its cities are often considered to be more comparable with Chongqing-Chengdu agglomeration and Chongqing than those developed areas. Research on agricultural land changes in the middle Yangtze River shows that 8075.0 km2 of arable land was lost and a comparable decrease rate of 4.5% took place in 1990–2015, which mostly happened in Wuhan, Changsha, and Nanchang [42]. Yet, the disequilibrium degree of the agricultural land change was higher in the middle Yangtze River area than that in Chongqing. For example, when calculated at the district/county scale, the Gini coefficient in the former was 0.60 in 1990–2015, while those in Chongqing were 0.467, 0.639, and 0.466 in 1990–2000, 2000–2010, and 2010–2015, respectively; throughout all periods in 1990–2015, values of CV were around 1.5 or larger in the former, while those in Chongqing were smaller than 1.0 in all of the periods.
However, these studies acknowledge that as areas of the statistical units are often very large at national or regional scales, values of the proposed indexes within the divided unit can hardly reveal the characteristics of agricultural land changes at lower scales for these areas [17,19,42,50]. Scholars call for more in-depth studies at lower scales to further explore the change of agricultural land, which this research complements.

4.2. Major Policies Influencing Chongqing’s Agricultural Land Change

Conversion of agricultural land to construction land in Chongqing is inseparable from the city’s several milestone policies. During 1980 and 1990, Chongqing remained subordinate to Sichuan province, while nowadays most of the two wings areas are extremely poverty-stricken counties under the jurisdiction of Sichuan. The urbanization process was slow, as was the transition of agricultural land to construction land. In addition, the proposed “converting agricultural land to forest” policy implemented in the late 1990s has facilitated reforestation from agricultural land, which was eminently observed in 2000–2010.
Since 1999, Chongqing ushered in a period of great transformation due to the initiation of a national campaign, i.e., the West Development Strategy, with the aim of minimizing regional disparities and strengthening territorial unity [52]. The transition of agricultural land to construction land, therefore, is more visible during that time than in the earlier period. During this period, one of the most notable macro policies for Chongqing’s rural-urban transformation was the national-level comprehensive reform experimental zones (CREZs) for coordinating urban and rural development, which was launched in 2007. A CREZ is a pilot region that allows for innovative policies and practices to minimize the distance between urban and rural developments, thus enhancing people’s well-being. Quite related to the transition of agricultural land to construction land in the CREZ policy package is the land-bill (dipiao) system reform which aims to benefit rural villagers in the course of urban development.
The land-bill system is an explorative exercise in the conventional land-conveyance model whereby villagers are compensated for the transition of agricultural land at prices far below potential market value once the land is developed. The land-bill system is guided by a tightened land-use policy in Chongqing; this policy aims for a future increase in urban construction land to be granted based on the amount of non-agricultural land returned for arable lands (Land development in China is under strict surveillance by the central government, which states that rural-to-urban land transfers must not appropriate additional arable lands. In October 2005, the Ministry of Land and Resources issued “an opinion on regulating the experiment of associating the increase in land use for urban development with the decrease in non-agricultural land use for rural development” (chengxiang jianshe yondi zengjian guagou), with a view to protect the amount of arable lands). Land bills are in essence new quotas for construction land generated by the restoration of rural residential plots as agricultural land. It frees the fragmented, small scale family based rural land to be urbanized and adds the quotas of construction land in dense areas such as the MCA. The conversion of the homesteads and the residential plots to agricultural land under the incentive of land bill helps concentrate rural dwellers by “elevating” the villagers into high-rise apartments. This step helps rural villagers adapt to an urban life style. Rehoused rural villagers become a potential labor force for urban industries, and urban employment helps accelerates their change of identity as a farmer. The land-bill transactions also bring increased income to rural villagers and help them become better off. In Chongqing, by June 2016, the accumulated returns totaled 35 billion RMB. This partly explains why the transition of agricultural land to construction land after 2010 has become so intense and manages to offset the unbalanced and polarized development in Chongqing.
The pursuit of spatial egalitarianism against uneven spatiality is rewarding. Yet, as China remains far from achieving agricultural mechanization, the loss of its rural workforce is detrimental to agricultural productivity and is likely to harm the cornerstone of food security and rural sustainability. In other words, without agricultural modernization and mechanization, sustainable conversion of agricultural land into construction land is difficult to achieve.
In sum, for a long time, Chongqing has acted as a focal point for administrative restructuring and territorial development, with a particular emphasis on urban-rural integration and the wellbeing of rural villagers. The rural-urban transformation, exemplified by the transition of agricultural land to construction land, properly displays the effects of a focused spatial ability of the state to fulfill the tasks of addressing inequality. The process captures a more ambitious picture of urban-rural integration to free up rural land for “optimally sized” family farms [53].

Author Contributions

Conceptualization, L.L.; methodology, L.L. and Z.Q.; formal analysis, L.L.; data curation, Z.Q. and L.L.; writing—original draft preparation, L.L.; writing—review and editing, L.L., Z.Q., S.X. and D.Y.; visualization, L.L. and Z.Q.; supervision, L.L.; funding acquisition, D.Y. All authors have read and agreed to the published version of the manuscript.

Funding

This research has been supported by the National Key R&D Program of China [Grant Number 2019YFD1100801].

Institutional Review Board Statement

Not applicable.

Informed Consent Statement

Not applicable.

Data Availability Statement

The data presented in this study are not publicly available and can be requested from the corresponding author.

Acknowledgments

The authors wish to thank the research student Lie WANG for helping with preparing the figures.

Conflicts of Interest

The authors declare no conflict of interest.

Abbreviations

ACRaannual conversion rate
ACRsstandardized annual conversion rate
ALCIintensity index of agricultural land conversion to construction land
CREZsnational-level comprehensive reform experimental zones
CVcoefficient of variation
LULCland use/land cover
MCAmain city area
NWnortheast wing
OHECone-hour economic circle
ROHECrest of one-hour economic circle
SWsoutheast wing

References

  1. Rounsevell, M.D.A.; Pedroli, B.; Erb, K.-H.; Gramberger, M.; Busck, A.G.; Haberl, H.; Kristensen, S.; Kuemmerle, T.; Lavorel, S.; Lindner, M.; et al. Challenges for land system science. Land Use Policy 2012, 29, 899–910. [Google Scholar] [CrossRef]
  2. Verburg, P.H.; Erb, K.H.; Mertz, O.; Espindola, G. Land System Science: Between global challenges and local realities. Curr. Opin. Environ. Sustain. 2013, 5, 433–437. [Google Scholar] [CrossRef] [PubMed] [Green Version]
  3. Sun, Z.; You, L.; Muller, D. Synthesis of agricultural land system change in China over the past 40 years. J. Land Use Sci. 2019, 13, 473–479. [Google Scholar] [CrossRef] [Green Version]
  4. Haines-Young, R. Land use and biodiversity relationships. Land Use Policy 2009, 26, S178–S186. [Google Scholar] [CrossRef]
  5. Kuemmerle, T.; Erb, K.; Meyfroidt, P.; Müller, D.; Verburg, P.H.; Estel, S.; Haberl, H.; Hostert, P.; Jepsen, M.R.; Kastner, T. Challenges and opportunities in mapping land use intensity globally. Curr. Opin. Environ. Sustain. 2013, 5, 484–493. [Google Scholar] [CrossRef]
  6. Peerzado, M.B.; Magsi, H.; Sheikh, M.J. Land use conflicts and urban sprawl: Conversion of agriculture lands into urbanization in Hyderabad, Pakistan. J. Saudi Soc. Agric. Sci. 2019, 18, 423–428. [Google Scholar] [CrossRef]
  7. Roeffen, B.; Czapiewska, K.M.; Graaf, R.E.D.; Zanon, B.D.B. Reducing global land scarcity with floating urban development and food production. In Proceedings of the International Water Week, Amsterdam, Netherlands, 5–6 November 2013. [Google Scholar]
  8. Hu, Q.; Wu, W.; Xiang, M.; Chen, D.; Long, Y.; Song, Q.; Liu, Y.; Lu, M.; Yu, Q. Spatio-Temporal Changes in Global Cultivated Land over 2000–2010. Sci. Agric. Sin. 2018, 51, 1091–1105. (In Chinese) [Google Scholar]
  9. Lepers, E.; Lambin, E.F.; Janetos, A.C.; Defries, R.; Achard, F.; Ramankutty, N.; Scholes, R.J. A synthesis of information on rapid land-cover change for the period 1981–2000. BioScience 2005, 55, 115–124. [Google Scholar] [CrossRef]
  10. Zhang, L.; Yao, Z.; Tang, S.; Li, X.; Hao, T. Spatiotemporal characteristics and patterns of the global cultivated land since the 1980s. Acta Geogr. Sin. 2017, 72, 1235–1247. [Google Scholar]
  11. Ramankutty, N.; Foley, J.A. Estimating historical changes in global land cover: Croplands from 1700 to 1992. Glob. Biogeochem. Cycles 1999, 13, 997–1027. [Google Scholar] [CrossRef]
  12. Liu, X.; Huang, Y.; Xu, X.; Li, X.; Zeng, Z. High-spatiotemporal-resolution mapping of global urban change from 1985 to 2015. Nat. Sustain. 2020, 3, 564–570. [Google Scholar] [CrossRef]
  13. Friedmann, J. China’s Urbanization. Int. J. Urban Reg. Res. 2003, 27, 745–758. [Google Scholar] [CrossRef]
  14. Liu, X.; Pei, F.; Wen, Y.; Li, X.; Liu, Z. Global urban expansion offsets climate-driven increases in terrestrial net primary productivity. Nat. Commun. 2019, 10, 5558. [Google Scholar] [CrossRef] [Green Version]
  15. Song, X.-P.; Hansen, M.C.; Stehman, S.V.; Potapov, P.V.; Tyukavina, A.; Vermote, E.F.; Townshend, J.R. Global land change from 1982 to 2016. Nature 2018, 560, 639–643. [Google Scholar] [CrossRef]
  16. Schulpa, C.J.E.; Levers, C.; Kuemmerle, T.; Tieskens, K.F.; Verburg, P.H. Mapping and modelling past and future land use change in Europe’s cultural landscapes. Land Use Policy 2019, 80, 332–344. [Google Scholar] [CrossRef]
  17. Long, H. Farmland Use Transition in China. In Land Use Transitions and Rural Restructuring in China; Long, H., Ed.; Springer: Singapore, 2020; pp. 31–160. [Google Scholar]
  18. Ning, J.; Liu, J.; Kuang, W.; Xu, X.; Zhang, S.; Yan, C.; Li, R.; Wu, S.; Hu, Y.; Du, G.; et al. Spatiotemporal patterns and characteristics of land-use change in China during 2010–2015. J. Geogr. Sci. 2018, 28, 547–562. [Google Scholar] [CrossRef] [Green Version]
  19. Ge, D.; Long, H.; Zhang, Y.; Ma, L.; Li, T. Farmland transition and its influences on grain production in China. Land Use Policy 2018, 70, 94–105. [Google Scholar] [CrossRef]
  20. He, C.Y.; Li, J.W.; Zhang, X.L.; Liu, Z.F.; Zhang, D. Will rapid urban expansion in the drylands of northern China continue: A scenario analysis based on the Land Use Scenario Dynamics-urban model and the Shared Socioeconomic Pathways. J. Clean. Prod. 2017, 165, 57–69. [Google Scholar] [CrossRef]
  21. Shi, L.; Liu, F.; Zhang, Z.; Zhao, X.; Liu, B.; Xu, J.; Wen, Q.; Yi, L.; Hu, S. Spatial differences of coastal urban expansion in China from 1970s to 2013. Chin. Geogr. Sci. 2015, 25, 389–403. [Google Scholar] [CrossRef]
  22. Zhou, Y.; Chen, M.; Tang, Z.; Mei, Z. Urbanization, land use change, and carbon emissions: Quantitative assessments for city-level carbon emissions in Beijing-Tianjin-Hebei region. Sustain. Cities Soc. 2021, 60, 102701. [Google Scholar] [CrossRef]
  23. Zurqani, H.A.; Post, C.J.; Mikhailova, E.A.; Schlautman, M.A.; Sharp, J.L. Geospatial analysis of land use change in the Savannah River Basin using Google Earth Engine. Int. J. Appl. Earth Obs. Geoinf. 2018, 69, 175–185. [Google Scholar] [CrossRef]
  24. Chen, J.; Gao, J.; Yuan, F.; Wei, Y. Spatial Determinants of Urban Land Expansion in Globalizing Nanjing, China. Sustainability 2016, 8, 868. [Google Scholar] [CrossRef] [Green Version]
  25. Simwanda, M.; Murayama, Y. Spatiotemporal patterns of urban land use change in the rapidly growing city of Lusaka, Zambia: Implications for sustainable urban development. Sustain. Cities Soc. 2018, 39, 262–274. [Google Scholar] [CrossRef]
  26. Alijani, Z.; Hosseinali, F.; Biswas, A. Spatio-temporal evolution of agricultural land use change drivers: A case study from Chalous region, Iran. J. Environ. Manag. 2020, 262, 110326. [Google Scholar] [CrossRef] [PubMed]
  27. Rousta, I.; Sarif, M.O.; Gupta, R.D.; Olafsson, H.; Ranagalage, M.; Murayama, Y.; Zhang, H.; Mushore, T.D. Spatiotemporal Analysis of Land Use/Land Cover and Its Effects on Surface Urban Heat Island Using Landsat Data: A Case Study of Metropolitan City Tehran (1988–2018). Sustainability 2018, 10, 4433. [Google Scholar] [CrossRef] [Green Version]
  28. Oliveira, B.R.d.; Carvalho-Ribeiro, S.M.; Maia-Barbosa, P.M. A multiscale analysis of land use dynamics in the buffer zone of Rio Doce State Park, Minas Gerais, Brazil. J. Environ. Plan. Manag. 2020, 63, 935–957. [Google Scholar] [CrossRef]
  29. Smith, N. Remaking scale: Competition and cooperation in prenational and postnational Europe. In Competitive European Peripheries; Eskelinen, H., Snickars, F., Eds.; Springer: Berlin/Heidelberg, Germany, 1995; pp. 59–74. [Google Scholar]
  30. Lu, D.; Li, G.; Moran, E.; Hetrick, S. Spatiotemporal analysis of land-use and land-cover change in the Brazilian Amazon. Int. J. Remote Sens. 2013, 34, 5953–5978. [Google Scholar] [CrossRef] [Green Version]
  31. Boeing, G. A multi-scale analysis of 27,000 urban street networks: Every US city, town, urbanized area, and Zillow neighborhood. Environ. Plan. B 2020, 47, 590–608. [Google Scholar] [CrossRef] [Green Version]
  32. Li, L. State rescaling and national new area development in China: The case of Chongqing Liangjiang. Habitat Int. 2015, 50, 80–89. [Google Scholar] [CrossRef]
  33. Chien, S.-S. New local state power through administrative restructuring—A case study of post-Mao China county-level urban entrepreneurialism in Kunshan. Geoforum 2013, 46, 103–112. [Google Scholar] [CrossRef]
  34. Zuo, L.; Zhang, Z.; Zhao, X.; Wang, X.; Wu, W.; Yi, L.; Liu, F. Multitemporal analysis of cropland transition in a climatesensitive area: A case study of the arid and semiarid region of northwest China. Reg. Environ. Chang. 2014, 14, 75–89. [Google Scholar] [CrossRef]
  35. Zhong, T.; Qian, Z.; Huang, X.; Zhao, Y.; Zhou, Y.; Zhao, Z. Impact of the top-down quota-oriented farmland preservation planning on the change of urban land-use intensity in China. Habitat Int. 2018, 77, 71–79. [Google Scholar] [CrossRef]
  36. Long, H. Land use transitions and land management: A mutual feedback perspective. Land Use Policy 2018, 74, 111–120. [Google Scholar] [CrossRef]
  37. Lin, J.Y. The Household Responsibility System in China’s Agricultural Reform: A Theoretical and Empirical Study. Econ. Dev. Cult. Chang. 2000, 36, 199–224. [Google Scholar] [CrossRef]
  38. Tan, S.; Heerink, N.; Qu, F. Land fragmentation and its driving forces in China. Land Use Policy 2006, 23, 272–285. [Google Scholar] [CrossRef]
  39. Cui, Z. Partial intimations of the coming whole: The Chongqing experiment in light of the theories of Henry George, James Meade, and Antonio Gramsci. Mod. China 2011, 37, 646–660. [Google Scholar] [CrossRef] [Green Version]
  40. Naughton, B.J. Holding China together: Diversity and national integration in the post-Deng era. In The Western Development Program; Naughton, B.J., Yang, D.L., Eds.; Cambridge University Press: Cambridge, UK, 2004; pp. 1–25. [Google Scholar]
  41. Xu, Y.; Yu, L.; Peng, D.; Zhao, J.; Cheng, Y.; Liu, X.; Li, W.; Meng, R.; Xu, X.; Gong, P. Annual 30-m land use/land cover maps of China for 1980–2015 from the integration of AVHRR, MODIS and Landsat data using the BFAST. Sci. China Earth Sci. 2020, 63, 1390–1407. [Google Scholar] [CrossRef]
  42. Li, Q.; Hu, S.; Qu, S. Spatiotemporal characteristics of cultivated land use transition in the Middle Yangtze River from 1990 to 2015. Geogr. Res. 2017, 36, 1489–1502. [Google Scholar]
  43. Long, H.; Tang, G.; Li, X.; Heilig, G.K. Socio-economic driving forces of land-use change in Kunshan, the Yangtze River Delta economic area of China. J. Environ. Manag. 2007, 83, 351–364. [Google Scholar] [CrossRef]
  44. Xian, S.; Li, L.; Qi, Z. Toward a sustainable urban expansion: A case study of Zhuhai, China. J. Clean. Prod. 2019, 230, 276–285. [Google Scholar] [CrossRef]
  45. Aldwaik, S.Z.; Pontius, R.G. Intensity analysis to unify measurements of size and stationarity of land changes by interval, category, and transition. Landsc. Urban Plan. 2012, 106, 103–114. [Google Scholar] [CrossRef]
  46. Zhou, P.; Huang, J.; Pontius, R.G.; Hong, H. Land classification and change intensity analysis in a coastal watershed of southeast China. Sensors 2014, 14, 11640–11658. [Google Scholar] [CrossRef] [PubMed] [Green Version]
  47. Huang, J.; Pontius, R.G.; Li, Q.; Zhang, Y. Use of intensity analysis to link patterns with processes of land change from 1986 to 2007 in a coastal watershed of southeast China. Appl. Geogr. 2012, 34, 371–384. [Google Scholar] [CrossRef]
  48. Fellman, J. Estimation of Gini Coefficient using Lorenz curves. J. Stat. Econom. Methods 2012, 1, 31–38. [Google Scholar]
  49. Li, L.; Qi, Z.; Xian, S. Decoding spatiotemporal patterns of urban land sprawl in Zhuhai, China. Appl. Ecol. Environ. Res. 2020, 18, 913–927. [Google Scholar] [CrossRef]
  50. Cheng, W.; Gao, X.; Ma, T.; Xu, X.; Chen, Y.; Zhou, C. Spatial-temporal distribution of cropland in China based on geomorphological regionalization during 1990–2015. Acta Geogr. Sin. 2018, 73, 1613–1629. [Google Scholar]
  51. Cao, X.; Ma, L.; Yan, T. Spatial relationship between transporation and land-use in Pearl River Delta. Sci. Geogr. Sin. 2007, 27, 743–748. [Google Scholar]
  52. Lai, H.H. China’s western development program: Its rationale, implementation, and prospects. Mod. China 2002, 28, 432–466. [Google Scholar] [CrossRef]
  53. Huang, P.C. Chongqing: Equitable development driven by a “Third Hand”? Mod. China 2011, 37, 569–622. [Google Scholar] [CrossRef]
1
Spatial units for statistics are based on administrative divisions and adjustments after Chongqing upgraded to be a municipality directly administered by the central government.
2
Scale 1, Scale 2, Scale 3, and Scale 4 in this table refer to the four scales in Figure 2.
Figure 1. (a) Location of Chongqing in China; (b) Chongqing metropolis and its spatial structure.
Land 10 00275 g001
Figure 2. The multiscale administration framework of Chongqing. Source: edited by the authors.
Land 10 00275 g002
Figure 3. Evolution of Chongqing’s spatial development strategy: (a) the “Three Economic Zones” (3EZs) strategy; (b) the “Partition of Four Economic Zones (2003–2020)” strategy; (c) the “one circle, two wings” spatial strategy. Source: Chongqing Master Plans (1996–2020, 2003–2020, 2007–2020, 2011 revision); edited by the authors.
Land 10 00275 g003
Figure 4. LULC maps in Chongqing (1980, 1990, 2000, 2010, 2015). Source: edited by the authors.
Land 10 00275 g004
Figure 5. Spatiotemporal distribution of ACRa at the (a) district/county level and (b) town/village level in Chongqing (1980–2015).
Land 10 00275 g005
Figure 6. Spatiotemporal variation of ALCI at (a) the district/county level and (b) village level in Chongqing (1980–2015).
Land 10 00275 g006
Figure 7. The Lorenz Curves of ACRa in Chongqing at (a) the county/district and (b) village level during 1980–1990.
Land 10 00275 g007
Figure 8. The CVs of ACRa in Chongqing at (a) the county/district and (b) village level during 1980–2015.
Land 10 00275 g008
Table 1. Statistics of LULC in Chongqing (unit: km2) (1980, 1990, 2000, 2010, 2015).
Land Use Types19801990200020102015
Agricultural land39,444.539,272.239,132.238,007.137,302.1
Forest30,895.530,947.030,917.331,459.031,355.4
Grass11,974.011,949.811,937.911,610.811,579.3
Waters928.0921.6920.31061.21097.8
Construction land427.1578.5761.61534.82338.5
Unused land18.318.218.014.414.2
Table 2. Source and flow of agricultural land changes in Chongqing during 1980–1990, 1990–2000, 2000–2010, and 2010–20151 (km2).
Time PeriodFlow of ConversionTotalForestsGrasslandWatersBuilt-Up LandUnused Land
1980–1990Conversion to agricultural landValue (km2)33.8323.327.510.942.060.00
A L g a i n   i , j (%)100.00068.93122.1922.7826.0960.000
Conversion from agricultural landValue (km2)206.0473.059.890.68122.400.02
A L l o s s   i , j (%)100.00035.4544.7990.33159.4060.010
Net conversionValue (km2)−172.21−49.73−2.380.26−120.34−0.02
A L N l o s s   i , j (%)100.00028.8781.382-0.15169.8780.012
1990–2000Conversion to agricultural landValue (km2)31.7822.748.480.560.000.00
A L g a i n   i , j (%)100.00071.54626.6891.7650.0000.000
Conversion from agricultural landValue (km2)171.846.151.521.91162.260.00
A L l o s s   i , j (%)100.0003.5800.8851.11094.4250.001
Net conversionValue (km2)−140.0616.596.96−1.35−162.260.00
A L N l o s s   i , j (%)100.000−11.844−4.9710.961115.8520.002
2000–2010Conversion to agricultural landValue (km2)151.3737.82112.190.500.070.79
A L g a i n   i , j (%)100.00024.98674.1190.3310.0440.521
Conversion from agricultural landValue (km2)1276.52361.73137.1471.48706.170.00
A L l o s s   i , j (%)100.00028.33710.7435.60055.3200.000
Net conversionValue (km2)−1125.15−323.86−24.95−70.98−706.100.79
A L N l o s s   i , j (%)100.00028.7882.2176.30962.756−0.070
2010–2015Conversion to agricultural landValue (km2)0.090.010.000.000.080.00
A L g a i n   i , j (%)100.0006.4942.5970.00090.9090.000
Conversion from agricultural landValue (km2)705.070.000.3219.92684.840.00
A L l o s s   i , j (%)100.0000.0000.0452.82597.1300.000
Net conversionValue (km2)−704.980.01−0.32−19.92−684.760.00
A L N l o s s   i , j (%)100.000−0.0010.0452.82597.1310.000
Table 3. A multiscale understanding of agricultural land conversion to construction land in Chongqing2.
PeriodsCharacteristics of Agricultural Land Conversion to Built-Up LandPolicy Context and Mile Stone
1980–1990Amount of the conversion Volume (km2)/ratio
  • Chongqing city remains subordinated to Sichuan province
  • Most areas in the two wings later on were poverty-stricken without clear guidelines on development or conservation.
Scale 1122.40/100%
Scale 2MCAROHECNWSW
23.8623.0755.5819.89
19.5%18.8%45.4%16.3%
(Un)evenness of spatial distribution GiniCV
Scale 30.4910.923
Scale 40.9413.181
1990–2000Amount of the conversion Volume (km2)/ratio
  • Upgrading Chongqing as the municipality directly occurred under the administration of the central government
  • The Western Development Strategy
  • Converting agricultural land to forest policy
Scale 1162.26/100%
Scale 2MCAROHECNWSW
66.6245.0240.969.57
41.1%27.8%25.2%5.9%
(Un)evenness of spatial distribution GiniCV
Scale 30.4670.969
Scale 40.9354.465
2000–2010Amount of the conversion Volume (km2)/ratio
  • Comprehensive reform experimental zones for coordinating urban and rural development
  • Land bill (dipiao) system reform
Scale 1706.14/100%
Scale 2MCAROHECNWSW
354.57296.2741.7513.55
50.2%42.0%5.9%1.9%
(Un)evenness of spatial distribution GiniCV
Scale 30.6390.691
Scale 40.9334.597
2010–2015Amount of the conversion Volume (km2)/ratio
  • Approval and establishment of Liangjiang New Area
  • National central cities in China’s urban system
Scale 1684.83/100%
Scale 2MCAROHECNWSW
44.0838.5676.3642.55
44.1%38.6%11.1%6.2%
(Un)evenness of spatial distribution GiniCV
Scale 30.4660.987
Scale 40.8823.181
Publisher’s Note: MDPI stays neutral with regard to jurisdictional claims in published maps and institutional affiliations.

