
Bird Diversity Unconsciously Increases People’s Satisfaction with Where They Live


1
Department of Biology, Carleton University, Ottawa, ON K1S 5B6, Canada
2
National Wildlife Research Centre, Environment and Climate Change Canada, Ottawa, ON K1A 0H3, Canada
3
Department of Psychology, Carleton University, Ottawa, ON K1S 5B6, Canada
*
Author to whom correspondence should be addressed.
Land 2021, 10(2), 153; https://doi.org/10.3390/land10020153
Submission received: 7 December 2020
/
Revised: 20 January 2021
/
Accepted: 21 January 2021
/
Published: 3 February 2021
(This article belongs to the Special Issue What Is Next for Urban Landscape Ecology?)
Abstract
:There is growing evidence that exposure to nature increases human well-being, including in urban areas. However, relatively few studies have linked subjective satisfaction to objective features of the environment. In this study we explore the links among objective environmental features (tree cover, water, and bird diversity) and subjective judgements of satisfaction. We surveyed residents of Ottawa, Canada (n = 1035) about their satisfaction with their local neighbourhoods. We then compared the survey responses to measures of nature near their homes, including bird diversity (number of bird species), tree canopy cover, and distance to water. After controlling for effects of income and subjective happiness, residents’ neighbourhood satisfaction was positively related to the number of bird species nearby, even before participants were prompted to consider nature. Residents’ appreciation of their local neigbourhood relative to others also increased with tree canopy cover and nearness to water. Unsolicited comments from participants following the survey indicated that while residents consciously appreciate trees and water, the relationship between bird diversity and neighbourhood satisfaction appears to be unconscious; very few of the participants mentioned birds. Based on these results, we speculate that a diverse local bird community may provoke feelings of satisfaction through their presence, activity, and songs. Our results create a compelling argument for city planners and individual residents to maintain bird-friendly spaces in urban areas.
1. Introduction
There is growing evidence that exposure to nature increases human well-being [1]. Nature is related to a variety of indicators of well-being, such as improved mood, increased cognitive function, overall general health, and life satisfaction [2,3,4,5,6,7], though these relationships can be complicated [8]. Studies have used a wide variety of measures of nature to test this relationship. These can include broad landscape features, amount of greenspace, subjective measures of “naturalness” of the environment, and subjective or objective indices of biodiversity, most commonly indexed as the number of species [9]. In addition, people’s subjective sense of attachment to nature is thought to be a robust predictor of standard well-being measures and sometimes even an indicator of well-being itself [10,11].
The link between biodiversity and well-being has typically been less studied than the link between environmental features such as greenspace and well-being [12], but there is a growing body of literature in this field [7,9,13]. Previous work suggests that the relationship between biodiversity and well-being can differ depending on whether biodiversity is objectively measured or subjectively evaluated by participants. For example, Dallimer [14] found a positive relationship between well-being and perceived biodiversity, but no relationship between well-being and measured biodiversity.
In this study, we explore the links among objective environmental features (tree cover, water, and bird diversity) across the city of Ottawa, Canada, and subjective judgements of participants’ satisfaction, a component of well-being. Understanding this relationship in an urban environment is particularly important because urban areas can be associated with lower biodiversity than rural areas, especially in many downtown core areas [15]. It is estimated that 55% of the world’s population currently lives in urban areas and this is expected to increase to 68% by 2050 [16]. Therefore, knowledge of the relationship between human well-being and natural or semi-natural elements of urban areas, especially the biodiversity in them, is important for planning healthy cities.
Many studies that measure the effect of nature on humans in cities focus on nature in public parks and gardens [4,14,17,18,19], but see White et al. [20]. For example, Fuller et al. [17] found that indicators of psychological well-being of people who visited a community garden, such as reflection, distinct identity, and place attachment, were related to plant and bird diversity. Dallimer et al. [14] found similar effects of bird diversity, but not plant diversity. In a recent study by Cameron et al. [18], participants reported being happier in parks that had greater avian diversity or a wider variety of habitats compared to lower-diversity parks.
Methods that focus on people in dedicated greenspaces could represent a biased subset of the population. For example, people whose well-being is less influenced by nature may be less likely to visit a park and would therefore be under-represented in such studies. Consistent with this, Lin et al. [21] found that a person’s nature relatedness predicted park use more than the park’s physical proximity. In addition, there are greenspaces in cities other than parks, such as private yards and tree-lined streets. As noted by Botzat et al. [12], there has been considerably less focus on the role of urban greenspace overall, but suggestive findings do exist. Houlden et al. [22] found that well-being measures such as life satisfaction, sense of worth, and happiness were positively related to the presence of greenspace within 300 m of one’s home and that this relationship weakened at greater distances. Cox et al. [23] found lower incidence of mental health problems in people surrounded by more vegetation and more birds within 250 m. Kardan et al. [24] found that people whose neighbourhoods had higher tree canopy cover had fewer reported health problems and higher perceived health. Similarly, White et al. [20] found that on average, individuals have both lower mental distress and higher well-being when living in urban areas with more greenspace. This suggests that not only large public greenspaces are important to well-being, but that other urban greenspaces, and the biodiversity associated with them, may also be important [25,26].
Our goal was to determine whether residents’ general well-being and specific satisfaction with their local neighbourhoods is related to the amount of greenspace and biodiversity directly surrounding their residences. To accomplish this, we surveyed residents of Ottawa, Canada where we could link residents’ responses to already well-curated data on tree-cover, distance to water, and bird diversity. Our study included all greenspace, not just public greenspaces. In addition, our survey design was aimed to identify unconscious effects of greenspace and biodiversity on residents’ general well-being and satisfaction with their local neighbourhoods.
2. Methods
2.1. Overview
We surveyed residents in Ottawa with a short questionnaire about their satisfaction with their local neighbourhoods, general well-being, and subjective connections with nature, and we related the survey results to independent data on the natural environment near their residences. Participants were not told in advance that this study was about nature, because we did not want to influence their answers to early questions about their overall satisfaction and satisfaction with their neighbourhoods through the mentioning of nature. We compared participant responses to measures of nature around their homes while controlling for the potentially confounding variables of income and subjective happiness. We used four measures of nature: (1) bird abundance (number of bird individuals), (2) bird diversity (number of bird species), (3) tree canopy cover and (4) distance to water. Distance to water was added as a variable post hoc, as many participants explicitly mentioned the importance of being near to water, during unsolicited comments following the survey. We selected 100, 250 m-radius sites across the residential parts of Ottawa, Canada (Figure 1). These sites were centred on pre-existing bird survey locations (75 m radius each) from the Ottawa Bird Count (www.ottawabirds.ca), to provide information on bird abundance and diversity at a local spatial scale. The existence of this bird dataset made Ottawa an ideal city for this study. For our predictor variables and potentially confounding variables, we used the most recently available data preceding our survey of residents in 2017.
2.2. Survey of Residents
2.2.1. Survey Design
The survey contained eight questions (Table 1). Survey details were strongly driven by a desire to keep the survey short, and thus reduce the response burden on the participants and increase response rates. Although longer surveys have some clear advantages, they are not amenable to unannounced, uncompensated solicitations for answers. Rather, short and simple questions are common when prioritizing response rates from the general public. Items were adapted from commonly used surveys of subjective well-being and similar constructs. We preferred broad phrasings, as they are amenable to short surveys and they allow people to idiosyncratically weight sub-domains in a way that best captures personal satisfaction, cf. Diener et al. [27].
Questions started broad and gradually became more specific. The first question asked about the participant’s subjective happiness [28], which we treated as a personal character trait of the participant. It was used as a predictor for the other questions, to control for effects of subjective happiness on individuals’ feelings about their local neighbourhoods (e.g., generally happy people are more likely to have higher satisfaction with their neighbourhood). Question two was about life satisfaction [27,29]. Question three asked about the resident’s satisfaction with their neighbourhoods. Note that during the first three questions, the survey made no mention of nature or the natural environment, thus avoiding problematic order effects (see [30]). Questions four to six focused on how aware the participants were of the nature around them and whether this played a conscious role in their choice of neighbourhood. Questions seven and eight determined the participant’s relationship and connectivity to nature, and were adapted from the Nature Relatedness Scale [31]. The Carleton University Research Ethics Board approved all methods and survey questions (Project # 106476). Although we did some informal evaluations to determine whether the questions were understandable, we did not do structured piloting as our goal was to maximize our sample size given the time and resources available.
2.2.2. Survey Deployment
We surveyed people door-to-door, visiting all study sites between May and August, 2017. We used in-person surveying to ensure a high response rate within each site. In-person surveying took place Monday through Friday (excluding holidays) between 9:30 a.m. and 4:30 p.m. This timing may bias our sample towards residents who are home during the working-day. However, this overall bias in survey respondents should not affect our findings because it is consistent across all study sites, and therefore uncorrelated with any of our predictors of interest. For each 250 m-radius site, sampling continued until either 10 surveys had been achieved or until there were no more residential addresses to visit within the site. If a site could not be completed on a given date, it was revisited at the end of the sampling period. Residences were prioritised for surveying based on how close they were to the bird sampling point at the centre of the site. Residences within the 75 m bird-sampling radius had highest priority, followed by those within 150 m, and lastly within 250 m. The study period was chosen to bracket the mean leaf-out and leaf-senescence dates as recorded at the Ottawa Arboretum [32,33]. This was done so that the tree canopy cover would be consistent throughout the survey field season. The last online survey was collected on 1 October 2017.
We created the survey using the software QualtricsTM [34], which hosted the survey on its platform. For in-person surveys, the participants used a tablet to read and submit their answers. To increase sample size, flyers were left at residences inviting the occupants to participate online if they were not available for an in-person survey. Participants were asked if they would be willing to participate in a study on “resident life satisfaction”. We intentionally did not mention the environment until later in the survey as we did not want to influence their answers to questions about their overall satisfaction and satisfaction with their neighbourhoods by the mention of the environment. Those who answered affirmatively were given consent information to review. Once participants electronically submitted their consent, each participant was assigned a unique User ID. This ID was coded to the participant’s location so that the variables around their residence—bird abundance and diversity, tree canopy cover, distance to water, and median income—could be measured. The survey then began. The survey showed one question at a time, in order (Table 1), and participants were not able to change their answers after they had been given. Again, this was to avoid the later mention of the natural environment having an influence on participants’ answers to questions about their satisfaction with life and with their neighbourhood. After the last question, participants were shown debriefing information describing the purpose of the study and were asked to reaffirm their consent. Participants were given the option to withdraw from the survey, even after completion; however, no participants chose this option.
2.3. Site Selection
We selected 100 survey sites (Figure 1), from among the 928 Ottawa Bird Count locations distributed across Ottawa. The 100 sites represented gradients of our predictor variables: bird abundance and diversity, tree cover, distance to water, and median income. Sites were selected such that these gradients were as independent as possible. The sites were centred around the pre-existing bird count locations from the Ottawa Bird Count program and had a radius of 250 m from the centres of the bird count locations. The 250-m radius was selected to ensure that the bird data were relevant to the local neighbourhood experienced by the residents, as our goal was to evaluate influences of the natural environment within local neighbourhoods on residents satisfaction; note, the same distance was selected by Cox et al. [23] for the same purpose. A distance of 250 m was also practical for updating the tree canopy data during the field surveys (see Section 2.6). Sites with fewer than 10 residential properties were excluded due to low potential sample size. The centroid co-ordinates of each residential property were determined by using publicly available data [35]. Any potential sites that had missing or incomplete data for any of the predictor variables were excluded from consideration. This left a total of 221 candidate sites of the 928 Ottawa Bird Count sites. Sites that were overlapping at the 250 m radius extent were eliminated one by one, keeping sites that had the lowest pair-wise correlation between the predictor variables and favouring more evenly distributed sites across the study area. To ensure a low correlation between tree canopy cover and median income, we categorised candidate sites based on whether they were above or below the median value of income (i.e., high or low income) and tree canopy cover (i.e., high or low tree cover). A roughly even number of sites of each of the four combinations were included (29 high median income-high tree canopy cover, 20 high median income-low tree canopy cover, 24 low median income-high tree canopy cover, and 27 low median income-low tree canopy cover). However, a perfectly balanced design could not be obtained because some combinations are relatively rare (e.g., high income and low canopy cover). Therefore, median income was included as a co-variate in all analyses.
2.4. Sampling Order
We determined the order to visit sites using a structured framework, to make sure that there was no relationship between season and any of the predictor variables. We did this because seasonality may affect people’s moods [36] and mood may affect satisfaction judgments, though such effects appear weak and inconsistent [37]. To spatially distribute sampling, we divided the study area into quadrants (Figure 1). Sampling started in the western quadrant and we changed quadrant every day moving clockwise. We chose the order of sites within quadrants by their median income and tree canopy cover values. Each day we sampled two sites in the same category of median income level, switching daily from high median income to low, then reversing the pattern each cycle around the quadrants. Each day one high tree canopy cover site was paired with one low tree canopy cover site until all possible pairs were exhausted. This approach successfully avoided any seasonal pattern in the predictor variables of the sampled sites (Appendix A Figure A1).
2.5. Bird Data
The bird data we used for this project were provided by the Ottawa Bird Count. This is a breeding season monitoring program for birds that takes place within the city of Ottawa, Canada. Well-trained volunteers make bird observations between half an hour before sunrise and 8:00 a.m. at designated locations across the city, taking 10-min, 75 m fixed-radius counts, during peak breeding season (June 3 to July 7). The Ottawa Bird Count was designed to provide a representative sample of the bird community within the city. Each of the 928 bird survey locations is the nearest publicly accessible location to a randomly selected point within one cell of a 1 km by 1 km square grid. The grid covers all of the urban and suburban designated portions of the city.
We used the measure of bird abundance and diversity (number of species) available at each site in the closest year preceding our surveys, ranging from 2006 to 2016. These measures included only birds that were observed using the space in the site, and excluded birds flying far overhead. The bird data were collected within the 75 m-radius circle at the centre of each 250 m-radius survey site. We did not account for variability among individual observers in the bird data because previous work with these particular data have shown that observer effects are weak [38].
2.6. Tree Canopy Cover
A map of tree canopy cover was provided by the City of Ottawa [39]. It was created using stereo compilation of 6-cm aerial photography. The map is updated by the city every 2 to 3 years, the most recent date prior to our surveys being November 2015. During the survey period, field assistants updated the tree canopy cover data for each site, to account for small changes in canopy cover, by comparing the map data to trees present at the site and noting any discrepancies. We then updated the map in ArcGIS version 10.5.1 [40] before analysis. For site selection, we calculated the total amount of tree canopy cover within a 250 m radius of the centre of each site, i.e., the centre of the bird count. For analysis of our data, we calculated the tree canopy cover within a 250 m radius surrounding each participant’s residence.
2.7. Distance to Water
Distance to water was included post hoc. In unsolicited comments, many residents said that being close to water was one of the key features that they enjoyed about their neighbourhood. To reflect this, we added distance to water as a predictor variable in the models. The map of waterbodies was from the city of Ottawa, last updated April 2018 [41]. The map was derived from an Ontario Base Map created using aerial imagery at a scale of 1:10,000. We calculated the Euclidean distance from each participant’s residence to the nearest waterbody.
2.8. Median Income
Previous studies have indicated that higher relative income has a positive effect on a person’s life satisfaction [42]. As well, property values tend to increase with neighbourhood tree canopy cover [43]. Therefore, it is expected that income will be correlated to both life satisfaction and tree canopy cover. We therefore included median income as a variable in site selection and data analysis to control for this potentially confounding effect. Asking about individual participants’ income seemed invasive and could decrease our response rate. Therefore, we used income data from the Canadian National Household Survey from the Canadian Census of 2011 [44]. Median individual yearly income was treated as an indicator of the area’s relative wealth. For broad initial site selection, we assigned each site the median income of the Census Tract, i.e., an area of approximately 2500 to 8000 people, within which it was located. For analysis, we assigned each participant’s residence the median income of the Dissemination Area, i.e., an area of approximately 400 to 700 people. Dissemination Areas are the smallest Census division.
2.9. Data Analysis
The responses to each survey question were analysed with a hierarchical Bayesian, ordered probit mixed model using the software R version 3.4.3 [45], and the package MCMCglmm [46]. Site was treated as a random effect, to control for the non-independence of survey responses within sites, while all other variables were fixed effects. Bird abundance and diversity were highly correlated (r = 0.736), so models for each were run separately. We included subjective happiness (from Question 1) as a predictor for Questions 2–8. This was to control for the potential influence of a person’s subjective happiness on their feelings about their neighbourhood [47]. Note we could have controlled for life satisfaction instead (Question 2), as both subjective happiness and life satisfaction are components of subjective well-being. We chose to control for subjective happiness because it was our first question and therefore answers were not influenced by the other questions. Subjective happiness was an ordinal variable, so a series of orthogonal polynomials for subjective happiness were fit up to the sixth power (k-1, where k was the number of response levels in Question 1). This is a conservative approach as it reduces the amount of variation available for the nature predictors (bird abundance/diversity, tree canopy cover, and distance to water) to explain. Thus, the final model for each response was:
Surveyij = (β0 + Sitej) + β1Birdij + β2Treeij + β3Waterij + β4Incomeij + β5Subjective happiness1–6ij + ej
Survey is the response to a survey question of the i-th participant in the j-th site. Site is the site number, Bird is either bird abundance or bird diversity (number of species) and Tree is tree canopy cover within a 250 m radius of the residence in ha. Water is the Euclidean distance from the residence to the nearest waterbody in km, Income is the median income of the Dissemination Area within which the residence was located, and Subjective happiness1–6 is a 6th-degree matrix of orthogonal polynomial contrasts of a participant’s subjective happiness (taken from Question 1).
We ran models using vague priors, with residual variance fixed at 1. We used a burn in of 60,000, a thinning factor of 30, and 360,000 total iterations. We confirmed convergence using a Gelman-Rubin diagnostic [48] and using MCMC trace plots [49]. The postMCMCglmm R package [50] was used to predict the probability of each participant answering the most positive option for each question. We used this approach because there was the greatest variability among participants and therefore the most information contained in the contrast between the most positive option vs. any other option. In plotting the model results, all parameters were held at their mean values (median for subjective happiness) except for the predictor of interest. The Bayesian framework is particularly useful for this analysis as it provides direct estimates of the parameters of interest: the probability a resident would give a particular response [49].
3. Results
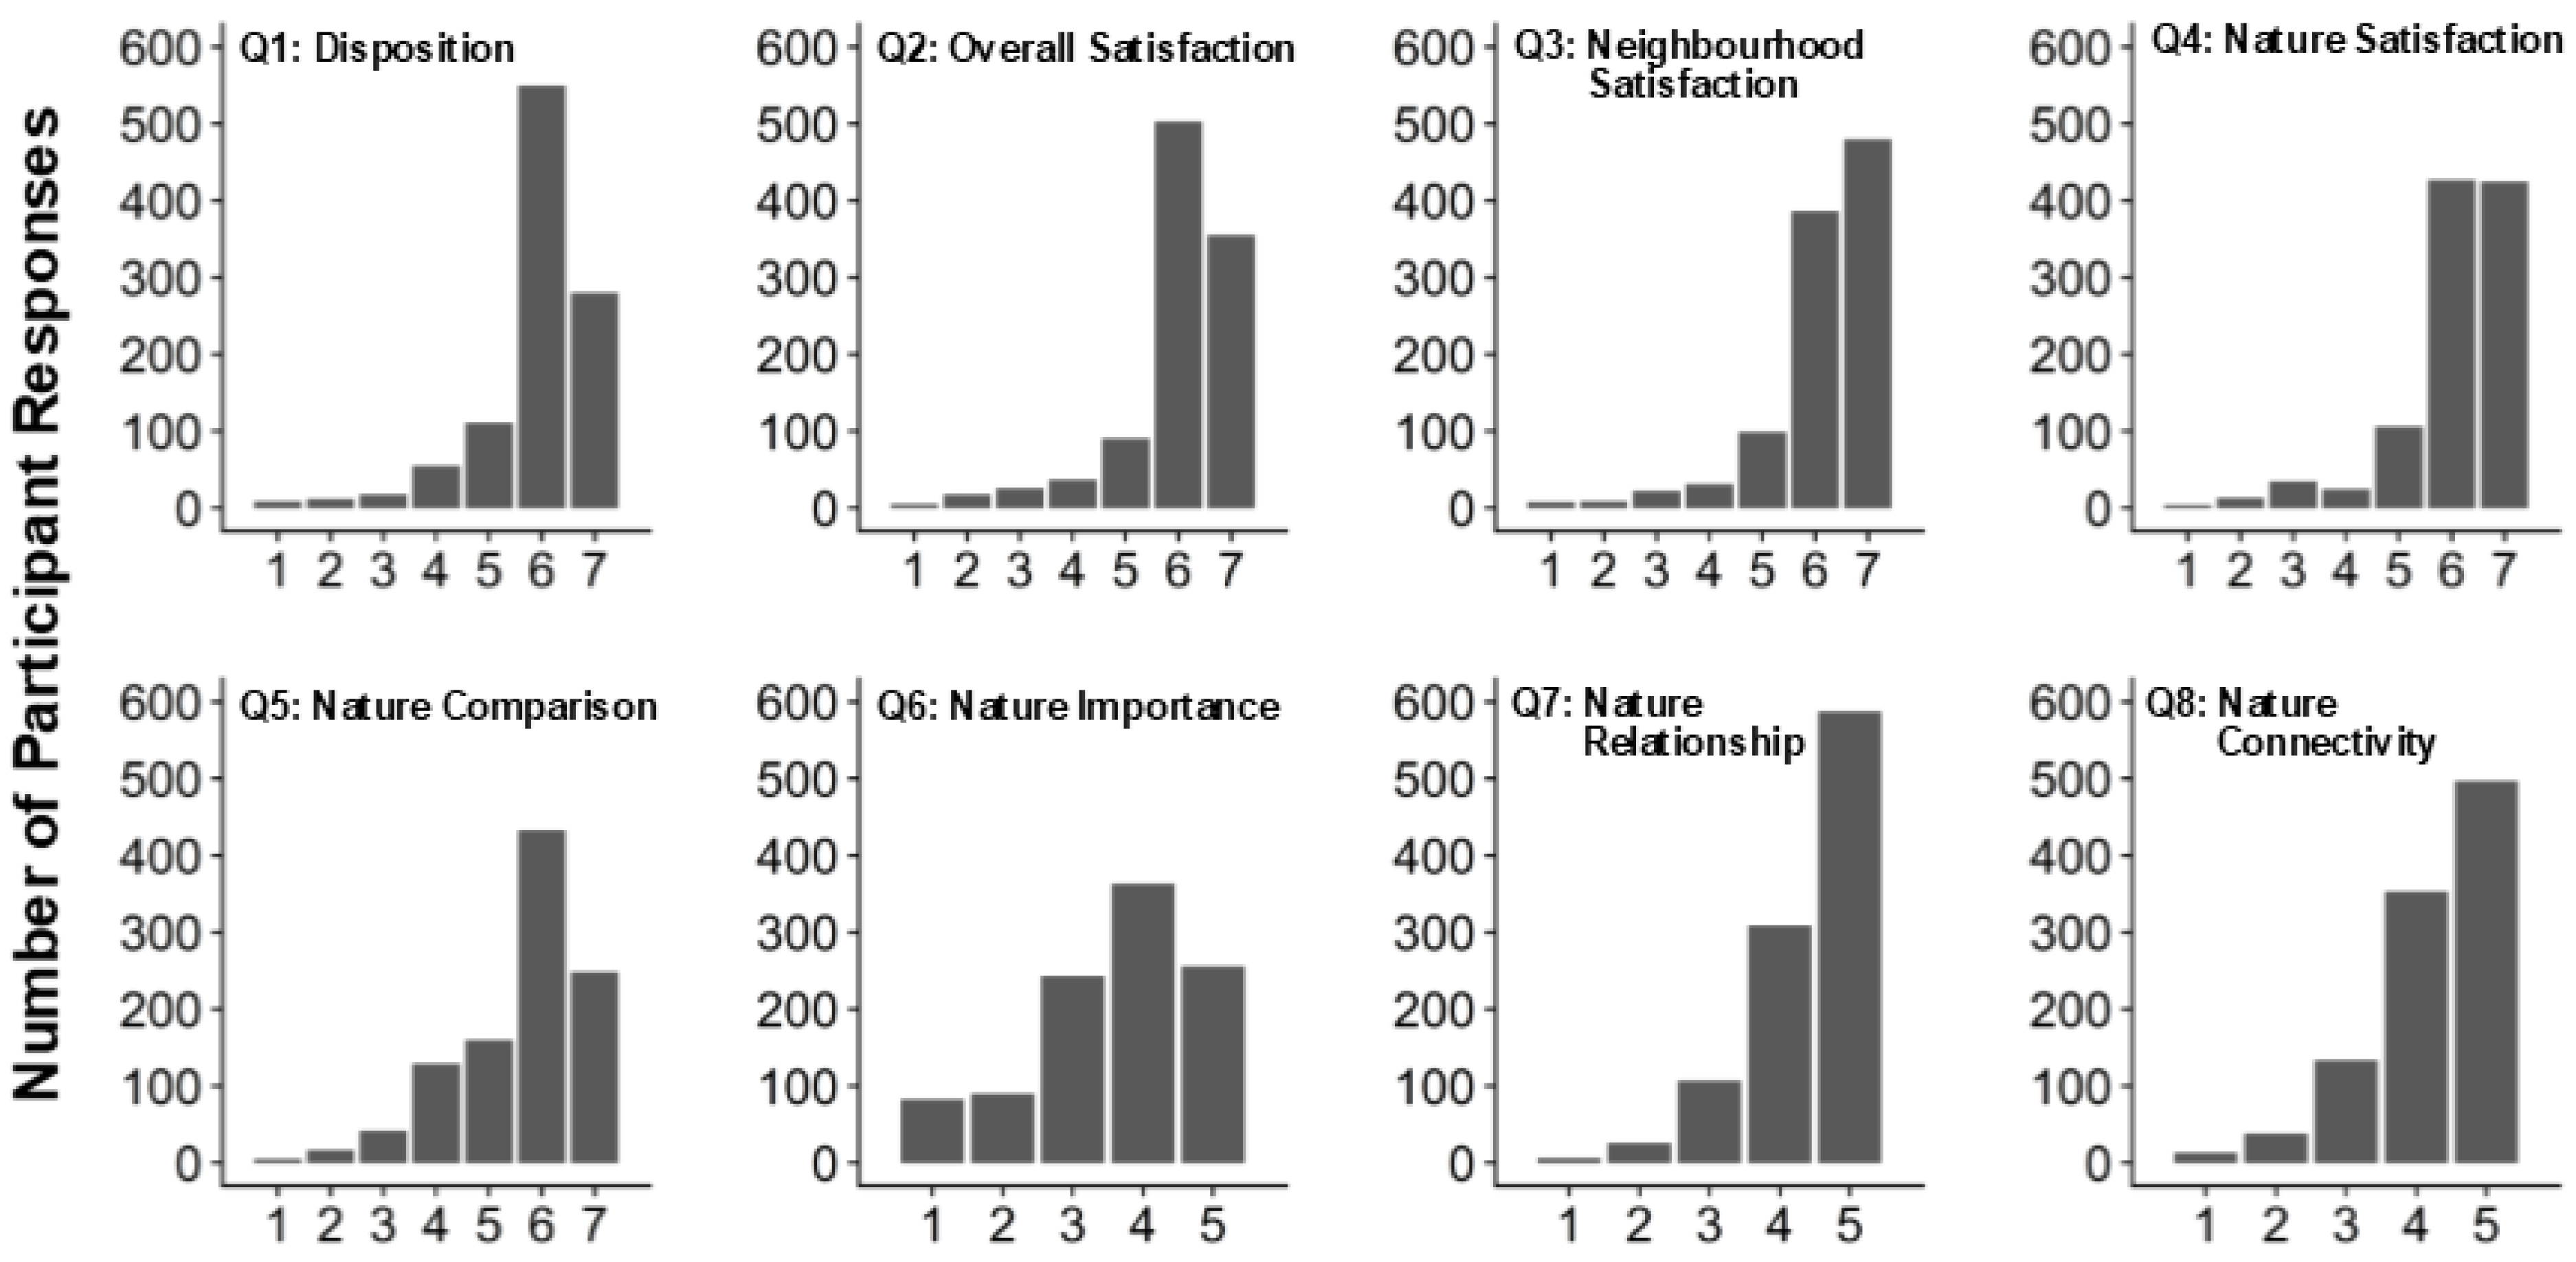
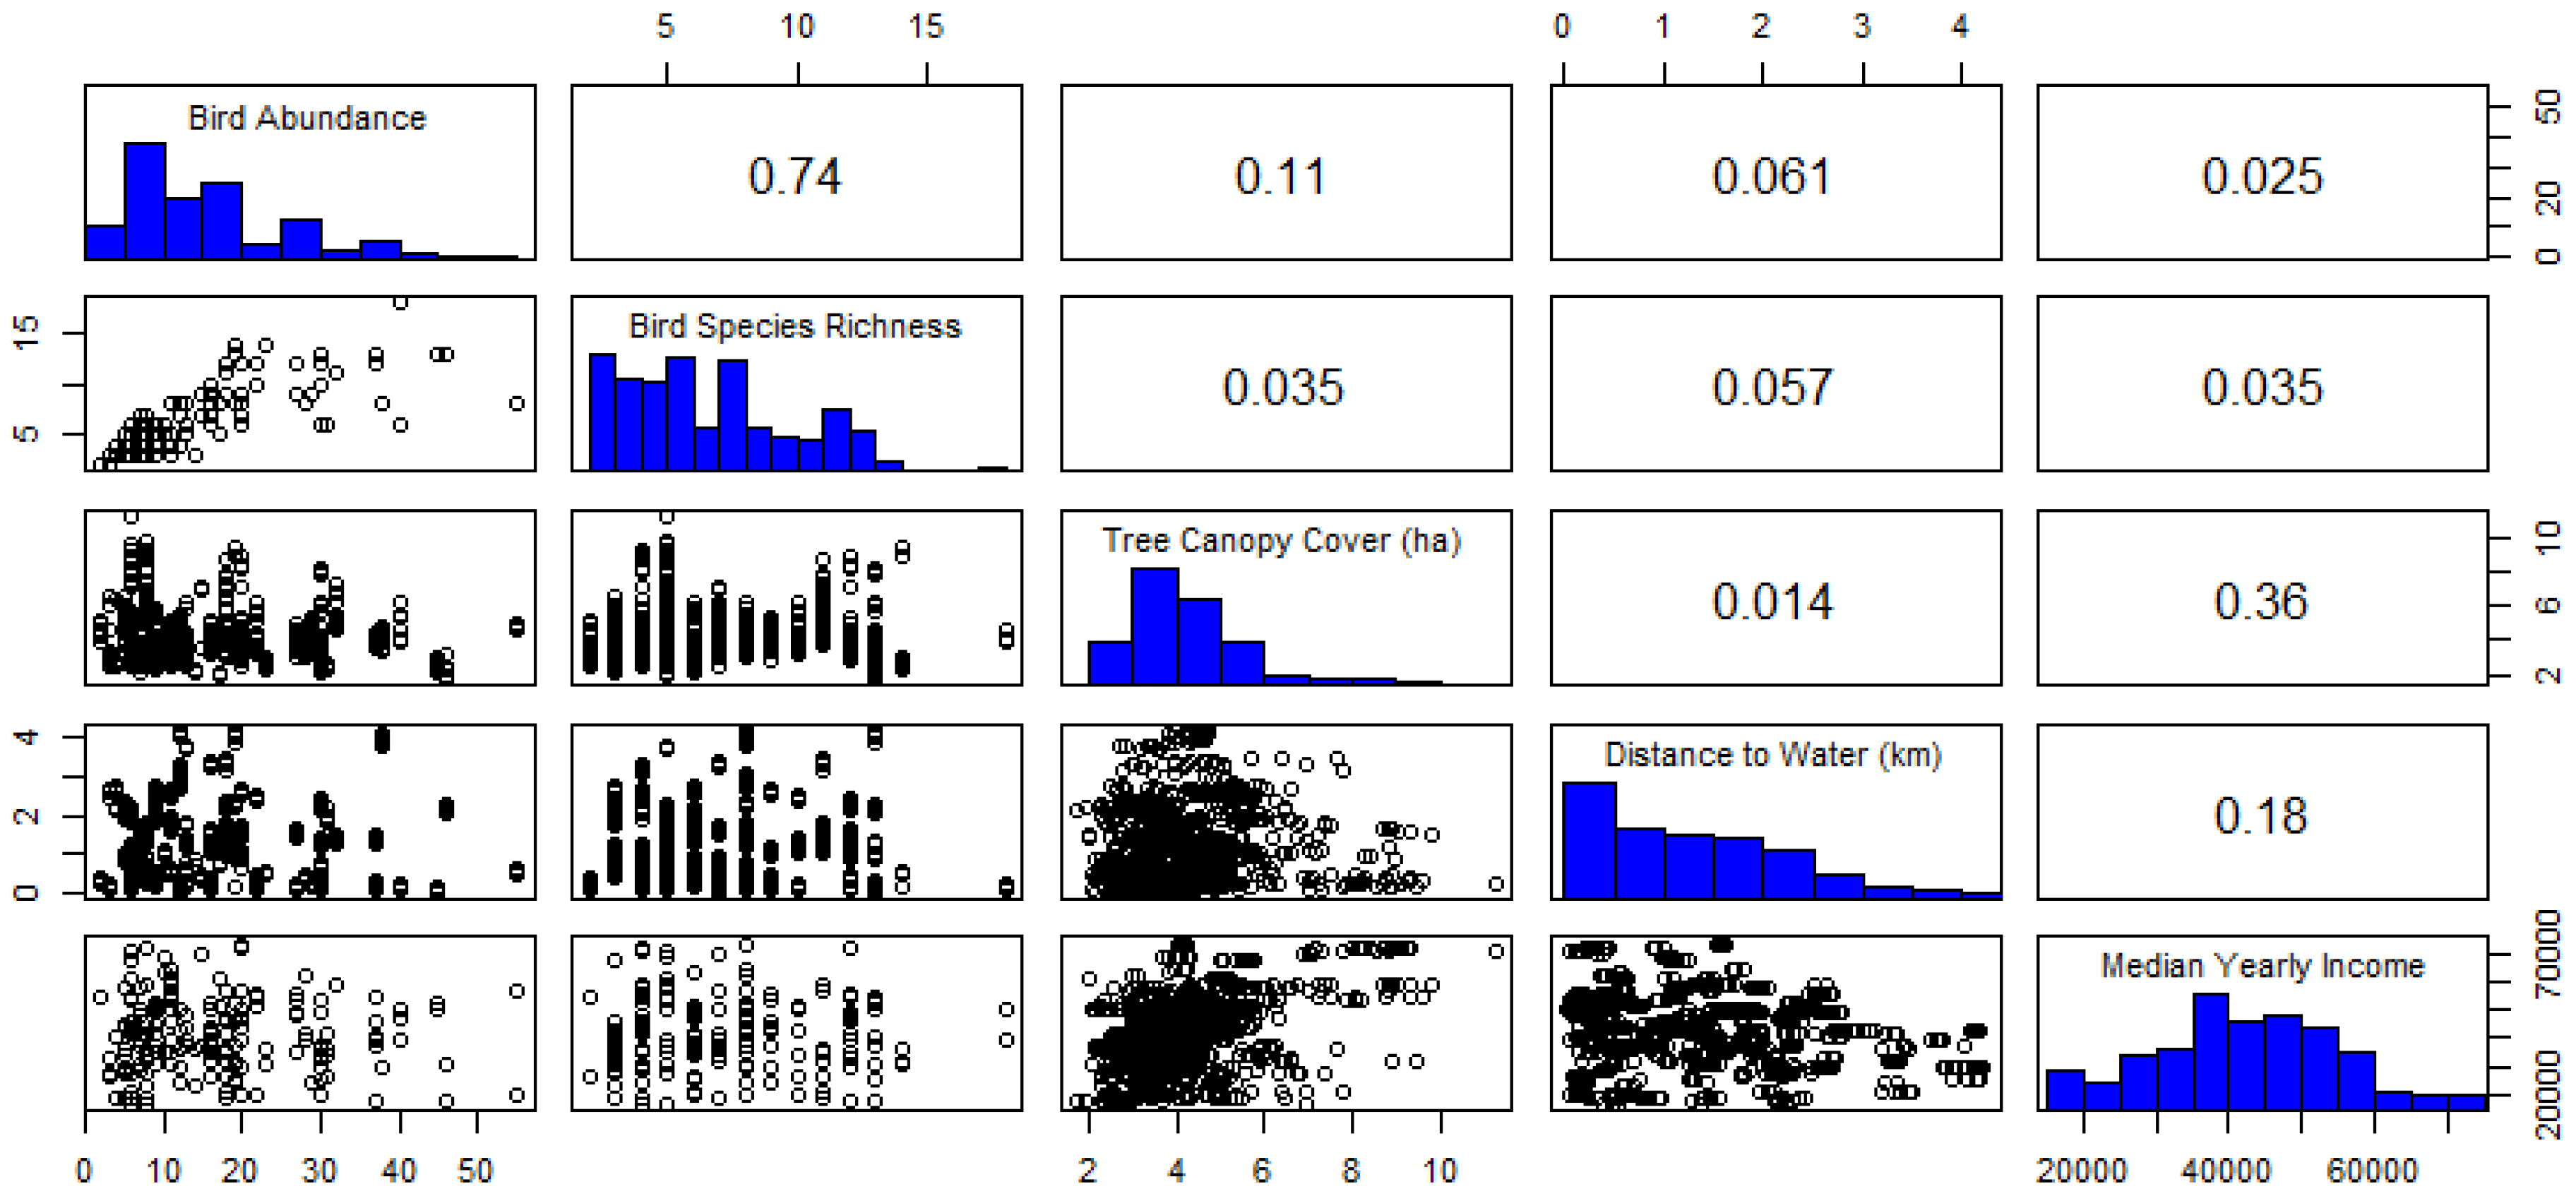
In all, we collected 1035 surveys (886 in-person, 149 online in response to flyers). The overall response rate was 16.7% (64.7% in-person, 3% in response to flyers). Thus, our results essentially reflect responses to in-person surveys. The responses to all questions were skewed, such that most responses were from the more positive options (Figure A2). There was a moderate correlation between response rate per site and median income (r = 0.358), and there were low correlations between the response rate per site and all other predictors (Table A1). The site selection procedure resulted in low correlations among all pairs of the predictors (Figure A3), except for bird abundance and bird diversity (r = 0.736). The correlation between tree canopy cover and median income was moderate (r = 0.363). The predictor variables were sampled evenly across the field season (Figure A1).
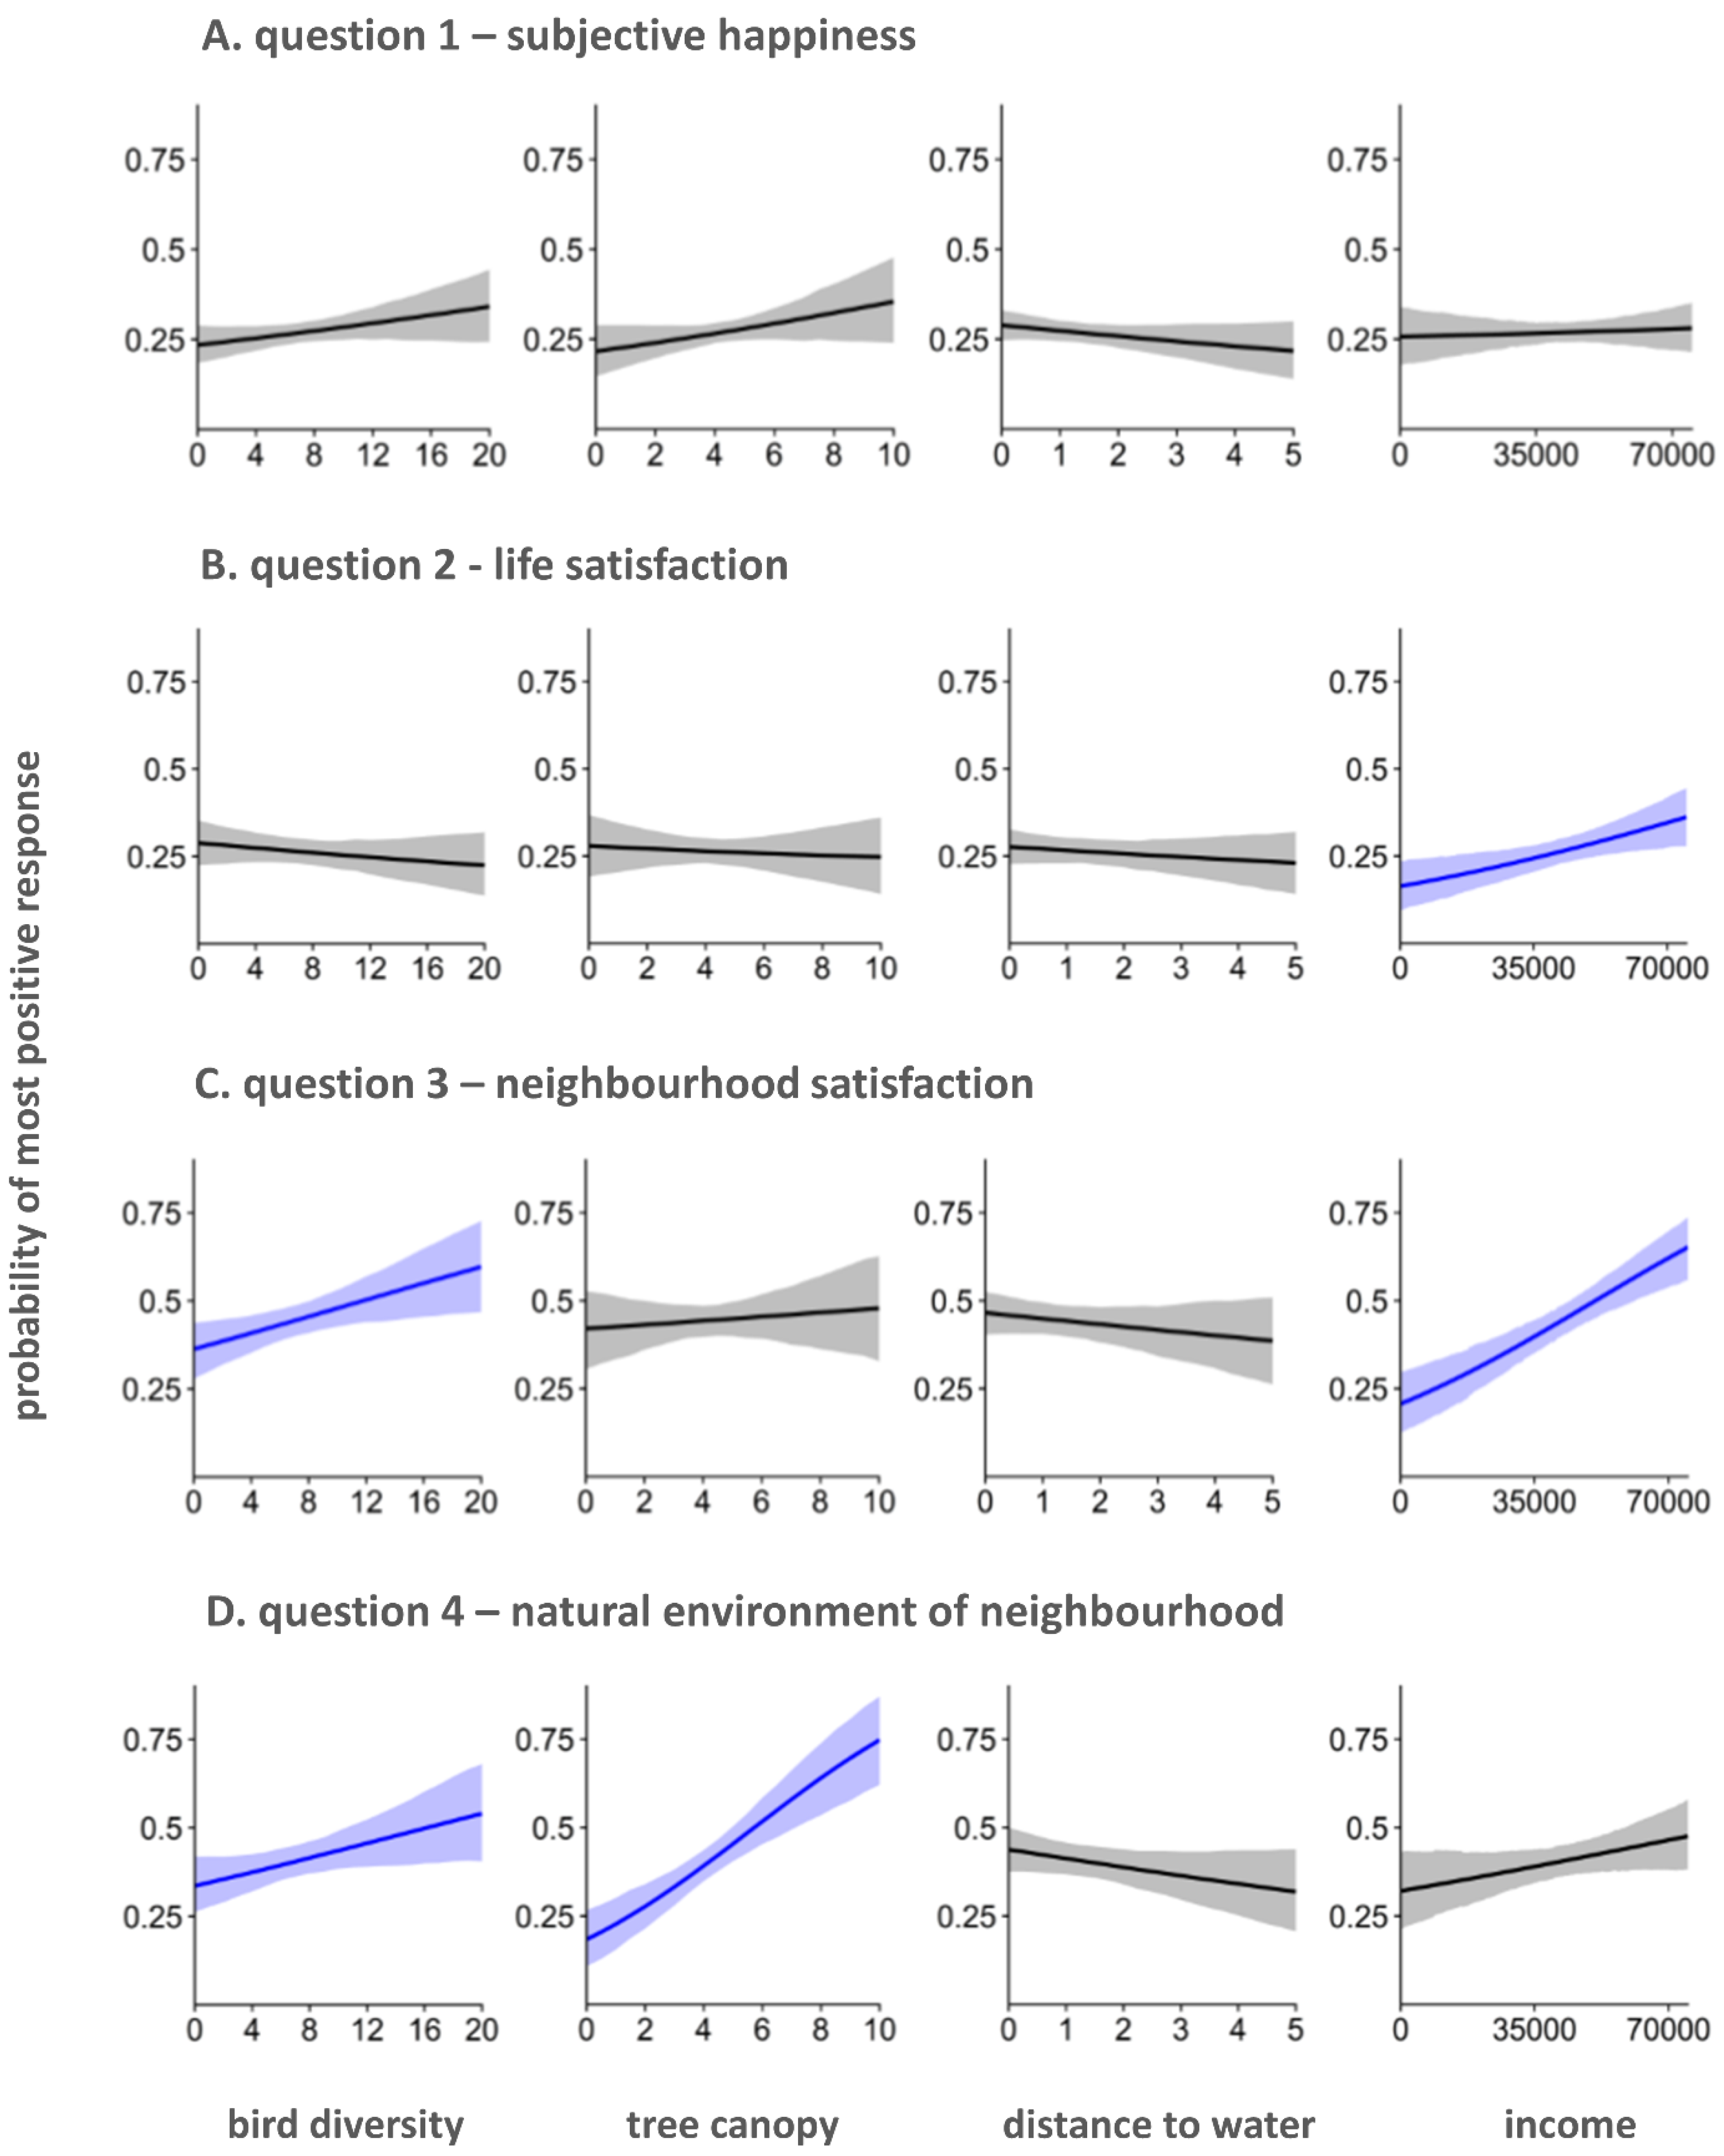
The signs of the significant coefficients across all models were consistent with our expectations: positive relationships for bird diversity, tree canopy cover, and median income, and negative relationships for distance to water on participant responses to every question (Figure 2, Table A2). Bird abundance was not significant in any of the models, but the direction of effect was consistent with the direction of effect for bird diversity. This was expected as these two predictors were highly correlated. At least one subjective happiness contrast was significant in models of responses to Questions 2–5, supporting the decision to include subjective happiness as a predictor in the models. The Spearman correlation between the participant’s subjective happiness (Question 1) and the participant’s overall life satisfaction (Question 2) was r = 0.574 (Table A3). However, the differentiation between subjective happiness (Question 1) and overall life satisfaction (Question 2) was supported, as the models for these two questions showed different results.
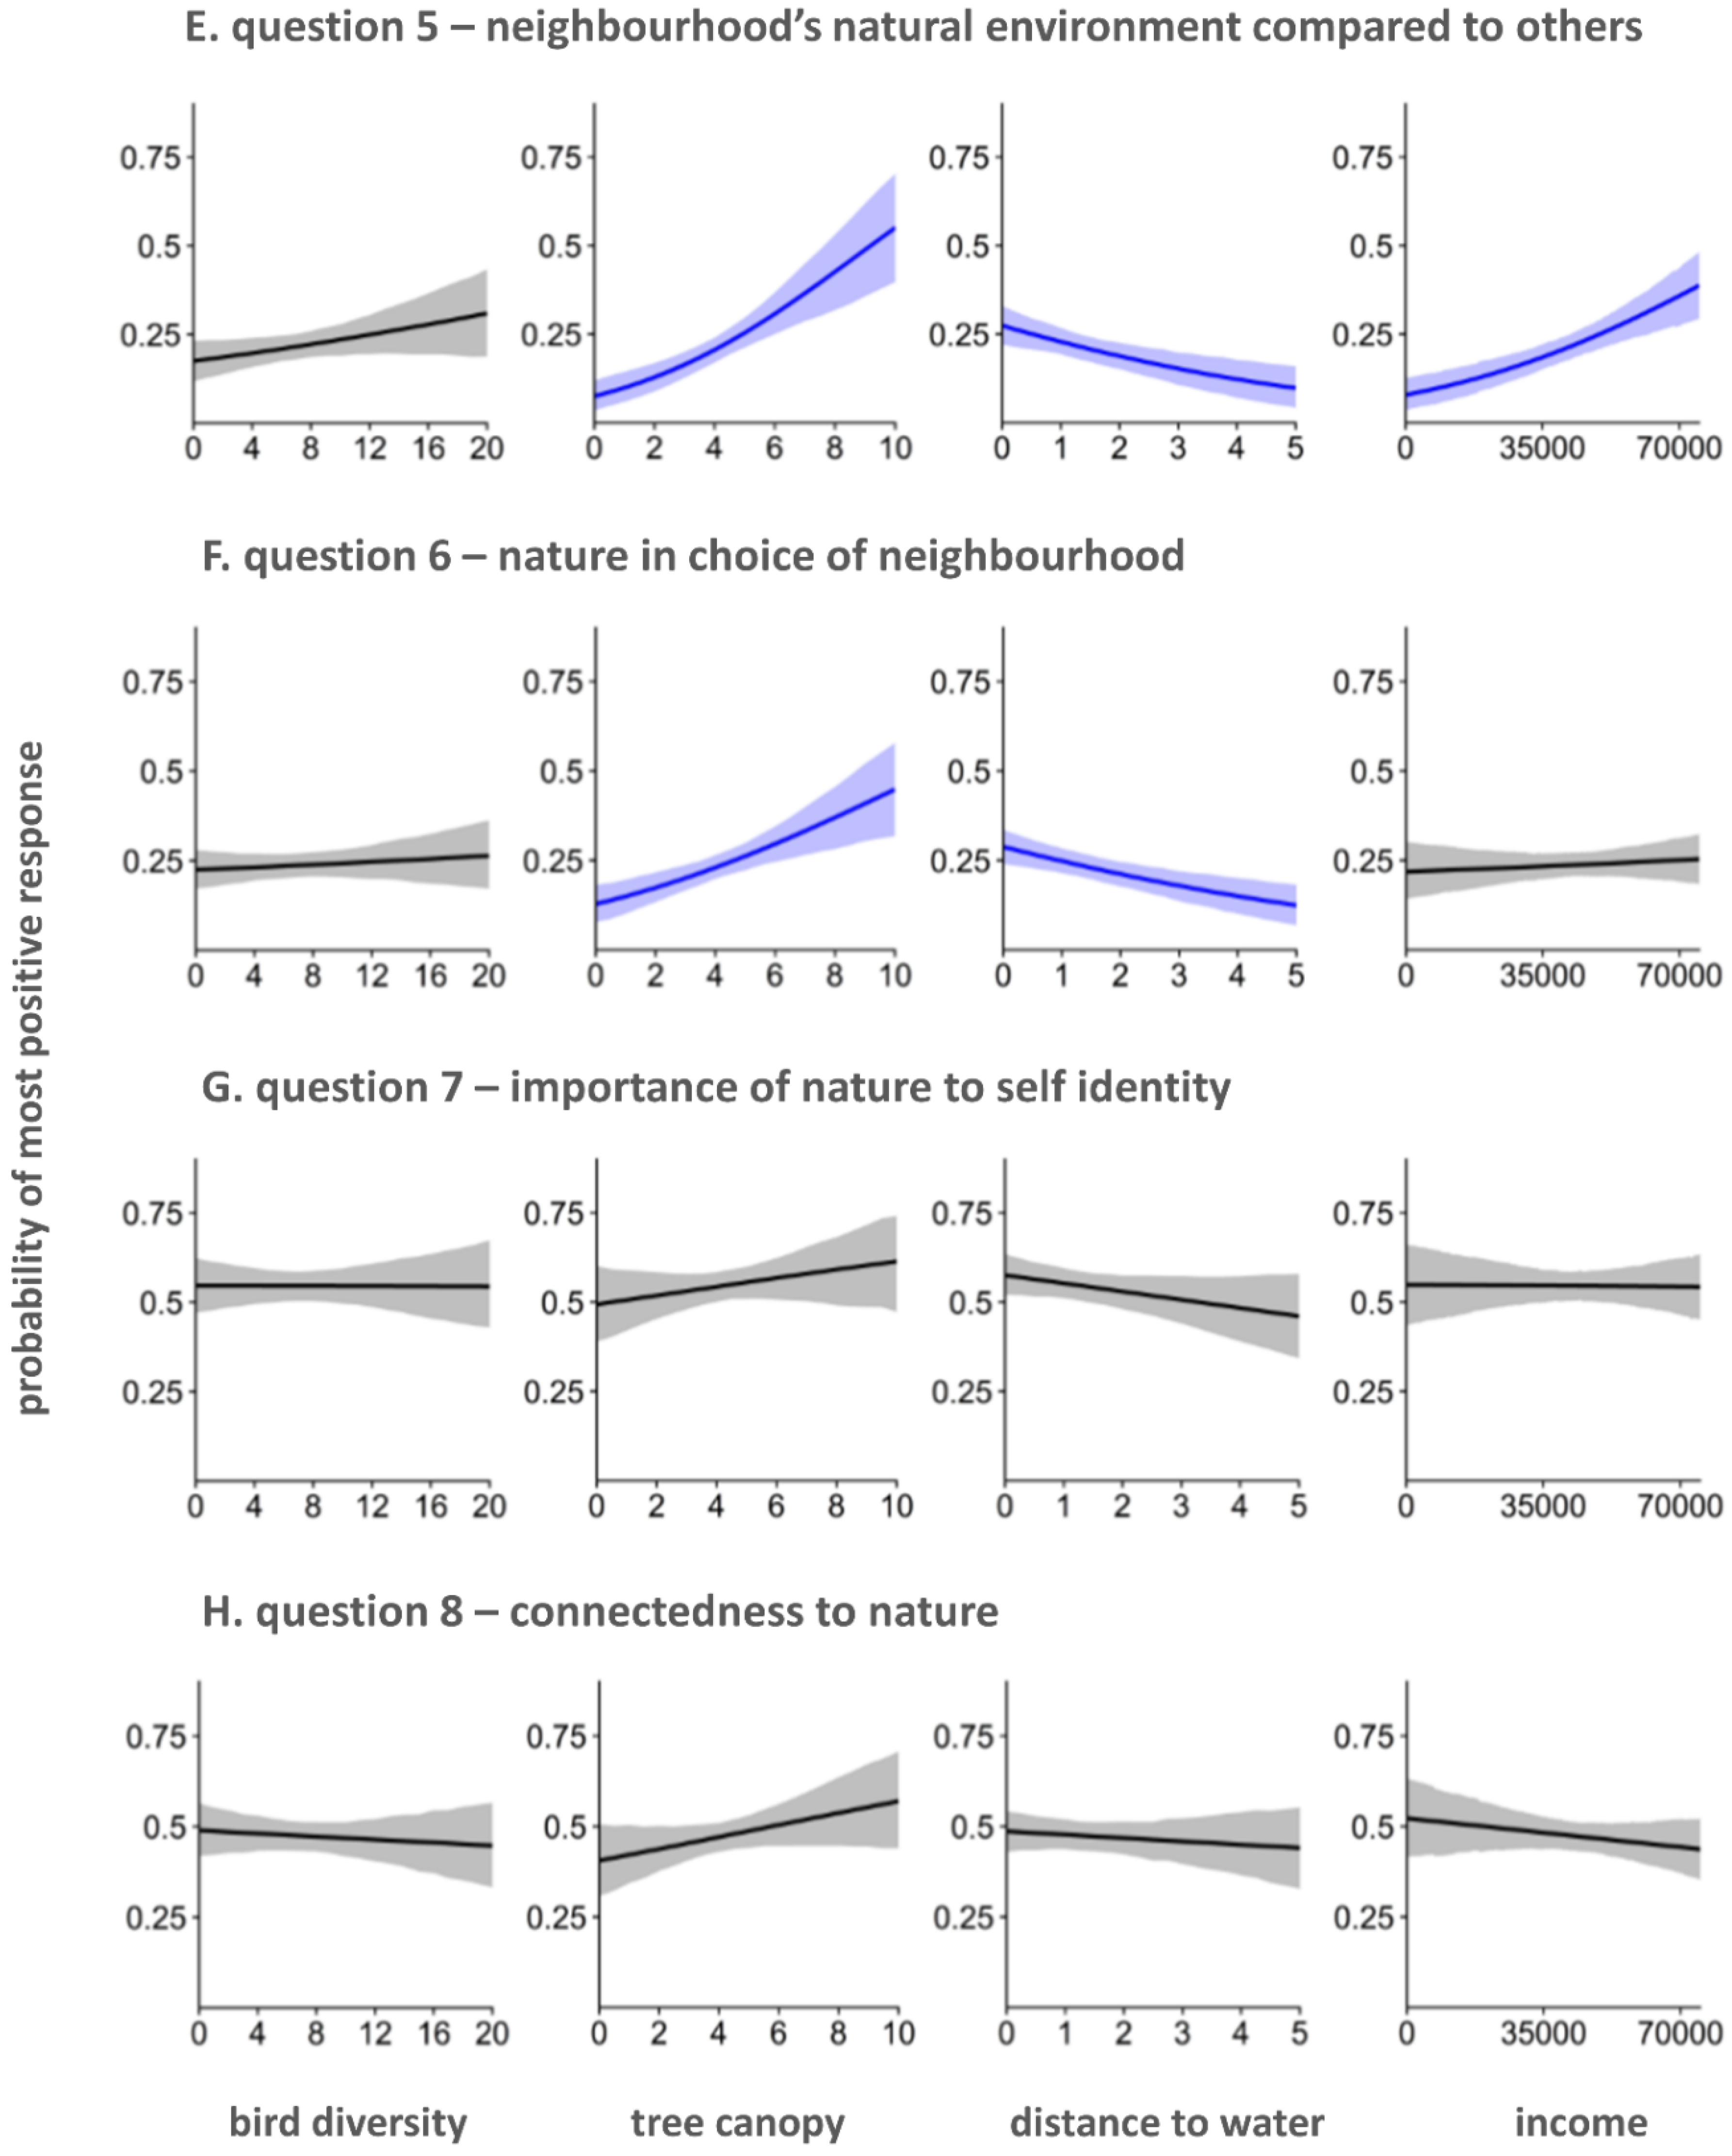
There was no clear evidence in any of the models for a relationship between a participant’s subjective happiness as the response variable (Question 1) and any of the predictor variables (Figure 2A). Overall life satisfaction (Question 2) was positively related to median income (Figure 2B). Neighbourhood satisfaction (Question 3) was positively related to bird diversity and median income (Figure 2C). Satisfaction with local nature (question 4) was positively related to bird diversity and tree canopy cover (Figure 2D). Residents’ rating of their natural environment compared to other areas (Question 5) increased with tree canopy cover, income, and proximity to water (Figure 2E). The importance of nature when choosing a place to live (Question 6) increased with tree canopy cover and proximity to water (Figure 2F). A participant’s relationship and connectivity to nature (Question 7 and Question 8, respectively) showed no significant predictors (Figure 2G,H).
4. Discussion
Urban residents living in areas with more bird species reported higher general satisfaction with their neighbourhoods. Neighbourhood satisfaction (Question 3) increased with increasing bird species diversity, even before survey respondents were prompted to think about nature at all (Figure 2C). We note that the relationship between bird diversity and neigbourhood satisfaction was not due to correlations between bird diversity and tree cover or distance to water, as these correlations were very low (r = 0.035 and 0.057 respectively; Figure A3). Although this study is correlational, it complements previous work showing that bird species diversity in urban greenspace is positively associated with human well-being [14,17,18]. While many studies have suggested well-being benefits for urban green spaces, substantially fewer have focused on the particular link between diversity of birds within urban neighbourhoods (i.e., developed areas outside of parks and greenspace) and the satisfaction of the residents living there (see [51]).
It appears that residents are not consciously aware of the relationship between bird diversity and their overall satisfaction with their neighbourhoods. First the order of questions avoided making nature (including birds) salient when our participants rated neighbourhood satisfaction (Question 3). Moreover, residents very rarely mentioned birds in their unsolicited comments following the surveys, even though by then they were well aware that the survey was actually about their responses to nature. In contrast, they frequently mentioned trees and water. Also, in the results from Question 6, where participants were asked about the importance of nature when they chose where to live, neither bird species diversity nor bird abundance was significantly associated (Figure 2F). This suggests that people are not consciously seeking to live in areas of high bird diversity, even when seeking nature, despite bird diversity having the largest impact on their ultimate satisfaction with their neighbourhoods, out of the variables we considered.
While bird diversity was significantly related to feelings of neighbourhood satisfaction, the relationship between bird abundance (total number of individuals) and neighbourhood satisfaction was weaker and non-significant. Most previous studies used either abundance or diversity but not both [14,17,52]. Wolf et al. [53] showed participants videos of birds and trees controlling for abundance, and found that species diversity positively predicted mental well-being. Thus, we speculate that the relationship between birds and well-being is specifically related to the number of different kinds of birds in an individual’s surroundings, at least within the ranges of bird diversity and abundance in our study area. Bird diversity is sensed both visually and auditorily. We intuitively suspect that the implicit response to bird diversity is more likely due to the diversity of bird song than to the diversity of seen birds. If it were a visual response, we might expect some evidence that residents are more aware of the role of birds in their neighbourhood satisfaction. Previous research has shown relationships between people’s subjective appreciation of bird song and their perception of the environment [54], but ours is the first study to show an unconscious relationship between bird diversity (possibly diversity of bird song) and peoples’ feelings of satisfaction with their neighbourhoods.
We note that it is also possible that the relationship between bird diversity and neighbourhood satisfaction is not due to bird diversity itself, but rather to the diversity of habitat types in the neighbourhood. While bird diversity and tree canopy cover are not correlated across our sites, we have no measure of habitat diversity. If bird diversity increases with habitat diversity, it is possible that residents are responding to habitat diversity rather than bird diversity. We note, however, that participants did not mention habitat diversity in their unsolicited comments following the surveys. Thus, whether the response to birds is due to bird diversity itself or to habitat diversity, it appears to be unconscious.
Tree canopy cover was positively related to satisfaction with local nature (Question 4) and both tree canopy cover and distance to water were related to participants’ ratings of the quality of their natural environment compared to other areas (Question 5) and the importance of nature in choosing where to live (Question 6) (Figure 2D–F). These findings suggest that participants consciously appreciate tree canopy cover and urban water bodies, and supports the previously-shown aesthetic preferences for vegetation and water [55]. Higher tree cover is preferred in residential neighbourhoods [56]. Spending time in treed areas has been found to improve happiness [5]. Similarly, coastal studies find that being near waterbodies is perceived as beneficial by residents [52], and viewing landscapes with water is associated with greater positive affect and higher perceived restorativeness [57]. We note that residents often mentioned trees and water in unsolicited comments after the surveys. It is thus not surprising that trees and water were related to their feelings about their natural environment (Questions 5 and 6).
We found no significant predictors of nature relatedness (Questions 7 and 8). However, almost all responses to these questions were very positive. The majority of participants indicated that a relationship with nature was important to them (Question 7) and that they had a strong connection to nature (Question 8) (Figure 2G,H). The low variation in participants’ responses to Questions 7 and 8 was surprising, particularly given that the nature relatedness questionnaire was developed and validated with many Ottawa resident samples, among others [31]. Nonetheless, low variability in this sample means that any effects of the predictors would be difficult to detect. We suspect that the low variation was at least partly due to the fact that these questions were at the end of the survey. Participants may have altered their responses to fit with their growing interpretation of the research goal, as they progressed through the questions [58]. By the time a participant got to the nature relatedness questions they may have thought that answering positively about nature was the expected result. This would influence the responses, as participants are known to be prone to being agreeable to questions [59]. Even though the results for the two nature relatedness questions were not significantly related to local nature, the typically high levels do suggest that residents in Ottawa view their relationship and connection with nature to be very important.
Another possible explanation for the lack of significant effects of predictors on peoples’ relationship and connection to nature (Questions 7 and 8) is that the local nature around one’s home may not be a strong predictor of nature relatedness. People who are highly connected to nature may be willing to live in lower nature areas (e.g., downtown core), especially when it supports a more environmentally sustainable lifestyle, as long as they can travel to spend time in more natural settings (cf. [21]). Participants mentioned hiking, camping, and other nature recreation activities not associated with their homes. These activities would be connected to nature relatedness but would not be captured by measuring local nature around their homes.
Our study had some limitations that may reduce our ability to generalize from the results. First, we studied one particular Canadian city, and we prioritised a short survey to increase the response rate. Therefore, idiosyncratic features of Ottawa or the questions’ phrasing may account for some results (both positive and negative). Confidence in the link between bird diversity and neighborhood satisfaction will be adjusted up or down depending on the results of similar studies conducted in other locations. Additionally, demographic measures such as age and gender were not included in the models. Some studies have found that different demographics show different relationships between well-being and nature [60]. However, a meta-analysis of nature relatedness found age and gender are not significant moderators of happiness [11]. A second limitation is that the majority of participants in our study were people who were home during the day (except for people who responded to the flyer, 14.4%). This would include people who were: stay-at-home parents, working from home, shift work employees, unemployed, or retired. This bias towards people at home during the day should be similar across all sites as the sampling times were kept consistent. Nonetheless, people who spend more time at home might have a different relationship to their local neighbourhoods, meaning the results might be less applicable to the day shift working population. Nature relatedness has been found to be correlated with time spent in nature [61]. People at home during the day may spend more time in their neighbourhood, strengthening their relationship and connection to their local nature. As well, most participants lived in detached or semi-detached housing as many apartment buildings had security that prevented in-person surveys or even distributing flyers. Those who live in apartment buildings may have less access to nature as they do not have a private yard, which might affect their nature relatedness. Finally, this study and the majority of research on this topic was based in North America and Europe [62], which may limit the applicability of the results to other parts of the world. For example, a study from Singapore did not find that access to greenspace affected well-being [63]. The authors theorized that because the total amount of nature and biodiversity was much higher across the region in Singapore than in temperate regions, the negative effects of being isolated from nature may not be as pronounced there.
5. Conclusions
Our results confirm previous findings that maintaining nature in the city is beneficial to resident satisfaction. Interestingly, although participants frequently mentioned trees and water being key features of their neighbourhoods, and very rarely mentioned birds, the nature measure that best predicted neighbourhood satisfaction (Question 3) was bird species diversity. This suggests an unconscious relationship between bird diversity and residents’ satisfaction with their neighbourhoods. This also implies that conserving bird diversity could be an important priority for urban planners and individual residents. To this end, priority could be given to conserving bird habitats as well as to installing measures that reduce bird mortality in cities, e.g., bird-safe windows. As well, many participants indicated that they strongly considered the quality of the local environment when choosing where to live, and responses to this question were significantly related to tree canopy cover near their residence. City regulations could therefore discourage the removal of trees and encourage planting them throughout the city, irrespective of location, rather than focusing greenspace attention only on parks. Real estate developers could leave existing trees and plant new ones to attract buyers. Lastly, most participants indicated that their relationship and connection to nature were important to them. City governments could take into account that residents feel strongly about nature and make conserving urban biodiversity and the natural environment a priority.
Author Contributions
Conceptualization: L.F., J.Z. and A.C.S.; Methodology: A.C.S., J.Z., L.H. and L.F.; Analysis: L.H. and A.C.S.; Investigation: L.H.; Data curation: L.H.; Writing—original draft: L.H.; Writing—review and editing: L.H., L.F., A.C.S. and J.Z.; Visualization: L.H. and A.C.S.; Funding acquisition: L.F. All authors have read and agreed to the published version of the manuscript.
Funding
This work was funded by a Natural Sciences and Engineering Research Council of Canada (NSERC) grant to L.F.
Institutional Review Board Statement
The study was conducted according to the guidelines of the Declaration of Helsinki, and approved by the Carleton University Research Ethics Board (Project # 106476, 22 February 2017).
Informed Consent Statement
Informed consent was obtained from all subjects involved in the study.
Data Availability Statement
The data collected for this study are available at https://curve.carleton.ca/c3237332-5627-40fa-bb95-09e063df7cc1 (accessed on 27 January 2021).
Acknowledgments
We are grateful to Madison Donoghue and Kayla Attinello for assistance with the surveys, to the more-than a thousand Ottawa residents who completed our survey, and to the many volunteers who conducted the Ottawa Bird Count. We thank Joe Bennett and Julie Morand-Ferron for their helpful comments on an earlier draft, and we thank reviewers for helpful suggestions. This work was funded by a Natural Sciences and Engineering Research Council of Canada (NSERC) grant to LF.
Conflicts of Interest
The authors declare no conflict of interest.
Appendix A
Figure A1.
Relationships between survey date and each of the predictor variables. The sequence of surveys was designed to avoid any confounding of survey date with any of the predictor variables (see Methods).
Figure A1.
Relationships between survey date and each of the predictor variables. The sequence of surveys was designed to avoid any confounding of survey date with any of the predictor variables (see Methods).

Figure A2.
Histograms of participant responses to survey questions (see Table 1). Responses were scored with 1 being the least positive response.
Figure A2.
Histograms of participant responses to survey questions (see Table 1). Responses were scored with 1 being the least positive response.


Table A1.
Pearson correlation coefficients between predictor variables and response rates. Predictor variables measured include bird abundance and species diversity, tree canopy cover (ha), distance to water (km), and median individual yearly income. Sites were surveyed until either there were 10 participants or until there were no more residential addresses to visit. In-person response rate is the number of individuals in the site who participated in door-to-door surveys divided by the total number of people who were spoken to in that site. The flyer response rate is the number of individuals who responded to the flyer divided by the total number of flyers left at residences. The overall response rate is the total number of participants divided by the total number of people contacted (either in-person or by flyer) in each site.
| Predictor Variable | In-Person Response Rate | Flyer Response Rate | Overall Response Rate |
|---|---|---|---|
| Bird abundance | −0.110 | −0.113 | −0.040 |
| Bird diversity | −0.091 | −0.083 | −0.048 |
| Tree canopy cover | −0.001 | −0.050 | 0.055 |
| Distance to nearest water body | −0.285 | −0.287 | −0.207 |
| Median income | 0.409 | 0.223 | 0.358 |
Figure A3.
Frequency distributions and pair-wise correlations of predictor variables. Values in the boxes are Pearson correlation coefficients. Variables are: bird abundance (total number of individuals) and bird diversity (number of bird species) measured at the Ottawa Bird Count (OBC) site closest to the residence; tree canopy cover in hectares within 250 m of the residence; Euclidean distance in km from the residence to the nearest body of water; and median yearly income in the Canadian Census Dissemination Area containing the residence.

Table A2.
Parameter coefficients for all models. Models were fit using ordered probit mixed models where site was treated as a random effect. Predictor variables included bird abundance and diversity, tree canopy cover (ha), distance to water (km), median individual yearly income and subjective happiness (taken from participants’ responses to Question 1 (Table 1)). Models either included subjective happiness as a predictor or did not. If subjective happiness was included as a predictor it was coded using orthogonal polynomial contrasts up to the sixth power. Each model only included one bird variable at a time, either bird abundance or bird diversity (number of species). Significance level is denoted by asterisks: * p < 0.05, ** p < 0.01, *** p < 0.001.
| Subjective Happiness & Bird Abundance | Subjective Happiness & Bird Diversity | Bird Abundance | Bird Diversity | ||||||
|---|---|---|---|---|---|---|---|---|---|
| Question | Parameter | Coefficients | |||||||
| Q1 | Intercept | 3.02600 | *** | 3.01100 | *** | ||||
| Bird | 0.00758 | 0.02212 | |||||||
| Tree | 0.06628 | 0.05812 | |||||||
| Water | −0.06398 | −0.06519 | |||||||
| Income | 0.00000 | 0.00000 | |||||||
| Q2 | Intercept | 3.38500 | *** | 3.36800 | *** | 3.32400 | *** | 3.31000 | *** |
| Bird | −0.00627 | −0.01461 | −0.00022 | 0.00274 | |||||
| Tree | −0.02099 | −0.01473 | 0.01353 | 0.01415 | |||||
| Water | −0.04261 | −0.04256 | −0.07485 | −0.07292 | |||||
| Income | 0.00001 | ** | 0.00001 | ** | 0.00001 | * | 0.00001 | * | |
| Happiness1 | 2.15600 | *** | 2.16000 | *** | |||||
| Happiness2 | 2.96500 | *** | 2.96000 | *** | |||||
| Happiness3 | −0.78150 | * | −0.78370 | * | |||||
| Happiness4 | 0.63130 | * | 0.63970 | * | |||||
| Happiness5 | −0.34910 | −0.36050 | |||||||
| Happiness6 | −0.05446 | −0.04752 | |||||||
| Q3 | Intercept | 2.19900 | *** | 2.10200 | *** | 2.42000 | *** | 2.32800 | *** |
| Bird | 0.00952 | 0.04230 | * | 0.01170 | * | 0.04735 | * | ||
| Tree | 0.03339 | 0.02078 | 0.05427 | 0.04022 | |||||
| Water | −0.06040 | −0.05837 | −0.07720 | −0.07522 | |||||
| Income | 0.00002 | *** | 0.00002 | *** | 0.00002 | *** | 0.00002 | *** | |
| Happiness1 | 1.14700 | *** | 1.15800 | *** | |||||
| Happiness2 | 0.81510 | ** | 0.80830 | ** | |||||
| Happiness3 | 0.19530 | 0.20070 | |||||||
| Happiness4 | −0.02998 | −0.04119 | |||||||
| Happiness5 | −0.23150 | −0.21290 | |||||||
| Happiness6 | 0.09538 | 0.07983 | |||||||
| Q4 | Intercept | 2.42100 | *** | 2.35900 | *** | 2.53000 | *** | 2.47200 | *** |
| Bird | 0.01025 | 0.03734 | * | 0.01172 | * | 0.04089 | * | ||
| Tree | 0.23740 | *** | 0.22540 | *** | 0.23730 | *** | 0.22410 | *** | |
| Water | −0.09111 | −0.09082 | −0.09829 | −0.10050 | |||||
| Income | 0.00001 | 0.00001 | 0.00001 | 0.00001 | |||||
| Happiness1 | 0.49500 | 0.49960 | |||||||
| Happiness2 | 0.85960 | ** | 0.85290 | ** | |||||
| Happiness3 | 0.23610 | 0.24720 | |||||||
| Happiness4 | −0.60740 | * | −0.62730 | * | |||||
| Happiness5 | 0.20800 | 0.22970 | |||||||
| Happiness6 | 0.06286 | 0.04530 | |||||||
| Q5 | Intercept | 2.06200 | *** | 2.08000 | *** | 2.19200 | *** | 2.22500 | *** |
| Bird | 0.01023 | 0.03073 | 0.01152 | * | 0.03408 | ||||
| Tree | 0.23430 | *** | 0.22420 | *** | 0.23300 | *** | 0.22170 | *** | |
| Water | −0.19740 | ** | −0.20080 | ** | −0.20620 | *** | −0.20860 | ** | |
| Income | 0.00002 | *** | 0.00002 | *** | 0.00002 | *** | 0.00002 | *** | |
| Happiness1 | 0.17840 | 0.19170 | |||||||
| Happiness2 | 1.00700 | *** | 1.00100 | ** | |||||
| Happiness3 | −0.17560 | −0.16940 | |||||||
| Happiness4 | −0.30160 | −0.31620 | |||||||
| Happiness5 | 0.18700 | 0.20510 | |||||||
| Happiness6 | −0.06171 | −0.07103 | |||||||
| Q6 | Intercept | 1.55100 | *** | 1.47900 | *** | 1.56800 | *** | 1.48300 | *** |
| Bird | −0.00111 | 0.00853 | −0.00065 | 0.01019 | |||||
| Tree | 0.14260 | *** | 0.14320 | *** | 0.14580 | *** | 0.14530 | *** | |
| Water | −0.17100 | ** | −0.16970 | *** | −0.17280 | *** | −0.16980 | *** | |
| Income | 0.00000 | 0.00000 | 0.00000 | 0.00000 | |||||
| Happiness1 | 0.02126 | 0.02127 | |||||||
| Happiness2 | 0.31030 | 0.30270 | |||||||
| Happiness3 | 0.14820 | 0.15630 | |||||||
| Happiness4 | −0.25780 | −0.26560 | |||||||
| Happiness5 | −0.07751 | −0.06941 | |||||||
| Happiness6 | 0.51540 | * | 0.51250 | * | |||||
| Q7 | Intercept | 3.40200 | *** | 3.38800 | *** | 3.46300 | *** | 3.45800 | *** |
| Bird | −0.00006 | −0.00027 | 0.00071 | 0.00266 | |||||
| Tree | 0.04407 | 0.04387 | 0.05515 | 0.05395 | |||||
| Water | −0.08205 | −0.08206 | −0.08869 | −0.08866 | |||||
| Income | 0.00000 | 0.00000 | 0.00000 | 0.00000 | |||||
| Happiness1 | 0.47140 | 0.47360 | |||||||
| Happiness2 | 0.39810 | 0.38820 | |||||||
| Happiness3 | 0.08638 | 0.09173 | |||||||
| Happiness4 | 0.14360 | 0.14320 | |||||||
| Happiness5 | −0.15360 | −0.15360 | |||||||
| Happiness6 | 0.18490 | 0.18250 | |||||||
| Q8 | Intercept | 2.97800 | *** | 3.00700 | *** | 3.10600 | *** | 3.15100 | *** |
| Bird | −0.00048 | −0.00751 | 0.00080 | −0.00315 | |||||
| Tree | 0.05728 | 0.05916 | 0.06658 | 0.06567 | |||||
| Water | −0.03238 | −0.03307 | −0.04239 | −0.04519 | |||||
| Income | 0.00000 | 0.00000 | 0.00000 | 0.00000 | |||||
| Happiness1 | 0.48080 | 0.47560 | |||||||
| Happiness2 | 0.59690 | 0.60200 | |||||||
| Happiness3 | −0.15990 | −0.16370 | |||||||
| Happiness4 | 0.27170 | 0.27350 | |||||||
| Happiness5 | −0.32430 | −0.32350 | |||||||
| Happiness6 | 0.05675 | 0.05339 | |||||||
Table A3.
Pairwise Spearman correlation values between the participant responses to the 8 questions. Questions and possible responses are in Table 1.
Table A3.
Pairwise Spearman correlation values between the participant responses to the 8 questions. Questions and possible responses are in Table 1.
| Subjective Happiness (Q1) | Overall Satisfaction (Q2) | Neighbourhood Satisfaction (Q3) | Environment Satisfaction (Q4) | Environment Comparison (Q5) | Environment Importance (Q6) | Nature Relationship (Q7) | Nature Connectivity (Q8) | |
|---|---|---|---|---|---|---|---|---|
| Q1 | 0.574 | 0.288 | 0.219 | 0.185 | 0.084 | 0.130 | 0.143 | |
| Q2 | 0.250 | 0.173 | 0.177 | 0.050 | 0.116 | 0.117 | ||
| Q3 | 0.453 | 0.334 | 0.117 | 0.085 | 0.100 | |||
| Q4 | 0.517 | 0.245 | 0.137 | 0.142 | ||||
| Q5 | 0.392 | 0.230 | 0.185 | |||||
| Q6 | 0.386 | 0.266 | ||||||
| Q7 | 0.591 | |||||||
| Q8 |
References
- Sandifer, P.A.; Sutton-Grier, A.E.; Ward, B.P. Exploring connections among nature, biodiversity, ecosystem services, and human health and well-being: Opportunities to enhance health and biodiversity conservation. Ecosyst. Serv. 2015, 12, 1–15. [Google Scholar] [CrossRef] [Green Version]
- De Vries, S.; Verheij, R.A.; Groenewegen, P.P.; Spreeuwenberg, P. Natural environments—Healthy environments? An exploratory analysis of the relationship between greenspace and health. Environ. Plan. A 2003, 35, 1717–1731. [Google Scholar] [CrossRef] [Green Version]
- Berman, M.G.; Jonides, J.; Kaplan, S. The cognitive benefits of interacting with nature. Psychol. Sci. 2008, 19, 1207–1212. [Google Scholar] [CrossRef] [PubMed]
- Park, B.J.; Furuya, K.; Kasetani, T.; Takayama, N.; Kagawa, T.; Miyazaki, Y. Relationship between psychological responses and physical environments in forest settings. Landsc. Urban Plan. 2011, 102, 24–32. [Google Scholar] [CrossRef]
- Mackerron, G.; Mourato, S. Happiness is greater in natural environments. Glob. Environ. Chang. 2013, 23, 992–1000. [Google Scholar] [CrossRef] [Green Version]
- Wheeler, B.W.; Lovell, R.; Higgins, S.L.; White, M.P.; Alcock, I.; Osborne, N.J.; Husk, K.; Sabel, C.E.; Depledge, M.H. Beyond greenspace: An ecological study of population general health and indicators of natural environment type and quality. Int. J. Health Geogr. 2015, 14, 17. [Google Scholar] [CrossRef] [Green Version]
- Methorst, J.; Rehdanz, K.; Mueller, T.; Hansjürgens, B.; Bonn, A.; Böhning-Gaese, K. The importance of species diversity for human well-being in Europe. Ecol. Econ. 2021, in press. [Google Scholar] [CrossRef]
- Hartig, T.; Mitchell, R.; de Vries, S.; Frumkin, H. Nature and health. Annu. Rev. Public Health 2014, 35, 207–228. [Google Scholar] [CrossRef] [Green Version]
- Schwarz, N.; Moretti, M.; Bugalho, M.N.; Davies, Z.G.; Haase, D.; Hack, J.; Hof, A.; Melero, Y.; Pett, T.J.; Knapp, S. Understanding biodiversity-ecosystem service relationships in urban areas: A comprehensive literature review. Ecosyst. Serv. 2017, 27, 161–171. [Google Scholar] [CrossRef] [Green Version]
- Baxter, D.E.; Pelletier, L.G. Is nature relatedness a basic human psychological need? A critical examination of the extant literature. Can. Psychol. 2019, 60, 21–34. [Google Scholar] [CrossRef]
- Capaldi, C.A.; Dopko, R.L.; Zelenski, J.M. The relationship between nature connectedness and happiness: A meta-analysis. Front. Psychol. 2014, 5, 976. [Google Scholar] [CrossRef] [PubMed] [Green Version]
- Botzat, A.; Fischer, L.K.; Kowarik, I. Unexploited opportunities in understanding liveable and biodiverse cities. A review on urban biodiversity perception and valuation. Glob. Environ. Chang. 2016, 39, 220–233. [Google Scholar]
- Aerts, R.; Honnay, O.; Van Nieuwenhuyse, A. Biodiversity and human health: Mechanisms and evidence of the positive health effects of diversity in nature and green spaces. Br. Med Bull. 2018, 127, 5–22. [Google Scholar] [CrossRef] [PubMed] [Green Version]
- Dallimer, M.; Irvine, K.N.; Skinner, A.M.; Davies, Z.G.; Rouquette, J.R.; Maltby, L.L.; Warren, P.H.; Armsworth, P.R.; Gaston, K.J. Biodiversity and the feel-good factor: Understanding associations between self-reported human well-being and species richness. BioScience 2012, 62, 47–55. [Google Scholar] [CrossRef] [Green Version]
- McKinney, M.L. Effects of urbanization on species richness: A review of plants and animals. Urban Ecosyst. 2008, 11, 161–176. [Google Scholar] [CrossRef]
- United Nations. World Urbanization Prospects: The 2018 Revision. 2018. Available online: https://esa.un.org/unpd/wup/Publications/Files/WUP2018-KeyFacts.pdf (accessed on 1 April 2018).
- Fuller, R.A.; Irvine, K.N.; Devine-Wright, P.; Warren, P.H.; Gaston, K.J. Psychological benefits of greenspace increase with biodiversity. Biol. Lett. 2007, 3, 390–394. [Google Scholar] [CrossRef]
- Cameron, R.W.; Brindley, P.; Mears, M.; McEwan, K.; Ferguson, F.; Sheffield, D.; Jorgensen, A.; Riley, J.; Goodrick, J.; Ballard, L.; et al. Where the wild things are! Do urban green spaces with greater avian biodiversity promote more positive emotions in humans? Urban Ecosyst. 2020, 23, 301–317. [Google Scholar] [CrossRef] [Green Version]
- Carrus, G.; Scopelliti, M.; Lafortezza, R.; Colangelo, G.; Ferrini, F.; Salbitano, F.; Agrimi, M.; Portoghesi, L.; Semenzato, P.; Sanesi, G. Go greener, feel better? The positive effects of biodiversity on the well-being of individuals visiting urban and peri-urban green areas. Landsc. Urban Plan. 2015, 134, 221–228. [Google Scholar] [CrossRef]
- White, M.P.; Alcock, I.; Wheeler, B.W.; Depledge, M.H. Would you be happier living in a greener urban area? A fixed-effects analysis of panel data. Psychol. Sci. 2013, 24, 920–928. [Google Scholar] [CrossRef]
- Lin, B.B.; Fuller, R.A.; Bush, R.; Gaston, K.J.; Shanahan, D.F. Opportunity or orientation? Who uses urban parks and why. PLoS ONE 2014, 9, e87422. [Google Scholar] [CrossRef] [Green Version]
- Houlden, V.; de Albuquerque, J.P.; Weich, S.; Jarvis, S. A spatial analysis of proximate greenspace and mental wellbeing in London. Appl. Geogr. 2019, 109, e102036. [Google Scholar] [CrossRef]
- Cox, D.T.; Shanahan, D.F.; Hudson, H.L.; Plummer, K.E.; Siriwardena, G.M.; Fuller, R.A.; Anderson, K.; Hancock, S.; Gaston, K.J. Doses of neighborhood nature: The benefits for mental health of living with nature. BioScience 2017, 67, 147–155. [Google Scholar] [CrossRef]
- Kardan, O.; Gozdyra, P.; Misic, B.; Moola, F.; Palmer, L.J.; Paus, T.; Berman, M.G. Neighborhood greenspace and health in a large urban center. Sci. Rep. 2015, 5, 11610. [Google Scholar] [CrossRef] [PubMed] [Green Version]
- Loram, A.; Tratalos, J.; Warren, P.H.; Gaston, K.J. Urban domestic gardens (X): The extent & structure of the resource in five major cities. Landsc. Ecol. 2007, 22, 601–615. [Google Scholar]
- Belaire, J.A.; Whelan, C.J.; Minor, E.S. Having our yards and sharing them too: The collective effects of yards on native bird species in an urban landscape. Ecol. Appl. 2014, 24, 2132–2143. [Google Scholar] [CrossRef] [PubMed]
- Diener, E.D.; Emmons, R.A.; Larsen, R.J.; Griffin, S. The satisfaction with life scale. J. Personal. Assess. 1985, 49, 71–75. [Google Scholar] [CrossRef] [PubMed]
- Lyubomirsky, S.; Lepper, H.S. A measure of subjective happiness: Preliminary reliability and construct validation. Soc. Indic. Res. 1999, 46, 137–155. [Google Scholar] [CrossRef]
- Inglehart, R.; Haerpfer, C.; Moreno, A.; Welzel, C.; Kizilova, K.; Diez-Medrano, J.; Lagos, M.; Norris, P.; Ponarin, E.; Puranen, B.; et al. (Eds.) World Values Survey: Round Six—Country-Pooled Datafile Version; JD Systems Institute: Madrid, Spain, 2014; Available online: www.worldvaluessurvey.org/WVSDocumentationWV6.jsp (accessed on 1 October 2016).
- Diener, E.; Lucas, R.E.; Oishi, S. Advances and open questions in the science of subjective well-being. Collabra Psychol. 2018, 4, 15. [Google Scholar] [CrossRef] [Green Version]
- Nisbet, E.K.; Zelenski, J.M.; Murphy, S.A. The nature relatedness scale: Linking individuals’ connection with nature to environmental concern and behavior. Environ. Behav. 2009, 41, 715–740. [Google Scholar] [CrossRef]
- Panchen, Z.A.; Primack, R.B.; Gallinat, A.S.; Nordt, B.; Stevens, A.D.; Du, Y.; Fahey, R. Substantial variation in leaf senescence times among 1360 temperate woody plant species: Implications for phenology and ecosystem processes. Ann. Bot. 2015, 116, 865–873. [Google Scholar] [CrossRef] [Green Version]
- Panchen, Z.A.; Primack, R.B.; Nordt, B.; Ellwood, E.R.; Stevens, A.D.; Renner, S.S.; Willis, C.G.; Fahey, R.; Whittemore, A.; Du, Y.; et al. Leaf out times of temperate woody plants are related to phylogeny, deciduousness, growth habit and wood anatomy. New Phytol. 2014, 203, 1208–1219. [Google Scholar] [CrossRef] [PubMed]
- Qualtrics. Provo, UT, USA. 2017. Available online: www.qualtrics.com (accessed on 1 October 2016).
- City of Ottawa. Address Point. GIS Point Shapefile; City of Ottawa: Ottawa, ON, Canada, 2017. [Google Scholar]
- Murray, G. The Seasonal Pattern Assessment Questionnaire as a measure of mood seasonality: A prospective validation study. Psychiatry Res. 2003, 120, 53–59. [Google Scholar] [CrossRef]
- Yap, S.C.; Wortman, J.; Anusic, I.; Baker, S.G.; Scherer, L.D.; Donnellan, M.B.; Lucas, R.E. The effect of mood on judgments of subjective well-being: Nine tests of the judgment model. J. Personal. Soc. Psychol. 2017, 113, 939–961. [Google Scholar] [CrossRef] [PubMed]
- Smith, A.C.; Francis, C.M.; Fahrig, L. Similar effects of residential and non-residential vegetation on bird diversity in suburban neighbourhoods. Urban Ecosyst. 2014, 17, 27–44. [Google Scholar] [CrossRef]
- City of Ottawa. Tree Canopy Cover. GIS Polygon Shapefile; City of Ottawa: Ottawa, ON, Canada, 2015. [Google Scholar]
- ESRI. ArcGIS Version 10.5.1; Environmental Systems Research Institute: Redlands, CA, USA, 2018. [Google Scholar]
- City of Ottawa. Major Waterbodies. GIS Polygon Shapefile; City of Ottawa: Ottawa, ON, Canada, 2018. [Google Scholar]
- Clark, A.E.; Frijters, P.; Shields, M.A. Relative income, happiness, and utility: An explanation for the Easterlin paradox and other puzzles. J. Econ. Lit. 2008, 46, 95–144. [Google Scholar] [CrossRef] [Green Version]
- Sander, H.; Polasky, S.; Haight, R.G. The value of urban tree cover: A hedonic property price model in Ramsey and Dakota Counties, Minnesota, USA. Ecol. Econ. 2010, 69, 1646–1656. [Google Scholar] [CrossRef]
- Statistics Canada. National Household Survey (NHS): Ottawa-Gatineau, CMA, Ontario [Code 505; Table]. Statistics Canada Catalogue No. 99-004-XWE. Ottawa. Released 11 September 2013. 2011. Available online: http://www12.statcan.gc.ca/nhs-enm/2011/dp-pd/prof/index.cfm?Lang=E (accessed on 1 October 2016).
- R Core Team. R: A Language and Environment for Statistical Computing; R Foundation for Statistical Computing: Vienna, Austria, 2018. [Google Scholar]
- Hadfield, J.D. MCMC Methods for Multi-Response Generalized Linear Mixed Models: The MCMCglmm R Package. J. Stat. Softw. 2010, 33, 1–22. [Google Scholar] [CrossRef] [Green Version]
- Kozma, A.; Stone, S.; Stones, M.J. Stability in components and predictors of subjective well-being (SWB): Implications for SWB structure. In Advances in Quality of Life Theory and Research; Diener, E., Rahtz, D., Eds.; Springer: Dordrecht, The Netherlands, 2000; pp. 13–30. [Google Scholar]
- Gelman, A.; Rubin, D.B. Inference from iterative simulation using multiple sequences. Stat. Sci. 1992, 7, 457–472. [Google Scholar] [CrossRef]
- Gelman, A.; Carlin, J.B.; Stern, H.S.; Dunson, D.B.; Vehtari, A.; Rubin, D.B. Bayesian Data Analysis, 3rd ed.; Chapman and Hall–CRC: Boca Raton, FL, USA, 2014. [Google Scholar]
- Wiley, J. postMCMCglmm: Average Marginal Predicted Probabilities from Bayesian Ordered Probit Models. R Package Version 0.1-2. 2013. Available online: https://rdrr.io/github/JWiley/postMCMCglmm/ (accessed on 1 December 2017).
- Lerman, S.B.; Warren, P.S. The conservation value of residential yards: Linking birds and people. Ecol. Appl. 2011, 21, 1327–1339. [Google Scholar] [CrossRef]
- 52 Bryce, R.; Irvine, K.N.; Church, A.; Fish, R.; Ranger, S.; Kenter, J.O. Subjective well-being indicators for large-scale assessment of cultural ecosystem services. Ecosyst. Serv. 2016, 21, 258–269. [Google Scholar] [CrossRef] [Green Version]
- Wolf, L.J.; zu Ermgassen, S.; Balmford, A.; White, M.; Weinstein, N. Is variety the spice of life? An experimental investigation into the effects of species richness on self-reported mental well-being. PLoS ONE 2017, 12, e0170225. [Google Scholar] [CrossRef] [PubMed] [Green Version]
- Hedblom, M.; Knez, I.; Sang, Å.O.; Gunnarsson, B. Evaluation of natural sounds in urban greenery: Potential impact for urban nature preservation. R. Soc. Open sci. 2017, 4, 170037. [Google Scholar] [CrossRef] [PubMed] [Green Version]
- Ulrich, R.S. Biophilia, biophobia, and natural landscapes. In The Biophilia Hypothesis; Kellert, S.R., Wilson, E.O., Eds.; Island Press: Washington, DC, USA, 1993; pp. 73–137. [Google Scholar]
- Jiang, B.; Larsen, L.; Deal, B.; Sullivan, W.C. A dose—Response curve describing the relationship between tree cover density and landscape preference. Landsc. Urban Plan. 2015, 139, 16–25. [Google Scholar] [CrossRef]
- White, M.; Smith, A.; Humphryes, K.; Pahl, S.; Snelling, D.; Depledge, M. Blue space: The importance of water for preference, affect, and restorativeness ratings of natural and built scenes. J. Environ. Psychol. 2010, 30, 482–493. [Google Scholar] [CrossRef]
- Orne, M.T. On the social psychology of the psychological experiment: With particular reference to demand characteristics and their implications. Am. Psychol. 1962, 17, 776. [Google Scholar] [CrossRef]
- Johns, R. Likert Items and Scales. Survey Question Bank: Methods Fact Sheet 1. 2010. Available online: https://ukdataservice.ac.uk/media/262829/discover_likertfactsheet.pdf (accessed on 1 October 2016).
- Luck, G.W.; Davidson, P.; Boxall, D.; Smallbone, L. Relations between urban bird and plant communities and human well-being and connection to nature. Conserv. Biol. 2011, 25, 816–826. [Google Scholar] [CrossRef]
- Nisbet, E.K.; Zelenski, J.M. The NR-6: A new brief measure of nature relatedness. Front. Psychol. 2013, 4, 813. [Google Scholar] [CrossRef] [Green Version]
- Matsuoka, R.H.; Kaplan, R. People needs in the urban landscape: Analysis of landscape and urban planning contributions. Landsc. Urban Plan. 2008, 84, 7–19. [Google Scholar] [CrossRef]
- Saw, L.E.; Lim, F.K.; Carrasco, L.R. The relationship between natural park usage and happiness does not hold in a tropical city-state. PLoS ONE 2015, 10, e0133781. [Google Scholar] [CrossRef] [Green Version]
Figure 1.
Location of the study region in Ottawa, Canada (A), and the distribution of 100 study sites across residential Ottawa (B). Each 250 m-radius site was centered on a pre-existing bird survey location from the Ottawa Bird Count (OBC). Within the sites, residents were surveyed door-to-door about their satisfaction with their local neighbourhood (see Table 1 for list of survey questions). Responses were related to independent measures of the local environment around each residence: bird abundance and diversity, tree canopy cover, and distance to water.

Figure 2.
The independent effects of each of the four predictor variables, after controlling for the effects of all other variables, on the probability (+/− 95% credible intervals) of a participant answering the most positive option to each of questions 1 to 8 in Table 1 (rows A to H). Predictor variables are bird species richness, tree canopy cover in ha within the 250-m radius area surrounding the residence, distance of the residence to the nearest water body in km, and median income of the Canadian Census Dissemination Area within which the residence was found. Each plot shows the effect of one predictor, while all other predictors are held constant at their means. Effects plotted in blue have 95% credible intervals around the coefficient estimates not overlapping 0.


Table 1.
Survey questions and possible responses. Participants were residents in Ottawa who lived within 250 m of pre-existing bird survey locations of the Ottawa Bird Count (OBC). Participants were recruited door-to-door and through flyers during the summer of 2017. Questions were asked singly and in order, and participants were not allowed to change their answers once they had been given.
| Question | Possible Responses | |||||||
|---|---|---|---|---|---|---|---|---|
| Q1 | How would you best describe your subjective happiness? | Extremely happy | Moderately happy | Slightly happy | Neither happy nor unhappy | Slightly unhappy | Moderately unhappy | Extremely unhappy |
| Q2 | How would you best describe your satisfaction with your life as a whole? | Extremely satisfied | Moderately satisfied | Slightly satisfied | Neither satisfied nor unsatisfied | Slightly unsatisfied | Moderately unsatisfied | Extremely unsatisfied |
| Q3 | How would you best describe your satisfaction with your neighbourhood (i.e., the immediate area surrounding your residence, usually within a few hundred metres)? | Extremely satisfied | Moderately satisfied | Slightly satisfied | Neither satisfied nor unsatisfied | Slightly unsatisfied | Moderately unsatisfied | Extremely unsatisfied |
| Q4 | How would you best describe your satisfaction with the natural environment in your neighbourhood? | Extremely satisfied | Moderately satisfied | Slightly satisfied | Neither satisfied nor unsatisfied | Slightly unsatisfied | Moderately unsatisfied | Extremely unsatisfied |
| Q5 | How would you rate the quality of your neighbourhood’s natural environment compared to other areas in Ottawa? | Far above average | Moderately above average | Slightly above average | Average | Slightly below average | Moderately below average | Far below average |
| Q6 | How important a factor was the quality of the natural environment when you were choosing where to live? | Extremely important | Very important | Moderately important | Slightly important | Not at all important | ||
| Q7 | How do you feel about the statement “My relationship to nature is an important part of who I am”? | Strongly agree | Agree a little | Neither agree not disagree | Disagree a little | Strongly disagree | ||
| Q8 | How do you feel about the statement “I feel very connected to all living things and the earth”? | Strongly agree | Agree a little | Neither agree not disagree | Disagree a little | Strongly disagree | ||
Publisher’s Note: MDPI stays neutral with regard to jurisdictional claims in published maps and institutional affiliations. |
© 2021 by the authors. Licensee MDPI, Basel, Switzerland. This article is an open access article distributed under the terms and conditions of the Creative Commons Attribution (CC BY) license (http://creativecommons.org/licenses/by/4.0/).
Share and Cite
MDPI and ACS Style
Hepburn, L.; Smith, A.C.; Zelenski, J.; Fahrig, L. Bird Diversity Unconsciously Increases People’s Satisfaction with Where They Live. Land 2021, 10, 153. https://doi.org/10.3390/land10020153
AMA Style
Hepburn L, Smith AC, Zelenski J, Fahrig L. Bird Diversity Unconsciously Increases People’s Satisfaction with Where They Live. Land. 2021; 10(2):153. https://doi.org/10.3390/land10020153
Chicago/Turabian StyleHepburn, Lauren, Adam C. Smith, John Zelenski, and Lenore Fahrig. 2021. "Bird Diversity Unconsciously Increases People’s Satisfaction with Where They Live" Land 10, no. 2: 153. https://doi.org/10.3390/land10020153
Note that from the first issue of 2016, this journal uses article numbers instead of page numbers. See further details here.