Three Decades of Land Cover Change in East Africa


 ,
,  ,
,
Abstract
:1. Introduction
2. Methodology
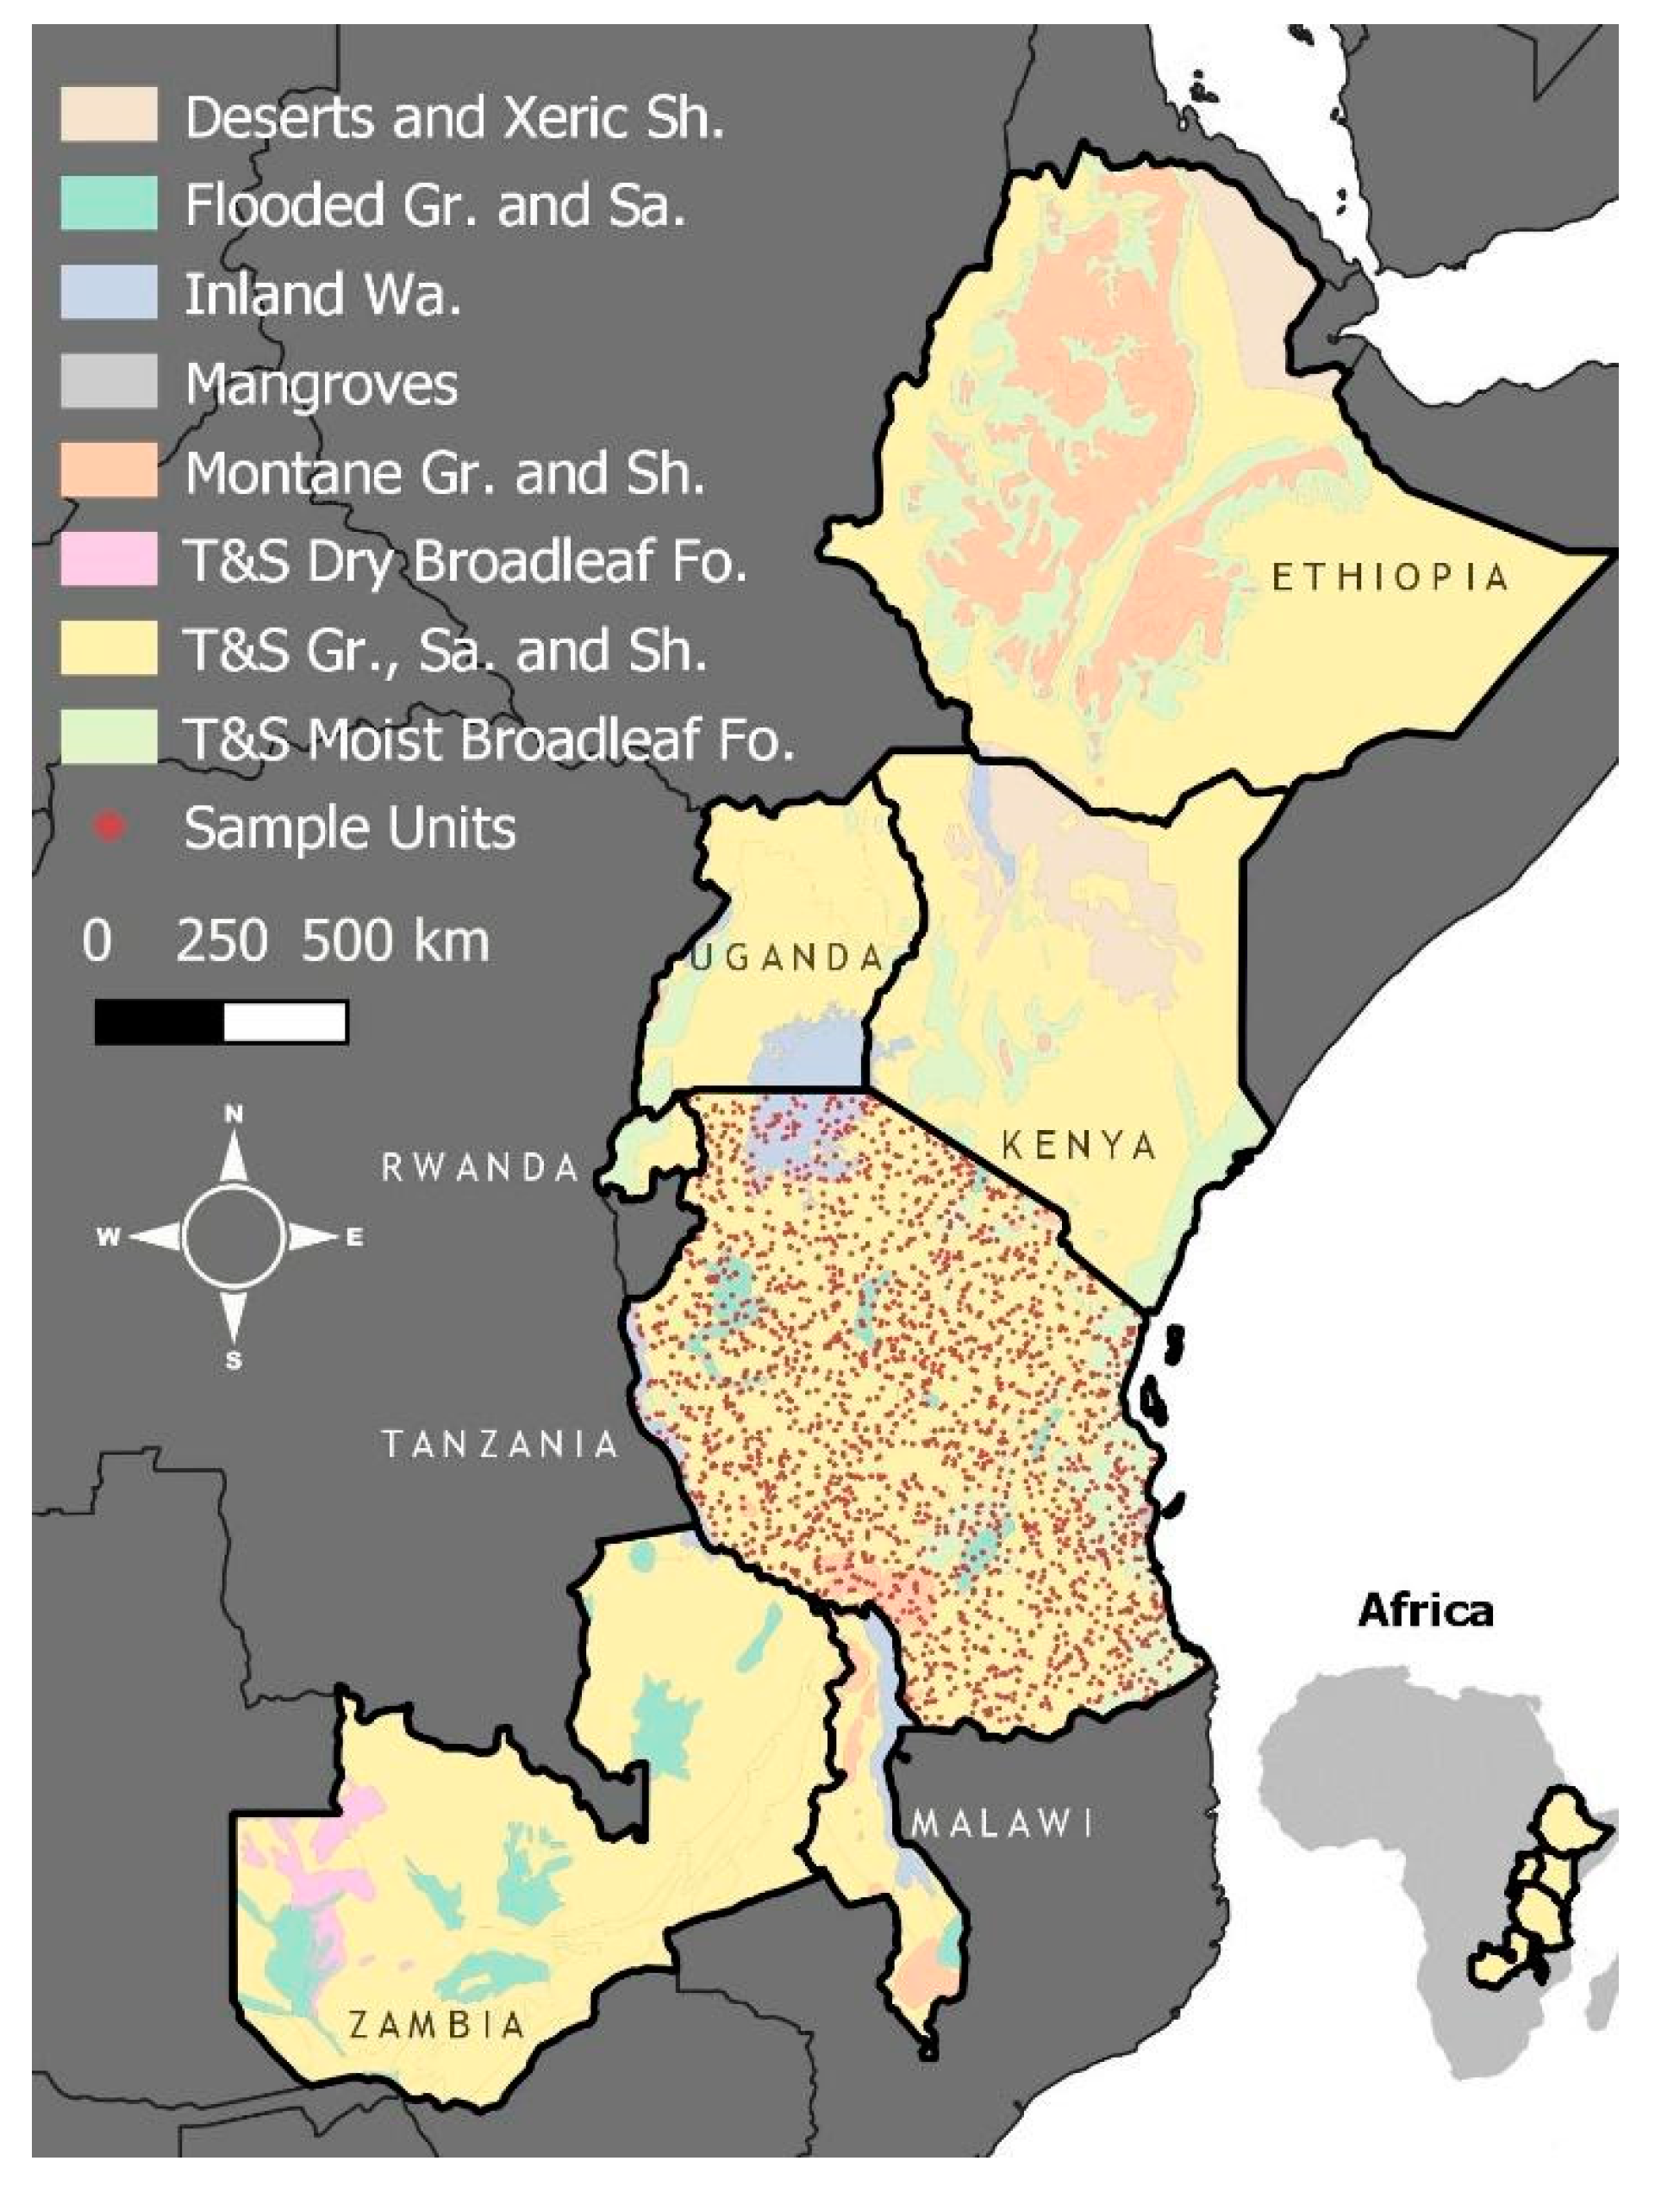
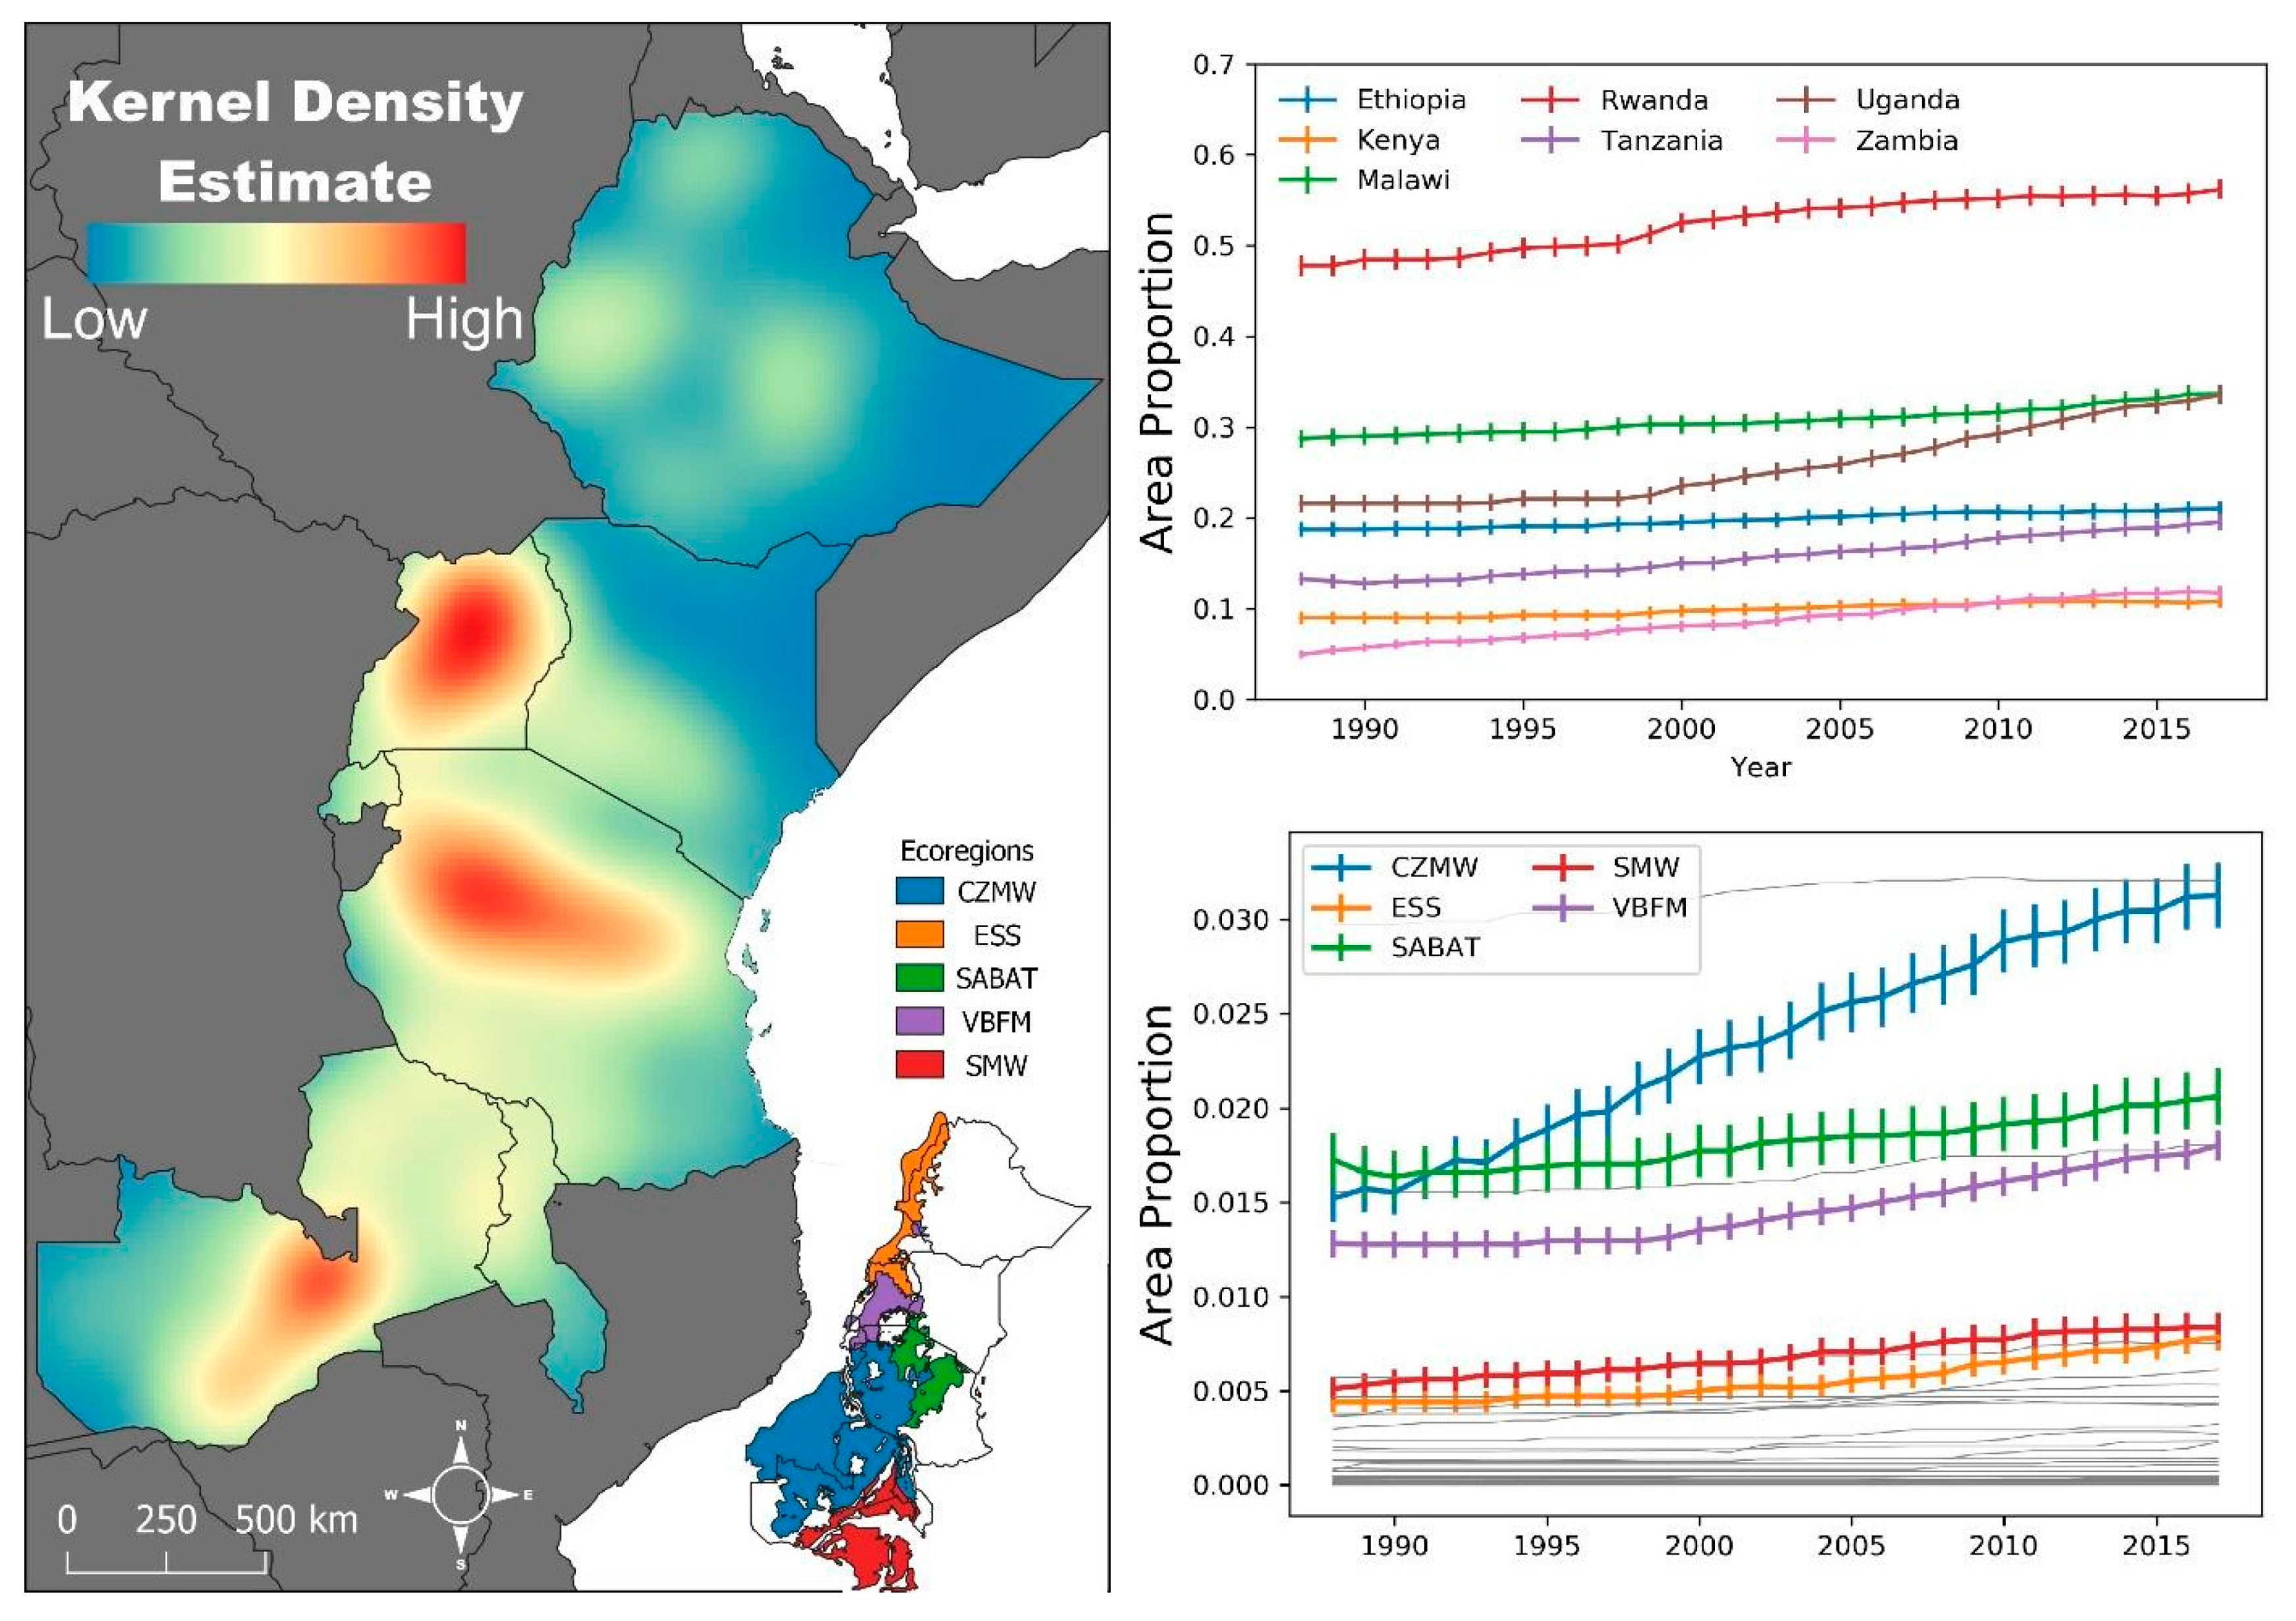
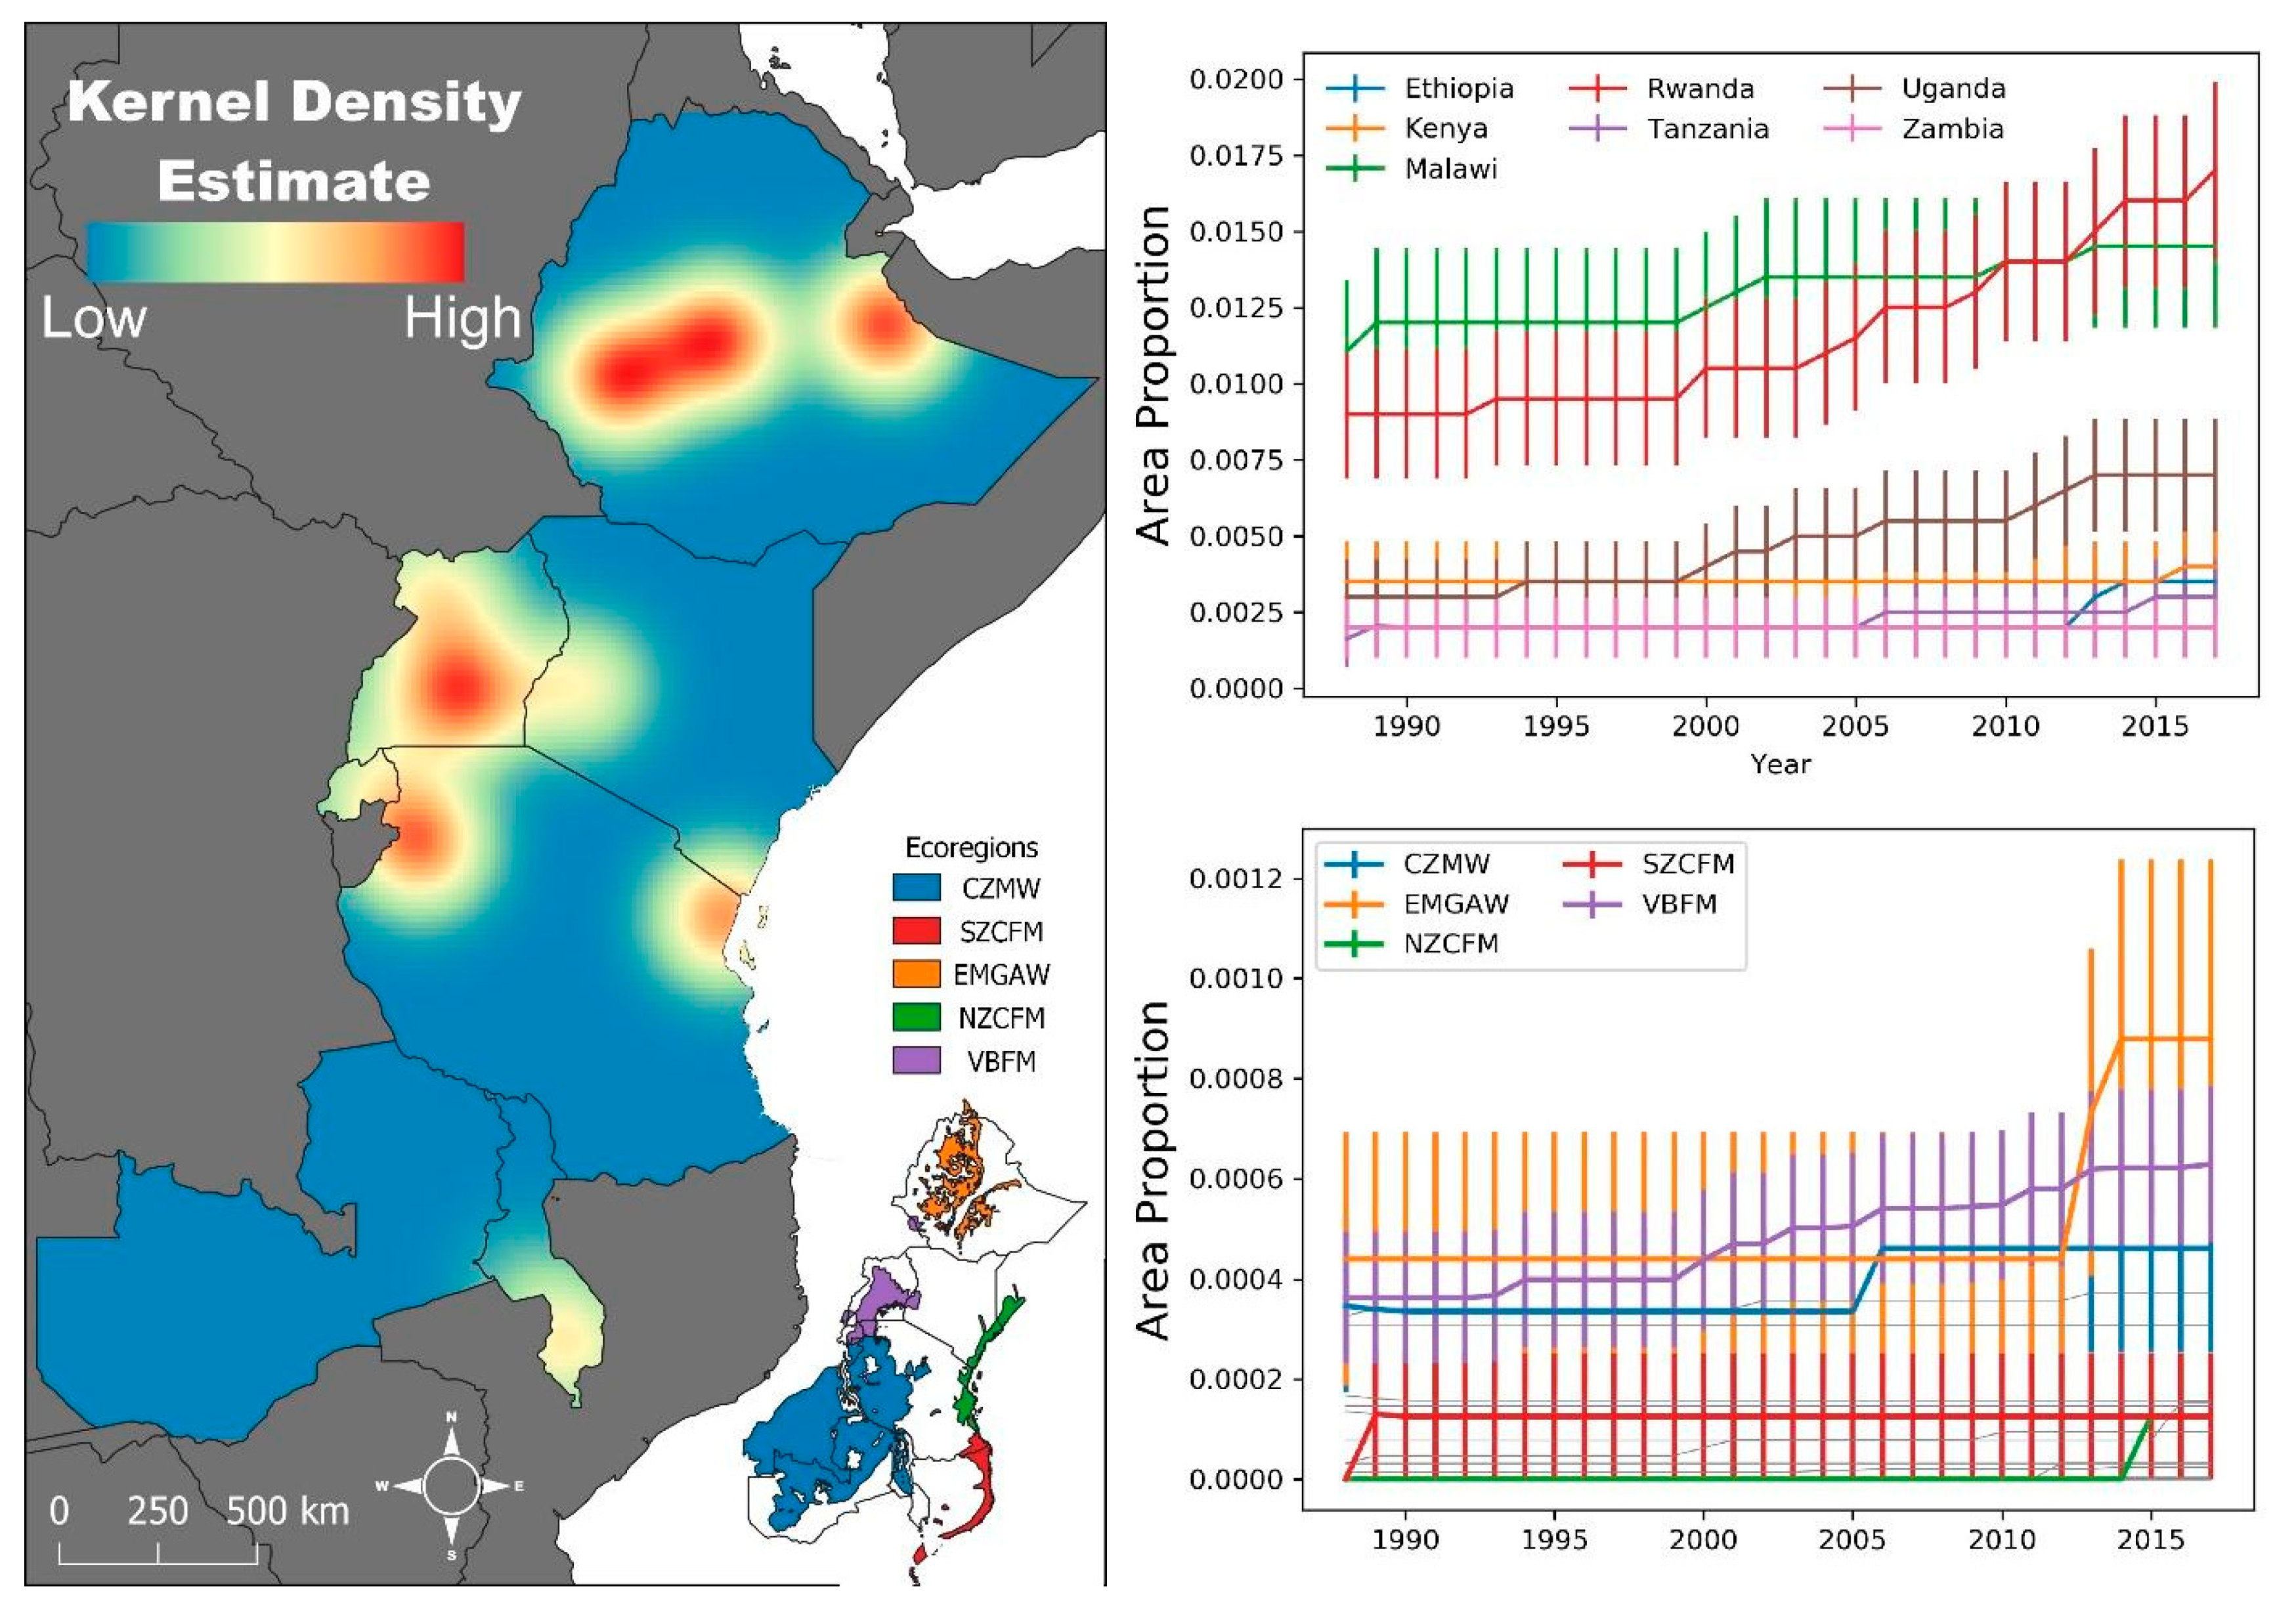
2.1. Study Area
2.2. Area Estimation
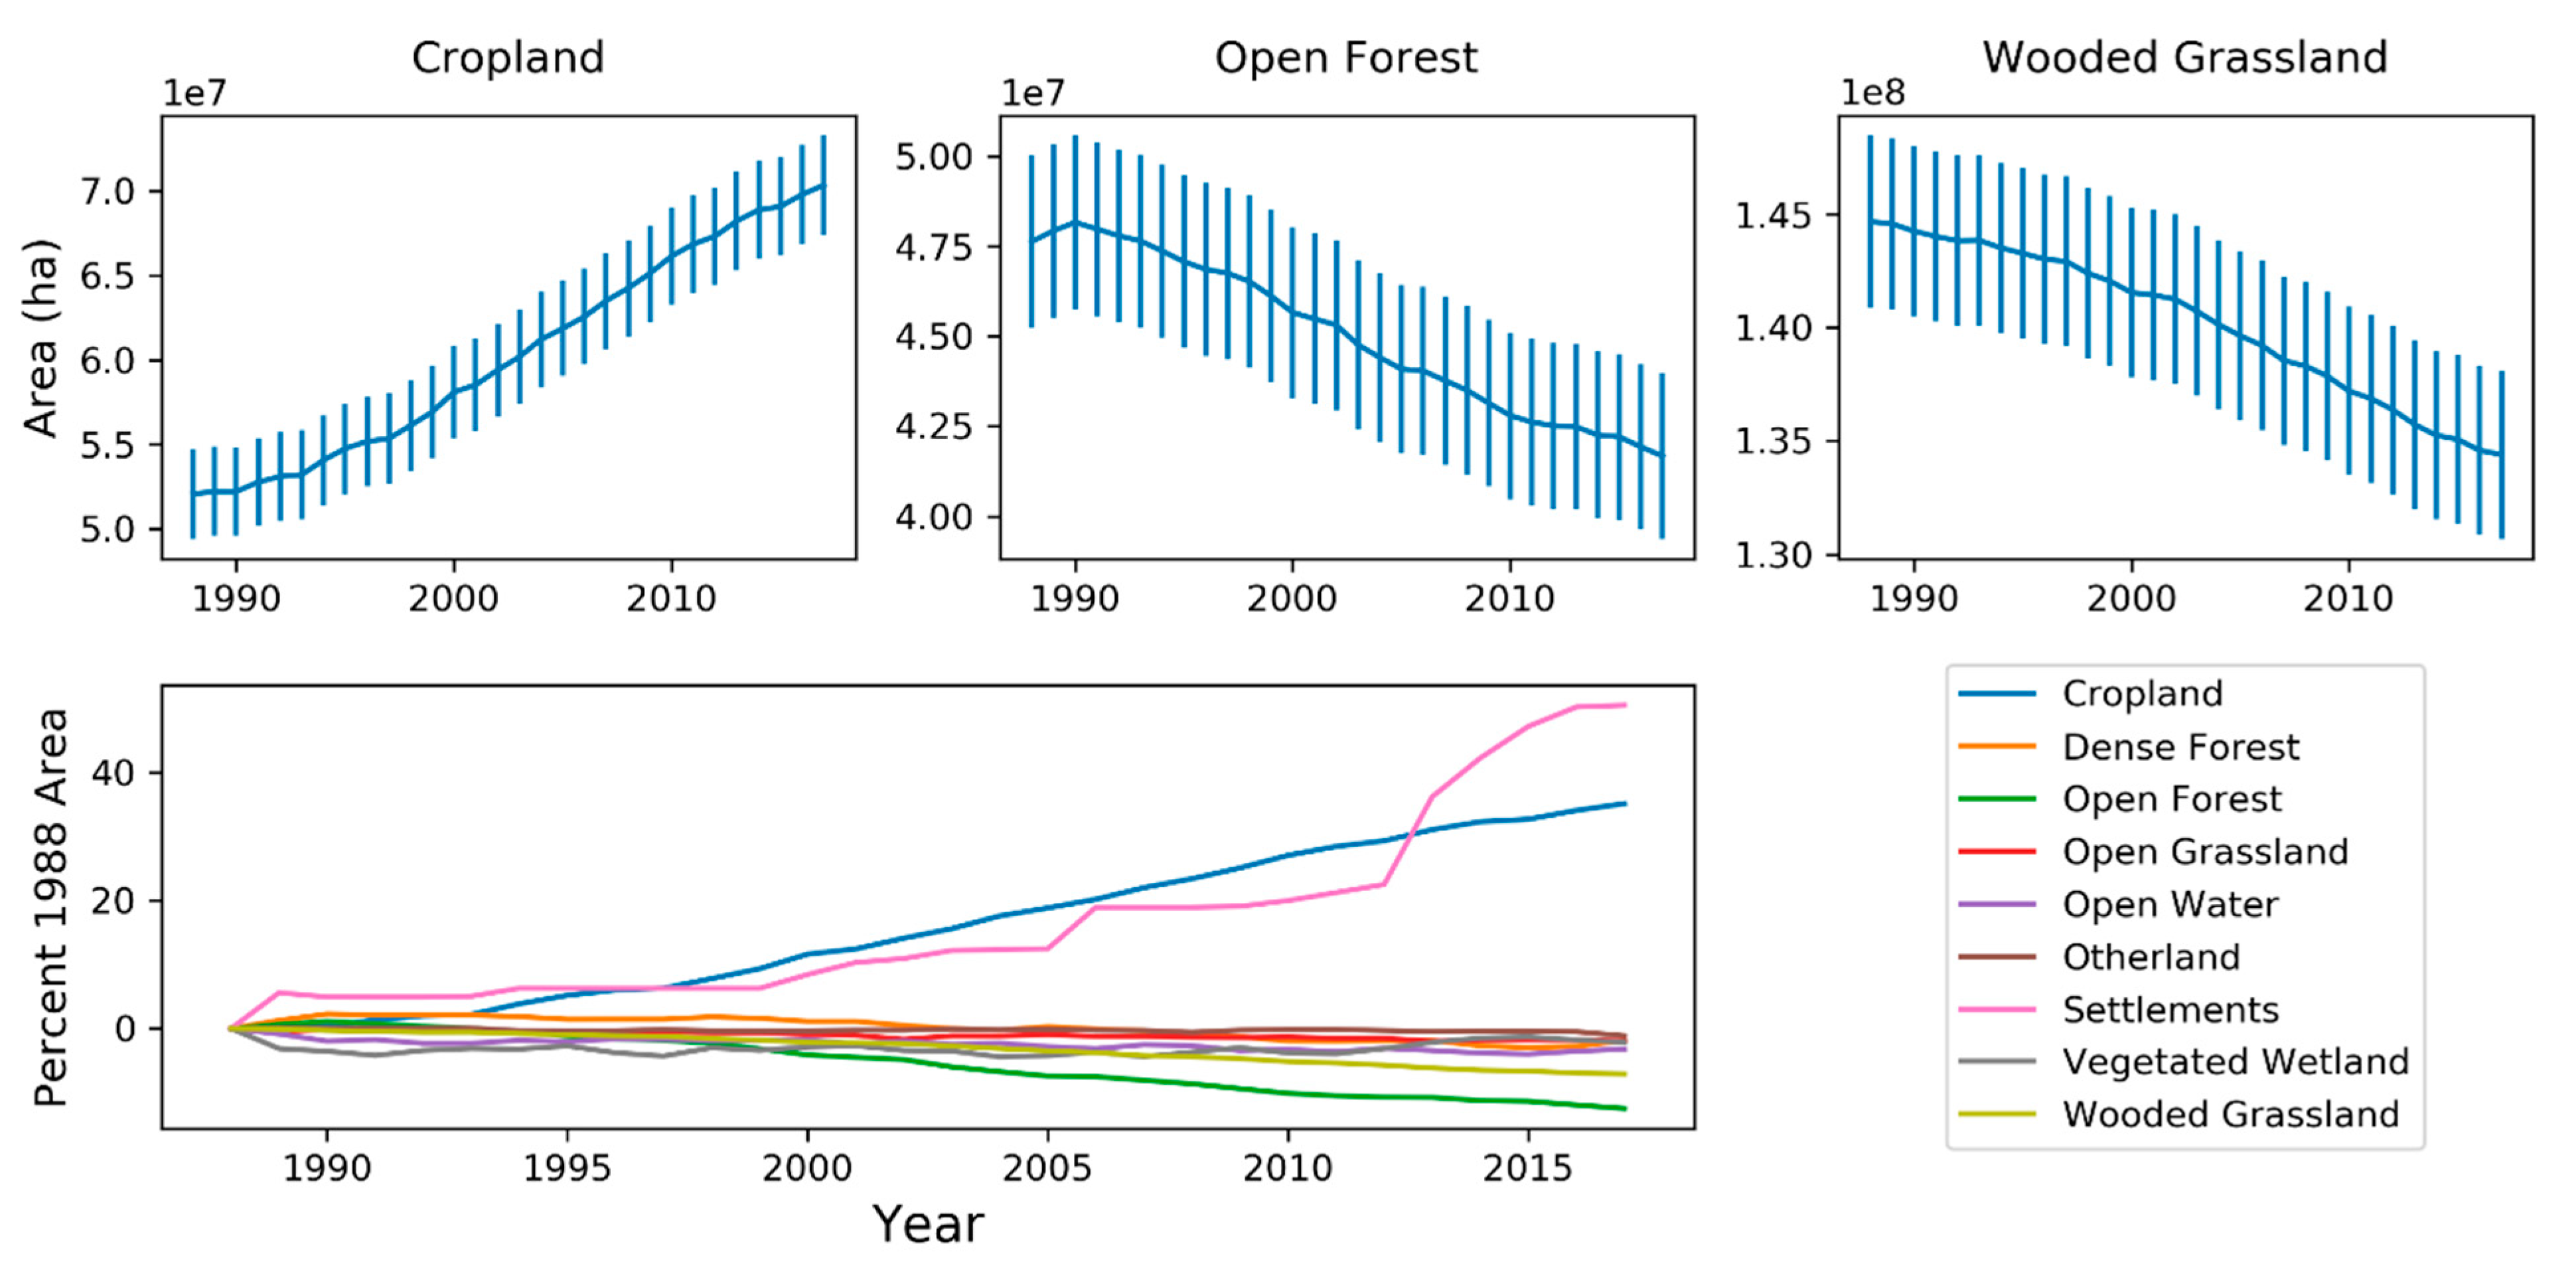
3. Results
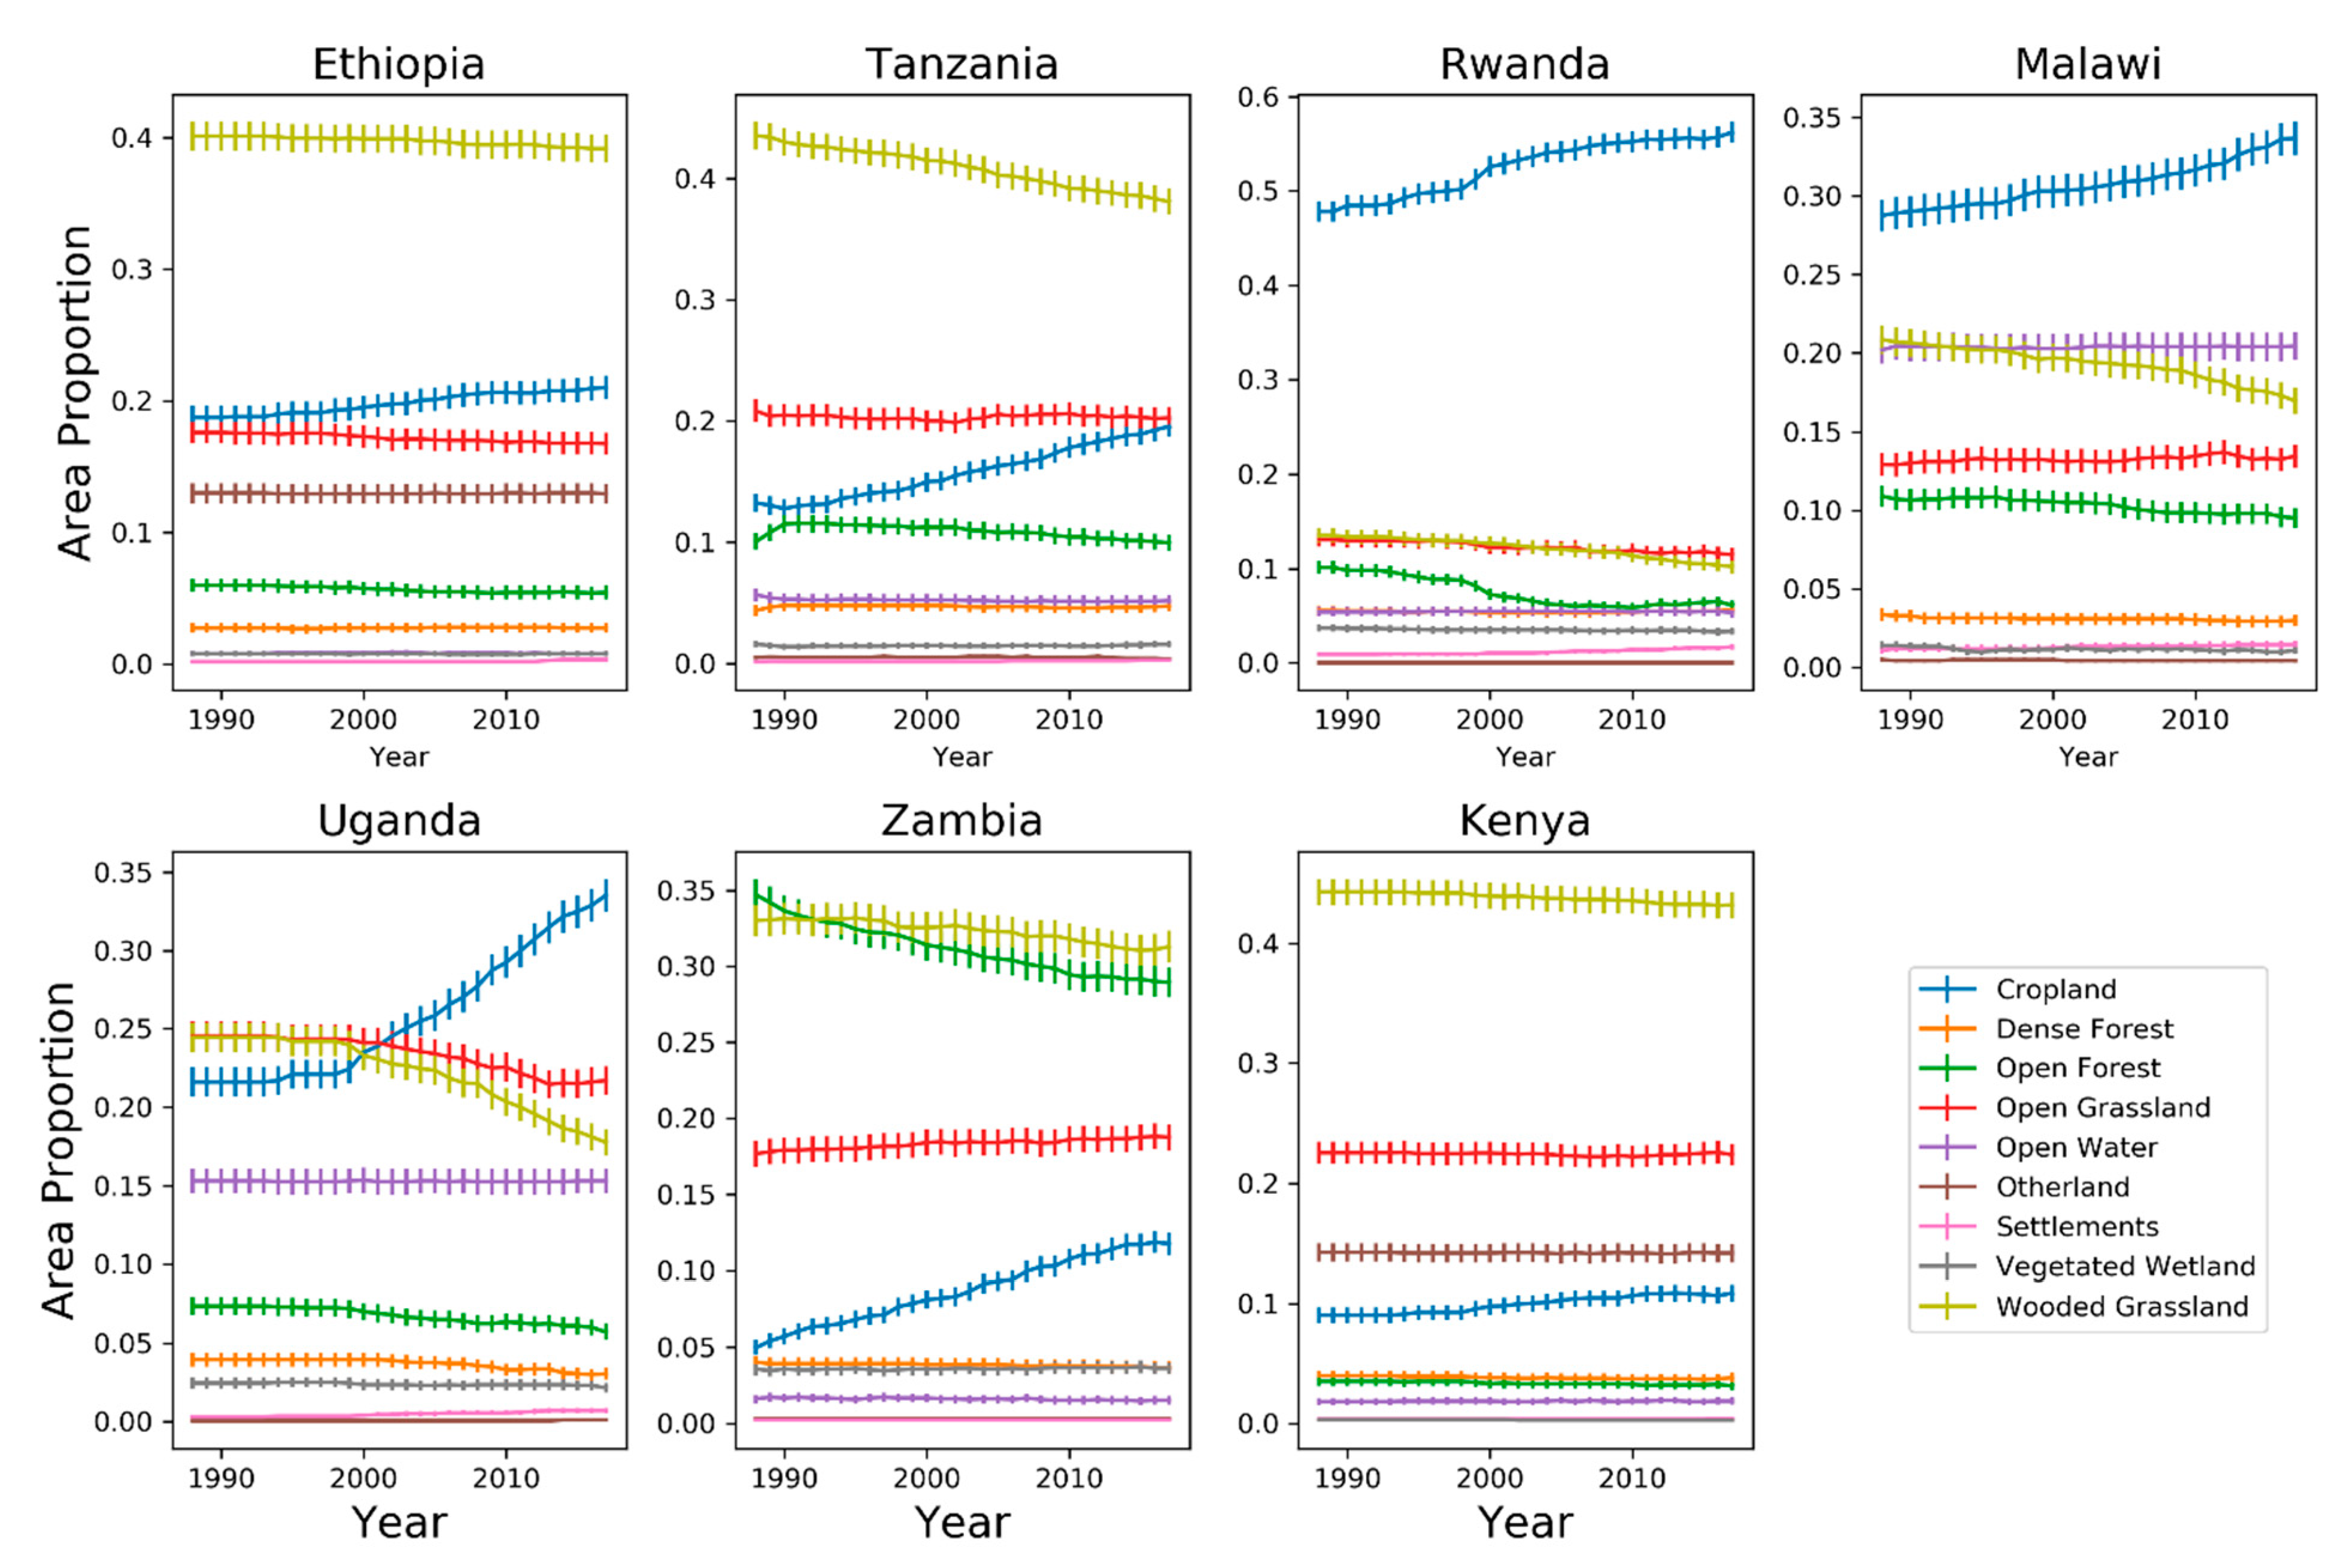
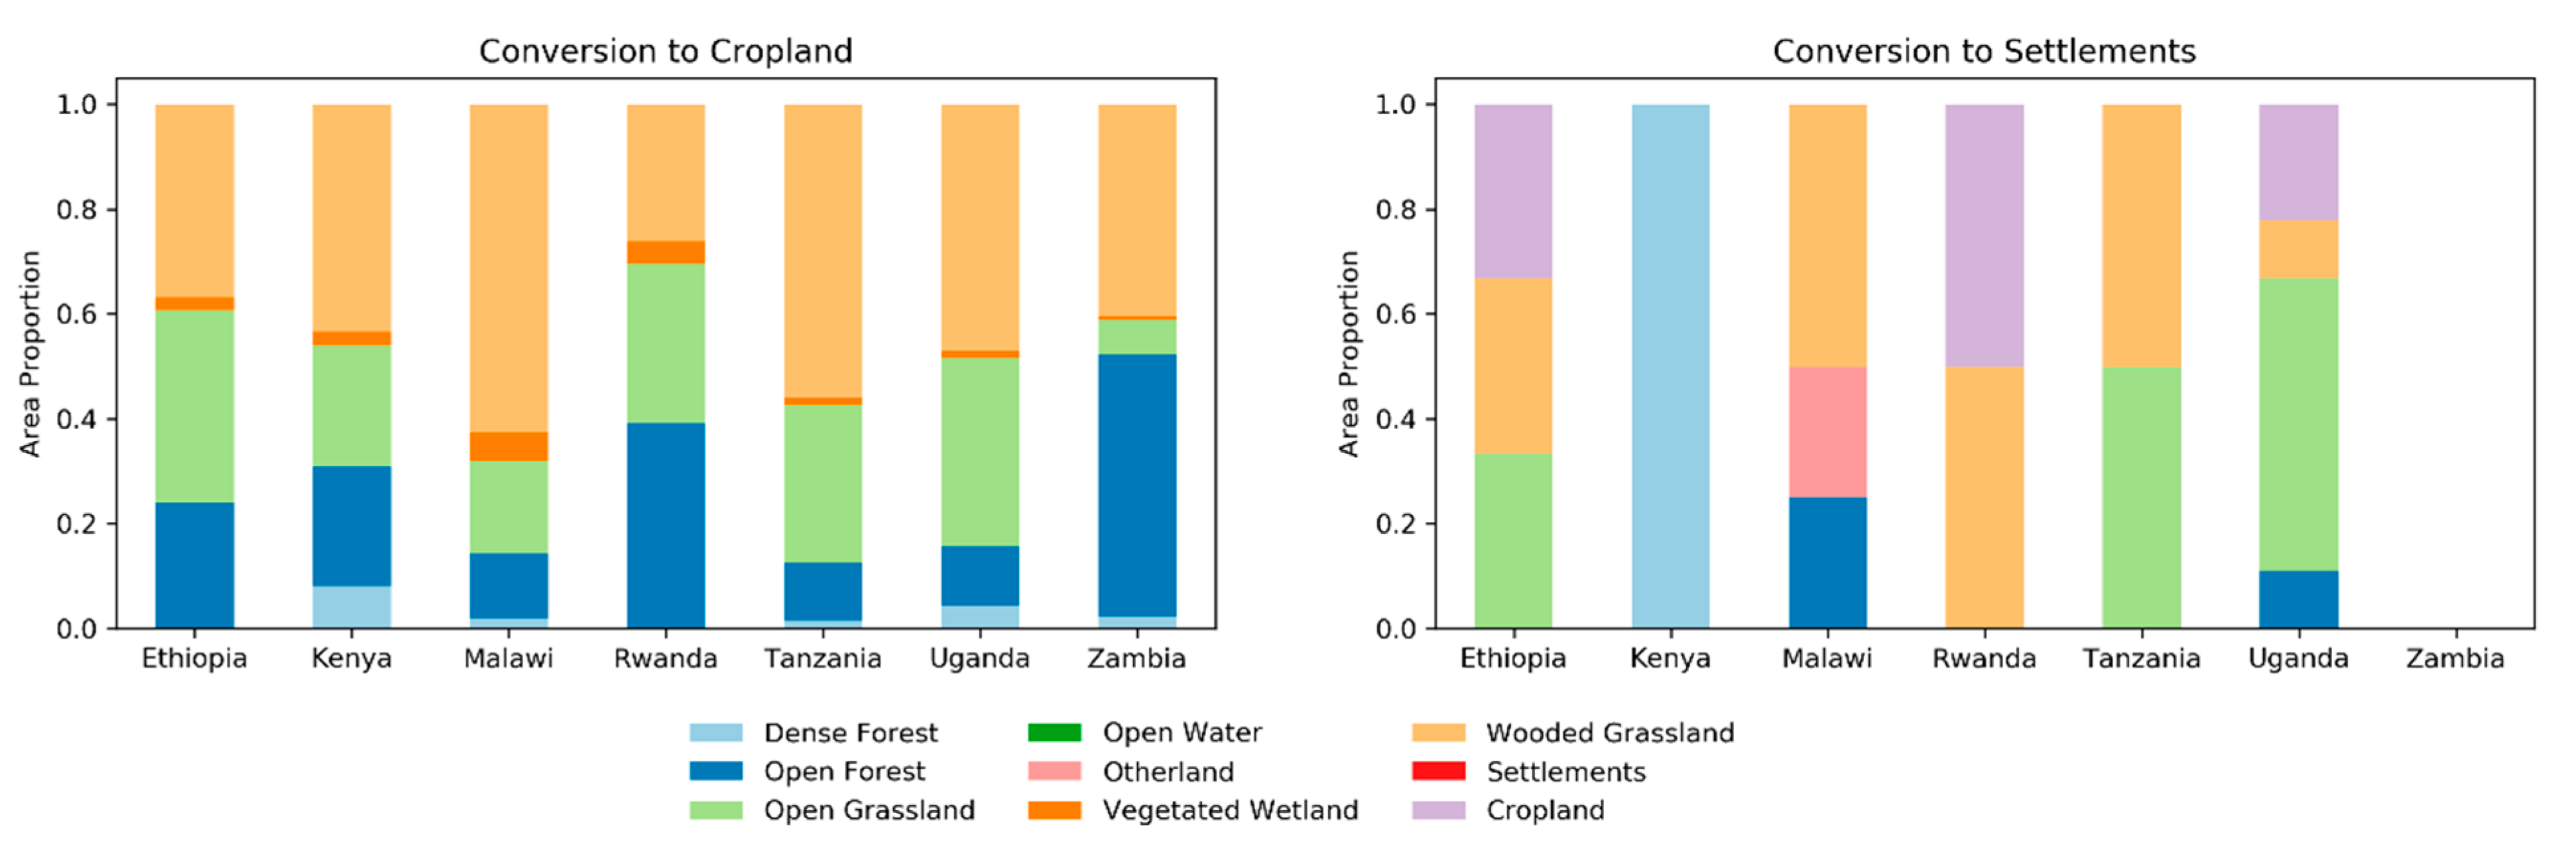
3.1. Conversion to Croplands
3.2. Settlements Expansion
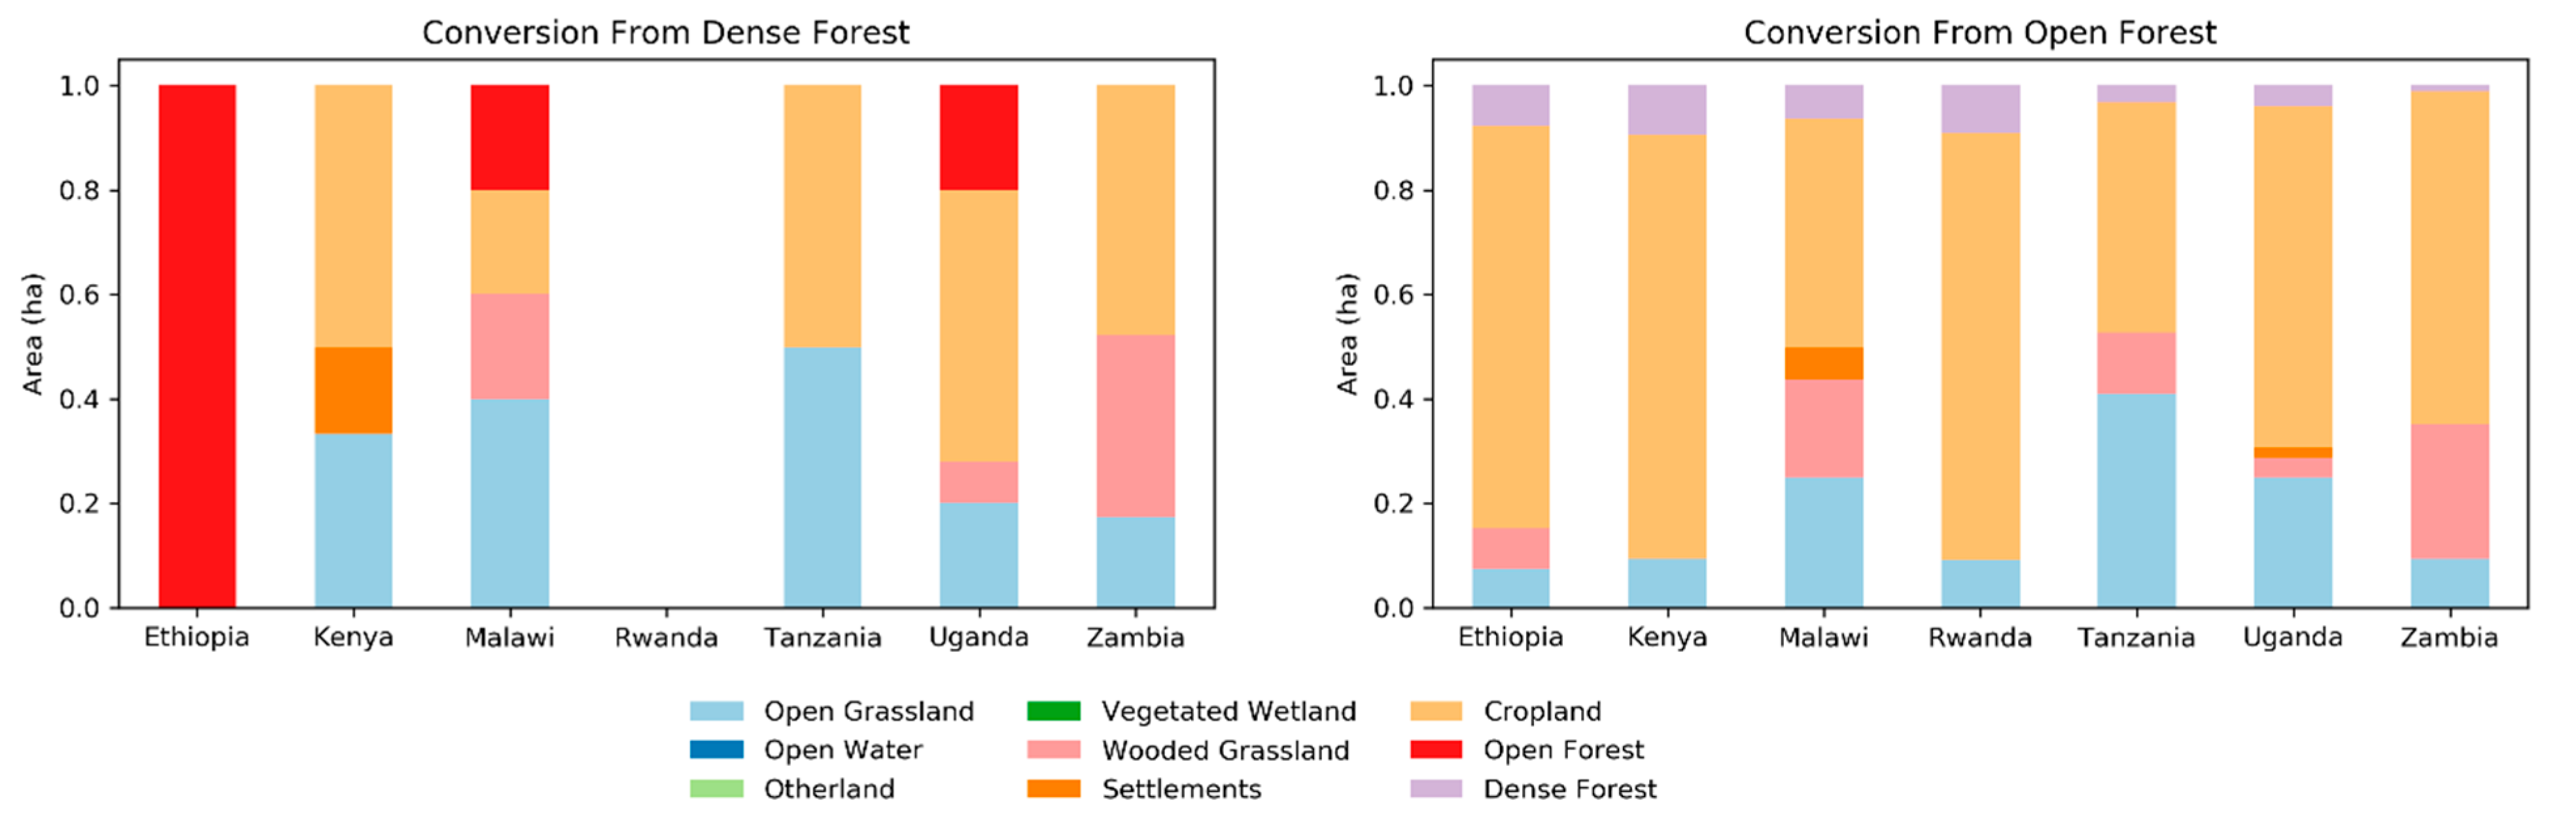
3.3. Deforestation
3.4. Wooded Grasslands
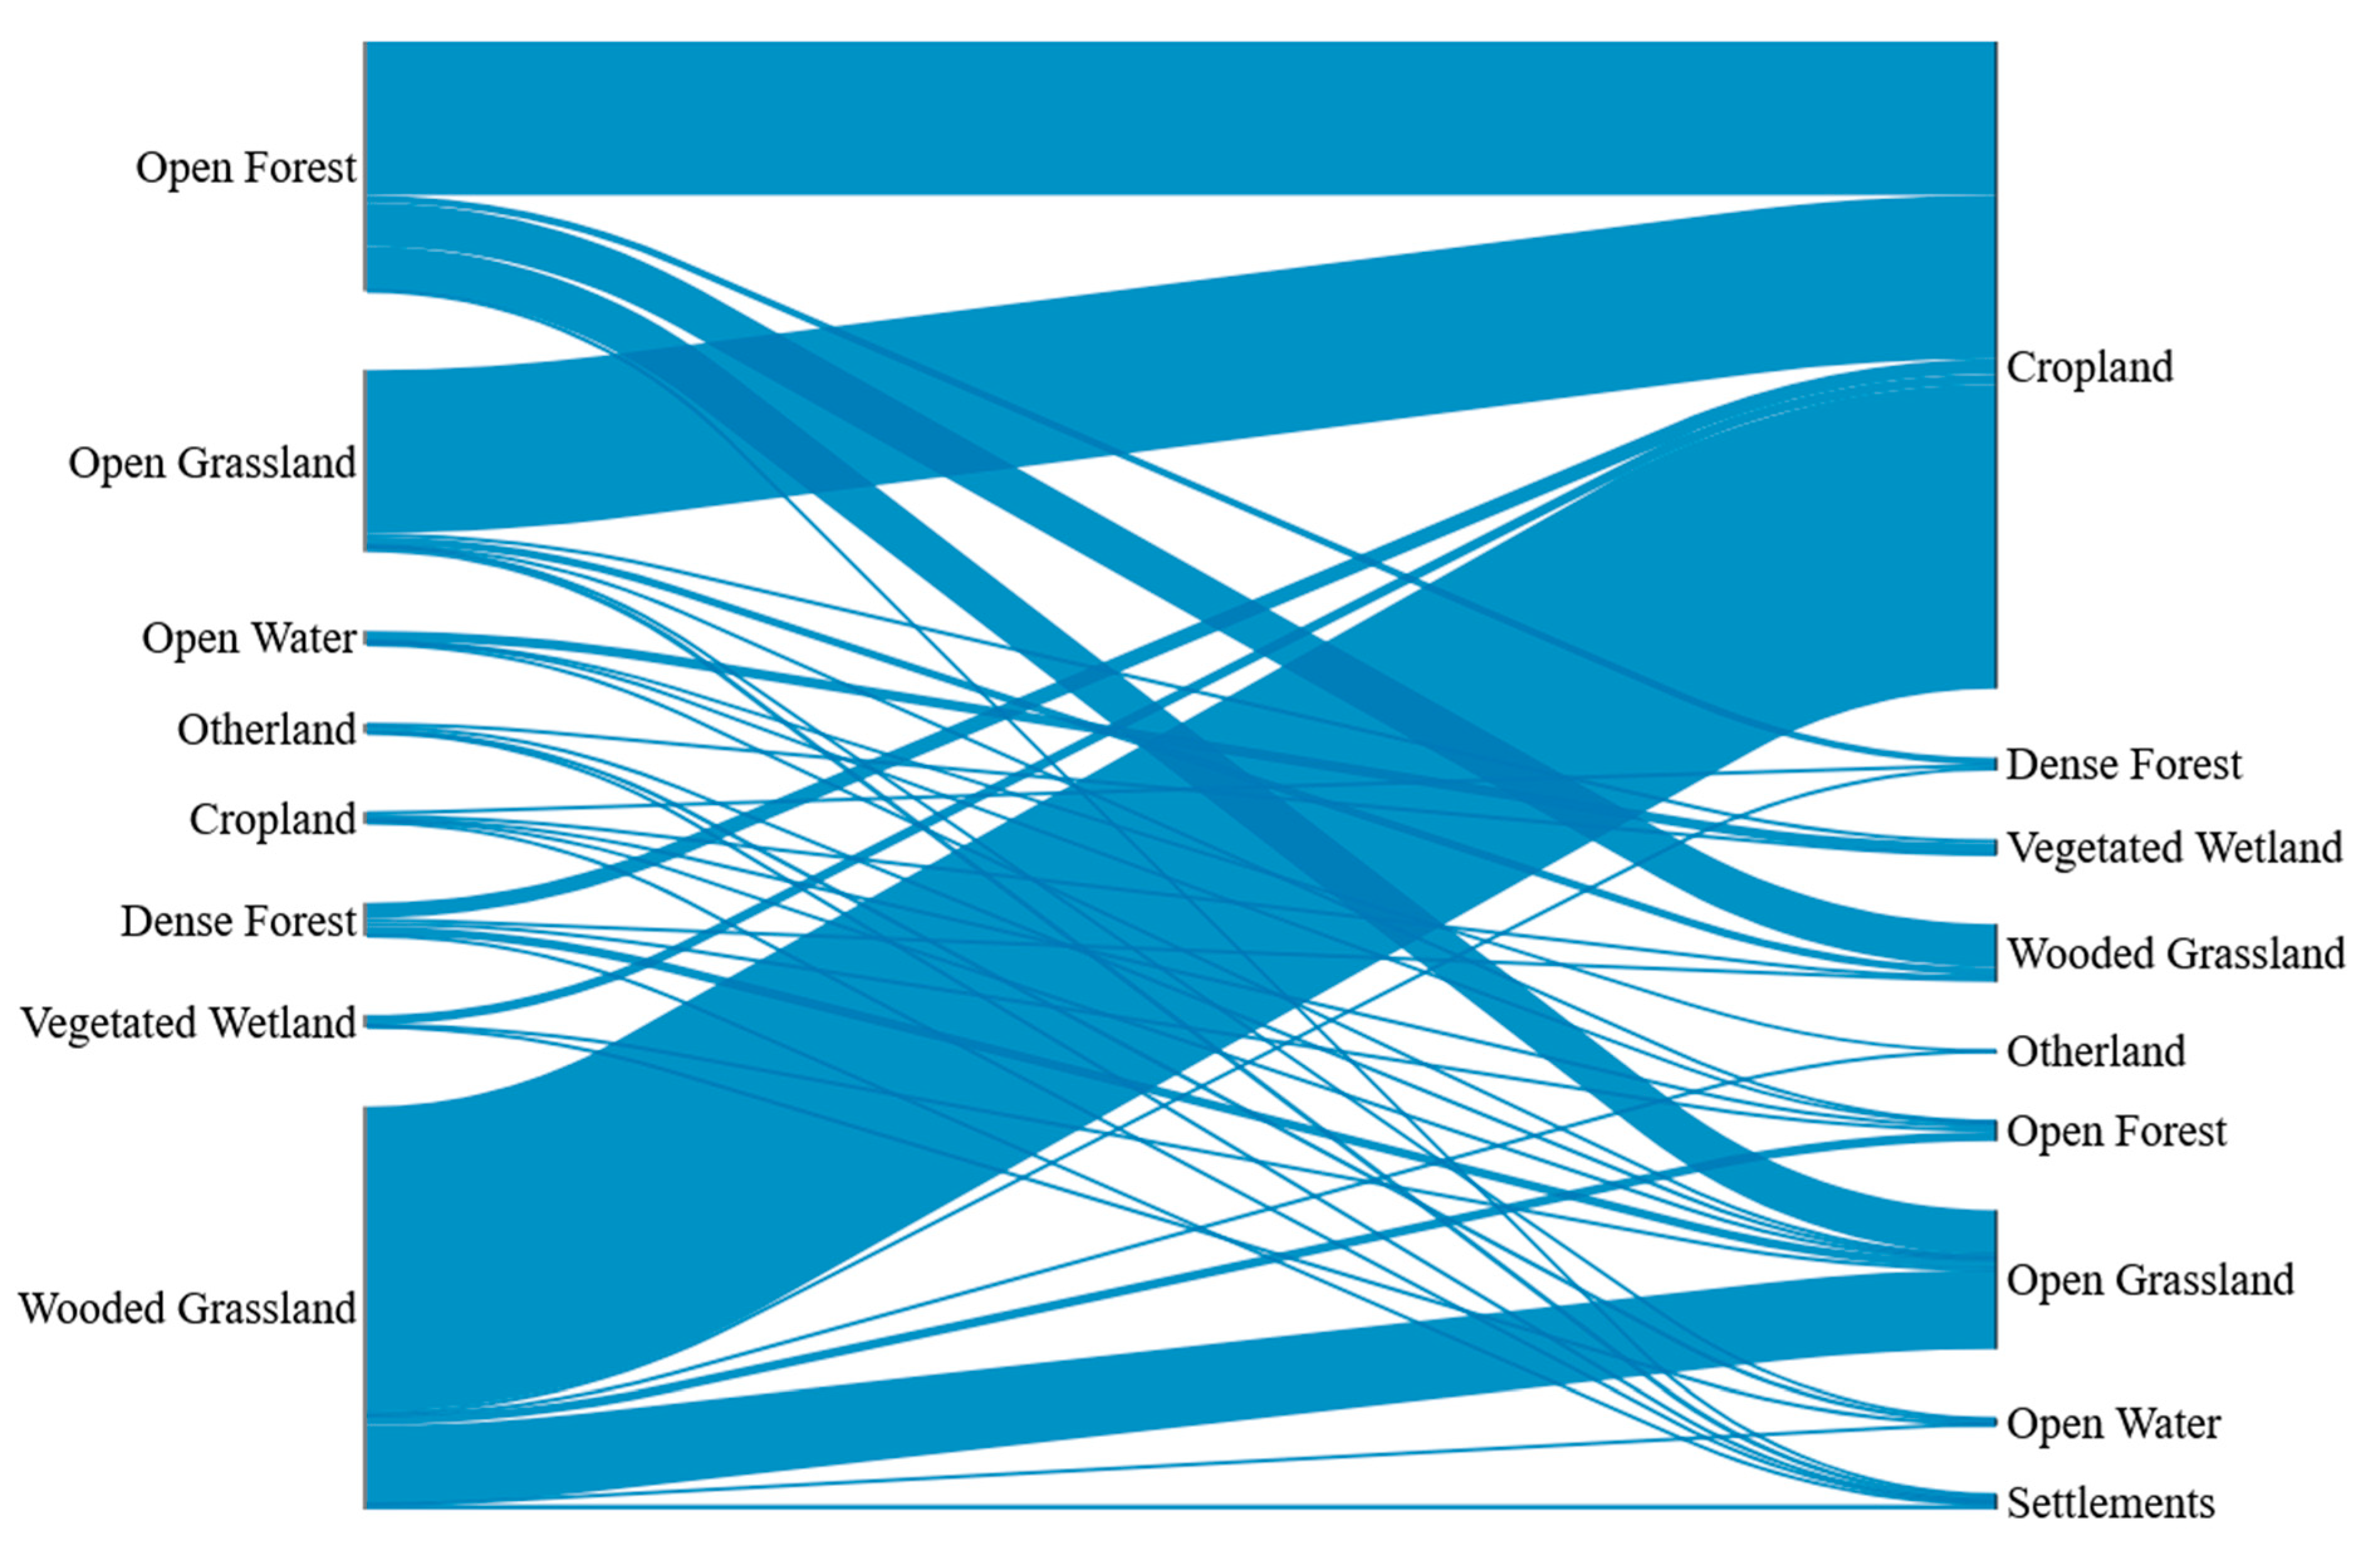
3.5. Cross-Class Woody Vegetation Change
4. Discussion
5. Conclusions
Author Contributions
Funding
Data Availability Statement
Acknowledgments
Conflicts of Interest
References
- FAOSTAT. Statistics of the Food and Agriculture Organization of the United Nations; FAOSTAT: Rome, Italy, 2020; ISBN 9789251310120. [Google Scholar]
- World Bank Life Expectancy at Birth, Total (Years). Available online: https://data.worldbank.org/indicator/SP.DYN.LE00.IN (accessed on 1 November 2020).
- Buitenwerf, R.; Bond, W.J.; Stevens, N.; Trollope, W.S.W. Increased tree densities in South African savannas: >50 years of data suggests CO 2 as a driver. Glob. Chang. Biol. 2012, 2, 675–684. [Google Scholar] [CrossRef]
- Mitchard, E.T.A.; Flintrop, C.M. Woody encroachment and forest degradation in sub-Saharan Africa’s woodlands and savannas 1982–2006. Philos. Trans. R. Soc. B Biol. Sci. 2013, 368. [Google Scholar] [CrossRef] [PubMed] [Green Version]
- Niang, I.; Ruppel, O.C.; Abdrabo, M.A.; Essel, A.; Lennard, C.; Padgham, J.; Urquhart, P. 2014: Africa. In Climate Change 2014: Impacts, Adaptation, and Vulnerability. Part B: Regional Aspects. Contribution of Working GroupII to the Fifth Assessment Report of the Intergovernmental Panel on Climate Change; Barros, V.R., Field, C.B., Dokken, D.J., Mastrandrea, M.D., Mach, K.J., Bilir, T.E., Chatterjee, M., Ebi, K.L., Estrada, Y.O., Genova, R.C., et al., Eds.; Cambridge University Press: Cambridge, UK; New York, NY, USA, 2014; pp. 1199–1265. [Google Scholar]
- Wigley, B.J.; Bond, W.J.; Hoffman, M.T. Bush encroachment under three contrasting land-use practices in a mesic South African savanna. Afr. J. Ecol. 2009, 47, 62–70. [Google Scholar] [CrossRef]
- Bughin, J.; Chironga, M.; Desvaux, G.; Ermias, T.; Jacobson, P.; Kassiri, O.; Leke, A.; Lund, S.; Van Wamelen, A.; Zouaoui, Y. Lions On The Move Ii: Realizing The Potential of Africa’s Economies; Mckinsey Global Instititute: New York, NY, USA, 2016. [Google Scholar]
- United Nations. World Population Prospects 2019; United Nations: New York, NY, USA, 2019; ISBN 9789211483161. [Google Scholar]
- Olson, D.M.; Dinerstein, E. The Global 200: Priority Ecoregions for Global Conservation. Ann. Mo. Bot. Gard. 2002, 89, 199–224. [Google Scholar] [CrossRef]
- Grace, J.; José, J.S.; Meir, P.; Miranda, H.S.; Montes, R.A. Productivity and carbon fluxes of tropical savannas. Proc. J. Biogeogr. 2006, 33, 387–400. [Google Scholar] [CrossRef]
- Estes, L.D.; Searchinger, T.; Spiegel, M.; Tian, D.; Sichinga, S.; Mwale, M.; Kehoe, L.; Kuemmerle, T.; Berven, A.; Chaney, N.; et al. Reconciling agriculture, carbon and biodiversity in a savannah transformation frontier. Philos. Trans. R. Soc. B Biol. Sci. 2016, 371. [Google Scholar] [CrossRef] [Green Version]
- McNicol, I.M.; Ryan, C.M.; Mitchard, E.T.A. Carbon losses from deforestation and widespread degradation offset by extensive growth in African woodlands. Nat. Commun. 2018, 9, 3045. [Google Scholar] [CrossRef]
- Venter, Z.S.; Cramer, M.D.; Hawkins, H.J. Drivers of woody plant encroachment over Africa. Nat. Commun. 2018, 9, 2272. [Google Scholar] [CrossRef] [Green Version]
- Brandt, M.; Rasmussen, K.; Peñuelas, J.; Tian, F.; Schurgers, G.; Verger, A.; Mertz, O.; Palmer, J.R.B.; Fensholt, R. Human population growth offsets climate-driven increase in woody vegetation in sub-Saharan Africa. Nat. Publ. Gr. 2017, 1, 0081. [Google Scholar] [CrossRef] [PubMed] [Green Version]
- Hafner, M.; Tagliapietra, S.; de Strasser, L. Energy in Africa; Springer Nature: Cham, Switzerland, 2018. [Google Scholar] [CrossRef] [Green Version]
- Tchuenté, A.T.K.; Roujean, J.L.; de Jong, S.M. Comparison and relative quality assessment of the GLC2000, GLOBCOVER, MODIS and ECOCLIMAP land cover data sets at the African continental scale. Int. J. Appl. Earth Obs. Geoinf. 2011, 13, 207–219. [Google Scholar] [CrossRef]
- Nutini, F.; Boschetti, M.; Brivio, P.A.; Bocchi, S.; Antoninetti, M. Land-use and land-cover change detection in a semi-arid area of Niger using multi-temporal analysis of Landsat images. Int. J. Remote Sens. 2013, 34, 4769–4790. [Google Scholar] [CrossRef]
- Terfa, B.K.; Chen, N.; Liu, D.; Zhang, X.; Niyogi, D. Urban expansion in Ethiopia from 1987 to 2017: Characteristics, spatial patterns, and driving forces. Sustainability 2019, 11, 2973. [Google Scholar] [CrossRef] [Green Version]
- Vittek, M.; Brink, A.; Donnay, F.; Simonetti, D.; Desclée, B. Land cover change monitoring using landsat MSS/TM satellite image data over west Africa between 1975 and 1990. Remote Sens. 2013, 6, 658–676. [Google Scholar] [CrossRef] [Green Version]
- Tyukavina, A.; Hansen, M.C.; Potapov, P.V.; Krylov, A.M.; Goetz, S.J. Pan-tropical hinterland forests: Mapping minimally disturbed forests. Glob. Ecol. Biogeogr. 2016, 25, 151–163. [Google Scholar] [CrossRef]
- Hansen, M.C.; Potapov, P.V.; Moore, R.; Hancher, M.; Turubanova, S.A.; Tyukavina, A.; Thau, D.; Stehman, S.V.; Goetz, S.J.; Loveland, T.R.; et al. High-resolution global maps of 21st-century forest cover change. Science 2013, 342, 850–853. [Google Scholar] [CrossRef] [PubMed] [Green Version]
- Cohen, W.B.; Yang, Z.; Kennedy, R. Detecting trends in forest disturbance and recovery using yearly Landsat time series: 2. TimeSync-Tools for calibration and validation. Remote Sens. Environ. 2010, 114, 2911–2924. [Google Scholar] [CrossRef]
- Gray, A.N.; Cohen, W.B.; Yang, Z.; Pfaff, E. Integrating TimeSync disturbance detection and repeat forest inventory to predict carbon flux. Forests 2019, 10, 984. [Google Scholar] [CrossRef] [Green Version]
- McRoberts, R.E. Satellite image-based maps: Scientific inference or pretty pictures? Remote Sens. Environ. 2011, 115, 715–724. [Google Scholar] [CrossRef]
- Olofsson, P.; Foody, G.M.; Herold, M.; Stehman, S.V.; Woodcock, C.E.; Wulder, M.A. Good practices for estimating area and assessing accuracy of land change. Remote Sens. Environ. 2014, 148, 42–57. [Google Scholar] [CrossRef]
- Stehman, S.V. Comparing estimators of gross change derived from complete coverage mapping versus statistical sampling of remotely sensed data. Remote Sens. Environ. 2005, 96, 466–474. [Google Scholar] [CrossRef]
- Olson, D.M.; Dinerstein, E.; Wikramanayake, E.; Burgess, N.; Powell, G.; Underwood, E.C.; D’Amico, J.; Itoua, I.; Strand, H.; Morrison, J.; et al. Terrestrial Ecosystems of the World: A New Map of Life on Earth. Bioscience 2001, 51, 933–938. [Google Scholar] [CrossRef]
- Pedregosa, F.; Varoquaux, G.; Gramfort, A.; Michel, V.; Thirion, B.; Grisel, O.; Blondel, M.; Prettenhofer, P.; Weiss, R.; Dubourg, V.; et al. Scikit-learn: Machine learning in Python. J. Mach. Learn. Res. 2011, 12, 2825–2830. [Google Scholar]
- Cochran, W.G. Sampling Techniques; John Wiley & Sons: New York, NY, USA, 1977; p. 428. [Google Scholar]
- Espejo, A.; Federici, S.; Green, C.; Amuchastegui, N.; d'Annunzio, R.; Balzter, H.; Bholanath, P.; Brack, C.; Brewer, C.; Birigazzi, L.; et al. Integration of Remote-Sensing and Ground-Based Observations for Estimation of Emissions and Removals of Greenhouse Gases in Forests: Methods and Guidance from the Global Forest Observations Initiative; UN Food and Agriculture Organization: Rome, Italy, 2020. [Google Scholar]
- Stehman, S.V. Estimating area and map accuracy for stratified random sampling when the strata are different from the map classes. Int. J. Remote Sens. 2014, 35, 4923–4939. [Google Scholar] [CrossRef]
- Kier, G.; Mutke, J.; Dinerstein, E.; Ricketts, T.H.; Küper, W.; Kreft, H.; Barthlott, W. Global patterns of plant diversity and floristic knowledge. J. Biogeogr. 2005, 32, 1107–1116. [Google Scholar] [CrossRef]
- Burgess, N.; Dinerstein, E.; Olson, D.; Schipper, J. Terrestrial Ecoregions of Africa and Madagascar: A Conservation Assessment; Island Press: Washington, DC, USA, 2004. [Google Scholar]
- D’Amour, C.B.; Reitsma, F.; Baiocchi, G.; Barthel, S.; Güneralp, B.; Erb, K.H.; Haberl, H.; Creutzig, F.; Seto, K.C. Future urban land expansion and implications for global croplands. Proc. Natl. Acad. Sci. USA 2017, 114, 8939–8944. [Google Scholar] [CrossRef] [Green Version]
- Central Intelligence Agency. GDP Per Capita (PPP); Central Intelligence Agency: Langley, VA, USA, 2017; ISBN 9780387792835.
- Ordway, E.M. Political shifts and changing forests: Effects of armed conflict on forest conservation in Rwanda. Glob. Ecol. Conserv. 2015, 3, 448–460. [Google Scholar] [CrossRef] [Green Version]


| Land Cover Class | Definition |
|---|---|
| Open Forest | Tree-covered areas with 15–40% canopy cover. This class includes both natural and planted forests that meet the canopy cover threshold and the national definitions of forest cover. |
| Dense Forest | Tree-covered areas with over 40% canopy cover. This class includes both natural and planted forests that meet the canopy cover threshold. |
| Cropland | An area primarily used for agriculture. Includes field crops, agroforestry, horticulture, perennial crops and floriculture, and abandoned croplands left fallow. |
| Settlements | Areas primarily built for the development of buildings, roads, or other human-modified land uses. |
| Wooded Grassland | A natural landscape that does not meet the tree canopy thresholds of either forest class and contains woody vegetation in the form of shrubs, very sparse tree cover, or single trees. |
| Open Grassland | A natural landscape that does not meet the tree canopy thresholds of either forest class and does not containing substantial woody vegetation. The plant cover is composed principally of grasses, grass-like plants, and forbs, including areas where practices such as clearing, burning, chaining, and/or chemicals are applied to maintain the grass vegetation. |
| Vegetated Wetland | Areas covered in water for at least part of the year and containing a mix of vegetation and open water. Includes marshlands, swamps, and peatlands. |
| Open Water | Open water bodies, including oceans, lakes, rivers, and reservoirs. |
| Other land | Areas that do not meet a different class definition, including barren land, rock outcrops, permanent snow cover, beaches, and salt crusts. |
Publisher’s Note: MDPI stays neutral with regard to jurisdictional claims in published maps and institutional affiliations. |
© 2021 by the authors. Licensee MDPI, Basel, Switzerland. This article is an open access article distributed under the terms and conditions of the Creative Commons Attribution (CC BY) license (http://creativecommons.org/licenses/by/4.0/).
Share and Cite
Bullock, E.L.; Healey, S.P.; Yang, Z.; Oduor, P.; Gorelick, N.; Omondi, S.; Ouko, E.; Cohen, W.B. Three Decades of Land Cover Change in East Africa. Land 2021, 10, 150. https://doi.org/10.3390/land10020150
Bullock EL, Healey SP, Yang Z, Oduor P, Gorelick N, Omondi S, Ouko E, Cohen WB. Three Decades of Land Cover Change in East Africa. Land. 2021; 10(2):150. https://doi.org/10.3390/land10020150
Chicago/Turabian StyleBullock, Eric L., Sean P. Healey, Zhiqiang Yang, Phoebe Oduor, Noel Gorelick, Steve Omondi, Edward Ouko, and Warren B. Cohen. 2021. "Three Decades of Land Cover Change in East Africa" Land 10, no. 2: 150. https://doi.org/10.3390/land10020150
APA StyleBullock, E. L., Healey, S. P., Yang, Z., Oduor, P., Gorelick, N., Omondi, S., Ouko, E., & Cohen, W. B. (2021). Three Decades of Land Cover Change in East Africa. Land, 10(2), 150. https://doi.org/10.3390/land10020150