
Development of the Landslide Susceptibility Map of Attica Region, Greece, Based on the Method of Rock Engineering System


Abstract
:1. Introduction
- (i)
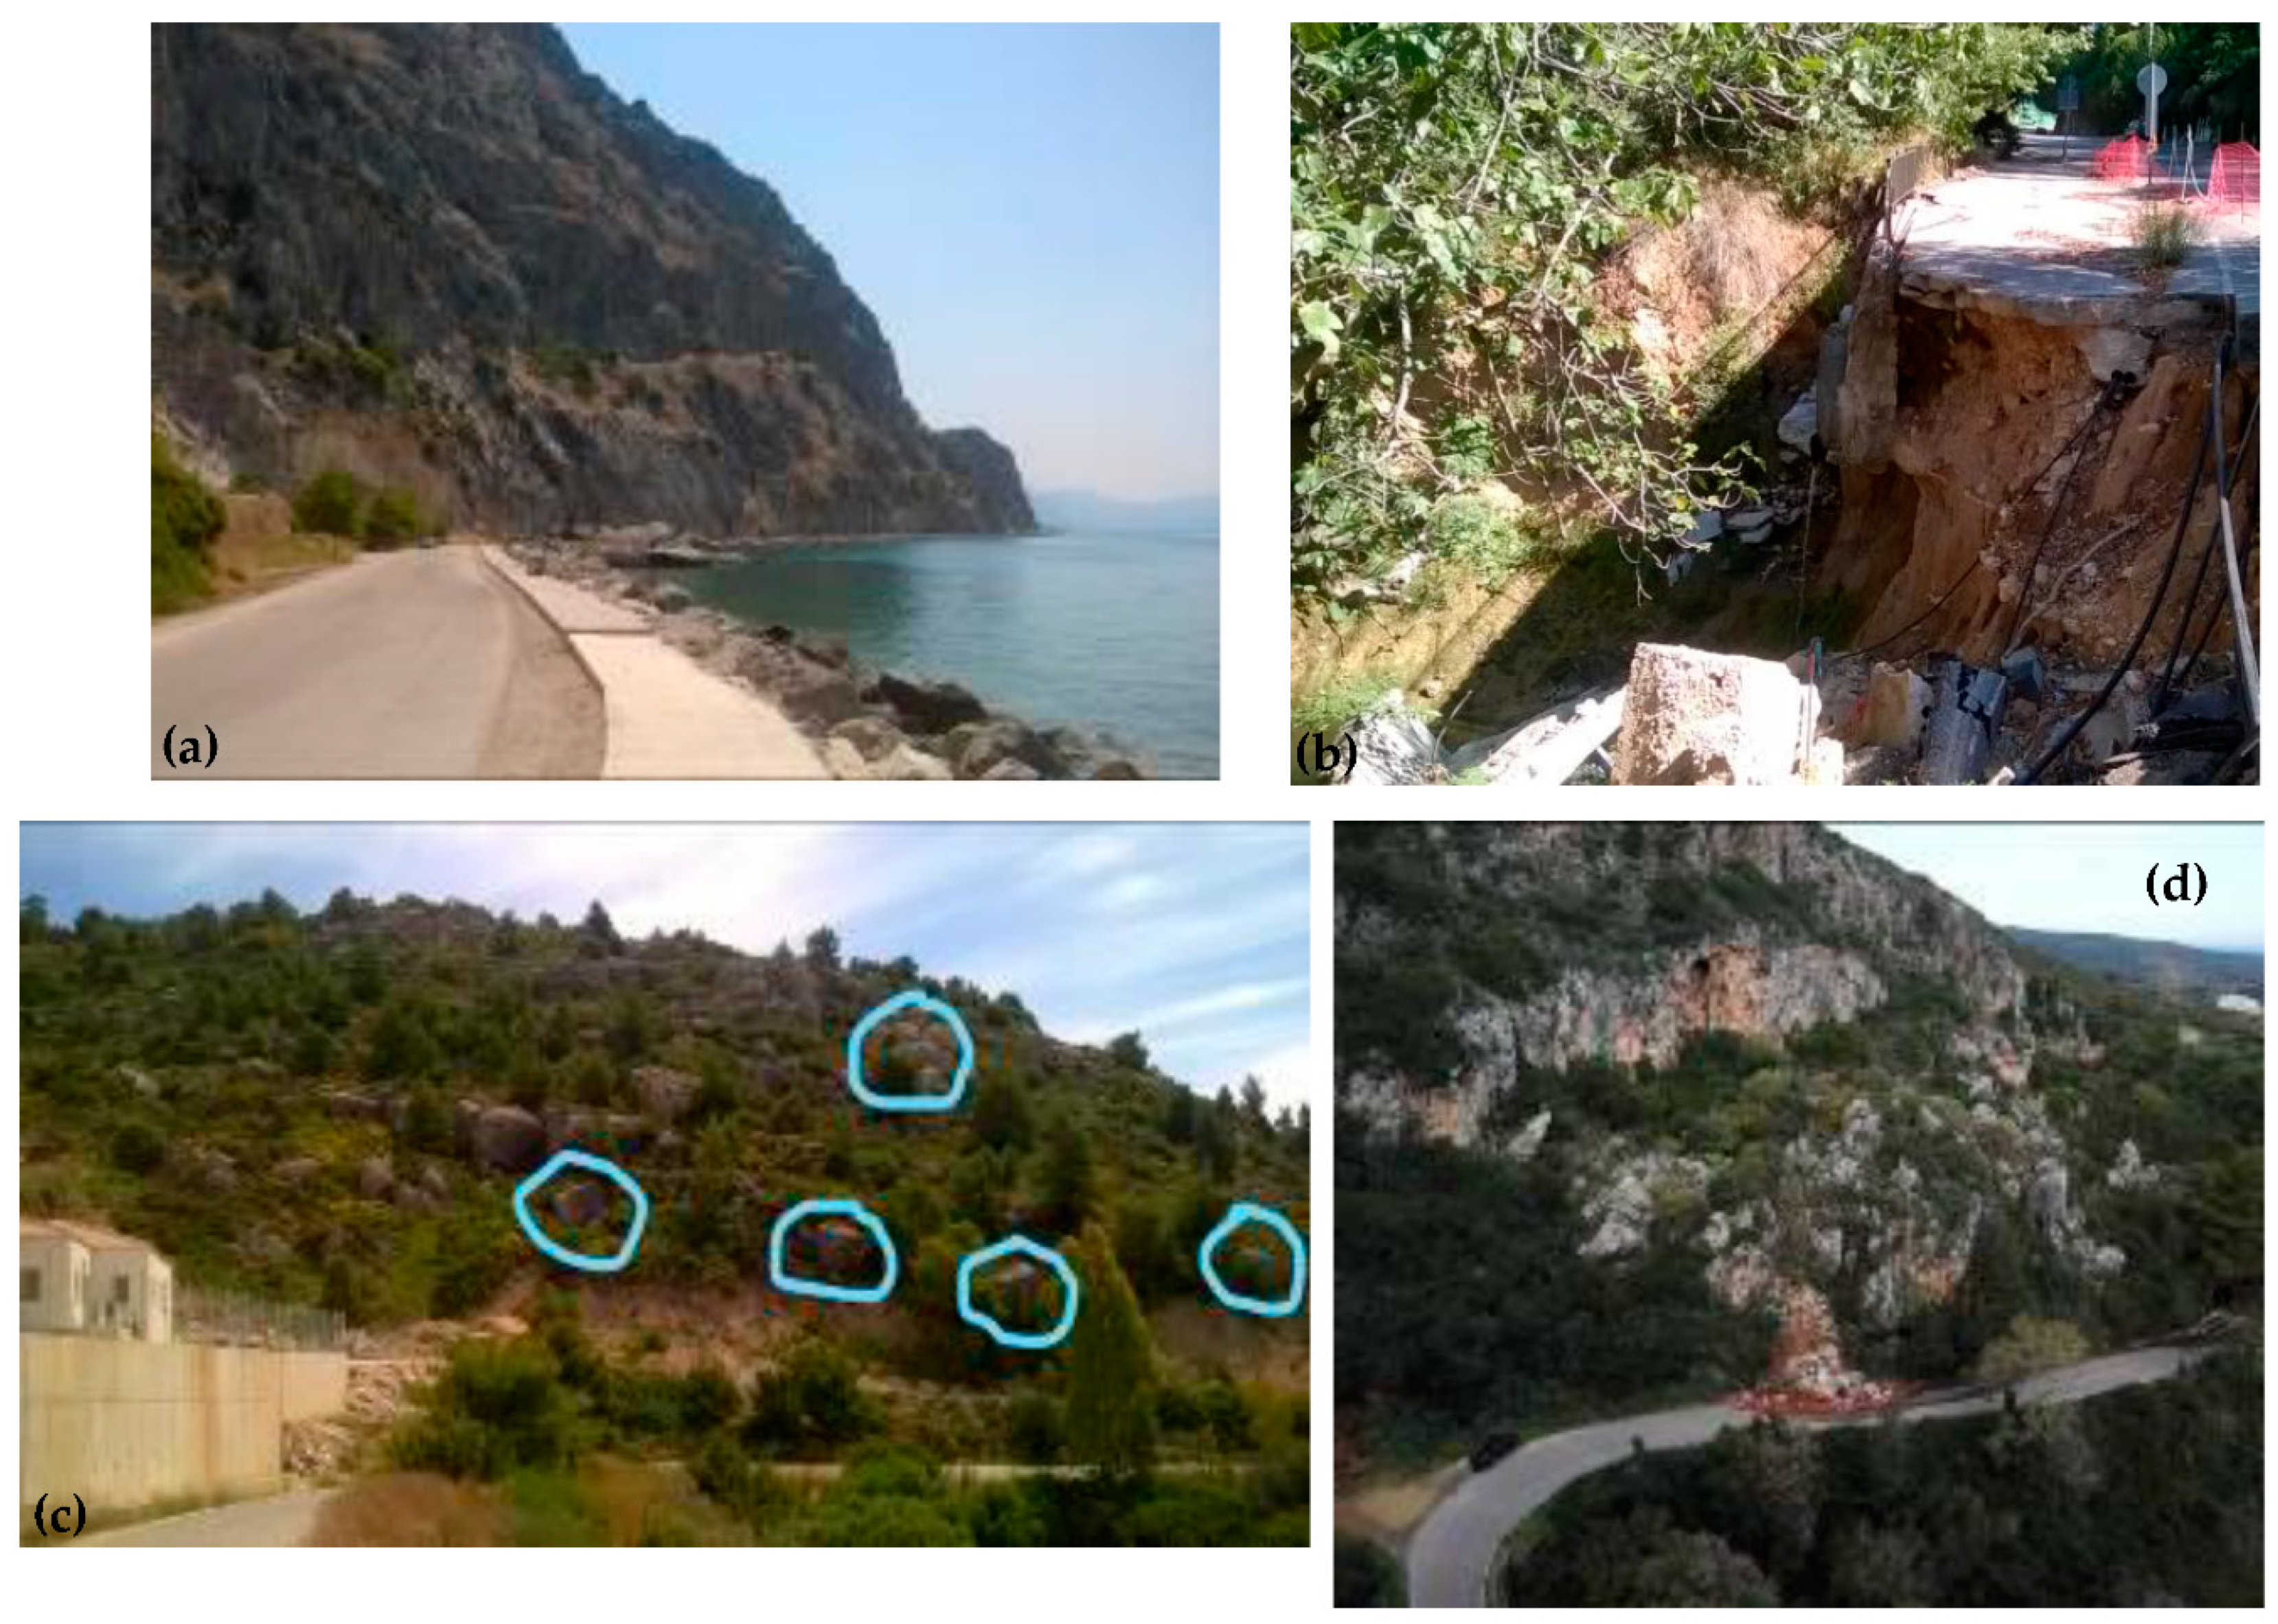
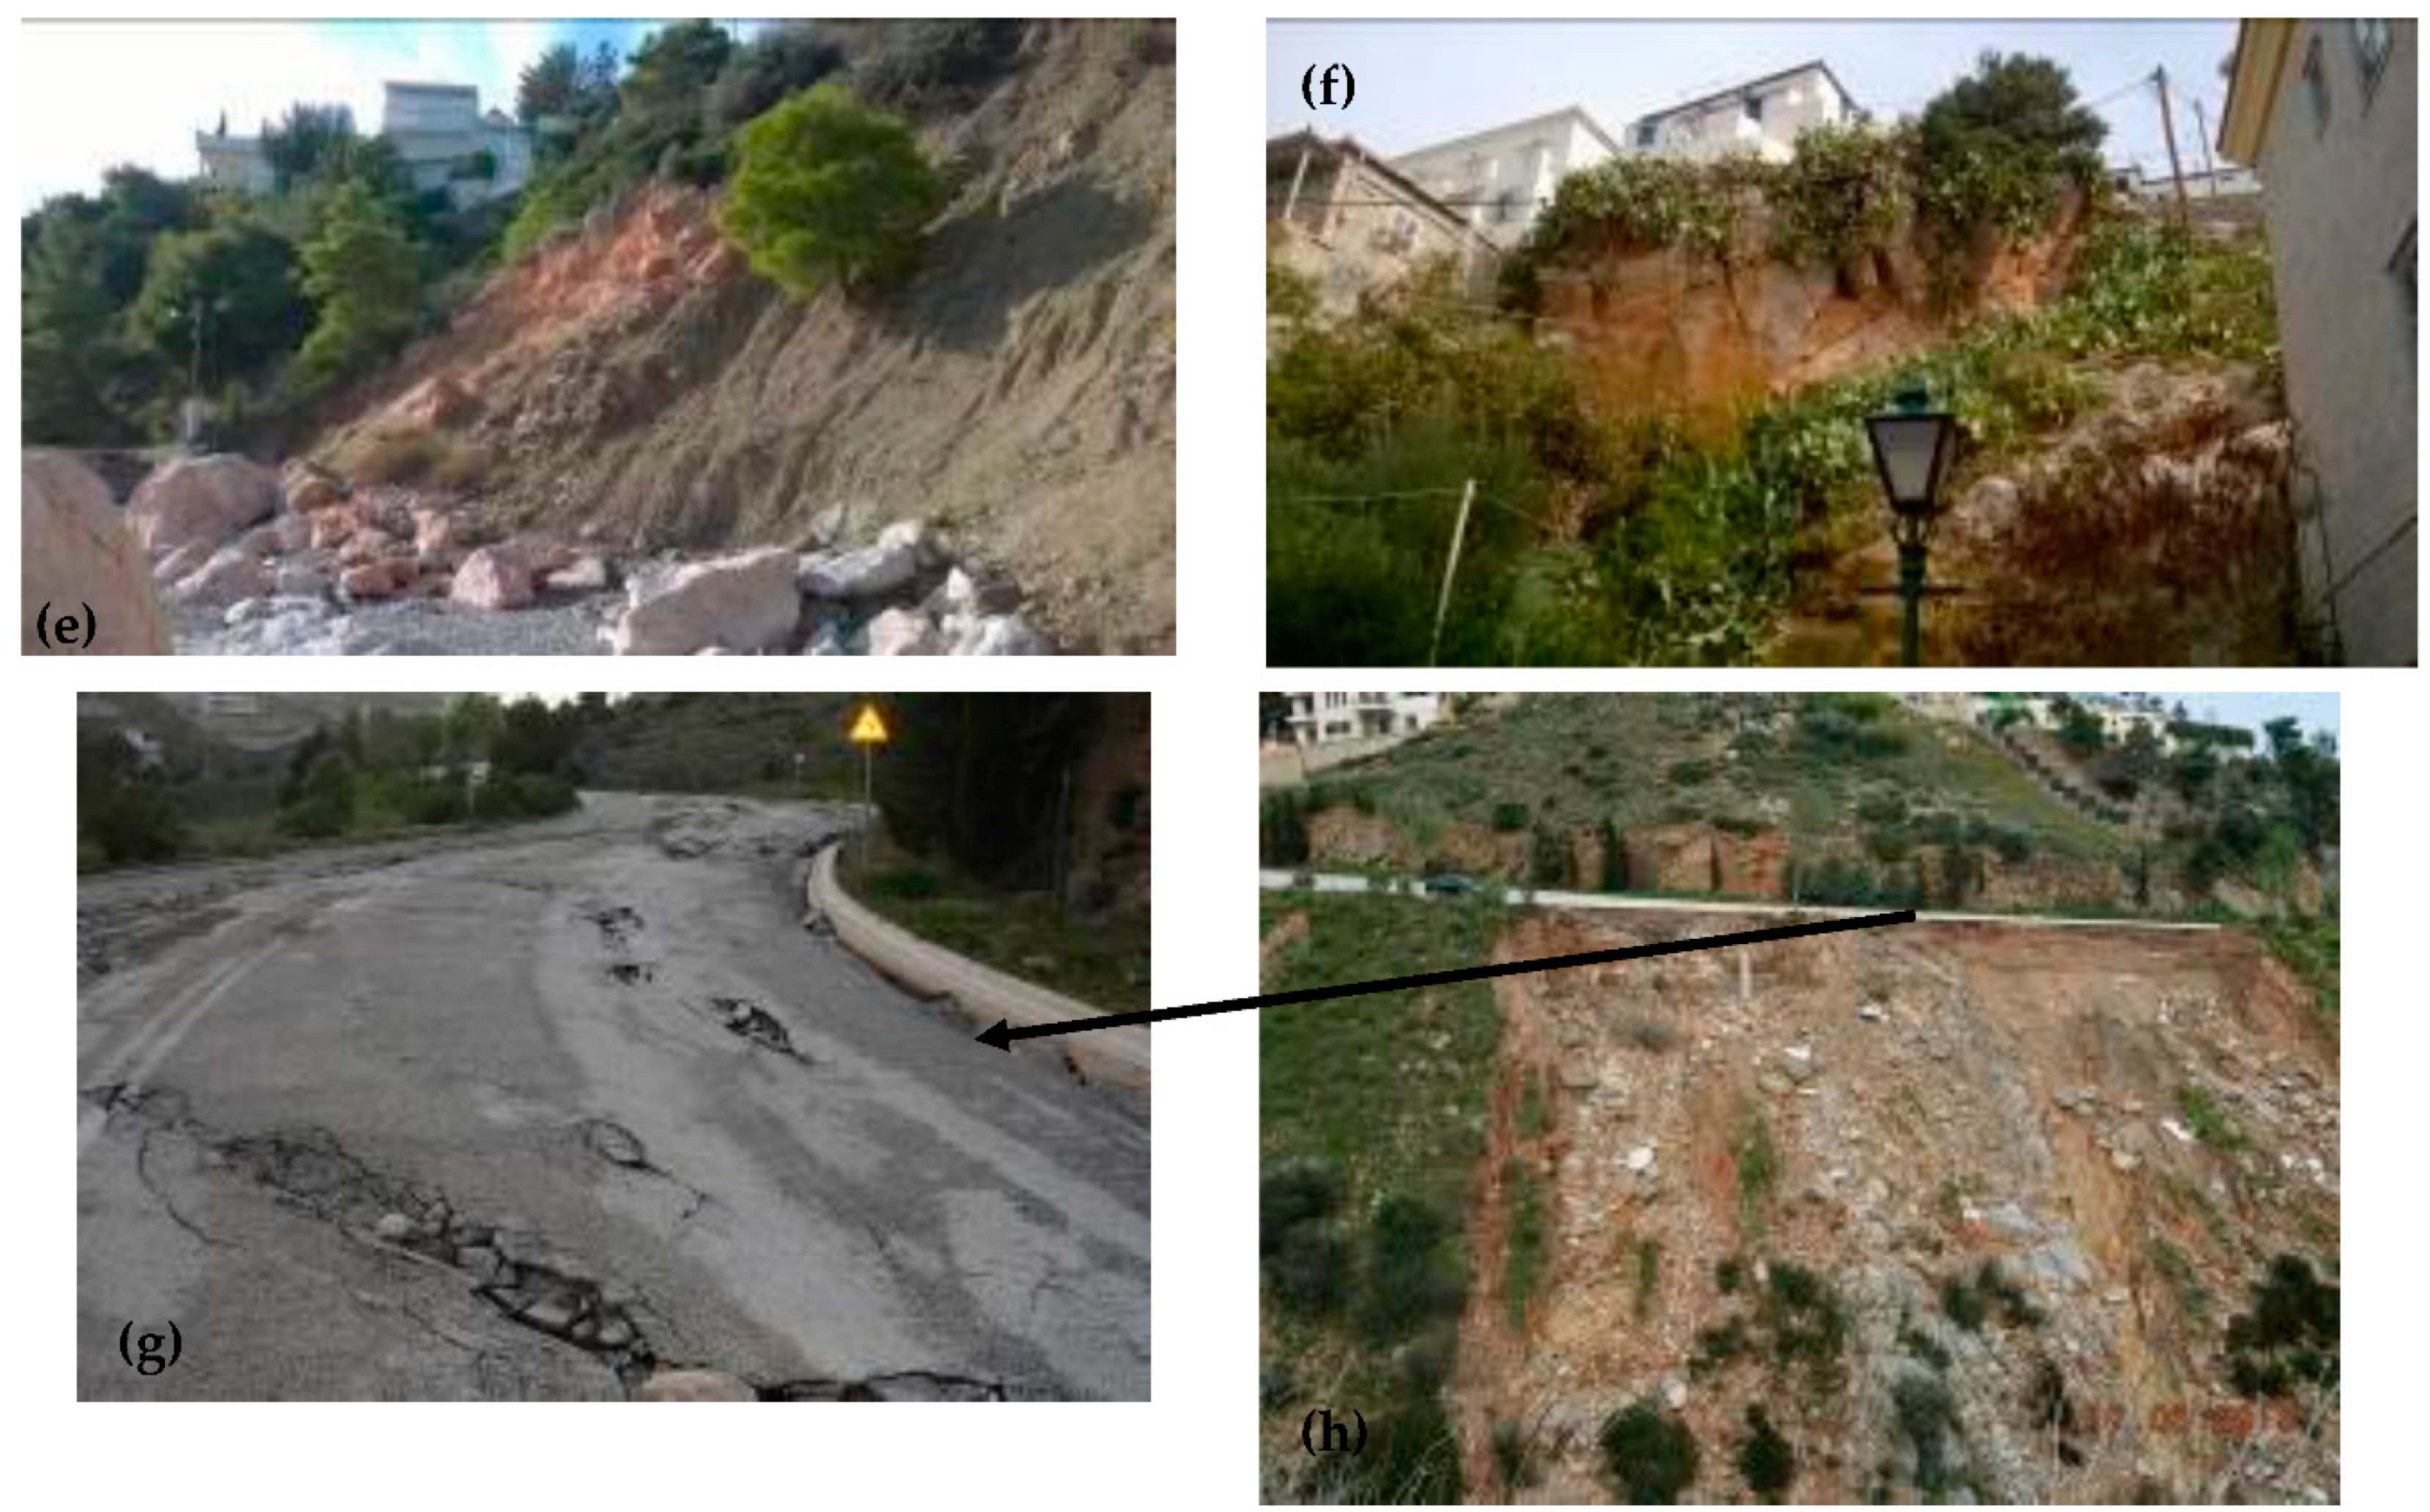
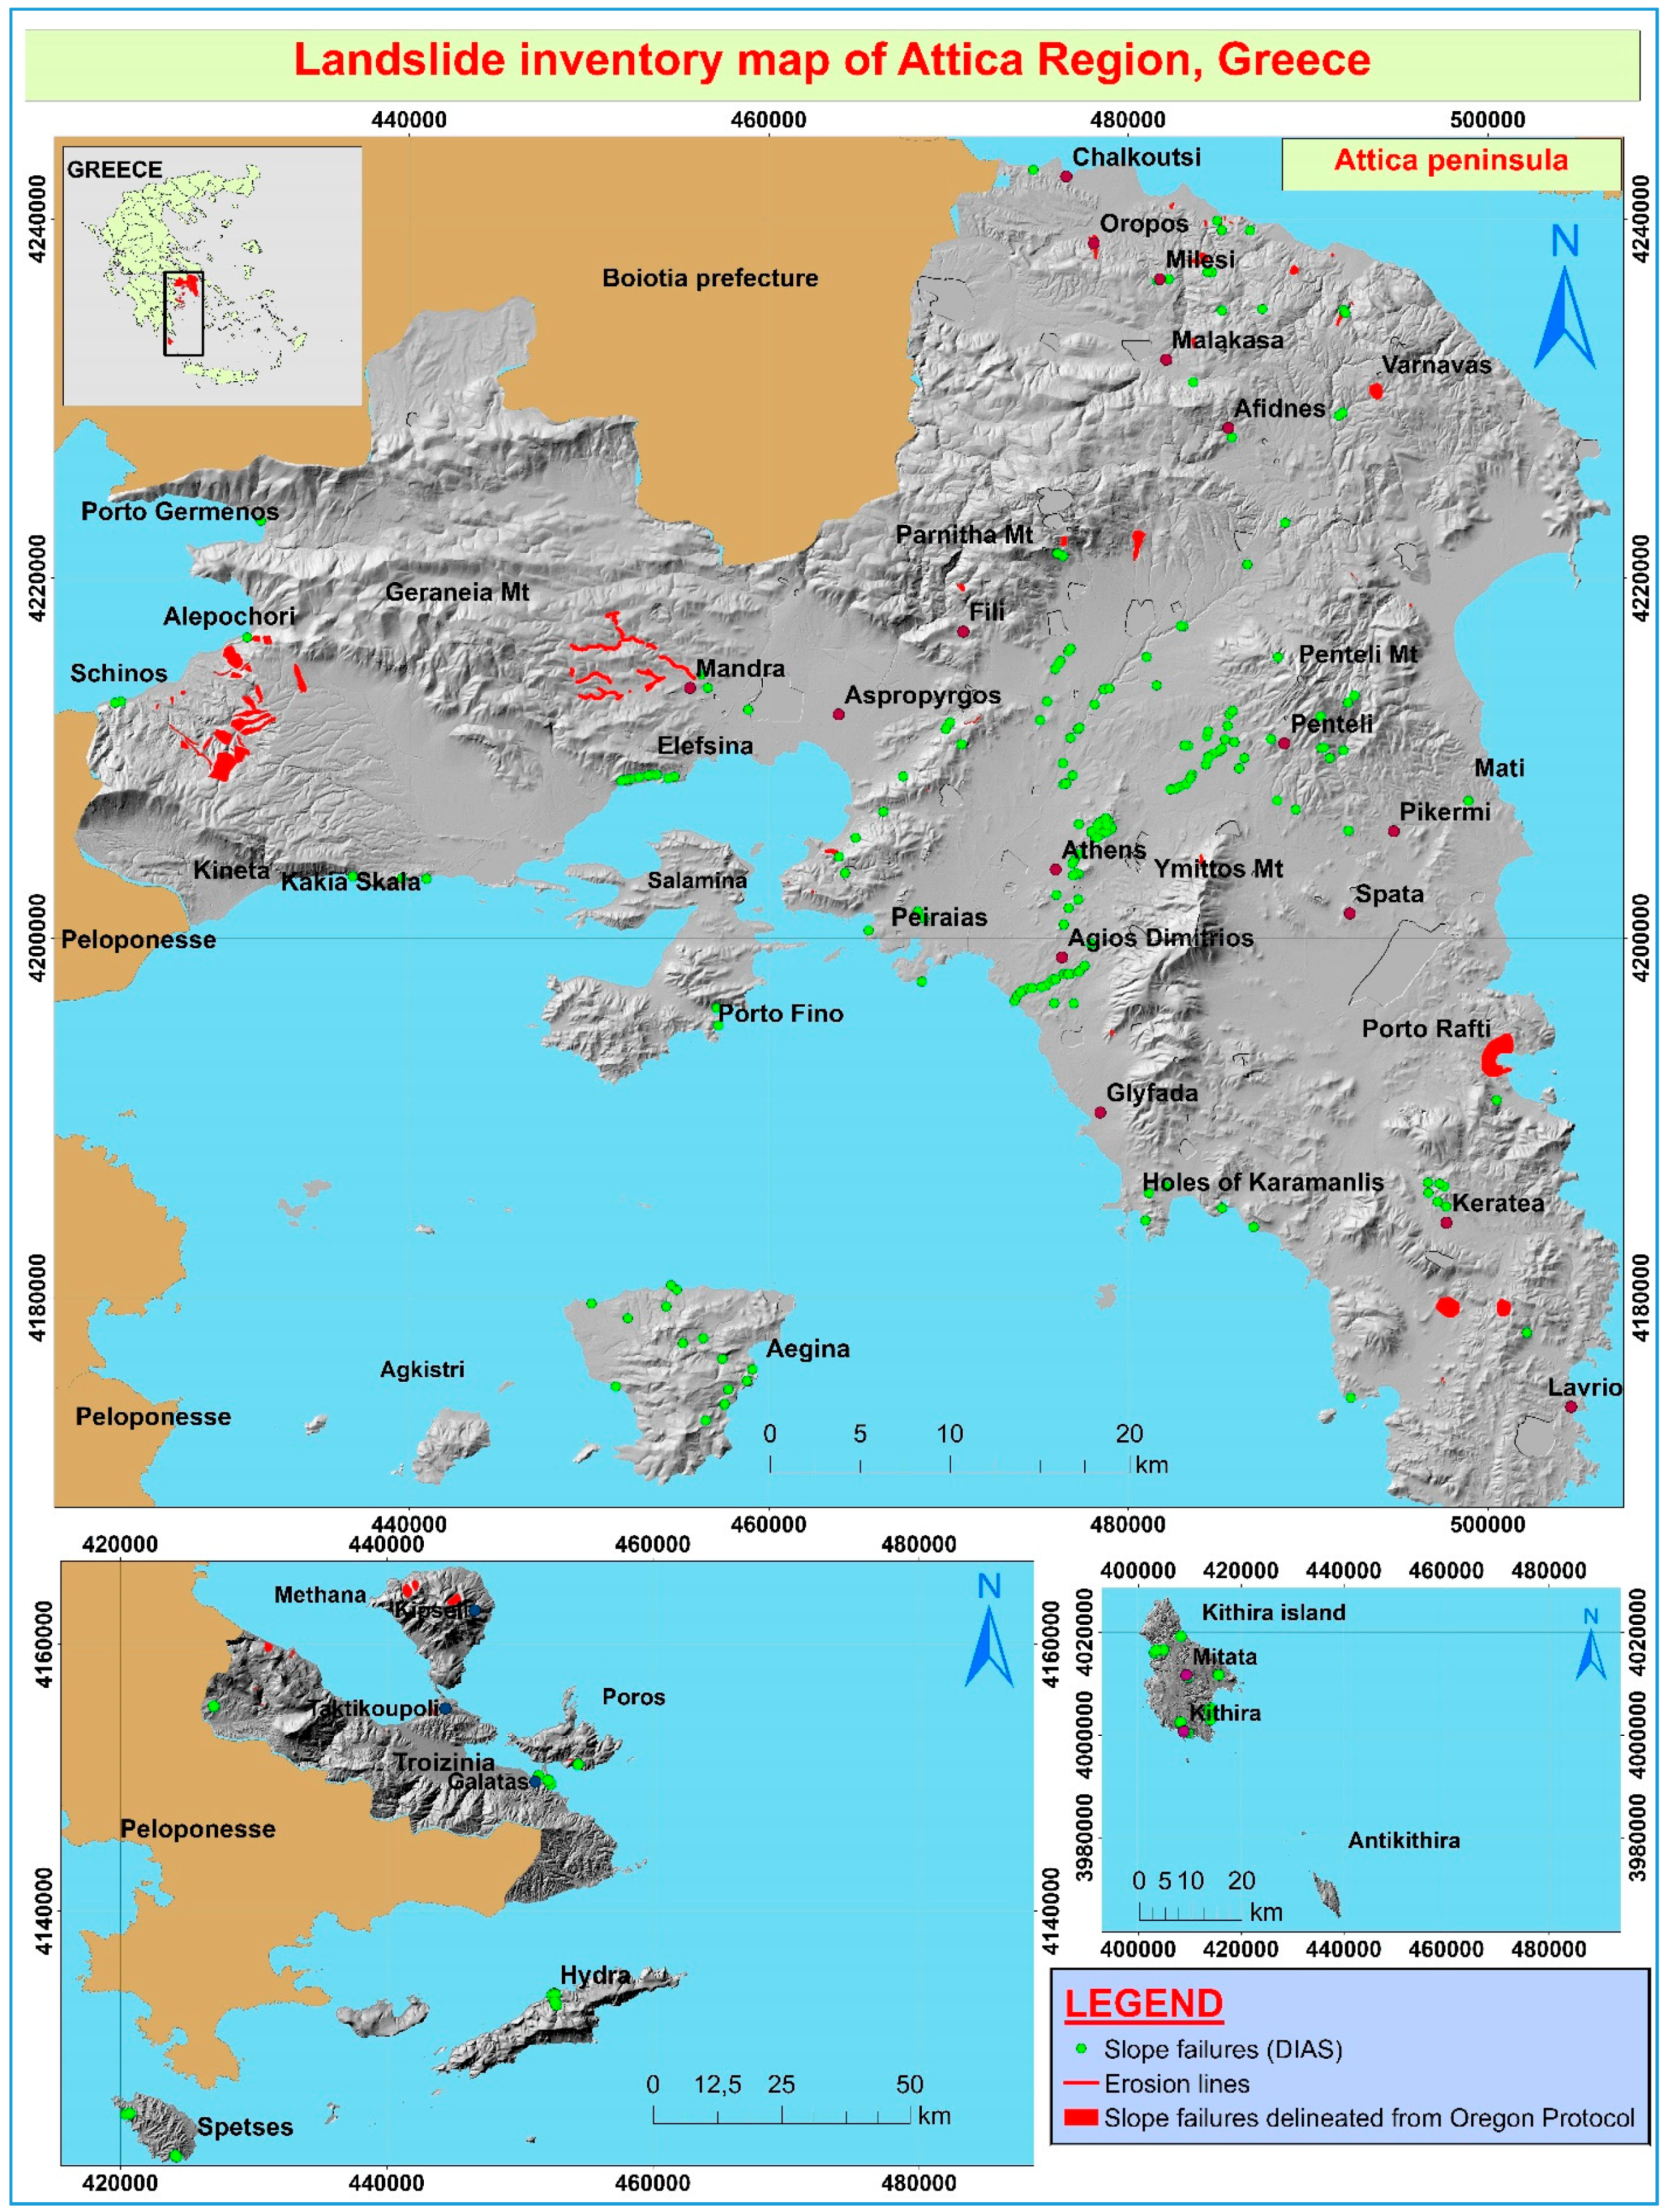
- in this region, many cases of slope failures have been reported (Figure 1); the well-known historical landslide of Malakasa (1995) [8] caused serious economic consequences due to the cut-off connection between Athens (the capital city of Greece) and the northern part of Greece; the dangerous, due to rockfalls, segment (located in Kakia Skala) of the National motorway connecting Athens to Patras, some other characteristic rockfall sites such as Alepochori–Psatha, and Alepochori–Schino in Western Attica. Furthermore, rockfalls at particular segments of main streams due to erosion and flash floods, landslides and rockfalls at Attica islands (e.g., Kithira, Salamina, Aegina, Spetses, Hydra, Poros), are some of the most characteristic slope failures that already took place in the administrative region of Attica. Thus, adopting the principle that “slope failures in the future will be more likely to occur under the conditions which led to past and present instability” [9], and inventorying and mapping the susceptible to failure slopes provides crucial information for evaluating the future occurrence of landslides in this region.
- (ii)
- the existing information considering the landslide occurrences in Attica Region was dispersed in more than one public agency, and was mainly focused on landslides documented along the road network and residential areas, while only a few cases were georeferenced. The slope failures induced at the mountainous areas and at sites that are not directly affecting the manmade environment were either not recorded or probably under-reported. Thus, there is a need for gathering every slope failure that happened till nowadays, for generating reliable hazard maps in order to use them for civil protection actions.
- (iii)
- the Attica region concentrates almost half of the Greek population, more than 60% of the industrial production in Greece and high-value properties and infrastructure. For this reason, mapping areas prone to slope failure helps public authorities associated with public works in taking mitigation measures against the increase of risk in potentially dangerous areas, leading to losses of life and investments in such a densely populated county.
- (iv)
- the completeness and quality of the available slope failures and thematic geodata.
- (v)
- to the author’s knowledge, this is the first time that a landslide susceptibility analysis has been conducted on a regional scale (1:100,000), for the whole territory of the Attica Region. Furthermore, the generated landslide susceptibility map will serve for many authorities related to public works, as a dynamic map for the planning, design, and implementation of a long-term landslide reduction strategy as well as identifying the areas where more detailed investigations will be required for the planning of critical infrastructure.
- (vi)
- taking into account that the next five to ten years, very important civil engineering projects are about to be constructed in Attica county (such as transports network elements: highways, railroads, metro-tunnels, hospitals, administrative buildings, security/emergency structures, residential buildings) the existence of a regional-scale landslide susceptibility map could be a very useful tool for supporting decisions in order to prevent the location of high-value constructions in unsuitable locations.
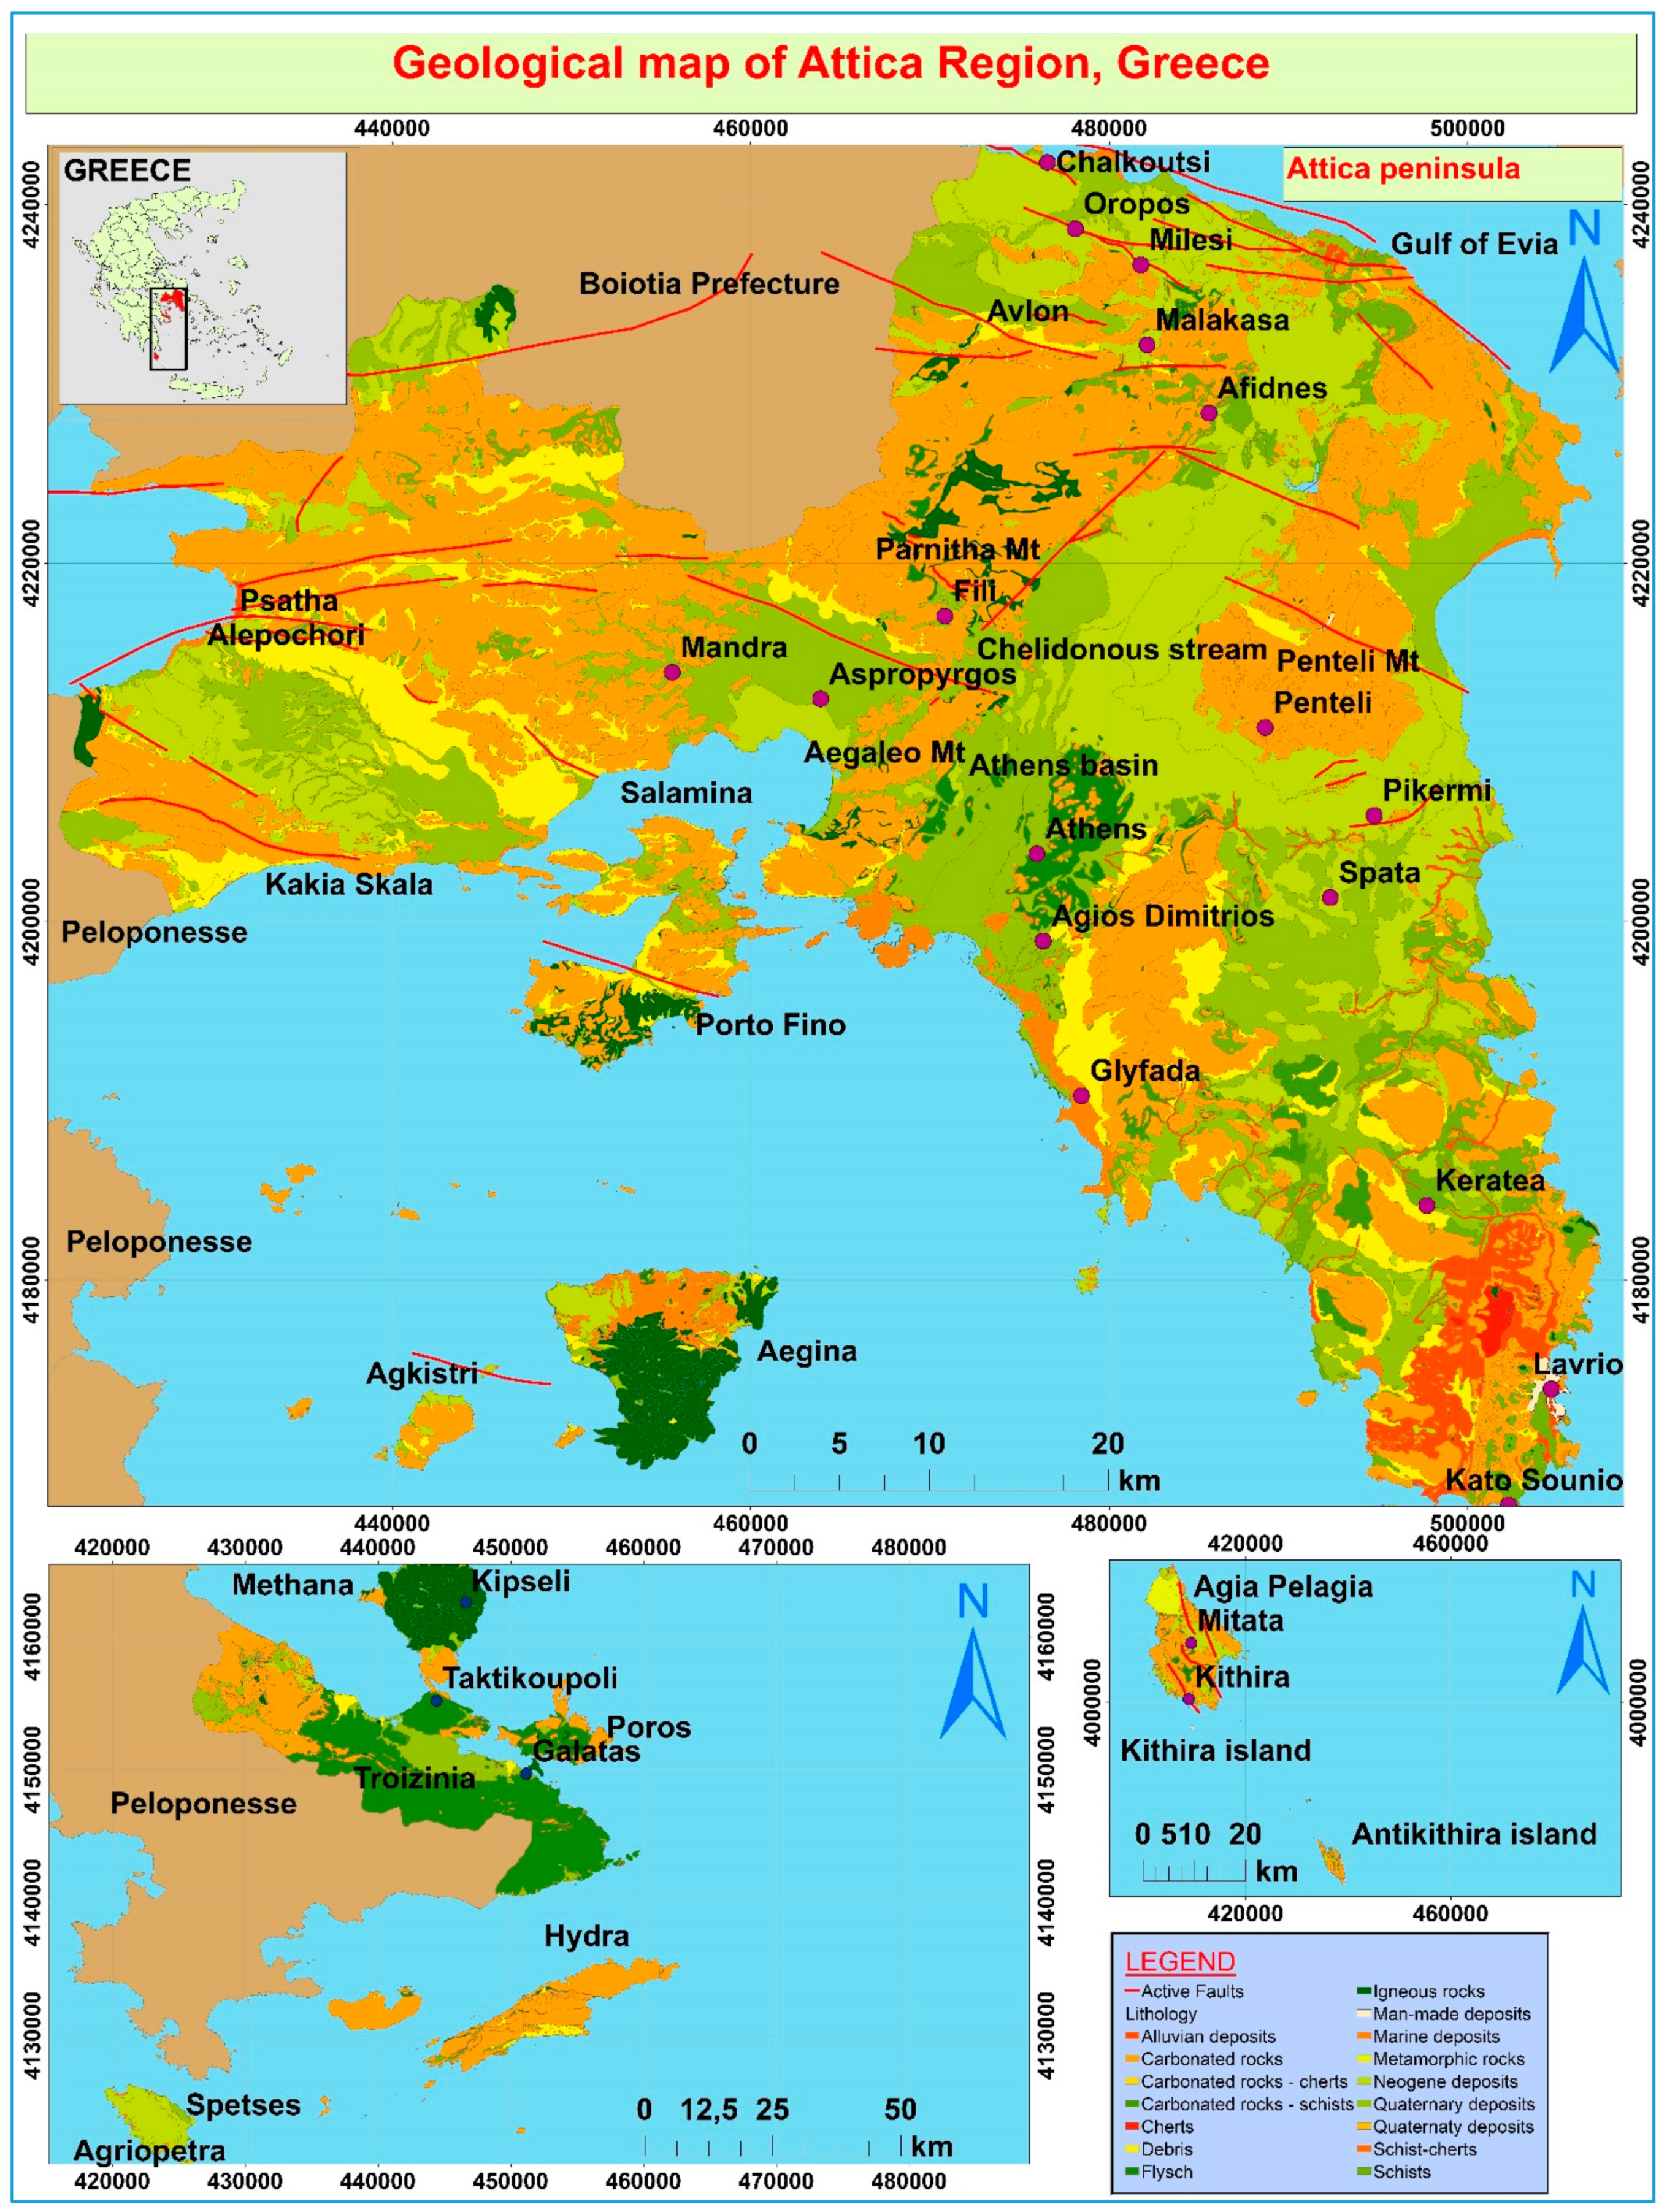
2. Geology and Tectonic Setting of Attica
3. Materials and Methods
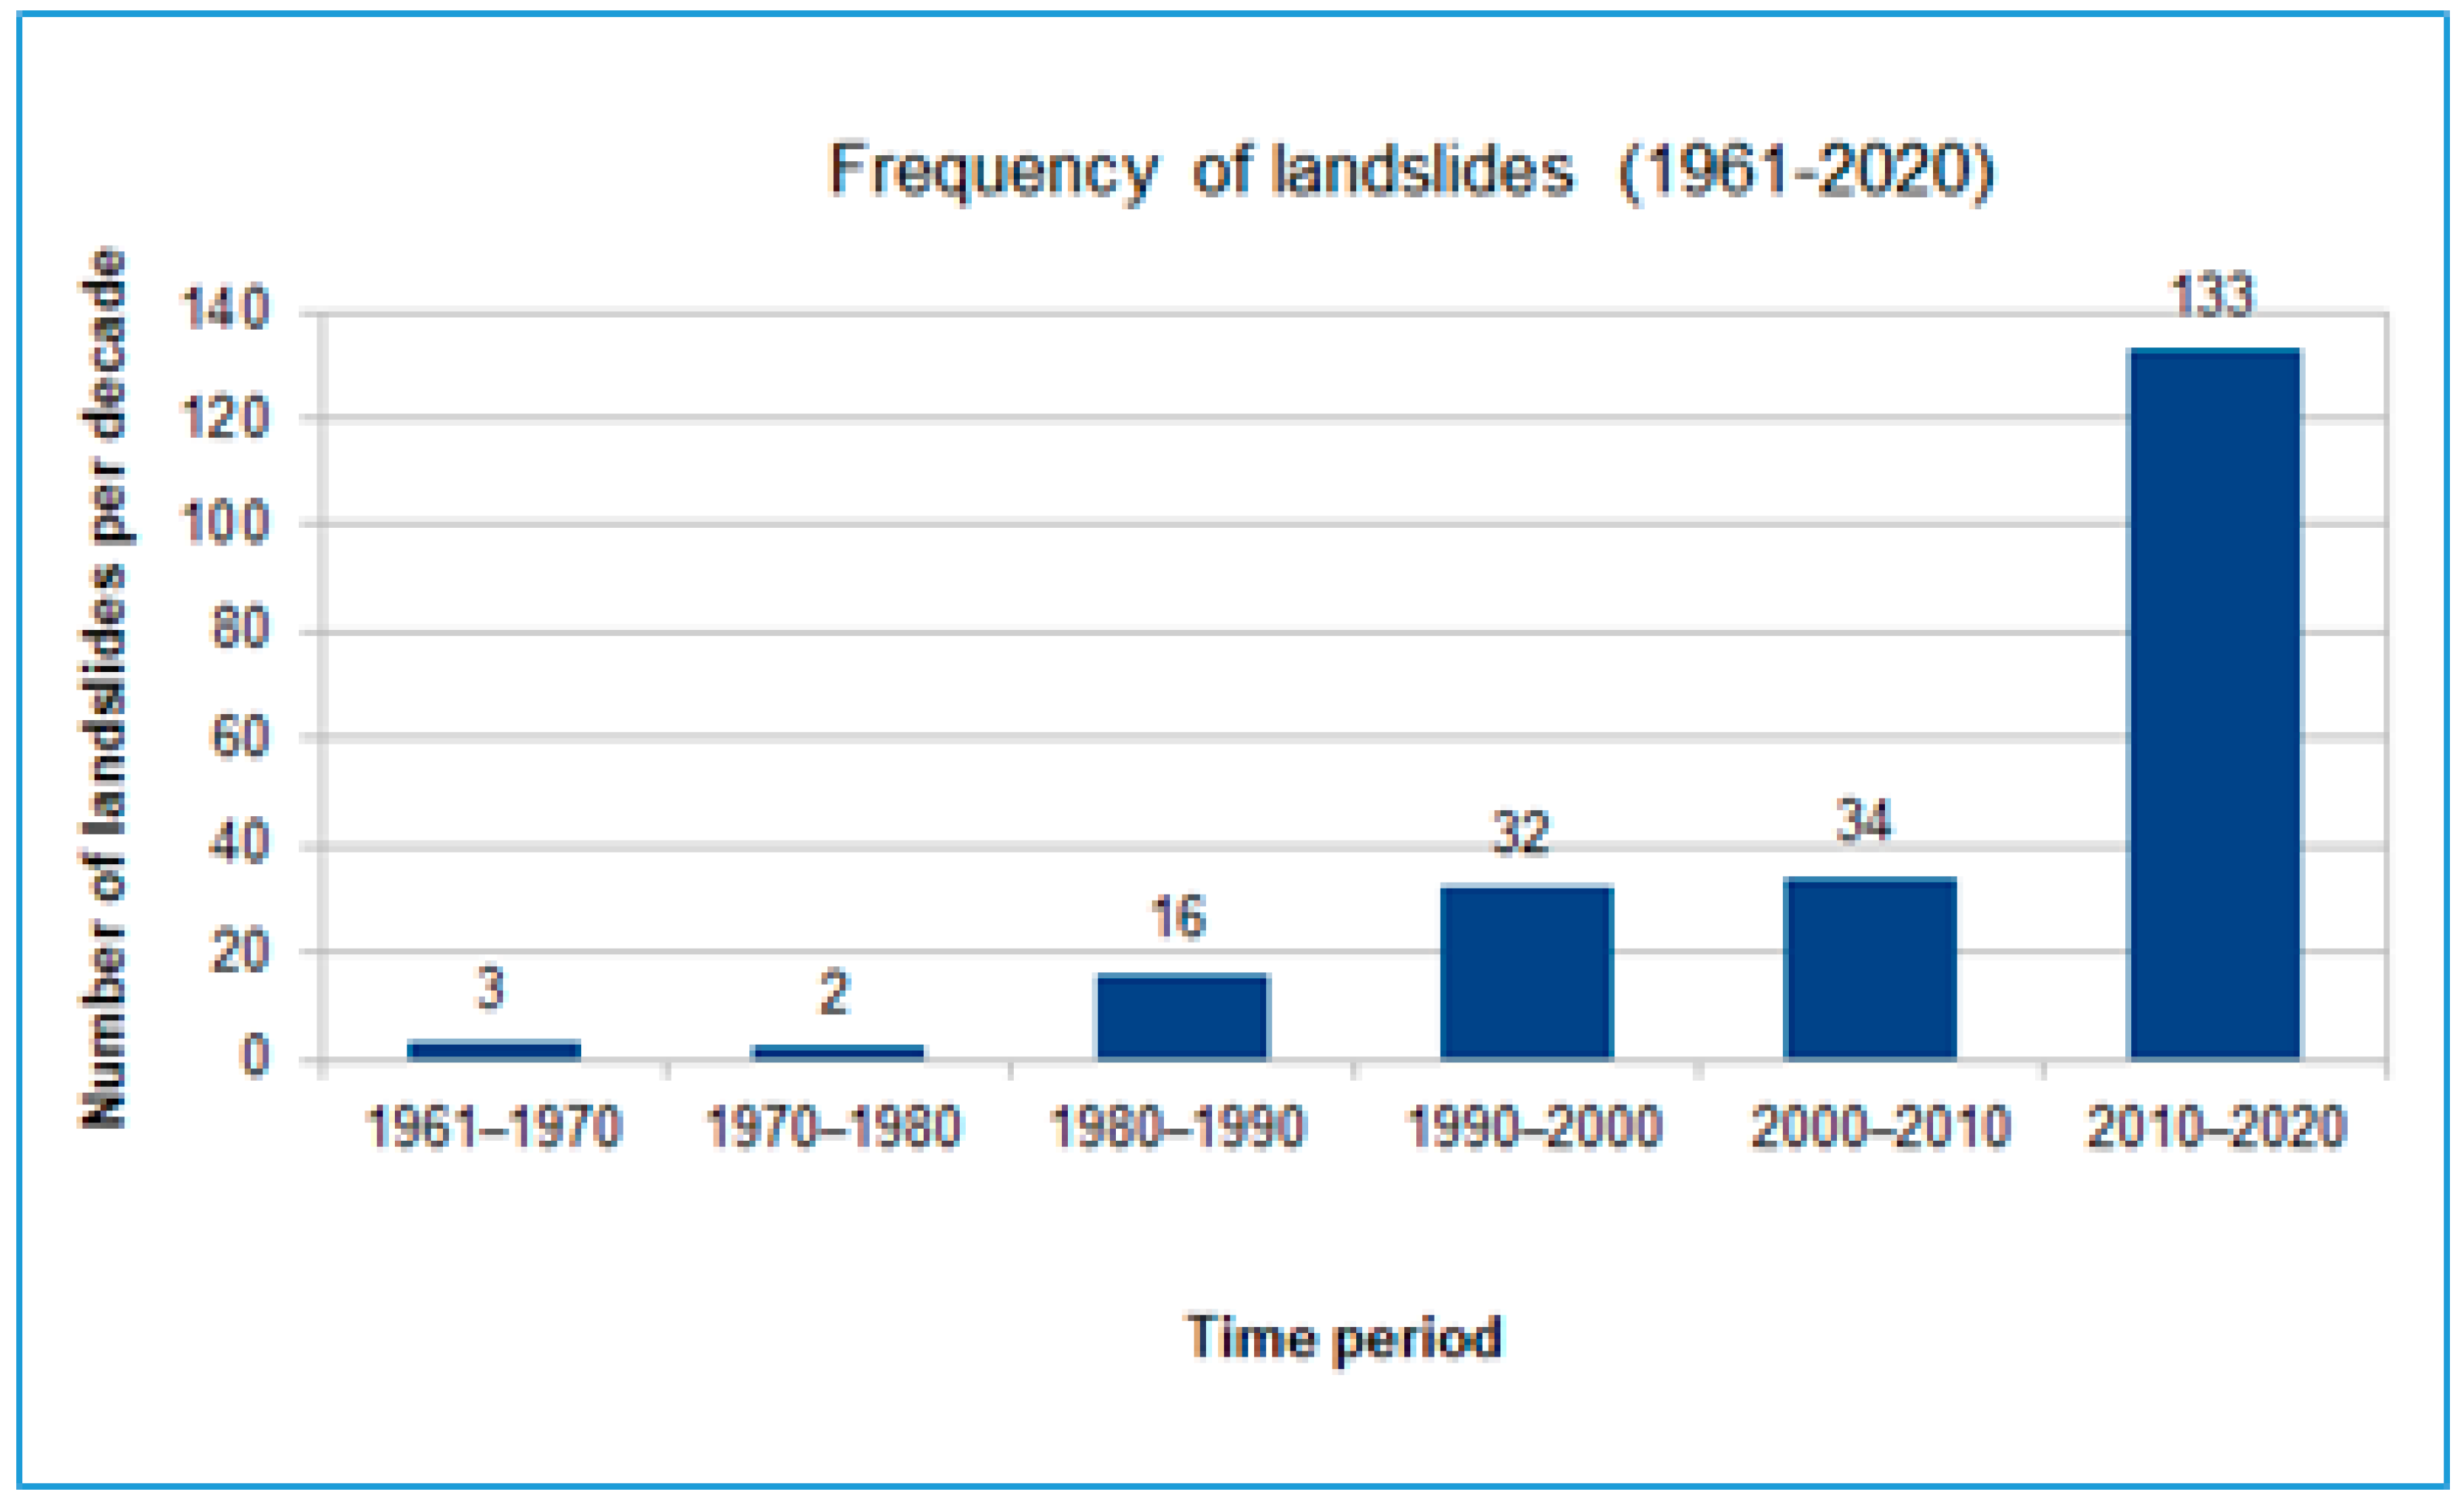
3.1. Landslide Inventory of Attica
- An in-depth collection and review of technical reports (analog and electronic copies) from public authorities, research institutes and newspaper articles
- Field surveys and validation of previously mapped landslides by the authors of past reports
- Airborne and satellite image analysis and interpretation using (a) multi-temporal optical images from Google Earth Pro, (b) processed hillshade imagery extracted from a high-resolution Digital Elevation Model (pixel size of 5 m). we used the 5-m Digital Elevation Model for mapping older landslide features and identify new potential ones. Those landslide areas were delineated based on the guidelines recommended by the protocol of Special Paper 42 from the Oregon Department of Geology and Mineral Industries [24]. The identified slope failures were imported in the ArcGIS database, georeferenced, based on the official Greek projection system (EGSA 87), as: (1) spatial data (mapped as points, lines and polygons) and (2) tabular (descriptive) data in text or numeric form, stored in rows and columns in a database and linked to spatial data [24]. Characteristic examples of the slope failures that were reported in the Attica Region and employed in the DIAS geodatabase are shown in the following Figure 2.
3.2. Assessment of Landslide Susceptibility at the Attica Region
- (i)
- R. Rafiee et al. (2018) [28], have used fuzzy RES in order to apply system thinking-based techniques for assessment of the rock mass cavability in block caving mines.
- (ii)
- J. Wang et al. (2018) [29], have implemented RES to evaluate sandy soil liquefaction.
- (iii)
- M. Ferentinou and M. Fakir (2018) [30], used RES in accordance with self-organising maps (e.g., artificial neural networks), so as to assess the stability performance of newly open pit slopes.
- (iv)
- Finally, M. Elmouttie and P. Dean (2020) [31], used RES and a system theoretic process analysis in order to design the control system for the slope stability monitoring in an open cut mining.
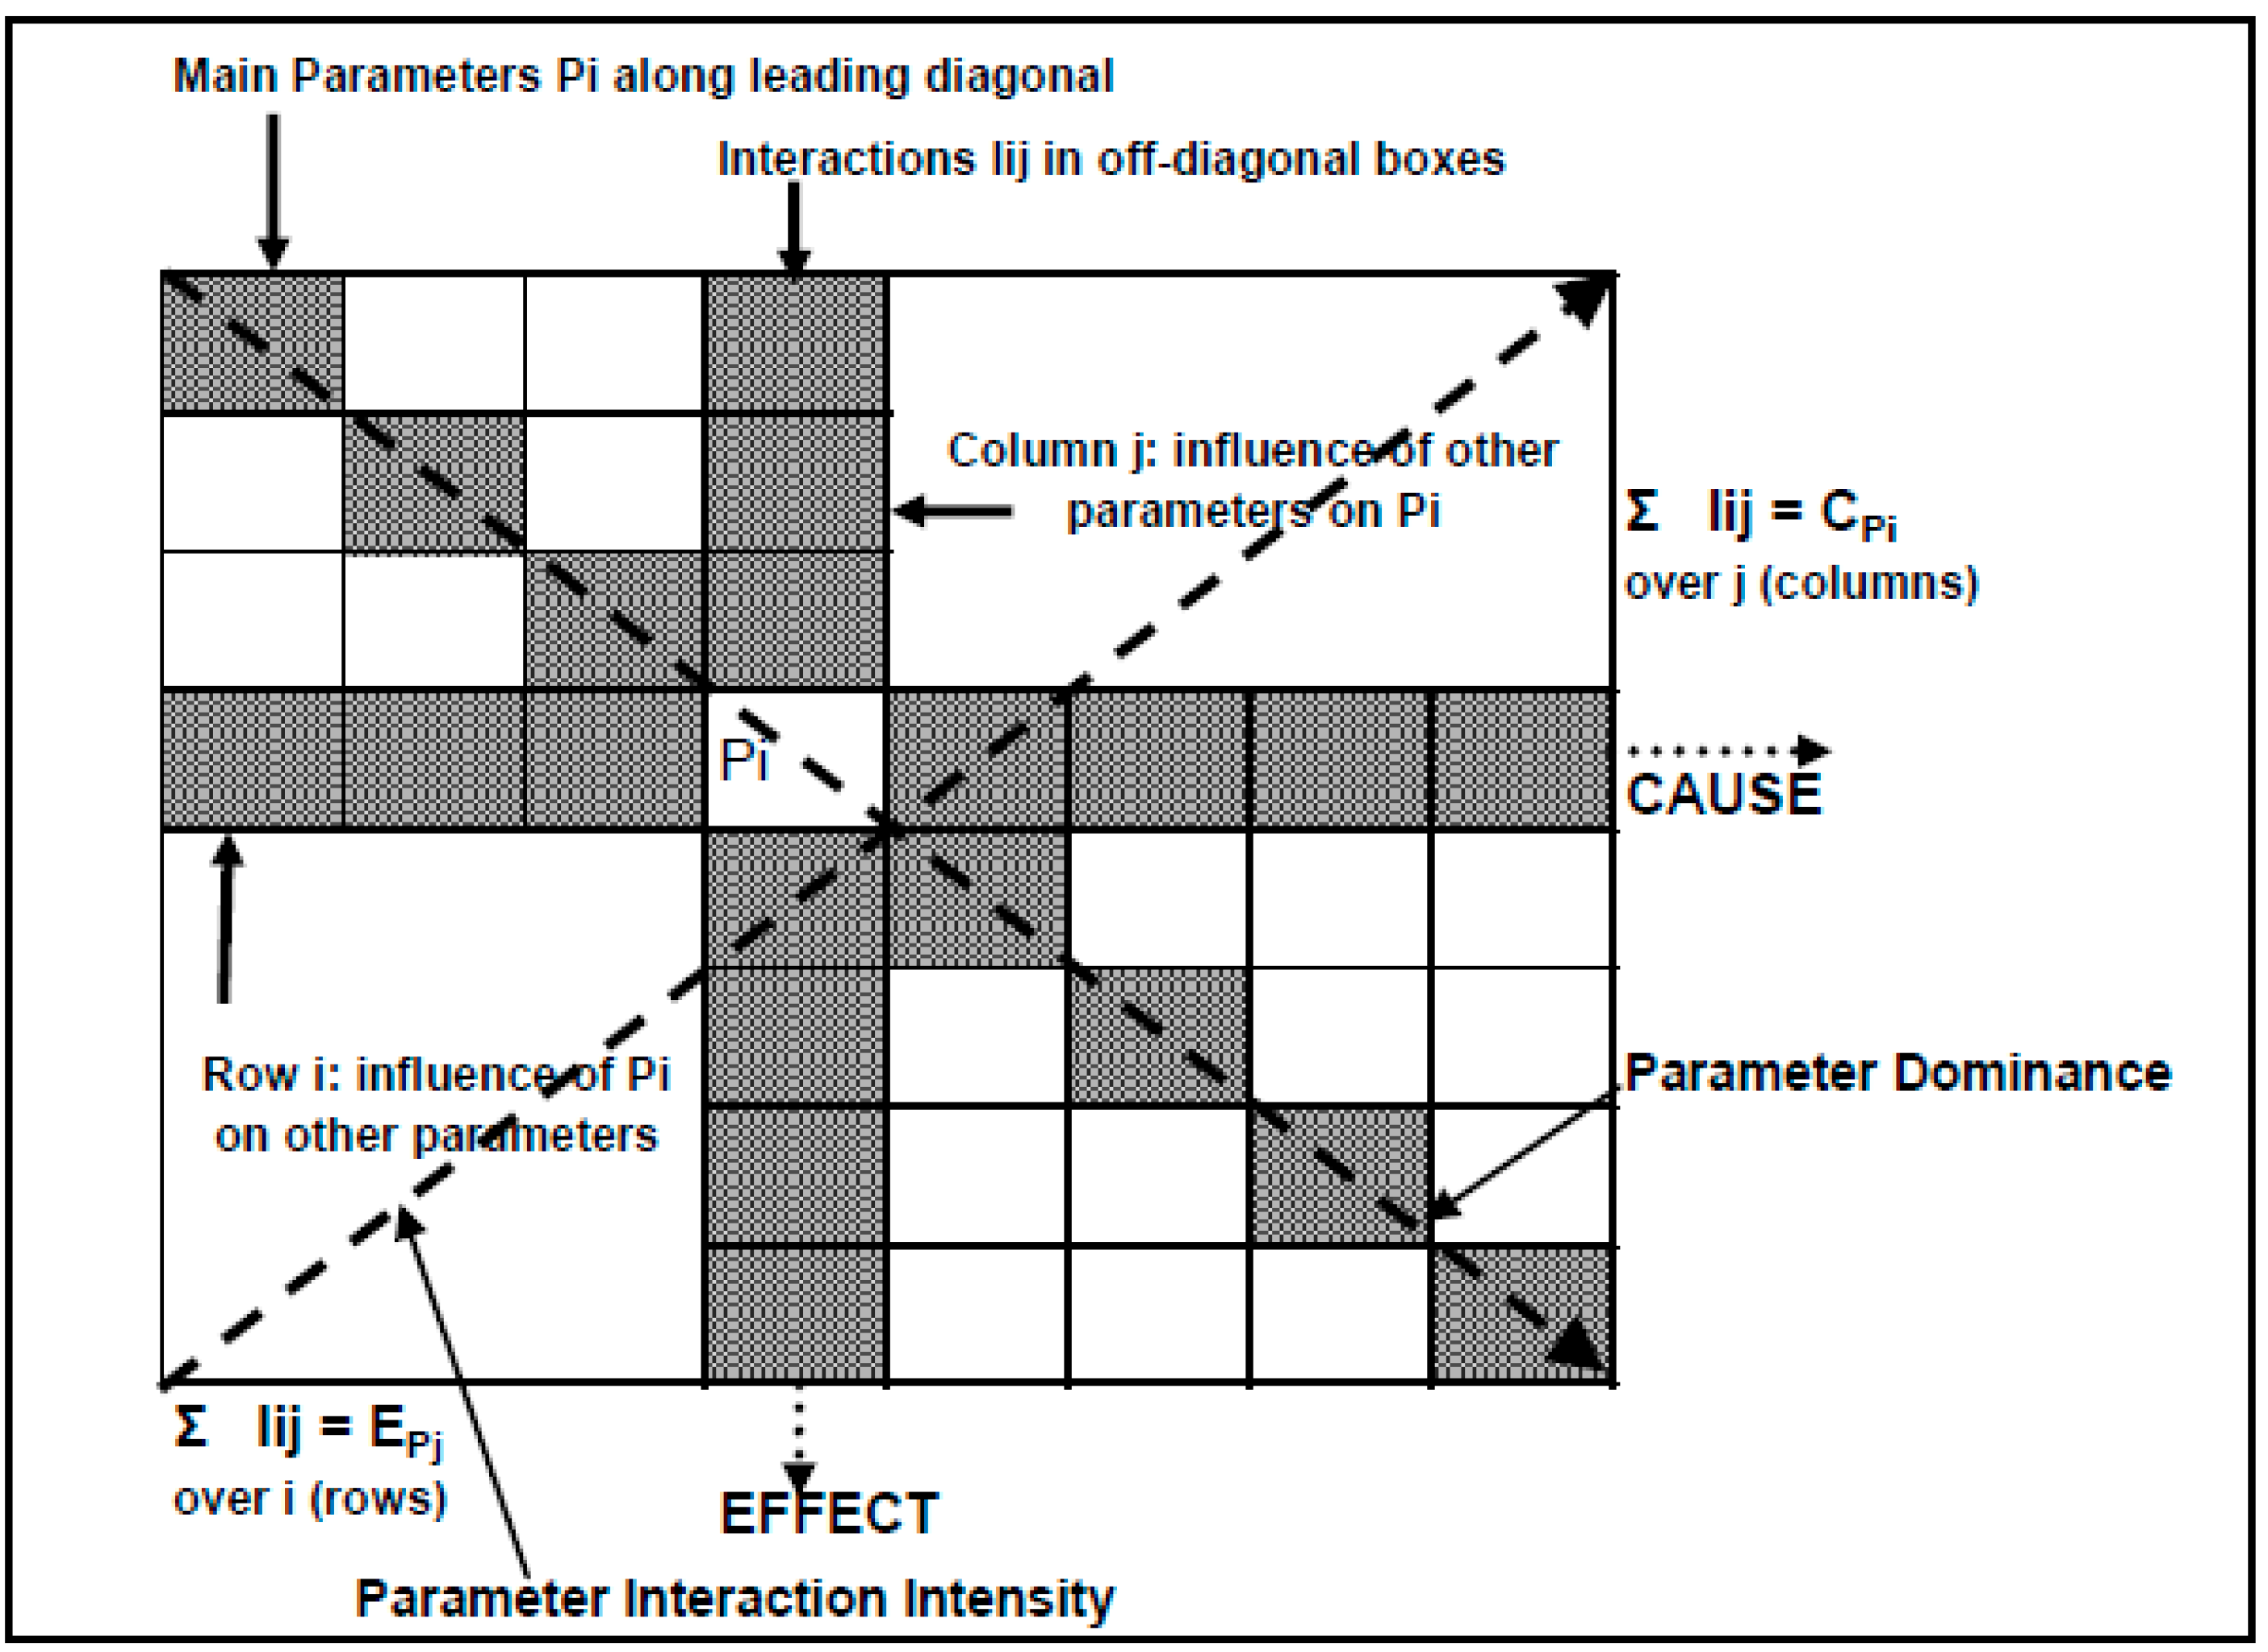
3.2.1. The RES Approach
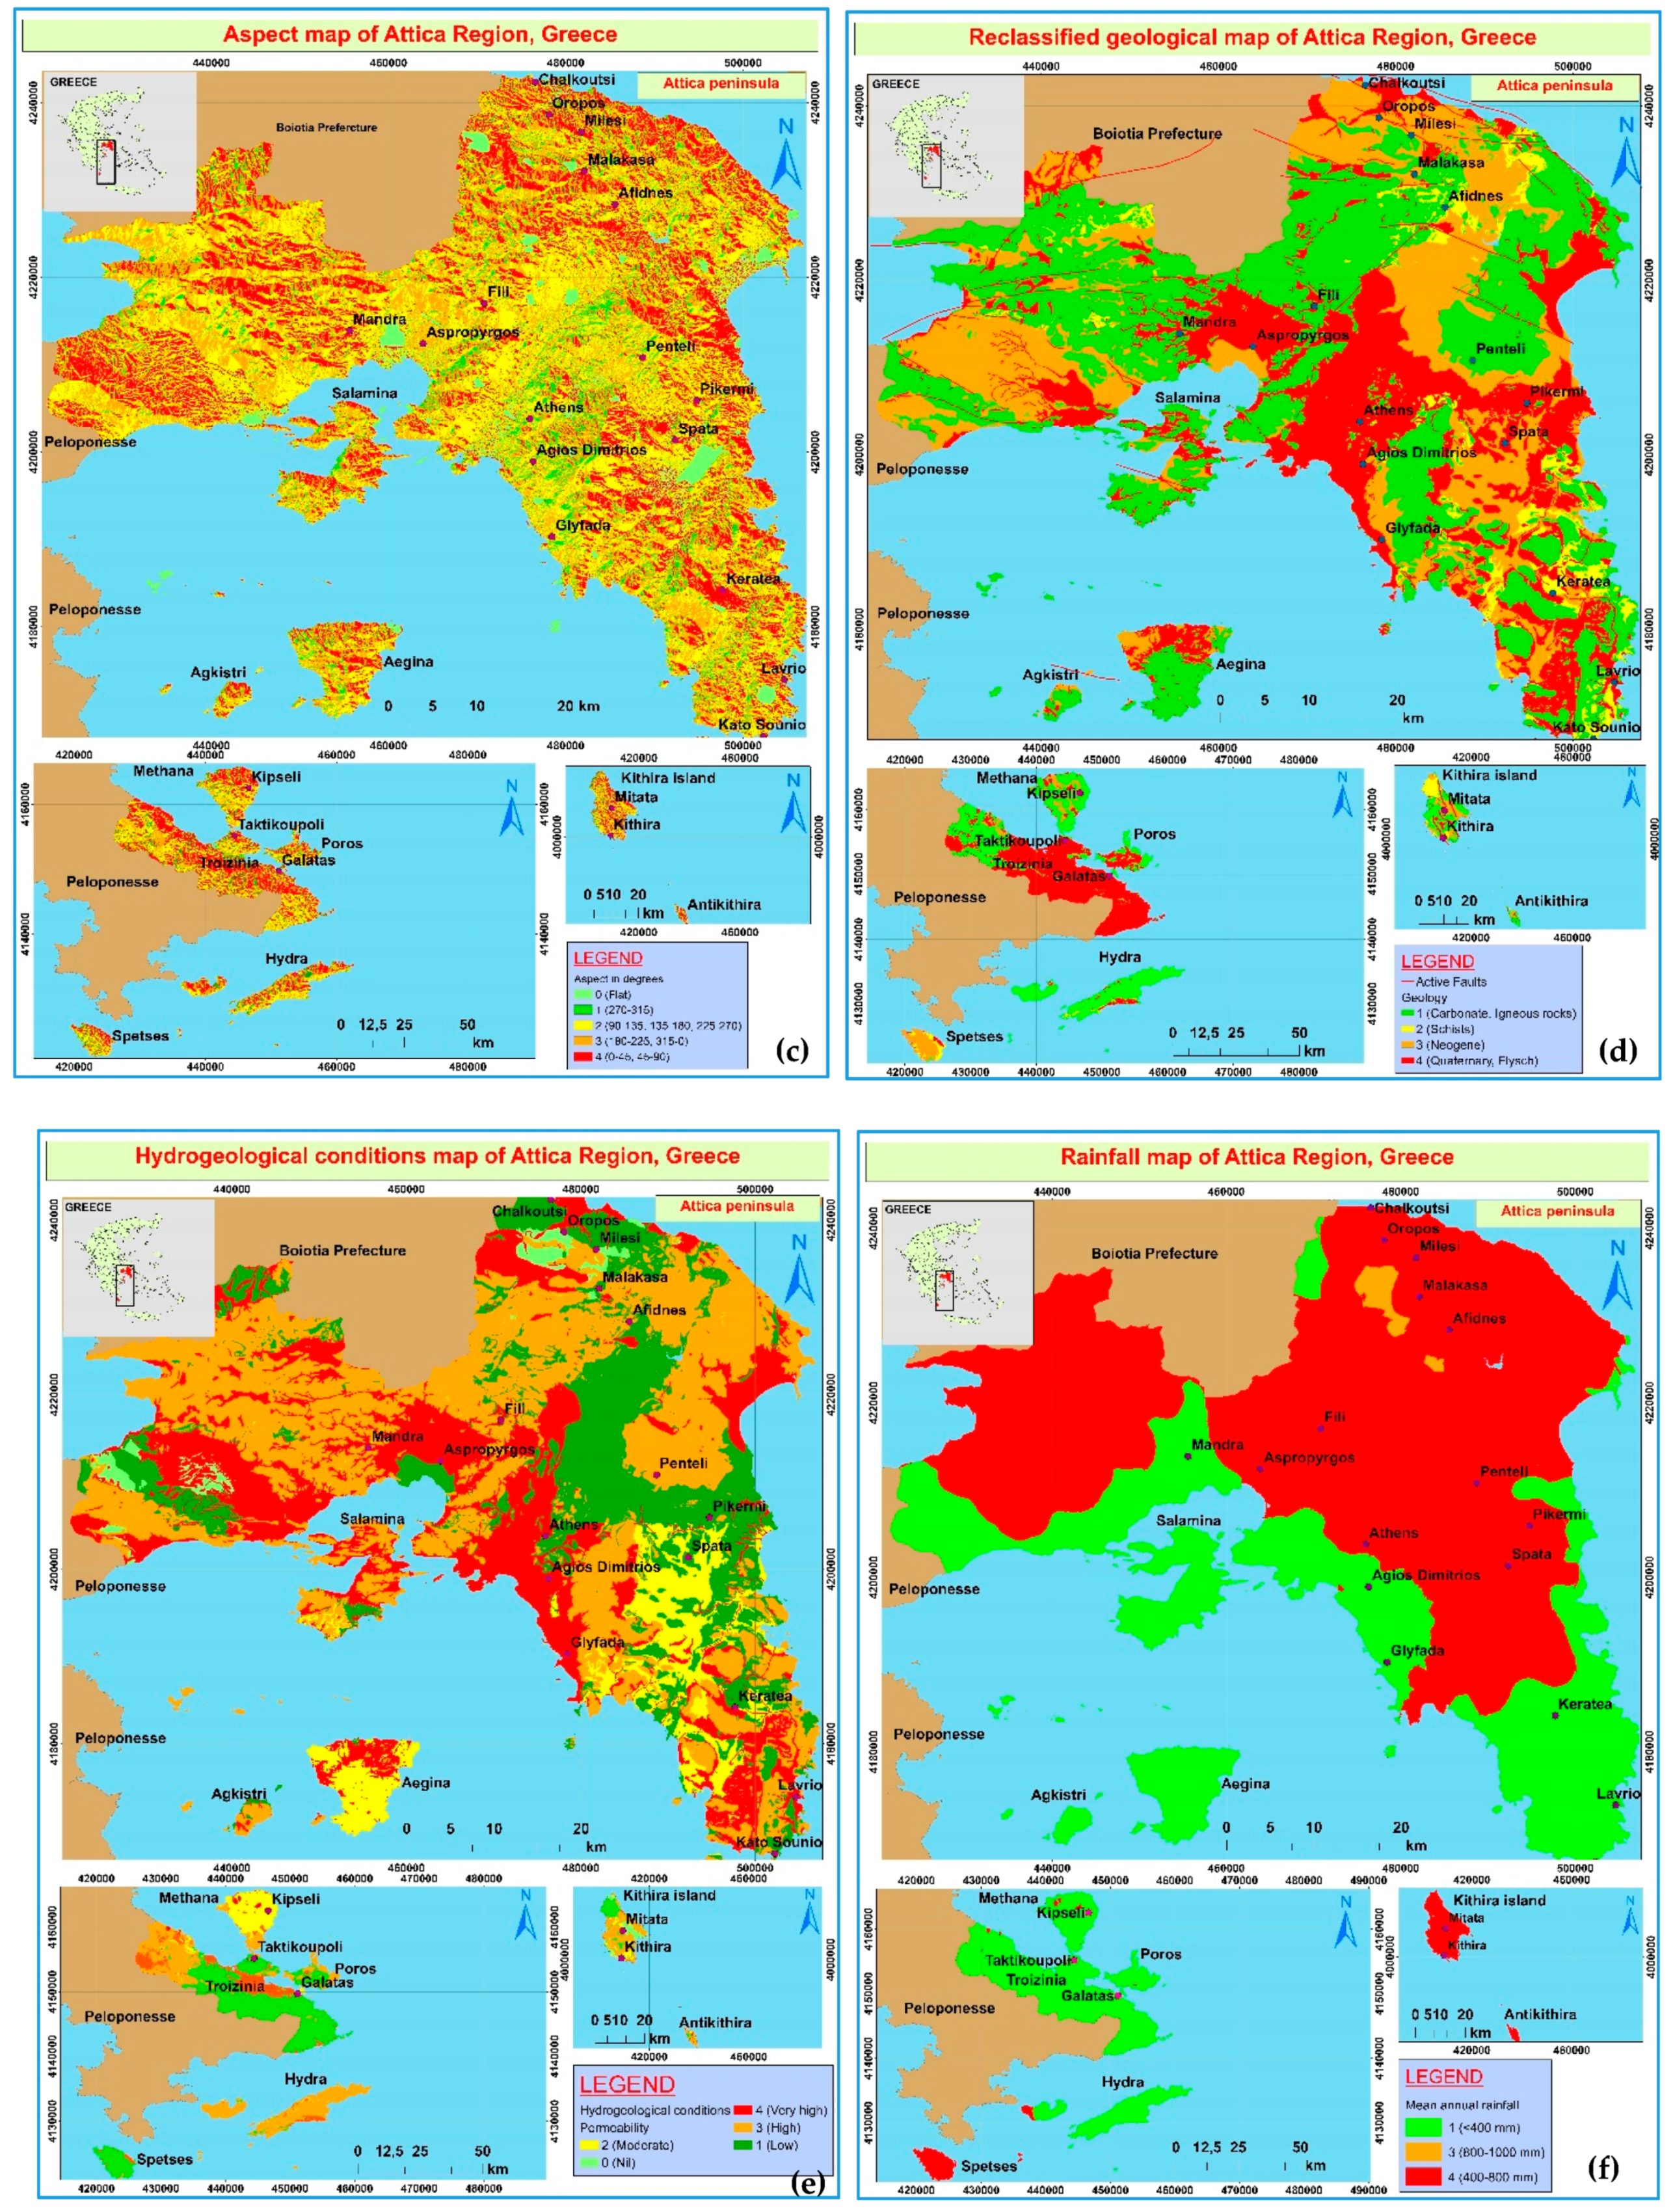
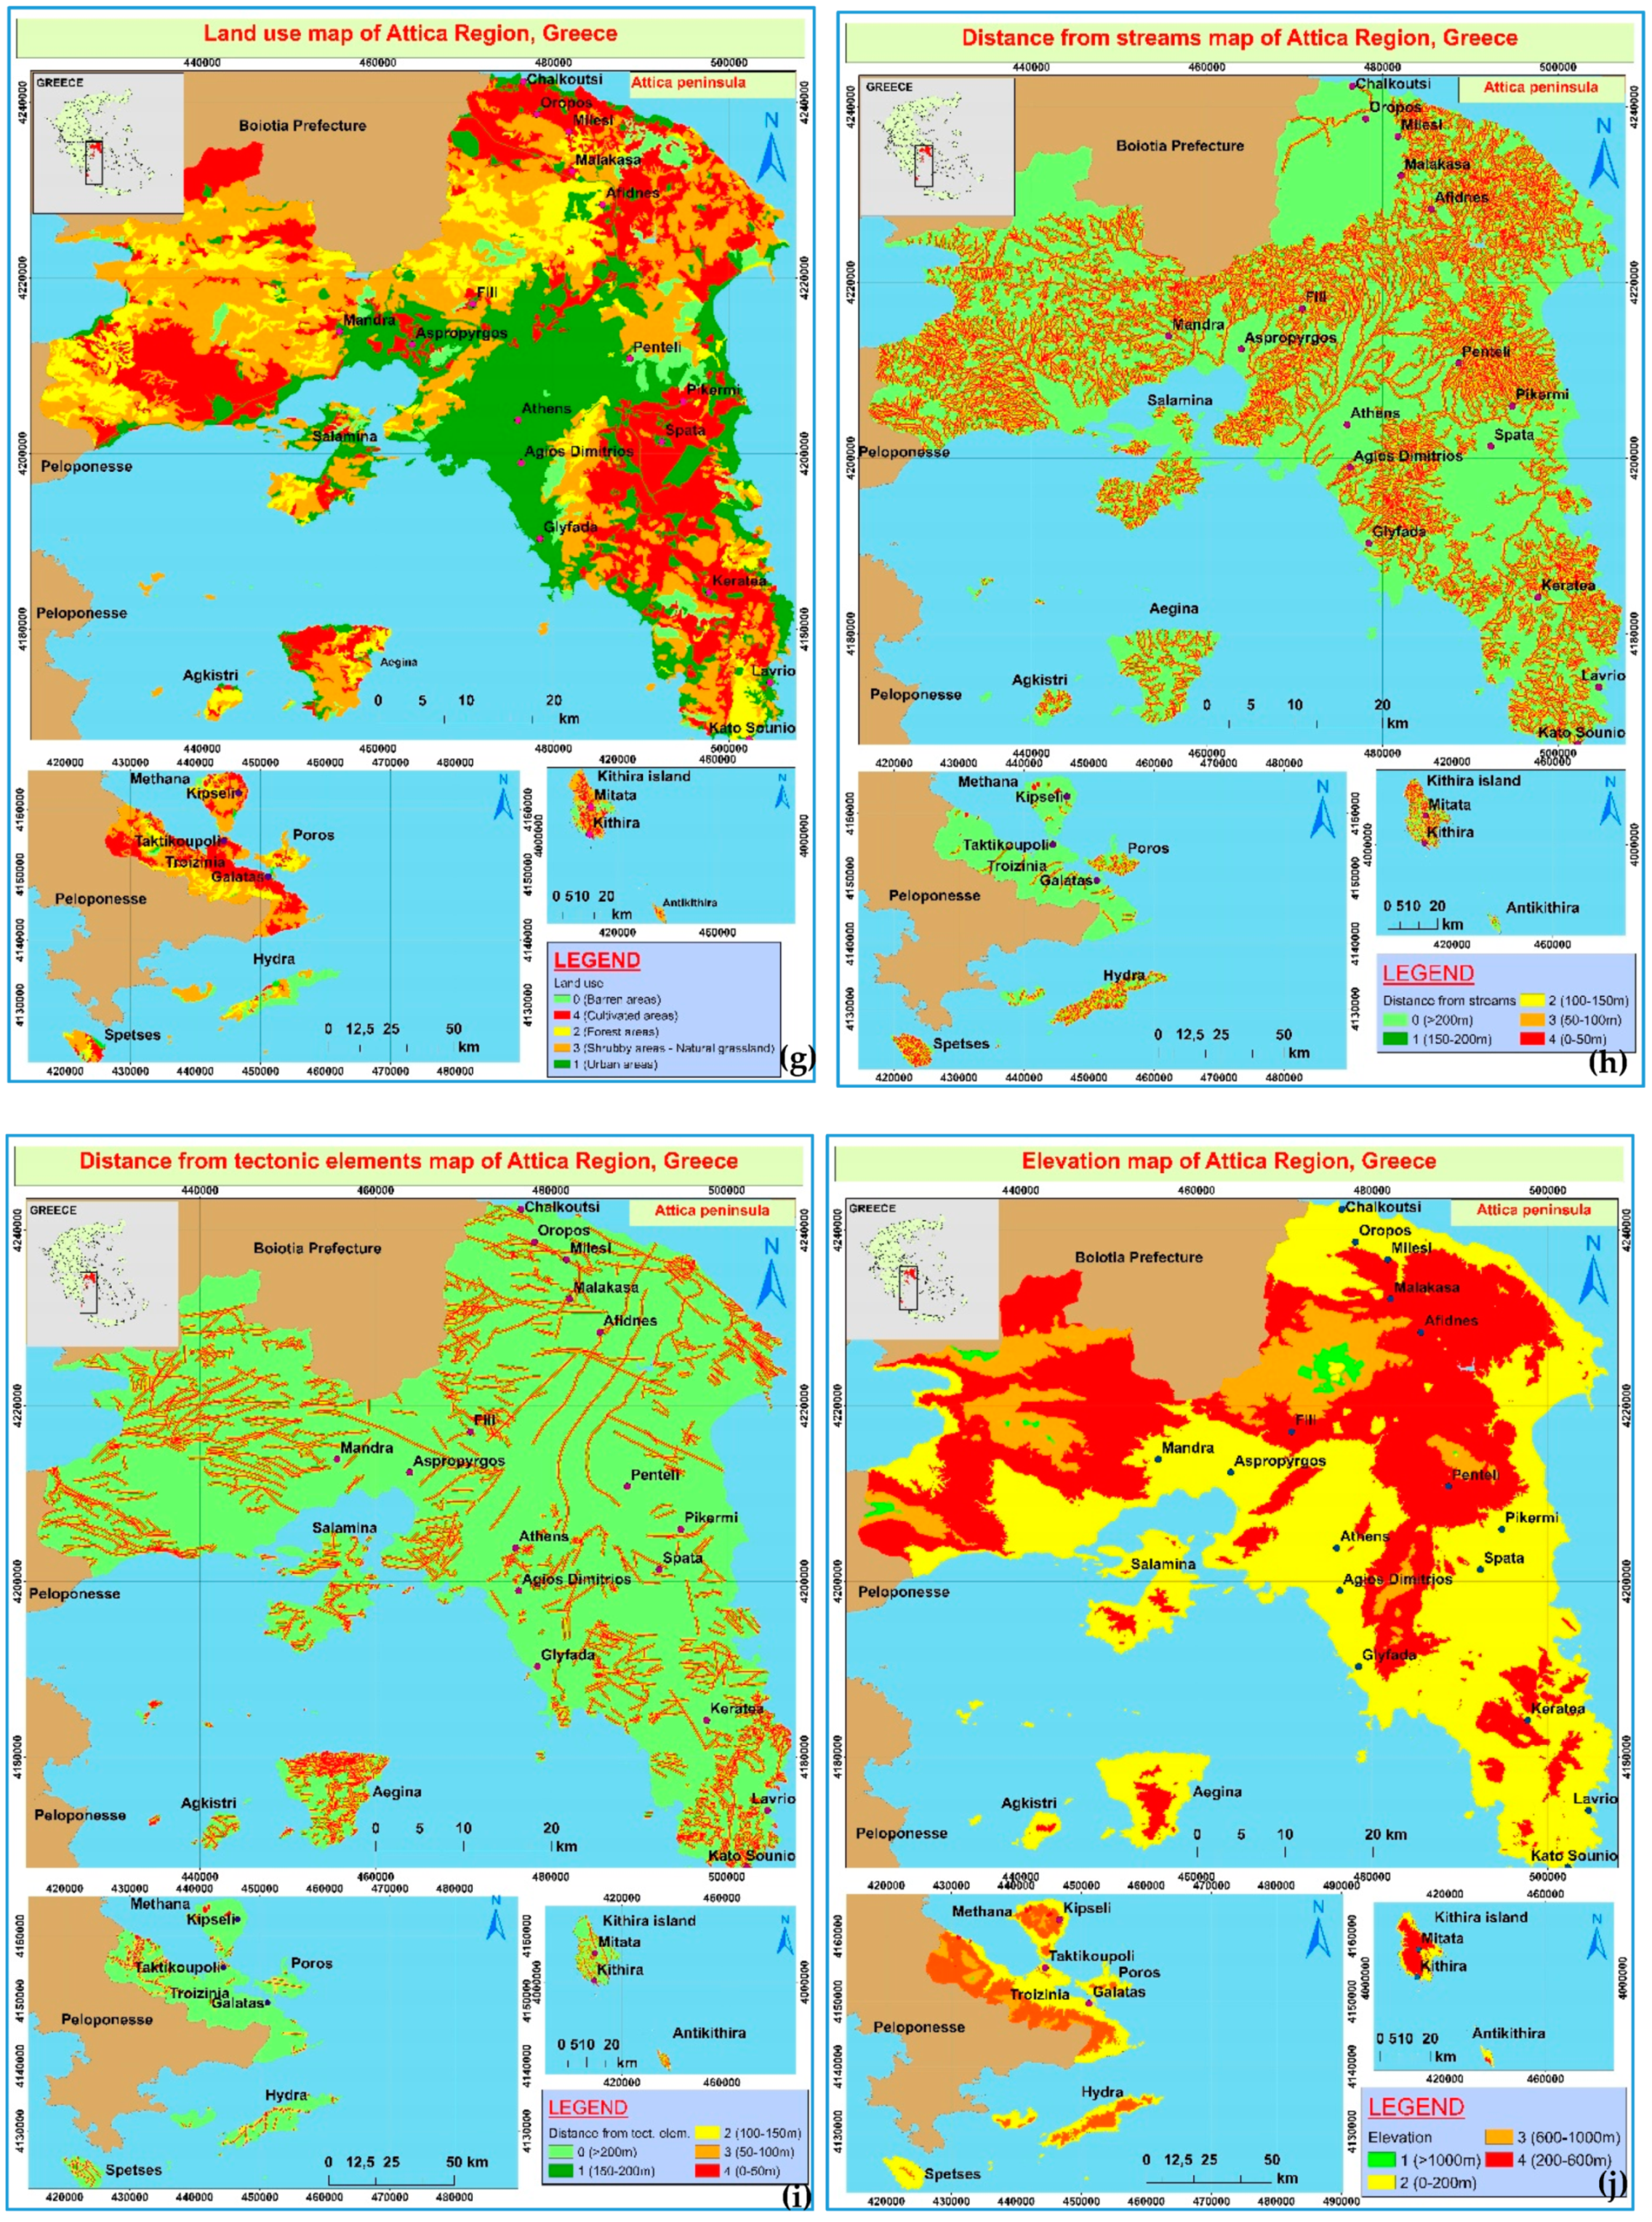
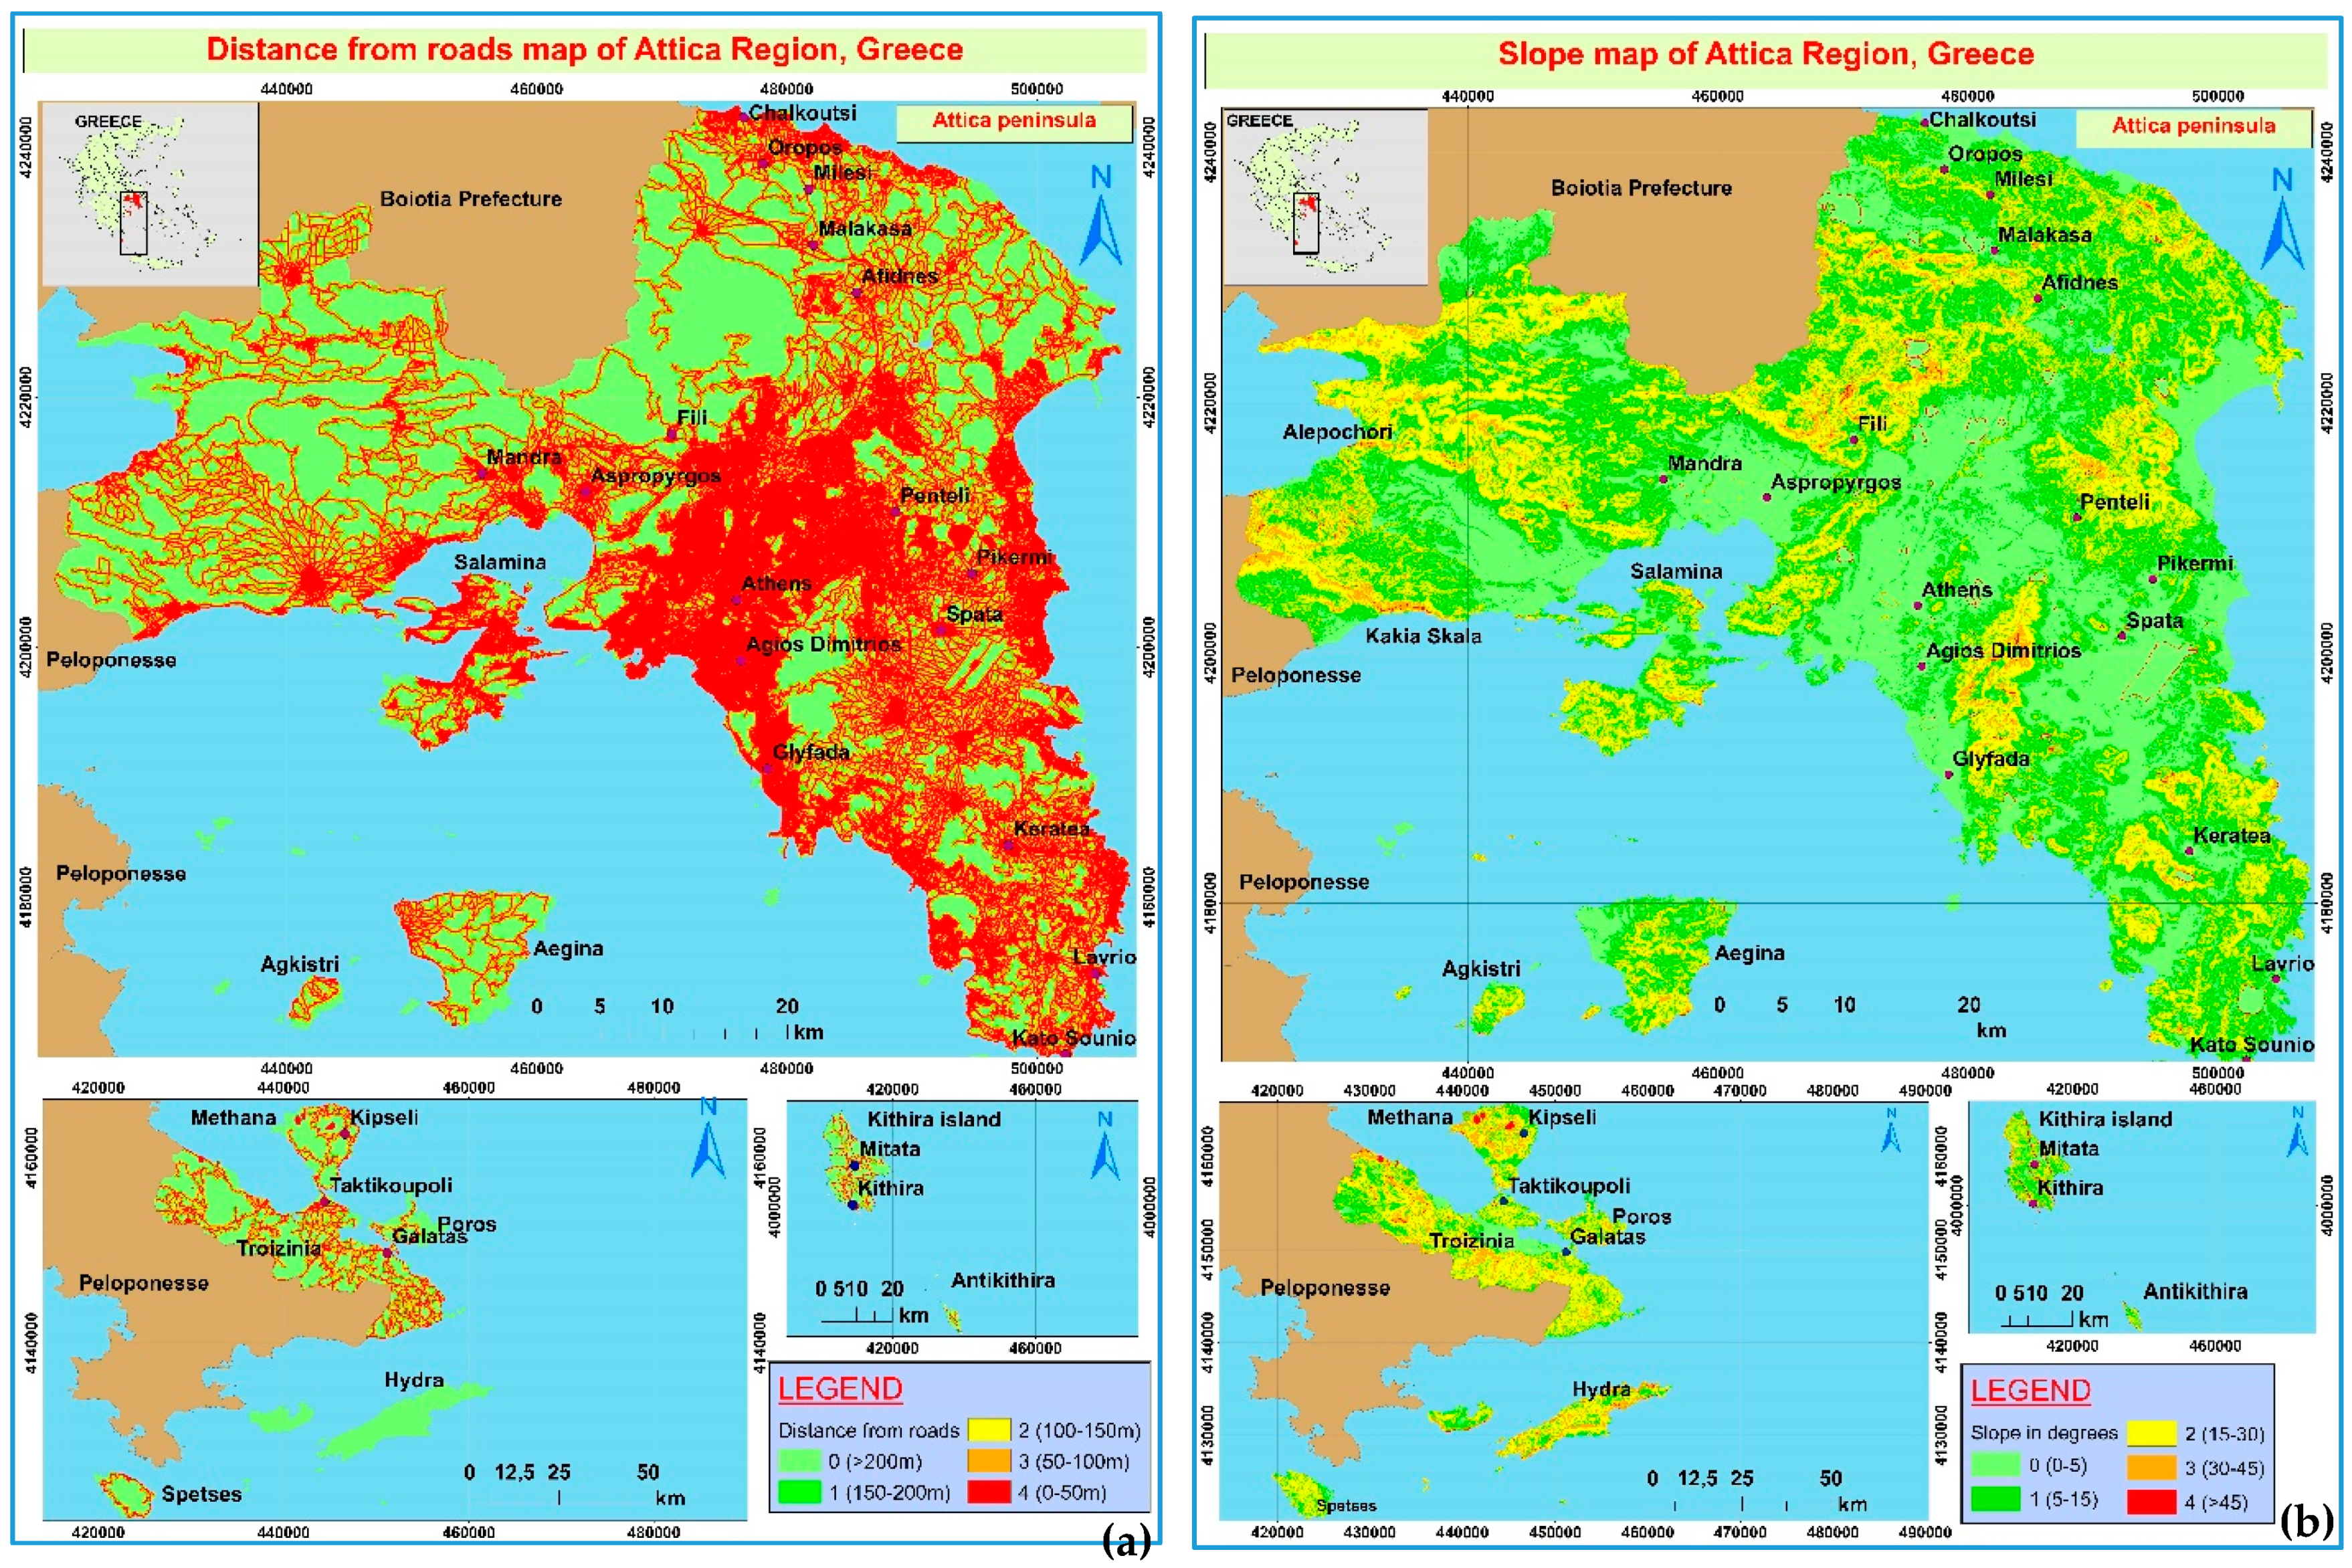
3.2.2. Selection of the Parameters Controlling the Slope Failures
- (i)
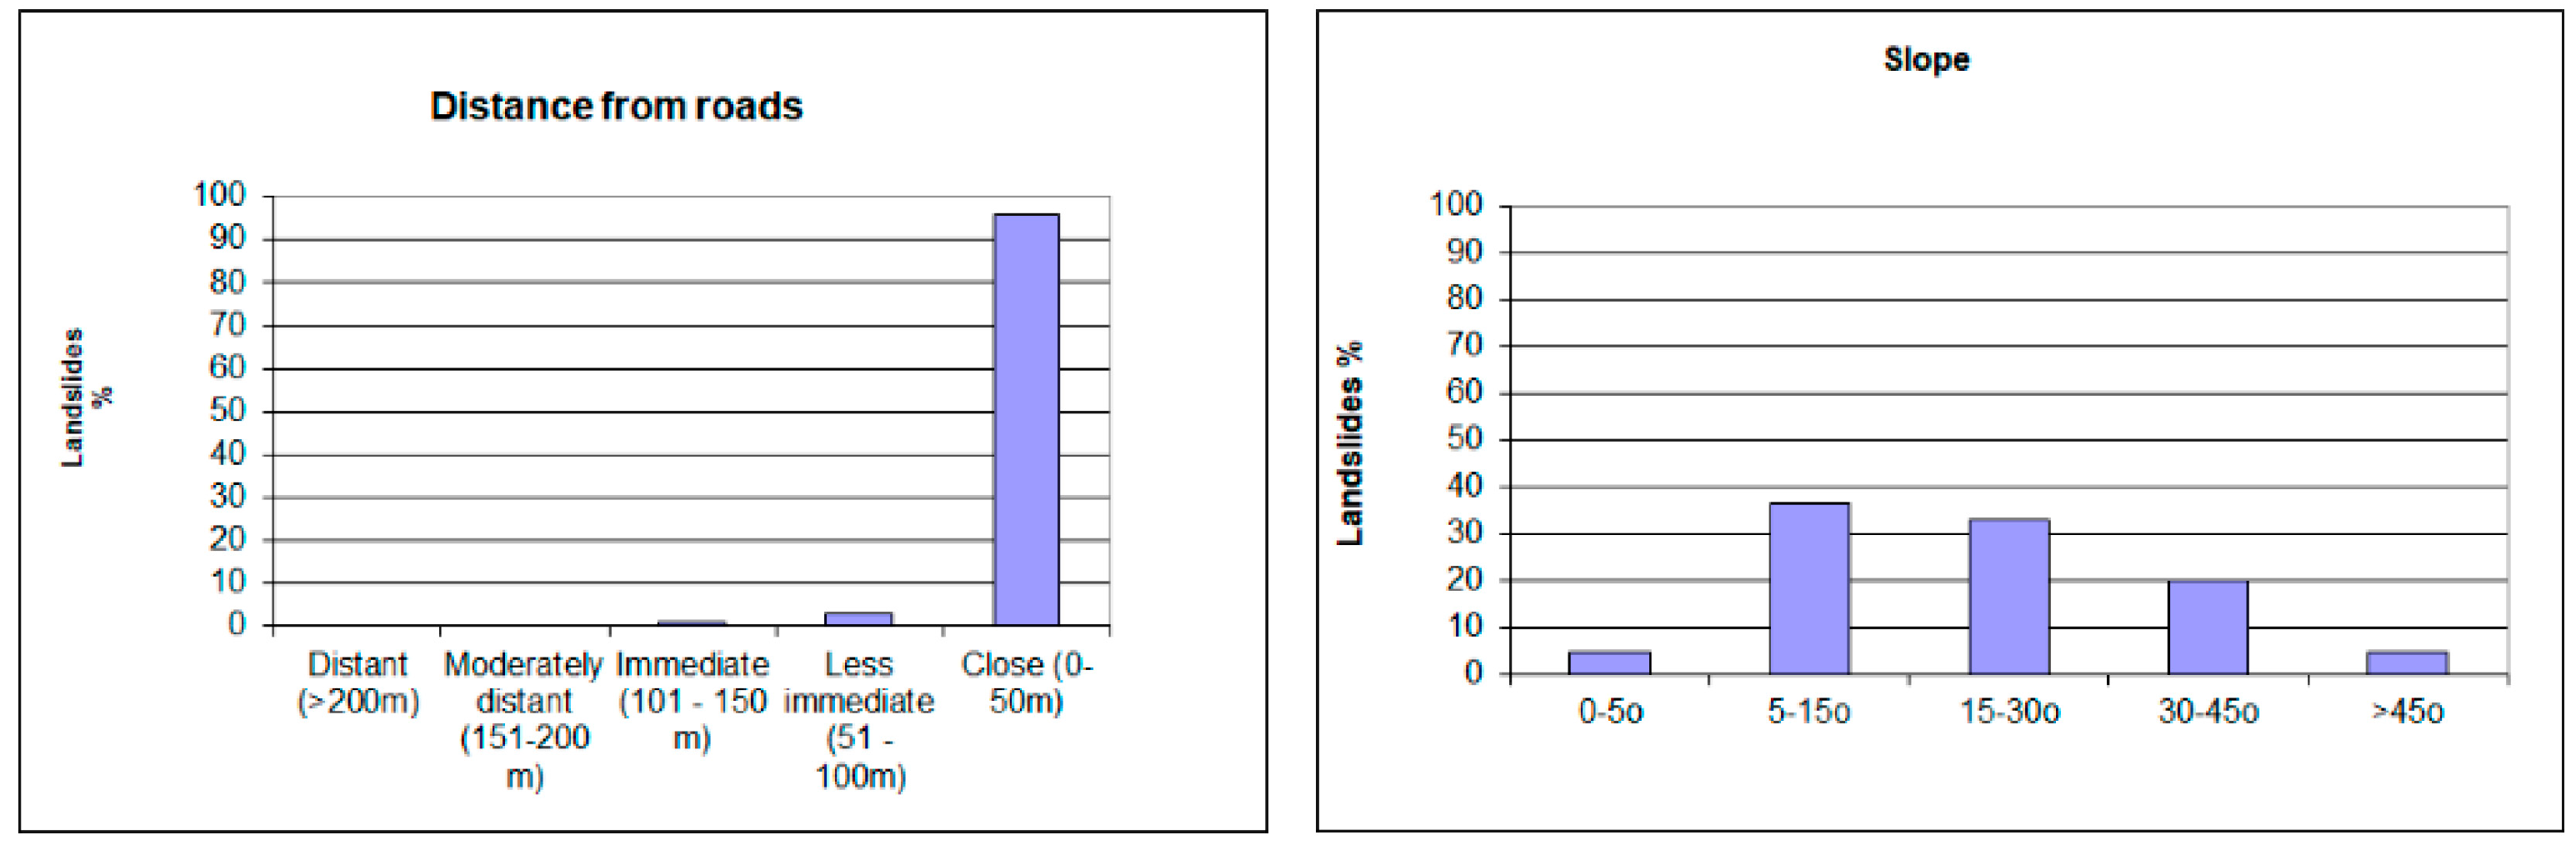
- Distance from roads
- (ii)
- Slope inclination
- (iii)
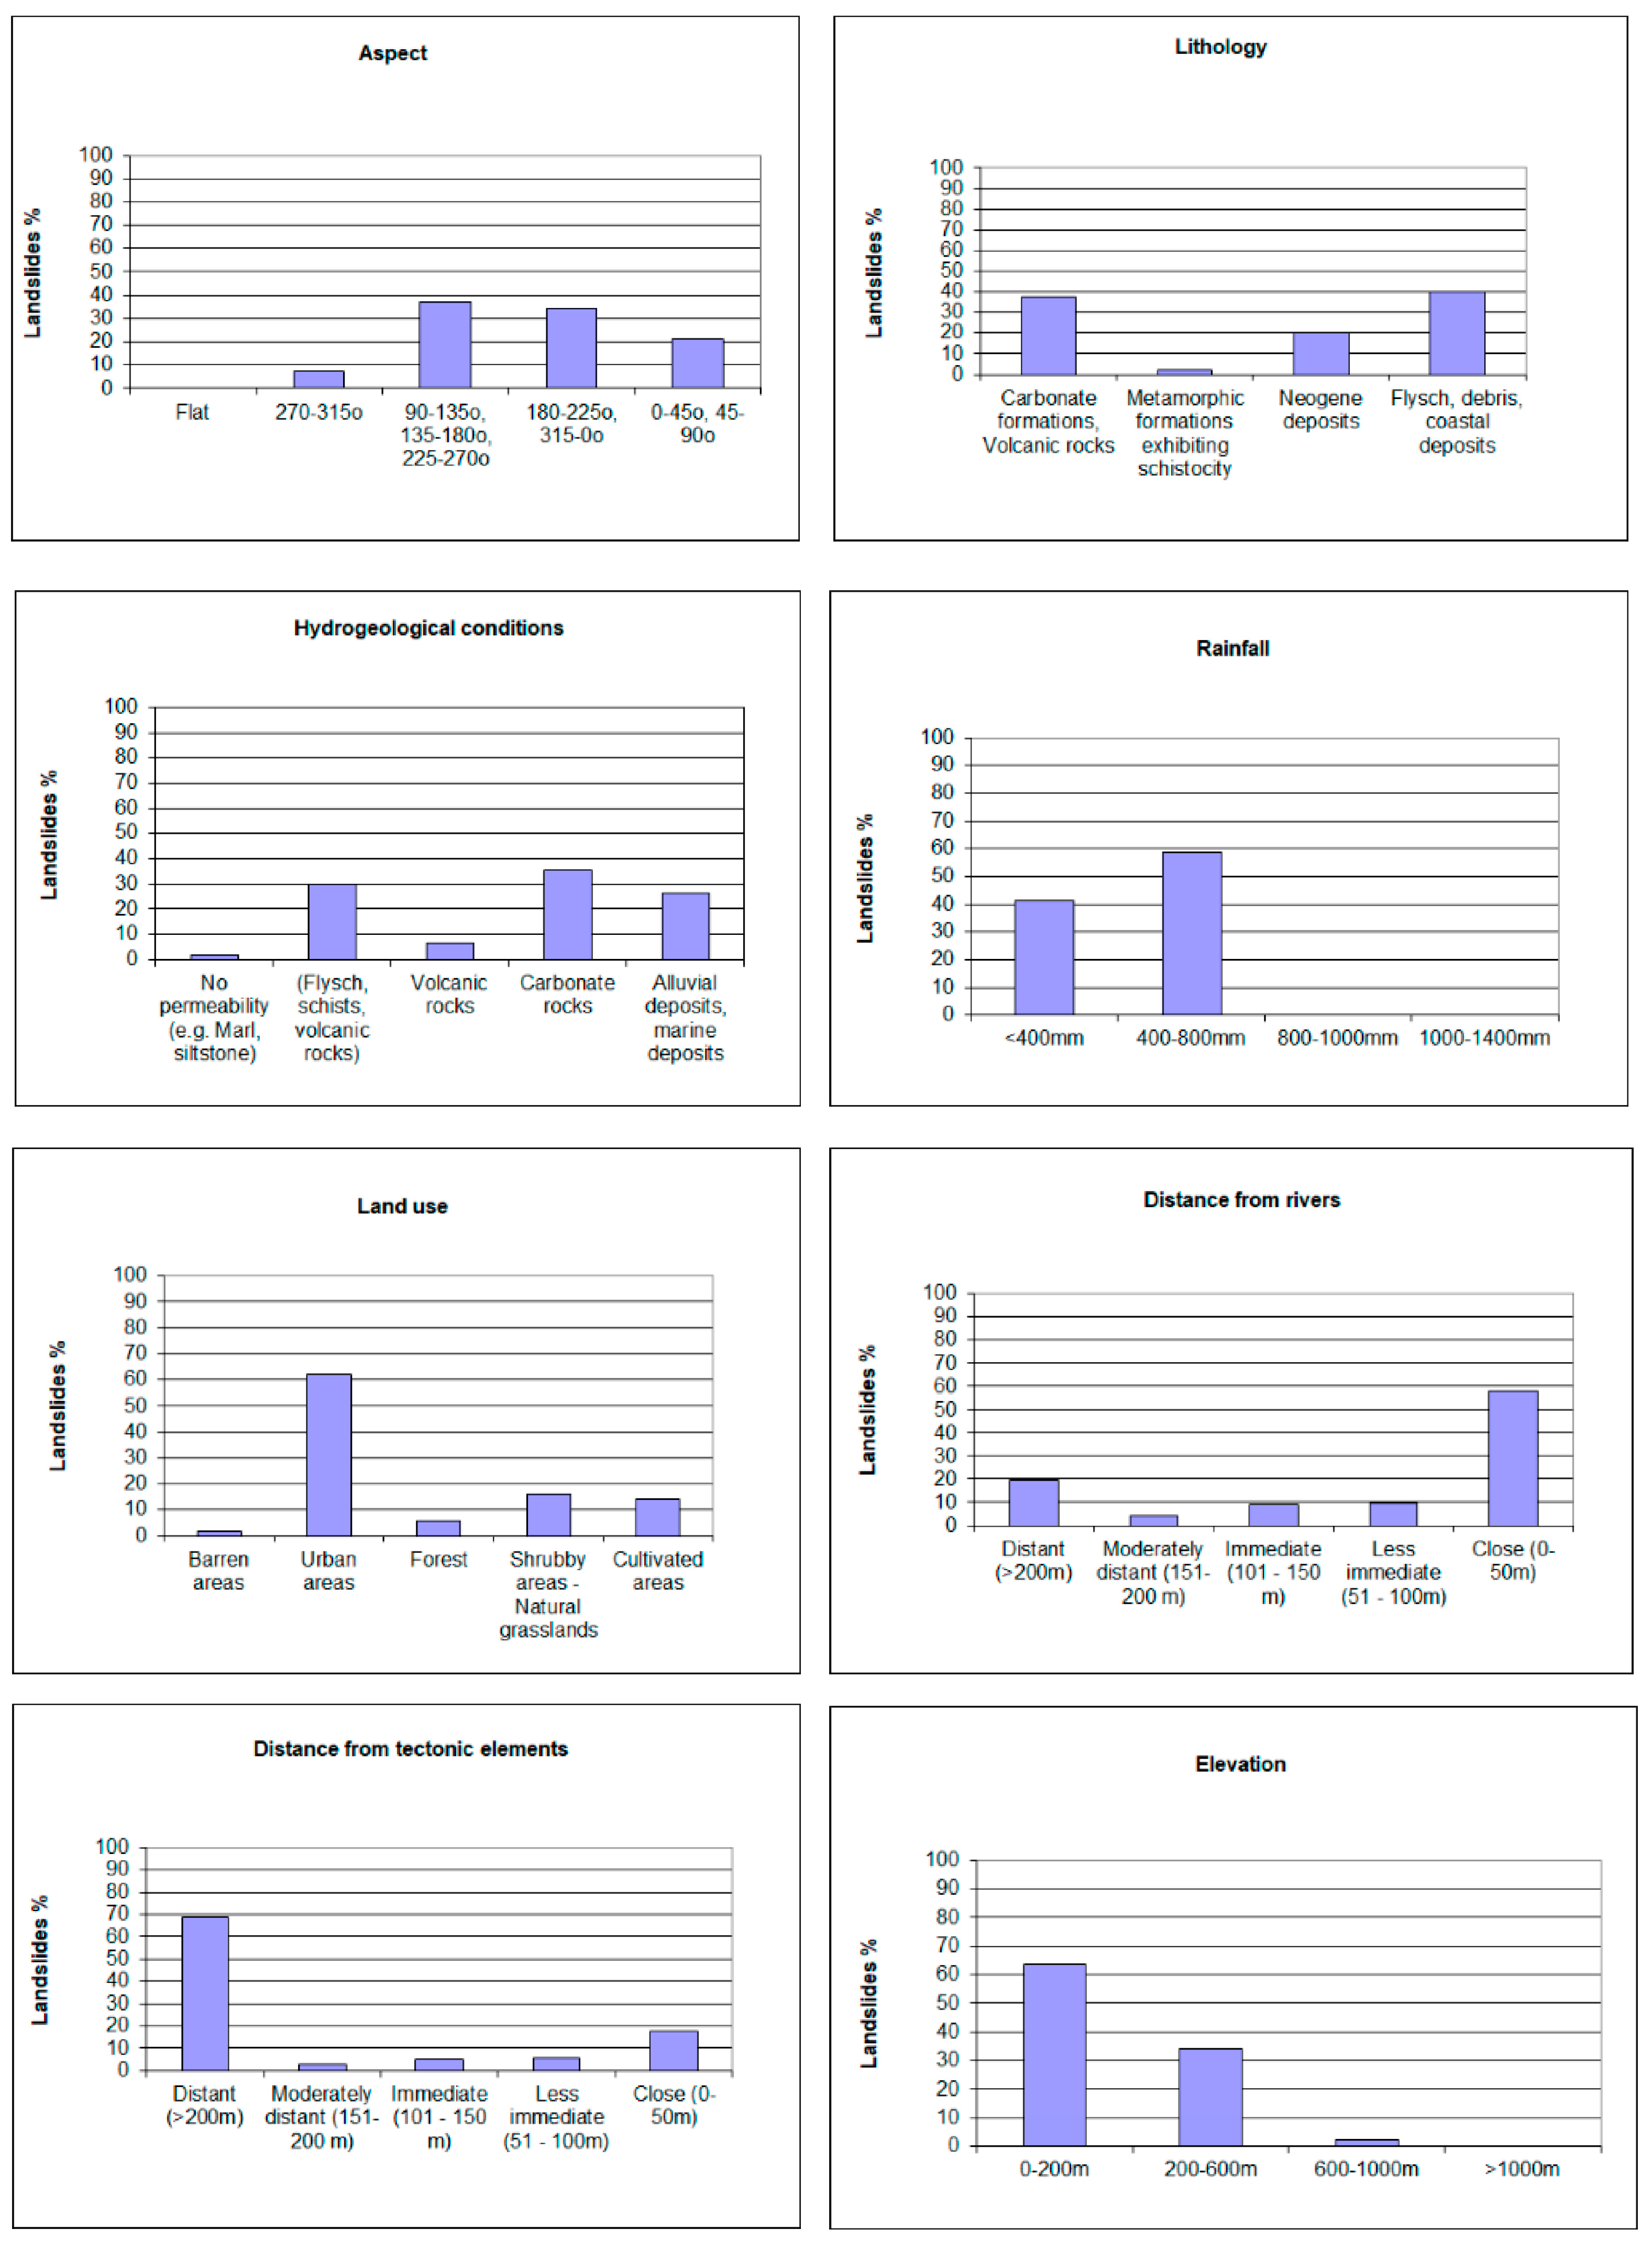
- Slope orientation (aspect)
- (iv)
- Lithology
- (v)
- Hydrogeological conditions
- (vi)
- Rainfall
- (vii)
- Land Use
- (viii)
- Distance from streams
- (ix)
- Distance from tectonic elements (e.g., faults)
- (x)
- Elevation
4. Results
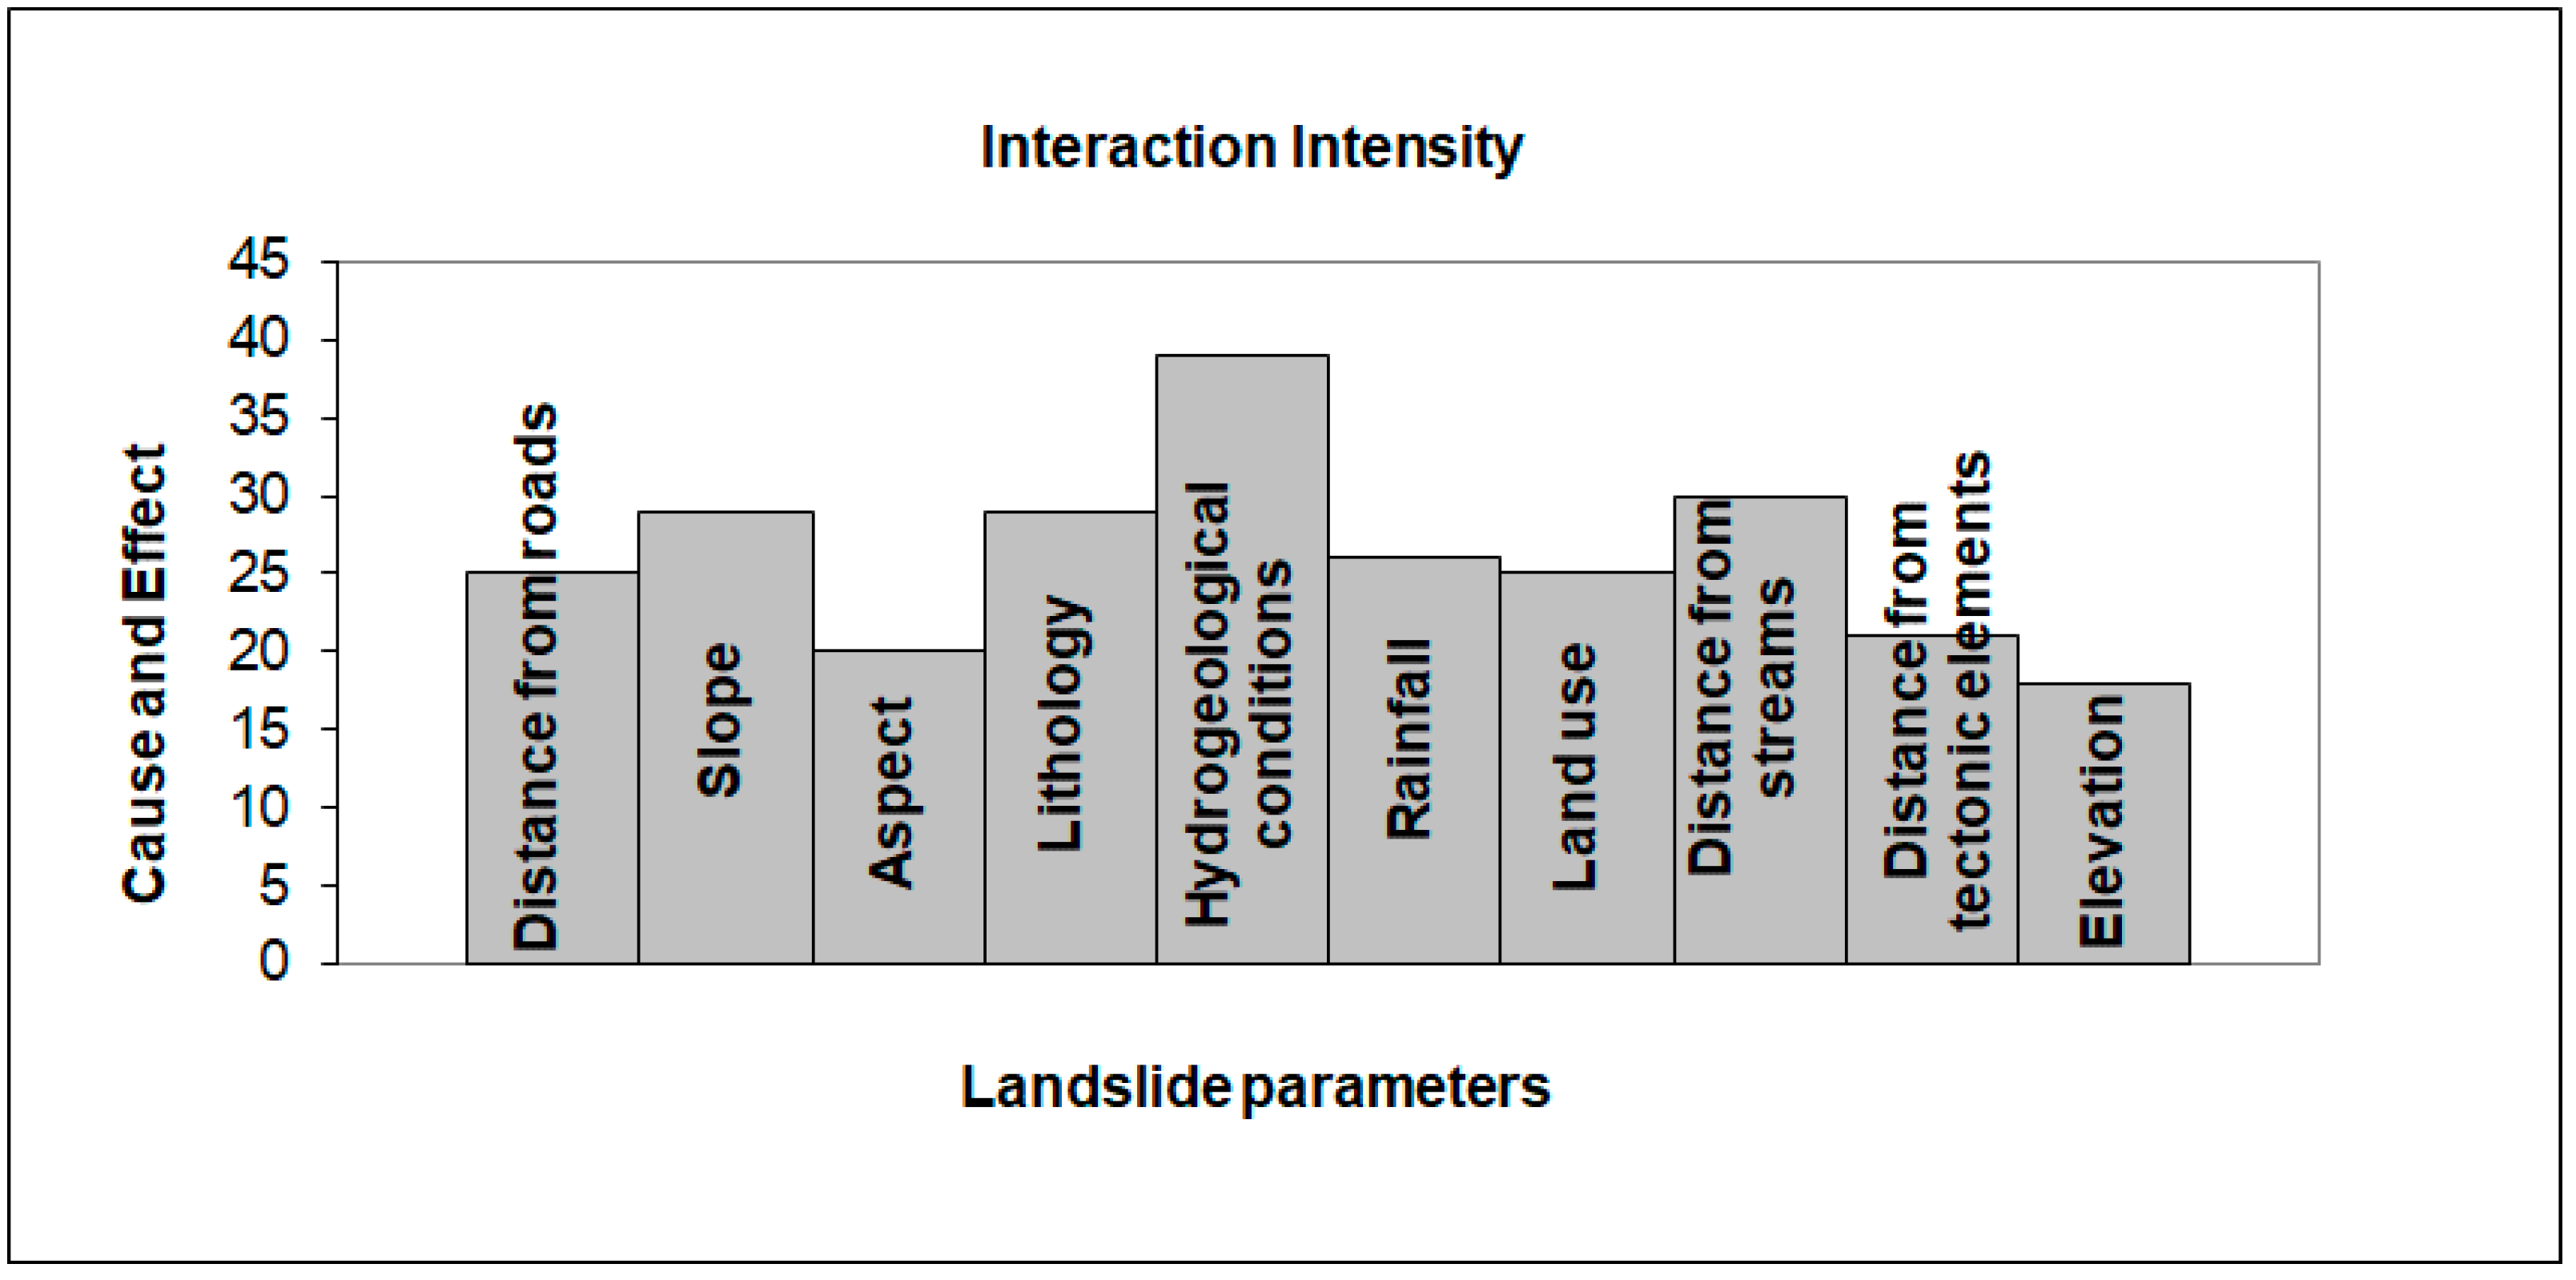
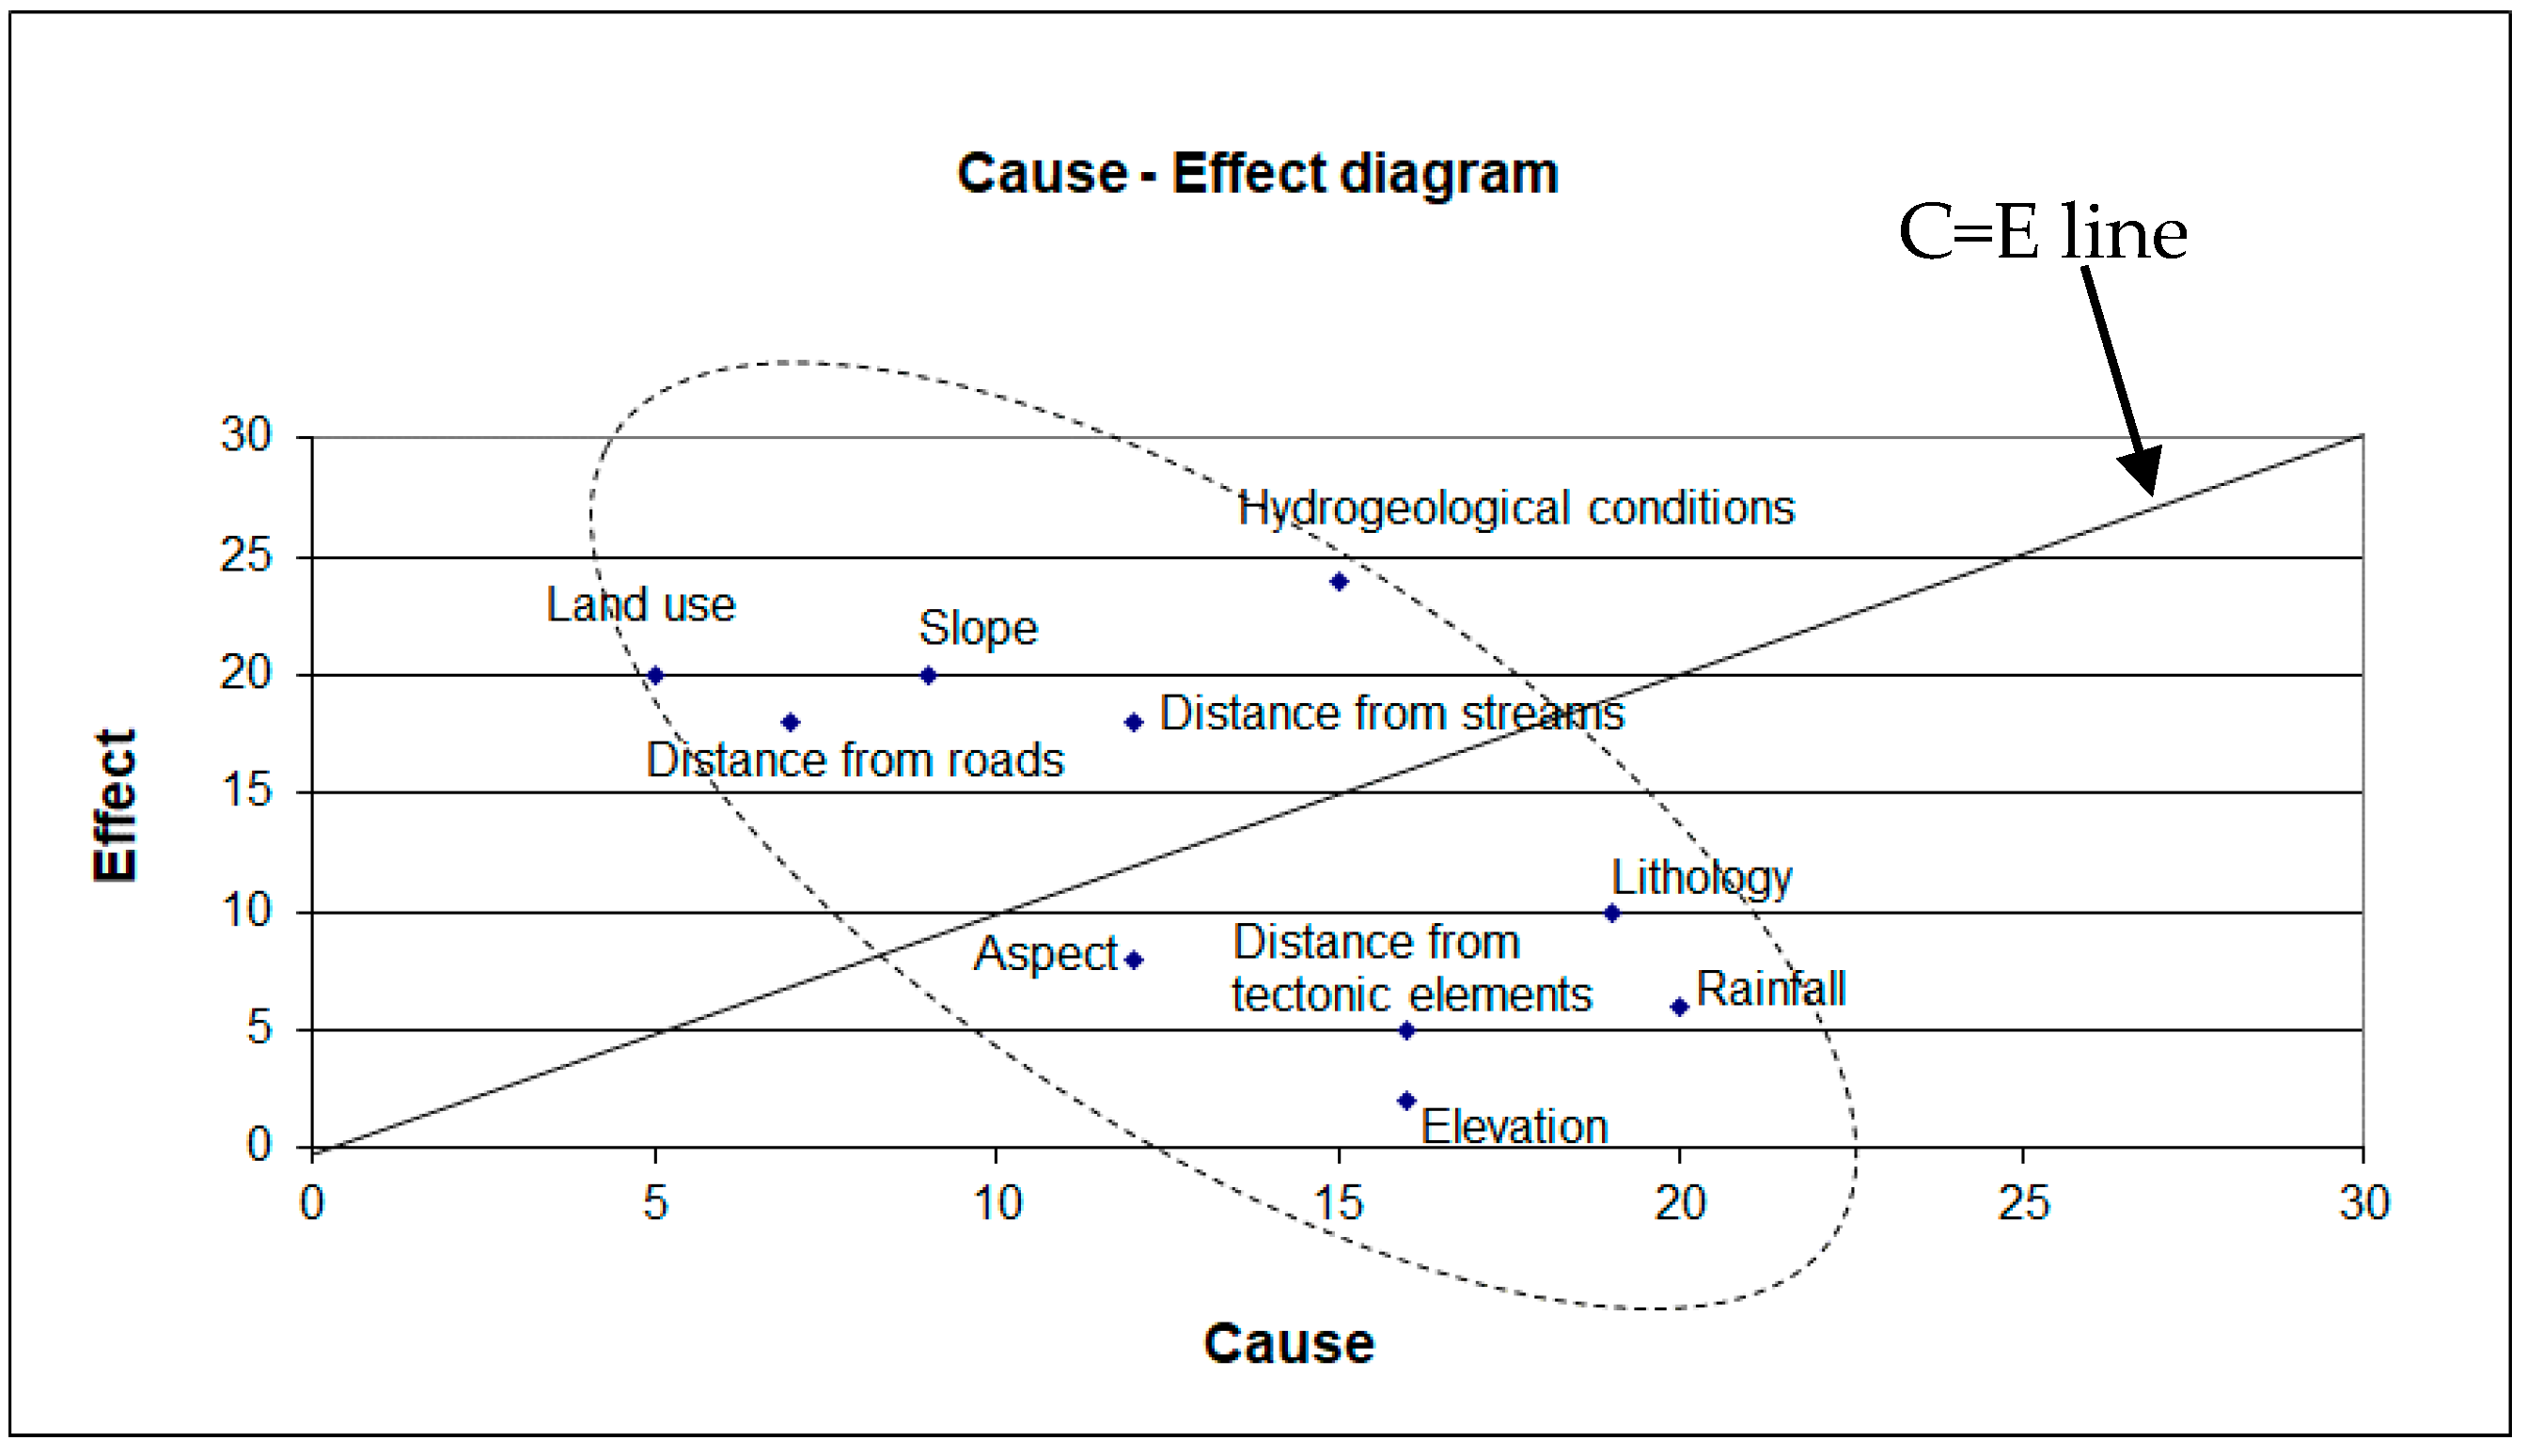
4.1. Implementation of RES for the Estimation of Weighted Coefficients
4.2. Correlation of Spatial Distribution of Slope Failures with the Predisposing Factors Using Statistical Analysis
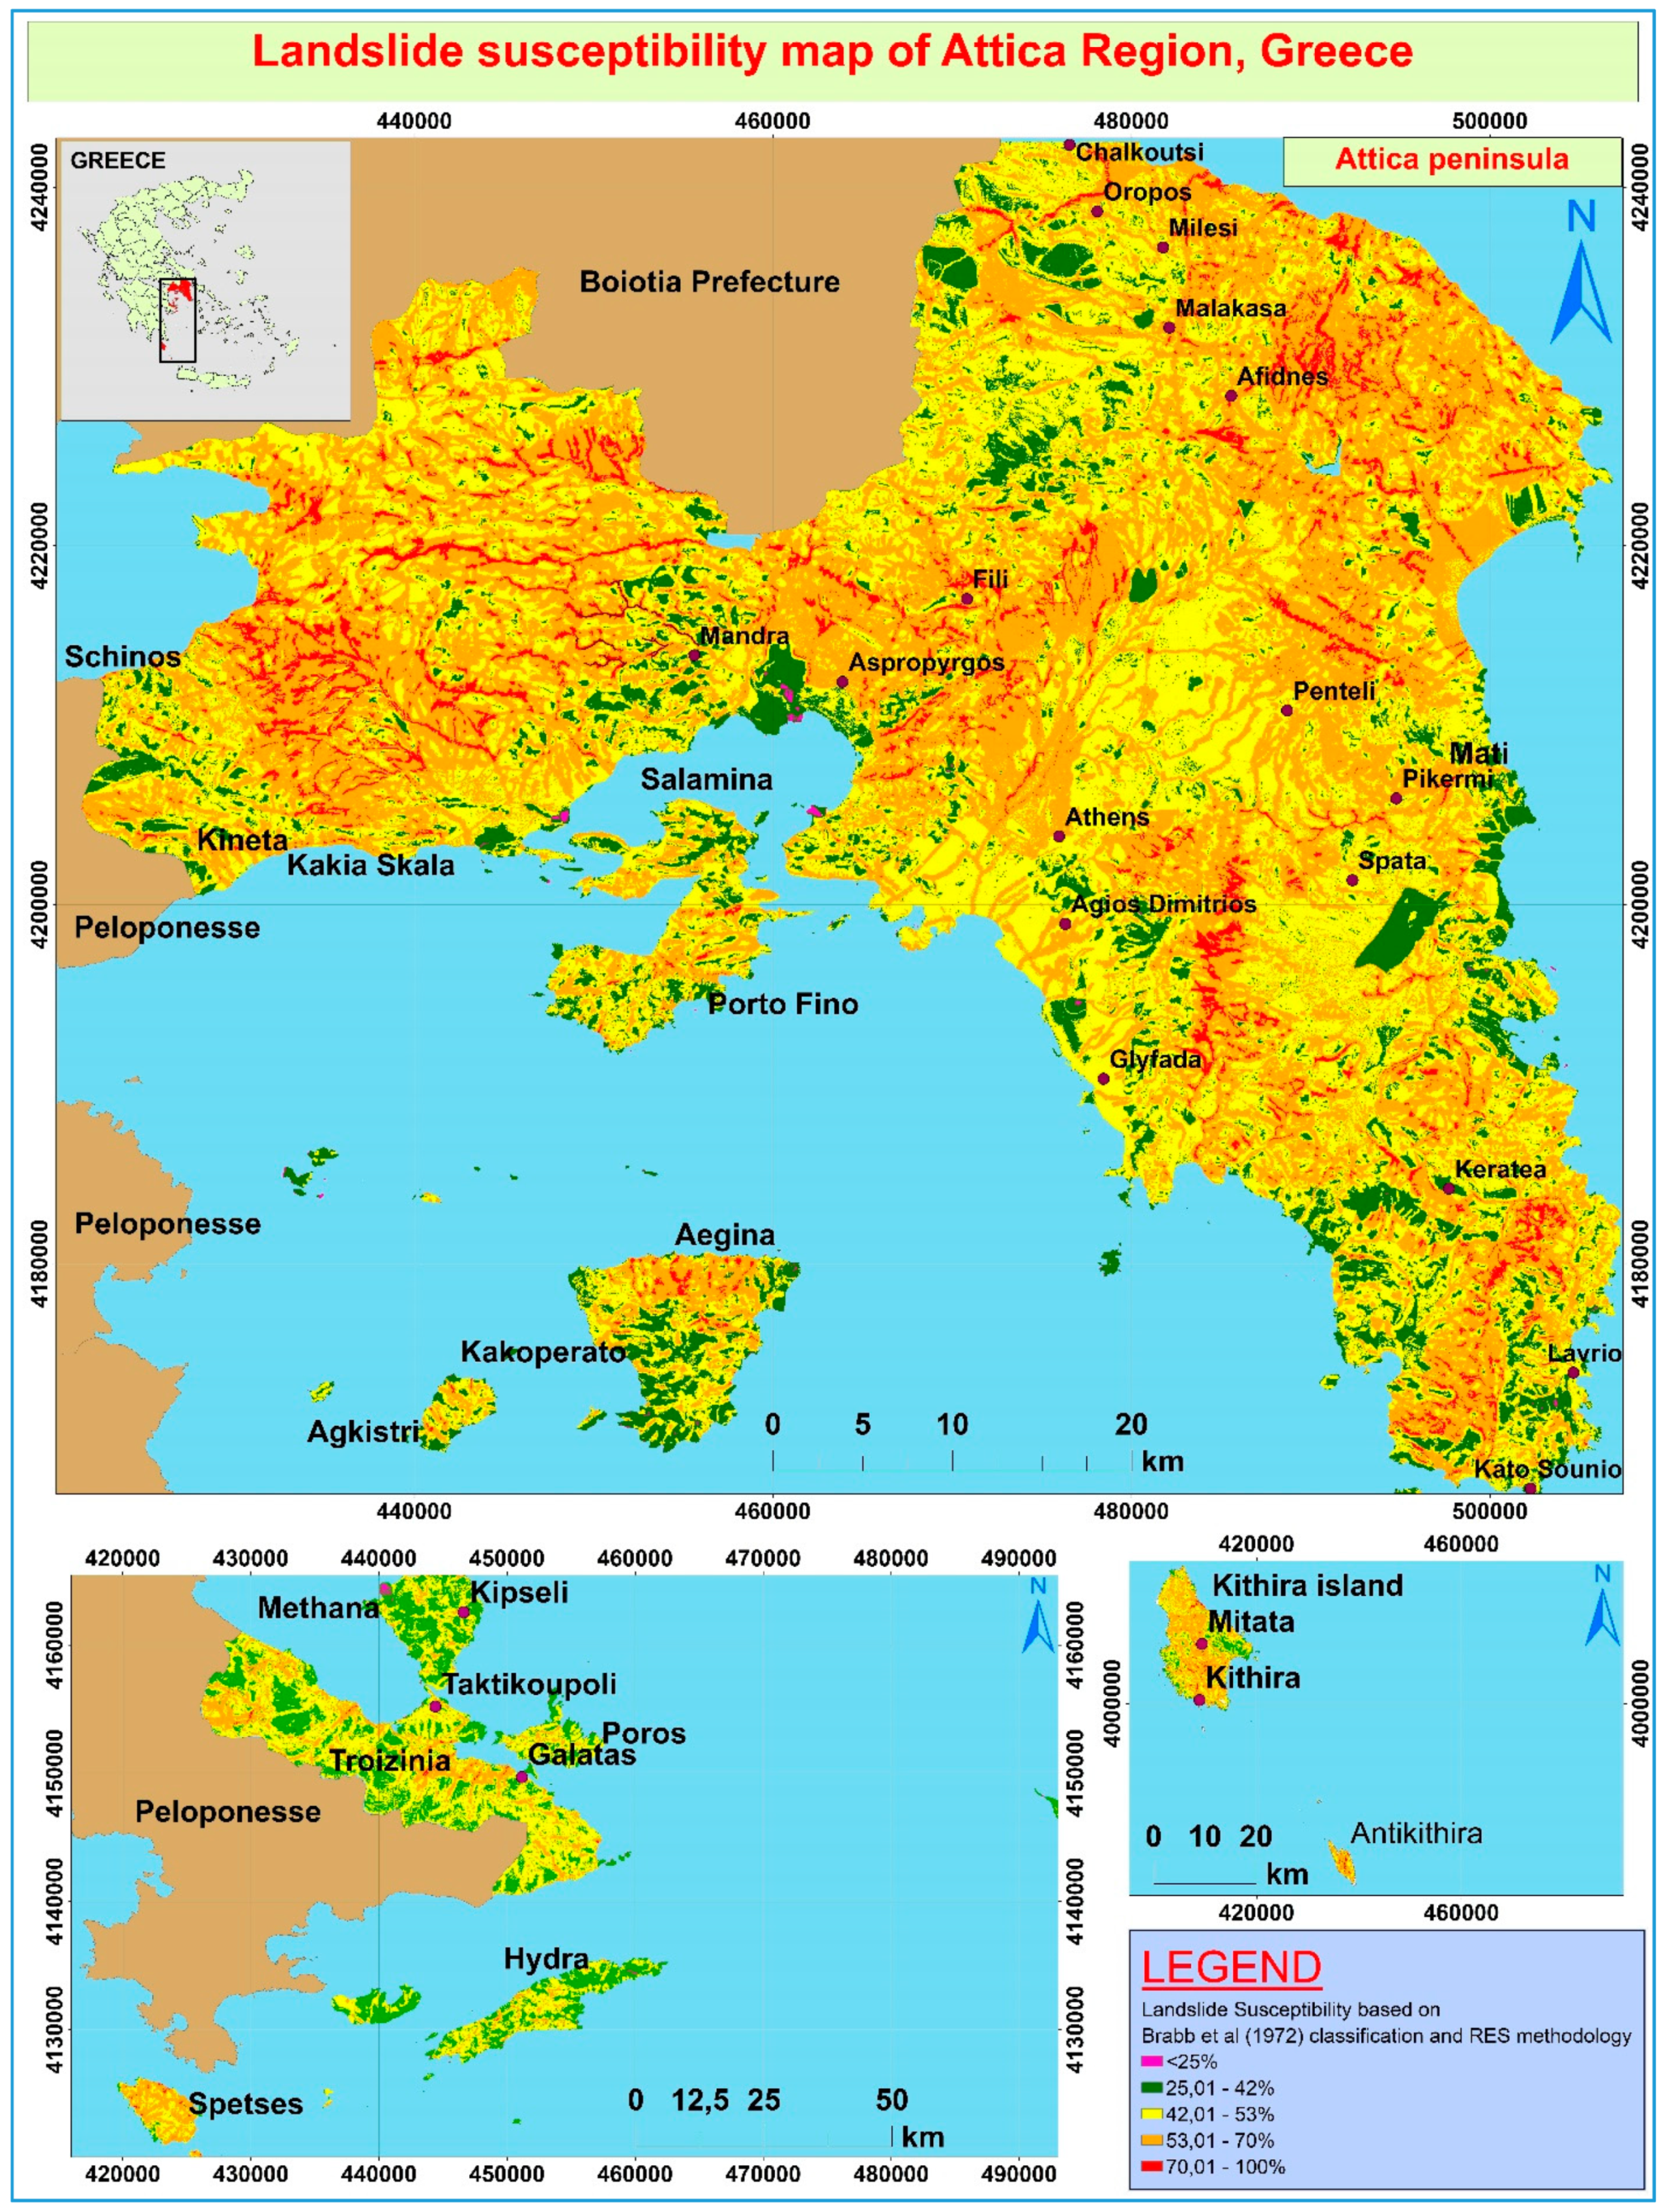
4.3. Landslide Susceptibility Map
4.4. Validation of the Landslide Susceptibility Map
- Accuracy: Overall, how often is the classifier correct?
- Precision: Out of all the positive classes we predicted correctly, how many are actually positive.
- Prevalence: How often does the yes condition actually occur in our sample?
- Low susceptibility zones
- Moderate susceptibility zone
- High and very high susceptibility zones
5. Discussion
6. Conclusions
Author Contributions
Funding
Institutional Review Board Statement
Informed Consent Statement
Acknowledgments
Conflicts of Interest
References
- Corominas, J.; Van Western, C.; Frattini, P.; Cascini, L.; Malet, J.; Fotopoulou, S.; Catani, F.; Van Den Eeckhaut, M.; Mavrouli, O.; Agliardi, F.; et al. Recommendations for the quan- titative analysis of landslide risk. Bull. Eng. Geol. Environ. 2014, 73, 209–263. [Google Scholar]
- Brabb, E. Innovative approaches to landslide hazard and risk mapping. In Proceedings of the IVth ISL, Toronto, ON, Canada, 23–31 August 1984; Volume 1, pp. 307–324. [Google Scholar]
- Papathanassiou, G.; Valkaniotis, S.; Ganas, A.; Pavlides, S. GIS-based statistical analysis of the spatial distribution of earthquake- induced landslides in the island of Lefkada, Ionian Islands, Greece. Landslides 2013, 10, 771–783. [Google Scholar] [CrossRef]
- Bonham-Carter, G.F. Geographic Information System for Geoscientists: Modelling with GIS. In Computer Methods in the Geosciences; Pergamon Press: Oxford, UK, 1994; Volume 3. [Google Scholar]
- Chung, C.J.; Fabbri, A.; Van Westen, C.J. Multivariate regression analysis for landslide hazard zonation. In Geographical Infor-mation Systems in Assessing Natural Hazards; Carrara, A., Guzetti, F., Eds.; Kluwer: Alphen aan den Rijn, The Netherlands, 1995; pp. 107–133. [Google Scholar]
- Van Westen, C.J.; Rengers, N.; Soeters, R. Use of geomorphological information in indirect landslide susceptibility assessment. Nat. Hazards 2003, 30, 399–419. [Google Scholar] [CrossRef]
- Hudson, J. Rock Engineering Systems: Theory and Practice, 1st ed.; Ellis Horwood Limited: Chichester, West Sussex, UK, 1992; pp. 1–185. [Google Scholar]
- Marinos, P.; Yannatos, M.; Sotiropoulos, E.; Cavounidis, S. Increasing the stability of a failed slope by pumping, Malakasa Landslide, Athens, Greece. In Engineering Geology and the Environment; Marinos, P., Koukis, G., Tsiambaos, G., Stoumaras, G., Eds.; Balkema: Rotterdam, The Netherlands, 1997; pp. 853–857. [Google Scholar]
- Varnes, D.; IAEG Commission on Landslides and Other Mass-Movements. Landslide Hazard Zonation: A Review of Principles and Practice; UNESCO Press: Paris, France, 1984; 63p.
- Lozios, S. Tectonic Analysis of the Metamorphic Rocks in NE Attica. Ph.D. Thesis, Department of Geology, University of Athens, Athens, Greece, 1993; 299p. (In Greek). [Google Scholar]
- Mettos, A.; Ioakim, C.; Rondoyanni, T. Palaeoclimatic and Palaeogeographic Evolution of Attica–Beotia (Central Greece); Special Publication 9; Geological Society of Greece: Athens, Greece, 2000; pp. 187–196. [Google Scholar]
- von Freyberg, B. Das Neogen Gebiet Nordwestlich Athen; Publication of Subsurface Research Department, Ministry of Coordination: Athens, Greece, 1951.
- Papanikolaou, D.; Papanikolaou, I. Geological, geomorphological and tectonic structure of NE Attica and seismic hazard implications for the northern edge of the Athens plain. Bull. Geol. Soc. Greece 2007, 40, 425–438. [Google Scholar] [CrossRef] [Green Version]
- Krohe, A.; Mposkos, E.; Diamantopoulos, A.; Kaouras, G. Formation of basins and mountain ranges in Attica (Greece): The role of Miocene to Recent low-angle normal detachment faults. Earth-Sci. Rev. 2010, 98, 81–104. [Google Scholar] [CrossRef]
- Ganas, A.; Pavlides, S.B.; Sboras, S.; Valkaniotis, S.; Papaioannou, S.; Alexandris, G.A.; Plessa, A.; Papadopoulos, G.A. Active Fault Geometry and Kinematics in Parnitha Mountain, Attica, Greece 2004. J. Struct. Geol. 2004, 26, 2103–2118. [Google Scholar] [CrossRef]
- Ganas, A.; Pavlides, S.; Karastathis, V. DEM-based morphometry of range-front escarpments in Attica, central Greece, and its relation to fault slip rates. Geomorphology 2005, 65, 301–319. [Google Scholar] [CrossRef]
- Ambraseys, N.N.; Jackson, J.A. Seismicity and associated strain of central Greece between 1890 and 1988. Geophys. J. Int. 1990, 101, 663–708. [Google Scholar] [CrossRef] [Green Version]
- Chousianitis, K.; Ganas, A.; Gianniou, M. Kinematic interpretation of present-day crustal deformation in central Greece from continuous GPS measurements. J. Geodyn. 2013, 71, 1–13. [Google Scholar] [CrossRef]
- Papanikolaou, D.; Mariolakos, I.; Lekkas, E.; Lozios, S. Morphotectonic observations on the Asopos Basin and the coastal zone of Oropos. Contribution on the neotectonics of Northern Attica. Bull. Geol. Soc. Greece 1988, 20, 252–267. [Google Scholar]
- Goldsworthy, M.; Jackson, J.; Haines, J. The continuity of active fault systems in Greece. Geophys. J. Int. 2002, 148, 596–618. [Google Scholar] [CrossRef] [Green Version]
- Grützner, C.; Schneiderwind, S.; Papanikolaou, I.; Deligiannakis, G.; Pallikarakis, A.; Reicherter, K. New constraints on extensional tectonics and seismic hazard in northern Attica, Greece: The case of the Milesi Fault. Geophys. J. Int. 2016, 204, 180–199. [Google Scholar] [CrossRef] [Green Version]
- Deligiannakis, G.; Papanikolaou, I.D.; Roberts, G. Fault specific GIS based seismic hazard maps for the Attica region, Greece. Geomorphology 2018, 306, 264–282. [Google Scholar] [CrossRef] [Green Version]
- Casagli, N.; Catani, F.; Puglisi, C.; Delmonaco, G.; Ermini, L.; Margottini, C. An inventory-based approach to landslide susceptibility assessment and its application to the Virginio River Basin, Italy. Environ. Eng. Geosci. 2004, 10, 203–216. [Google Scholar] [CrossRef] [Green Version]
- Burns, W.; Madin, I. Protocol for Inventory Mapping of Landslide Deposits from Light Detection and Ranging (LiDAR) Imagery; Special paper 42; Oregon Department of Geology and Mineral Industries: Portland, OR, USA, 2009. [Google Scholar]
- Fell, R.; Lacerda, W.; Cruden, D.M.; Evans, S.G.; LaRochelle, P.; Martinez, F.; Watanabe, M. A suggested method for reporting a landslide. Bull. Int. Assoc. Eng. Geol. 1990, 41, 5–12. [Google Scholar]
- Varnes, D.J. Slope movement types and processes. In Landslides, Analysis and Control, Special Report 176: Transportation Research Board; Schuster, R.L., Krizek, R.J., Eds.; National Academy of Sciences: Washington, DC, USA, 1978; pp. 11–33. [Google Scholar]
- Hudson, J. A Review of Rock Engineering Systems (RES) Applications over the Last 20 Years; Department of Earth Science and Engineering, Imperial College: London, UK, 2013. [Google Scholar]
- Rafiee, R.; Mohammadi, A.; Ataei, M.; Khalookakaie, R. Application of fuzzy RES and fuzzy DEMATEL in the rock behavioral systems under uncertainty. Geosyst. Eng. 2018, 22, 1–12. [Google Scholar] [CrossRef]
- Wang, J.; Deng, Y.; Wu, L.; Liu, X.; Yin, Y.; Xu, N. Estimation model o sandy soil liquefaction based on RES model. Arab. J. Geosci. 2018, 11, 565. [Google Scholar] [CrossRef]
- Ferentinou, M.; Fakir, M. Integrating Rock Engineering Systems device and Artificial Neural Networks to predict stability conditions in an open pit. Eng. Geol. 2018, 246, 293–309. [Google Scholar] [CrossRef]
- Elmouttie, M.; Dean, P. Systems Engineering Approach to Slope Stability Monitoring in the Digital Mine. Resources 2020, 9, 42. [Google Scholar] [CrossRef] [Green Version]
- Rozos, D.; Tsagaratos, P.; Markantonis, C.; Skias, S. An application of Rock Engineering System (R.E.S.) method for ranking the instability potential of natural slopes in Achaia County, Greece. In Proceedings of the XIth International Congress for Mathematical Geology, Liege, Belgium, 3–8 September 2006. [Google Scholar]
- Rozos, D.; Bathrellos, G.; Skillodimou, H. Comparison of the implementation of rock engineering system and analytic hierarchy process methods, upon landslide susceptibility mapping, using GIS: A case study from the Eastern Achaia County of Peloponnesus, Greece. Environ. Earth Sci. 2011, 63, 49–63. [Google Scholar] [CrossRef]
- Tavoularis, N.; Koumantakis, I.; Rozos, D.; Koukis, G. The contribution of landslide susceptibility factors through the use of Rock Engineering System (RES) to the prognosis of slope failures. An application in Panagopoula and Malakasa landslide areas in Greece. Geotech. Geol. Eng. Int. J. 2017, 36, 1491–1508. [Google Scholar] [CrossRef]
- Tavoularis, N.; Koumantakis, I.; Rozos, D.; Koukis, G. Landslide susceptibility mapping using Rock Engineering System approach and GIS technique: An example from southwest Arcadia, Greece. Eur. Geol. J. 2017, 44, 19–27. Available online: https://eurogeologists.eu/tavoularis-landslide-susceptibility-mapping-using-rock-engineering-system-approach-gis-technique-example-southwest-arcadia-greece/ (accessed on 7 December 2017).
- Ayalew, L.; Yamagishi, H. The application of GIS-based logistic regression for landslide susceptibility mapping in the Kakuda-Yahiko Mountains, Central Japan. Geomorphology 2005, 65, 15–31. [Google Scholar] [CrossRef]
- Koukis, G.; Ziourkas, C. Slope instability phenomena in Greece: A statistical analysis. Bull. IAEG 1991, 43, 47–60. [Google Scholar] [CrossRef]
- Tavoularis, N.; Argyrakis, P.; Papathanassiou, G.; Ganas, A. Towards the development of an updated GIS-based landslide hazard map in Attica region, Greece; DIAS project. In Proceedings of the SafeGreece 2020 7th International Conference on Civil Protection & New Technologies, 14–16 October 2020; Available online: https://safegreece2020_proceedings.pdf (accessed on 13 November 2017).
- Popescu, M.E. A suggested method for reporting landslide causes. Bull. Int. Assoc. Eng. Geol. 1994, 50, 71–74. [Google Scholar] [CrossRef]
- Dai, F.C.; Lee, C.F.; Ngai, Y.Y. Landslide risk assessment and management: An overview. Eng. Geol. 2002, 64, 65–87. [Google Scholar] [CrossRef]
- Greek Ministry of Environment, Energy and Climate Change/Special Secretariat. Water River Basin Management Plans; Greek Ministry of Environment, Energy and Climate Change/Special Secretariat: Athens, Greece, 2012.
- Founda, D.; Giannakopoulos, C.; Pierros, F.; Kalimeris, A.; Petrakis, M. Observed and projected precipitation variability in Athens over a 2.5 century period. Atmos. Sci. Lett. 2013, 14, 72–78. [Google Scholar] [CrossRef]
- Lalioti, V.; Spanou, N. Recording, analysis and evaluation of landslides phenomena in Greek territory during the period 1991–1998. Master’s Thesis, Sector of Engineering Geology, Geology Department, University of Patras, Patras, Greece, 2001. [Google Scholar]
- Greenway, D.R. Vegetation and slope stability. In Slope Stability; Anderson, M.G., Richards, K.S., Eds.; Wiley: New York, NY, USA, 1987; pp. 187–230. [Google Scholar]
- Gokceoglou, C.; Aksoy, H. Slide susceptibility mapping of the slopes in the residual soils of the Mengen Region (Turkey) by deterministic stability analyses and image-processing techniques. Eng. Geol. 1996, 44, 147–161. [Google Scholar] [CrossRef]
- Kanungo, D.P.; Arora, M.K.; Sarkar, S.; Gupta, R.P. A comparative study of conventional, ANN black box, fuzzy and combined neural and fuzzy weighting procedures for landslide susceptibility zonation in Darjeeling Himalayas. Eng. Geol. 2006, 85, 347–366. [Google Scholar] [CrossRef]
- Gemitzi, A.; Eskioglou, P.; Falalakis, G.; Petalas, C. Evaluating landslide susceptibility using environmental factors, fuzzy membership functions and GIS. Glob. Nest J. 2011, 13, 28–40. [Google Scholar]
- Foumelis, M.; Lekkas, E.; Parcharidis, I. Landslide susceptibility mapping by GIS-based qualitative weighting procedure in Corinth area. Bull. Geol. Soc. Greece 2004, 36, 904–912. [Google Scholar] [CrossRef] [Green Version]
- Ganas, A.; Tsironi, V.; Tsimi, C.; Delagas, M.; Konstantakopoulou, E.; Kollia, E.; Efstathiou, E.; Oikonomou, A. NOAFaults v3.0: New Upgrades of the NOA Geospatial Database of Active Faults in the Broader Aegean Area; Institute of Geodynamics, National Observatory of Athens: Athens, Greece, 2020. [Google Scholar]
- Brabb, E.; Bonilla, M.G.; Pampeyan, E. Landslide Susceptibility in San Mateo County, California. US Geological Survey Miscellaneous Field Studies, Map MF-360, Scale 1:62,500; US Geological Survey: Reston, VA, USA, 1972; reprinted in 1978.
- Chung, C.F.; Fabbri, A.G. Validation of Spatial Prediction Models for Landslide Hazard Mapping. Nat. Hazards 2003, 30, 451–472. [Google Scholar] [CrossRef]
- Data School. Simple Guide to Confusion Matrix Terminology, 25 March 2014. Available online: https://dataschool.io (accessed on November 2017).
- Hellenic Survey of Geology and Mineral Exploration. Geological Investigation of 2017 Mandra Flooding and Proposed Mitigation Measures; Unpublished Technical Report; 2018. [Google Scholar]
- Van Westen, C.J. National Scale Landslide Susceptibility Assessment for SVG. CHARIM Caribbean Handbook on Risk Information Management; World Bank Group GFDRR, ACP-EU Natural Risk Reduction Program; 2016; Available online: www.charim.net (accessed on November 2017).
- Tavoularis, N.; Koumantakis, I.; Rozos, D.; Koukis, G. An implementation of rock engineering system (RES) for ranking the instability potential of slopes in Greek territory. An application in Tsakona area (Peloponnese—Prefecture of Arcadia). Bull. Geol. Soc. Greece 2015, XLIX, 38–58. [Google Scholar] [CrossRef] [Green Version]


| Movement Type | Rock: 52 | Debris: 58 | Earth: 110 |
|---|---|---|---|
| Fall | 1. Rock fall: 40 | 2. Debris fall: 41 | 3. Earth fall: 67 |
| Topple | 4. Rock topple: 3 | 5. Debris topple: 3 | 6. Earth topple: 8 |
| Rotational sliding | 7. Rock slump: - | 8. Debris slump: - | 9. Earth slump: 27 |
| Translational sliding | 10. Block slide: 3 | 11. Debris slide: - | 12. Earth slide: 6 |
| Lateral spreading | 13. Rock spread: - | - | 14. Earth spread: - |
| Flow | 15. Rock creep: - | 16. Talus flow: - | 21. Dry sand flow: - |
| 17. Debris flow: 1 | 22. Wet sand flow: - | ||
| 18. Debris avalanche: - | 23. Quick clay flow: - | ||
| 19. Solifluction: - | 24. Earth flow: 1 | ||
| 20. Soil creep: 13 | 25. Rapid earth flow: - | ||
| 26. Loess flow: 1 | |||
| Complex | 27. Rock slide-debris avalanche: 6 | 28. Cambering, valley bulging: - | 29. Earth slump-earth flow: - |
| Parameters. | Grade | Parameters | Grade | Parameters | Grade |
|---|---|---|---|---|---|
| 1. Distance from roads | 5. Hydrogeological conditions | 9. Distance from tectonic elements | |||
| Distant (>200 m) | 0 | Impermeable formations (Marl, siltstone) | 0 | Distant (>200 m) | 0 |
| Moderately distant (151–200 m) | 1 | Fractured formations characterized as having low to negligible permeability (Flysch, schists) | 1 | Moderately distant (151–200 m) | 1 |
| Immediate (101–150 m) | 2 | Volcanic rocks, conglomerate | 2 | Immediate (101–150 m) | 2 |
| Less immediate (51–100 m) | 3 | Carbonate formations with medium to high permeability | 3 | Less immediate (51–100 m) | 3 |
| Close (0–50 m) | 4 | Debris, alluvial–marine deposits | 4 | Close (0–50 m) | 4 |
| 2. Slope’s inclination | 6. Rainfall | 10. Elevation | |||
| 0°–5° | 0 | <400 mm | 1 | >1000 m | 1 |
| 6°–15° | 1 | 400–800 mm | 4 | 0–200 m | 2 |
| 15°–30° | 2 | 800–1000 mm | 3 | 600–1000 m | 3 |
| 30°–45° | 3 | 1000–1400 mm | 2 | 200–600 m | 4 |
| >45° | 4 | 7. Land Use | |||
| 3. Slope’s orientation | Barren areas | 0 | |||
| 270°–315° | 1 | Urban areas | 1 | ||
| 90°–135°, 135°–180°, 225°–270° | 2 | Forest areas | 2 | ||
| 180°–225°, 315°–0° | 3 | Shrubby areas-Natural grassland | 3 | ||
| 0°–45°, 45°–90° | 4 | Cultivated areas | 4 | ||
| 8. Distance from streams | |||||
| 4. Lithology | Distant (>200 m) | 0 | |||
| Carbonate rocks (e.g., limestones, marbles), schist, cherts | 1 | Moderately distant (151–200 m) | 1 | ||
| Metamorphic rocks exhibiting schistocity | 2 | Immediate (101–150 m) | 2 | ||
| Loose soil formations (alluvial, etc.) | 3 | Less immediate (51–100 m) | 3 | ||
| Flysch, marine deposits | 4 | Close (0–50 m) | 4 |
| Interaction Matrix of Attica Region | |||||||||||
|---|---|---|---|---|---|---|---|---|---|---|---|
| P1 | 3 | 1 | 0 | 1 | 0 | 2 | 0 | 0 | 0 | 7 | Cause (C) |
| 2 | P2 | 1 | 0 | 1 | 0 | 2 | 2 | 1 | 0 | 9 | |
| 1 | 2 | P3 | 1 | 2 | 2 | 2 | 2 | 0 | 0 | 12 | |
| 1 | 3 | 2 | P4 | 4 | 0 | 2 | 3 | 2 | 2 | 19 | |
| 2 | 2 | 2 | 2 | P5 | 0 | 3 | 3 | 1 | 0 | 15 | |
| 4 | 3 | 0 | 2 | 4 | P6 | 4 | 3 | 0 | 0 | 20 | |
| 0 | 1 | 0 | 1 | 2 | 0 | P7 | 1 | 0 | 0 | 5 | |
| 2 | 1 | 1 | 1 | 4 | 0 | 2 | P8 | 1 | 0 | 12 | |
| 4 | 3 | 1 | 2 | 4 | 0 | 0 | 2 | P9 | 0 | 16 | |
| 2 | 2 | 0 | 1 | 2 | 4 | 3 | 2 | 0 | P10 | 16 | |
| 18 | 20 | 8 | 10 | 24 | 6 | 20 | 18 | 5 | 2 | ||
| Effect (E) | |||||||||||
| P1 = Distance from roads | P2 = Slope | P3 = Aspect | P4 = Lithology | P5 = Hydrogeological conditions | |||||||
| P6 = Rainfall | P7 = Land Use | P8 = Distance from streams | P9 = Distance from tectonic elements | P10 = Elevation | |||||||
| Parameters | C + E | C-E | [(C + E)/Σ(C + E)]*100% | Maximum rating | Weighted coefficient ai = [(C + E)/Σ(C + E)]*100%/4 | ||||||
| 1 | Distance from roads | 25 | −11 | 9.54 | 4 | 2.39 | |||||
| 2 | Slope | 29 | −11 | 11.07 | 4 | 2.77 | |||||
| 3 | Aspect | 20 | 4 | 7.63 | 4 | 1.91 | |||||
| 4 | Lithology | 29 | 9 | 11.07 | 4 | 2.77 | |||||
| 5 | Hydrogeological conditions | 39 | −9 | 14.89 | 4 | 3.72 | |||||
| 6 | Rainfall | 26 | 14 | 9.92 | 4 | 2.48 | |||||
| 7 | Land Use | 25 | −15 | 9.54 | 4 | 2.39 | |||||
| 8 | Distance from streams | 30 | −6 | 11.45 | 4 | 2.86 | |||||
| 9 | Distance from tectonic elements | 21 | 11 | 8.02 | 4 | 2.00 | |||||
| 10 | Elevation | 18 | 14 | 6.87 | 4 | 1.72 | |||||
| Total | Σ(C + E) | 262 | 100.00 | 25.00 | |||||||
| Parameters | |||||||||||
|---|---|---|---|---|---|---|---|---|---|---|---|
| Slopes/Coordinates (Greek Projection EGSA 87) | 1 | 2 | 3 | 4 | 5 | 6 | 7 | 8 | 9 | 10 | Instability Index |
| 1 (476,117–4,215,245) | 4 | 1 | 3 | 4 | 4 | 4 | 1 | 4 | 0 | 2 | 71 |
| 2 (476,790–4,216,087) | 4 | 0 | 3 | 4 | 4 | 4 | 1 | 4 | 0 | 2 | 68 |
| 3 (483,219–4,208,555) | 4 | 1 | 4 | 4 | 1 | 4 | 1 | 4 | 0 | 4 | 65 |
| 4 (482,341–4,208,253) | 4 | 1 | 3 | 4 | 1 | 4 | 1 | 4 | 0 | 4 | 63 |
| 5 (483,441–4,208,871) | 4 | 1 | 2 | 4 | 1 | 4 | 1 | 4 | 0 | 4 | 62 |
| 6 (458,846–4,212,690) | 4 | 1 | 4 | 3 | 1 | 1 | 4 | 4 | 0 | 2 | 59 |
| 7 (477,287–4,211,687) | 4 | 2 | 3 | 4 | 4 | 4 | 1 | 4 | 0 | 2 | 74 |
| 8 (476,938–476,938) | 4 | 1 | 3 | 4 | 4 | 4 | 1 | 4 | 0 | 2 | 71 |
| 9 (475,095–4,212,107) | 4 | 1 | 3 | 4 | 4 | 4 | 1 | 4 | 0 | 2 | 71 |
| 10 (457,187–4,195,149) | 4 | 3 | 2 | 1 | 3 | 1 | 1 | 4 | 4 | 2 | 63 |
| Maximum Pij rating | 4 | 4 | 4 | 4 | 4 | 4 | 4 | 4 | 4 | 4 | |
| [(C + E)/Σ(C + E)] * 100% | 9.54 | 11.07 | 7.63 | 11.07 | 14.89 | 9.92 | 9.54 | 11.45 | 8.02 | 6.87 | 100 |
| Weigh. Coeff. (ai) = C + E)/Σ(C + E)] * 100%/4 | 2.39 | 2.77 | 1.91 | 2.77 | 3.72 | 2.48 | 2.39 | 2.86 | 2.00 | 1.72 | |
| % Failed Area | 0–1 | 2–8 | 9–25 | 25–42 | 42–53 | 53–70 | 70–100 |
|---|---|---|---|---|---|---|---|
| Relat. Susceptib. | I | II | III | IV | V | VI | L |
| Negligible | Low | Middle | High | Very high | Extremely high | Landslide |
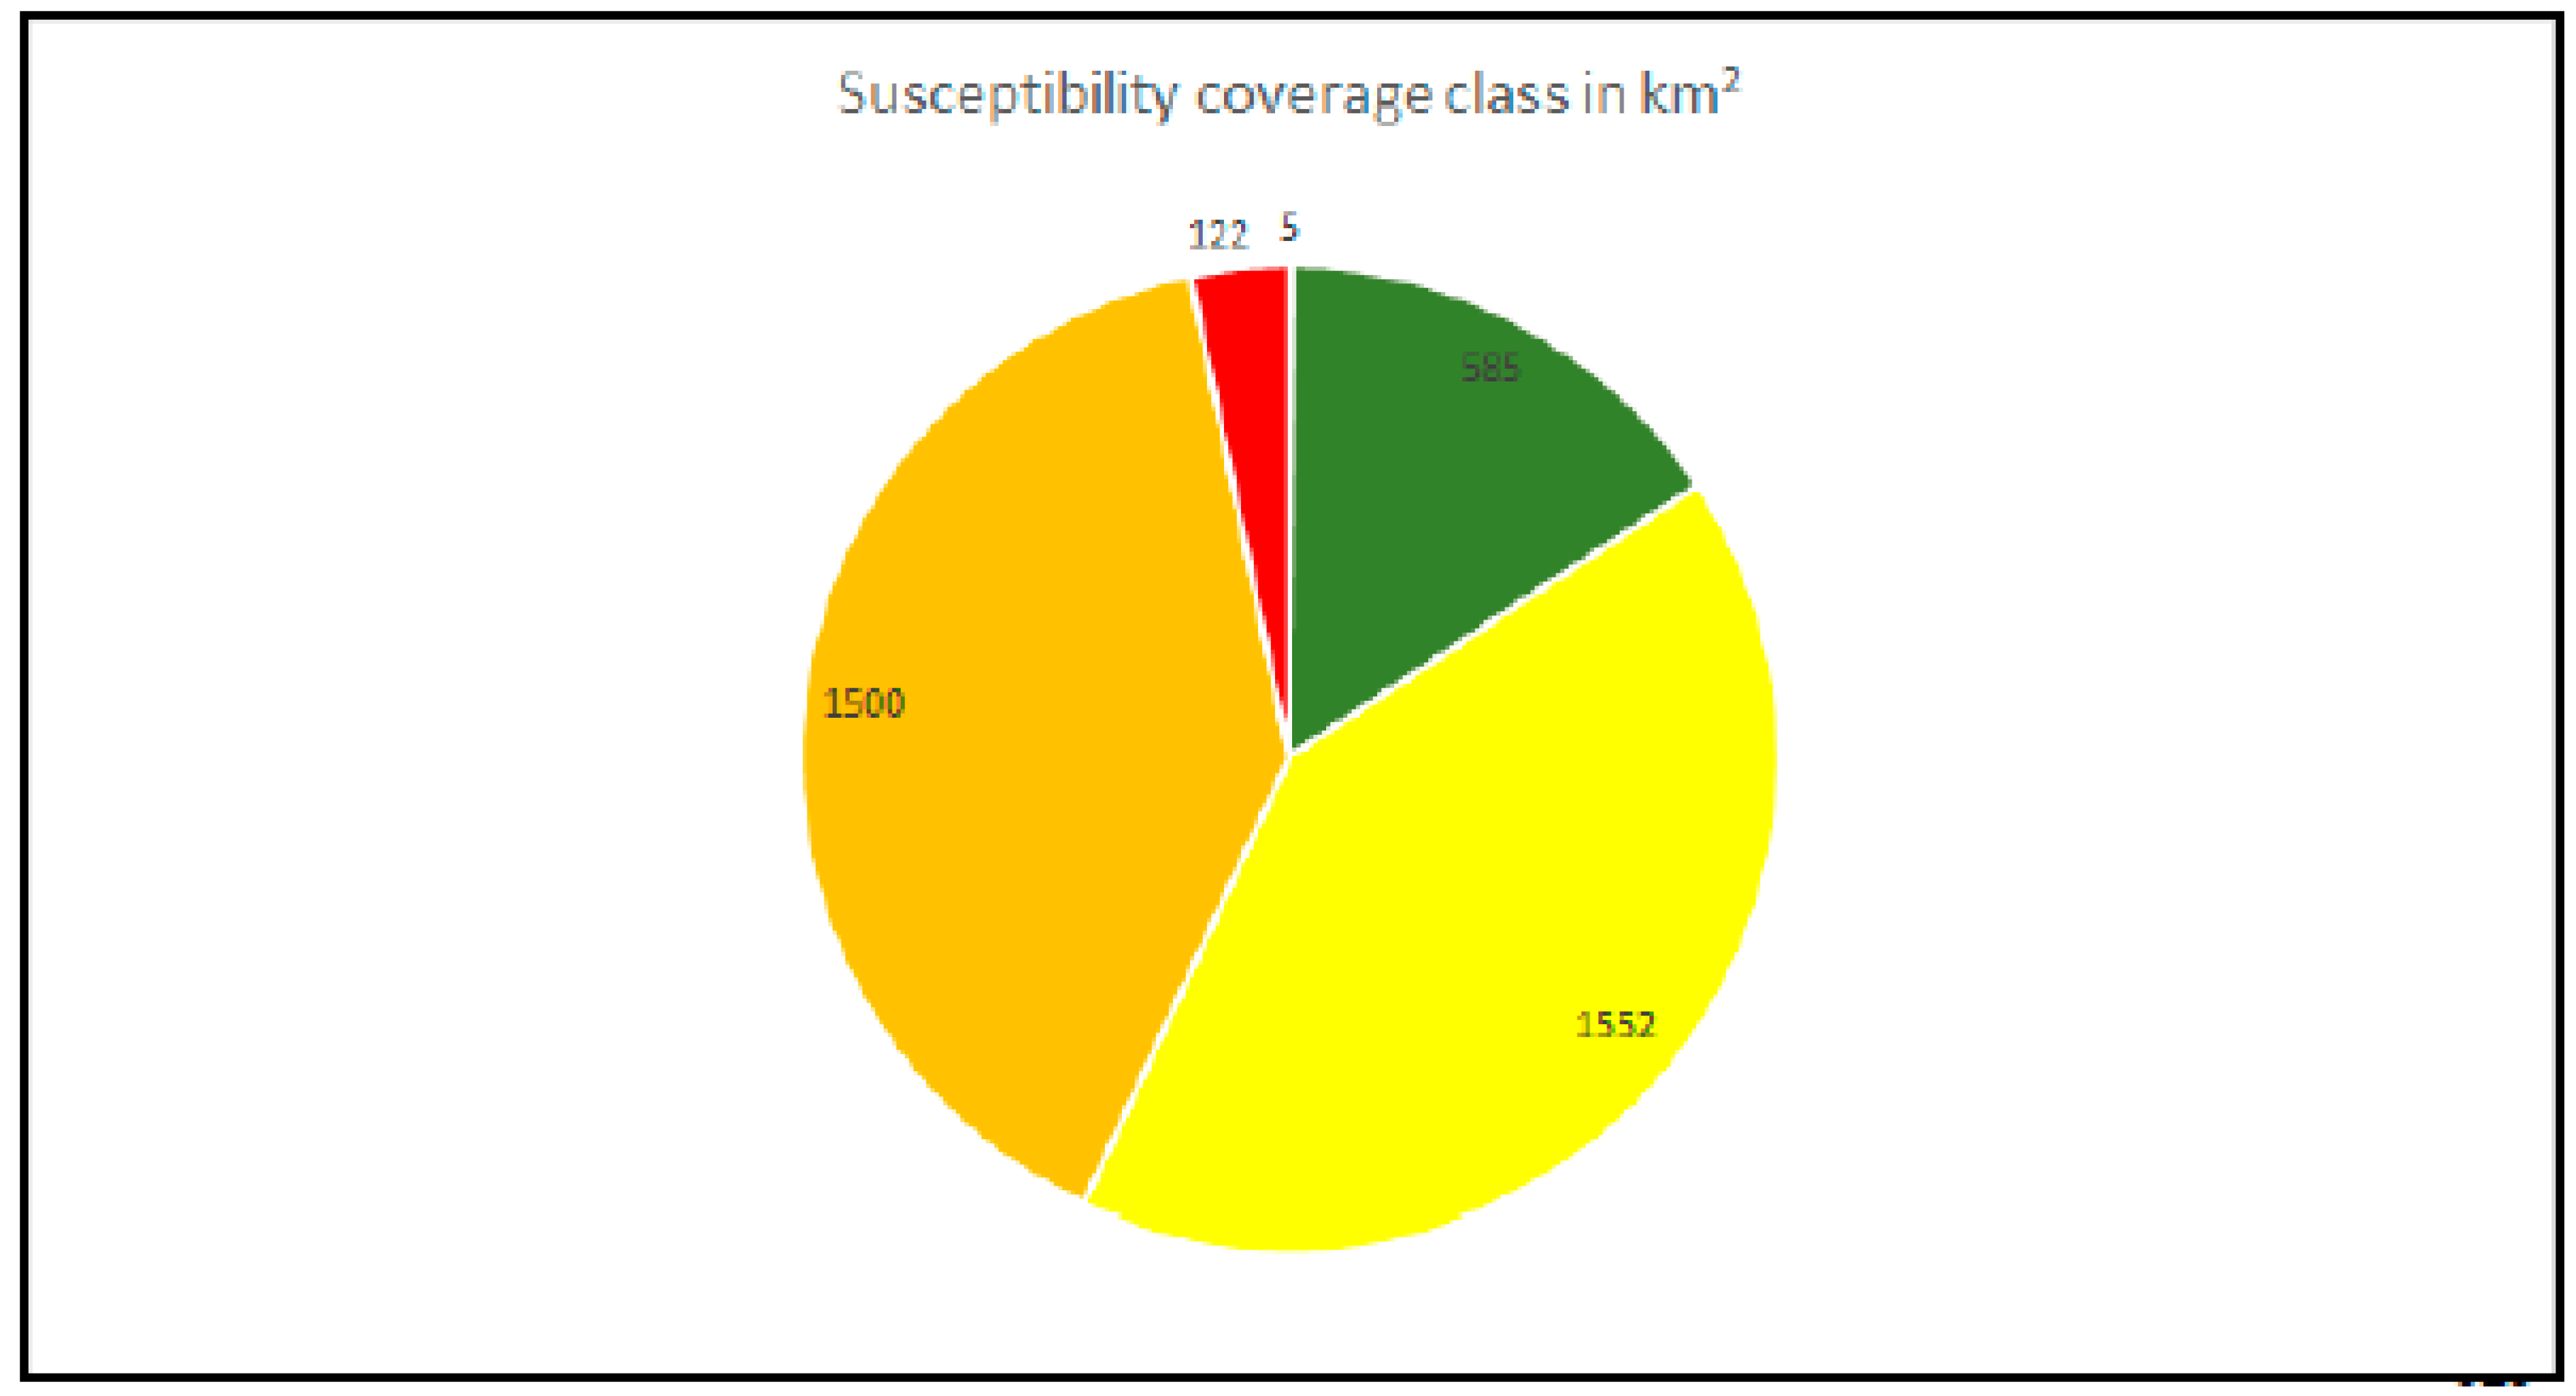
| Instability Index Category | Susceptibility Coverage Class in km2 |
|---|---|
| <25% | 5 (0.13%) |
| 25.01–42% | 585 (15.54%) |
| 42.01–53% | 1552 (41.23%) |
| 53.01–70% | 1500 (39.85%) |
| 70.01–100% | 122 (3.24%) |
| Total examined area: 3.764 km2 |
| Relative Susceptibility Classification | Number (No) of Slope Failures | Instability Index (%) |
|---|---|---|
| <42% (Low to moderate) | 1 | 0.45 |
| 42.01–53% (High) | 23 | 10.45 |
| 53.01–70% (Extrem. high) | 149 | 67.73 |
| 70.01–100% (Landslide) | 47 | 21.36 |
| Total: 220 | 100 |
| Total Population: n = 220 Slope Failures | Predicted Conditions | ||
|---|---|---|---|
| Predicted NO | Predicted YES | ||
| True conditions (Observed) | Actual NO | 3 (TN) | 21 (FP) |
| Actual YES | 22 (FN) | 174 (TP) | |
Publisher’s Note: MDPI stays neutral with regard to jurisdictional claims in published maps and institutional affiliations. |
© 2021 by the authors. Licensee MDPI, Basel, Switzerland. This article is an open access article distributed under the terms and conditions of the Creative Commons Attribution (CC BY) license (http://creativecommons.org/licenses/by/4.0/).
Share and Cite
Tavoularis, N.; Papathanassiou, G.; Ganas, A.; Argyrakis, P. Development of the Landslide Susceptibility Map of Attica Region, Greece, Based on the Method of Rock Engineering System. Land 2021, 10, 148. https://doi.org/10.3390/land10020148
Tavoularis N, Papathanassiou G, Ganas A, Argyrakis P. Development of the Landslide Susceptibility Map of Attica Region, Greece, Based on the Method of Rock Engineering System. Land. 2021; 10(2):148. https://doi.org/10.3390/land10020148
Chicago/Turabian StyleTavoularis, Nikolaos, George Papathanassiou, Athanassios Ganas, and Panagiotis Argyrakis. 2021. "Development of the Landslide Susceptibility Map of Attica Region, Greece, Based on the Method of Rock Engineering System" Land 10, no. 2: 148. https://doi.org/10.3390/land10020148