Abstract
Forest classifications by disturbance permit designation of multiple types of both old growth forests and shorter-lived forests, which auto-replace under severe disturbance, and also identification of loss of the disturbance type and associated forest. Historically, fire and flooding disturbance regimes, or conversely, infrequent disturbance, produced unique forests such as disturbance-independent forests of American beech (Fagus grandifolia), eastern hemlock (Tsuga canadensis), and sugar maple (Acer saccharum) in the Eastern United States. However, disturbance has changed to primarily frequent mechanical overstory disturbance, resulting in novel forests. To demonstrate the transition to no-analog forests after disturbance change, I compared historical tree surveys (ca. 1837 to 1857) to current surveys in the Northern Lower Peninsula of Michigan. To establish widespread disturbance change effects, I also located where beech and hemlock are currently most abundant throughout the Eastern US compared to historical distribution of beech–hemlock forests. In the Northern Lower Peninsula of Michigan, beech and hemlock historically were about 30% of all trees, but currently, beech and hemlock are 2% of all trees. Red maple (Acer rubrum) increased from 1% to 11% of all trees and aspen (Populus) increased from 2% to 13% of all trees. The squared-chord difference between historical and current surveys was 0.40, or dissimilar forests. Areas with ≥20% beech and hemlock or ≥15% of either species decreased from about 52 million to 6 million hectares, with current distribution restricted to the Northeastern US. Current forests are dissimilar to historical forests, and this transition appears to be driven by disturbance regimes without historical analogs. Disturbance change may provide perspective in forest management for climate change.
1. Introduction
Disturbance generates a system to differentiate types of old growth forest that persist under minimal or low severity disturbance and shorter-lived forests that auto-replace under severe disturbance (Figure 1). Archetypical closed old growth forests are relatively unaffected both by understory and overstory disturbance and instead, dominant tree species are long-lived and shade-tolerant, while their structure is complex due to the extended time since the last disturbance. Stand-scale replacement occurs after centuries to millennia and is likely to be patchy even then. For example, in the Eastern United States, American beech (Fagus grandifolia), eastern hemlock (Tsuga canadensis), and sugar maple (Acer saccharum) represent disturbance-independent upland and even wetland forests, according to limited disturbance, shade tolerance, longevity, and complex internal structure [1]. Stand-replacing disturbance, primarily by wind, may have returned approximately every 1400 years [2,3,4]. Surface fires did not occur to remove small diameter trees, but larger diameter trees controlled the growing space for long intervals, which overall caused either mortality or suspension of growth in tree regeneration. Small-scale disturbance of individual larger trees (“gap dynamics”) allowed recruitment of shade-tolerant tree species. Structure consisted of large trees, presence of old trees near maximum longevity, dense multiple canopy layers, canopy gaps and anti-gaps, snags, coarse woody debris with accumulated moisture, mosses, and epiphytes [5,6]. American beech, eastern hemlock, and sugar maple are long-lived species; in particular, eastern hemlock may live for over 800 years [7]. Each of the three species has a unique distribution, and depending on region, one species may be absent or less dominant relative to the other two. American beech spans the latitudinal gradient of Eastern United States from Eastern Texas to Eastern Wisconsin [8,9]. Eastern hemlock and sugar maple do not extend as far south, but these species currently extend further west than American beech.
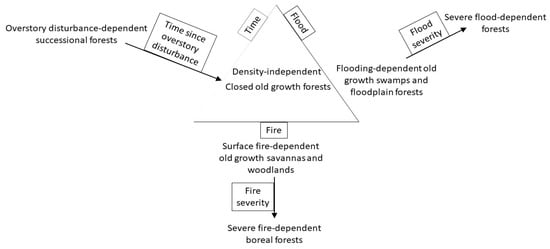
Figure 1.
Forest types based on dependence on disturbance type and disturbance severity in the Eastern United States.
Other old growth and naturally less enduring, short-lived forests are filtered by different disturbance types and severity. Frequent surface fire is an understory disturbance that is critical for maintaining a bilayer of fire-tolerant trees and herbaceous vegetation in tropical and temperate savannas and woodlands, but because overstory disturbance is rare, these forests are also old growth with long-lived tree species [10]. In contrast, severe fire removes both understory and overstory trees every 50 to 150 years in boreal forests, favoring auto-replacement by the pre-fire tree species, which have traits for rapid post-fire recovery [11,12]. Disturbance interacts with vegetation dynamics and site conditions to shape the composition and structure of forests. Fire is generally more frequent in conditions that are exposed to wind and sun, with sandy, dry soils, and flat terrain, which contribute to drying vegetation for ignition and spreading fire. For example, in the Eastern United States, grasslands and fire-tolerant pine savannas are typically located where fire is most frequent. Fire becomes less frequent in dry, rocky locations with limited vegetation or as conditions become increasingly protected with soils that have greater water capacity, more rugged terrain, and trees that provide coarse fuel for fire replace abundant herbaceous vegetation that provide fine fuel. As fire-free intervals extend, biomass accumulates and when ignition occurs, fire may be severe enough to spread through tree canopies, killing overstory trees.
Similarly, long-lived trees of swamps and floodplains are flooding-tolerant, but relatively frequent severe flooding favors auto-replacement by short-lived Salix and similar species (e.g., Populus deltioides; [13]). In the Eastern United States, the lower Mississippi River Alluvial Valley and tributaries such as the Missouri and Wabash Rivers once produced enormous trees, both in height (60 m) and in diameter (4 to 5 m; [14]). However, many of the swamps of the past do not functionally exist anymore, both at small and large scales, such as the Great Black Swamp of Northeast Ohio, due to wetland drainage.
Wind and herbivory are other disturbances that directly contribute to stand-scale replacement or interact with surface and crown fires and flooding to remove trees at different vertical profiles. For example, strong winds spread fires, whereas blown-down trees supply coarse fuels for severe fires. Trees in saturated soils after flooding may be vulnerable to wind. Herbivores that browse and trample small diameter trees maintain open forest densities, similarly to surface fire. Insect herbivores and various pathogens are well-known for killing large trees. Although wind and herbivory alone do not appear to maintain unique forests at landscape scales in the Eastern United States [15], wind may be the primary disturbance of pine forests of tropical islands [16], and megaherbivores (Elephantidae) may maintain tropical savannas.
The effects of disturbance and disturbance change may receive less consideration than the effects of climate and climate change; nonetheless, disturbance change has already caused widespread declines in historical forests. Currently, widespread overstory disturbance, with minimal understory disturbance, for forest products creates a cycle of short-term closed forests, which tend to be non-analogous in composition and structure compared to historical forests [10]. During Euro-American settlement and particularly between 1850 and 1920, the combination of increased population and improved tools of industrialization led to forest removal for different forest products and land uses, primarily agriculture, throughout the Eastern United States. Other changes include exclusion of surface fire, suppression of flooding processes though river regulation, and wetland drainage for agriculture. Compared to historical disturbances, continued mechanical removal of overstory trees has increased frequency of overstory disturbance, while fire and flooding exclusion have decreased frequency of understory disturbance [17]. Historically, common tree species have been replaced by a variety of early-successional and mid-successional tree species that were formerly rare and, furthermore, changed structure by decreasing tree diameter and increasing tree density [18]. Most notably, red maple (Acer rubrum) and eastern redcedar (Juniperus virginiana) have increased [18,19,20,21].
In disturbance-independent forests, although clearing for agriculture did occur, disturbance change overall occurred by logging. Some disturbance-independent forests were concentrated in rugged or cold locations protected from fire that were less suitable for agriculture. For example, Whitney [22] described that for hemlock forests located in Northern Pennsylvania (Figure 2A; green area in agriculture <15% in Pennsylvania), farming was limited by the short growing season and steep terrain, but lumbering was intensive starting about 1880 due to mechanical innovations of bands saws and railroads. By then, preferred pines had been selectively harvested but hemlock was abundant and bark was valuable for the tanning industry. Between 1880 and 1900, hemlock constituted more than two-thirds of the lumber production in Pennsylvania, whereas Northern Pennsylvania had the greatest tannery concentration in the world. Logging railroads allowed removal of the heavy broadleaf species, and sugar maple and beech specifically were removed for charcoal and organic chemicals. Equally, in the Northern Lower Peninsula of Michigan (Figure 2A), lightweight and valuable pine was selectively harvested, and then during 1890 to 1920, hemlock and the heavier broadleaf species were harvested for a variety of products, including tannins and chemicals, while agricultural cultivation was sparse and unproductive [2]. Extensive cutting allowed fast establishment by light-seeded and sprouting sugar maple and also aspen initially, which started a pulpwood industry. These landscapes have remained forested and relatively unfragmented by other land uses but are perforated by clearings (Figure 2B). Flatter landscapes, such as parts of Indiana, Ohio, Pennsylvania, and New York, have been converted to agriculture (Figure 2).
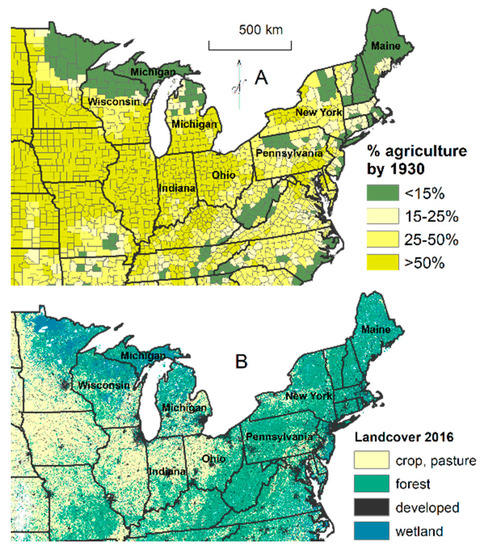
Figure 2.
Percentage area in agriculture for 1930 (A; [23]) and 2016 land classes (B; [24]).
To illustrate the effects of disturbance change, I first provided a detailed example of transition after tree harvest from disturbance-independent American beech and eastern hemlock forests to no-analog forests in the Northern Lower Peninsula, a 4.5 million ha ecological section of Michigan (Figure 3; [25]). I evaluated forests surveyed by the General Land Office (GLO; 1837 to 1857) and USDA Forest Service Forest Inventory and Analysis (FIA; 2010 to 2015; [26]). To scale these results of disturbance change to the Eastern United States, I mapped the historical distribution of beech–hemlock forests, as identified by studies to this point, and located where beech–hemlock analogs may exist today at landscape scales, according to all current FIA surveys, by ecological subsections or landscape scales of hundreds of thousands of hectares throughout the Eastern United States (Figure 3). Other spatial maps may be available, and for example, to extend historical coverage, I added sites identified as beech or hemlock from expert-based models (Biophysical Settings, [27,28]), which represent vegetation that may have been dominant historically. Lastly, I addressed how disturbance change from pre-Euro-American settlement forests to current no-analog forests helps to provide a context for climate change.
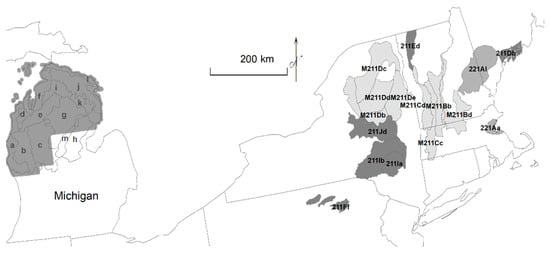
Figure 3.
The ecological section (212H) of the Northern Lower Peninsula, Michigan, with ecological subsections (outlined and labeled with subsection suffix letter) and extent with historical tree surveys (shaded). Additionally, subsections (outlined and labeled with complete subsection designation, shaded by ecological provinces of M211, 211, 221) where beech and hemlock are currently ≥20% of all trees or either species are ≥15% of all trees.
2. Materials and Methods
2.1. Transition to No-Analog Communities in the Northern Lower Peninsula
For historical surveys, the General Land Office was established in 1812 to direct the surveying, platting, and selling of public lands following a systematic method in which undivided land was measured into 9.6 × 9.6 km townships that were subdivided further into 1.6 × 1.6 km sections, improving on surveys based on the Land Ordinance of 1785 [29]. Surveyors recorded tree species, diameter, distance, and bearing for two to four trees selected at survey points in the corners and middle of each section line (i.e., every 0.8 km) and also recorded the species and diameter of line trees, or trees encountered along section lines. When selecting trees at survey points, surveyors may have had preferences for tree species that were easier to access (i.e., no low branches) and blaze (i.e., smoother bark) and were also following survey instructions, such as to record trees of moderate diameter, whereas trees intercepted along the survey lines were recorded without selection. The difference between these two survey methods can help to detect bias in trees at survey points and provide a general indication of the differences that can occur between two sampling methods. In the Northern Lower Peninsula of Michigan, surveys from 1837 to 1857 contained about 100,000 of both line and survey point trees, after exclusion of trees that were <12.7 cm in diameter because smaller trees were rarely recorded by surveyors in GLO surveys. Not all of the Northern Lower Peninsula was recorded in the dataset, and therefore, the southern four of the thirteen ecological subsections were partially incomplete (Figure 3). I determined tree composition for both survey types in the Northern Lower Peninsula of Michigan and for line trees by ecological subsection. I proportionately distributed the tree number for unidentified species within each genus to compare to current composition.
For current surveys, the USDA Forest Service Forest Inventory and Analysis was established to monitor long-term plots, which occur about every 2500 ha [30]. Personnel visit each plot on a five-year cycle. I used available plots from the complete cycle of 2010 to 2015 (~36,000 trees ≥ 12.7 cm) to determine tree composition in the Northern Lower Peninsula of Michigan and by ecological subsection.
In addition to comparing changes in composition of historical and current surveys, I demonstrated the novel status of current forests using the squared-chord distance metric ([31]; R Core Team package analog, [32]) Historical and modern forests that differ in composition tend to have squared-chord distance ≥0.15, and given that thresholds divide continuous data, values between 0.12 and 0.15 indicate divergence ([31]. I also compared the squared-chord distance metric between historical line and survey point tree surveys to display the similarity arising from two different survey methods, one of which may be more biased, of the same forests.
2.2. Current Analogs for Beech–Hemlock Forests in the Eastern United States
I then searched USDA Forest Inventory and Analysis surveys for ecological subsections that currently contain both beech and hemlock as ≥20% of all trees or either species as ≥15% of all trees. This threshold is a low standard, but necessary to find any current American beech–eastern hemlock forests. I summed the subsection areas to calculate the distribution extent. To map the historical distribution of beech–hemlock, following the rule of at least 20% beech and hemlock or ≥15% of each species, I used databases of published historical tree survey research [33,34,35,36] and then summed areas to calculate the extent. Although the distribution may increase as more historical tree surveys become available, I also added sites identified as beech or hemlock from expert-based Biophysical Settings [27,28] that extended beyond the survey bounds. Most of the map was based on survey point surveys because line surveys are often not available or limited in sample.
3. Results
3.1. Transition to No-Analog Communities in the Northern Lower Peninsula
Eastern hemlock, sugar maple, and American beech were the three most abundant species historically, comprising about 45% of all trees in the Northern Lower Peninsula of Michigan (Table 1). Surveyors had a marked bias for marking smooth-barked beech trees, based on the difference between beech composition in the line and survey point surveys, which were encountered or selected by surveyors, respectively. Beech percentage in line surveys was only 60% of beech in survey point surveys. When beech and hemlock are combined, their combined percentage in line surveys was 84% of that found in point surveys. The three pine species and northern white-cedar (Thuja occidentalis) comprised another 37% of all trees, such that seven species were 80% of all trees. The squared-chord distance was 0.029 between line and survey point surveys, which indicated that forests were the same, or analogs, despite known biases.

Table 1.
Most abundant tree species (≥12.7 cm in diameter) of historical trees from 1837 to 1857 encountered by surveyors along survey lines (line), historical trees selected by surveyors (points), and the ratio of line to point trees in the Northern Lower Peninsula of Michigan.
In contrast, current forests contained about 9% eastern hemlock, sugar maple, and American beech, primarily due to declines in hemlock and beech (Table 2). Only 2% of all trees were eastern hemlock and American beech compared to 30% of historical composition (Figure 4). A major increase occurred in the aspen group of quaking aspen and bigtooth aspen (+11 percentage points from 2% of all trees to 13%), red maple (+10 percentage points), and the red oak group (+4 percentage points). If the unidentified pine species group contains representative proportions of eastern white (Pinus strobus), red (P. resinosa), and jack pine (P. banksiana), then red pine has increased (+7 percentage points), while the other two pine species have declined. The squared-chord distance between historical line tree surveys and current tree surveys was 0.40, which demonstrated different, no-analog forests.
Table 2.
Percent composition (≥1% of total stems in one survey; trees ≥12.7 cm in diameter) of historical trees encountered by surveyors along survey lines (after allocation to unidentified species) from 1837 to 1857 and current trees from 2010 to 2015, and ratio of current to line trees in the Northern Lower Peninsula of Michigan.
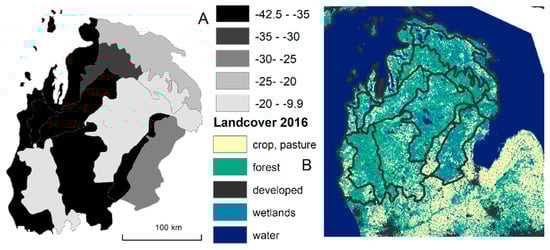
Figure 4.
Decrease in percentage points of American beech and eastern hemlock between historical and current surveys (A) and 2016 land classes (B; [24]).
3.2. Current Analogs for Beech–Hemlock Forests in the Eastern United States
Currently, a total of 16 ecological subsections contain ≥20% both beech and hemlock or ≥15% of either species, which are all located in the Northeastern United States (Table 3, Figure 5). No subsections in the Northern Lower Peninsula contain >6.5% of both species. Beech and hemlock forests cover an area of 6.1 million hectares.
Table 3.
Historical (1837 to 1857) and current percent composition of American beech, eastern hemlock, and sugar maple (trees ≥12.7 cm in diameter) by subsection in the Northern Lower Peninsula of Michigan (section 212H) and analogous subsections in the Eastern US that contain ≥20% beech and hemlock or ≥15% of either species.
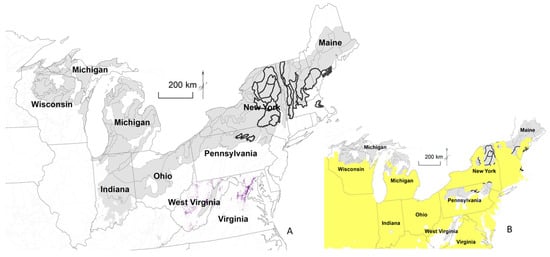
Figure 5.
Historical distribution (ca. 1620–1900; light shading) of American beech and eastern hemlock forests, compared to current distribution (dark outline), where beech and hemlock were ≥20% of all trees or either species was ≥15% of all trees (A). Purple indicates locations of Appalachian HemlockNorthern Hardwood Forest from Biophysical Settings [28]. Agricultural area did not exceed 25% in some locations before 1940, which was typically followed by agricultural abandonment in the Eastern United States (B, [23]).
A distribution map shows the best available beech and hemlock historical distributions (Figure 5). Historically, 9 of 13 ecological subsections in the Northern Lower Peninsula alone contained ≥20% both beech and hemlock or ≥15% of either species, based on line trees. This area covered 51.8 million ha. Due to surveyor preference for beech, the map may be too expansive; however, where beech and hemlock intersect, a bias for beech may be counterbalanced by a bias against hemlock. Based on Biophysical Settings [28], the main remaining landscapes that may meet these thresholds are the Appalachian hemlock forests.
4. Discussion
4.1. Key Findings
The three most abundant tree species in the Northern Lower Peninsula of Michigan were American beech, eastern hemlock, and sugar maple, which historically comprised about 45% of all trees. In the absence of overstory disturbance, generations changed at scales of hundreds of years, often to the same species given that overstory trees were positioned to supply seed sources and sprouts to the understory. The species require long disturbance-free intervals to become dominant (Figure 1). Shade-tolerant beech and hemlock decreased in current forests to only 2% of all trees from 30% of historical composition. Most forests in the Eastern US have been disturbed by multiple cycles of harvest since Euro-American settlement. Current forests are typically within a tree generation from origination and will require hundreds of years, or several tree generations without disturbance to restore a historically low disturbance regime and allow compositional and structural succession to old growth forests. Compositional succession occurs slowly, such that successional stages in composition are not particularly applicable, similar to high severity disturbance regimes in short-lived forests that auto-replace with pre-disturbance species (Figure 1; [11,12,17])
Sugar maple declined but remained relatively stable despite disturbance change. Sugar maple grows relatively well in gaps from overstory disturbance and is often the first of the three species to become abundant [2,37]. As time increases since overstory disturbance, sugar maple, then beech, then hemlock may rotate in dominance [38], although American beech may have been the most historically abundant shade-tolerant species in the Eastern United States within an oak and pine open forest matrix [21,33].Propagule sources may be a problem in some locations. Reports of sugar maple declines and beech increases occur in other locations, perhaps in some cases due to beech sprouting that suppresses other tree regeneration [37,39,40,41,42].
Historically, the Northern Lower Peninsula of Michigan alone contained almost as much area of beech and hemlock forests as the entire US contains currently (Figure 5). The area with minimum thresholds of beech and hemlock decreased from about 52 million to 6 million hectares. Limited current vegetation analogs exist of composition comparable to historical eastern old growth forests of American beech and eastern hemlock. Given land use and rates of tree removal, the archetypal structure of old growth forests is also not likely present throughout most of the ecological subsections that approach historical composition, even in mature forests [43].
Within the historical beech–hemlock distribution developed here, caveats include that the distribution is likely to expand as more historical surveys become available. Nonetheless, the main remaining landscapes may be identified as Appalachian hemlock forests [28]. Additionally, survey point surveys, composed of trees selected by surveyors, contained 1.7 times more beech trees than line tree surveys, which means that historical beech abundance is likely to be inflated because survey point surveys with surveyor bias are typically the only available source of information. The map incorporates hemlock and thus should help offset the bias in favor of beech.
In order to locate current vegetation analogs, I used low thresholds of at least 20% beech and hemlock or ≥15% of each species because increasing this threshold to ≥30% beech and hemlock produced only one subsection. However, at this minimum threshold, upland oaks were likely to be more abundant than beech where there was historical overlap. Historically, beech was abundant in landscapes with fire-tolerant oak species, perhaps due to fine-scale variation in understory fire disturbance [35,44]. Aside from understory disturbance by fire, open oak forests shared a similar infrequent overstory disturbance regime with closed beech forests (Figure 1).
Biodiversity and ecosystem function are affected by the loss of disturbance-independent beech and hemlock forests because dominant species most influence ecosystem properties and processes [45]. Large trees, the presence of old trees near maximum longevity, and snags are all rare across the Eastern US and elsewhere [46,47]. These structural characteristics are desirable for a wide range of associated taxa, which are declining in the absence of mature forests [10,48]. Beech generates nuts, or hard mast, for wildlife; due to concurrent decreases in oak species, which provide acorns, beech declines prevent substitution of one type of hard mast for another [49]. Functional redundancy cannot be compensated for if the major suppliers of hard mast all are declining. Native understory plants have also decreased in this region [50]. Both beech and hemlock produce leaf litter that decomposes more slowly than most other species of eastern forests and influences soil processes [51]. Older forests provide greater recruitment of large woody debris to streams, forming debris dams and pools [43,52]. Furthermore, hemlock is an evergreen species and may stabilize shading, temperature, and humidity and even available water throughout the year, perhaps allowing streams to have increased water flow [52].
Hemlock and beech additionally face new diseases from the wooly adelgid (Adelges tsugae) and beech bark disease (beech scale insect, Cryptococcus fagisuga, followed by lethal fungal infections by Neonectria spp.; [9]). In Michigan, hemlock wooly adelgid is not a widespread problem and beech bark disease was first detected in 2000, and thus, any losses have been recent [53]. Beech is a sprouting species, and when beech bark disease affects larger diameter trees, beech trees become thickets or in some cases, pole-sized trees, somewhat analogously to American chestnut transformation in life form to a shrub due to disease [52]. Beech is extremely shade-tolerant and can survive as thickets in dense understory conditions. Indeed, tree removal exposes resistant American beech to open conditions that may lead to mortality, although selective removal of infested beech may be beneficial [9,42,54]. Beech thickets appear to be undesirable, recalcitrant vegetation that prevents development of either an herbaceous understory or forest [55]. However, impenetrable thickets, similar to shrub ecosystems, often provide valuable nesting and protective cover for wildlife. Additionally, in some cases, the loss of beech in the canopy may allow hemlock, which has extreme longevity, to increase with less competition from a long-lived competitor. Hemlock similarly is dealing with the hemlock wooly adelgid, but hemlock has exhibited development of resistance in the past. Rapid hemlock decline, attributed to insects, perhaps Lepidoptera, to about 5400 BP depressed pollen composition for millennia or several tree generations, but hemlock increased again in about 3500 BP [56]. Developing resistance followed by recovery is a long process [9].
4.2. Disturbance Change, Climate Change, and Novel Forests
Identification of compositionally similar analog communities or compositionally dissimilar no-analog communities typically occurs under the context of climate, with links to analog or no-analog climates [57]. Although concerns about climate change effects on forests are justified, historical forests have already been replaced by non-analogous forests in composition and structure throughout the Eastern US during the past century or two, due to changing disturbance. The limited extent of the potential current analogs of beech–hemlock forests demonstrates the loss of disturbance-independent beech–hemlock forests throughout most of the 52 million ha range. The current analogs may not even be very similar to historical beech–hemlock forests, but these may be the most disturbance-free landscapes in the Eastern United States.
Similarly to the loss of disturbance-free forests, surface fire-dependent pine, pine-oak, and oak open forests that historically covered most of the Eastern United States also have decreased to remnants without fire as a frequent disturbance to filter out fire-sensitive species and remove small trees, and with increased overstory disturbance that favors other traits [10,58] For example, longleaf pine (Pinus palustris) woodlands, which dominated (60% to 95% of all trees) about 37.5 million ha of the Coastal Plain in the Southeastern United States, have transitioned to a combination of planted loblolly pine (Pinus taeda) forests and eastern broadleaf forests, while longleaf is currently 3% of all trees [59,60]. The Northern Lower Peninsula of Michigan may be one of the few locations in the Eastern US where upland oak species, particularly northern red oak, are increasing. However, historical oak dominance extended only into the Southern Lower Peninsula. Oaks grow well replacing pines in the pine understory, as seemed to be the case here, and northern red oak may share more traits with red maple and other increasing species than other fire-tolerant oak species [61].
The current disturbance regime of forestry favors species that reproduce vegetatively or produce prolific seeds for rapid establishment after overstory disturbance, and grow rapidly, including planted species such as red pine in Michigan and the Northern US and loblolly pine in the Southeastern US. Multiple eastern broadleaf species from the Central–Eastern US have expanded both north and south, not apparently due to climate change [15,62,63]. For example, in the Northern Lower Peninsula Michigan, severe, repetitive fires after logging at the turn to the 20th century that removed organic soil layers and cones first benefitted aspen, an established boreal species, resulting in a pulpwood industry, in which aspen stands are clear-cut on a rotation cycle of 30–60 years [2,4]. More recently, red maple in particular has expanded and increased in this near-boreal landscape and throughout most of the Eastern United States, including the Southeast [18,19,20,21,50,58]. Historically, red maple was limited to wetland areas between fire and flooding disturbances but currently succeeds in frequent gaps and clear cuts after overstory disturbance with limited understory disturbance.
Climate change may not be any worse for historical forests than disturbance change has already been and introduction of diseases for beech and hemlock specifically, which are still in progress. Climate change will interact with disturbance change, in unexpected ways, to both amplify and dampen disturbance change [64]. Future rates of change of forests in the Eastern US may not be likely to exceed rates of change that occurred during the exploitation era of Euro-American settlement and subsequent disequilibrium as species have been re-sorted by disturbance change. Moreover, tree dynamics respond slowly to climate change [65,66], which is why climate may not have a very apparent effect on tree distributions relative to direct disturbance [15,67]. Climate change is expected to shift forests in a poleward direction and expand southern forests, but replacement of established trees by more heat-adapted species will occur slowly due to requirements for propagule dispersal and successful competition for growing space after natural tree mortality or tree removal.
Forests are now novel, which helps to contextualize change and perhaps alters how forests could be managed to reduce the effects of climate change. Biodiversity and ecosystem function have been affected by disturbance change and many species associated with historical forests are not being supported by current forests in the Eastern United States, which include longleaf pine, a biodiversity hotspot [10]. Management and restoration of historical forests and historical disturbance regimes will support declining species and provide ecosystem types that may be more resistant and resilient under the pressure of climate change. Historical forests have persisted throughout millennia of climate change, but current no-analog forests have assembled during the past hundred or so years and have not withstood the climate variation that historical forests have experienced. Additionally, forest management practices, such as protection of overstory trees and species-specific cutting and planting, may slow compositional change. Without acceleration of overstory turnover by tree removal, it may take hundreds of years for climate change effects on competitive dynamics to materialize. Management and restoration of fire-tolerant pine and oak species currently helps to maintain these species against competition from fire-sensitive species now that fire regimes are no longer in place.
5. Conclusions
The effects of Euro-American settlement and altered disturbance change are registered in the environmental records of disturbance-independent forests in Michigan, with similar large-scale effects on disturbance-independent forests in the Eastern United States. Mature forests composed of late-successional beech and hemlock have been removed across the Eastern US, due to mechanical disturbance of overstory trees, which has influenced forests to states that are not representative of historical forests. Forests continue to change in response to land use pressure in a trajectory of increased early to mid-successional species of eastern broadleaf forests. Even where current composition meets minimal thresholds of similarity to historical forests, current forests may not be likely to have the same structural and functional properties that are critical to associated species. Historical ecology and knowledge of the magnitude and trajectory of change from pre-Euro-American settlement forests to current forests help to provide a context for changes due to climate.
Author Contributions
The author performed all authorship tasks. The authors have read and agreed to the published version of the manuscript.
Funding
No funding was provided.
Institutional Review Board Statement
Not applicable.
Informed Consent Statement
Not applicable.
Data Availability Statement
All data are available.
Acknowledgments
I thank the anonymous reviewers. The findings and conclusions in this publication are those of the author and should not be construed to represent any official USDA or U.S. Government determination or policy.
Conflicts of Interest
The author declares no conflict of interest.
References
- Woods, K.D. Long-term change and spatial pattern in a late-successional hardwood. J. Ecol. 2000, 88, 267–282. [Google Scholar] [CrossRef]
- Whitney, G.G. An ecological history of the Great Lakes forest of Michigan. J. Ecol. 1987, 1, 667–684. [Google Scholar] [CrossRef]
- Lorimer, C.G.; White, A.S. Scale and frequency of natural disturbances in the northeastern, U.S.: Implications for early successional forest habitats and regional age distributions. For. Ecol. Manag. 2003, 185, 41–64. [Google Scholar] [CrossRef]
- Cleland, D.T.; Crow, T.R.; Saunders, S.C.; Dickmann, D.I.; Maclean, A.L.; Jordan, J.K.; Watson, R.L.; Sloan, A.M.; Brosofske, K.D. Characterizing historical and modern fire regimes in Michigan (USA): A landscape ecosystem approach. Landsc. Ecol. 2004, 19, 311–325. [Google Scholar] [CrossRef]
- Tyrrell, L.E.; Crow, T.R. Structural characteristics of old-growth hemlock-hardwood forests in relation to age. Ecology 1994, 75, 370–386. [Google Scholar] [CrossRef]
- Whitney, G.G. From Coastal Wilderness to Fruited Plain; Cambridge University Press: Cambridge, UK, 1996. [Google Scholar]
- Burns, R.M.; Honkala, B.H. Silvics of North America: 1. Conifers; 2. Broadleafs. Agriculture Handbook 654; U.S. Department of Agriculture, Forest Service: Washington, DC, USA, 1990.
- Schafale, M.P.; Harcombe, P.A. Presettlement vegetation of Hardin County, Texas. Am. Midl. Nat. 1983, 109, 355–366. [Google Scholar] [CrossRef]
- Stephanson, C.; Coe, N. Impacts of beech bark disease and climate change on American beech. Forests 1998, 8, 155. [Google Scholar] [CrossRef]
- Hanberry, B.B.; Bragg, D.C.; Alexander, H.D. Open forest ecosystems: An excluded state. For. Ecol. Manag. 2020, 472, 118256. [Google Scholar] [CrossRef]
- Johnstone, J.F.; Chapin, F.S. Fire interval effects on successional trajectory in boreal forests of northwest Canada. Ecosystems 2020, 9, 268–277. [Google Scholar] [CrossRef]
- Johnstone, J.F.; Hollingsworth, T.N.; Chapin, F.S., III; Mack, M.C. Changes in fire regime break the legacy lock on successional trajectories in Alaskan boreal forest. Glob. Chang. Biol. 2010, 16, 1281–1295. [Google Scholar] [CrossRef]
- Johnson, W.C. Woodland 2006, expansions in the Platte River, Nebraska: Patterns and causes. Ecol. Monogr. 1994, 64, 45–84. [Google Scholar] [CrossRef]
- Jackson, M.T. Forest communities and tree species of the Lower Wabash River Basin. Proc. Indiana Acad. Sci. 2006, 115, 94–102. [Google Scholar]
- Hanberry, B.B.; Abrams, M.D.; Arthur, M.A.; Varner, J.M. Reviewing fire, climate, deer, and foundation species as drivers of historically open oak and pine forests and transition to closed forests. Front. For. Glob. Chang. 2020, 3, 56. [Google Scholar] [CrossRef]
- O’Brien, J.J.; Hiers, J.K.; Callaham, M.A., Jr.; Mitchell, R.J.; Jack, S.B. Interactions among overstory structure, seedling life-history traits, and fire in frequently burned neotropical pine forests. AMBIO 2008, 37, 542–547. [Google Scholar] [CrossRef] [PubMed]
- Pan, Y.; Chen, J.M.; Birdsey, R.; McCullough, K.; He, L.; Deng, F. Age structure and disturbance legacy of North American forests. Biogeosciences 2011, 8, 715–732. [Google Scholar] [CrossRef]
- Hanberry, B.B.; Dey, D.C. Historical range of variability for restoration and management in Wisconsin. Biodivers. Conserv. 2019, 28, 2931–2950. [Google Scholar] [CrossRef]
- Abrams, M.D. The red maple paradox. BioScience 1998, 48, 355–364. [Google Scholar] [CrossRef]
- Hanberry, B.B.; Kabrick, J.M.; He, H.S. Changing tree composition by life history strategy in a grassland-forest landscape. Ecosphere 2014, 6, 277. [Google Scholar] [CrossRef]
- Hanberry, B.B. Trajectory from beech and oak forests to eastern broadleaf forests in Indiana, USA. Ecol. Process. 2019, 8, 3. [Google Scholar] [CrossRef]
- Whitney, G.G. The history and status of the hemlock-hardwood forests of the Allegheny Plateau. J. Ecol. 1990, 78, 443–458. [Google Scholar] [CrossRef]
- Maizel, M.; White, R.D.; Root, R.; Gage, S.; Stitt, S.; Osborne, L.; Muehlbach, G. Historical Interrelationships between Population Settlement and Farmland in the Conterminous United States. 1790. Available online: https://archive.usgs.gov/archive/sites/landcover.usgs.gov/luhna/chap2.html (accessed on 21 May 2020).
- Homer, C.; Dewitz, J.; Jin, S.; Xian, G.; Costello, C.; Danielson, P.; Gass, L.; Funk, M.; Wickham, J.; Stehman, S.; et al. Conterminous United States land cover change patterns 2001–2016 from the 2016 National Land Cover Database. ISPRS J. Photogramm. Remote Sens. 2020, 162, 184–199. [Google Scholar] [CrossRef]
- Cleland, D.T.; Avers, P.E.; McNab, W.H.; Jensen, M.E.; Bailey, R.G.; King, T.; Russell, W.E. National hierarchical framework of ecological units. In Ecosystem Management Applications for Sustainable Forest and Wildlife Resources; Boyce, M.S., Haney, A., Eds.; Yale University Press: London, UK, 1997; pp. 18–200. [Google Scholar]
- Forest Inventory and Analysis [FIA]. FIA DataMart. Available online: https://apps.fs.usda.gov/fia/datamart/datamart.html (accessed on 30 January 2021).
- Landfire. Biophysical Settings Description and Quantitative Models. Available online: https://www.landfire.gov/bps.php (accessed on 19 January 2021).
- Landfire. Data Products Distribution Table. Available online: https://www.landfire.gov/version_comparison.php (accessed on 17 January 2021).
- White, C.A. A History of the Rectangular Survey System; Bureau of Land Management, Government Printing Office: Washington, DC, USA, 1986. Available online: https://www.blm.gov/sites/blm.gov/files/histrect.pdf (accessed on 18 January 2021).
- Bechtold, W.A.; Patterson, P.L. The Enhanced Forest Inventory and Analysis Program-National Sampling Design and Estimation Procedures; U.S. Department of Agriculture, Forest Service, Southern Research Station: Asheville, NC, USA, 2005.
- Overpeck, J.T.; Webb, T.I.; Prentice, I.C. Quantitative interpretation of fossil pollen spectra: Dissimilarity coefficients and the method of modern analogs. Quat. Res. 1985, 23, 87–108. [Google Scholar] [CrossRef]
- Simpson, G.L.; Oksanen, J. 2020 Analogue: Analogue and Weighted Averaging Methods for Palaeoecology. R Package Version 0.17-5. Available online: https://cran.r-project.org/package=analogue (accessed on 18 January 2021).
- Hanberry, B.B.; Nowacki, G.J. Oaks were the foundation genus of the east-central United States. Quat. Sci. Rev. 2016, 145, 94–103. [Google Scholar] [CrossRef]
- Paciorek, C.; Goring, S.; Thurman, A.; Cogbill, C.; Williams, J.; Mladenoff, D.; Peters, J.; Zhu, J.; McLachlan, J. Settlement-era Gridded Tree Composition, Northeastern, U.S.: Level 2 ver 0. Environmental Data Initiative. Available online: https://doi.org/10.6073/pasta/8544e091b64db26fdbbbafd0699fa4f9 (accessed on 30 October 2020).
- Hanberry, B. Revisiting historical beech and oak forests in Indiana using a GIS method to recover information from bar charts. PeerJ 2018, 6, e5158. [Google Scholar] [CrossRef] [PubMed]
- McLachlan, J.; Williams, J. Settlement Trees, Southern Michigan Level 0 ver 0. Environmental Data Initiative. Available online: https://doi.org/10.6073/pasta/8d033c1cfadca42bf060f9f38940c81e (accessed on 23 October 2020).
- Forrester, J.A.; Mcgee, G.G.; Mitchell, M.J. Effects of beech bark disease on aboveground biomass and species composition in a mature northern hardwood forest, 1985. J. Torrey Bot. Soc. 2003, 130, 70–78. [Google Scholar] [CrossRef]
- Woods, K.D. Dynamics in late-successional hemlock–hardwood forests over three decades. Ecology 2000, 81, 110–126. [Google Scholar]
- Hane, E.N. Indirect effects of beech bark disease on sugar maple seedling survival. Can. J. For. Res. 2003, 33, 807–813. [Google Scholar] [CrossRef]
- Duchesne, L.; Ouimet, R.; Moore, J.-D.; Paquin, R. Changes in structure and composition of maple–beech stands following sugar maple decline in Québec, Canada. For. Ecol. Manag. 2005, 208, 223–236. [Google Scholar] [CrossRef]
- Runkle, J.R. Impacts of beech bark disease and deer browsing on the old-growth forest. Am. Midl. Nat. 2007, 157, 241–249. [Google Scholar] [CrossRef]
- Collin, A.; Messier, C.; Kembel, S.; Bélanger, N. Low light availability associated with American beech is the main factor for reduced sugar maple seedling survival and growth rates in a hardwood forest of Southern Quebec. Forests 2007, 8, 413. [Google Scholar] [CrossRef]
- Keeton, W.S.; Kraft, C.E.; Warren, D.R. Mature and old-growth riparian forests: Structure, dynamics, and effects on Adirondack stream habitats. Ecol. Appl. 2007, 17, 852–868. [Google Scholar] [CrossRef] [PubMed]
- Kenoyer, L.A. Ecological notes on Kalamazoo County, Michigan, based on the original land survey. Mich. Acad. Sci. Arts Lett. 1930, 11, 211–217. [Google Scholar]
- Mokany, K.; Ash, J.; Roxburgh, S. Functional identity is more important than diversity in influencing ecosystem processes in a temperate native grassland. J. Ecol. 2008, 96, 884–893. [Google Scholar] [CrossRef]
- Hanberry, B.; Hanberry, P.; Demarais, S.; Jones, J. Importance of residual trees to birds in regenerating pine plantations. iForest 2012, 5, 108–112. [Google Scholar] [CrossRef]
- Hanberry, B.B.; He, H.S. Effects of historical and current disturbance on forest biomass in Minnesota. Landsc. Ecol. 2015, 30, 1473–1482. [Google Scholar] [CrossRef]
- Eschtruth, A.K.; Cleavitt, N.L.; Battles, J.J.; Evans, R.A.; Fahey, T.J. Vegetation dynamics in declining eastern hemlock stands: 9 years of forest response to hemlock woolly adelgid infestation. Can. J. For. Res. 2006, 36, 1435. [Google Scholar] [CrossRef]
- McShea, W.J.; Healy, W.M.; Devers, P.; Fearer, T.; Koch, F.H.; Stauffer, D.; Waldon, J. Forestry matters: Decline of oaks will impact wildlife in hardwood forests. J. Wildl. Manag. 2007, 71, 1717–1728. [Google Scholar] [CrossRef]
- Rooney, T.P.; Wiegmann, S.M.; Rogers, D.A.; Waller, D.M. Biotic impoverishment and homogenization in unfragmented forest understory communities. Conserv. Biol. 2004, 18, 787–798. [Google Scholar] [CrossRef]
- Lovett, G.M.; Canham, C.D.; Arthur, M.A.; Weathers, K.C.; Fitzhugh, R.D. Forest ecosystem responses to exotic pests and pathogens in eastern North America. BioScience 2006, 56, 395–405. [Google Scholar] [CrossRef]
- Ellison, A.M.; Bank, M.S.; Clinton, B.D.; Colburn, E.A.; Elliott, K.; Ford, C.R.; Foster, D.R.; Kloeppel, B.D.; Knoepp, J.D.; Lovett, G.M.; et al. Loss of foundation species: Consequences for the structure and dynamics of forested ecosystems. Front. Ecol. Environ. 2005, 3, 479–486. [Google Scholar] [CrossRef]
- McCullough, D.G. Munching, 1992, Crunching & Sucking: Invasive Forest Insect Pests in the U.S. & Michigan. Available online: https://forestadaptation.org/sites/default/files/McCullough_HOL_ITCM_Day1_handouts.pdf (accessed on 28 October 2020).
- Farrar, A.; Ostrofsky, W.D. Dynamics of American beech regeneration 10 years following harvesting in a beech bark disease-affected stand in Maine. North. J. Appl. For. 2006, 23, 192–196. [Google Scholar] [CrossRef][Green Version]
- Royo, A.A.; Carson, W.P. On the formation of dense understorey layers in forests worldwide: Consequences and implications for forest dynamics, biodiversity, and succession. Can. J. For. Res. 2006, 36, 1345–1362. [Google Scholar] [CrossRef]
- Calcote, R. Mid-Holocene climate and the hemlock decline: The range limit of Tsuga canadensis in the western Great Lakes region, USA. Holocene 2003, 13, 215–224. [Google Scholar] [CrossRef]
- Williams, J.W.; Jackson, S.T. Novel climates, no-analog communities, and ecological surprises. Front. Ecol. Environ. 2007, 5, 475–482. [Google Scholar] [CrossRef]
- Hanberry, B.B.; Brzuszek, R.F.; Foster, H.T., II; Schauwecker, T.J. Recalling open old growth forests in the Southeastern Mixed Forest province of the United States. Écoscience 2019, 26, 11–22. [Google Scholar] [CrossRef]
- Frost, C.C. Four centuries of changing landscape patterns in the longleaf pine ecosystem. In Proceedings of the Tall Timbers Fire Ecology Conference, Tallahassee, FL, USA, 30 May–2 June 1991; Hermann, S.M., Ed.; Tall Timbers Research Station: Tallahassee, FL, USA, 1993; Volume 18, pp. 17–43. [Google Scholar]
- Hanberry, B.B.; Coursey, K.; Kush, J.S. Structure and composition of historical longleaf pine ecosystems in Mississippi, USA. Hum. Ecol. 2018, 46, 241–248. [Google Scholar] [CrossRef]
- Crow, T.R. Reproductive mode and mechanisms for self-replacement of northern red oak (Quercus rubra)—A review. For. Sci. 1988, 34, 19–40. [Google Scholar]
- Hanberry, B.B.; Hansen, M.H. Latitudinal range shifts of tree species in the United States. Basic Appl. Ecol. 2015, 16, 231–238. [Google Scholar] [CrossRef]
- Woodall, C.W.; Westfall, J.A.; D’Amato, A.W.; Foster, J.R.; Walters, B.F. Decadal changes in tree range stability across forests of the eastern, U.S. For. Ecol. Manag. 2018, 429, 503–510. [Google Scholar] [CrossRef]
- Goring, S.J.; Williams, J.W. Effect of historical land-use and climate change on tree-climate relationships in the upper Midwestern United States. Ecol. Lett. 2007, 20, 461–470. [Google Scholar] [CrossRef]
- Webb, T. Is vegetation in equilibrium with climate? How to interpret late-Quaternary pollen data. Vegetatio 1986, 67, 75–91. [Google Scholar] [CrossRef]
- Davis, M.B.; Shaw, R.G. Range shifts and adaptive responses to Quaternary climate change. Science 2001, 292, 673–679. [Google Scholar] [CrossRef] [PubMed]
- Zhang, Y.; Bergeron, Y.; Zhao, X.H.; Drobyshev, I. Stand history is more important than climate in controlling red maple (Acer rubrum L.) growth at its northern distribution limit in western Quebec. Can. J. Plant Ecol. 2014, 8, 368–379. [Google Scholar] [CrossRef]
Publisher’s Note: MDPI stays neutral with regard to jurisdictional claims in published maps and institutional affiliations. |
© 2021 by the author. Licensee MDPI, Basel, Switzerland. This article is an open access article distributed under the terms and conditions of the Creative Commons Attribution (CC BY) license (http://creativecommons.org/licenses/by/4.0/).