
The Evolution of the Urban Residential Space Structure and Driving Forces in the Megacity—A Case Study of Shenyang City


1
School of Geography, Liaoning Normal University, Dalian 116029, China
2
Human Settlements Research Center, Liaoning Normal University, Dalian 116029, China
3
Center for Studies of Marine Economy and Sustainable Development, Liaoning Normal University, Dalian 116029, China
4
Institute of Geographic Sciences and Natural Resources Research, Beijing 100101, China
*
Author to whom correspondence should be addressed.
Land 2021, 10(10), 1081; https://doi.org/10.3390/land10101081
Submission received: 8 September 2021
/
Revised: 4 October 2021
/
Accepted: 11 October 2021
/
Published: 13 October 2021
(This article belongs to the Topic Climate Change and Environmental Sustainability)
Abstract
:For megacities, they are in a period of transformation from extensive development to smart growth. Recognizing new characteristics and new changes of the residential space in megacities under the backdrop of new development has great practical significance for realizing the sustainable development of the city. As the only megacity in Northeast China, Shenyang was selected to be the research object, with 1989–2018 as the research period. The research comprehensively used multiple spatial representation methods and statistical methods to study the residential space pattern and driving factors in Shenyang City. The results showed that: (1) Residential space expansion can be divided into four stages: slow development, rapid expansion, speedy expansion, and stable extension. (2) The residential space structure presented a spatial evolution characteristic of overall expansion, forming multiple secondary core density centers. The east-west direction had a larger extension range than the northeast-southwest direction. There was an axisymmetric zonal distribution on both sides of the Hun River. (3) The agglomeration of different residential forms was obvious, and the spatial heterogeneity was increasingly stronger. (4) Urban planning measures and economic strength were the main driving forces of residential space expansion.
1. Introduction
As an important aspect of improving people’s livelihood, housing has long attracted widespread attention from the country and the wider society [1,2]. Since China’s reform and opening up, urbanization and industrialization have developed rapidly, and the scale and spatial structure of cities has expanded significantly [3,4]. Many megacities have been born, and the expansion structure and form of residential space are constantly changing [5,6]. However, with the increase in urban land saturation, some cities have encountered unsustainable development problems such as disorderly expansion, low land-use efficiency, and so on [7]. The national “13th Five-Year Plan” outline put forward the goal of “optimizing the spatial layout of housing construction, significantly improving living quality, transforming and upgrading housing construction mode”. In the context of rapid urbanization, it is a top priority for China in the transitional period to systematically analyze the status quo of housing, implement refined management of urban development, and realize the sustainable development of residential space [8]. Urban residential space as people’s living communication activities carrier is an important part of urban space. It is not only the spatial combination of buildings but also the social system of human activities [9]. Its evolution process and form are complementary to the evolution of the whole city, deeply affecting the quality of the human settlement environment.
The unprecedented activity of global urban construction has made scholars generally pay attention to the impact on residential space [10]. The study of residential space originated after the Western Industrial Revolution. With the acceleration of industrialization, a huge number of people gathered into cities, and urban functions were complicated, which also brought about urban problems such as housing congestion, environmental deterioration, as well as serious social problems such as the slums and social polarization [11,12]. Therefore, theoretical exploration and practical problem solving emerged. Research on the theory of residential space mainly began in the late 19th century. Social activists led to utopian socialist urban planning ideas, such as the “Pastoral City Theory”, “Union New Village” and “Daylight Port” [13]. Developed in the 1980s, five schools gradually formed: ecological [14,15], neoclassical [16,17], behavioral [18], Marxist structural [19], and institutional [20]. According to the existing international theoretical models, Chinese scholars relied on the Marxist Structural School to deepen and put forward the theory of “social-spatial unity”, which has been widely recognized as the theoretical basis of Chinese urban residential space differentiation [21]. At the same time, there were theoretical studies based on the comparative analysis of the social space differences of countries with different systems, such as the social-spatial differences of “socialist transition countries” and “post-socialist cities”, such as in Eastern Europe and the former Soviet Union [22,23]. The practical research of urban residential space was mostly related to practical issues such as energy, economic society, ethnic and economic system influencing factors, which can diversify the research perspectives and deepen the content. For example, there were studies on the impact of residential buildings and urban forms on energy consumption, the compactness of urban forms affected urban traffic, energy, and the formation of urban heat islands [24,25]. Residential space differentiation characteristics and suburbanization of different income groups, segregation in urban poverty-stricken areas, and mixed living conditions among different races had also been studied [26,27,28,29,30,31]. The evolution of world urban networks, urban shrinkage, and spatial evolution of human settlements are also hot spots by scholars [32,33,34,35,36,37,38,39]. With the rapid development of science and technology, data collection is more extensive, such as questionnaires, night light data, land cover data, real estate network data, etc. Research methods are gradually diversified, such as principal component analysis, structural equation model, spatial measurement model, etc. Scholars have conducted a large number of empirical studies on the status quo of spatial layout, evolution processes, spatial differentiation, spatial expansion, and driving mechanism through multiple technical means and multi-data fusion [40,41,42,43].
China’s political and economic system is in a period of transformation, shifting from a socialist planned economy to a socialist market-oriented economy. The housing system has gradually shifted from “a plan” to “a market”. The expansion and evolution of residential space closely revolve around the housing system. Due to the derailment of the economic system and marketization, the Northeast China development was once in trouble [44]. Shenyang, the capital of Liaoning Province, is one of the national heavy industrial bases mainly built by the state in the early days of the founding of the People’s Republic of China and is an important central city in Northeast China [45]. As a typical megacity in China, Shenyang is the only megacity in China’s Bohai Rim region and the three northeastern provinces. It has invested heavily in the real estate market in recent years, and the urban space has been sprawling disorderly, which has kept housing prices at a relatively low level among cities of the same scale, which indicates unreasonable problems in its residential space structure. Therefore, it is particularly important to reveal and summarize the expansion mechanism of residential space in megacities. Shenyang is currently experiencing urban development challenges combining internal and external renewal. Research in this area is very typical and representative. Clarifying the evolution mode and driving mechanism of the expansion of residential space in Shenyang City in the new development period is of great practical significance for exploring the sustainable development of residential space in megacities around the world.
2. Study Area and Data
2.1. Study Area
Shenyang is located in the central part of Liaoning Province, in the transition zone between Changbai Mountain and the Liaohe River alluvial plain [46]. It covers an area of 12,948 km2 and is rich in water resources, belonging to two major water systems, namely Liaohe River and Hun River. The terrain is flat, the east and north are mostly hilly mountains. The overall terrain has a trend of sloping from northeast to southwest and both sides to the middle. There is a temperate semi-humid continental climate with four distinct seasons [47]. By the end of 2019, Shenyang had a permanent resident population of 8.322 million and an urbanization rate of 81%. In 2019, the GDP of the region was 647.93 billion CNY. Referring to the definition of a central city in Shenyang City Master Plan (2011–2020), this study limited its research scope within the fourth ring road of Shenyang, including nine districts: Tiexi, Dadong, Heping, Shenhe, Huanggu, Sujiatun, Yuhong, Shenbei New, and Hunnan Districts, covering an area of approximately 1545 km2 (Figure 1).
Due to its basic plain terrain features, Shenyang has had a spatial form reflecting an inner square and outer circle since ancient times. Shenyang was positioned as an industrial city, the railway runs through the city center, and each functional interval is distinctly separated. In the urban fringe area, after successive measures, such as the expansion of the industrial park and workers village, promoting a large agglomeration and transfer of population, planning layout structure across the river development, which has greatly extended and changed the living space.
2.2. Data Source
The residence data from nine districts of Shenyang was collected on 31 December 2018, including the administrative district, business district, completion time, property, and real estate development companies, the average price of housing, number of buildings, building type, and longitude and latitude. 2768 samples were obtained. After data cleaning and correction, 2255 sets of valid data were filtered out. ArcGIS10.2 was used for spatial processing of other basic elements, and classification and registration were supervised by remote sensing images (Table 1).
3. Models and Methods
3.1. Spatially Extended Feature Model
3.1.1. Classification Standard of Residential Community Form
Previous studies on residential space differentiation are mainly based on housing price or property right type. However, with the reform of the housing system and the growth of the national economy, people are no longer concerned about whether they have a place to live in, but about living more comfortably and improving their quality of life. During residential space expansion in Shenyang, studying the residential form can directly reflect the development quality of each stage, help the rational layout of the city, and provide a deeper understanding of the construction characteristics of each administrative unit. This study referenced the classification method by Sun, combined with five elements: district closure, property right years, building structure, property type, and building volume ratio [48]. The residential district form was divided into five categories: dispersed communities, single closed communities, villas, mixed communities, and integrated commercial and residential communities (Table 2).
3.1.2. Spatial Expansion Intensity Index
In the study of the driving factors affecting the expansion of residential space, the spatial expansion intensity index was introduced. Current research on urban spatial expansion mainly obtains the spatial growth area in different periods through remote sensing image processing and calculates the land expansion speed or land expansion intensity, to compare the temporal differences [49,50]. This method was used to calculate the annual expansion intensity index by selecting the number of newly added communities as the basic data, which reflects the evolution process of residential space expansion in the study area over time. The index refers to the percentage of the number of newly added residential communities to the total number of the overall residential communities in a certain spatial unit during the study period, and the formula is as follows:
where βi,t−t+n represents the expansion strength index during the study period of t to t+n within the study unit of i; Ni,t, Ni,t−1 represent the number of existing residential communities in i spatial unit in year t, year t−1, and Ni represents the total number of the overall residential communities in i unit; t represents the research year, and i represents the research spatial unit. In this study, Shenyang as the research unit (i), and 15 years (n) as the research period.
3.1.3. Kernel Density Estimation Method
The kernel density estimation method solves the distribution density of the residential space according to the point dataset of the residential district [51,52,53]. The spatial distribution characteristics of the data were studied starting from the kernel density estimation sample itself. This method mainly calculates the magnitude value of each unit area according to the data point elements of the residential district and fits each point or broken line into a smooth cone surface. Let the random sample points X1... Xn distribute in the density function f and estimate the function value f(x) at point X. The Rosenblatt Parzen kernel is usually used to estimate:
K is the kernel function, h is the bandwidth, and h > 0; n is the sample number; (x-xi) represents the distance between the estimated point x and the sample xi. By using ArcGIS to conduct spatial interpolation analysis on the obtained function values, the location, shape, and ductility of the distribution of each housing type can be clearly and intuitively obtained. Among them, different h bandwidths caused different results. This study determined the bandwidth to be 1000 m after several tests and calculations, which is consistent with the spatial pattern of the residential community.
3.1.4. Multi-Distance Spatial Clustering Analysis
The spatial clustering pattern of the point elements in the residential community changed with the change in scale, which is a distance-based technique based on dispersity. It is widely used because it can effectively solve the dependence of the spatial agglomeration pattern on the scale. This study used Ripley’s k function to study the spatial distribution pattern and laws of different housing types in nine districts of Shenyang [54,55]. Ripley’s K(d) estimation function is:
where d is the spatial scale, A represents the area of the study area, n represents the number of communities, and wij(d) is the weight. If the distance between point i and point j within the range of d is ≤d, the value is 1; if the distance is >1, the value is 0.
The simulation method was adopted, and the calculation results were compared with the random distribution model (CSR) obtained by simulation. Under this formula, the obtained function K(d) is the observed value of K, and the expected value of K is d. If the observed value of K is greater than the expected value of K, then the spatial distribution clustering degree of this type of community in Shenyang is higher. If the observed value of K is less than the expected value of K, the spatial dispersion of this type of community is stronger. If the observed value of K is greater than the confidence interval of the high value, then this type of community has a significant agglomeration. If the observed value of K is less than the confidence interval of the low value, then this type of community has significant dispersion.
3.2. Driving Force Analysis Model
3.2.1. Driving Factors Selection
During the selection of indicators, the factors that have a greater impact on the expansion of residential space were summarized. Residential space evolution was the result of the joint action of several aspects. The policy support of the state and the overall planning of the government guide social behavior. Real estate development enterprises built the housing and responded to the housing development behavior through macro-control. Moreover, the overall economic situation of the city also affected the change in population structure and individual consumption behavior. Social behavior is an intermediate process between policy and planning.
From macro and micro perspectives, supply-side and demand-side, the influencing factors were screened by six driving factors: policy, planning, economy, population, the housing market, and transportation externality [56,57,58,59]. The panel data of Shenyang from 2002 to 2017 was selected, and all the data were from the Shenyang Yearbook (2002–2018) provided by Shenyang Statistical Information Network (Table 3).
Engel’s coefficient is the ratio of per capita consumption of food, tobacco, and alcohol to current consumption expenditure. The ratio of per capita income to expenditure is the ratio of per capita annual income to per capita consumption; the urbanization rate is the proportion of the urban population to total population; residential development efficiency is the proportion of the construction area to the completed area in the real estate development of the year, and the rate of return on residential investment and construction is the proportion of residential sales and completed value in real estate development.
3.2.2. Multiple Linear Regression Analysis Based on PCA
In the study of practical problems of urban development, the change in an urban phenomenon is often determined by the influence of several factors. In this case, two or more influential factors must be used as independent variables to explain the change in dependent variables. When multiple independent variables have a linear relationship with the dependent variable, multiple linear regression analysis is performed; therefore, to explore the driving force of residential space evolution in Shenyang, a multiple linear regression analysis method was conducted [60,61].
where β represents the expansion strength index; X1,X2,...,Xn represent the driving factors; α1,α2,...,αn represent the importance degree of driving factors; D is the constant.
Due to the large number of impact factors selected in this study, principal component analysis (PCA) was used to reduce the dimensionality of these factors first and extract the main driving factors with greater impact.
4. Results
4.1. Evolution Stage and Characteristics of Residential Spatial Pattern in Shenyang
Shenyang’s existing residences were first built in 1989. From 1989 to 2018, the number of residences continued to increase, and the incremental amount differed in different stages. According to the trend and characteristics, with an annual increase of 50 residences and 100 residences as a cut-off point, residential space expansion in Shenyang was divided into four stages: (1) slow development (1989–1994), (2) rapid expansion (1995–2003), (3) high-speed development (2004–2013), and (4) stable extension (2014–2018) (Figure 2). The distribution characteristic was shown in Figure 3.
Slow development stage: here, a total of 75 new communities were built, and most were built after 1992, indicating that the demolition work in Shenyang was carried out well. The residential areas were mainly located in Shenhe District, followed by Heping and Huanggu Districts. There were no new residential areas in Shenbei New and Hunnan Districts in this stage. The plot distribution was not uniform, and the overall spatial distribution was the pattern of “one core, one ring, and one point”. The “One Core” was the high-density area, extending from northwest to southeast, and was mainly located in the center of Shenyang Railway Station, Shenyang North Railway Station, and Huanggutun Railway Station. "Yihuan" was the position between the first ring and the second ring and was distributed in a concentric ring, extending farther in the east-west direction than in the north-south direction, with a long history of construction. “One point” refers to the Sujiatun that had formed an independent residential area, which was farther from the main urban area. During this period, Shenyang developed to the west, north, and south, with a slightly longer distance from east to west. This is because, during this period, Shenyang’s export-oriented economy pushed the city into the stage of overall scale expansion (Figure 3a).
Rapid expansion stage: There were 656 new communities built in this stage, 8.7 times that of the previous stage. Shenhe District was still the administrative unit with the most newly built communities, and the increase was different from other districts. Shenhe, Heping, Huanggu, Tiexi, and Dadong Districts were still the center of residential district construction. The new communities of Hunnan and Shenbei New Districts were built around 2000 with good development; while Sujiatun District had relatively weak development power and the total increase is small. Regarding spatial distribution, the city expanded outward from the core in this period. The expansion mode was a linear extension of the main roads with low density, and the filling development was still dominated by the old city. The overall pattern was a ring-radial combination. The eastern part of the First Ring Road and the southern part of the Second Ring Road were still the focus of the construction, with a concentration in the center. The city mainly expanded to the north, south, northeast-southwest, and southeast, along both sides of the main road, albeit on a small scale. The universities originally located in the core area of Shenyang responded to the call of the government, moved to the Shenbei New District and Hunnan New District, forming the present Shenbei University Town and Hunnan University Town (Figure 3b).
High-speed development stage: During this period, with the improvement of urban space, the real estate industry in Shenyang developed rapidly, and the total number of residential areas was 1.7 times that of the last stage. The number of new residential areas in Tiexi District was significantly different from that of other districts. The number of residential areas in Yuhong and Hunnan New Districts increased rapidly. Regarding the spatial distribution, the external expansion of Shenyang during this period was rapid, and the area of living space greatly increased, extending to the third ring road, areas beyond the third ring road the north and south, and east and west in a cross shape. The north-south direction reflected gradual expansion from Huanggu District to the north of Shenbei New District. The southern Sujiatun District gradually became closer to the main urban area and was connected with Hunnan District. In the east-west direction, the Tiexi Economic Development Zone, Tiexi New District, Yuhong District, and other places built a large number of new communities, extending to the west and southwest. Furthermore, the east also expanded along the two sides of the Hunhe River to form a strip symmetrical distribution. Additionally, villas were constructed around Qipanshan Scenic Area in the northeast area, and high-grade residential buildings began to form in the areas with a good ecological environment. The establishment of the airport formed a linear residential layout pattern along the road from the main urban area to the airport (Figure 3c).
Stable extension stage: during this stage, every year, the number of new residential communities was effectively controlled, there were fewer new main urban areas, and the main construction was in Hunnan District. At this stage, the residential space in Shenyang followed the polycentric distribution pattern of “one main body and four secondary bodies”. With the relocation of Shenyang municipal government, Shenyang Olympic Sports Center, the establishment of several large businesses, and the completion of the main road, the new Hunnan New District began to attract developers’ investment, and residential living space was transferred. Sujiatun District is connected with Hunnan District, along each of Hun River, forming a unique urban landscape, and forming more high-grade new urban complexes. In Puhe New Town, because of the attraction of several large amusement parks, such as Font Joy World and Seven Star Sea World Theme Park, the north exhibition continued based on the original living space on both sides of the Puhe River. Since the northwest formed a regional logistics and trade base and equipment manufacturing industry base, it also drove the reintegration of residential space in Yuhong District. To realize new-type urbanization and achieve urban-rural integration, new-type urban construction around cities was distributed in points. Traffic was the main factor affecting the expansion of residential space in this stage. The construction of Shenyang South Railway Station, East Railway Station, and the Fourth Ring Road, expressways to surrounding cities were gradually improved, all of which drove the orderly expansion of residential space in Shenyang (Figure 3d).
4.2. Current Residential Space Distribution Pattern in Shenyang
After four urban planning, the overall urban layout and distribution of various types of land are becoming more and more perfect. The overall layout of the living space has obvious agglomeration characteristics, and the single-center phenomenon is still obvious and closely related to the distribution of underground traffic lines (Figure 4).
The high-value region of the core density was a hollow ring, which gradually decreased to the periphery and the interior; there were multiple secondary core density centers in the east-west and northeast-southwest directions, among which the east-west direction expansion was stronger and the northeast-southwest direction expanded farther. The two sides of the Hunhe River had axisymmetric zonal distribution.
Core high-value area: the two high-value areas were Tiexi Square and Youth Street, which are located on the east and west sides of the ring, respectively, and are symmetrically distributed. This form was closely related to the construction of Metro Line 1 and was the result of the coordination between traffic and residential space construction; Metro Line 1 fully opened in 2010. In the early stage, the site selection must be combined with the existing densely inhabited areas, and the opening of the subway motivates the development of the surrounding communities, making the living space more concentrated. To the east, it is connected with commercial areas such as Zhongjie, Joy City, Huaiyuan Men, and other historical and cultural protection areas. The west connects Tiexi Plaza, Yuhong Plaza, Wanda Plaza, and other central CBD areas, and gradually extends to the Developing Avenue, Industrial Development Zone such as Zhang Industrial Zone, all of which are densely populated areas and high - density urban buildings. It has convenient transportation facilities and relatively compact living spaces. Several core areas were formed along the line. The construction of subway line 2 was distributed in a north–south direction, mainly to connect Shenbei New District and Hunnan New District, drive the development of the two new districts, and accelerate population flow.
Low center area: located in the urban area in the middle of Beijing and Harbin road, near three around the railway stations, namely Shenyang, Shenyang North, and Huanggu District railway stations, and rail tracks across the city center. Therefore, the internal form of the core of the triangle kernel density value was low; it also benefited from overall planning and layout and urban renewal projects, etc.
The axisymmetric zone distribution on both sides of the Hunnan River: with the continuous attention of the municipal government to the ecological environment and to create a livable Hunnan New City, the landscape was optimized on both sides of the Hunnan River and additional development was conducted on the Hunnan District in the heyday. This caused substantial migration to the south bank of the Hunhe River. Cluster areas had been formed on both sides.
Group distribution of peripheral new towns: the tilt of planning policy significantly improved the development of the four sub-cities. With the development of the industry, Puhe New City in the north, Tiexi West Industrial New City in the west, Hunhe New City in the south of Hunnan District, and Yong’an New City in the northwest of Yuhong District also obtained the surrounding resources and population flows.
4.3. Characteristics of Various Types of Residential Forms
The order of residential forms in Shenyang was as follows: single closed communities (1031, 45.72%) > mixed communities (615, 27.27%) > dispersed communities (465, 20.62%) > integrated commercial and residential communities (79, 3.50%) > villas (65, 2.88%), indicating that the quality of residential communities in Shenyang is generally high, and most are single enclosed communities with obvious differentiation in living space.
Regarding the development stage: in the slow development stage, the new residential buildings were mainly dispersed communities. Single closed communities, mixed communities, and villas appeared. At this time, there was no integrated commercial or residential community. During the rapid expansion stage, dispersed communities still dominated; however, the number of single closed communities increased significantly, while integrated commercial and residential communities also appeared, and villas began growing slowly. In the high-speed development stage, the single enclosed community was the main type of residence. Along with the construction of mixed communities, the dispersed community gradually faded out of the historical stage, and the new number of integrated commercial and residential communities exceeded the new number of villas. In the stable extension stage, the construction of dispersed residential areas stopped, and this kind of form was replaced by other residential areas. The new number of single closed communities and mixed communities was equal, and the construction of villas and integrated commercial and residential communities slowed.
From the perspective of each administrative unit, Shenhe District was the only district in which there were more dispersed communities than single closed communities, indicating that the overall construction of Shenhe District has a long history and the urban construction work must be improved. Moreover, Shenhe District had more integrated commercial and residential communities, which is closely related to the financial center and other CBD core business districts in this area. The number of single closed communities in Tiexi District was more than that in other districts, which is associated with the vigorous planning and development work later. The overall building age was relatively young. The distribution of Taiyuan Street, Tiexi Square, and Wanda Plaza promoted the concentration of residential space in Tiexi District, and the integrated commercial and residential communities in Tiexi District were the largest among the five old districts. The residential forms of Heping, Huanggu, and Dadong Districts were similar. Regarding the number of residential areas, the number of single closed communities was the highest, followed by dispersed communities and mixed communities. Furthermore, the number of villas and integrated commercial and residential communities was lower, which is a common feature of the old city. Yuhong District developed later than the five districts of the old city, and the single closed and mixed communities occupied the main position in the number. The number of single closed and mixed communities in Hunnan District was more, which is closely related to the construction of infrastructure. The villas and integrated commercial and residential communities dominated in several districts, which is closely related to its excellent natural environment, convenient traffic conditions, and the settlement of several large commercial supermarkets. The development of the Shenbei New District was relatively slow, while Sujiatun District built new residential areas based on the original old city, with fewer villas and integrated commercial and residential communities (Figure 5).
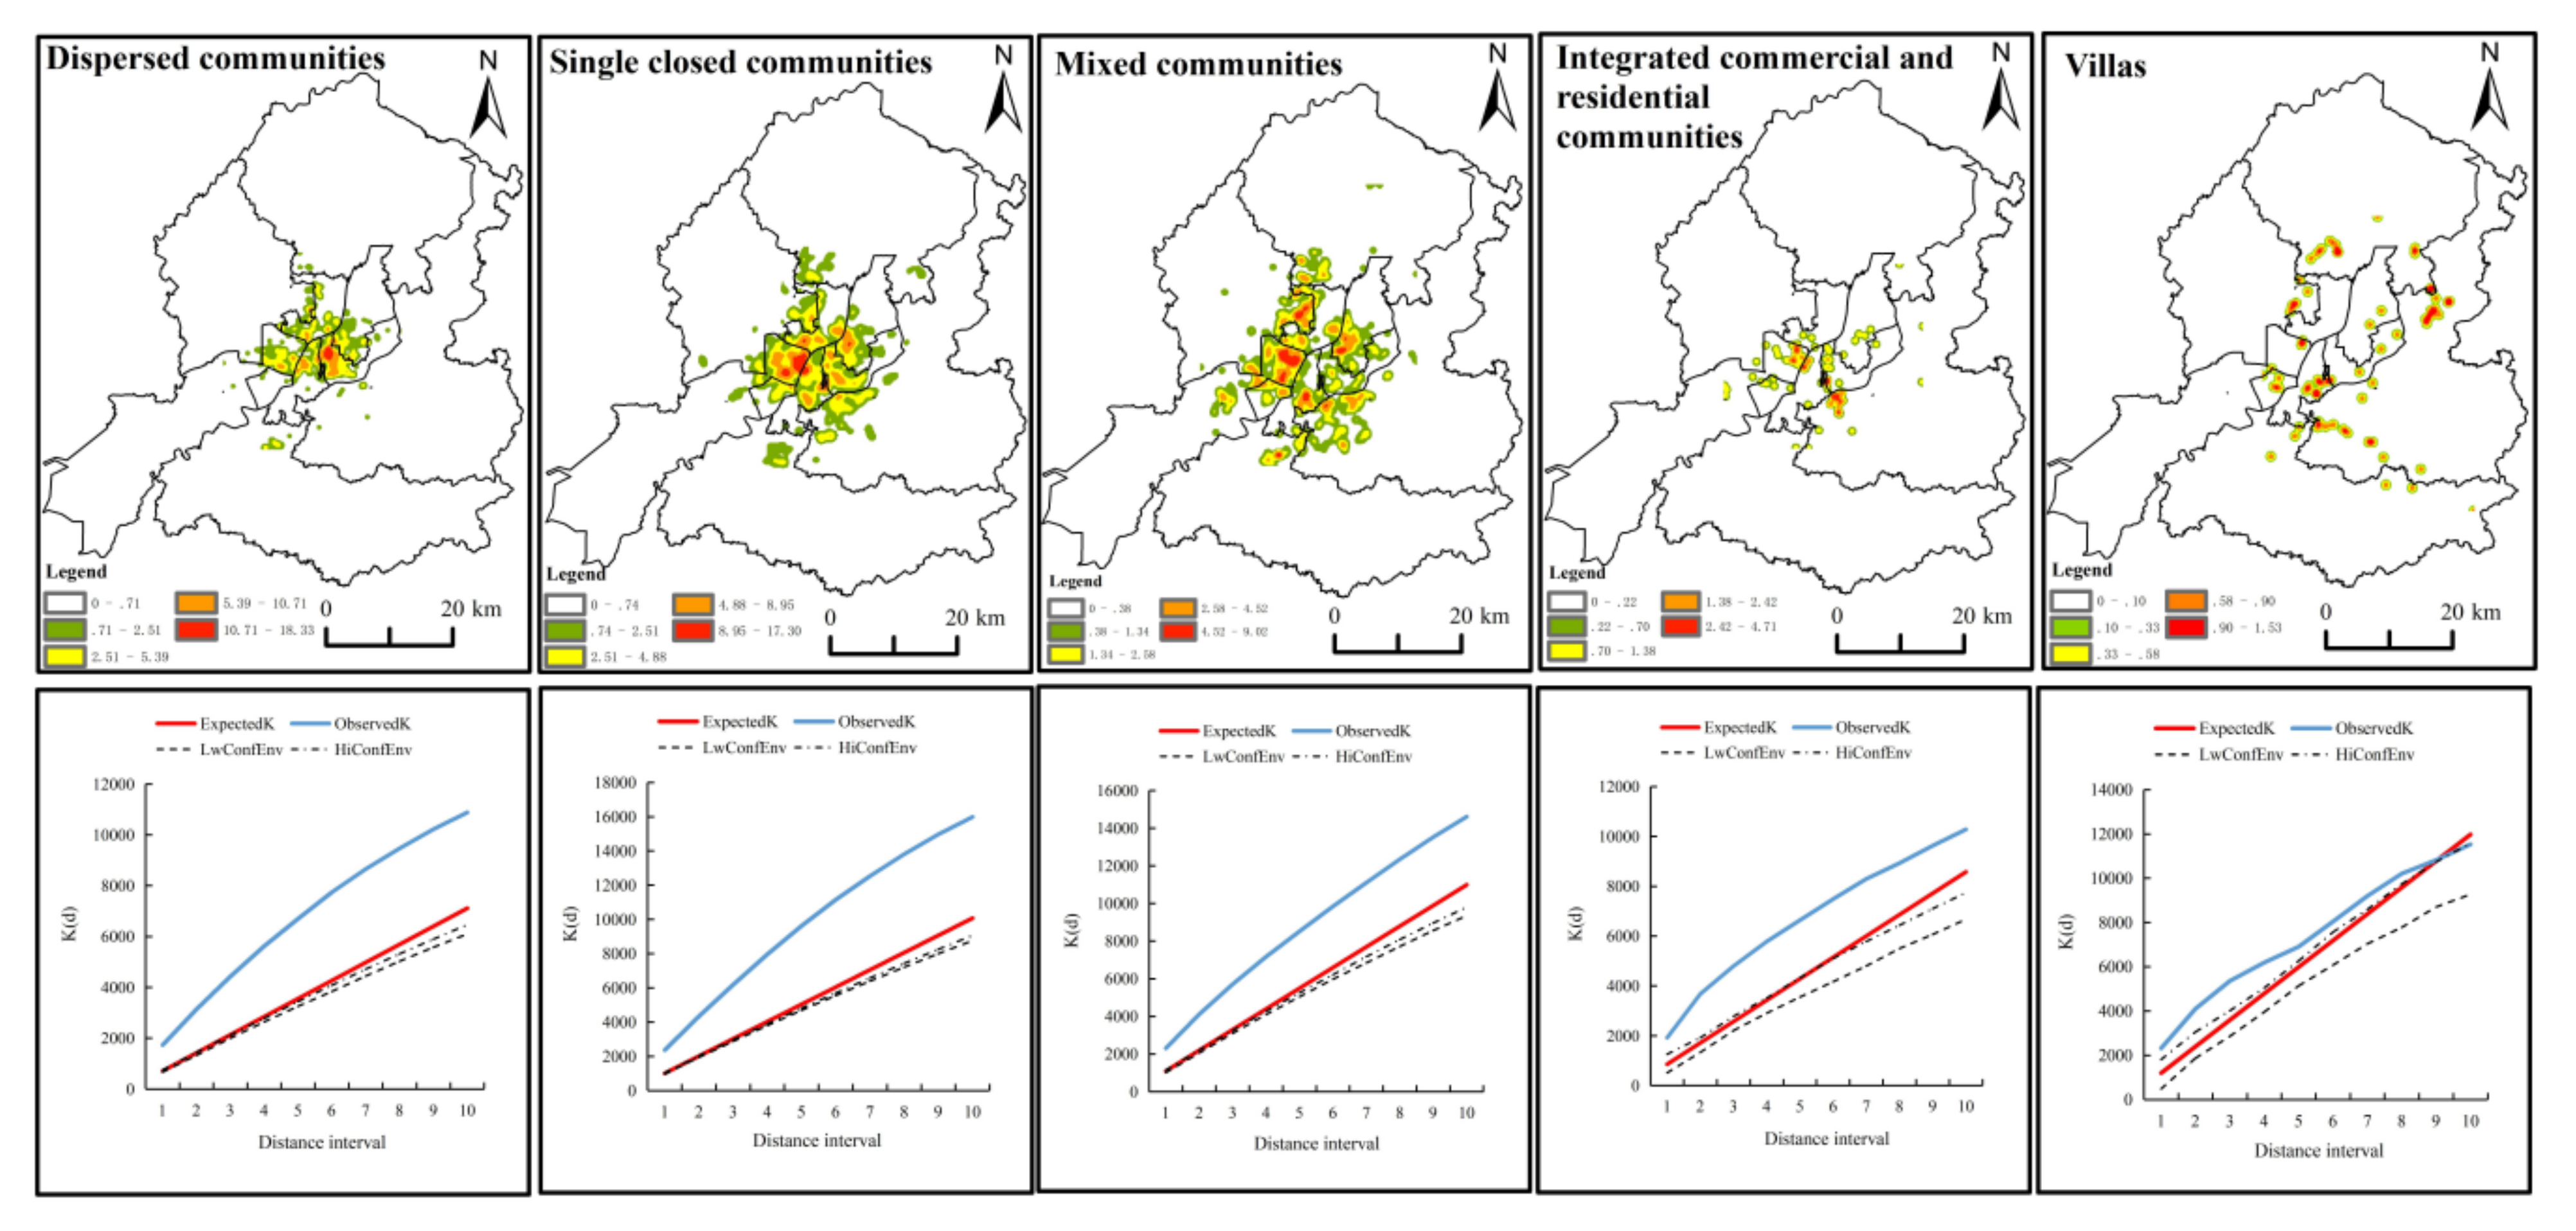
From the perspective of residential forms: (1) Agglomeration: according to the results of the multi-distance spatial clustering analysis, several residential forms show agglomeration characteristics on the short distance scales. With the increase in scale, the agglomeration characteristics of dispersed communities and single closed communities becoming more obvious, the concentrating effect of mixed communities and integrated commercial and residential communities basic remains unchanged. However, the villa was gradually transformed from agglomeration in close scale, uniform distribution in medium-distance scale to dispersion in long-distance scale. These cluster analyses passed 99% confidence intervals. (2) Regarding the distribution area, the distribution shapes of dispersed, single closed, and mixed communities were similar; however, the dispersed communities were distributed within the second ring road area, with fewer surrounding areas and a smaller area. The distribution area of the single closed communities was larger than that of the former, and it was mainly distributed within the second ring road; however, it extended more around. Mixed communities had the largest area, and the distribution was more scattered than dispersed and single closed communities. There were fewer areas of integrated commercial and residential communities and villas, with a center or surrounding scattered distribution. (3) Regarding distribution characteristics, the high-density area of the dispersed communities was mainly located in Shenhe District, showing a mononuclear distribution. The high-density area of the single closed community was located in Tiexi District and formed a cluster distribution of several small clusters. The overall range of the mixed communities was relatively dispersed, forming multiple high-value areas of core density, which were evenly distributed and had a multi-core distribution. The linear pattern of integrated commercial and residential communities was the most obvious, extending along subway line 1 to the east and west, and extending along subway line 2 to the south, showing a T-shaped distribution. Villas were distributed around the second ring road in the periphery of the main city distribution, showing suburbanization; its distribution depended on the northeast Qipan Mountain Scenic Area and the suburban radial main road distribution (Figure 6).
4.4. Driving Forces of Residential Space Evolution Based on Multiple Linear Regression
To ensure the accuracy and validity of the data, the 18 impact factors from 2002 to 2017 were preprocessed by range standardization. According to eigenvalues >1 as the basis for the selection of the main component, three principal components were selected. The cumulative variance contribution rate of variance reached 94.67%, which can reflect the characteristics of the original 18 variables, which was enough to reflect the expression in the original data (Table 4).
The principal component load matrix can explain the relationship between each principal component and the associated variables. The greater a load of each index in the principal component, the more able to characterize the characteristics of the index variable. The main characteristic factors in the first main component: permanent resident population(X11), road length(X17), urbanization rate(X12), total floor area of housing per capita(X10). It reflected the population characteristic, the status quo of economic development, and transportation. It can be summarized as the residents’ behavior. The second main component included expenditure on urban and rural community public facilities(X3) and Engel coefficient(X7), reflecting the planning and economic development. It can be summed up as government functions. The third main component included total tax revenue(X2), reflecting the national policy impact (Table 5).
The spatial expansion intensity index was used as the dependent variable Y, FAC1_1, FAC2_1, and FAC3_1 were the independent variables. Use the “linear” in the SPSS “regression analysis” to perform multiple linear regression analysis. After calculation, R2 = 0.991. The Durbin–Watson test was used to test the independence of the model residuals, DW = 1.578. The value of DW was in the range without autocorrelation. Therefore, the residual independence was determined and passed the test, with a significance level of 0.013∈ (0.01, 0.05). It indicated that it passed the 0.05 significance test but failed the 0.01 significance test, demonstrating that the regression model has significant statistical significance. The linear relationship between the expansion strength index and the three principal components was significant. The various regression coefficient results are shown in Table 6.
The significance values were all less than 0.05, indicating that the regression coefficients B were present and significant. The regression linear equation of this model can be obtained as follows:
Since the coefficient of the second principal component in the formula was relatively large (0.815). It indicated that the second principal component had a greater correlation with β. That is, planning and urban economic development have a greater impact on the intensity of urban expansion. Based on the prediction of this model, the spatial expansion intensity in 2018 was 2.933–5.213, while the actual spatial expansion index in 2018 was 3.104∈ (2.933, 5.213). The actual value was consistent with the predicted results, indicating that the accuracy of this statistical model was high (Table 7).
The results show that Engel’s coefficient, urban and rural community expenditure on public facilities, and fixed asset investment are the three primary factors affecting urban expansion intensity, which correspond to planning and economic development which are the two primary driving factors affecting urban expansion. Meanwhile, other factors have a relatively small influence. Urban planning is the main driving force affecting the expansion of residential space. It guides real estate enterprises and residents to choose residential space by combining the overall development direction of the country. Economic strength is an important basis for the construction of urban vitality.
5. Discussion
5.1. Findings
The continuous optimization of residential space is an important content to improve the quality of urban human settlements. Shenyang is the only megacity in Northeast China, located in the old industrial heartland. It is of great research significance to grasp the evolution model of its overall residential space, grasp the actual problems that its residential space needs to solve, and put forward specific optimization opinions. It is not only an exploration of the development characteristics of urban residential space itself but also a supplement to the research on the development process of megacities in developing countries. Compared with existing research results in the world, the spatial expansion of megacities is mostly in developing countries, mainly in Asia and Africa. In developed countries, this phenomenon rarely exists, such as Europe, Oceania, and North America [62]. Many scholars raise that urban problems are due to urban expansion and urbanization, such as the sacrifice of green land and farmland, and the deterioration of climatic conditions [6]. However, some scholars have proposed that in the process of urban development, if orderly planning and reasonable ecological protection are obtained, and resource waste is reduced, then it can also be defined as the sustainable development of human society [63]. Studies have shown that economic development is the main driving force for urban expansion [5,33]. Areas with relatively good economic development develop faster, while areas with less economic development are mainly still filled open spaces within boundaries. At the same time, rates of urban expansion in most developing countries are greatly affected by the structural transformation of societies [64,65,66]. According to the results of this study, Shenyang’s residential space expansion characteristics are also closely related to China’s economic system reform, and it is undergoing a transition from a planned economy to a market economy, which has greatly expanded the residential space. At the same time, as the capital of Liaoning Province, the urbanization of Shenyang has accelerated. It has realized the importance of orderly expansion and sustainable development. Over the past 40 years, there has been a continuous transformation of Shenyang, from the initial center to the surrounding disorderly spread, to the later planning of industrial, commercial, university town, economic, and technological development zones, and other multi-core cluster modes. It has been in the stage of transition from boundary expansion to internal filling. With the development of the city, the overall residential space in Shenyang has higher vitality and potential. All these indicate that compared with other megacities, Shenyang has made beneficial control and exploration in the overall development of the city.
In this study, we found that economic development and urban planning are the primary driving forces for the intensity of residential space expansion. The development of residential space cannot be separated from the macro-control and micro-transformation of government department planning. The stable development of an urban economy, the guarantee of per capita income, and improvement of consumption level can improve people’s willingness to choose a living environment and promote the improvement of living quality and development of the real estate. Moreover, the change of population number and structure, accessibility of traffic layout, the regulation of the real estate market, and national policy support will have a direct or indirect impact on the residential space in terms of supply and demand. At the same time, the research also carried out an in-depth analysis based on the five planning documents of Shenyang City’s urban space and found that the results of this paper are consistent with the overall planning direction of Shenyang City.
In the process of development, there were several problems, such as a waste of energy, land, and public resources and an oversupply of housing. Smart growth and intensive use were gradually integrated into urban planning. According to the research results, there are still three practical problems in the development process of residential space in Shenyang: crowded roads, obvious monopolization, and the small green coverage rate of built-up areas. The specific optimization suggestions are as follows: to guide the transfer of the residential population to the sub-cities, to form a complete high-speed road system as soon as possible, and to strengthen the emphasis on ecological construction. The control of residential space in Shenyang should give full play to the government’s macro-control ability, weaken the phenomenon of single-polarization and obvious circle structure, and reconstruct old residential areas. Urban construction work should give full consideration to the livability of residents, improve the quality of the living environment, enhance the happiness of residents. It should improve the construction of infrastructure, promote the equal development of the city, and improve the fairness of urban areas. In future development, planning and economic development should be coordinated to jointly promote the high-quality development of urban residential space.
5.2. Contributions
The evolution model of residential space in China has unique Chinese characteristics. It is not appropriate to directly quote the basic hypothetical theories of western countries. There are few theoretical studies on this in China, and the system is not perfect enough. Firstly, due to the difficulties in collecting historical data, most of the research is based on housing statistics obtained from historical materials such as census data [67], statistical yearbook data, real estate information magazines, newspapers, and city chronicles [68]. With the further strengthening of technology, remote sensing data of land use in interval years was introduced [69]. The acquisition method cannot be unified and the data lacks continuity, so research can only be conducted through limited data. This research mainly uses the data of existing residential quarters to analyze the development process and status quo of residential space in Shenyang in recent years. Although the use of newly added data each year cannot reflect the overall picture of the urban residential space at that time, the urban planning process and direction information can be analyzed at the location of the newly added communities. Divide the development stages according to the characteristics of the number of newly-added communities, describe the change process in different stages, and describe the dynamic evolution expansion process of residential space structure.
At the same time, in the qualitative description and analysis of the current situation of the spatial structure, the evolution law of the housing form is introduced. Different levels of cities have different phenomena at different development stages, and it is difficult to have a unified theoretical model for their evolution laws. Existing morphological studies mostly classify residential space according to single factors such as land use type or building attributes, such as property type [70], floor area ratio [41], housing price [71], and lack of specific analysis of residential morphology. The research describes the differentiation characteristics and structural changes of the urban residential space form and analyzes the overall residential space evolution in Shenyang qualitatively and quantitatively. Based on this, the study enriches and expands the theory of urban space through practical research, and furthers the theoretical research on the evolution mechanism of the urban residential space structure in China.
5.3. Limitation
Due to the difficulty of accurately obtaining historical data and the lack of long-term quantitative research, the comparative analysis should be strengthened in future research. Moreover, more effective methods should be used to refine the research on the differences in the driving factors of the expansion of residential space in various regions in future studies.
6. Conclusions
In this study, the characteristics of urban residential space evolution in Shenyang were the research object. Based on the data of newly added residential from 1989 to 2018, the spatiotemporal characteristics of Shenyang were analyzed using various spatial analysis methods in ArcGIS and classified according to residential area morphology. The overall internal characteristics and existing residential differentiation phenomenon of Shenyang were described in detail. Finally, principal component analysis and multiple linear regression analysis were used to explore the driving mechanism affecting the intensity of urban residential space expansion in Shenyang. The following conclusions were obtained:
(1) From to 1989–2018, Shenyang experienced four stages of slow development, rapid expansion, high-speed expansion, and stable spread. In the process of evolution, the main scope expanded continuously, the circle structure continuously improved, spatial heterogeneity increased, and morphology had obvious spatial agglomeration features.
(2) The number of residential areas among administrative units in Shenyang was different. The residential space of the whole city was large and distributed in a cross-shaped multi-core group. However, there was still a generally circular structure, and according to the results of the standard deviation ellipse, the length from the northeast to southwest of the city is larger than that from the northwest to southeast.
(3) Based on the basic properties of residential areas, the residential areas were classified into five categories: dispersed communities, single closed communities, mixed communities, integrated commercial and residential communities, and villas, and each residential form had a different degree of spatial agglomeration. The distribution of dispersed communities was mononuclear. The single closed communities are distributed with Tiexi Square as the single core multi-group. Mixed communities were more uniform, showing a multi-core distribution. The integrated commercial and residential buildings were distributed along the subway line in a “T” shape. Villas were mainly distributed in the vicinity of the Qipan Mountain Scenic Area or around the periphery of the main urban area, and the phenomenon of suburbanization was obvious.
(4) Selecting 18 indicators as driving factors and using a multiple linear regression model to analyze the spatial expansion intensity index of Shenyang from 2002 to 2017, it was shown that this theoretical model has a good explanatory ability. According to the influence of each factor on the spatial expansion intensity, six driving factors were ranked in order: urban planning > economic strength > population > transportation > housing market > national policy.
Author Contributions
Conceptualization, X.L.; methodology, H.S.; software, H.S.; validation, H.S., Y.G. and S.T.; formal analysis, H.S.; investigation, H.L.; resources, H.S.; data curation, H.S.; writing—original draft preparation, H.S.; writing—review and editing, X.L.; visualization, H.S.; supervision, X.L.; project administration, X.L.; funding acquisition, X.L. All authors have read and agreed to the published version of the manuscript.
Funding
This research was funded by the National Natural Science Foundation of China (Grant no. 41671158).
Data Availability Statement
The primary data used to support the findings of this study are available from the corresponding author upon request.
Conflicts of Interest
The authors declare no conflict of interest.
References
- Weimann, A.; Kabane, N.; Jooste, T.; Hawkridge, A.; Smit, W.; Oni, T. Health through human settlements: Investigating policymakers’ perceptions of human settlement action for population health improvement in urban South Africa. Habitat. Int. 2020, 103, 102203. [Google Scholar] [CrossRef]
- Wang, Y.; Jin, C.; Lu, M.; Lu, Y. Assessing the suitability of regional human settlements environment from a different preferences perspective: A case study of Zhejiang Province, China. Habitat. Int. 2017, 70, 1–12. [Google Scholar] [CrossRef]
- Li, G.; Fang, C.; Qi, W. Different effects of human settlements changes on landscape fragmentation in China: Evidence from grid cell. Ecol. Indic. 2021, 129, 107927. [Google Scholar] [CrossRef]
- Li, C.; Wu, K.; Gao, X. Manufacturing industry agglomeration and spatial clustering: Evidence from Hebei Province, China. Environ. Dev. Sustain. 2020, 22, 2941–2965. [Google Scholar] [CrossRef]
- Yeh, A.G.; Chen, Z. From cities to super mega city regions in China in a new wave of urbanisation and economic transition: Issues and challenges. Urban Stud. 2020, 57, 636–654. [Google Scholar] [CrossRef]
- Matsa, M.; Mupepi, O.; Musasa, T. Spatio-temporal analysis of urban area expansion in Zimbabwe between 1990 and 2020: The case of Gweru city. Environ. Chall. 2021, 4, 100141. [Google Scholar] [CrossRef]
- Wang, M.; Feng, C. The inequality of China’s regional residential CO2 emissions. Sustain. Prod. Consum. 2021, 27, 2047–2057. [Google Scholar] [CrossRef]
- Yang, J.; Wang, Y.; Xiu, C.; Xiao, X.; Xia, J.; Jin, C. Optimizing local climate zones to mitigate urban heat island effect in human settlements. J. Clean. Prod. 2020, 275, 123767. [Google Scholar] [CrossRef]
- Mao, S.; Chen, J. Residential Mobility and Post-Move Community Satisfaction: Empirical Evidence from Guangzhou, China. Land 2021, 10, 741. [Google Scholar] [CrossRef]
- Luo, X.; Yang, J.; Sun, W.; He, B. Suitability of human settlements in mountainous areas from the perspective of ventilation: A case study of the main urban area of Chongqing. J. Clean. Prod. 2021, 310, 127467. [Google Scholar] [CrossRef]
- Yang, J.; Yang, Y.; Sun, D.; Jin, C.; Xiao, X. Influence of urban morphological characteristics on thermal environment. Sustain. Cities Soc. 2021, 103045. [Google Scholar] [CrossRef]
- Kim, J.H.; Li, X. Building more housing near transit: A spatial analysis of residential densification dynamics. Transport. Policy 2021, 114, 15–24. [Google Scholar] [CrossRef]
- Howard, E. Garden Cities of To-Morrow; The Commercial Press: Beijing, China, 2009; ISBN 9780262580021. [Google Scholar]
- Park, R.E. Human ecology. Am. J. Sociol. 1936, 13, 1–15. [Google Scholar] [CrossRef] [Green Version]
- Hoyt, H. The structure and growth of residential areas in American cities. Development 1941, 19, 453–454. [Google Scholar] [CrossRef]
- Muth, R.F. Cities and Housing; The University of Chicago Press: Chicago, IL, USA, 1969; ISBN 8170220300. [Google Scholar]
- Alonso, W. Location and land use: Toward a general theory of land rent. Econ. Geogr. 1964, 42, 11–26. [Google Scholar] [CrossRef]
- Michelson, W.M. Environmental Choice, Human Behavior, and Residential Satisfaction; Oxford University Press: New York, NY, USA, 1977; ISBN 0195021452. [Google Scholar]
- Liu, W.; Zhang, W. Review and prospect of the research on urban residential spatial structure. Hum. Geogr. 2004, 3, 6–11. [Google Scholar] [CrossRef]
- Shapely, P. The Politics of Housing: Power, Consumers and Urban Culture; Manchester University Press: Manchester, UK, 2007; ISBN 9781526130686. [Google Scholar]
- Wu, Q.; Ren, D.; Yang, Y.; Shu, X. The theoretical basis of urban residential differentiation and its research field. Hum. Geogr. 2000, 3, 1–5. [Google Scholar] [CrossRef]
- Wei, L.; Yan, X. Summaries and analysis on the studies about urban social space in the socialist transitional countries. Hum. Geogr. 2006, 4, 13–18. [Google Scholar]
- Li, Z.; Wu, F.; Xue, D. A review of sociospatial differentiation in ‘post-socialist’ cities. Hum. Geogr. 2006, 5, 1–5. [Google Scholar]
- Moura, M.; Smith, S.; Belzer, D.B. 120 years of U.S. residential housing stock and floor space. PLoS ONE 2015, 10, e0134135:1–e0134135:18. [Google Scholar] [CrossRef] [PubMed]
- He, B.; Zhao, Z.; Shen, L.; Wang, H.; Li, L. An approach to examining performances of cool/hot sources in mitigating/enhancing land surface temperature under different temperature backgrounds based on landsat 8 image. Sustain. Cities Soc. 2019, 44, 416–427. [Google Scholar] [CrossRef]
- Wang, D.; Schwanen, T.; Mao, Z. Does exposure to richer and poorer neighborhoods influence wellbeing. Cities 2009, 95, 102401–102408. [Google Scholar] [CrossRef]
- Glaeser, E.L.; Kahn, M.E.; Rappaport, J. Why do the poor live in cities? The role of public transportation. J. Urban Econ. 2008, 63, 1–24. [Google Scholar] [CrossRef]
- Mansour, S. Spatial concentration patterns of South Asian low-skilled immigrants in Oman: A spatial analysis of residential geographies. Appl. Geogr. 2017, 88, 118–129. [Google Scholar] [CrossRef]
- Yang, J.; Yang, R.; Chen, M.; Su, C.J.; Zhi, Y.; Xi, J. Effects of rural revitalization on rural tourism. J. Hosp. Tour. Manag. 2021, 47, 35–45. [Google Scholar] [CrossRef]
- Sharma, M.; Brown, L.A. Racial/ethnic intermixing in intra-urban space and socioeconomic context: Columbus, Ohio and Milwaukee, Wisconsin. Urban Geogr. 2012, 33, 317–347. [Google Scholar] [CrossRef]
- Rémi, L.; Marc, B.; Chen, Y. Patterns of residential segregation. PLoS ONE 2016, 11, e0157476:1–e0157476:20. [Google Scholar] [CrossRef] [Green Version]
- Xue, B.; Zhang, L.; Geng, Y.; Mitchell, B.; Ren, W. Extended land-use coding system and its application in urban brown field redevelopment: A case study of Tiexi district in Shenyang, China. J. Urban Plan. Dev. 2016, 142, 5015014:1–5015014:11. [Google Scholar] [CrossRef]
- Small, C.; Sousa, D.; Yetman, G.; Elvidge, C.; MacManus, K. Decades of urban growth and development on the Asian megadeltas. Glob. Planet. Chang. 2018, 165, 62–89. [Google Scholar] [CrossRef]
- Kowalczyk, C.; Kil, J.; Kurowska, K. Dynamics of development of the largest cities—Evidence from Poland. Cities 2019, 89, 26–34. [Google Scholar] [CrossRef]
- Li, X.; Bai, Z.; Tian, S.; Yang, J.; Guo, Y. Human settlement assessment in Jinan from a facility resource perspective. SAGE Open 2020, 10, 2158244020924056:1–2158244020924056:16. [Google Scholar] [CrossRef]
- Yang, J.; Ren, J.; Sun, D.; Xiao, X.; Xia, J.C.; Jin, C.; Li, X. Understanding land surface temperature impact factors based on local climate zones. Sustain. Cities Soc. 2021, 69, 102818. [Google Scholar] [CrossRef]
- Shang, S.; Du, S.; Du, S.; Zhu, S. Estimating building-scale population using multi-source spatial data. Cities 2021, 111, 103002:1–103002:13. [Google Scholar] [CrossRef]
- Zhou, G.; Li, C.; Liu, Y.; Zhang, J. Complexity of functional urban spaces evolution in different aspects: Based on urban land use conversion. Complexity 2020, 9741203. [Google Scholar] [CrossRef]
- Tong, Y.; Liu, W.; Li, C.; Zhang, J.; Ma, Z. Understanding patterns and multilevel influencing factors of small town shrinkage in Northeast China. Sustain. Cities Soc. 2021, 2, 102811:1–102811:11. [Google Scholar] [CrossRef]
- Zhou, C.; Luo, R.; Dai, D. Evolution and mechanism of the residential spatial structure from 2000 to 2010 in Guangzhou. Geogr. Res. 2015, 34, 1109–1124. [Google Scholar]
- Li, X.; Zhu, J.; Wang, Y. Spatial differences of residential quarter floor area ratio: A case study of Dalian. Prog. Geogr. 2015, 34, 687–695. [Google Scholar]
- Yang, J.; Guo, A.; Li, Y.; Zhang, Y.; Li, X. Simulation of landscape spatial layout evolution in rural-urban fringe areas: A case study of Ganjingzi District. Gisci. Remote Sens. 2019, 56, 388–405. [Google Scholar] [CrossRef]
- Zhong, Y.; Feng, J. Residential spatial differentiation of migrant population within the city: A case study of Shenzhen. Prog. Geogr. 2017, 36, 125–135. [Google Scholar] [CrossRef] [Green Version]
- You, H.; Yang, J.; Xue, B.; Xiao, X.; Xia, J.; Jin, C.; Li, X. Spatial evolution of population change in Northeast China during 1992–2018. Sci. Total Environ. 2021, 776, 146023. [Google Scholar] [CrossRef]
- Sun, L.; Dong, H.; Geng, Y.; Li, Z.; Liu, Z.; Fujita, T.; Ohnishi, S.; Fujii, M. Uncovering driving forces on urban metabolism—A case of Shenyang. J. Clean. Prod. 2016, 114, 171–179. [Google Scholar] [CrossRef]
- Liu, M.; Xu, Y.; Hu, Y.; Li, C.; Sun, F.; Chen, T. A century of the evolution of the urban area in Shenyang, China. PLoS ONE 2014, 9, e98847. [Google Scholar] [CrossRef]
- Zhao, Z.; He, B.; Li, L.; Wang, H.; Darko, A. Profile and concentric zonal analysis of relationships between land use/land cover and land surface temperature: Case study of Shenyang, China. Energ. Build. 2017, 155, 282–295. [Google Scholar] [CrossRef]
- Li, X.; Sun, H.; Tian, S.; Wang, M.; Zhang, D. Spatio-temporal differentiation of types of urban residential community: A case study of four districts in Dalian city. Resour. Dev. Mark. 2019, 35, 388–394. [Google Scholar] [CrossRef]
- Liu, S.; Wu, C.; Shen, H. A GIS based model of urban land use growth in Beijing. Acta Geogr. Sin. 2000, 4, 407–416. [Google Scholar]
- Xu, Q.; Huang, Y. Analysis of urban expansion measurement and driving mechanism in typical region of pearl river delta. Sci. Surv. Mapp. 2018, 43, 45–53. [Google Scholar]
- Okabe, A.; Kitamura, M. A computational method for market area analysis on a network. Geogr. Anal. 1996, 28, 330–349. [Google Scholar] [CrossRef]
- Anderson, T.K. Kernel density estimation and K-means clustering to profile road accident hotspots. Accident Anal. Prev. 2009, 41, 359–364. [Google Scholar] [CrossRef] [PubMed]
- Nadi, P.A.; Murad, A.K. Modelling Sustainable Urban Transport Performance in the Jakarta city Region: A GIS Approach. Sustainability 2019, 11, 1879. [Google Scholar] [CrossRef] [Green Version]
- Wang, J.; Lu, M.; Yuan, Z.; Rui, Y.; Qian, T. Point pattern analysis of ATMs distribution based on Ripley’s K-Function method in Nanjing city. Sci. Geogr. Sin. 2016, 36, 1843–1849. [Google Scholar]
- Ripley, B.D. Spatial Statistics; John Wiley: Chichester, UK, 1981; ISBN 047169116X. [Google Scholar]
- Chai, Y.; Zhou, Y. The characteristics, mechanisms and tendency of suburbanization of residence in Dalian city. Sci. Geogr. Sin. 2000, 20, 127–132. [Google Scholar]
- Cao, X.; Xue, D.; Yan, X. Development tendency of urban transport geography. Sci. Geogr. Sin. 2006, 26, 111–117. [Google Scholar]
- Li, X.; Du, J. Research on private cars’ influence on residential space based on residents’ travel behavior: Taking Dalian as an example. Geogr. Res. 2007, 26, 1033–1042. [Google Scholar]
- Zhang, C.; Li, X.; Zhang, X. Expansion of residence distribution and suburbanization research in Dalian. Areal. Res. Dev. 2005, 1, 66–69. [Google Scholar]
- Niu, X.; Ou, M. A Study on driving-force system of regional land-use change: Taking Yangzhou city as an example. China Popul. Resour. Environ. 2007, 1, 102–108. [Google Scholar]
- Hou, J.; Ying, W. Analysis Methods of Regional Economy; The Commercial Press: Beijing, China, 2004; ISBN 9787100041256. [Google Scholar]
- Ilesanmi, A.O. Urban sustainability in the context of Lagos mega-city. J. Geogr. Reg. Plan. 2010, 3, 240–252. [Google Scholar] [CrossRef]
- Newman, P.; Kenworthy, J. Sustainability and Cities: Summary and Conclusions. In Designing Cities: Critical Readings in Urban Design; Cuthbert, A.R., Ed.; Blackwell: Oxford, UK, 2003. [Google Scholar]
- Griffiths, P.; Hostert, P.; Gruebner, O.; der Linden, S.V. Mapping megacity growth with multi-sensor data. Rem. Sens. Environ. 2010, 114, 426–439. [Google Scholar] [CrossRef]
- Cheeseman, N.; de Gramont, D. Managing a mega-city: Learning the lessons from Lagos. Oxf. Rev. Econ. Pol. 2017, 33, 457–477. [Google Scholar] [CrossRef]
- Aguilar, A.G.; Ward, P.M.; Smith Sr, C.B. Globalization, regional development, and mega-city expansion in Latin America: Analyzing Mexico City’s peri-urban hinterland. Cities 2003, 20, 3–21. [Google Scholar] [CrossRef]
- Xiao, Y.; Chen, S.; Wang, X.; Huang, J. Study on segregation of residential space of new migrants in Shanghai from the perspective of global city. Plan. Stud. 2016, 3, 25–33. [Google Scholar] [CrossRef]
- Xu, Y.; Li, X.; Gao, J.; Guo, J. Research on dynamic changes and evolution model of urban residential quarter of Dalian in past ten years. Sci. Geogr. Sin. 2009, 29, 825–832. [Google Scholar]
- Yang, Y.; Li, T.; Feng, X. Spatial-temporal analysis of residential space in Xi’an metropolis. Areal. Res. Dev. 2016, 35, 51–57. [Google Scholar]
- Song, W.; Wu, Q.; Zhu, X. Residential differentiation of Nanjing in the new period. Acta Geogr. Sin. 2010, 65, 685–694. [Google Scholar]
- Zhang, Y. Study on Spatial Differentiation of Beijing’s Second-Hand Housing Prices Based on GWR Model. Master’s Thesis, China University of Geosciences, Beijing, China, 2018. [Google Scholar]
Figure 1.
Administrative division and basic elements map of Shenyang.
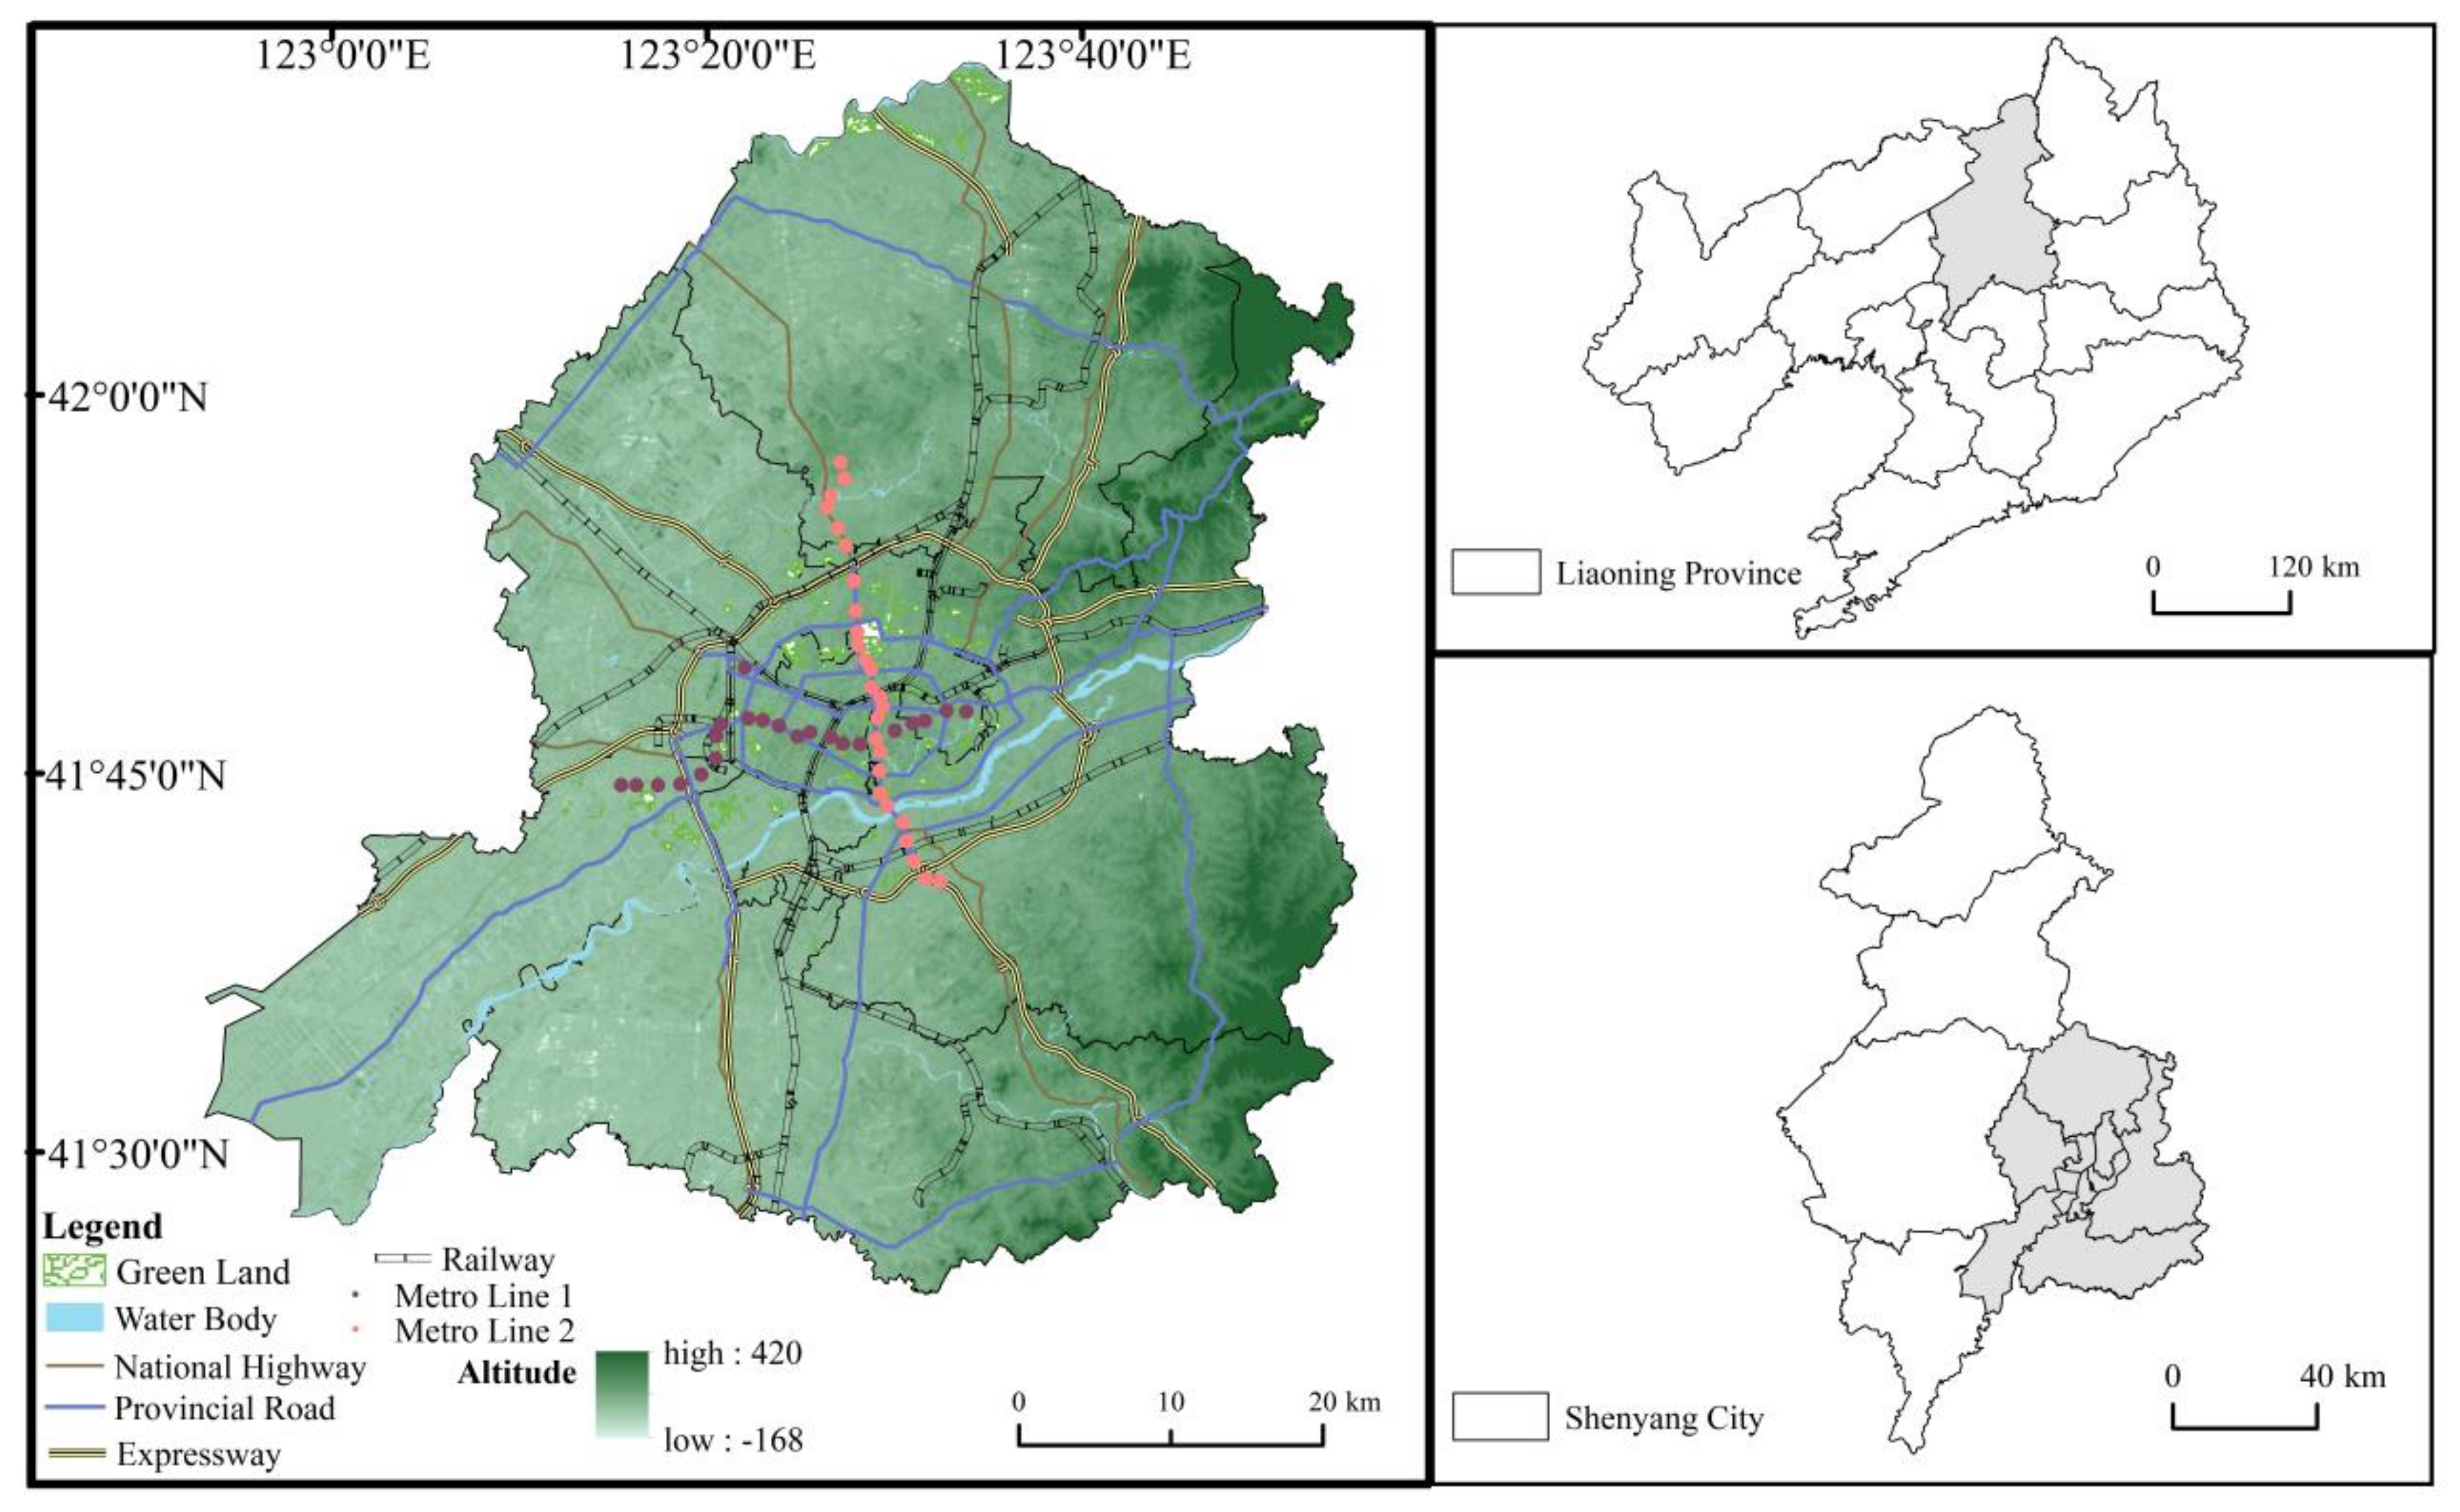
Figure 2.
Number of new communities over the years.
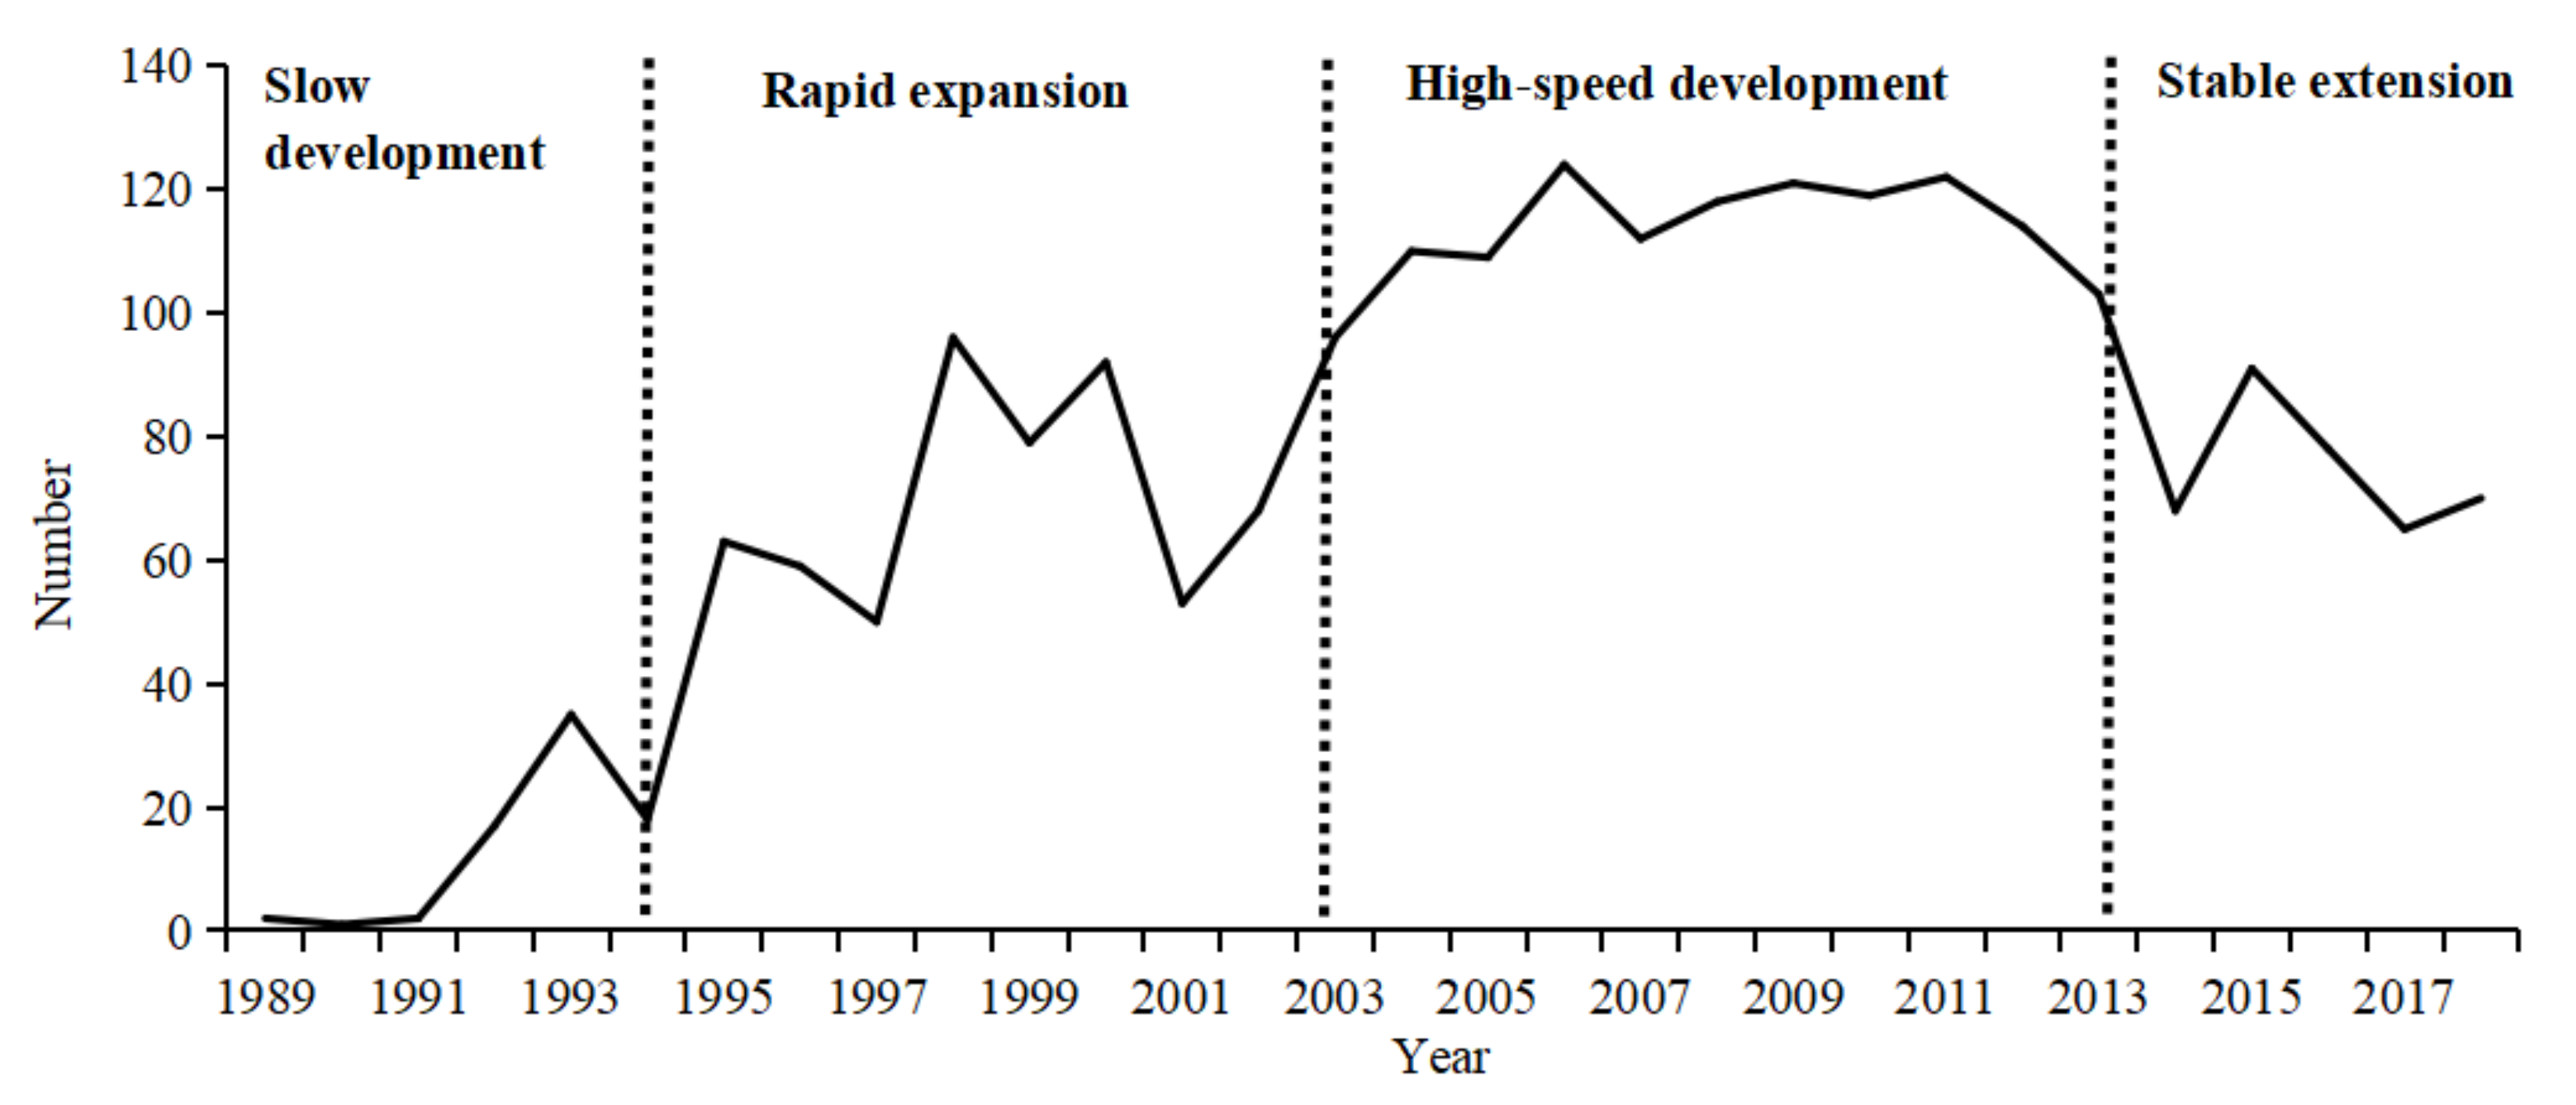
Figure 3.
New communities distribution in different stages. (a) Slow development stage. (b) Rapid expansion stage. (c) High-speed development stage. (d) Stable extension stage.
Figure 3.
New communities distribution in different stages. (a) Slow development stage. (b) Rapid expansion stage. (c) High-speed development stage. (d) Stable extension stage.
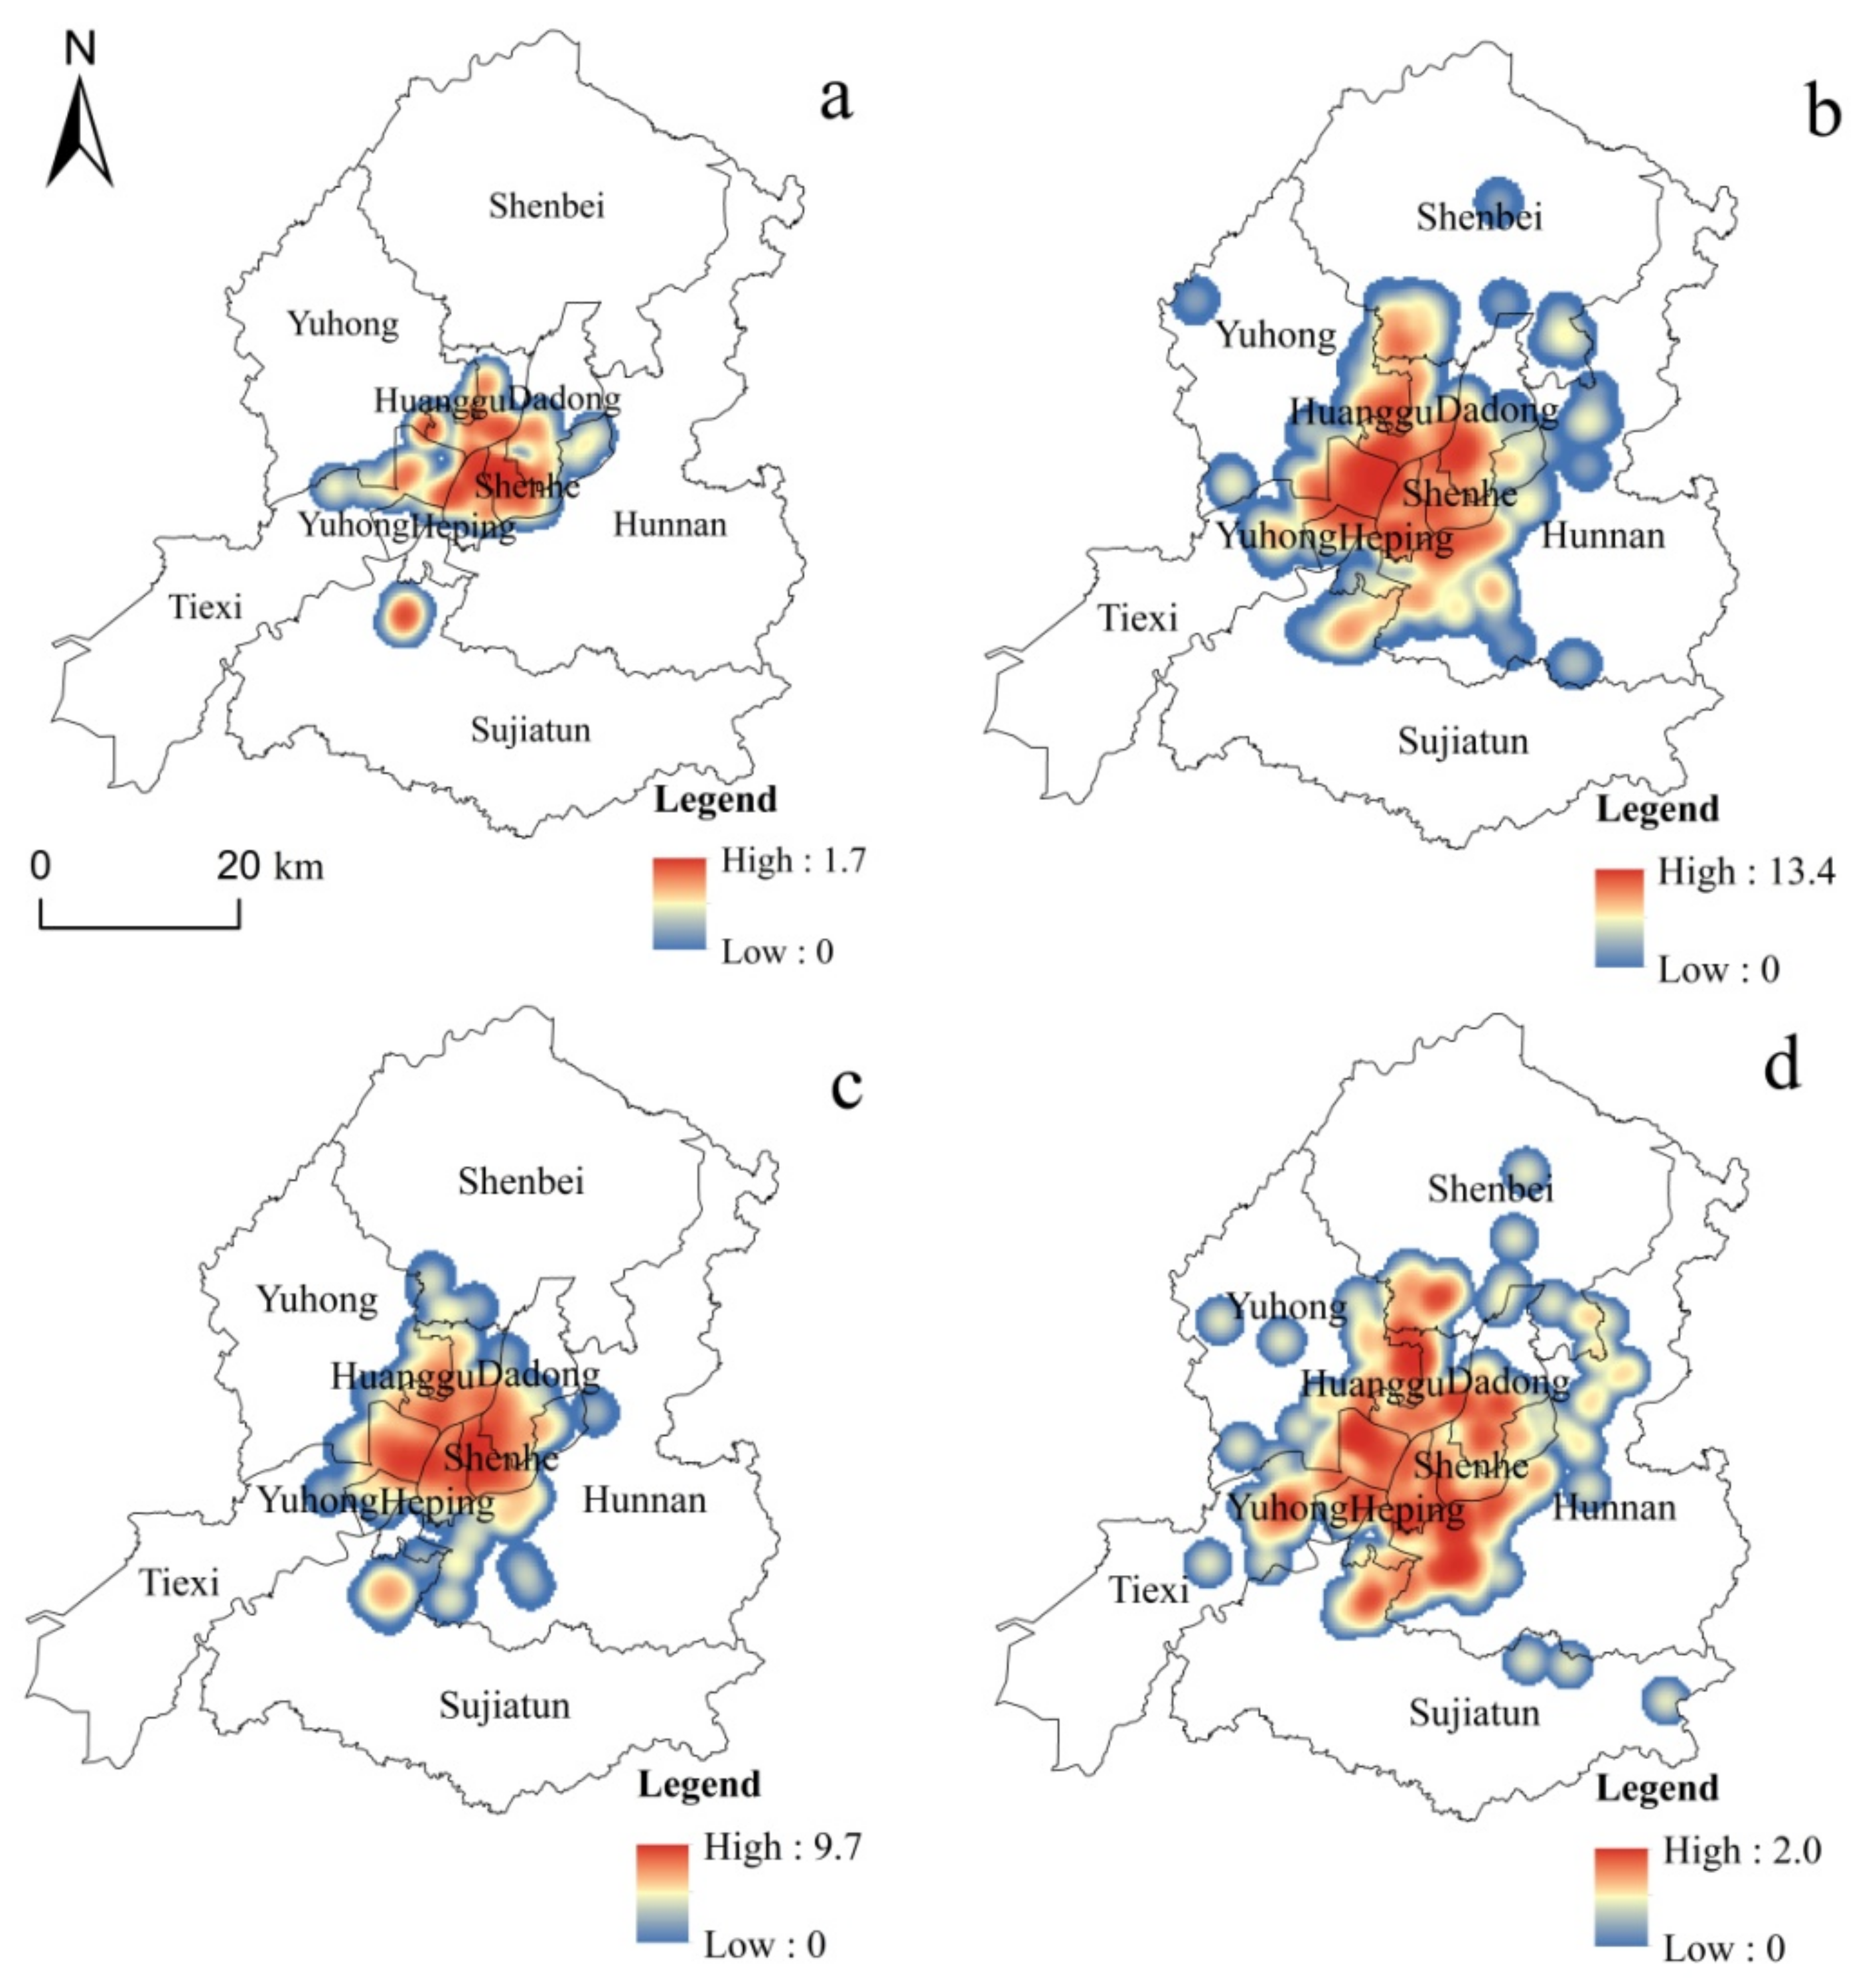
Figure 4.
Overall residential communities distribution in Shenyang.

Figure 5.
Residential communities number in different regions.
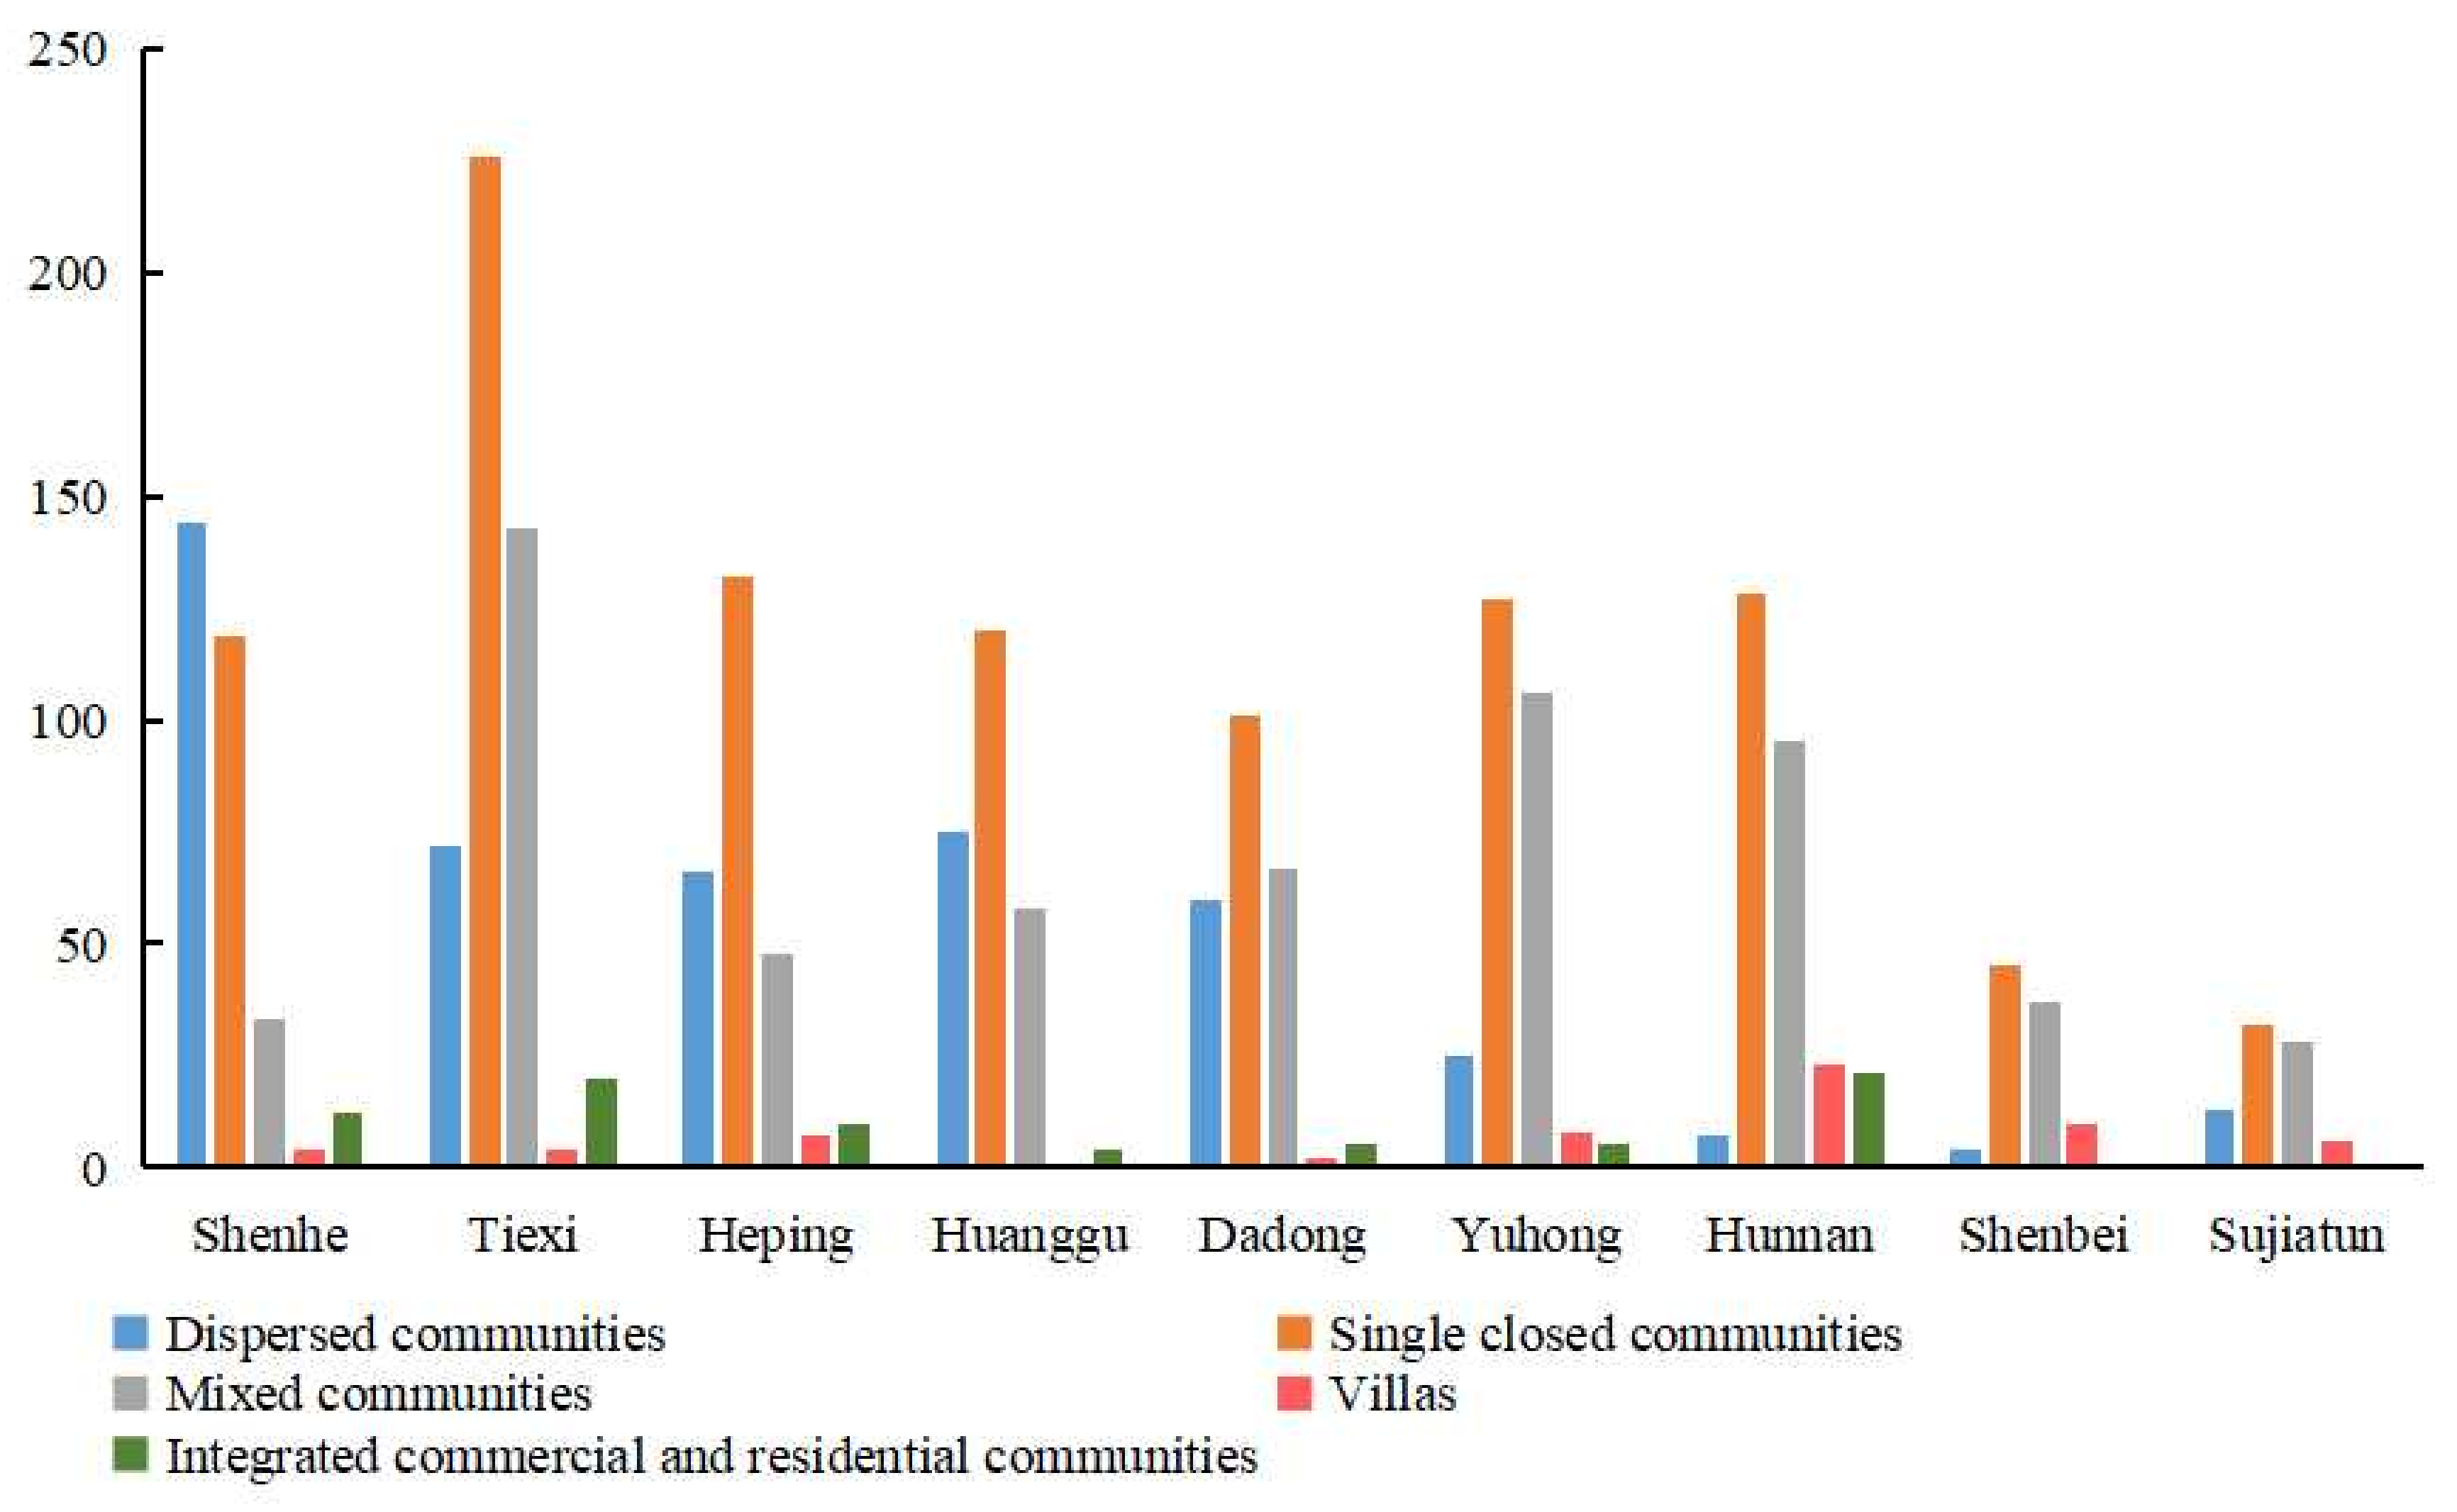
Figure 6.
Nuclear density distribution and multi-distance spatial cluster diagram of all kinds of communities.
Figure 6.
Nuclear density distribution and multi-distance spatial cluster diagram of all kinds of communities.

Table 1.
Data description.
| Data Type | Year | Source | Pretreatment |
|---|---|---|---|
| Residence data | 2018 | Main https://dl.ke.com Others (anjuke.com, soufang.com, fang.com, and 58.com) | Collect other four websites to eliminate incorrect data, combine with high-resolution remote sensing images and Baidu’s online map to spatially correct data, carry out a geographical trend surface analysis. |
| Natural element data | 2019 | https://www.earthol.com/ | Use the same Google Earth image to further correct and supplement the data. |
| Traffic network data | 2019 | https://map.baidu.com/ www.gscloud.cn/ | |
| Administrative division data | 2019 | http://www.lnditu.gov.cn/main/index.html | |
| Statistical panel data | 2019 | Shenyang Urban Statistical Yearbook (2002–2018) | Obtain other relevant official publications, and official websites to ensure the accuracy of the data. |
Table 2.
Classification standard of the residential communities.
| Property Right Years | District Closure | Building Structure | Building Type | Property Type | Floor Area Ratio Grade | |
|---|---|---|---|---|---|---|
| Dispersed community | 70 | Open | Brick mix, steel mix | Low-rise, multi-story | Residence | Medium low, medium |
| Single closed community | 70 | Closed | Brick mix, steel mix, Frame | Multi-story, small high-rise, high-rise | Residence, apartments | Medium, medium high, High |
| Villa | 70 | Closed | Brick mix, steel mix, frame | Low-rise | Villas | Very low |
| Mixed community | Residence: 70 | Closed; Semi-closed | Brick mix, steel mix, frame | Low-rise, multi-story, small high-rise, high-rise mixed | Residence | Medium, medium high, High |
| Villa: 40 | Villas | Low, very low | ||||
| Apartment: 40 | Apartment | High | ||||
| Integrated commercial and residential community | 40 | Open | Steel mix, frame | High-rise, super high-rise | Residence, commercial and residential buildings, street buildings | High, super high |
Table 3.
Driver selection and construction.
| Factor | Indicator | Unit | Variable | Direction |
|---|---|---|---|---|
| Policy | Investment in fixed assets | 108 yuan(RMB) | X1 | + |
| Total tax revenue | 104 yuan(RMB) | X2 | - | |
| Planning | Expenditure on urban and rural community public facilities | 104 yuan(RMB) | X3 | + |
| Number of schools at all levels | person | X4 | + | |
| Green-covered area in the built-up area | hm2 | X5 | + | |
| Economy | GDP | 108 yuan(RMB) | X6 | + |
| Engel coefficient | % | X7 | - | |
| Average wage of employees | yuan(RMB) | X8 | + | |
| Percapita income-expenditure ratio | % | X9 | + | |
| Total floor area of housing per capita | m2 | X10 | + | |
| Population | Permanent resident population | 104 person | X11 | + |
| Urbanization rate | % | X12 | + | |
| Average population per household | person | X13 | - | |
| Estate | Housing development efficiency | % | X14 | + |
| Residential completed investment | 108 yuan(RMB) | X15 | + | |
| Residential investment and construction rate of return | % | X16 | + | |
| Traffic | Road length | km | X17 | + |
| Number of civilian cars | number | X18 | + |
Table 4.
Eigenvalues and squared loading of the principal components.
| Principal Component | Eigenvalues | % of Variance | Cumulative % |
|---|---|---|---|
| 1 | 12.841 | 71.341 | 71.341 |
| 2 | 3.060 | 16.998 | 88.338 |
| 3 | 1.139 | 6.330 | 94.668 |
Table 5.
Principal component load matrix.
| Component | Component | ||||||
|---|---|---|---|---|---|---|---|
| 1 | 2 | 3 | 1 | 2 | 3 | ||
| X1 | 0.634 | 0.601 | 0.34 | X10 | 0.984 * | −0.036 | 0.118 |
| X2 | −0.321 | −0.615 | 0.636 * | X11 | 0.990 * | −0.062 | 0.083 |
| X3 | 0.432 | 0.896 * | 0.042 | X12 | 0.979 * | −0.111 | −0.151 |
| X4 | −0.915 | −0.224 | 0.331 | X13 | 0.921 | −0.143 | −0.331 |
| X5 | 0.957 | 0.203 | −0.092 | X14 | 0.972 | −0.098 | 0.191 |
| X6 | 0.972 | 0.011 | 0.166 | X15 | 0.812 | 0.502 | 0.275 |
| X7 | −0.461 | 0.856 * | −0.073 | X16 | 0.749 | 0.045 | 0.23 |
| X8 | 0.947 | −0.318 | −0.017 | X17 | 0.980 * | −0.048 | 0.175 |
| X9 | 0.812 | −0.298 | −0.339 | X18 | 0.894 | −0.446 | −0.045 |
* It refers to the driving factor that with the large load weight in each principal component.
Table 6.
Regression coefficient.
| Model | Non-Standardized Factor | Standardized Factor | T | Significance | |
|---|---|---|---|---|---|
| B | Standard Error | Beta | |||
| (Constant) | 4.095 | 0.052 | 78.129 | 0 | |
| First primary component | −0.305 | 0.057 | −0.349 | −5.315 | 0.014 |
| Second primary component | 0.815 | 0.057 | 0.932 | 14.194 | 0.005 |
| Third primary component | 0.024 | 0.057 | 0.028 | 0.425 | 0.012 |
Table 7.
Residual statistics.
| Minimum | Maximum | Average | Standard Deviation | N | |
|---|---|---|---|---|---|
| Forecast Value | 2.933 | 5.213 | 4.095 | 0.870 | 15 |
| Residual Difference | −0.098 | 0.122 | 0.000 | 0.081 | 15 |
| Standard forecast value | −1.335 | 1.285 | 0.000 | 1.000 | 15 |
| Standard residual | −0.765 | 0.952 | 0.000 | 0.632 | 15 |
Publisher’s Note: MDPI stays neutral with regard to jurisdictional claims in published maps and institutional affiliations. |
© 2021 by the authors. Licensee MDPI, Basel, Switzerland. This article is an open access article distributed under the terms and conditions of the Creative Commons Attribution (CC BY) license (https://creativecommons.org/licenses/by/4.0/).
Share and Cite
MDPI and ACS Style
Sun, H.; Li, X.; Guan, Y.; Tian, S.; Liu, H. The Evolution of the Urban Residential Space Structure and Driving Forces in the Megacity—A Case Study of Shenyang City. Land 2021, 10, 1081. https://doi.org/10.3390/land10101081
AMA Style
Sun H, Li X, Guan Y, Tian S, Liu H. The Evolution of the Urban Residential Space Structure and Driving Forces in the Megacity—A Case Study of Shenyang City. Land. 2021; 10(10):1081. https://doi.org/10.3390/land10101081
Chicago/Turabian StyleSun, He, Xueming Li, Yingying Guan, Shenzhen Tian, and He Liu. 2021. "The Evolution of the Urban Residential Space Structure and Driving Forces in the Megacity—A Case Study of Shenyang City" Land 10, no. 10: 1081. https://doi.org/10.3390/land10101081
Note that from the first issue of 2016, this journal uses article numbers instead of page numbers. See further details here.