Article

Farmland Zoning Integrating Agricultural Multi-Functional Supply, Demand and Relationships: A Case Study of the Hangzhou Metropolitan Area, China

1
College of Economics and Management, China Jiliang University, Hangzhou 310018, China
2
College of Humanities and Foreign Languages, China Jiliang University, Hangzhou 310018, China
3
College of Environment and Natural Resource, Zhejiang University, Hangzhou 310058, China
*
Author to whom correspondence should be addressed.
Land 2021, 10(10), 1014; https://doi.org/10.3390/land10101014
Submission received: 10 August 2021 / Revised: 20 September 2021 / Accepted: 24 September 2021 / Published: 27 September 2021
(This article belongs to the Section Land Systems and Global Change)

Abstract

:
Land-use zoning provides an effective tool for designing and implementing differentiated farmland-protection policies. Despite the exponential increase in research on farmland zoning in recent years, little research has comprehensively explored the supply, demand and relationships of the diverse functions of farmland. In this study, multi-sourced datasets and diverse methods, along with GIS, were combined to spatially evaluate the supply, demand and relationship patterns among the production, ecological and landscape-cultural functions of the farmland of Hangzhou City in China, to construct farmland zoning. The results indicate that high production supply was mostly concentrated in flat plains, whereas highly ecological farmland was frequently observed in mountains. Both urban and rural areas had the capacity to provide aesthetics and recreation. Regarding demand, high values were mainly observed near the downtown area. Additionally, supply-and-demand matching (SDM) and multi-functional coupling and coordination degree (MCCD) were evaluated. Among the four basic zones acquired by SDM analysis, two zones dominated by more than one function were further divided into four sub-regions, according to the MCCD values. Ultimately, six farmland-use zones were determined. By considering the supply, demand and relationships of multiple functions, this farmland-zoning program offers new insights into differentiated farmland protection.

1. Introduction

The survival and development of a country is based on farmland protection [1]. Over the past three decades, China’s urbanization and population growth rate have been up to 63.89% and 31.21%, respectively, which poses a tremendous challenge to farmland protection [2]. According to the China Land and Resources Yearbook, since 1990, China’s farmland area has decreased by more than 10 million ha, with a total loss rate of 10.45% [3]. Furthermore, abandonment, planting with non-grain species, and occupation by construction also plagues existing farmland protection efforts with difficulties [1,4].
The cause of the aforementioned problems lies in the natural geographical environment and the extreme variation in socioeconomic development in different regions of China. For example, 93.44% of China’s high-quality farmland is distributed in the eastern monsoon area, which is characterized by a dense population and rapid urbanization [5]. This imbalance has led to a mismatch between supply and demand for farmland functions in some areas of China. The spatial heterogeneity of farmland’s supply capacity is determined by differing background qualities, as well as diversity in its utilization and management. Meanwhile, population density and composition, and economic conditions, etc., affect the spatial variety of farmland’s degree of demand. The mismatch between supply and demand can manifest as the excessive use or abandonment of farmland, amongst others [2,6]. Therefore, given the spatial variability of farmland-protection problems, and the growing contradiction between resource development and protection, it is imperative to enact regionally differentiated and targeted farmland management measures and policies.
Land-use zoning provides an effective tool for designing and implementing differentiated land-use protection policies [7]. Land-use zoning is based on the regionalization theory, proposed in the field of ecology in the early 19th century and further advanced with the emergence of the delineation scheme of eco-regions [8]. It is worth mentioning that the land rent theory is also a crucial theoretical basis for the development of land-use zoning programs. In land rent theory, the natural conditions and the intensity of utilization of farmland mainly affect the value and function of farmland [9]. Thus, this theory can assist in guiding the land-use zoning program and the differential management and utilization suggestions in each farmland-use zones in this study.
A successful land-use zoning program could improve the efficiency and sustainability of land use. Considering the importance and urgency of farmland protection, many studies on zoning farmland have been authored in recent years. Methods such as spatial overlay, autocorrelation and clustering analysis have been used to divide farmland into sub-regions [10,11,12]. The spatial overlay method is straightforward but ignores the relationship between farmland plots and its surroundings [12]. The autocorrelation method is relatively objective, but it is more applicable to research at the administrative–region scale due to the huge amount of calculation required [13]. Spatial clustering analysis can quickly capture regional differences to realize the zoning of geographic phenomena at a fine scale, based on multiple factors [14]. Hence, it is very suitable for application in farmland zoning, in which both the natural environmental and socioeconomic factors are taken into account.
The stage for the factors of farmland zoning has changed from being production-related, only, to being comprehensively concerned with multiple factors, such as productive, ecological and landscape-cultural functions [12]. A consensus has not been reached on the definition and classification of farmland’s multiple functions. Current studies usually evaluate the multiple functions of farmland regarding four aspects: economic production, social security, ecological service and landscape culture [6,11,12,15]. Food production (grains, vegetables, edible oils, etc.) is the most basic function. The ecological services of farmland, such as carbon sequestration, climate moderation, soil retention, pollution control, etc., greatly contribute to human well-being [15]. Especially for metropolitan areas, where green spaces are extremely scarce, the farmland ecosystem plays a crucial role in supplying these ecological services to residents [16]. With socioeconomic development and the transformation of material human demand, the landscape-cultural functions have become increasingly prominent, and social functions (such as life security) have gradually declined [6]. Therefore, this study is mainly focused on the production, ecological and landscape-cultural functions of farmland.
Moreover, it is realized that there are synergistic or trade-off relationships between the diverse functions of farmland [12,17]. For instance, large-scale farming not only improves material output, but also the aesthetic value of the farmland landscape. Although the input of chemical fertilizers and pesticides can increase the yield of farmland, their excessive application leads to the degradation of its ecological effects. Therefore, it is crucial to include these relationships in farmland zoning, not only to eliminate or weaken the undesirable trade-off relationship, but also to promote the coordinated development of diverse functions.
In addition to relationships among various functions, matching supply with demand information also plays a crucial role in farmland-use zoning. Using supply capacity, alone, as the basis for zoning farmland, without spatial variation by demand, might lead to research results being divorced from the actual situation. However, little attention has been devoted to the spatial variability of multi-functional demand. Questionnaire surveys and interviews are generally used for data collection in present-day demand analyses of farmland [18]. However, these methods are costly, time consuming and difficult to use to visualize spatially distributed information. This study has therefore integrated multi-sourced spatial datasets to explore an evaluation framework for the multi-functional demands of farmland. Furthermore, the mapping of the cultural landscape functionality of farmland is a daunting challenge due, to its intangible and subjective attributes [6], which limits its application in farmland zoning. The present study has attempted to use the Maxent model and public government data to evaluate the landscape-cultural function at the plot scale.
As stated above, two aspects—the characteristics of matching supply with demand, as well as the relationships among different functions—should be included in any scientific farmland-zoning program. However, current research tends to approach farmland zoning based only on a single aspect with one analytical technique [12,19]. This might lead to research results being divorced from actual circumstances or limit the coordinated development of diverse functions of farmland [20]. Thus, this study has integrated spatial clustering analysis and correlation analysis to incorporate the multi-functional supply-and-demand relationships into a farmland-zoning program, which could offer new insights into differentiated farmland protection.
Hangzhou, as one of the metropolises in China, is facing a contradiction between urban development and farmland protection. As lifestyles and consumption shift, the multiple functions of farmland need to satisfy the diverse needs of urban residents. Therefore, it is urgent to establish a zoning program for the deep and targeted farmland utilization by this city. This study aimed to explore a farmland-zoning program by integrating the spatial variation in the supply, demand and relationships among production, ecological and landscape-cultural functions: (1) assessing and visualizing the spatial patterns of supply capacity and demand levels of these functions; (2) conducting spatial quantitative analyses of the relationships between different functions; (3) finally exploring a farmland-use zoning program based on the clustering analysis of supply-and-demand maps, and the analysis of correlation between multiple functions, and then proposing suggestions for the differentially optimized management of farmland.

2. Materials and Methods
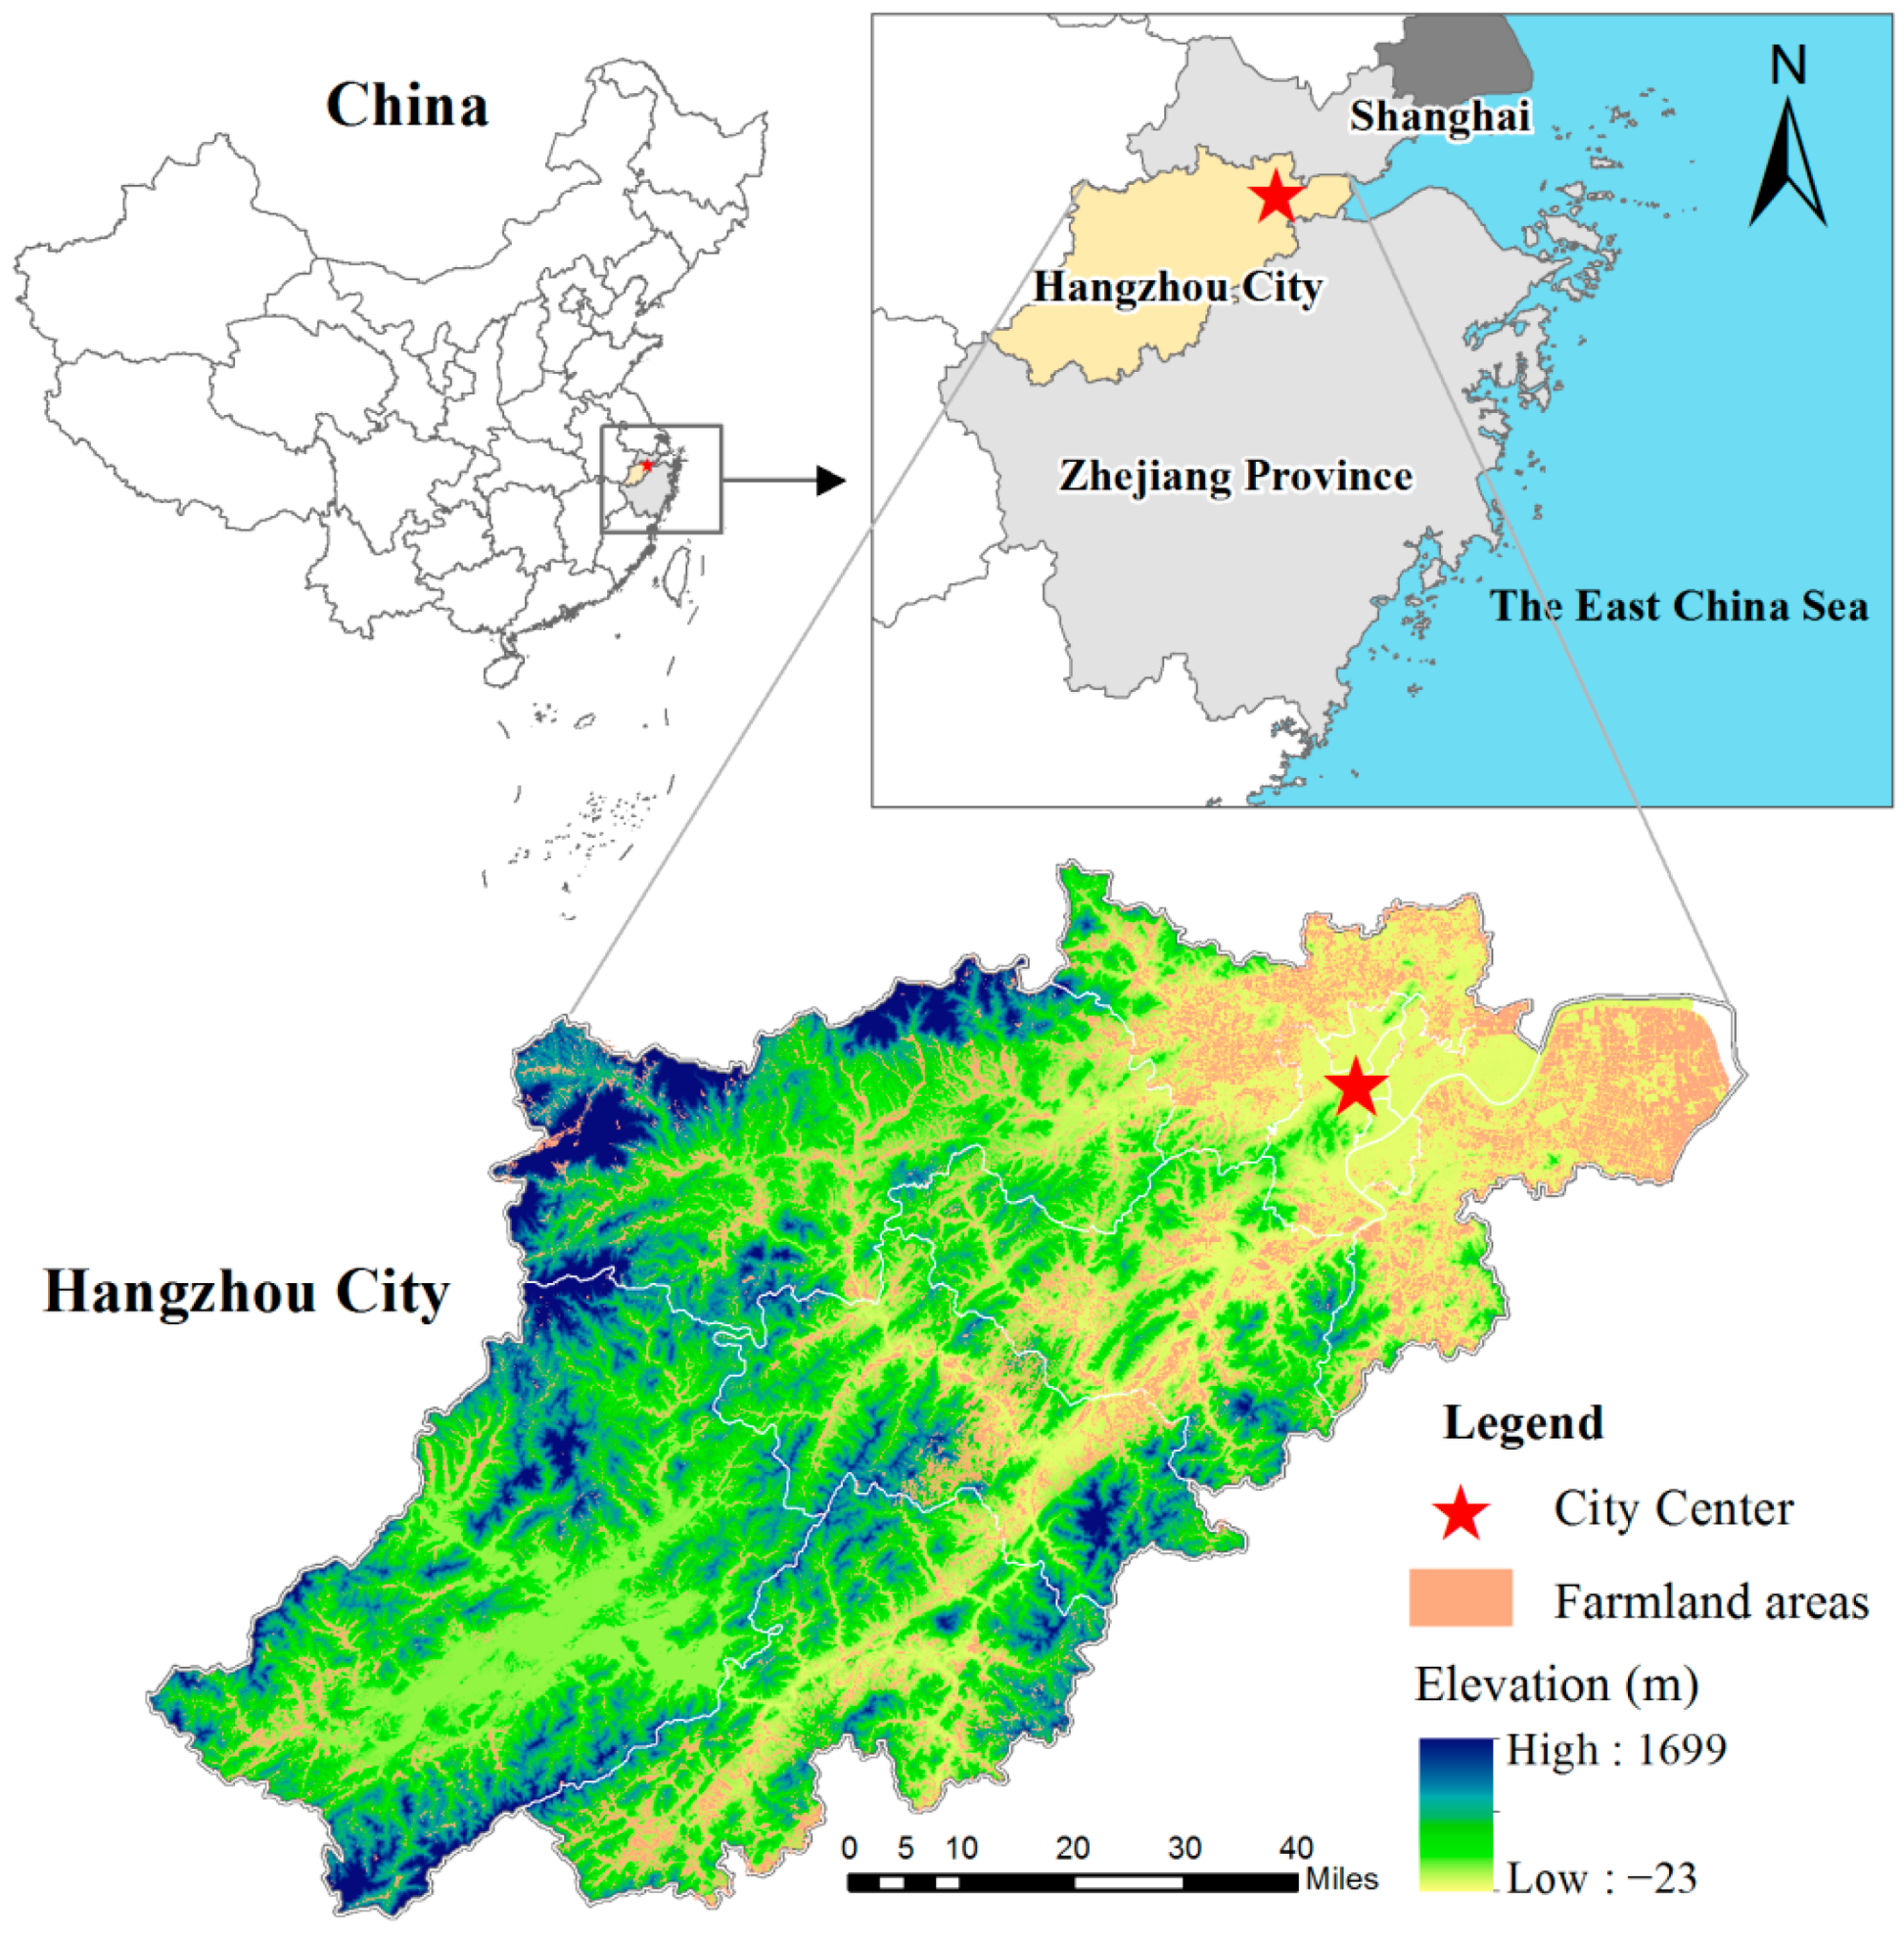
2.1. Study Area

Hangzhou is the capital of Zhejiang Province (29°11′–30°33′ N, 118°21′–120°30′ E) and located on the southeast coast of China (Figure 1). The study area covers 16,596 km2, its average annual temperature is about 18 °C and the average annual precipitation is about 1500 mm. This city has rich ecological environmental resources, such as the renowned West Lake, Xixi National Wetland Park and Qiantang River. The gross domestic product (GDP) of Hangzhou has significantly increased, from 18.9 billion CNY in 1990 to 1350.9 billion CNY in 2018 [21]. Due to its fascinating landscapes and unprecedented economic growth, Hangzhou was chosen as the host of the G20 Summit in 2016 and the 2022 Asian Games in 2022.
The area of farmland within Hangzhou was 2356.11 km2 in 2014, accounting for 13.98% of its total area. The population growth rate of Hangzhou City is up to 3.57%/year, ranking third in the country. Additionally, according to the seventh population census data, the urbanization rate of Hangzhou has increased to 83.29%. These pose a severe challenge for production and ecological functionality of farmland in this city. Moreover, Hangzhou ranks first in the China Rural Tourism Development Index report, which makes the ecological and landscape-cultural functions of farmland in Hangzhou of great concern. Therefore, in such a metropolis, with rapid urbanization and agritourism development, there is an urgent need to systematically evaluate the multiple functions of farmland and accordingly explore differentiated usage and management measures to ensure its sustainable development.
In this city, the Hangzhou Bureau of Planning and Natural Resources is responsible for the management and planning of local farmland. It has drawn up the overall plans for land use and a classification project for farmland quality to guide the farmland-zoning program. As aforementioned, farmland-zoning studies based on the multiple functions of the farmland within Hangzhou City are necessary, urgent, and typical. Therefore, it can provide a certain reference for other urban areas and offer valuable information to decisional actors regarding farmland management and protection.

2.2. Data Sources

Various datasets were used in this study. The types, resolutions and acquisition sources of these data are all detailed in Table 1.

2.3. Methods

2.3.1. Supply and Demand Evaluation of Farmland’s Functions

1.
Supply evaluation
The supply capacity of farmland is defined as its capacity to provide economic, ecological and spiritual benefit for people [12]. Three functions of farmland, namely, productive, ecological and landscape-cultural functions, were analyzed in this study.
  • Production supply: Comprehensively considering the current benefits and future potential, two factors, i.e., the actual output and production potential, were together used to characterize the production supply of farmland in this study. The production potential was characterized by the classification and grading data for agricultural land. The calculation formula for the production supply capacity is as follows:
    G i = ( P ij / P sumj )     G sumj
    where   G i is the production supply index in grid cell i; P ij is the production potential value in grid cell i of region j; P sumj is the total value of the production potential within region j; G sumj is the total actual output of the farmland within region j.
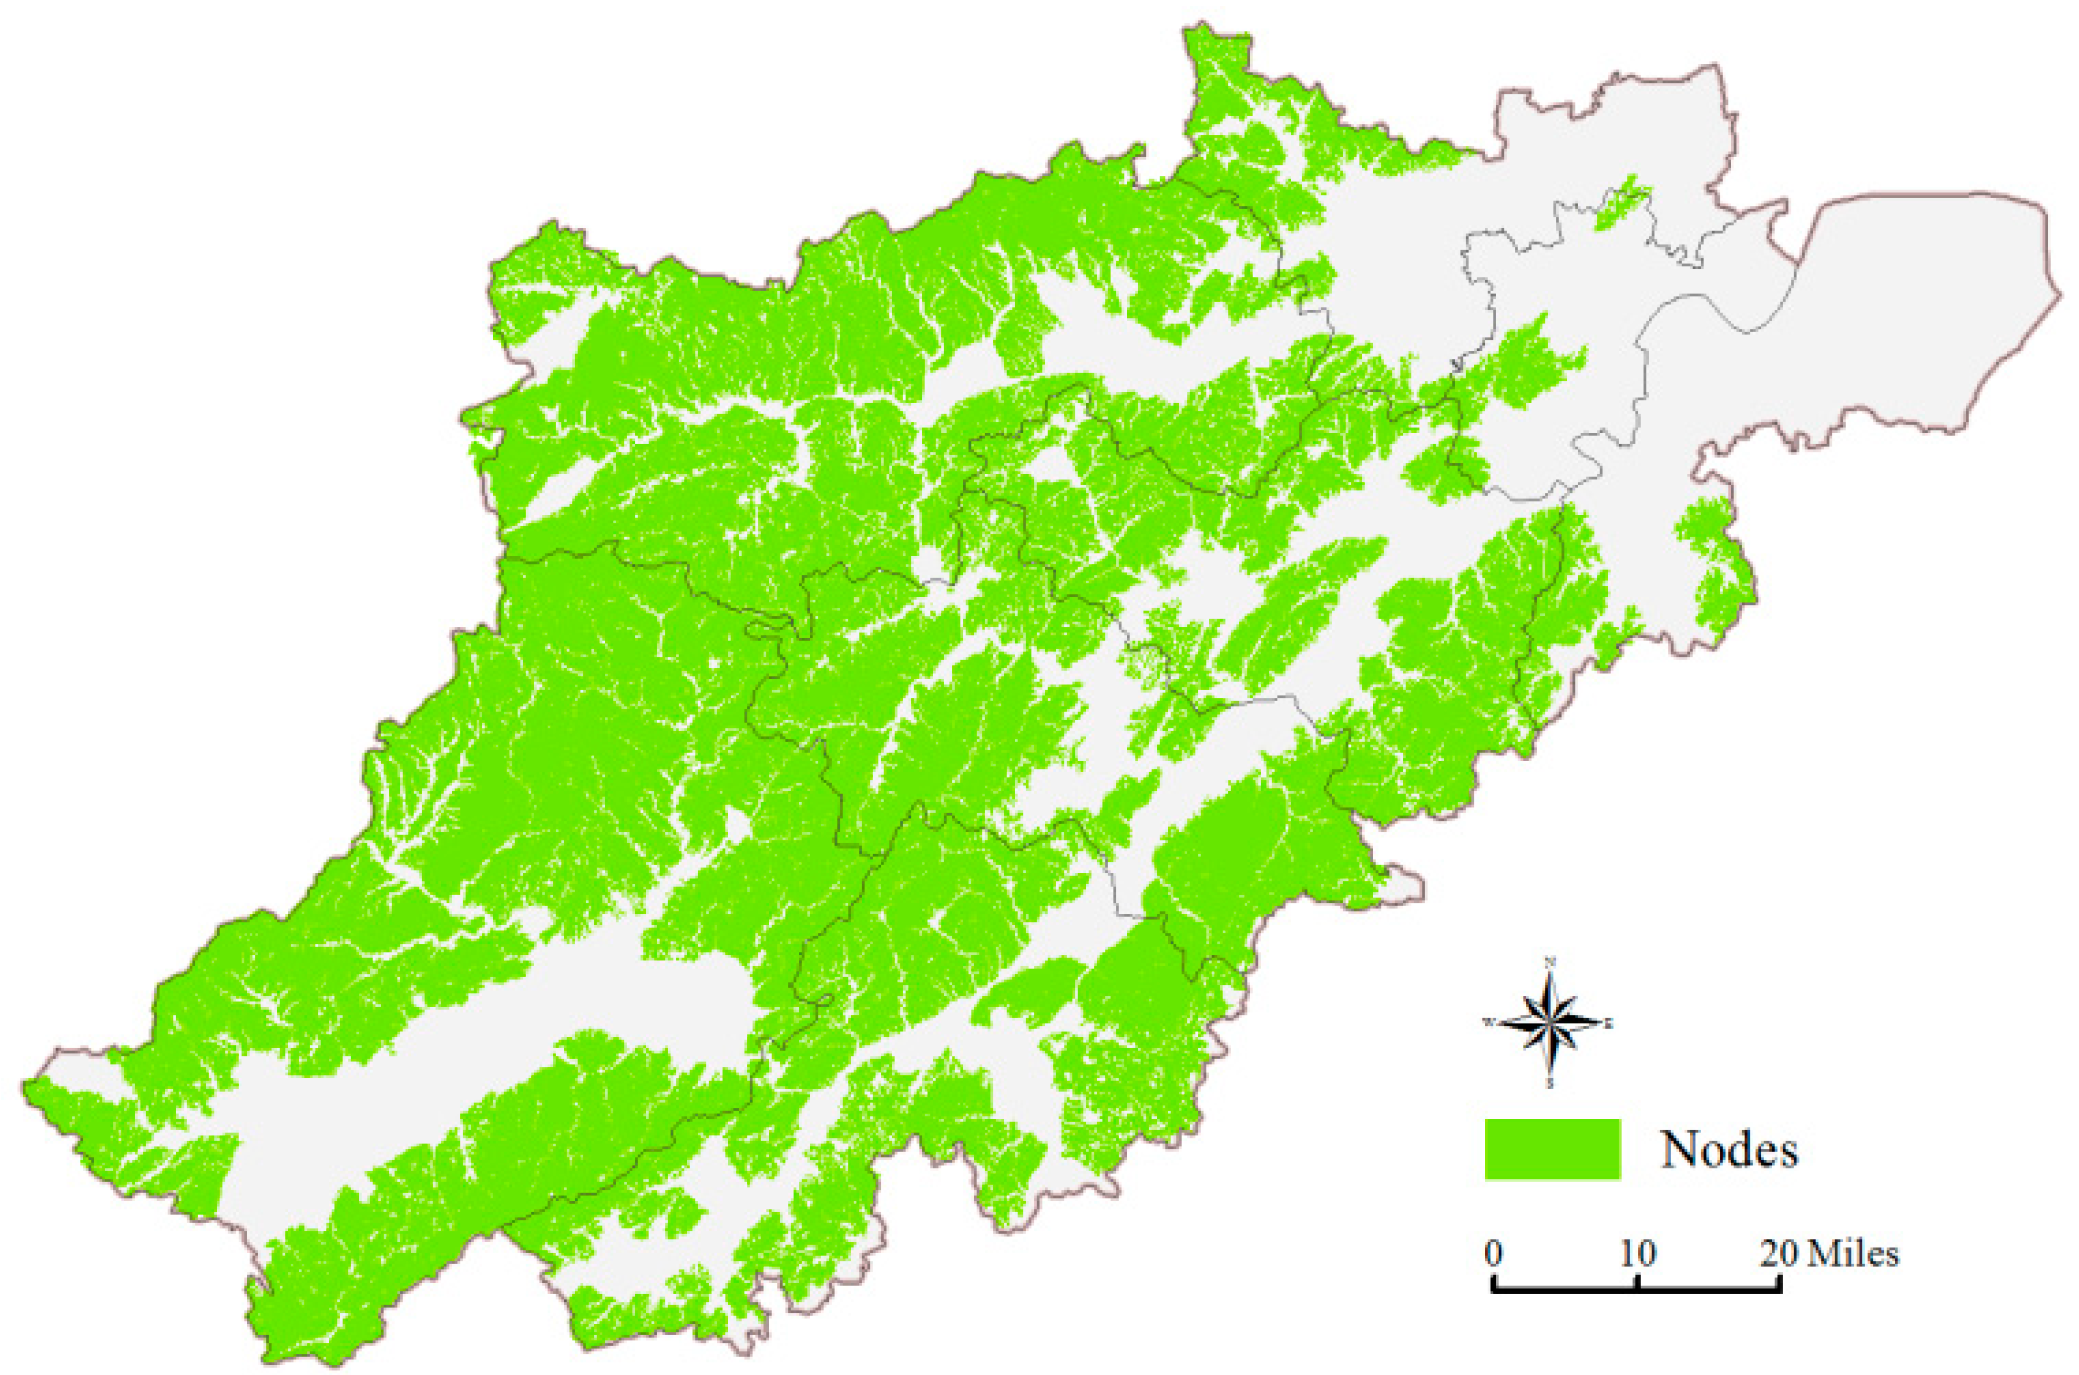
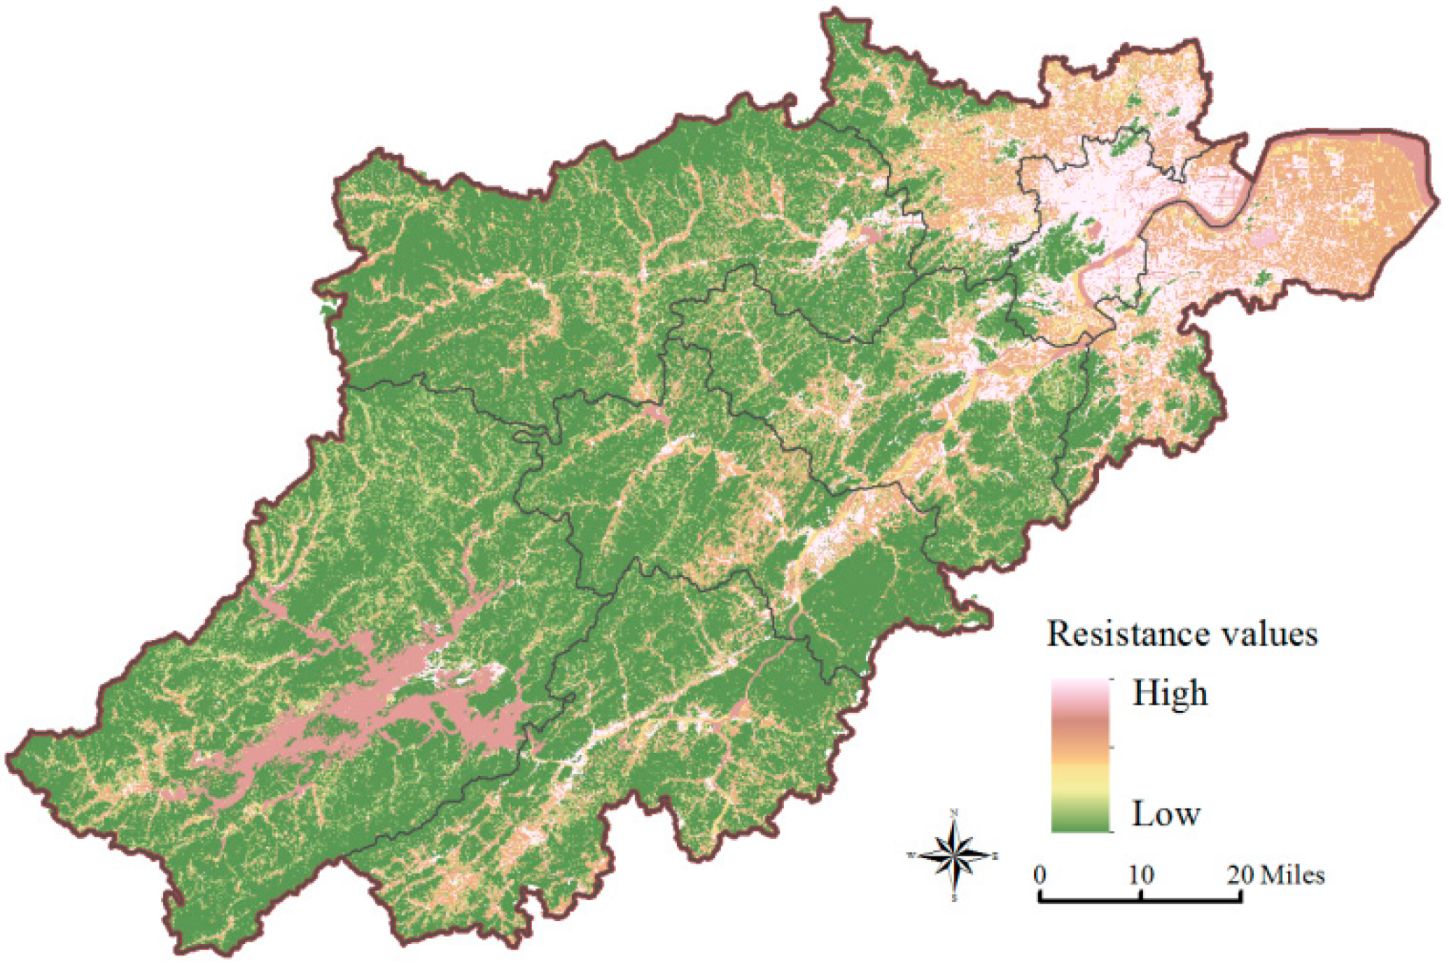
  • Ecological supply: According to the actual circumstances of the study area and prior related studies [11,15,17,22], we used four sub-functions, i.e., soil retention, habitat maintenance, landscape connectivity and environmental functions, to characterize the spatial heterogeneity of the ecological supply of farmland. Soil retention was defined as the capacity of farmland for reducing surface-soil erosion, maintaining soil nutrients and controlling sediment runoff compared with bare land [22]. The classic revised universal soil loss equation (RUSLE) was used to evaluate it in this study [23]. Habitat maintenance refers to the potential of farmland to provide species with suitable habitats for survival, reproduction and sustainable development [15]; we used the InVEST model to simulate it. Landscape connectivity reflects the degree of connection between farmland plots and their surrounding landscape plots [24]. Considering that the circuit theory model has greater randomness in the process of simulating species migration [25], we used it to map the landscape connectivity of the farmland in the study area. Environmental functions were assessed by three metrics, i.e., fertilizer, pesticide and plastic film consumption per unit of farmland [11]. A detailed description of the calculation of these functions is attached in Appendix A.
  • Landscape-cultural supply: The Maxent software (version 3.4.1) was used to map the landscape-cultural supply (aesthetics and recreation) of the farmland within the study area. Two sets of data, i.e., the occurrence localities of given observation points and environmental variables, were needed as input for the Maxent model. The former was represented by the location information of typical farmland randomly selected from the most popular tourism routes for agritourism published online by the government in April 2018 [26]. It included 100 aesthetic and recreational farmland samples. The latter consisted of ten natural and human variables selected based on their relationships with landscape-cultural supply. Details of the calculation process for this function have been introduced in a previous study by the author [6].
2.
Demand evaluation
The demand level refers to the degree to which the functions of farmland are required or desired by society [27]. However, a consensus on the best method for spatially evaluating the demand for farmland’s multiple functions has not been reached [28]. Here, considering that the ultimate beneficiaries of farmland functionality are humans, we used population density (PD) as one of the indicators characterizing the spatial distribution of demand. In addition, according to the unique attributes of each farmland function, we selected specific indicators (as follows) together with PD to spatially evaluate the demand level, respectively.
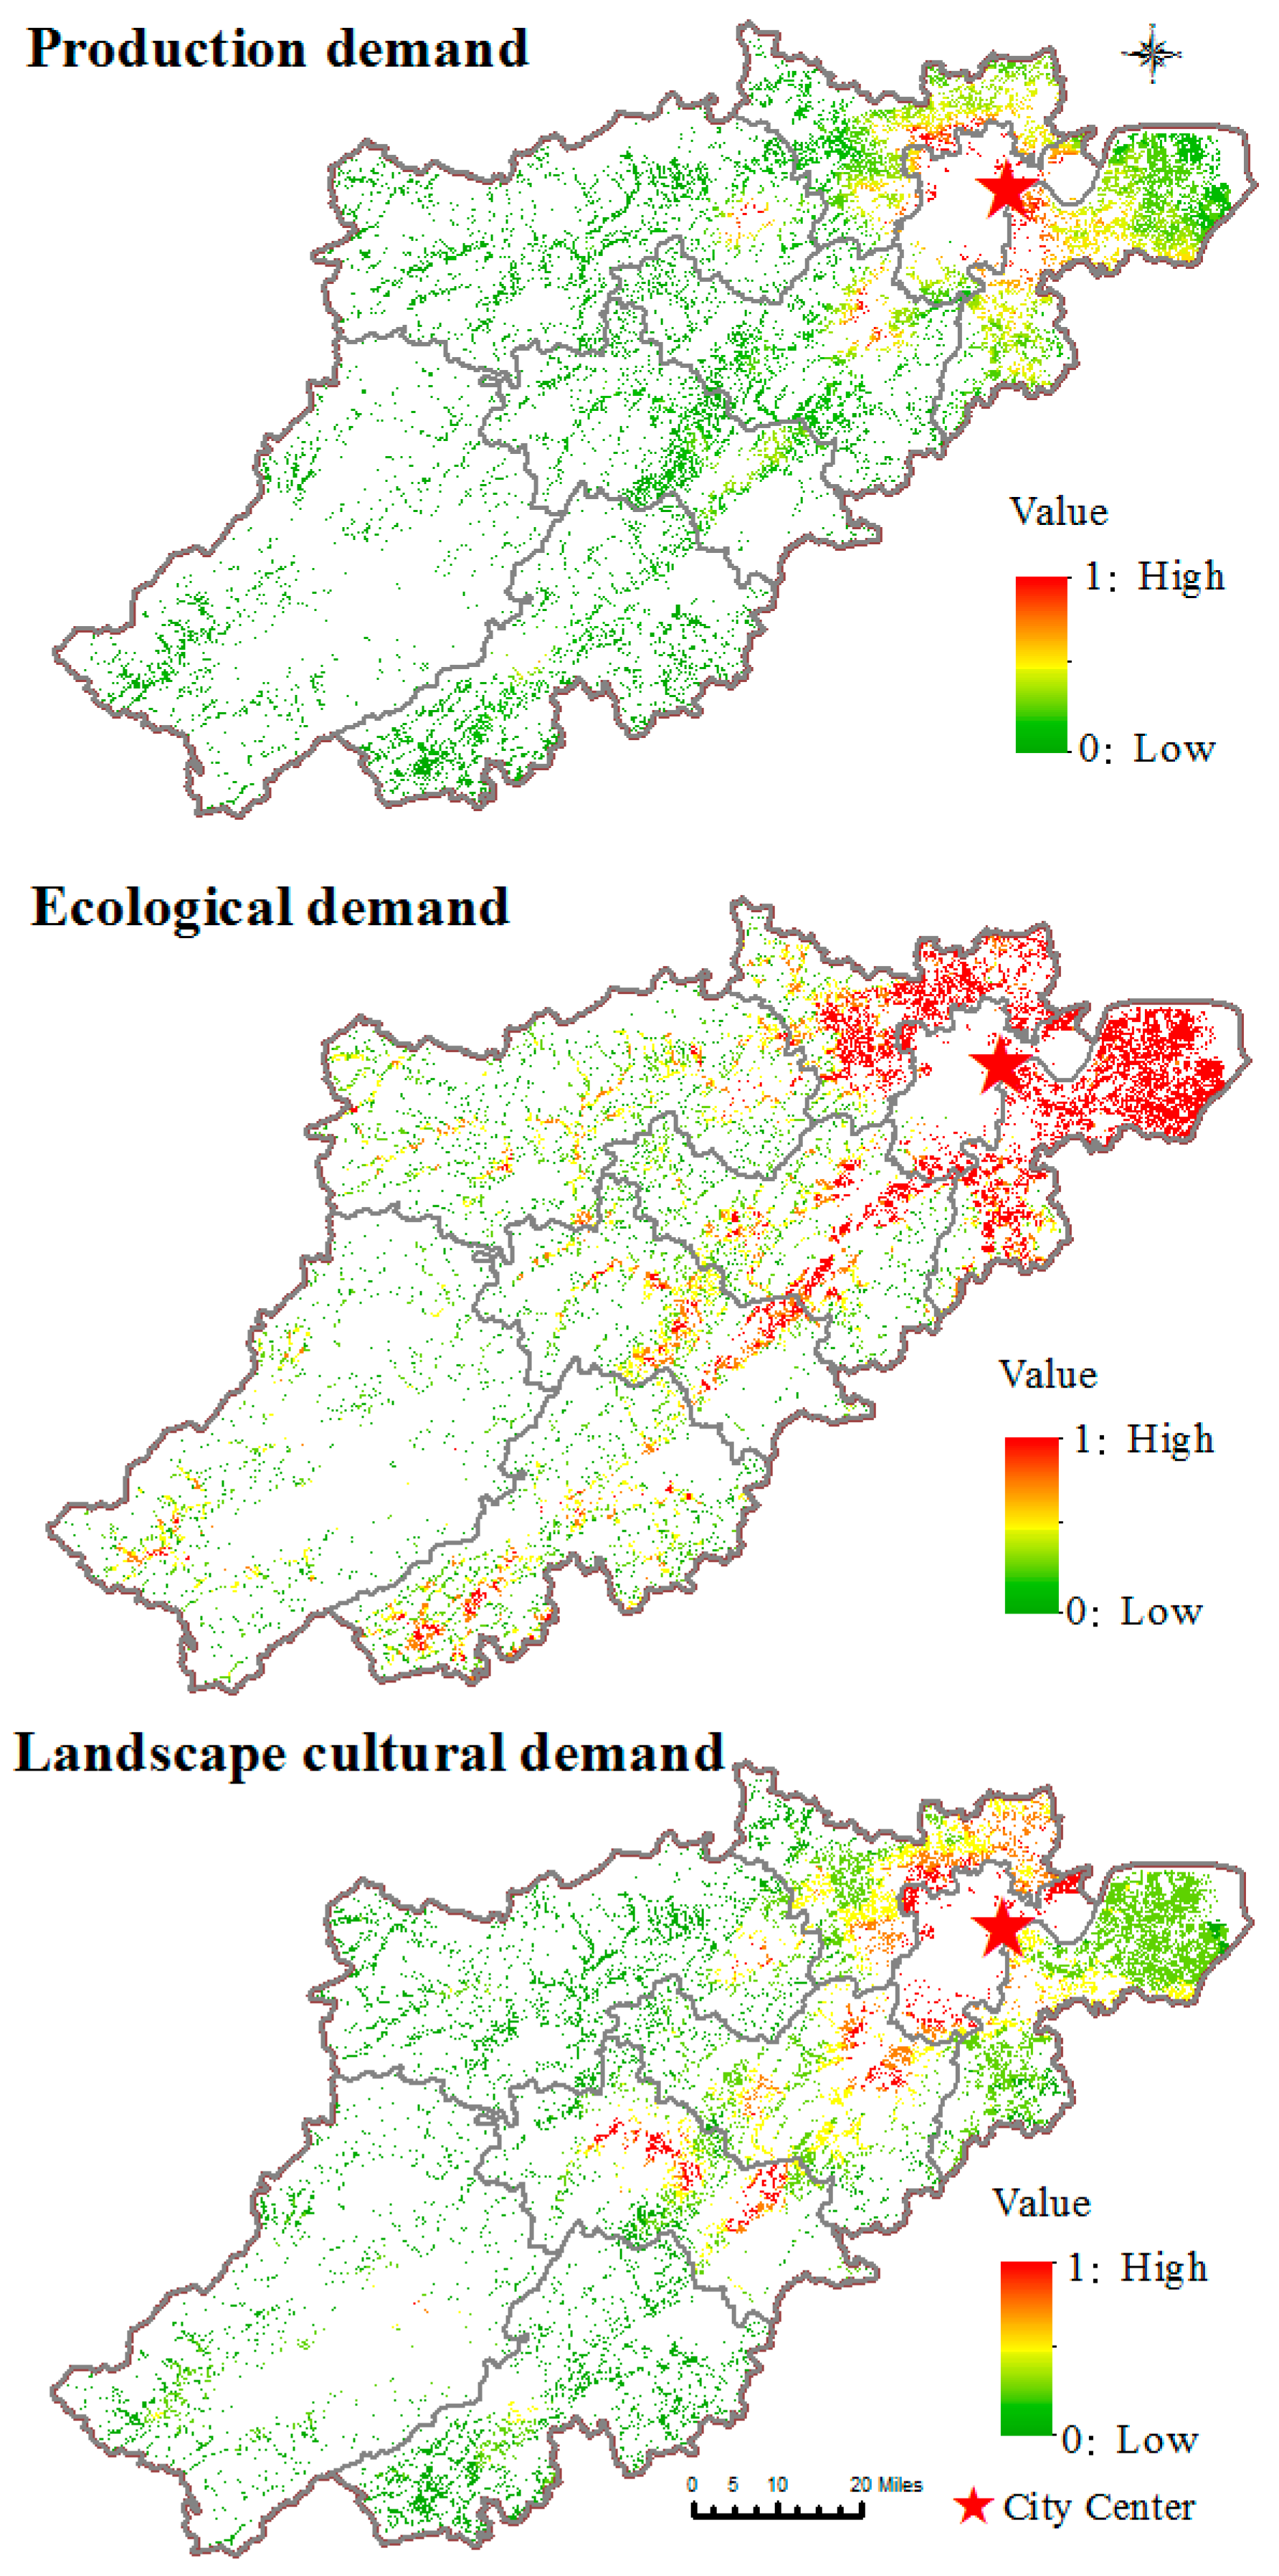
  • Production demand: Crop consumption data, obtained from statistical yearbooks or national economic statistical bulletins, can directly reflect the residents’ demand for the production function of farmland. However, due to its county-level scale, it is difficult for it to reflect more detailed spatial demand information. Thus, this study used the gross domestic product (GDP) data at a resolution of 1 km as a substitute indicator. We assumed that residents in regions with strong economies also had higher requirements for the quality of food consumed, which can indirectly reflect their higher demand for farmland production.
  • Ecological demand: Considering that forests, gardens and other areas with significant vegetation coverage are outstanding in the supply of ecological effects [29], this study assumed that the lower the proportion of green land around farmland, the higher would be the demand for ecological farmland. Therefore, the green land (gardens and forests) ratio (GLR) within 1 km around the farmland calculated using the zonal statistics tool in ArcGIS was used to represent the ecological demand of residents for farmland functions in this study.
  • Landscape-cultural demand: Considering that proximity is decisive for the experience of the aesthetics of and recreation in farmland landscape, we characterized the landscape-cultural demand of farmland according to the distribution of the beneficiaries [6]. In addition to the residents characterized by PD, the tourists of agritourism (TA) were another indicator used to evaluate the demand for cultural landscapes from farmland in this research. The TA data were acquired from the Hangzhou Statistical Yearbooks, and they covered the population information of each administrative unit in the study area. We then converted them to a shape file using ArcGIS 10.2.
To ensure consistency with supply, the above three indicators (GDP, GLR and TA) were normalized to values of 0–1, resampled to a 90 × 90 m spatial resolution and then added to a PD raster to, respectively, indicate the demand levels for each farmland function. Finally, the supply and demand maps were all classified into three levels (high, medium and low) using the geometrical interval classification method for visualizing the spatial pattern of each component across landscapes.

2.3.2. Evaluation of Relationships between Functions

Firstly, qualitative analysis was carried out through Spearman’s rank correlation analysis [30]. Considering that geospatial data are often nonlinearly or non-normally distributed, we selected this non-parametric correlation method, to initially explore the relationships between the above seven sub-functions of farmland within the study area. A positive or negative correlation coefficient indicates a synergistic or trade-off relationship, respectively, between the two sub-functions of farmland [15]. This correlation analysis was conducted in SPSS 22.0 and visualized in R.
Secondly, the analysis of the spatial correlation between the production, ecological and landscape-cultural functions of farmland was conducted using the coupling and coordination degree model [31]. The calculation formula is as follows:
C = F ( pro ) F ( eco ) F ( aes & rec ) / ( ( F ( pro ) + F ( eco ) + F ( aes & rec ) ) / 3 ) 3 3
T = α F ( pro ) + β F ( eco ) + γ F ( aes & rec )  
D = C × T  
where F(pro), F(eco) and F(aes&rec) are the values of the production, ecological, landscape and cultural functions of farmland, respectively; α, β and γ are the weights of three farmland functions, to which this study assigned equal values; C, T and D are the coupling degree, coordination degree, and multi-functional coupling and coordination degree (MCCD), respectively, each with values between 0 and 1. A higher MCCD value indicates more coordinated and orderly development between diverse functions.

2.3.3. Farmland-Use Zoning

The matching analysis between the supply and demand of farmland functions was conducted using the spatial clustering method. The result could provide basic zones for farmland-use zoning. Due to its superiorities of simplicity, high efficiency and good application effects, as demonstrated by previous studies, this study selected the most commonly used k-means clustering algorithm to conduct the above matching analysis [14]. The Elbow method was used to determine the optimal k value. The sum of squared errors (SSE) in the K-means clustering algorithm gradually decreases as the k value increases. It is generally considered that the k value corresponding to the inflection point (elbow) in the curve where the SSE decreases with an increase in k is the best k value. In this study, the value of k was assigned a value in the rage of 1 to 10 and then run independently in the R software. Additionally, the number of iterations was set to 30.
As shown in Figure 2, through the above clustering analysis, the basic farmland-use zones with similar supply and demand matching (SDM) characteristics were determined. Basic zones dominated by multiple functions (more than one function within this zone shows a high supply capacity) were further divided into ultimate utilization zones by overlaying with the spatial relationship layer (MCCD) between its various functions. Ultimately, with reference to the characteristics of SDM and the MCCD, differential suggestions for each farmland zone, including current utilization and future development, served as references provided for the managers and decision makers.

3. Results

3.1. Patterns of Supply Capacity

As presented in Figure 3, the supply patterns for three functions showed a large discrepancy. In terms of production, 35.83% of farmland with high supply values was observed in the northeast plains, whereas 19.49% of farmland located in the remote mountainous areas exhibited low productive supply capacity. Contrary to the distribution of production functionality, farmland with high ecological supply (79.64%) were concentrated in the western and southern hilly areas, and 7.82% of farmland located in northeast plains showed low ecological effects. Regarding cultural landscapes, low supply (47.16%) was scattered mostly at the edge of the study area, whereas high supply (15.23%) was observed in both urban and rural areas.

3.2. Patterns of Demand Level

Overall, the demand level for the three farmland functions exhibited a similar spatial pattern, in that 52% of farmland with high demand was observed near the downtown area, whereas 29% of farmland was located in remote mountainous areas exhibited low demand (Figure 4). Specifically, 41.23% of farmland with high ecological demand was concentrated in the northeast plains. In terms of the cultural landscape function, farmland close to the downtown area and farmland located in the suburban valley plains (26.15%) showed relatively high demand levels. As for production, farmland with high demand (10.72%) showed a distribution pattern extending from the city center to the surrounding areas.

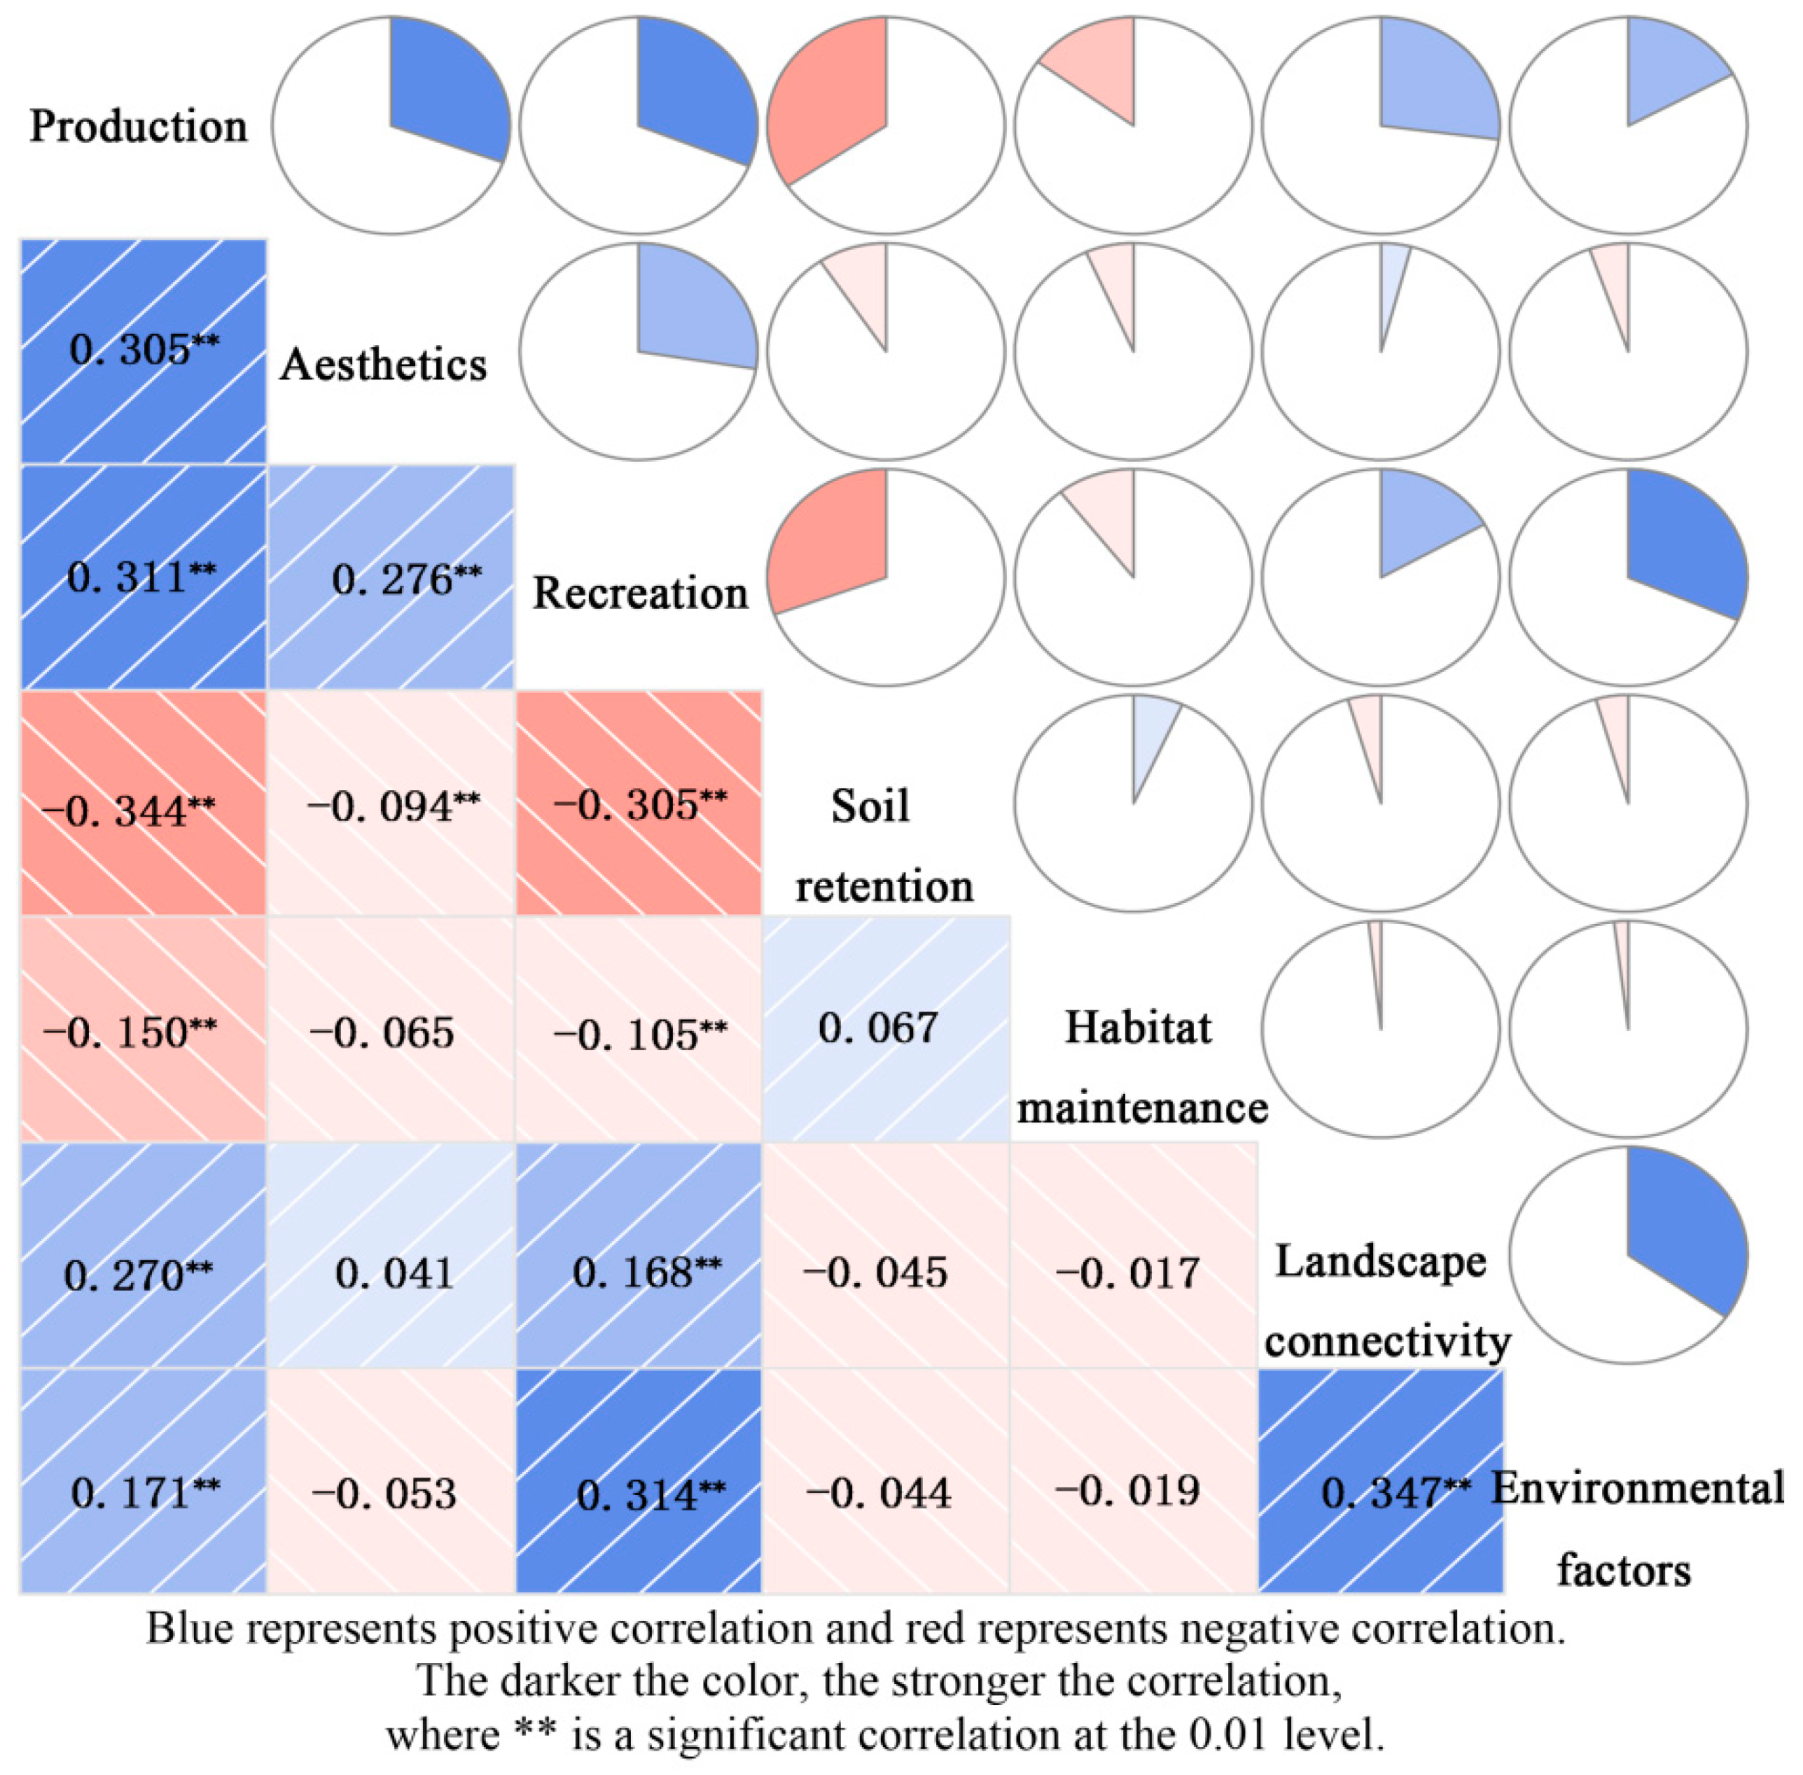
3.3. Relationships between Multiple Functions of Farmland

The results of the Spearman’s rank correlation analysis are presented in Figure 5. Overall, there was a positive correlation between the production and landscape-cultural functions of farmland, whereas ecological function was negatively correlated with the other functions. From the perspective of correlation types, among the 21 sets of correlations between the seven sub-functions, 10 sets were positive (between the production, aesthetics, recreation, landscape connectivity and environmental functions) and 11 sets were negative (between soil retention, habitat maintenance and the other sub-functions). In terms of the correlation strength, six sets were weak correlations, six sets were strong correlations and the other correlations were not obvious. Specifically, the strong correlations were mainly observed between the production, aesthetics, recreation and soil retention sub-functions.
Figure 6 shows the spatial patterns of the multi-functional coupling and coordination degree (MCCD) of farmland. The results show that farmland with MCCDs higher than 0.60 was primarily distributed in flat areas in the northern and central regions. Farmland with MCCDs lower than 0.47 was mostly observed in the northeast region and the western hilly areas, indicating an uneven development of various functions within this region.

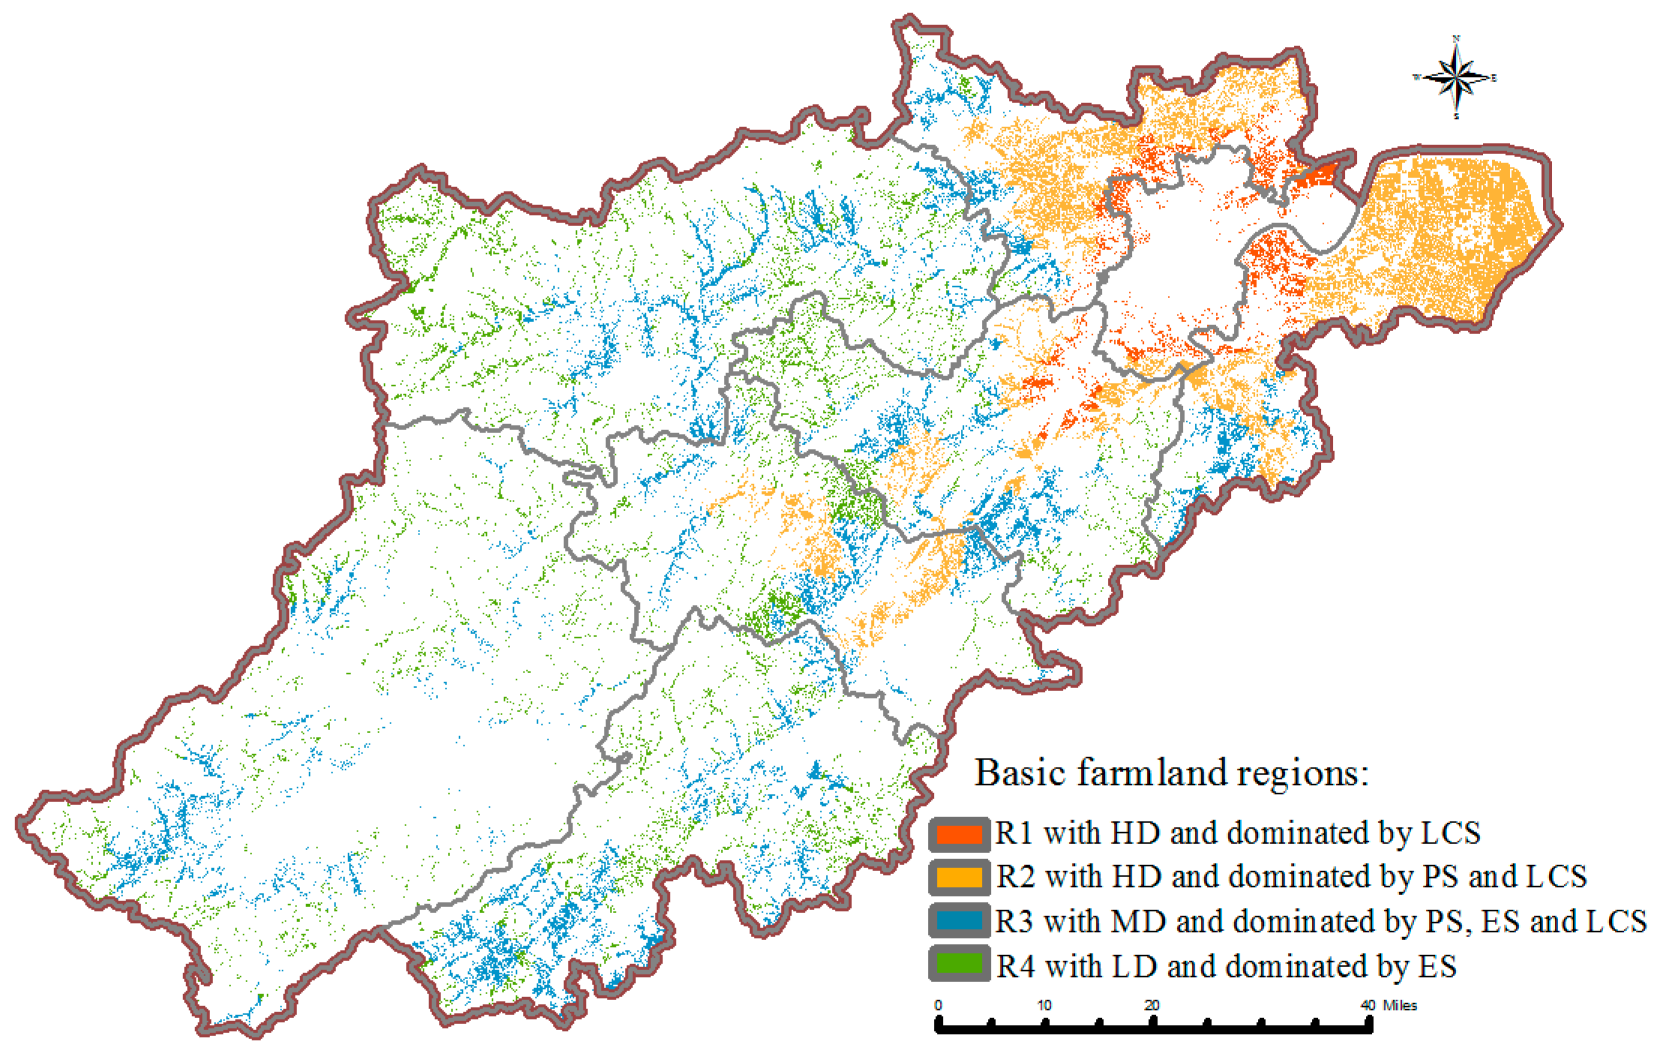
3.4. Farmland Zoning Based on the Characteristics of Matching between Supply and Demand, and the Relationships between Multiple Functions

The SDM characteristics of farmland functions calculated using the spatial clustering method provided the basic information for farmland-use zoning. As presented in Figure 7, after clustering analysis, the farmland within the study area was divided into four basic regions. They were R1 (8.56% of farmland with higher demand and dominated by cultural landscape supply), R2 (36.17% of farmland with high demand and combined with production and cultural landscape supply), R3 (32.31% of farmland with medium demand and combined with production, ecological and cultural landscape supply), and R4 (22.96% of farmland with low demand and dominated by ecological supply).
According to the MCCD values for the studied farmland, the clustering results above were further divided into six farmland-use zones (Figure 8). Considering that R1 and R4 were only dominated by one type of function, we did not partition them further. As for the farmland within R2 and R3, it was divided into two sub-regions based on their MCCD values. Finally, the farmland within the study area was divided into six zones, namely, Z1 (original R1), Z2 (R2 with high MCCD), Z3 (R2 with medium or low MCCD), Z4 (R3 with high MCCD), Z5 (R3 with medium or low MCCD) and Z6 (original R4).
Among them, Z1 accounted for 8.32% of the total farmland and had a relatively high demand and landscape-cultural supply. It was located within and around the densely populated urban areas. Contrary to Z1, farmland in Z6 constituted 23.65% of the total farmland. These farms were mainly scattered in the remote mountainous areas and characterized by high ecological supply capacity but low demand. Z2 (10.23%) and Z4 (9.98%) exhibited relatively high MCCDs and were high-quality farmland with great site conditions. They were all located in the valley plains, but Z2 was close to the downtown area and Z4 was distributed in the countryside; thus, the demand level for Z2 was higher than that for Z4. Farmland within Z3 (26.26%) and Z5 (21.56%) had similar characteristics of demand and supply as well as location, whereas the farmland in these zones was all characterized by medium or low MCCDs.

4. Discussion

4.1. Evaluation of Supply and Demand Patterns of Farmland

In this research, we mapped the multi-functional supply and demand using diverse methods and multi-sourced datasets under the GIS environment. To make the results more scientific and objective, we utilized the Maxent model (a machine-learning algorithm) to map the supply of landscape-cultural functionality, instead of the expert evaluation method, used in previous studies [15,32]. Therefore, we implemented the mapping of two sub-functions of landscape (aesthetic and recreation). Current research usually evaluates the multi-functional demand of farmland using questionnaire surveys or interviews [18,33], which do not generate detailed spatial information. Here, we attempted to map the demand patterns for each function to further expand their usage in farmland zoning.
In this study, there were considerable differences in the spatial supply patterns of farmland’s diverse functions, which was consistent with previous studies [11,12]. Among them, valley plains characterized by fertile soil, abundant water, flat terrain and convenient infrastructure, are greatly conductive to agricultural production [11,15]. However, affected by urbanization, the fragmented landscape of some plain farmland, adjacent to the downtown area, also limited both production and ecological supply [34]. However, from another perspective, this urban farmland is usually close to residences and transportation facilities and, thus, is more likely to provide recreation for residents [6,28]. Additionally, rural farmland near cultural and historic scenic spots also has potential to provide aesthetics or recreation. The observed high ecological value of farmland in remote mountainous areas can be attributed to its superior natural conditions. These areas are far away from the city and less disturbed by people; thus, the ecosystem within these areas tends to be relatively stable [15].
As previous studies have reported, the population distribution played an overriding role in the multi-functional demand patterns of farmland [6,27,32]. In a way, beneficiaries’ demand for farmland’s aesthetics and recreation depends on how close they live to the areas [35]. A great ecological environment and superior-quality agricultural products are also in high demand in densely populated areas. Therefore, high-demand farmland was primarily located nearby the densely populated urban area in the study area [17,27]. It is worth mentioning that, in addition to these urban areas, some rural farmland with well-established infrastructures has also been observed with high cultural landscape demand. That might be related to the enhancing transportation and accommodation and the increasing incomes and leisure time of residents [36,37]. We also found that the ecological demand for farmland in the downtown area and surrounding suburbs of Hangzhou was typically high. According to the land-use survey data for Hangzhou in 2014, the ratio of farmland areas to green spaces in two suburban districts adjacent to Hangzhou’s downtown area was 45.82% and 68.23%, respectively. Apparently, farmland in these areas played a vital role in regulating the ecological environment.
As stated above, significant differences still exist between the spatial patterns of supply and demand in the multiple functions of farmland, which is related to the increasing conflict between urban development and farmland protection. Since farmland has strong building suitability, it is more likely to be transferred for construction use in a land-scarce area, such as a metropolitan district [3,38]. For instance, the northeast part of our research region is particularly well suited for farmland production, with flat terrain and abundant water resources, but it is also the core region of city development. As rapid urbanization and population growth increase the various functional demands on farmland [39], the fragmentation and pollution of farmland follow, as well as the supply of production and ecological functions becoming limited [12,34]. Therefore, to optimize farmland resource utilization in different regions, it is crucial for policymakers to make decisions according to local conditions and zone management.

4.2. Relationships between Multiple Functions of Farmland

Compared with other types of land (such as forests and gardens), one single function of farmland may not be distinctly characteristictive. However, its multi-functional effects are prominent, with huge multi-dimensional coupling value, such as that involving the economy, ecology and culture [11,40]. In the context of the rapid urbanization and socioeconomic development and to narrow the gap between urban and rural areas, the Chinese government has recently issued relevant supporting policies for vigorously developing agritourism and a multi-functional countryside. As an important part of rural areas, farmland is also receiving corresponding attention, and its multi-functional effects are manifest. Therefore, to ensure the sustainable development of rural resources, it is essential to clarify the relationships between the multiple functions of farmland.
Consistent with previous studies, a positive relationship and strong synergy between the production and landscape-cultural functions were observed in this study [12,16,17]. As highly aesthetic farmland is distributed concentratedly and contiguously, this is greatly conducive to agricultural production [15]. Additionally, the recreational activities of farmland mainly include fruit and vegetable picking, farming experiences and other activities, which are also based on superior agricultural production activities [41].
Other than related research with only the production, ecological and landscape-cultural functions (without sub-functions) evaluation of farmland, this study further found correlations between the production and ecological functions, which were both negative and positive. For instance, there was a negative correlation between production and habitat maintenance, which might be contributed to by less human disturbance [15,24]. However, farmland production is inseparable from farmers and managers, since excessive intensive management might cause the homogenization of the farmland landscape [15]. Meanwhile, a positive correlation between production and environmental function was demonstrated, as the productivity of farmland is related to yield, as well as the quality of agricultural products. Briefly, a good ecological environment favors the improvement of the material output efficiency of farmland.
Both negative and positive correlations between ecological functions and landscape cultural functions were found in the present study. Among them, recreation was negatively related to habitat maintenance. From the above, farmland with high habitat maintenance is generally less affected by human activities [12,17], which conflicts with recreational farmland aiming to provide people with leisure and entertainment [6,28]. In addition, this study also found a positive relationship between recreation and environmental functions. Similar to the case for production, the development of rural tourism also requires a good ecological environment because people are more willing to go to environmentally healthy farmland for agricultural activities [6].
As stated above, our results show diverse relationships among the multiple functions of farmland, which further highlights the importance of including these relationships in farmland-zoning projects.

4.3. Comprehensively Considering Supply, Demand and Relationships of Multiple Functions in Farmland Zoning Is Important for Realizing Reasonable Usage of Farmland Resources

Along with the increasing conflict between city development and farmland protection, it is necessary to guarantee the reasonable and sustainable use of farmland resources by zoning. As stated above, the multi-functional supply, demand and relationships of farmland all play crucial roles in farmland zoning. In previous studies, the farmland-zoning process depended on supply alone, ignoring the demand patterns dominated by socioeconomic conditions [10,12,19]. That is unilateral and cannot address the real situation. Thus, to discern better applications in farmland zoning, we further conducted spatial analyses of supply and demand matching (SDM) and the multi-functional coupling and coordination degree (MCCD) based on above results. Furthermore, the multiple functions of farmland were evaluated at the plot scale. Compared with the regional scale, a finer scale could provide more accurate information for government decision making.
In the structure of farmland zoning, regarding the SDM, the examined farmland was divided into four different zones by the spatial cluster analysis of the multi-functional supply and demand maps. In each zone, the supply capacity value can assist in identifying the current dominant or shortcoming functions, and the multi-functional demand level can guide the direction of the future usage and management of this farmland. Additionally, it is worth noting that some regional farmland is not dominated by only one type of function [12]. For instance, in this study area, valley farmland in proximity to rural residences was characterized by both high production and aesthetic values. Moreover, the ultimate aim of farmland-use zoning is realizing the multi-functional coordinated development of farmland and maximizing its compound benefits [12,19]. Therefore, in addition to the spatial patterns of SDM, the MCCD is also vital content that needs attention in farmland zoning. Farmland with high MCCD value have more potential to bring multi-functional compound benefits into play. Comprehensively considering the spatial patterns of SDM and MCCD, we finally divided the farmland within the study area into six zones, as follows:
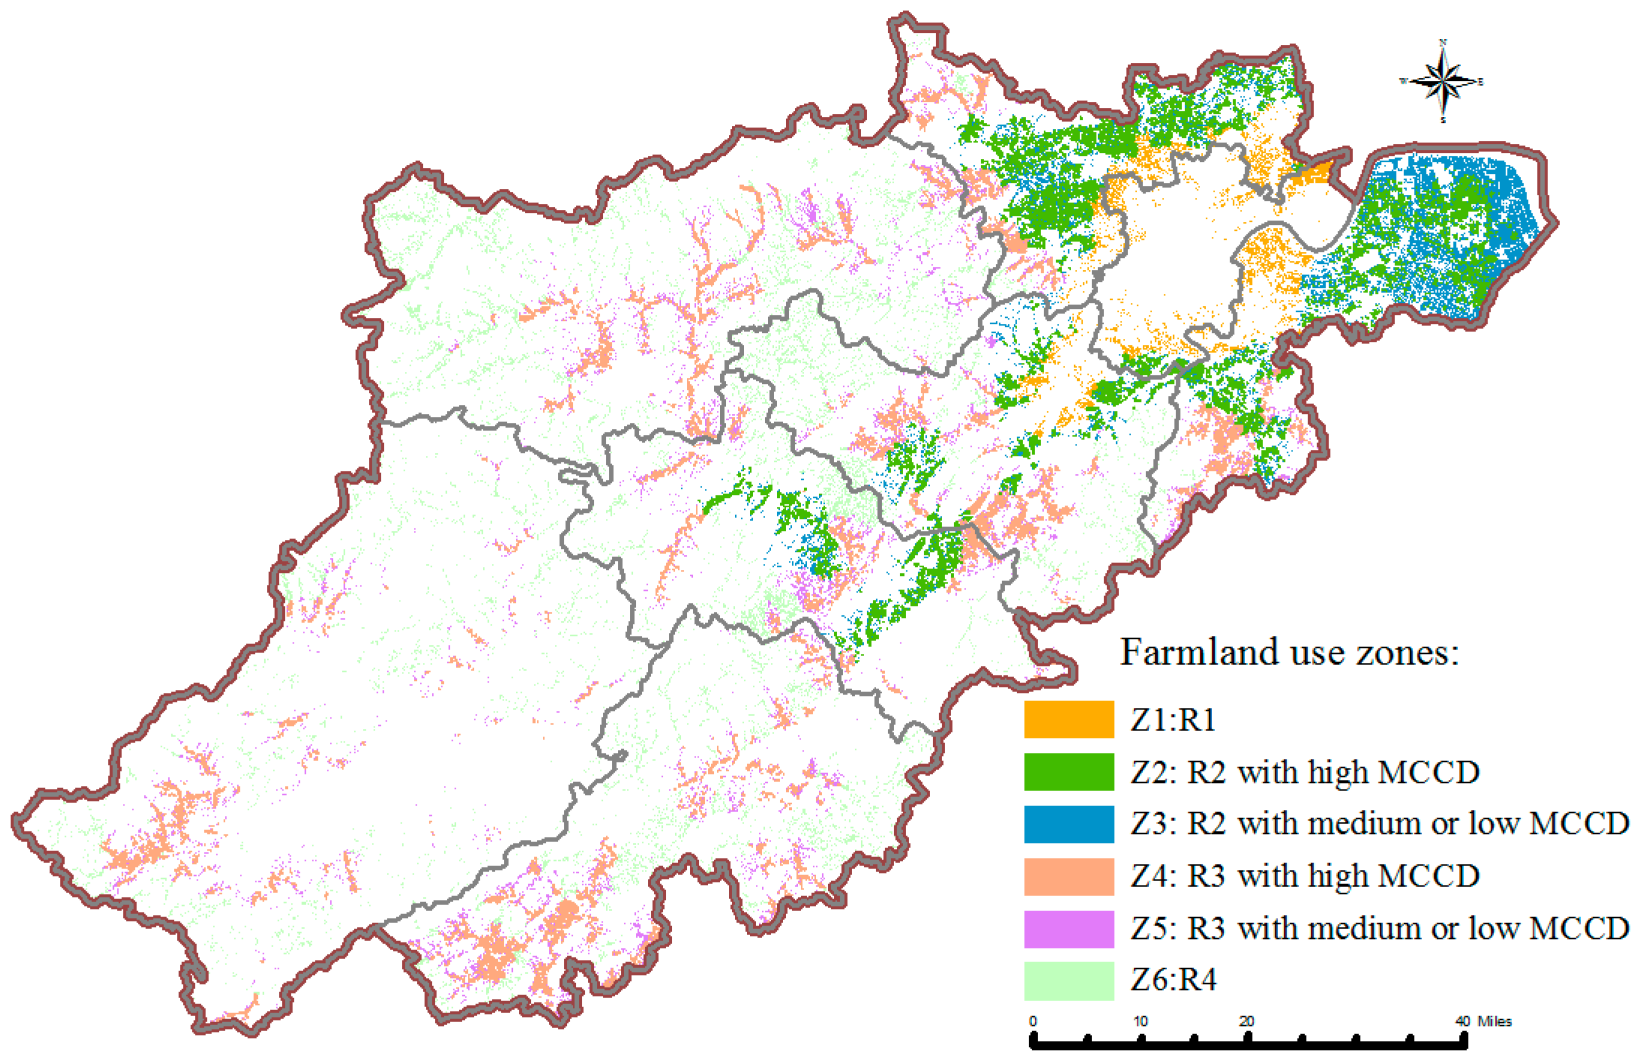
  • The farmland within Z1 is veritable urban farmland. It is mainly distributed along traffic lines and around towns, and is close to many tourist attractions, so its landscape and cultural functions are very prominent [6]. The medium value of MCCD indicates a certain potential for the multi-functional compound development of these farmland. Furthermore, the high population density and urbanization level make its multi-functional demand generally high. Therefore, more attention should be devoted to the ecological and production supply in these farmland to meet high demand while simultaneously improving the landscape-cultural functions. Contrary to that of Z1, farmland within Z6 was characterized by low MCCDs. Due to the high altitude and inconvenient traffic situation, its productive and cultural capacities are poor [11]. It is recommended to focus on solving the low contiguousness of this farmland through land consolidation and ecological restoration, and to improve its deree of utilization by constructing infrastructures.
  • The farmland within Z2 and Z3 is all located in suburban areas. The geographical advantages of being located in a plain water network and close to downtown areas make this farmland characterized by relatively high multi-functional demand, as well as high production and landscape-cultural supply capacity [11,12]. However, contrary to that of Z2, the farmland within Z3 has lower MCCDs. This farmland is mainly responsible for supplying vegetables and aquatic products to urban areas and thus need large amounts of chemical fertilizers, pesticides and films. Additionally, many industrial areas are concentrated here. The low ecological benefits caused by these factors may have hindered the MCCDs of this farmland. Strengthening the control and supervision of soil pollution may present an opportunity to ensure the sustainable usage and development of these farmland resources.
  • Z4 and Z5 are rural farmland. Z4 is a densely occupied by high-quality farmland. Benefiting from its good site condition, superior natural environment and long historical farming culture, the production, ecological and landscape-cultural functions of this farmland have all developed synergistically. However, fragmented landscapes and inconvenient transportation hinder the synergy between the productive and aesthetic functions of farmland in Z5. Thus, promoting specialty agricultural products, such as mountain vegetables and fruits, and creating exclusive agricultural brands in the countryside may be the opportunity to maximize the multi-functional compound benefits of these farmland [42].

5. Conclusions

In the context of China’s rural vitalization, the multi-functionality of farmland is highly relevant. Additionally, rapid urbanization threatens the sustainable development of farmland resources. Therefore, there is a growing need to conduct regionally differentiated and targeted farmland management measures by farmland zoning to ensure the maximization of multi-functional compound benefit. Although research on farmland zoning has been conducted by assessing multiple functions, it has ignored the demand patterns of diverse functionality. This study sought to conduct a farmland-zoning program by exploring the spatial variety of farmland’s supply and demand and the relationships between its diverse functions. Furthermore, our research also improvemed upon current evaluations, such as mapping the landscape-cultural function through a machine-learning algorithm.
Our results show a large discrepancy in the supply-and-demand patterns of different farmland functions. High production supply was mostly concentrated in flat plains, whereas high ecological supply was mainly observed in remote mountains. Both urban and rural areas with well-established infrastructures have the capacity to provide significant landscape culture. Regarding demand, high values were frequently observed near the downtown area. Additionally, some suburbs with low vegetation coverage had stronger ecological demand, and partial remote rural farmland also exhibited high aesthetic or recreational demand.
Based on the above results, the study area was divided into four basic farmland-use zones through SDM analysis conducted using the k-means clustering algorithm. According to the MCCD results of the spatial correlation analysis, the basic farmland-use zones dominated by more than one type of function were further divided into sub-zones. Ultimately, six farmland-use zones were determined, and targeted suggestions applicable to each zone were put forward in this study. In each zone, the SDM information indicated the current situation and the future usage of the farmland’s single function, and the MCCD values assisted in judging the potential of the multi-functional compound development of the farmland within the zone.
There are also some considerations that need to be addressed; with respect to the datasets, higher-resolution data, such as the location information of tourists from mobile phones and visitation frequencies for agricultural spots, will assist the demand-mapping of farmland functions. Moreover, due to the relationship between the multiple functions of farmland changing over time, this dynamism should also be considered when conducting farmland zoning in the future.
Generally, scientific planning and sustainable management need to design balanced strategies. Zoning farmland, by integrating multi-functional supply, demand and relationships can contribute to these balanced strategies. Our results can provide a valuable basis for further research and provide relevant input to inform stakeholders. Furthermore, this assessment structure for farmland zoning is also applicable to other rapidly urbanizing regions.

Author Contributions

Conceptualization, S.H. and K.W.; methodology, S.H.; software, S.H. and M.Z.; validation, S.H. and K.W.; formal analysis, S.H.; investigation, S.H.; resources, S.H. and M.Z.; data curation, S.H. and Y.L.; writing—original draft preparation, S.H.; writing—review and editing, S.H., L.L., Q.X. and J.L.; visualization, S.H.; supervision, K.W. and C.H.; project administration, S.H. and K.W.; funding acquisition, S.H. and C.H. All authors have read and agreed to the published version of the manuscript.

Funding

This research was funded by the National Natural Science Foundation of China (Grant No. 42001201); National Social Science Foundation of China (Grant No. 20BJY085); and Humanities and Social Sciences Youth Foundation of the Ministry of Education (Grant No. 20YJCZH095).

Institutional Review Board Statement

Not applicable.

Informed Consent Statement

Not applicable.

Data Availability Statement

Not applicable.

Conflicts of Interest

The authors declare no conflict of interest.

Appendix A

The detailed calculation processes for the four ecological sub-functions of the farmland in this study were as follows:

Appendix A.1. Soil Retention

The revised universal soil loss equation (RUSLE) [23] was used to evaluate the soil retention function of the farmland within the study area:
A c = R K LS ( 1 C P s ) ,
where A c is the soil conservation; R, K, LS, C and P s are the factors of rainfall erosion, soil erodibility, terrain, vegetation cover and management, as well as the measures for conserving the soil and water, respectively (Figure A1).
In the present study, the R factor was calculated according to previous research similar to this study area [43,44,45]; the erosion productivity impact calculator (EPIC) proposed by Williams et al. (1984) [46] was used to estimate the K value; and the LS factor was evaluated using the international DEM-based method [23]. Referring to previous research [47], the C value of paddy fields was uniformly assigned as 0.1 and the C value of dry land was calculated using the method established by Liu et al. (1999) [48]. In terms of the P s factor, we assigned the P s values of paddy field and dry land as 0.01 and 0.4, respectively, according to [49].
Figure A1. Spatial patterns of the R, K, LS and CP factors of farmland within the study area.
Land 10 01014 g0a1

Appendix A.2. Habitat Maintenance

The habitat quality module in the integrated valuation of ecosystem services and trade-offs (InVEST) model [15] was used to simulate the habitat maintenance of farmland in this study. Its calculation process was mainly based on the habitat suitability of different types of farmland and their sensitivity (Table A1) to diverse threat sources (Table A2). Referring to previous research, these parameters were set as follows:
Table A1. Detailed information of the threat sources applied in the InVEST model.
Threat SourcesMaximum Influence
Distance (km)
WeightsDeclining Linear Correlation
Urban land160.9exponential
Rural settlement120.8exponential
Traffic land201linear
Other construction land80.5exponential
Table A2. The sensitivity of different farmland types to threat sources.
Farmland TypesHabitat SuitabilityUrban LandRural SettlementTraffic LandOther
Plain paddy field0.80.60.50.30.25
Plain dry land0.70.50.40.20.15
Slope paddy field0.90.80.60.50.35
Slope dry land10.90.70.50.4
Non-arable land00000

Appendix A.3. Landscape Connectivity

The circuit theory model [25] was used to map the landscape connectivity of the farmland in the study area. The key factors for the operation of this model are the node data and resistance values that need to be input. This study took the farmland, woodland, garden and grassland plots larger than 1000 hectares within the study area as the basic node elements (Figure A2). Additionally, the spatial patterns of the resistance value of the different landscapes in this study were as shown in Figure A3.
Figure A2. Spatial patterns of the R, K, LS and CP factors of farmland within the study area.
Land 10 01014 g0a2
Figure A3. Patterns of the resistance values of landscape in the study area.
Land 10 01014 g0a3

Appendix A.4. Environmental Factors

The environmental function was represented by three aspects, i.e., the fertilizer, pesticide and plastic film consumption per unit of farmland, in this study. These indicators were considered to equally contribute to the environmental supply capacity and finally overlaid to obtain the environmental supply capacity of farmland.
Before calculating the ecological function of farmland, the above four sub-functions were normalized to 0–1 values, resampled to a 90 × 90 m spatial resolution and then overlaid with the same weight of 0.25 to obtain the final ecological supply of farmland.

References

  1. Cheng, L.; Jiang, P.; Chen, W.; Li, M.; Wang, L.; Gong, Y.; Pian, Y.; Xia, N.; Duan, Y.; Huang, Q. Farmland protection policies and rapid urbanization in China: A case study for Changzhou City. Land Use Policy 2015, 48, 552–566. [Google Scholar]
  2. Lu, X.; Huang, S. Barriers of and solutions to farmland conservation in China. J. Huazhong Univ. Sci. Technol. 2010, 24, 79–84. [Google Scholar]
  3. Luo, X.; Luo, J.; Zhang, L. Farmland pressure and China’s urbanisation: An empirical study with the view of geographical difference. Chin. J. Popul. Sci. 2015, 127, 47–59. [Google Scholar]
  4. Su, Y.; He, S.; Wang, K.; Shahtahmassebi, A.R.; Zhang, L.; Zhang, J.; Zhang, M.; Gan, M. Quantifying the sustainability of three types of agricultural production in China: An emergy analysis with the integration of environmental pollution. J. Clean. Prod. 2020, 252, 119650. [Google Scholar] [CrossRef]
  5. Si, Z.; Li, M.; Qiu, W.; Yun, W. Regional difference analysis and preservation of cultivated land resources in China. J. Nat. Resour. 2010, 25, 713. [Google Scholar]
  6. He, S.; Su, Y.; Shahtahmassebi, A.R.; Huang, L.; Zhou, M.; Gan, M.; Deng, J.; Zhao, G.; Wang, K. Assessing and mapping cultural ecosystem services supply, demand and flow of farmlands in the Hangzhou metropolitan area, China. Sci. Total Environ. 2019, 692, 756–768. [Google Scholar] [CrossRef]
  7. Xu, K.; Wang, J.; Wang, J.; Wang, X.; Chi, Y.; Zhang, X. Environmental function zoning for spatially differentiated environmental policies in China. J. Environ. Manag. 2020, 255, 109485. [Google Scholar] [CrossRef]
  8. Fischer, S.; Thatje, S. Temperature effects on life-history traits cause challenges to the management of brachyuran crab fisheries in the Humboldt Current: A review. Fish. Res. 2016, 183, 461–468. [Google Scholar] [CrossRef]
  9. CzyEwski, B.; Matuszczak, A. A new land rent theory for sustainable agriculture. Land Use Policy 2016, 55, 222–229. [Google Scholar] [CrossRef]
  10. Jin, G.; Deng, X.; Zhang, Q.; Wang, Z.; Li, Z. Comprehensive function zoning of national land space for Wuhan metropolitan region. Geogr. Res. 2017, 36, 541–552. [Google Scholar]
  11. Fan, Y.; Jin, X.; Xiang, X.; Yang, X.; Liu, J.; Zhou, Y. Evaluation and spatial characteristics of arable land multifunction in southern Jiangsu. Resour. Sci. 2018, 40, 980–992. [Google Scholar]
  12. Fang, Y.; Wang, J.; Kong, X.; Rongtao, W.U.; Baolian, L.I.; Liu, J. Trade-off relation measurement and zoning optimization of multi-functionality of cultivated land use: A case study of Henan Province. China Land Sci. 2018, 32, 57–64. [Google Scholar]
  13. Yang, L.; Yi, Z.; Lin, B.; Xu, W.; Wang, C. Analysis for the characteristics of spatial difference of cultivated land quality in Fujian Province. Chin. J. Agric. Resour. Reg. Plan. 2018, 39, 52–58. [Google Scholar]
  14. Jain, A.K. Data clustering: 50 years beyond K-means. Pattern Recognit. Lett. 2010, 31, 651–666. [Google Scholar] [CrossRef]
  15. Peng, J.; Liu, Z.; Liu, Y.; Chen, X.; Zhao, H. Assessment of farmland landscape multifunctionality at county level in BeijingTianjin-Hebei area. Acta Ecol. Sin. 2016, 36, 2274–2285. [Google Scholar]
  16. Power, A.G. Ecosystem services and agriculture: Tradeoffs and synergies. Philos. Trans. R. Soc. B Biol. Sci. 2010, 365, 2959–2971. [Google Scholar] [CrossRef]
  17. Zhu, Q.; Hu, W.; Zhao, Z. Dynamic analysis on spatial-temporal pattern of trade-offs and synergies of multifunctional cultivated land—Evidence from Hubei Province. Econ. Geogr. 2018, 38, 143–153. [Google Scholar]
  18. Ren, S.; Hu, Y.; Liu, Z.; Xin, Z. Study on the supply and demand of cultivated land eological service function in metropolitan area. Guangdong Land Sci. 2019, 18, 14–22. [Google Scholar]
  19. Fei, D.; Cheng, Q.; Mao, X.; Liu, F.; Zhou, Q. Land use zoning using a coupled gridding- self-organizing feature maps method: A Case Study in China. J. Clean. Prod. 2017, 161, 1162–1170. [Google Scholar] [CrossRef]
  20. Hu, W.Y.; Wei, A.Q.; Zhao, Z.S.; Zhang, A.L.; Song, Y. Literature review on mismatch of demand and supply, and syner-gies of multifunctional agricultural land. China Land Sci. 2017, 31, 90–96. [Google Scholar]
  21. Bureau, H.S. Hangzhou Statistical Yearbook; China Statistical Press: Beijing, China, 2018. [Google Scholar]
  22. Wang, C.; Li, X.; Yu, H.; Wang, Y. Tracing the spatial variation and value change of ecosystem services in Yellow River Delta, China. Ecol. Indic. 2019, 96, 270–277. [Google Scholar] [CrossRef]
  23. Renard, K.G.; Foster, G.R.; Weesies, G.A.; Mccool, D.K.; Yoder, D.C. Predicting Soil Erosion by Water: A Guide to Conservation Planning with the Revised Universal Soil Loss Equation (RUSLE); United States Government Printing: Washington, DC, USA, 1997.
  24. Yang, Z.; Xu, J.; Feng, X.; Guo, M.; Jin, Y.; Gao, X. Effects of land use change on habitat based on InVEST model in Northeast China. Ecol. Sci. 2018, 37, 139–147. [Google Scholar]
  25. Mcrae, B.H.; Beier, P. Circuit theory predicts gene flow in plant and animal populations. Proc. Natl. Acad. Sci. USA 2007, 104, 19885–19890. [Google Scholar] [CrossRef] [Green Version]
  26. The 100 Recommended Routes of Leisure Agriculture and Rural Tourism in Zhejiang Province. Available online: http://www.zjagri.gov.cn/jpxl/html/index.html (accessed on 19 March 2020).
  27. Wolff, S.; Verburg, P.H.; Schulp, C.J.E. Mapping ecosystem services demand: A review of current research and future perspectives. Ecol. Indic. 2015, 55, 159–171. [Google Scholar] [CrossRef]
  28. Yoshimura, N.; Hiura, T. Demand and supply of cultural ecosystem services: Use of geotagged photos to map the aesthetic value of landscapes in Hokkaido. Ecosyst. Serv. 2017, 24, 68–78. [Google Scholar] [CrossRef]
  29. Xie, G.; Zhen, L.; Lu, C.; Xiao, Y.; Chen, C. Expert knowledge based valuation method of ecosystem services in China. J. Nat. Resour. 2008, 23, 911–919. [Google Scholar]
  30. Spearman, C. The proof and measurement of association between two things. Am. J. Psychol. 1904, 15, 72–101. [Google Scholar] [CrossRef]
  31. Liu, H.; Zhang, Y.; Zheng, W. Evaluation on spatio-temporal development and interaction of intensive urban land use and urbanization: Case studies of the cities in the Bohai Rim Region. Geogr. Res. 2011, 30, 1805–1817. [Google Scholar]
  32. Li, F.; Guo, S.; Li, D.; Li, X.; Xie, S. A multi-criteria spatial approach for mapping urban ecosystem services demand. Ecol. Indic. 2020, 112, 106119. [Google Scholar] [CrossRef]
  33. Yda, B.; Lin, Z.; Xyb, C.; Mb, A.; Gjc, A.; Zx, C. Assessing the influences of ecological restoration on perceptions of cultural ecosystem services by residents of agricultural landscapes of western China—ScienceDirect. Sci. Total Environ. 2019, 646, 685–695. [Google Scholar]
  34. Cheng, L.; Xia, N.; Jiang, P.; Zhong, L.; Pian, Y.; Duan, Y.; Huang, Q.; Li, M. Analysis of farmland fragmentation in China Modernization Demonstration Zone since “Reform and Openness”: A case study of South Jiangsu Province. Sci. Rep. 2015, 5, 11797. [Google Scholar] [CrossRef] [PubMed] [Green Version]
  35. Clemente, P.; Calvache, M.; Antunes, P.; Santos, R.; Cerdeira, J.O.; Martins, M.J. Combining social media photographs and species distribution models to map cultural ecosystem services: The case of a Natural Park in Portugal. Ecol. Indic. 2019, 96, 59–68. [Google Scholar] [CrossRef]
  36. Gao, J.; Barbieri, C.; Valdivia, C. Agricultural landscape preferences: Implications for agritourism development. J. Travel Res. 2014, 53, 366–379. [Google Scholar] [CrossRef] [Green Version]
  37. Ibnescu, B.C.; Stoleriu, O.M.; Munteanu, A.; Iatu, C. The impact of tourism on sustainable development of rural areas: Evidence from romania. Sustainability 2018, 10, 3529. [Google Scholar] [CrossRef] [Green Version]
  38. Sroka, W.; Mikolajczyk, J.; Wojewodzic, T.; Kwoczynska, B. Agricultural land vs. urbanisation in chosen Polish metropolitan areas: A spatial analysis based on regression trees. Sustainability 2018, 10, 837. [Google Scholar] [CrossRef] [Green Version]
  39. Sarah, T.L. Multifunctional urban agriculture for sustainable land use planning in the United States. Sustainability 2010, 2, 2499–2522. [Google Scholar]
  40. Yoshida, S.; Yagi, H.; Kiminami, A.; Garrod, G. Farm diversification and sustainability of multifunctional peri-urban agriculture: Entrepreneurial attributes of advanced diversification in Japan. Sustainability 2019, 11, 2887. [Google Scholar] [CrossRef] [Green Version]
  41. Guo, H. The significance situation and prospects of the development of leisure agriculture in China. Chin. J. Agric. Resour. Reg. Plan. 2010, 31, 39–42. [Google Scholar]
  42. Minta, S.; Tańska-Hus, B.; Nowak, M. The implementation of concept of a regional product “sudeten beef” in the context of environment protection. Rocz. Ochr. Srodowiska 2013, 15, 2887–2898. [Google Scholar]
  43. Wischmeier, W.H. Predicting Rainfall Erosion Losses—A Guide to Conservation Planning; Science and Education Administration: Washington, DC, USA, 1978; p. 537. [Google Scholar]
  44. Wang, W.; Jiao, J.; Hao, X.; Zhang, X.; Lu, X.; Chen, F.; Wu, S. Distribution of Rainfall Erosivity R Value in China. J. Soil. Water. Conserv. 1996, 2, 29–39. [Google Scholar]
  45. Zhou, F.; Huang, Y. The rainfall erosivity index in Fujian province. J. Soil Water Conserv. 1995, 9, 13–18. [Google Scholar]
  46. Williams, J.R.; Jones, C.A.; Dyke, P.T. A modeling approach to determining the relationship between erosion and soil productivity. Trans. ASAE 1984, 27, 129–144. [Google Scholar] [CrossRef]
  47. Zhou, M.; Deng, J.; Lin, Y.; Belete, M.; Wang, K.; Comber, A.; Huang, L.; Gan, M. Identifying the effects of land use change on sediment export: Integrating sediment source and sediment delivery in the Qiantang River Basin, China. Sci. Total Environ. 2019, 686, 38–49. [Google Scholar] [CrossRef] [PubMed]
  48. Liu, B.; Liu, S.; Zheng, S. Soil conservation and coefficient of soil conservation of crops. Res. Soil Water Conserv. 1999, 6, 32–36. [Google Scholar]
  49. Teng, H. Assimilating Multi-Source Data to Model and Map Potential Soil Loss in China. Ph.D. Thesis, Zhejiang University, Hangzhou, China, 2017. [Google Scholar]
Figure 1. Location of the study region.
Land 10 01014 g001
Figure 2. Flowchart of the division of the farmland-use zones in the present study.
Land 10 01014 g002
Figure 3. Supply patterns for seven sub-functions (left) and three functions (right) of farmland.
Land 10 01014 g003
Figure 4. Demand patterns for farmland functions.
Land 10 01014 g004
Figure 5. Correlations between farmland functions calculated with Spearman’s rank correlation analysis.
Land 10 01014 g005
Figure 6. Spatial patterns of the multi-functional coupling and coordination degrees of farmland.
Land 10 01014 g006
Figure 7. Basic farmland regions divided according to the supply-and-demand matching conditions for farmland functions calculated through the spatial clustering analysis (HD, MD and LD are the abbreviations of high demand, medium demand and low demand, respectively; PS, ES and LCS are the abbreviations of production function, ecological function and landscape-cultural functions, respectively).
Land 10 01014 g007
Figure 8. Farmland-use zones with similar supply, demand and correlation patterns for multiple functions of farmland.
Land 10 01014 g008
Table 1. Description of the datasets utilized in this study.
DataTypeResolutionSource
Classification and grading data for agricultural land;
Land-use survey data
Shape file1:10,000Land and Resources Bureau of Hangzhou
Actual output of crops;
fertilizer, pesticide and plastic film consumption data;
agritourists
Geo TiffCountyHangzhou Statistical Yearbooks
(http://www.hangzhou.gov.cn, accessed on 26 September 2021)
ResidentsGeo Tiff100 mWorldPop project
(https://www.worldpop.org/, accessed on 26 September 2021)
Digital elevation model;
NDVI
Geo Tiff30 mGeospatial data cloud
(http://www.gscloud.cn, accessed on 26 September 2021)
Typical farmlandShape file100 pointsThe most popular tourism routes
(http://nynct.zj.gov.cn, accessed on26 September 2021)
GDPGeo Tiff100 mGeographical Information Monitoring Cloud Platform
(http://www.dsac.cn/, accessed on 26 September 2021)
Soil dataGeo Tiff1:200,000Map of the Second National Soil Survey
Meteorological dataGeo Tiff1000 mWorld Weather Database (1950–2010)
(https://worldclim.org/, accessed on 26 September 2021)
Publisher’s Note: MDPI stays neutral with regard to jurisdictional claims in published maps and institutional affiliations.

