Article

Using a Statistical Model to Examine the Effect of COD: SO42 Ratio, HRT and LA Concentration on Sulfate Reduction in an Anaerobic Sequencing Batch Reactor

by
Rajesh Singh
,
Chungman Moon
,
Sathyanarayan S. Veeravalli
,
Saravanan R. Shanmugam
,
Subba Rao Chaganti
and
Jerald A. Lalman
*
Department of Civil and Environmental Engineering, University of Windsor, 401 Sunset Ave., Windsor, ON N9B 3P4, Canada
*
Author to whom correspondence should be addressed.
Current address: School of Environment and Sustainable Development, Central University of Gujarat, Sector-30, Gandhinagar 382030, India.
Current address: Korea Institute of Energy Research, 152 Gajeong-ro, Yuseong-gu 305343, Daejeon, Korea.
Water 2014, 6(11), 3478-3494; https://doi.org/10.3390/w6113478
Submission received: 29 August 2014 / Revised: 30 October 2014 / Accepted: 5 November 2014 / Published: 14 November 2014

Abstract

:
Taguchi statistical design, an orthogonal array (OA) method, was used to study the impact of the COD/SO42− ratio, hydraulic retention time (HRT) and linoleic acid (LA) concentration on sulfate (SO42−) reduction in an anaerobic sequencing batch reactor using glucose as the electron donor. Based on the OA, optimum condition for maximum SO42− reduction was evaluated. Increasing the COD/SO42− ratio and HRT caused decreasing SO42− reduction while increased SO42− reduction was observed with increasing LA concentration (1 g L−1). In control (not fed LA) cultures, higher SO42− reduction (87% ± 3%) was observed at a low COD/SO42− ratio of 0.8. This indicates that increasing SO42− reduction was observed at increasing SO42− loading rates. In general, results from this study reveal that limiting the substrate concentration with high SO42− levels (low COD/SO42− ratio) favors high SO42−removal. Surface plots were used to evaluate the significant interactions between the experimental factors. Accuracy of the model was verified using an analysis of residuals. Optimum conditions for maximum SO42− reduction (97.61%) were observed at a COD/SO42− ratio of 0.8 (level 1), 12 h HRT (level 1) together with 1000 mg L−1 LA addition (level 3). In general, the Taguchi OA provided a useful approach for predicting the percent SO42− reduction in inhibited mixed anaerobic cultures within the factor levels investigated.

Graphical Abstract

1. Introduction

The sulfate ion (SO42−) is found in natural environments such as sediments, seawater and areas rich in decaying organic matter. Sulfate is also released in effluents from many industries such as pulp and paper processing, coal powered power plants, edible oil industries, tannery operations, molasses fermentation and mining [1,2]. Effluents generated from these industries also contain other sulfur species, which include thiosulfate, sulfite, sulfide and dithionite [3].
In mining operations, minerals, such as iron and zinc are converted to reduced metal sulfides. These sulfide compounds are oxidized with the release of metals ions and SO42− (Reactions (1) and (2); Table 1). Under acidic conditions, dissolution of heavy metals from metal oxides and carbonates results in the formation of metal and SO42− containing wastewater known as acid mine drainage (AMD) [4,5,6].
Discharging AMD can cause serious threats to the environment. Sulfate, an electron acceptor, is converted to hydrogen sulfide (H2S) in the presence of electron donors such as hydrogen (H2) or easily degradable organic chemicals [7]. Biological SO42− reduction is a promising methodology to treat AMD due to the combined removal of acidity, SO42− and heavy metals. Sulfate removal is accomplished by SO42− reducing bacteria (SRB). SRBs utilize electron donors, such as volatile fatty acids (VFAs), alcohols and H2. SRBs often out-compete methane producing bacteria (MPB) for substrates, such as H2 (Reactions (3) and (4); Table 1). When H2 is utilized as an electron donor, SRBs produce H2S and hydroxide ions (Reaction (5); Table 1).
Table 1. Standard Gibb’s free energies for selected reaction stoichiometries.
Reaction No.Stoichiometric ReactionΔG°' (kJ mol−1)
(1)2FeS2 + 7O2 + 2H2O→2Fe2+ + 4SO42− + 4H+−2168.0
(2)ZnS + 2O2→Zn2+ + SO42−−690.0
(3)4H2 + HCO3 + H+→CH4 + 3H2O−135.6
(4)4H2 + H+ + SO42−→4H2O + HS−152.2
(5)8H2 + 2SO42−→H2S + HS + 5H2O + 3OH−146.9
Note: The Gibb’s free energy values were calculated using data from Thauer et al. [8].
Competition between MPBs and SRBs is also dependent on the substrate concentration (Reactions (3) and (4); Table 1). Note if the substrate COD/SO42− ratio is large or with decreasing SO42− levels, MPBs out-compete SRB for available electrons. Conversely, SRBs out-compete MPBs if the COD/SO42− ratio is low. A minimum COD/SO42− mol ratio of 0.67 is required for SO42− reduction [9]. The percent SO42− reduction is variable with different COD/SO42− ratios [10,11]. SRB and MPB competition is also dependent on the operational pH with SRB growth favored at high pH [12]. Since the chemical equilibrium of different sulphide species is pH dependent [13,14], pH is a crucial factor affecting the competition between SRBs and MPBs.
Hydraulic retention time (HRT) can also affect competition between SRBs and MPBs. Lower HRT is favorable for SRB growth when compared to MPBs. The doubling time of many SRBs is less than MPBs. For example, Desulfotomaculum acetoxidance has a doubling time of 30 h when grown on acetate at 35 °C [15]. In comparison, the doubling time of Methanosarcina barkeri is 43 h when grown on acetate at 37 °C [16].
Controlling the electron flow to SRBs and MPBs is affected by factors such as pH, the COD/SO42− ratio and HRT. Another factor controlling the activity of SRBs and MPBs is inhibitory chemicals. Successful inhibition of MPB growth will favor SRB growth and increase the quantity of SO42− reduced. Diverting the fraction of substrate electron flow from MPBs to SRBs is achievable using different treatment methods, which selectively inhibit methanogenic growth. Among the physical methods, heat treatment is used to inhibit non-spore forming MPB [17]. However, due to the high cost associated with heat treatment, the method is unsuitable for full-scale application. Alternate methods to heat treatment include utilizing chemical inhibitors. Various chemical inhibitors have been used successfully to inhibit MPBs [18]. Inhibitors specific to inhibiting methanogens include 2-bromo ethane sulfonic acid (2-BESA). Other methanogenic and non-methanogenic inhibitors, which have been extensively studied, include saturated long chain fatty acids (SLCFAs) and unsaturated long chain fatty acids (ULCFAs). Lauric acid (C12:0), a SLCFA, and as linoleic acid (LA, C18:2), a ULCFA, are able to suppress gram positive bacteria and methanogens [19,20].
In natural habitats and engineered systems, microbial processes are affected by a combination of different factors. The effect of multiple factors on biological SO42− reduction can be examined using statistical methods, such as the Taguchi design [21]. A significant difference between Taguchi’s optimization technique and other similar methods is the ability to reduce process variability by involving factors that cause variability in the experimental design, modeling and optimization process [22]. The Taguchi method has been used in many biotechnological applications Rao et al. [21]. The method has been used by many researchers to optimize the operation of microbial processes [21,23,24].
The Taguchi method provides a systematic approach to understand manufacturing, microbial as well as environmental processes by assisting to identify factors which affects the process/product characteristics [25]. The method is robust and can be applied in the manufacture of automotive parts, plastics and semi-conductors [25]. The Taguchi method is used to rapidly and accurately gather data which is useful in the design and production of low-cost processes [26]. Hence, the objectives of this study are to examine the effect of the COD/SO42− ratio, HRT and LA concentration on mesophilic biological SO42− reduction in anaerobic sequencing batch reactors (ASBRs) using a Taguchi design.

2. Materials and Methods

2.1. Inoculum Source

The anaerobic inoculum was procured from an up-flow anaerobic sludge blanket reactor (UASBR) located at a brewery wastewater treatment facility (Guelph, ON, Canada) (designated as culture A) and at the municipal wastewater treatment plant (Chatham, ON, Canada) (designated as culture B). Culture A and culture B were selected based on sources of MPBs and SRBs, respectively. The volatile suspended solid (VSS) of culture A and B was 50 and 20 g VSS L−1, respectively. Cultures A and B were diluted with basal medium to 25 and 12 g VSS L−1 in 9 L reactors, respectively (designated as reactor A and B). The bioreactors were operated in accordance with procedures reported by Ray et al. [27]. Reactors A and B were operated at 37 °C in a sequencing batch mode with a 14 d HRT and a feed concentration of 2000 mg glucose L−1. The pH of the reactors was maintained at 7.0 ± 0.5. In addition to glucose, reactor B was acclimated incremental to increasing SO42− levels of 250 mg L−1 to 2000 mg L−1 for 2 months. During the acclimation period, the quantity of gas and VFAs were monitored to establish quasi-steady state conditions. Inoculum for the experiments under consideration was combined from reactors A (80%) and B (20%) and diluted with basal medium to 8 g VSS L−1. The basal medium composition used for dilution and feed was adapted from Wiegant and Lettinga [28]. All the chemicals for basal medium were procured from ACP Chemicals Inc. (Montreal, QC, Canada) and Sigma Aldrich (Oakville, ON, Canada). The feed substrate (glucose) was procured from Spectrum Chemicals, Gardena, CA, USA.

2.2. Sulfate Reduction Studies

Two 7-L (total volume) continuous stirred tank reactors (CSTRs) (New Brunswick Scientific, New Brunswick, NJ, USA) with a 5 L working volume were used to conduct the experiments. The CSTRs (R1 and R2) were operated as ASBRs at 37 ± 1 °C. Liquid samples were collected at the end of each cycle. Continuous mixing of the reactor contents during the reaction phase was conducted at 200 rpm. The pH (6.5 ± 0.1) was maintained using 1 M NaOH (base) and 0.5 M HCl (acid). The ASBRs (R1 and R2) were seeded with the inoculum from reactors A and B (8 g VSS L−1) and then purged with nitrogen (N2) (99.99% purity, Praxair, Windsor, ON, Canada) for 5 min to maintain anaerobic conditions. The experimental reactors (R1 and R2) were operated under identical conditions with a feed concentration of 2000 mg glucose L−1 (2.134 g COD L−1) as a carbon source. The SO42− concentration was varied according to the COD/SO42− ratio shown in Table 2.
Reactors R1 and R2 were operated as follows: 40 min settling; 10 min decanting; and 10 min fill. The reaction times maintained were 5 h, 11 h and 17 h for HRT values of 12 h, 24 h and 36 h, respectively. The volume decanted per cycle was constant at 2.5 L and the HRT was calculated using Equation (1) [29].
HRT =   ( Working volume of the reactor ) ( Volume decanted per cycle ) ( No . of cycles per day )
At each HRT, the reactors were operated until they attained quasi-steady state conditions (constant SO42− reduction with ±10% variation). Different LA levels (0, 0.5 and 1.0 g L−1) were fed to cultures according to experimental conditions shown in Table 2. Cultures were incubated with LA for 24 h prior to initiating the experiment (substrate addition).

2.3. Analytical Methods

Biogas production was monitored using a tipping bucket gas meter [30]. The biogas composition was determined by gas chromatography (GC) [7]. The detection limits for CH4 and H2 were 0.0032 kPa (0.5 mL/bottle (160 mL)) and H2S was 0.0315 kPa (5 mL/bottle (160 mL)), respectively. The liquid samples collected at the end of each cycle were analyzed for SO42− using an ion chromatography (IC) [7]. The detection limits for the SO42− was 0.5 mg L−1. The total suspended solids (TSS) and VSS levels were measured according to Standard Methods [31].
Table 2. Design matrix for experimental factors and corresponding response function at different factor levels.
Exp. No.COD/SO42− Ratio 1HRT (h)LA conc. (mg L−1)Experimental SO42− Reduction (%) 2Predicted SO42− Reduction (%)
X1LevelX2LevelX3Level
10.811210186.5 ± 2.683.5
20.81242500265.8 ± 1.967.8
30.813631000380.6 ± 0.781.6
41.62121500275.1 ± 1.976.1
51.622421000378.2 ± 3.775.2
61.623630158.3 ± 2.760.3
72.431211000389.9 ± 6.091.9
82.432420161.5 ± 8.662.5
92.43363500264.5 ± 2.961.5
Notes: LA = linoleic acid; HRT = hydraulic retention time; COD = Chemical oxygen demand; SO42− = sulfate; 1 COD/SO42− ratio of 0.8 denotes a glucose COD concentration of 2.134 g L−1 and SO42− concentration of 2.668 g L−1. Similarly in order to attain a COD/SO42− ratio of 1.6 and 2.4, SO42− concentration of 1.334 and 0.889 g L−1 were used by keeping a constant glucose COD concentration of 2.134 g L−1; 2values shown in mean ± standard deviation represents the average sulfate reduction from two reactor samples for at least three consecutive cycles;

2.4. Taguchi Design

The optimization methodology adopted in this study was divided into three phases, namely planning, conducting, and analysis. Each phase had a separate objective, interconnected sequence wise to achieve the overall optimization process using Qualitek-4 software (Nuteck Inc., Bloomfield Hills, MI, USA). Qualitek-4 software is equipped to use L4–L64 arrays with the selection of 2–63 factors and with 1, 3, and 4 levels for each factor.

2.4.1. Fractional Factorial Design of Experiments (FFDOE) (Phase 1)

The initial step in phase 1 was to identify different key parameters/factors to be optimized in the anaerobic process, which have a critical influence on the percent of SO42− removed. The normal practice has been to experiment with a feasible range so that the variation inherent in the process does not mask the factor effect. Factors were selected and the ranges were assigned based on data from work reported by Moon et al. [7,32] and Kaksomen et al. [32]. Three factors (HRT, COD/SO42− ratio, LA concentration) with significant influence on the SO42− removal rate were selected for the Taguchi orthogonal array (OA) study. The levels for the three factors are shown in Table 2. The L9 OA can handle up to four factors at three levels with eight degrees of freedom. Since only three factors were examined in this study, the fourth column in the OA was left empty. Orthogonality is not lost by maintaining one or more columns of an array empty [33]. Taguchi’s OA are used to estimate main effects using only a few experimental runs. An OA (n, q, s, t) is an n × p array with entries from a set of s distinct symbols such that for any collection of t columns of the array, each of the st row vectors appears equally often in the matrix [34].
After selecting the levels, the OAs was created for the parameter design indicating the number and conditions for each experiment. Next, experiments were conducted as indicated in the completed array to gather data on the effect on the performance measure. The final step in phase 1 is to conduct the data analysis by assessing the effect of different parameters on the performance measure. An experimental design matrix was generated to define the data analysis procedure and a L9 OA for the control parameters to fit a specific study was selected. In the present OA, the three levels of factor variation were considered and the size of experimentation was represented by symbolic arrays L9 (the 9 experimental trials are shown in Table 2).

2.4.2. Sulfate Removal ASBR Experiments with Selected Factors and Levels (Phase 2)

Phase 2 was focused on conducting the experiments according to the Taguchi L9 OA (Table 2). The details of the inoculum source and detailed experimental methodology are outlined in Section 2.1 and Section 2.2, respectively. The analytical methods used in this study to quantify the experimental response (%SO42− reduction) are outlined in Section 2.3.

2.4.3. Analysis of Experimental Data (AED) and Prediction of Performance (POP) (Phase 3)

The SO42− removal rate data obtained from the L-9 experiments were analyzed using the Qualitek-4 software with the “bigger-is-better” quality characteristics selected to determine the optimum conditions (higher SO42− removal rate) and to identify individual factor influence on the SO42− removal rate. In the Taguchi’s method, quality is measured by the deviation of a characteristic from a target value using the loss function (Equation (2)).
L ( y ) = k ( y m ) 2
where k denotes the proportionality constant, m represents the target value and y is the experimental value obtained for each trial.
The experimental data processed using the Qualitek-4 software with the bigger is better quality characteristics determined the optimum conditions for SO42− removal. In the optimization, the bigger-is-better quality characteristic for the loss function is represented as Equation (3).
L ( y ) = k ( 1 y 2 )
The expected loss function can be represented by Equation (4):
E [ L ( y ) ] = k E ( 1 y 2 )
where E (1/y2) can be estimated from a sample of as Equation (5):
i = 1 n [ 1 y i 2 ] / n
Verification of the model was performed by an analysis of residuals. The residuals for the OA were calculated using the difference between the models predicted response and the experimental response at identical factor levels within the design space under consideration. The Anderson-Darling (AD) test was used to determine whether the residuals follow a normal distribution. The AD test at 5% level of significance was used to confirm the accuracy of the model based on the distribution of residuals. Three-dimensional surface plots were used to evaluate the effect of any two experimental factors on the experimental response. The ANOVA, AD plots and surface plots were generated using the MINITAB 16 statistical software (MINITAB Inc., State College, PA, USA).

3. Results and Discussion

3.1. Experimental Design Analysis

The Taguchi method is based on OAs providing a systematic, simple and efficient approach [35]. This method provides an approach which allows for a realistic arrangement of the experimental data sets with the understanding system, parameter, and tolerance designs [35]. The Taguchi OA is used to identify relationships between experimental independent variables and response dependent variable (%SO42− reduction). The residual quantity of SO42− measured at the end of each experimental run in the effluent was used to compute the percent of SO42− removed (Table 2). This response variable was used to predict the optimum response using the three factors and three levels. The regression coefficients computed for the experimental response (%SO42− reduction) were used to derive a model equation involving the three independent factors (Equation (6)).
Sulfate reduction  ( % ) = 60.762 2.838 × ( COD SO 4 2 ratio ) 7.995 × ( HRT ) +   7.069 × ( LA concentration ) +   4.23 × ( COD SO 4 2 ratio ) 2 +   7.338 × ( HRT ) 2 +   7.361 ×   ( LA concentration ) 2

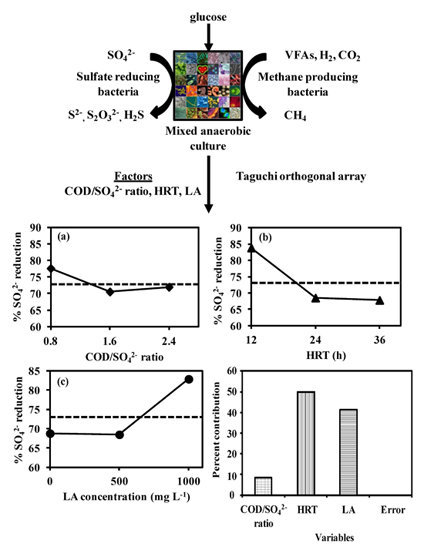
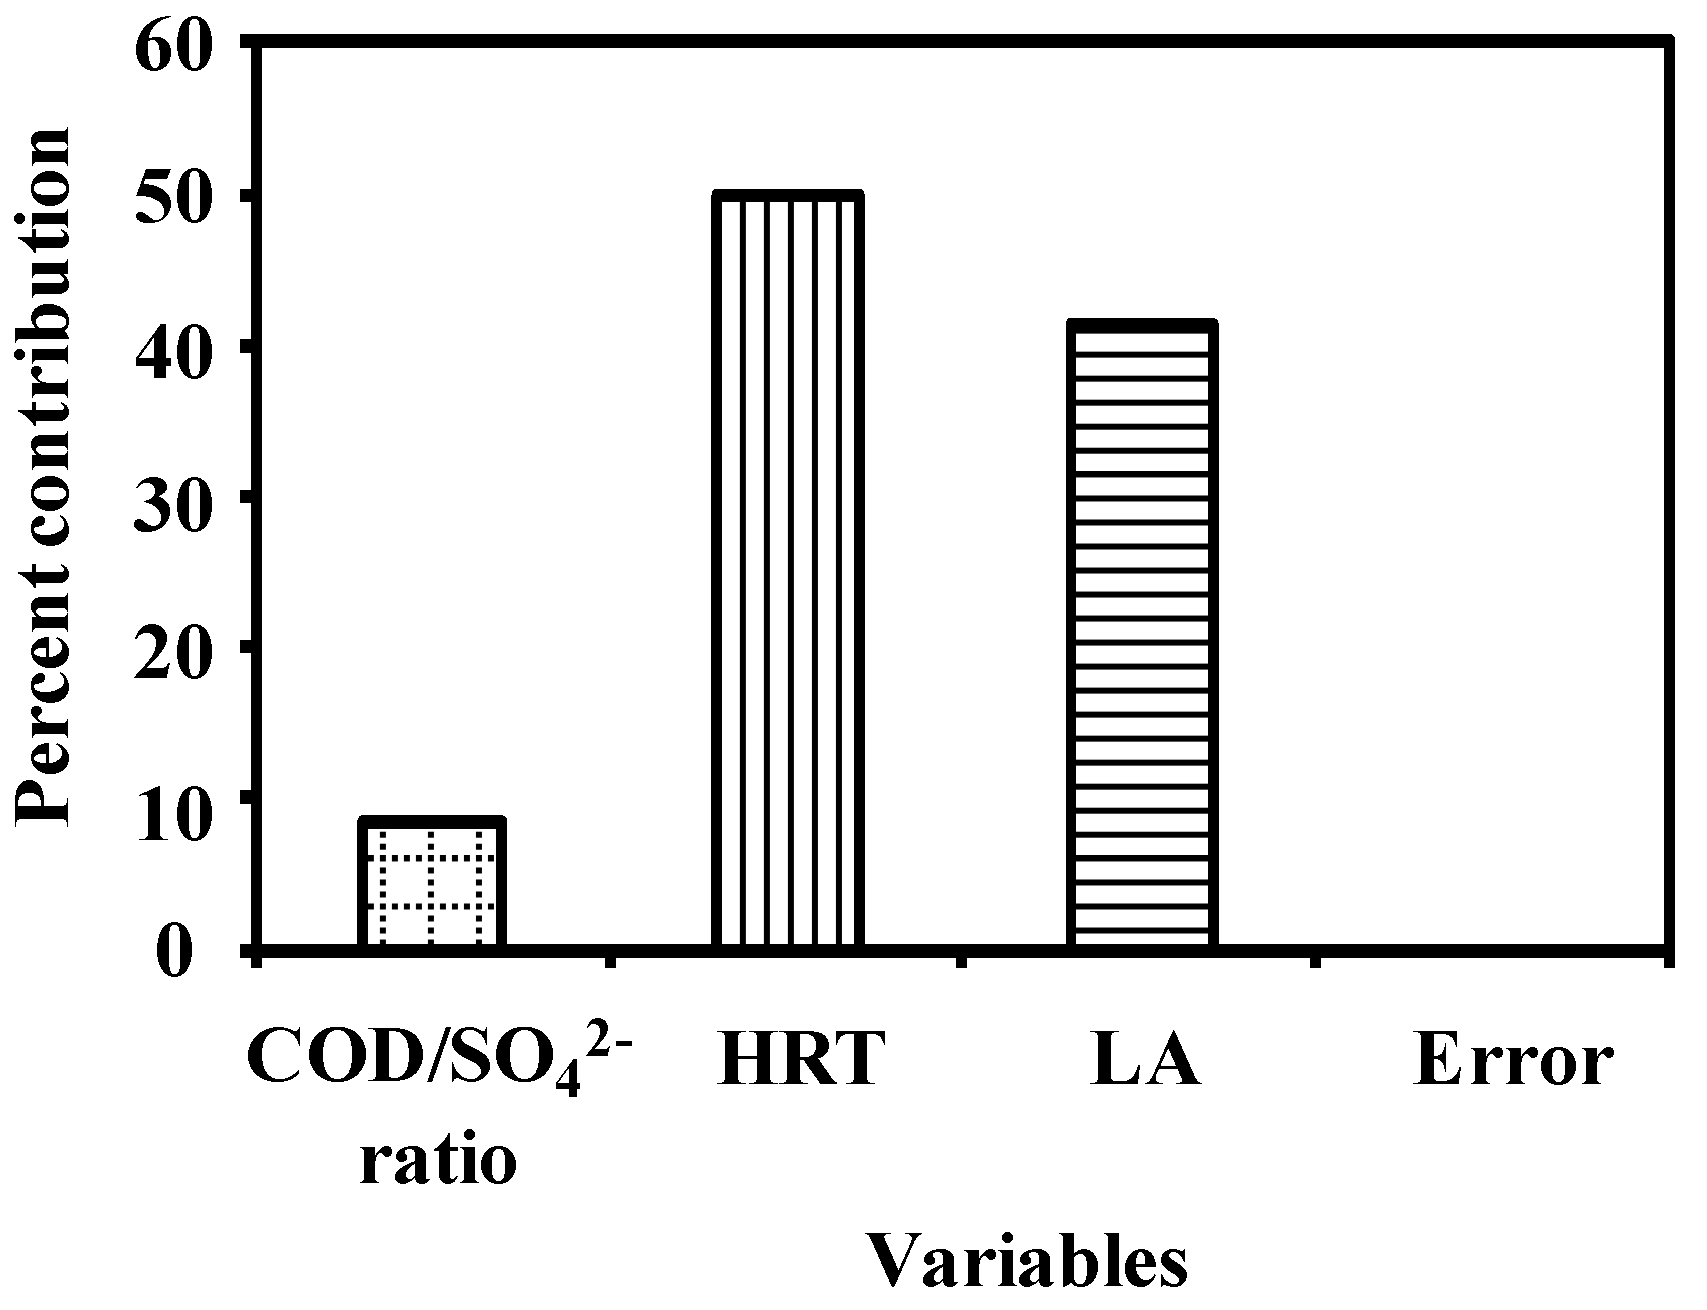
3.2. Analysis of Variance

ANOVA was conducted to analyze the experimental response (%SO42− reduction) at different conditions and to determine variation in contribution of each factor to the response variable (Table 3). The Fisher statistic (F-test) was used to establish whether the factors under investigation have any significant effects on the quality characteristic. In particular, the F ratio is used to determine the significance of the different experimental factor. The calculated F ratios indicate all the individual factors are statistically significant at a 95% confidence limit. The p values were used to determine the significance of each factor on SO42− reduction. Based on the p values, the HRT contributed the maximum impact (49.99%) on the overall SO42− reduction followed by LA with 41.42% (Figure 1 and Table 3).
The COD/SO42− ratio showed the least impact at the individual level (8.58%). The results from the study indicate that both HRT and LA concentration contributed more than 91% towards SO42− reduction.
Table 3. ANOVA table.
FactorDOF (f)Sum of Squares (s)Mean SquaresVariance (v)F ratio (F) 1Pure Sum (S’)Percent p (%) 2
COD/SO42−284.5742.2942.29845,749.5 384.578.58
HRT2492.67246.33246.334,926,686.4 3492.6750.00
LA2408.16204.08204.084,081,612.0 3408.1641.42
Error20.0010.00050.001 0.002
Total8985.40492.70 100.00
Notes: F ratio (F) = Mean square error/residual square error; 1Critical F0.05, 2, 8 = 4.46; 2Percent p (%) = (Sum of squared deviations/total sum of squared deviations) × 100; 3denotes significant at 95% confidence level.
Figure 1. Percent contribution of each variable on the sulfate removal rate. (1. HRT = hydraulic retention time; LA = linoleic acid; 2. Percent contribution of each experimental variable was estimated using ANOVA).
Water 06 03478 g001

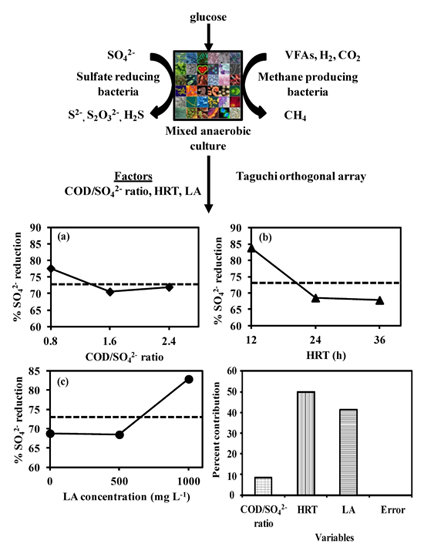
3.3. Effect of Factors on the Response Variables

3.3.1. Main Effects Plot

The main effects plot was used to establish the effect of each experimental factor on the response variable. The average response for each factor without considering the effects of other experimental factors is shown in the plots. Hence, interpretation of the plots must be conducted with caution. The experimental response variation between 61.5% ± 8.6% and 89.9% ± 6.0% (Table 2) indicates the effect of the different factors on SO42− reduction.

Effect of COD/SO42− Ratio

The COD/SO42− ratio is a major factor affecting SO42− reduction [36]. According to Velasco et al. [36], for a given SO42− concentration, the feed COD/SO42− ratio was used to control H2S production, which in-turn was used for metal precipitation. Varying quantities of the % SO42− removed was observed in cultures fed different COD/SO42− ratios (Figure 2a). The main effects plot showed a maximum mean SO42− removal of 78% at a COD/SO42− ratio of 0.8. With increasing COD/SO42− ratios of 1.6 and 2.4, the mean SO42− reduction reached approximately 70% irrespective of the experimental HRT and LA concentration. These results indicate that low COD/SO42− ratios are favorable for high SO42− removal. Studies conducted by Choi and Rim [9] reported reduced SRB activity at COD/SO42− ratios exceeding 2.7 for acetate and hydrogen electron donors. They attributed the reduced SRB activity to competition by MPBs. In similar work by El Bayoumy et al. [37], they concluded that SRB growing on lactate and acetate with COD/SO42− ratios between 0.75 and 2.25 was enhanced in comparison to ratios greater than 2.25. Studies by Velasco et al. [36] have indicated that COD/SO42− ratios greater than 1.5 resulted in increasing sulfide levels while at lower COD/SO42− ratios, sulfur species such as H2S, dissolved sulfide was produced. Higher SO42− reduction at low COD/SO42− ratios is likely attributed to higher SRBs growth rates under these conditions. Evidence by Erdirencelebi et al. [10] also support the argument that at higher COD/SO42− ratios, SRBs are unable to compete with MPBs for electrons derived from substrate oxidation.
Figure 2. Impact of selected experimental factors on percent sulfate reduction. (a) Effect of COD/SO42− ratio; (b) Effect of HRT; (c) Effect of LA concentration.
Water 06 03478 g002
Notes: 1. Average values are shown for the model; 2. Dashed line (--------) indicates the mean value of the percent sulfate reduction; 3. HRT = hydraulic retention time; LA = linoleic acid.

Effect of Hydraulic Retention Time

Assessing the impact of HRT on SO42− removal was conducted after optimizing the COD/SO42− ratio. According to Neculita et al. [38], increased treatment efficiency was observed with increasing HRT. Reduced treatment efficiency with decreasing HRT at a constant COD/SO42− ratio was reported by Zhou et al. [39]. These authors reported decreasing SO42− removal efficiencies from 89% to 82% as the HRT was decreased from 24 h to 12 h at a constant COD/SO42− ratio of 4. In this study, a mean experimental response of 84% SO42− reduction was observed at a 12 h HRT (Figure 2b).
Lower mean percent SO42− removals of 69% and 68% observed in cultures operating at 24 h and 36 h HRT indicated that long HRT conditions are unfavorable for SO42− reduction. The low SO42− removals might be due to the ability of MPBs competing with SRB for the available substrate. MPBs are able to compete with SRBs for substrates derived electrons and subsequently produce CH4. Higher SO42− removal at lower HRT (12 h) is likely associated with elevated growth rates of SRB in comparison to MPBs [37]. MPB have longer doubling times and are washed out at lower HRT thus favoring SO42− reduction [16].

Effect of Linoleic Acid Concentration

A mean SO42− removal (experimental response) of 69% was observed in control cultures (not fed LA). Cultures fed 0.5 g L−1 LA performed the same as the controls with mean SO42− removal reaching approximately 68% (Figure 2c). However, with 1 g L−1 LA, the SO42− removal was more effective with a 22% increase. This result indicates that adding 1 g L−1 LA was effective in selectively inhibiting MPBs and re-directing the substrate derived electrons to SRBs. In work conducted by Ray et al. [40] and Chowdhury et al. [41], they indicated that methanogenic inhibition by a threshold LA level lead to H2 production. In comparison, Moon et al. [7] concluded no significant difference in SO42− reduction was detected at low (0.5 g L−1) and high (1.5 g L−1) LA levels using glucose fed batch cultures maintained at pH 6.0 to 7.5 and COD/SO42− ratios varying from 0.5 to 2.5. This difference in comparison to the work reported herein could be due to no pH control in the batch studies. Additionally, in comparison to the work reported by Moon et al. [7], variation in HRT might have exerted a significant effect at varying LA levels.

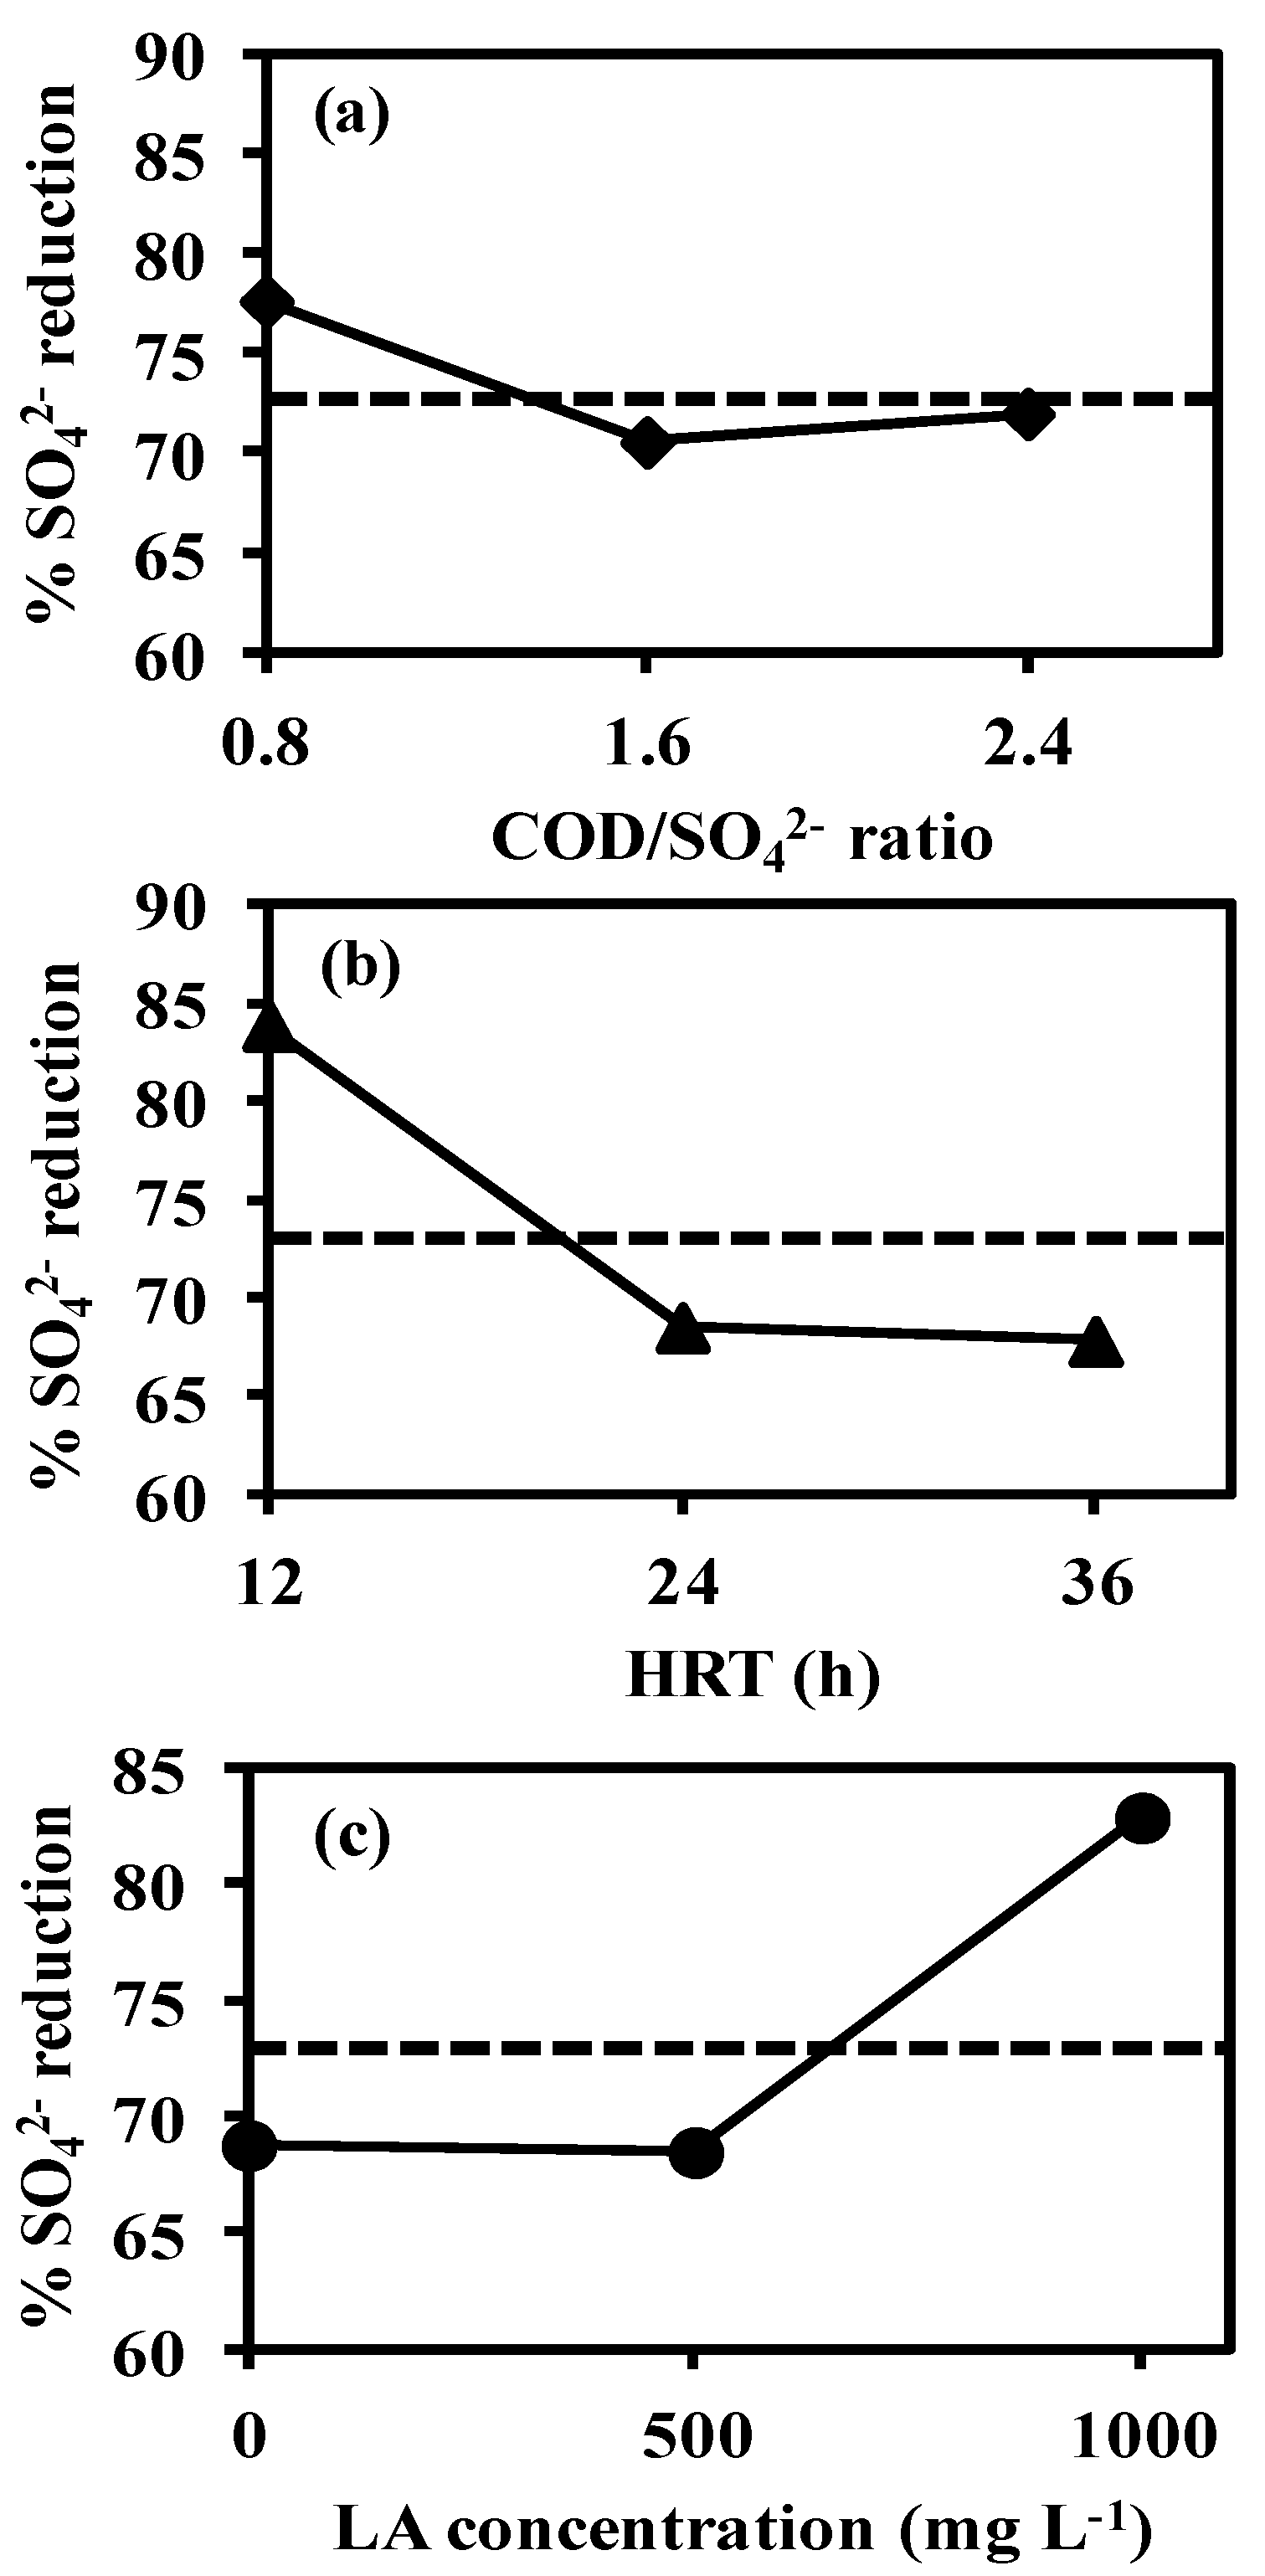
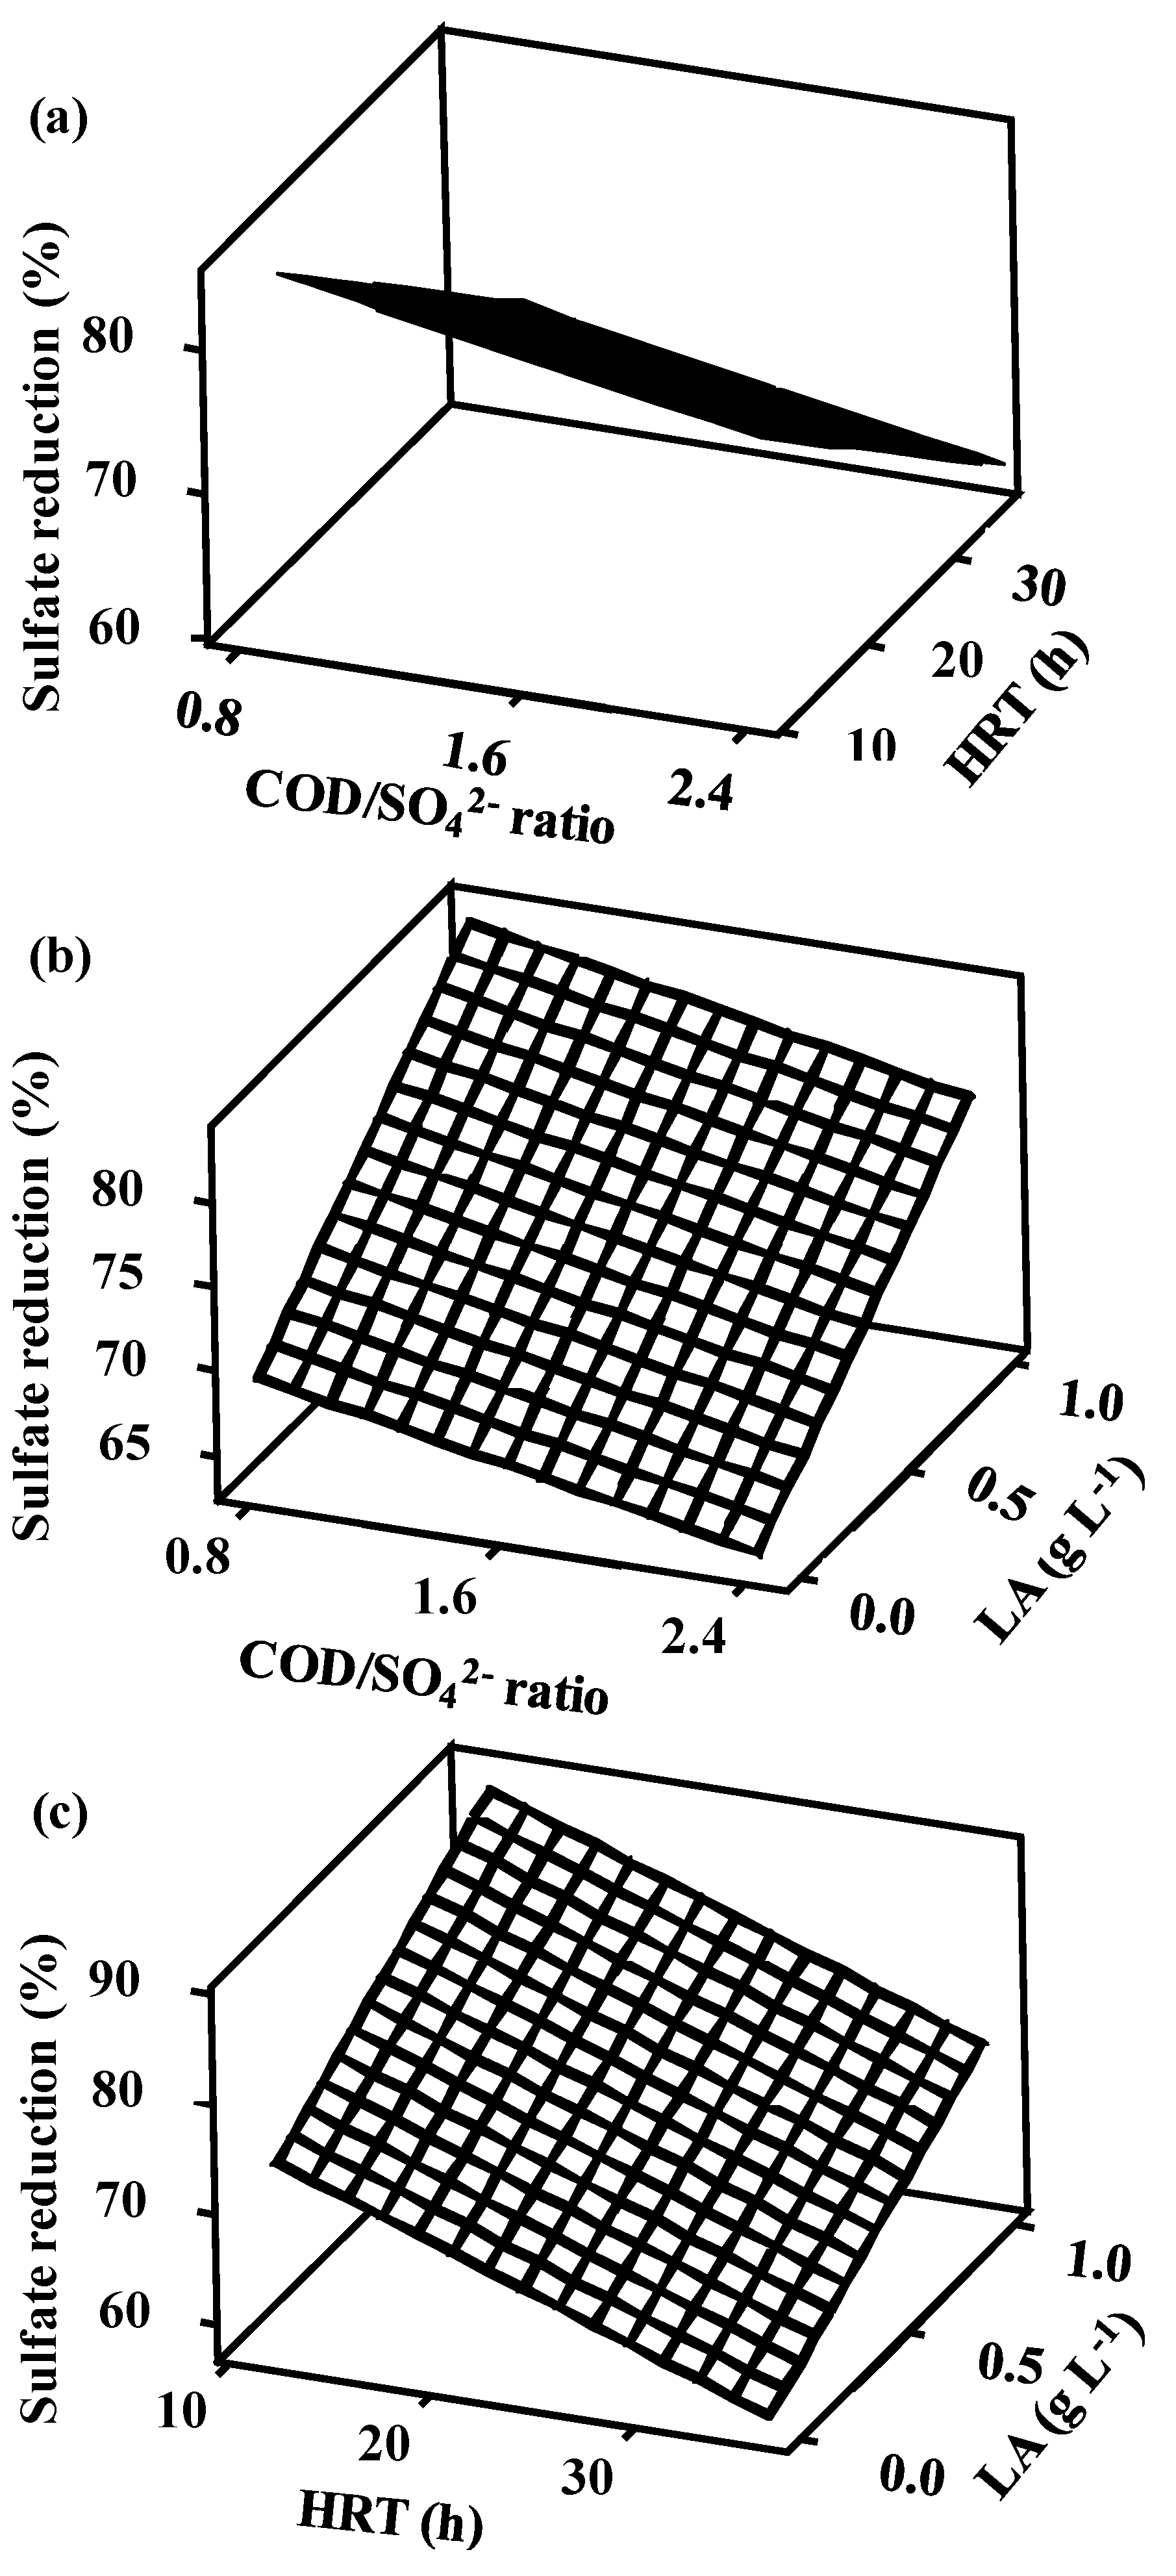
3.3.2. Surface Plots

Interaction between the experimental factors is depicted using the surface plot (Figure 3). The effects of COD/SO42− ratio and HRT (Figure 3a) suggest that maximum SO42− reduction (>80%) was observed at a COD/SO42− ratio of 0.8 and a 12 h HRT. Similar trends were observed with a low COD/SO42− ratio of 0.8 and an elevated LA concentration of 1 g L−1 (Figure 3b). The effect of HRT and LA concentration on SO42− removal is shown in Figure 3c. Lower HRT (12 h) and higher LA concentration (1 g L−1) resulted in maximum SO42− removal. In general, from these surface plots, a combination of lower HRT and COD/SO42− ratio together with higher LA concentration resulted in maximum SO42− removal.

3.4. Model Verification

The response variable computed using the model correlated reasonably well with the experimental data. The R2 value for predicted versus experimental SO42− reduction (%) was 0.9592 (data not shown). The residuals (model predicted value - experimental value) for the experimental response were used to assess the adequacy of the fit. The Anderson-Darling (AD) plot confirmed a normal distribution of the residuals. The observed AD statistic for the model response was 0.290 (Supplementary Figure A1). This value is smaller than the critical AD value of 0.752 for a sample size of 18 at a 5% significance level. The observed p-value (Supplementary Figure A1) of 0.572 (greater than 0.05) also confirms a normal distribution of residuals. This suggests that the model-predicted response values correlated reasonably well with the experimental response values (Table 2) over the factor space under consideration. The results obtained from this study are comparable with data reported in literature (Table 4). In general, the results (%SO42− reduction) reported in literature for various reactor systems fed with different type of substrates obtained higher SO42− reduction at higher COD/SO42− ratios (>2; Table 4).
Figure 3. Surface plots for the experimental response (% sulfate reduction) (a) COD/SO42− ratio versus HRT (at constant LA = 0.5 g L−1); (b) COD/SO42− ratio versus LA (at constant HRT = 24 h); (c) HRT versus LA (at constant COD/SO42− ratio = 1.6).
Water 06 03478 g003
Table 4. Comparison of percent sulfate reduction under different operational conditions.
COD/SO42− RatioReactor Type; Mode of OperationTemp. (°C)pHSO42− Reduction (%)SubstrateHRTRef.
2.5UASBR; Continuous307.0 ± 0.594 ± 1Ethanol4 d[36]
4FBR; Continuous357.4 ± 0.290Ethanol6.5 h[32]
3.2, 4, 5UASBR; Continuous30–337.3 ± 0.770, 81, 74Glucose24 h[10]
3.15, 2.7CSTR; Continuous30NR29, 28GlucoseNR[10]
2.7, 1.23, 0.6Serum bottle; Batch30NR9, 4, 4.5AcetateNA[10]
0.41, 1.03, 2.07Serum bottle; Batch35 ± 17.3 ± 0.126, 60, 93PropionateNA[11]
1, 4UASBR; Continuous556.025–35, 65Sucrose10 h[42]
6.67UASBR; Continuous35 ± 17.0–7.580–86Sulfate rich vinasse4.86 days[43]
4AFR; Continuous37 ± 0.59.597.8 ± 1.1Ethanol18 h[39]
0.8, 1.6, 2.4ASBR; Sequencing batch37 ± 0.16.5 ± 0.187 ± 3, 58 ± 3, 62 ± 9Glucose12, 36, 24 hThis study *
Notes: UASBR = Upflow anaerobic sludge blanket reactor; FBR = fluidized bed reactor; CSTR = continuous stirred tank reactor; ASBR = anaerobic sequential batch reactor, ABR = anaerobic filter reactor; NR = not reported; NA = not applicable; *: denotes % sulfate reduction in LA untreated (Control cultures).
Erdirencelebi et al. [10] reported maximum SO42− reduction of 81% and 29% in UASBR and CSTR, respectively, using COD/SO42− ratios >3 and mixed anaerobic cultures fed glucose at neutral pH 7.0. High SO42− reduction (86.5% ± 2.6%; Table 2) in control cultures (LA unfed cultures) at a low COD/SO42− ratio of 0.8 and a 12 h HRT indicate that higher SO42− levels is associated with high SO42− removal in comparison to data reported by other researchers (Table 4). In comparison, statistically the same percent SO42− reduction (89.9% ± 6%; Table 2) was observed in the presence of 1000 mg L−1 LA, a 12 h HRT and a COD/SO42− ratio of 2.4. In the control cultures with a low COD/SO42− ratio of 0.8 (i.e., at high SO42− concentration), low methane production (data not shown) was coupled with high SO42− reduction. Since LA is an effective methanogenic inhibitor (at threshold levels), the LA treated cultures with high levels of SO42− reduction at all COD/SO42− ratios indicated that the substrate-derived electrons were utilized for SO42− reduction rather than CH4 formation.

3.5. Factor Interactions and Their Influence on Sulfate Reduction

The average value of the different factors together with the interaction effects of other experimental factors at assigned factor levels on percent SO42− reduction is shown in Supplementary Table A1. The difference among the levels (L1−L2, L1−L3, L3−L2, L2−L1, L3−L2, and L3−L1) of each factor indicates the relative influence on the response (Supplementary Table A1). A larger difference is associated with a strong influence on the response variable. The data clearly indicate that HRT showed the greatest influence (83.8%) at level 1 (12 h HRT) when compared to the other factors. The next factors were the LA concentration (level 3) and COD/SO42− ratio (level 1; Supplementary Table A1). Notice the decreasing percent SO42− reduction from 83.8% to 63.8% is associated with increasing HRT from 12 h to 36 h (Supplementary Table A1). Increasing the LA concentration from 0 to 1 g L−1 showed an increase in SO42− reduction from 68.8% to 82.9% (Supplementary Table A1). In comparison, minimum variation in the percent SO42− removed was observed with varying COD/SO42− ratios.
The Qualitek 4 software generated interaction effects were analyzed individually to examine the impact of different factors on the overall SO42− reduction. In general, interaction effects are studied because of the possibility of one factor interacting with one or all of the other factors. The interaction severity index [SI] was calculated to determine the influence of the experimental factors at varying factor levels (Supplementary Table A2). The analysis indicates that the COD/SO42− ratio and LA concentration had the largest SI (59.33%) followed by the COD/SO42− ratio and HRT (37.65%; Supplementary Table A2). The SI value for the HRT and LA concentration was the lowest (24.84) among the factors investigated. Note that in the interactions, experimental variables with the least impact factor (COD/SO42− ratio (p% = 8.582); Table 3) were associated with a stronger impact factor (HRT (p% = 49.99) and LA concentration (p% = 41.42); Table 3). Data from this study indicate that the influence of selected factors on SO42− reduction was independent of the individual influence.

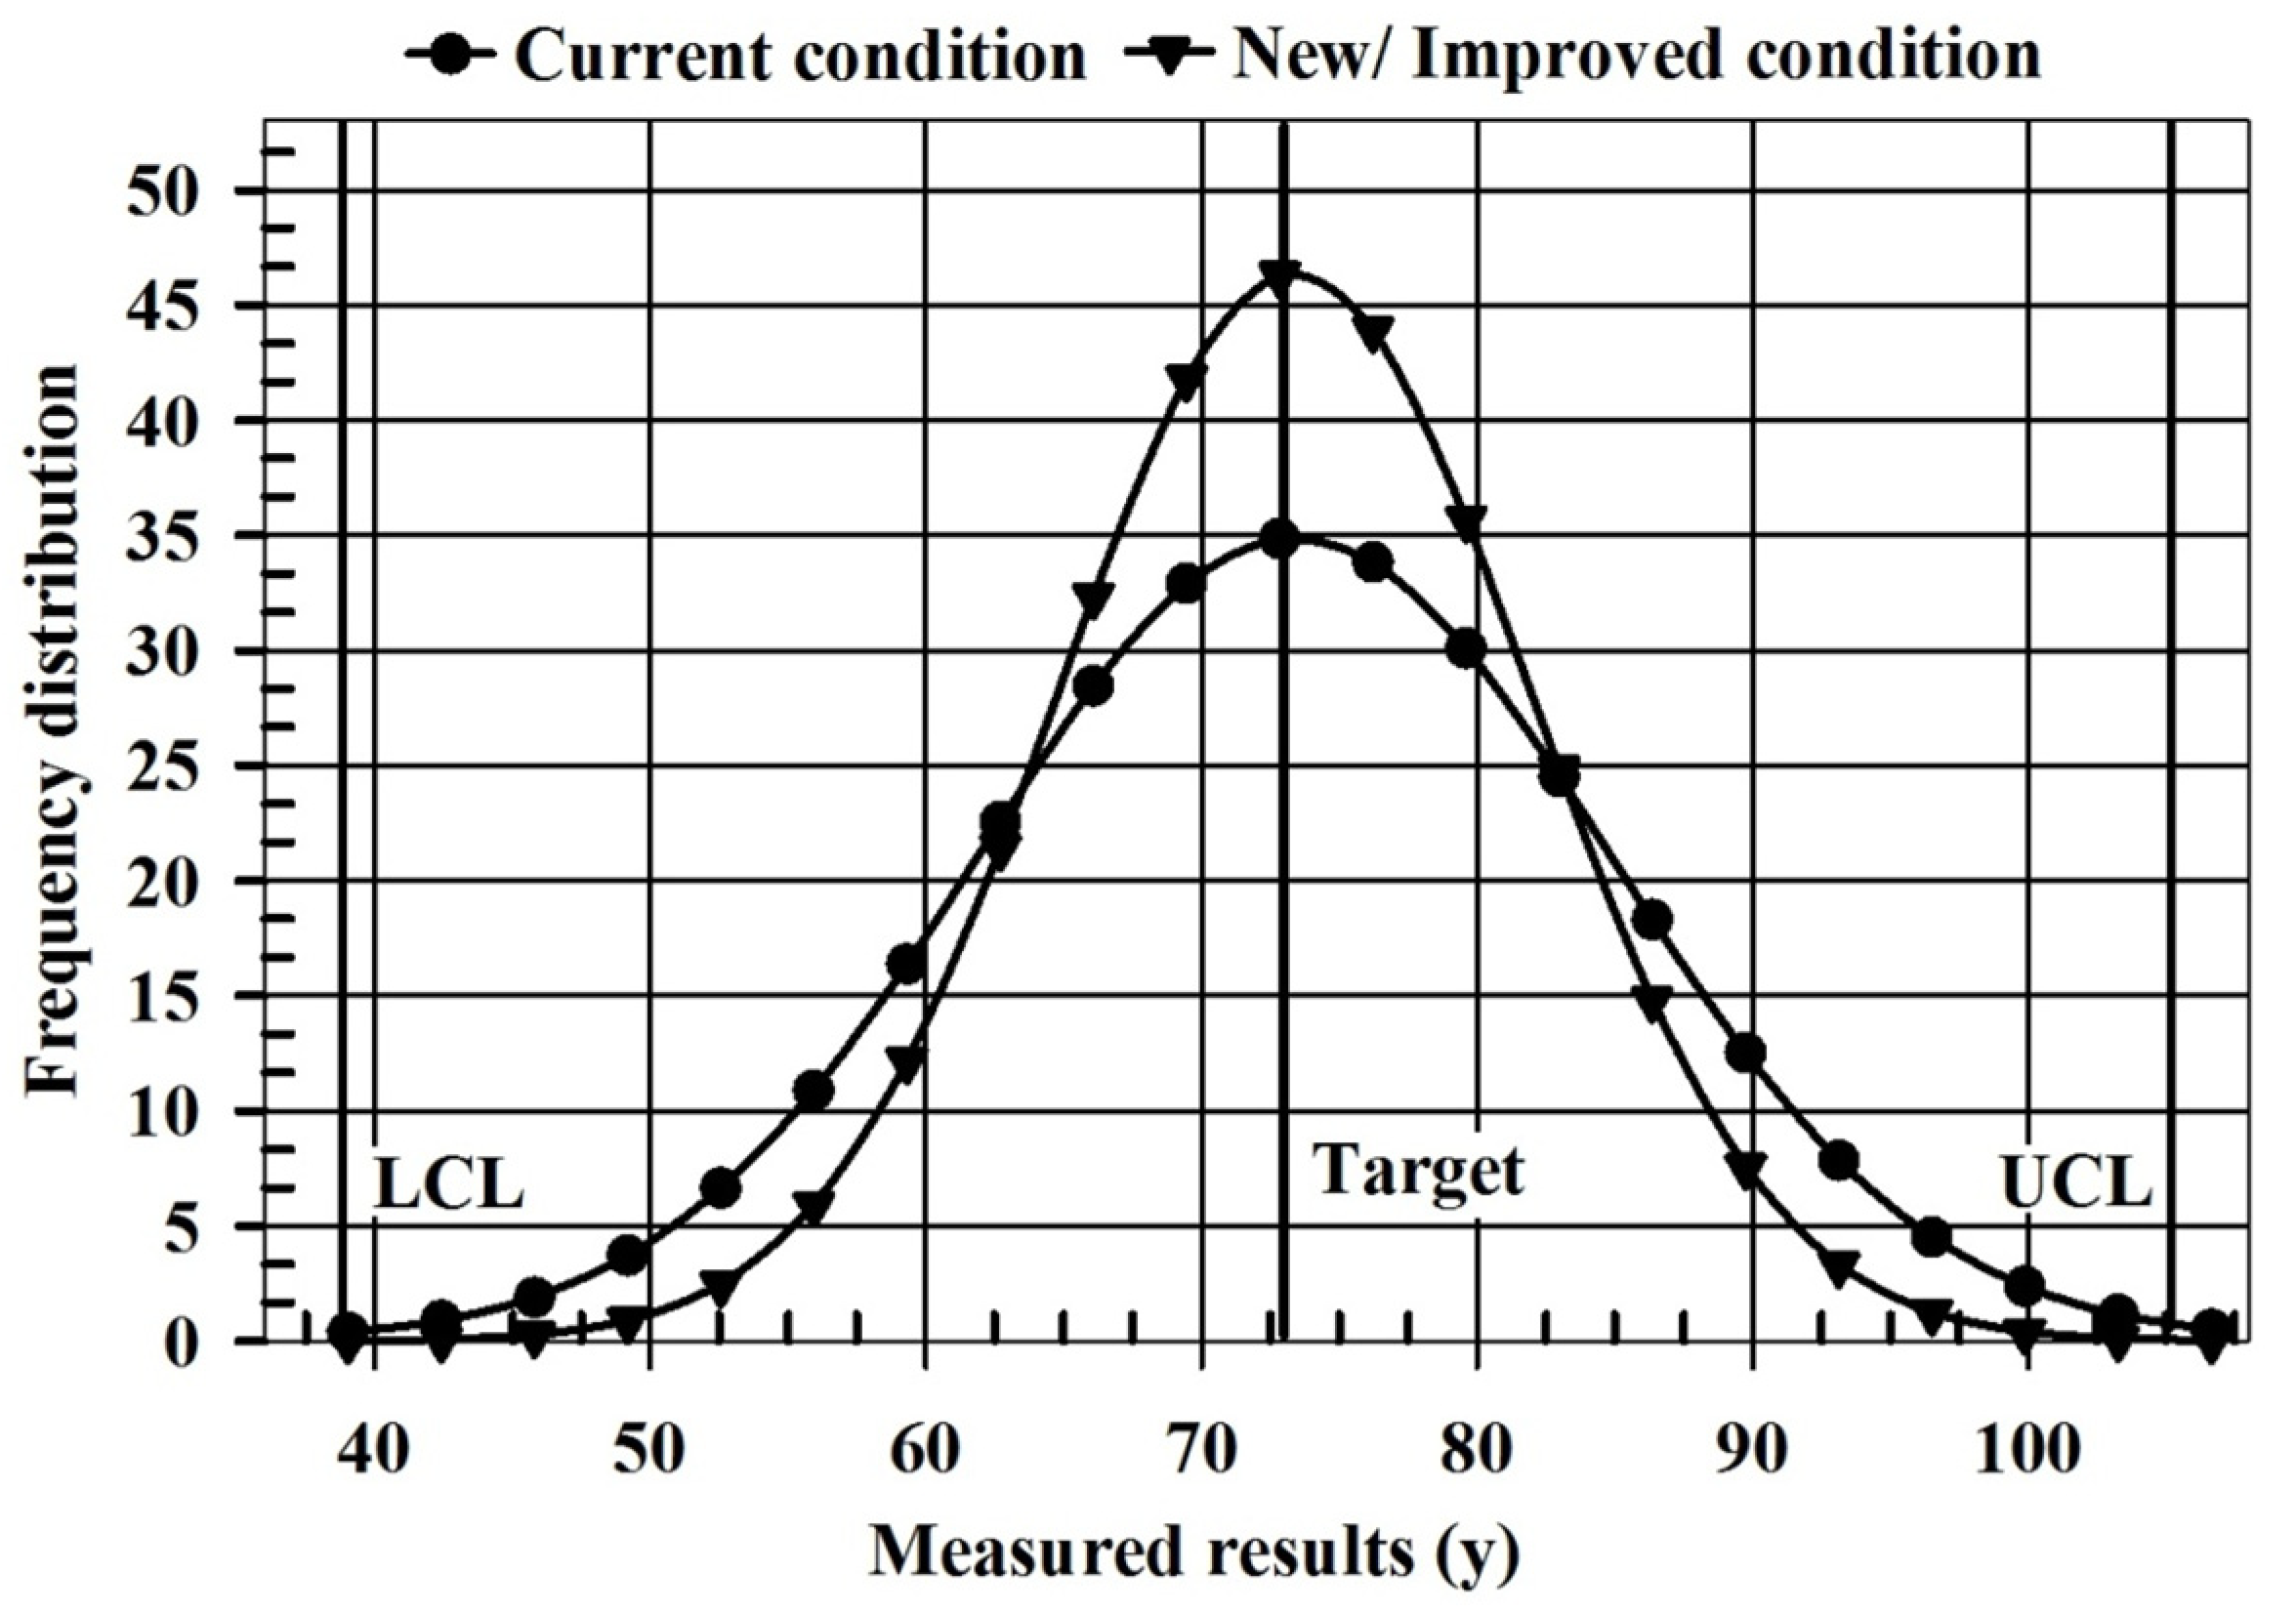
3.6. Optimum Conditions for Sulfate Reduction

The Qualitek 4 software was used to examine the interaction effect of the experimental variables at various levels. The optimum process performance with major factor contributions is shown in Supplementary Table A3. Among the selected factors, HRT had the largest positive impact on SO42− reduction. The data shows the relative interactions of the parameters on SO42− reduction. The contribution by each individual factor is the key for enforcing control over SO42− reduction. The expected improvement on SO42− reduction in mixed anaerobic culture using the experimental variables is shown in Figure 4.
Figure 4. Variation reduction plot showing the performance distribution of sulfate removal under current and improved conditions. (LCL = lower control limit; UCL = upper control limit.)
Water 06 03478 g004
The normal distribution profiles are shown for current and improved conditions assuming the optimum performance is a target. The average SO42− removal shown is approximately 73.9% (Figure 4). The improved and current average percent SO42− removal is the same; however, the improved condition frequency is larger when compared to the current condition frequency. A summary of the two conditions is shown in Table 5.
Table 5. Plotting parameters in the variation reduction plot.
ParametersCurrent ConditionNew/Improved Condition
Mean72.4972.49
Standard deviation11.507.93
Cp1.001.45
Cpk1.001.45
Quality characteristic (QC)Bigger is betterBigger is better
Lower control limit (LCL)37.9937.99
Upper control limit (UCL)106.99106.99
Notes: Cp represents the capability index expressed in terms of a number (ratio) indicating the narrowness of the population distribution within the LCL and UCL; Cpk represents the capability index is very similar to Cp which captures the position of the mean performance as well as the variation of the data within the specification limits; LCL = Mean − (3 × standard deviation of current condition); UCL = Mean + (3 × standard deviation of current condition).
In comparison to the current condition, the standard deviation for the improved condition is smaller. The current condition is derived from the experimental response (%SO42− reduction) while the improved condition is based on the minimization of the variation in the experimental response. The Cp and Cpk values are designated as capability indices [44]. Cp is a measure of the process capability with respect to the difference between the upper control limit (UCL) and lower control limit (LCL). The Cpk value measures the process variation with respect to the mean. A high the Cpk indicate the capability of the process to meet its requirements. For the improved condition case, the capability index is larger when compared to the current condition. A capability index greater than 1.33 (Table 5) indicate the percent SO42− removals are within the tolerances (LCL and UCL). The optimum conditions for SO42− removal was determined by the Qualitek 4 software based on the results obtained using the Taguchi OA.
The optimum conditions for maximum SO42− removal were observed at a COD/SO42− ratio of 0.8, a 12 h HRT together with 1 g L−1 LA (Supplementary Table A3). Under the optimum conditions, the maximum SO42− reduction attained was 97.6%. The total contribution from the experimental factors on SO42− reduction was 24.2%. The observed 73.4% average performance of the mixed microbial cultures and 24.2% contribution from all experimental factors revealed the potential of these variables and their interaction on SO42− reduction in the ASBRs.

4. Conclusions

The Taguchi OA was used to evaluate the percent SO42− reduction using glucose as substrate under different experimental conditions. The factors investigated in this study included the COD/SO42− ratio, HRT and LA concentration. In general, the percent SO42− removed decreased with increasing COD/SO42− ratio and HRT levels and increased with increasing LA concentration. An analysis of the residuals indicates a normal distribution. The surface plots and ANOVA indicates significant interactions between the experimental factors investigated. The Taguchi model predicted an optimum SO42− removal of 97.6% at a COD/SO42− ratio of 0.8 (level 1), a 12 h HRT (level 1) and 1000 mg L−1 LA (level 3). The maximum SO42− removal of 87% ± 3% was obtained at a lower feed COD/SO42− ratio (high SO42− loading conditions) in combination a lower HRT (12 h) in the control cultures (without LA addition). The results obtained from this current study indicated that higher biological SO42− reduction using anaerobic cultures could be achieved in an ASBR at high SO42− levels.

Acknowledgments

Financial support for this work was provided by the Natural Sciences and Engineering Research Council of Canada (Grant No. 261797-2009), the Canada Research Chair program (Grant No. 950-203725) and the University of Windsor (13320).

Author Contributions

The experimental work was conducted by Rajesh Singh, Chungman Moon, Sathyanarayanan S. Veeravalli and Saravanan R. Shanmugam; the manuscript was written by Saravanan R. Shanmugam and Jerald A. Lalman; Data analysis and the model development were performed by Saravanan R. Shanmugam, Sathyanarayanan S. Veeravalli, Subba Rao Chaganti and Jerald A. Lalman.

Conflicts of Interest

The authors declare no conflict of interest.

References

  1. Austin, G.T. Shreve’s Chemical Process Industries, 1st ed.; McGraw Hill: New York, NY, USA, 1984. [Google Scholar]
  2. Shin, H.S.; Sae-Eun, O.; Chae-Young, L. Influence of sulphur compounds and heavy metals on the methanisation of tannery wastewater. Water Sci. Technol. 1997, 35, 239–245. [Google Scholar] [CrossRef]
  3. Pol, L.W.H.; Lens, P.N.L.; Stams, A.J.M.; Lettinga, G. Anaerobic treatment of sulphate-rich wastewaters. Biodegradation 1998, 9, 213–224. [Google Scholar] [CrossRef] [PubMed]
  4. Dugan, P.R. Bacterial ecology of strip mine areas and its relationship to the production of acidic mine drainage. Ohio J. Sci. 1975, 75, 266–279. [Google Scholar]
  5. Foucher, S.; Battaglia-Brunet, F.; Ignatiadis, I.; Morin, D. Treatment by sulfate-reducing bacteria of Chessy acid-mine drainage and metals recovery. Chem. Eng. Sci. 2001, 56, 1639–1645. [Google Scholar] [CrossRef]
  6. Johnson, D.B.; Hallberg, K.B. Pitfalls of passive mine water treatment. Rev. Environ. Sci. Biotechnol. 2002, 1, 335–343. [Google Scholar] [CrossRef]
  7. Moon, C.; Singh, R.; Chaganti, S.R.; Lalman, J.A. Modeling sulfate removal by inhibited mesophilic mixed anaerobic communities using a statistical approach. Water Res. 2013, 47, 2341–2351. [Google Scholar] [CrossRef] [PubMed]
  8. Thauer, R.K.; Jungermann, K.; Decker, K. Energy conservation in chemotrophic anaerobic bacteria. Bacteriol. Rev. 1977, 41, 100–180. [Google Scholar] [PubMed]
  9. Choi, E.; Rim, J.M. Competition and inhibition of sulfate reducers and methane producers in anaerobic treatment. Water Sci. Technol. 1991, 23, 1259–1264. [Google Scholar]
  10. Erdirencelebi, D.; Ozturk, I.; Cokgor, E.U.; Tonuk, G.U. Degree of sulfate-reducing activities on COD removal in various reactor configurations in anaerobic glucose and acetate-fed reactors. Clean Soil Air Water 2007, 35, 178–182. [Google Scholar] [CrossRef]
  11. Uberoi, V.; Bhattacharya, S.K. Interactions among sulfate reducers, acetogens, and methanogens in anaerobic propionate systems. Water Environ. Res. 1995, 67, 330–339. [Google Scholar] [CrossRef]
  12. Omil, F.; Bakker, C.D.; Pol, L.W.H.; Lettinga, G. Effect of pH and low temperature shocks on the competition between sulphate reducing bacteria and methane producing bacteria in UASB reactors. Environ. Technol. 1997, 18, 255–264. [Google Scholar] [CrossRef]
  13. Hao, O.J.; Chen, J.M.; Huang, L.; Buglass, R.L. Sulfate-reducing bacteria. Crit. Rev. Environ. Sci. Technol. 1996, 26, 155–187. [Google Scholar] [CrossRef]
  14. Okabe, S.; Nielsen, P.H.; Jones, W.L.; Characklis, W.G. Sulfide product inhibition of Desulfovibrio desulfuricans in batch and continuous cultures. Water Res. 1995, 29, 571–578. [Google Scholar] [CrossRef]
  15. Widdel, F.; Pfennig, N. Sporulation and further nutritional characteristics of Desulfotomaculum acetoxidans. Arch. Microbiol. 1981, 129, 401–402. [Google Scholar] [CrossRef] [PubMed]
  16. Smith, M.R.; Mah, R.A. Growth and methanogenesis by Methanosarcina Strain 227 on acetate and methanol. Appl. Environ. Microbiol. 1978, 36, 870–879. [Google Scholar] [PubMed]
  17. Oh, S.E.; van Ginkel, S.; Logan, B.E. The relative effectiveness of pH control and heat treatment for enhancing biohydrogen gas production. Environ. Sci. Technol. 2003, 37, 5186–5190. [Google Scholar] [CrossRef] [PubMed]
  18. Shanmugam, S.R.; Chaganti, S.R.; Lalman, J.A.; Heath, D.D. Effect of inhibitors on hydrogen consumption and microbial population dynamics in mixed anaerobic cultures. Int. J. Hydrogen Energy 2014, 39, 249–257. [Google Scholar] [CrossRef]
  19. Galbraith, H.; Miller, T.B. Physicochemical effects of long-chain fatty acids on bacterial cells and their protoplasts. J. Appl. Bacteriol. 1973, 36, 647–658. [Google Scholar] [CrossRef] [PubMed]
  20. Lalman, J.; Bagley, D.M. Effects of C18 long chain fatty acids on glucose, butyrate and hydrogen degradation. Water Res. 2002, 36, 3307–3313. [Google Scholar] [CrossRef] [PubMed]
  21. Rao, R.S.; Kumar, C.G.; Prakasham, R.S.; Hobbs, P.J. The Taguchi methodology as a statistical tool for biotechnological applications: A critical appraisal. Biotechnol. J. 2008, 3, 510–523. [Google Scholar] [CrossRef] [PubMed]
  22. Myer, R.H.; Montogomery, D.C. Response Surface Methodology: Process and Product Optimization Using Designed Experiment, 2nd ed.; John Wiley and Sons: New York, NY, USA, 2002. [Google Scholar]
  23. Prakasham, R.S.; Rao, C.S.; Rao, R.S.; Rajesham, S.; Sarma, P.N. Optimization of alkaline protease production by Bacillus sp. using Taguchi methodology. Appl. Biochem. Biotechnol. 2005, 120, 133–144. [Google Scholar] [CrossRef]
  24. Prakasham, R.S.; Rao, C.S.; Rao, R.S.; Sarma, P.N. Enhancement of acid amylase production by an isolated Aspergillus awamori. J. Appl. Microbiol. 2007, 102, 204–211. [Google Scholar] [CrossRef] [PubMed]
  25. Antony, F.; Warwood, S.; Fernandes, K.; Rowlands, H. Process optimization using Taguchi methods of experimental design. Work Study 2001, 50, 51–57. [Google Scholar] [CrossRef]
  26. Roy, R.K. Design of Experiments Using Taguchi Approach:16 Steps to Product and Process Improvement; John Wiley and Sons: New York, NY, USA, 2001. [Google Scholar]
  27. Ray, S.; Chowdhury, N.; Lalman, J.A.; Seth, R.; Biswas, N. Impact of initial pH and linoleic acid (C18:2) on hydrogen production by a mesophilic anaerobic mixed culture. J. Environ. Eng. ASCE 2008, 134, 110–117. [Google Scholar] [CrossRef]
  28. Wiegant, W.M.; Lettinga, G. Thermophilic anaerobic digestion of sugars in upflow anaerobic sludge blanket reactors. Biotechnol. Bioeng. 1985, 27, 1603–1607. [Google Scholar] [CrossRef] [PubMed]
  29. Shizas, L.; Bagley, D.M. Improving anaerobic sequencing batch reactor performance by modifying operational parameters. Water Res. 2002, 36, 363–367. [Google Scholar] [CrossRef] [PubMed]
  30. Speece, R.E. Gas Flow Totalizer. U.S. Patent 4064750 A, 27 December 1977. [Google Scholar]
  31. American Publishers Health Association (APHA). Standard Methods for the Examination of Water and Wastewater, 20th ed.; APHA: Washington, DC, USA, 1999. [Google Scholar]
  32. Kaksonen, A.H.; Franzmann, P.D.; Puhakka, J.A. Effects of hydraulic retention time and sulfide toxicity on ethanol and acetate oxidation in sulfate-reducing metal-precipitating fluidized-bed reactor. Biotechnol. Bioeng. 2004, 86, 332–343. [Google Scholar] [CrossRef] [PubMed]
  33. Wang, J.X.; Roush, M.L. What Every Engineer Should Know about Risk Engineering and Management; Marcel Dekker, Inc.: New York, NY, USA, 2000. [Google Scholar]
  34. Evangelaras, H.; Koukouvinos, C.; Lappas, E. An efficient algorithm for the identification of isomorphic orthogonal arrays. J. Discrete Math. Sci. Cryptogr. 2006, 9, 125–132. [Google Scholar] [CrossRef]
  35. Phadke, M.S.; Dehnad, K. Optimization of product and process design for quality and cost. Qual. Reliab. Eng. Int. 1988, 4, 105–112. [Google Scholar] [CrossRef]
  36. Velasco, A.; Ramirez, M.; Volke-Sepulveda, T.; Gonzalez-Sanchez, A.; Revah, S. Evaluation of feed COD/sulfate ratio as a control criterion for the biological hydrogen sulfide production and lead precipitation. J. Hazard. Mater. 2008, 151, 407–413. [Google Scholar] [CrossRef] [PubMed]
  37. El Bayoumy, M.A.; Bewtra, J.K.; Ali, H.I.; Biswas, N. Sulfide production by sulfate reducing bacteria with lactate as feed in an upflow anaerobic fixed film reactor. Water Air Soil Poll. 1999, 112, 67–84. [Google Scholar]
  38. Neculita, C.M.; Zagury, G.J.; Bussiere, B. Effectiveness of sulfate-reducing passive bioreactors for treating highly contaminated acid mine drainage: I. Effect of hydraulic retention time. Appl. Geochem. 2008, 23, 3442–3451. [Google Scholar]
  39. Ray, S.; Saady, N.M.C.; Lalman, J.A. Diverting electron fluxes to hydrogen in mixed anaerobic communities fed with glucose and unsaturated C18 long chain fatty acids. J. Environ. Eng. ASCE 2010, 136, 568–575. [Google Scholar] [CrossRef]
  40. Chowdhury, N.; Lalman, J.A.; Seth, R.; Ndegwa, P. Biohydrogen production by mesophilic anaerobic fermentation of glucose in the presence of linoleic acid. J. Environ. Eng. 2007, 133, 1145–1152. [Google Scholar] [CrossRef]
  41. Lopes, S.I.C.; Wang, X.; Capela, M.I.; Lens, P.N.L. Effect of COD/SO42− ratio and sulfide on thermophilic (55 °C) sulfate reduction during the acidification of sucrose at pH 6. Water Res. 2007, 41, 2379–2392. [Google Scholar] [CrossRef] [PubMed]
  42. Barrera, E.L.; Spanjers, H.; Romero, O.; Rosa, E.; Dewulf, J. Characterization of the sulfate reduction process in the anaerobic digestion of a very high strength and sulfate rich vinasse. Chem. Eng. J. 2014, 248, 383–393. [Google Scholar] [CrossRef]
  43. Zhou, J.M.; Song, Z.Y.; Yan, D.J.; Liu, Y.L.; Yang, M.H.; Cao, H.B.; Xing, J.M. Performance of a haloalkaliphilic bioreactor and bacterial community shifts under different COD/SO42− ratios and hydraulic retention times. J. Hazard. Mater. 2014, 274, 53–62. [Google Scholar] [CrossRef] [PubMed]
  44. Van Aartsengel, A.; Kurtoglu, S. Handbook on Continuous Improvement Transformation: The Lean Six Sigma Framework and Systematic Methodology for Implementation; Springer: New York, NY, USA, 2013. [Google Scholar]

