Development, Characterization, and Validation of a Cold Stage-Based Ice Nucleation Array (PKU-INA)
by
 , , and
Jie Chen
1 ,
,
Xiangyu Pei
2,
Hong Wang
3,
Jingchuan Chen
1,
Yishu Zhu
1,
Mingjin Tang
4 and
Zhijun Wu
1,* 1
State Key Joint Laboratory of Environmental Simulation and Pollution Control, College of Environmental Sciences and Engineering, Peking University, Beijing 100871, China
2
Department of Chemistry and Molecular Biology, University of Gothenburg, 41296 Gothenburg, Sweden
3
Beijing National Laboratory for Condensed Matter Physics, Institute of Physics, Chinese Academy of Science, Beijing 100190, China
4
State Key Laboratory of Organic Geochemistry and Guangdong Key Laboratory of Environmental Protection and Resources Utilization, Guangzhou Institute of Geochemistry, Chinese Academy of Sciences, Guangzhou 510640, China
*
Author to whom correspondence should be addressed.
Atmosphere 2018, 9(9), 357; https://doi.org/10.3390/atmos9090357
Submission received: 3 August 2018
/
Revised: 30 August 2018
/
Accepted: 31 August 2018
/
Published: 17 September 2018
(This article belongs to the Special Issue Aerosol-Cloud Interactions)
Abstract
:A drop-freeze array (PeKing University Ice Nucleation Array, PKU-INA) was developed based on the cold-stage method to investigate heterogeneous ice nucleation properties of atmospheric particles in the immersion freezing mode from −30 to 0 °C. The instrumental details as well as characterization and performance evaluation are described in this paper. A careful temperature calibration protocol was developed in our work. The uncertainties in the reported temperatures were found to be less than 0.4 °C at various cooling rates after calibration. We also measured the ice nucleation activities of droplets containing different mass concentrations of illite NX, and the results obtained in our work show good agreement with those reported previously using other instruments with similar principles. Overall, we show that our newly developed PKU-INA is a robust and reliable instrument for investigation of heterogeneous ice nucleation in the immersion freezing mode.
1. Introduction
Ice nucleation plays an important role in ice crystal formation in clouds, thus it has large impacts on cloud properties, precipitation, and radiative transfer [1,2,3]. Ice nucleation in the atmosphere can occur via two primary mechanisms, i.e., homogeneous ice nucleation and heterogeneous ice nucleation [4]. While homogeneous ice nucleation can only occur for temperatures below −38 °C, heterogeneous ice nucleation can take place at higher temperatures [5]. Four modes have been proposed for heterogeneous ice nucleation, including deposition ice nucleation, immersion freezing, condensation freezing, and contact freezing [6,7,8]. Immersion freezing, initiated by an ice nucleating particle (INP) immersed in a supercooled droplet [6], has been suggested to be the dominant heterogeneous ice nucleation process in mixed-phase clouds where ice particles and supercooled droplets coexist [9,10]. Measurement of the ice nucleating properties of atmospheric particles and the concentration of INPs for the immersion freezing mode is gradually receiving attention [9,11,12,13]. However, largely due to a lack of techniques for investigation of immersion freezing (and heterogeneous ice nucleation in general), our knowledge of the abundance of INPs in the troposphere is very limited, and it is not well understood why different particles exhibit different ice nucleation activities [11,14].
In the last several years, a number of instruments have been developed for the investigation of immersion freezing, and these techniques fall into two categories, i.e., the chamber technique and drop-freeze technique [15,16,17]. For a typical chamber technique, aerosol particles are exposed to water vapor supersaturated with respect to ice, and the formed ice crystals are then detected by an optical particle counter. For example, the continuous flow diffusion chamber (CFDC) was developed approximately three decades ago to measure the concentration and ice nucleation efficiency of INP [18], and the principle used by the CFDCs has also been adopted by a few other instruments, including the Zurich Ice Nucleation Chamber (ZINC) [19], the Portable Ice Nucleation Chamber (PINC) [20], and SPectrometer for Ice Nuclei (SPIN) [21].
For drop-freeze techniques, droplets under investigation can be directly located on a cold-stage, or alternatively, they can be placed in tubes that are immersed in a cold bath; the freezing behavior of these droplets is monitored during cooling. Bigg [22] was one of the pioneers in development and application of this technique, and since then, several instruments based on this technique have been developed. For example, in the light emitting diode (LED)-based Ice Nucleation Detection Apparatus (LINDA), 52 tubes containing melted snow are placed in a cold bath to investigate the freezing behavior of these samples [17], and a similar instrument was developed to study the ice nucleation activities of aerosol particles collected on quartz filters [23]. Cold-stage-based instruments, for which droplets are distributed on a cold-stage, include the Bielefeld Ice Nucleation ARraY (BINARY) [24], Cryogenic Refrigerator Applied to Freezing Test (CRAFT) [25], and Leeds Nucleation by Immersed Particles Instrument (Leeds-NIPI) [9,26]. The recently developed WeIzmann Supercooled Droplets Observation on Microarray (WISDOM) [27] is also a cold-stage-based instrument in which microfluidics techniques are combined for automatic generation of droplets, the resulting droplets are then transferred to cold stage to investigate their freezing ability.
Ice nucleation activities of particles, which can be collected in solutions or onto filters, are measured offline using drop-freeze techniques. Compared with the chamber technique, the drop-freeze technique is inexpensive and easy to operate; in addition, INPs active at temperatures warmer than −10 °C can be reliably detected despite their low concentrations [17]. Nevertheless, this technique also has some drawbacks. For cold-stage-based instruments, due to the Wegener–Bergeron–Findeisen effect, ice particles may grow at the expense of neighboring supercooled droplets [24]. Potential contamination from the surrounding air, as well as temperature bias due to temperature heterogeneity of the substrate used to support droplets under investigation, could also lead to considerable experimental uncertainties [15]. Furthermore, if tubes containing droplets under investigation are immersed in a cold bath, it is nontrivial to correct the temperature difference between the cold bath and the droplets.
Intercomparison has been carried out for different immersion freezing instruments [28], with Saharan dust [27], Snomax [16,29] and illite NX (an illite rich powder referred to as illite NX by the supplier) [15] used as reference substances. A large discrepancy in the ice active-site densities of illite NX, up to three orders of magnitude, has been reported for the 17 instruments included in the comparison [15]. Relatively, good agreement in the measured ice nucleation activity of Snomax was found for temperature below −12 °C for the seven instruments involved in the comparison, and the measured ice active site densities differed by a factor of less than three [16]. However, the ice nucleation activity of Snomax was recently reported to be unstable [29], indicating the uncertainties for the ice nucleation measurement of Snomax.
In this work, a cold-stage-based array (PeKing University Ice Nucleation Array, abbreviated as PKU-INA), which shares common features with the one designed by Budke and Koop [24], was developed to study the ice nucleation properties of particles immersed in microliter droplets. In this work, a temperature calibration protocol was developed to account for the temperature difference between droplets under investigation and the substrate on which these droplets were distributed. To check the performance of the cold-stage-based array developed in our work, we measured the ice nucleation activities of illite NX (Arginotec, NX Nanopowder, Germany) at different temperatures and compared our results with those reported in previous studies [24,25]. The description, characterization, and validation of the newly developed PKU-INA are presented in this paper.
2. Experiments
2.1. Description of the Instrument
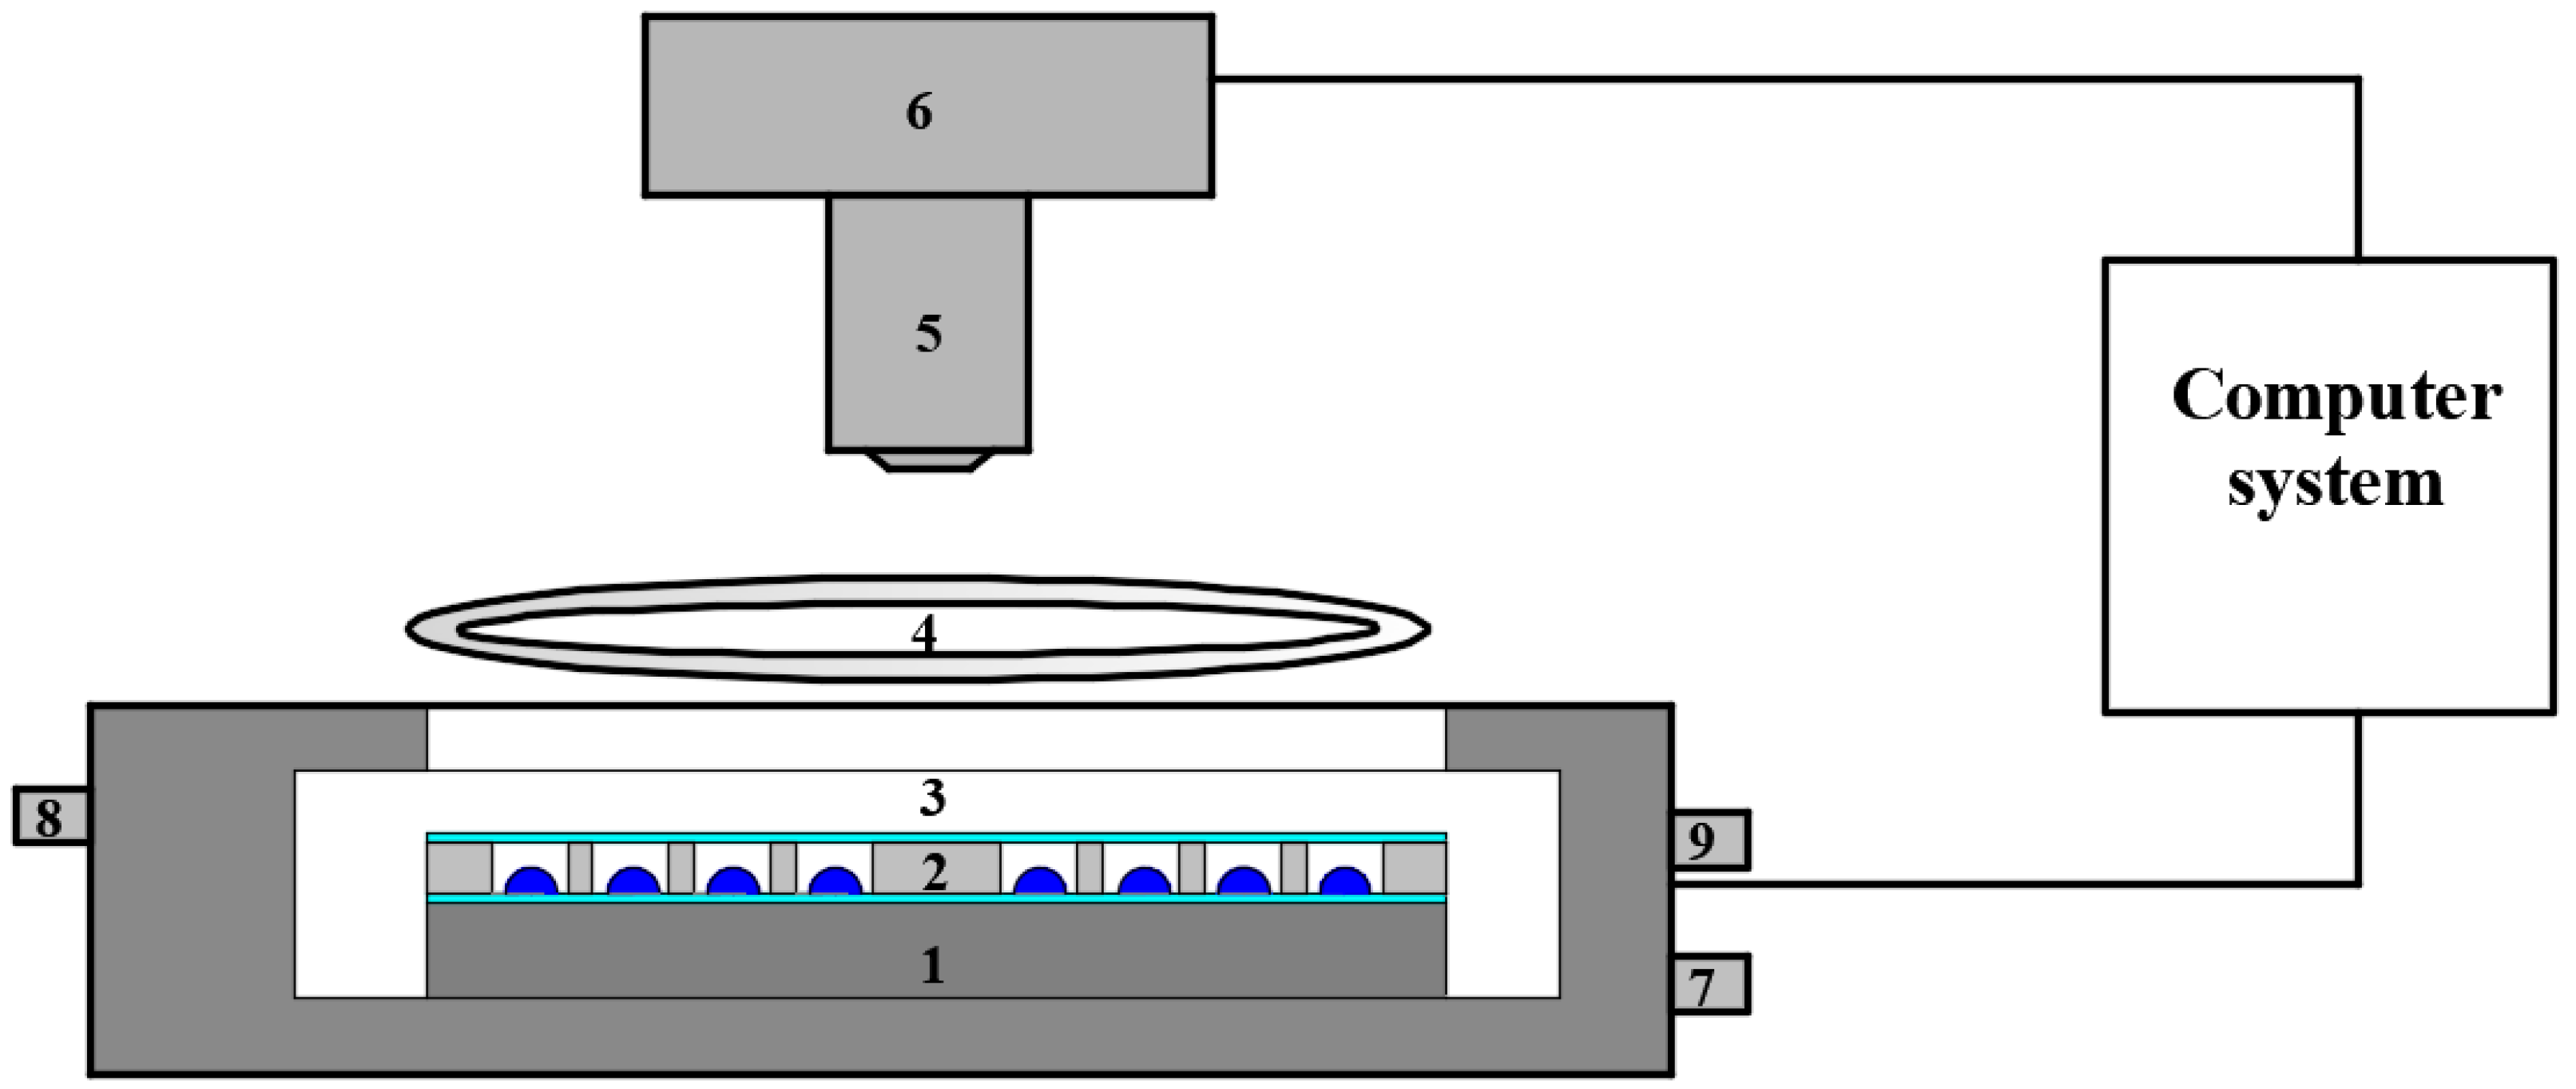
Figure 1 displays the schematic diagram of the PeKing University Ice Nucleation Array (PKU-INA). The PKU-INA consists of a commercial cold stage (LTS120, Linkam, Epsom Downs, UK), a ring LED light, a charge-coupled device (CCD) camera (Q-imaging MicroPublisher 5.0 RTV, QImaging, Surrey, BC, Canada), and a computer system. An external refrigerated water circulator (FP40-HL, Julabo, Seelbach, Germany) was used to maintain the low temperature of the cold stage. The cold stage offered a measuring temperature down to −40 °C when the temperature of circulating water inside the cold stage was to be maintained at 5 °C. A ring LED light was mounted on the top of the cold-stage to enhance the reflection of droplets under investigation.
Droplets were pipetted onto a hydrophobic glass slide (40 mm in diameter, 0.13–0.16 mm in thickness, supplied by Marienfeld company, Lauda-Königshofen, Germany) located on the cold stage. The gap between the glass slide and the stage was filled with silicone oil (product number 85409, Sigma-Aldrich, Beijing, China) to ensure good thermal contact. A round aluminum spacer (40 mm in diameter, 1.5 mm in thickness) with 90 round compartments (3.0 mm in diameter) was first placed onto the glass slides, and then, 90 droplets were pipetted dropwise into each compartment. The spacer was covered using another glass slide to avoid the Wegener–Bergeron–Findeisen process [30]. Both the spacer and hydrophobic glass were rinsed by deionized water and acetone and dried by pure nitrogen gas before each experiment.
Droplets were cooled down to −40 °C, with cooling rates varying from 0.1 to 10 °C/min, and meanwhile, the phase state of the droplets was recorded using the CCD camera with a given time resolution (1 frame per second in this study). High-purity nitrogen was delivered into the cold stage to avoid frost.
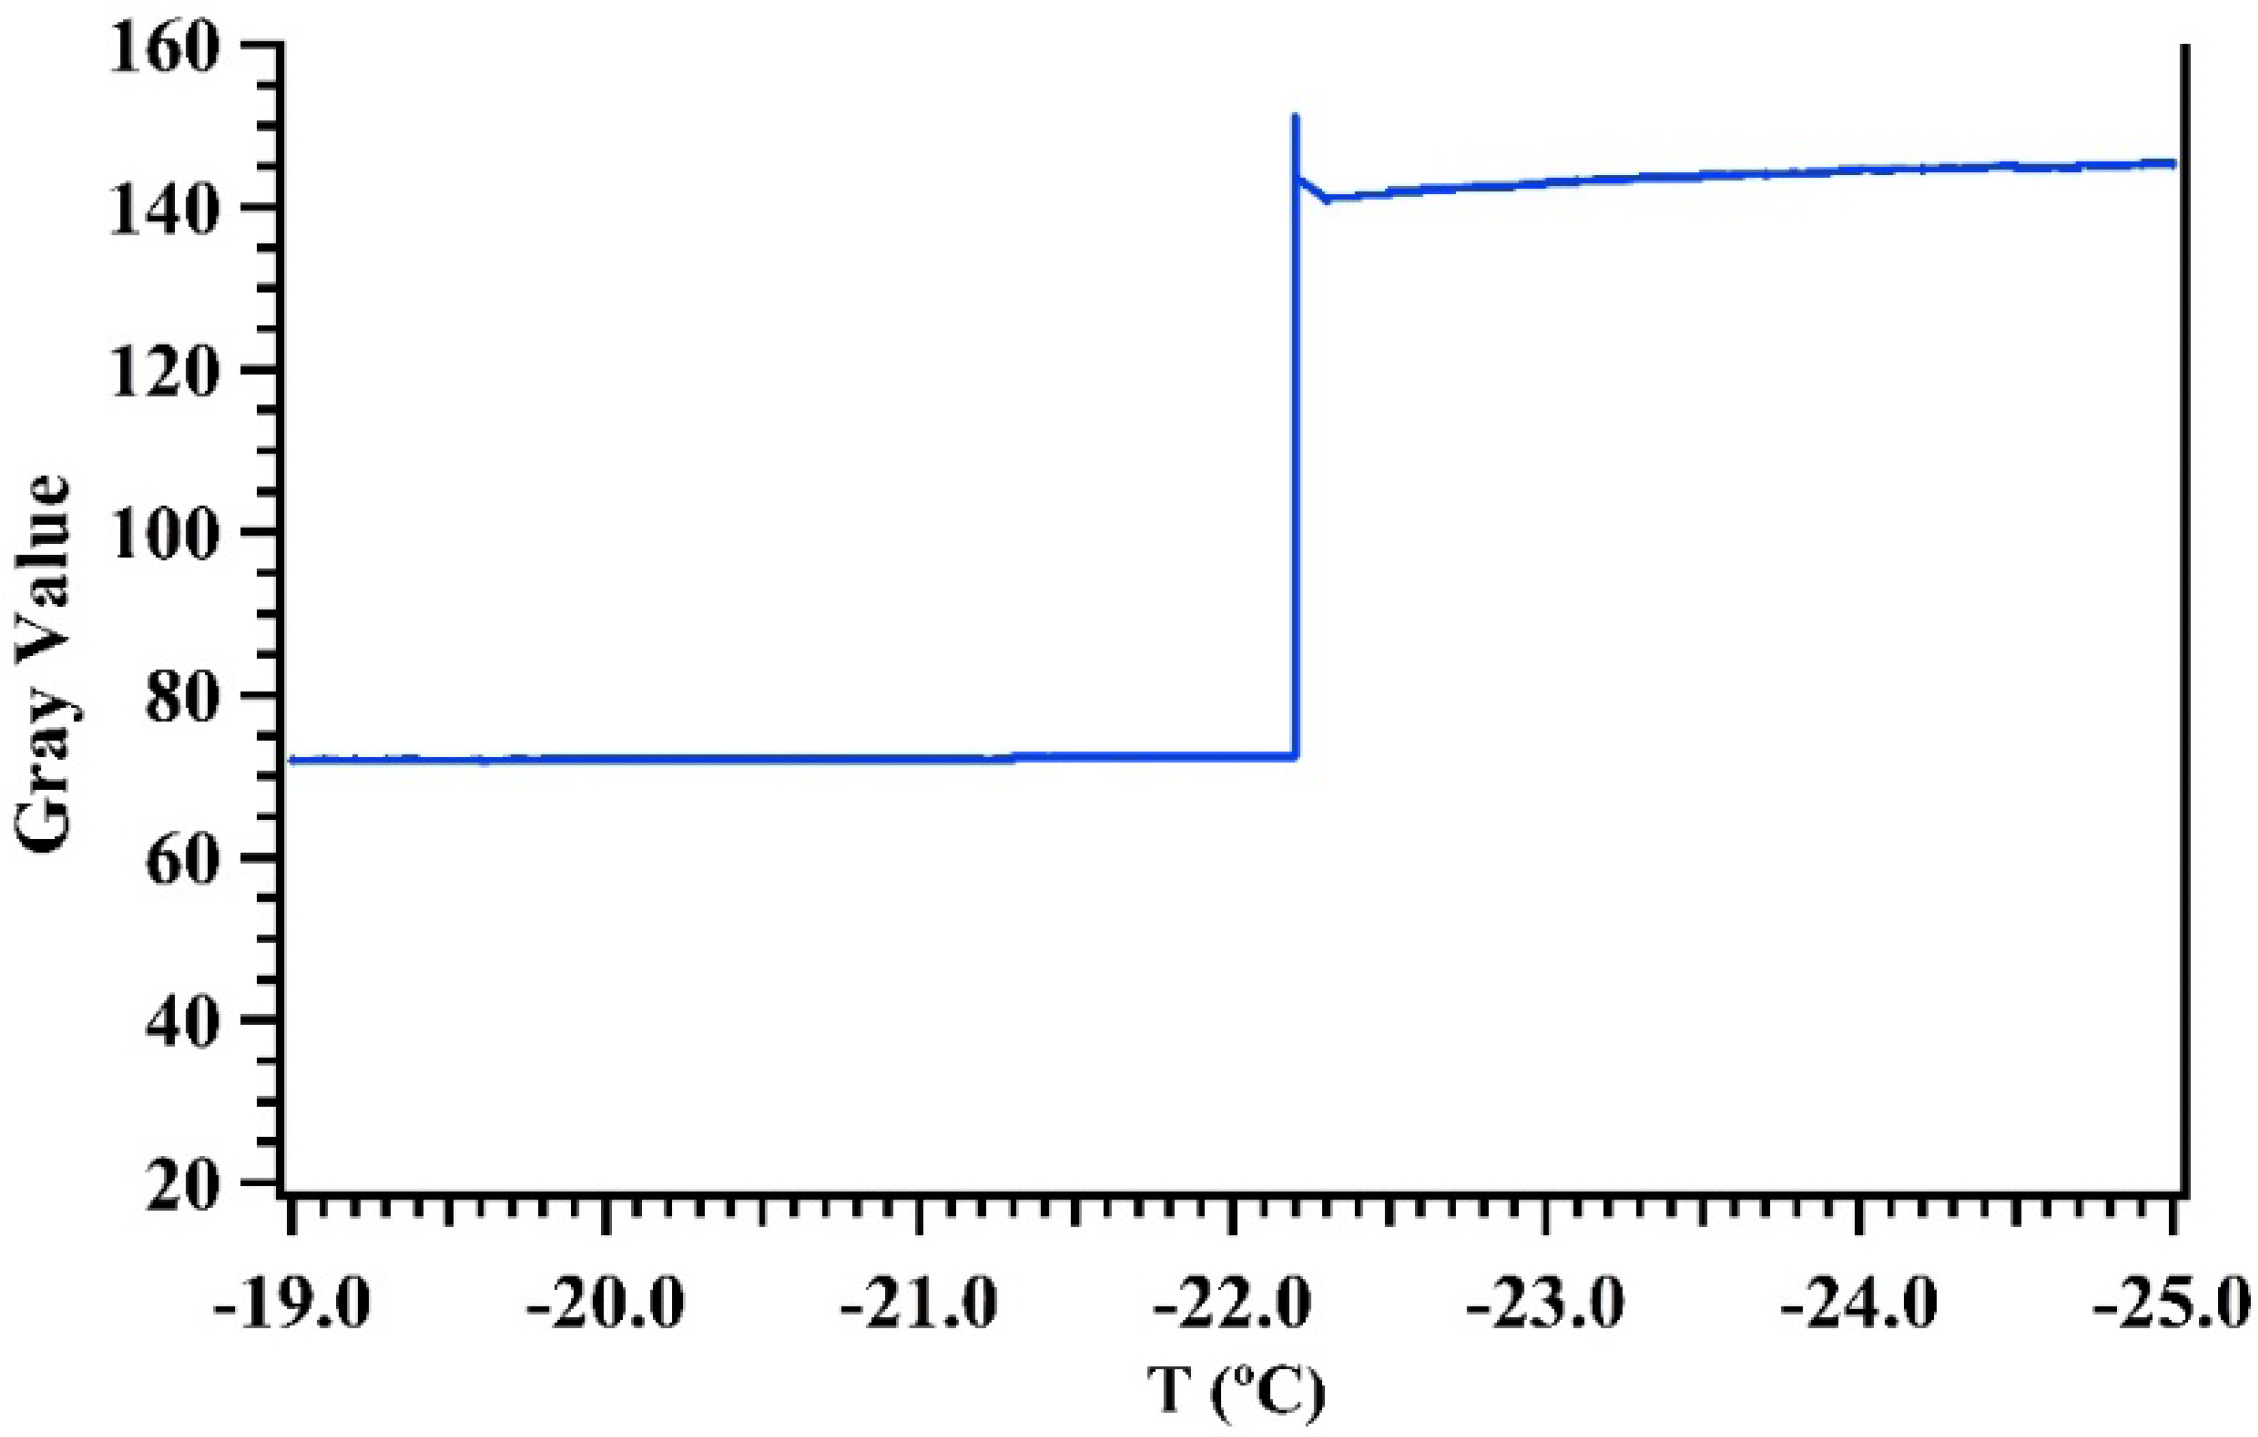
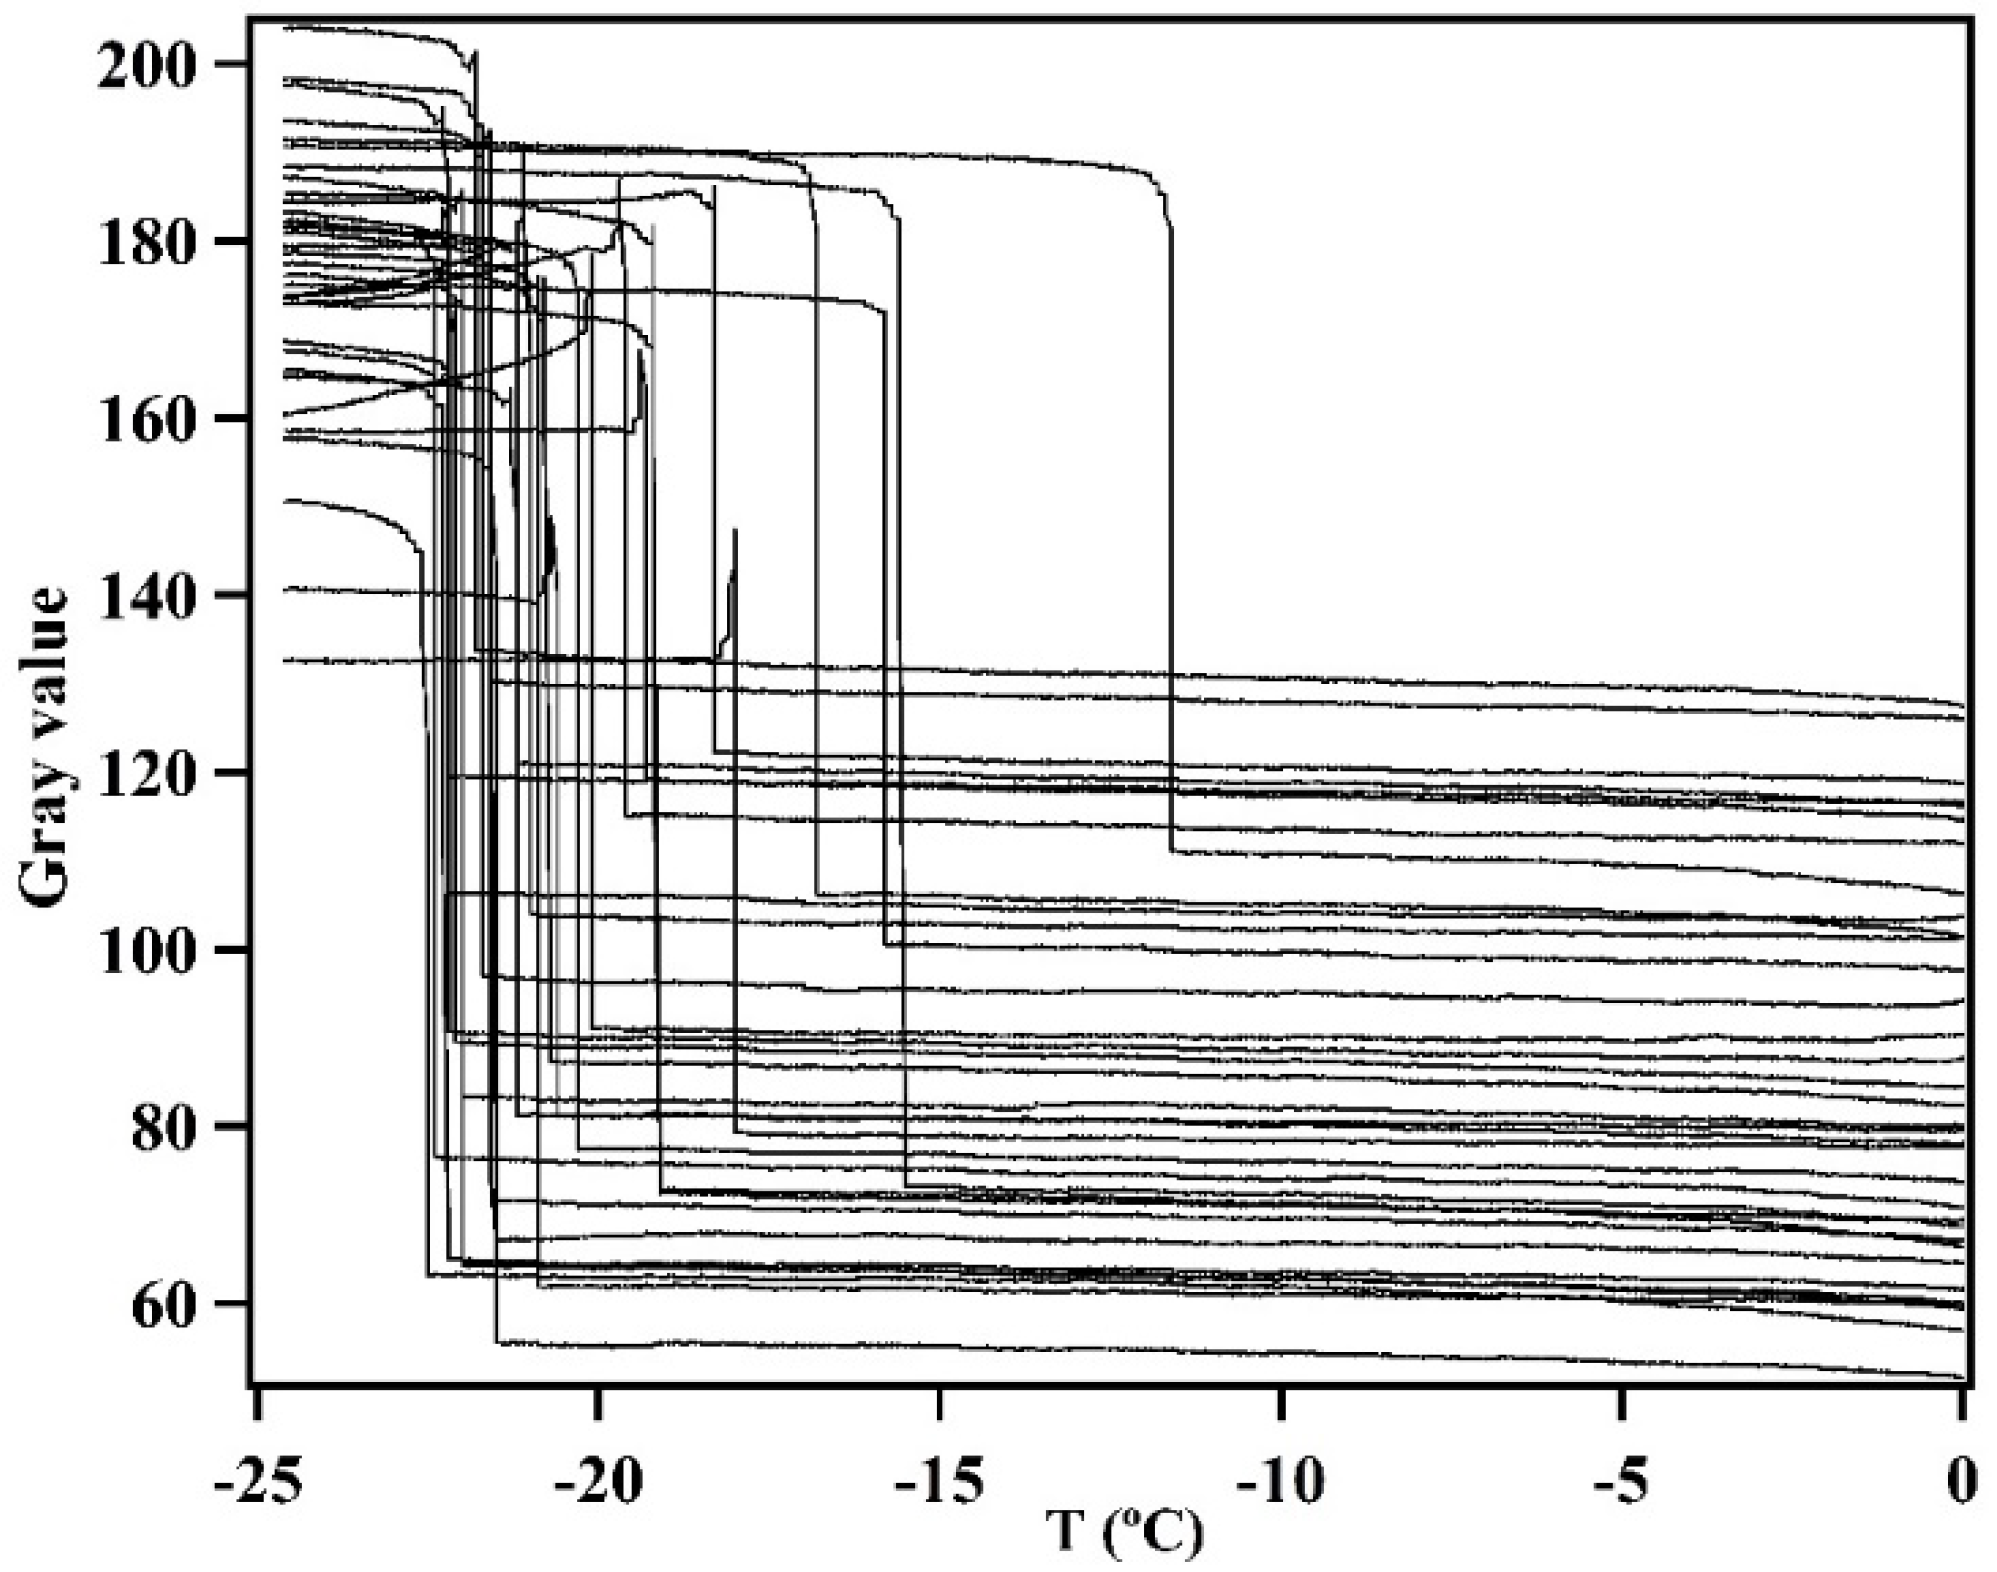
A Matlab program was developed to record the temperature of the cold stage in real time and to analyze droplet images under investigation. The images appear to be dark for unfrozen droplets and white once frozen; therefore, the phase transition of each droplet can be identified by the change in brightness of the image. The gray values of a typical water droplet are plotted in Figure 2 as a function of temperature when the temperature was decreased from −22 to −23 °C with a cooling rate of 1 °C/min. As shown in Figure 2, a dramatic increase in gray value was observed when temperature was decreased to approximately −22.2 °C, indicating that the water droplet was frozen. The gray value changes of different droplets in different temperatures are displayed in Figure A1, indicating that the counting processes work well even in a higher temperature range.
2.2. Temperature Calibration
A commercial water-filled capillary tube (Beijing Aidejiaye Technology Development Co., Ltd., Beijing, China) was used to examine the temperature accuracy of the cold stage at 0 °C. The capillary tube, which was filled with ultrapure water (18.2 MΩ·cm; total organic carbon: <5 ppb), had a length of 1 cm, an inner diameter of 300 μm, and an external diameter of 605 μm. The capillary was placed on a glass slide. The phase state of water in such a small capillary tube is sensitive to the temperature change of the cold stage and was observed by using a 10× (Olympus plan C N) microscope (made by Linkam Co., Tadworth, UK).
To investigate the impacts of heating rates and supporting substrates on the measured temperatures, we conducted a temperature calibration experiment similar to that used by Budke and Koop [24]. Phase transition temperatures of two references (tridecane and undecane, Sigma-Aldrich) and distilled water were determined and compared with those reported in the literature. When the temperature was increased to its solid-to-liquid phase transition temperature, the substance under investigation was melted immediately. We did not attempt to use liquid-to-solid phase transitions for temperature calibration because droplets could exist in the supercooled state, potentially leading to large biases in temperature calibration [31,32]. Notably, when the temperature was increased, both tridecane and undecane would first undergo solid-to-solid phase transition and then solid-to-liquid phase transition. The solid-to-solid phase transition temperatures were reported to be −36.85 °C (+0.30, −0.15) and −18.15 °C (+0.02, −0.00) for undecane and tridecane, respectively, and their corresponding solid-to-liquid phase transition temperatures were reported to be −25.61 °C (+0.01, −0.29) and −5.41 °C (+0.05, −0.39), respectively; together with the solid-liquid phase transition at 0 °C for distilled water [33,34], these temperatures covered the temperature range under which the cold-stage was typically operated. One should keep in mind that the cold-stage temperatures were calibrated by comparing with the phase transition temperatures of undecane and tridecane, thus, the temperature errors for the phase transition may introduce bias in the calibrated cold-stage temperatures. Such bias should be in the error ranges given above.
2.3. Illite NX Characterization
Illite NX, the immersion freezing properties of which were studied by 17 other instruments [15,27], was distributed by INUIT (Ice Nuclei Research Unit). The physicochemical properties of illite NX were characterized in our work. Its Brunauer–Emmett–Teller (BET) specific surface area (SSA) was determined by nitrogen adsorption (SSA-700, Beijing Builder Electronic Technology Company, Beijing, China), and samples were outgassed at 95 °C for 24 h before the BET analysis. Energy dispersive X-ray (EDX) spectroscopy was used to measure the elemental composition of illite NX, and its morphology (size and shape) was characterized by scanning electron microscopy (SEM). Illite NX particles were randomly distributed onto a conductive carbon resin pad and then coated with a layer of Au nanoparticles to improve the image contrast before SEM analysis.
2.4. Freezing Experiments of Illite NX
An illite NX suspension in water with a concentration of 1 mg/mL was first prepared, and it was further diluted to suspensions with lower concentrations (10−2, 10−4, and 10−6 mg/mL). Illite suspensions were stirred for 24 h using a magnetic stirrer to ensure homogeneity. Droplets with a volume of 1 μL were pipetted onto the hydrophobic glass slide, which was first cleaned with acetone. The cooling rate of the cold stage was set to 1 °C/min, which is similar to the cooling rate in slowly ascending clouds (<1 °C/min) [18] and was suggested to be suitable for freezing experiments [25]. Droplet images and the temperature of the cold stage were recorded every second. After gray value analysis, the numbers of frozen and unfrozen droplets at each temperature could be determined by the maximal gray value change, as mentioned above. The frozen fraction, ƒice, can be calculated using Equation (1):
where Nt is the total number of droplets (90 in each of our experiments) and Nice is the number of frozen droplets at a given temperature. If the immersion freezing of supercooled droplets was assumed to only depend on temperature, the cumulative number of ice nucleator concentration in each droplet, K (T), could be obtained using Equation (2) [6,25,26]:
where V is the volume of an individual droplet (1 μL in our work). The ice nucleation active site density per unit mass, nm (T), can be calculated using Equation (3):
where Cm is the mass concentration of illite NX in the suspension. The active site density per unit surface area, ns (T), can be further derived using Equation (4):
where S, the geometric surface area of illite NX, was assumed to be 6.54 m2/g [15,25].
ƒice (T) = Nice/Nt
K (T) = −ln (1 − ƒice (T))/V
nm (T) = K (T)/Cm
ns (T) = nm (T)/S
2.5. Distilled Water Experiments
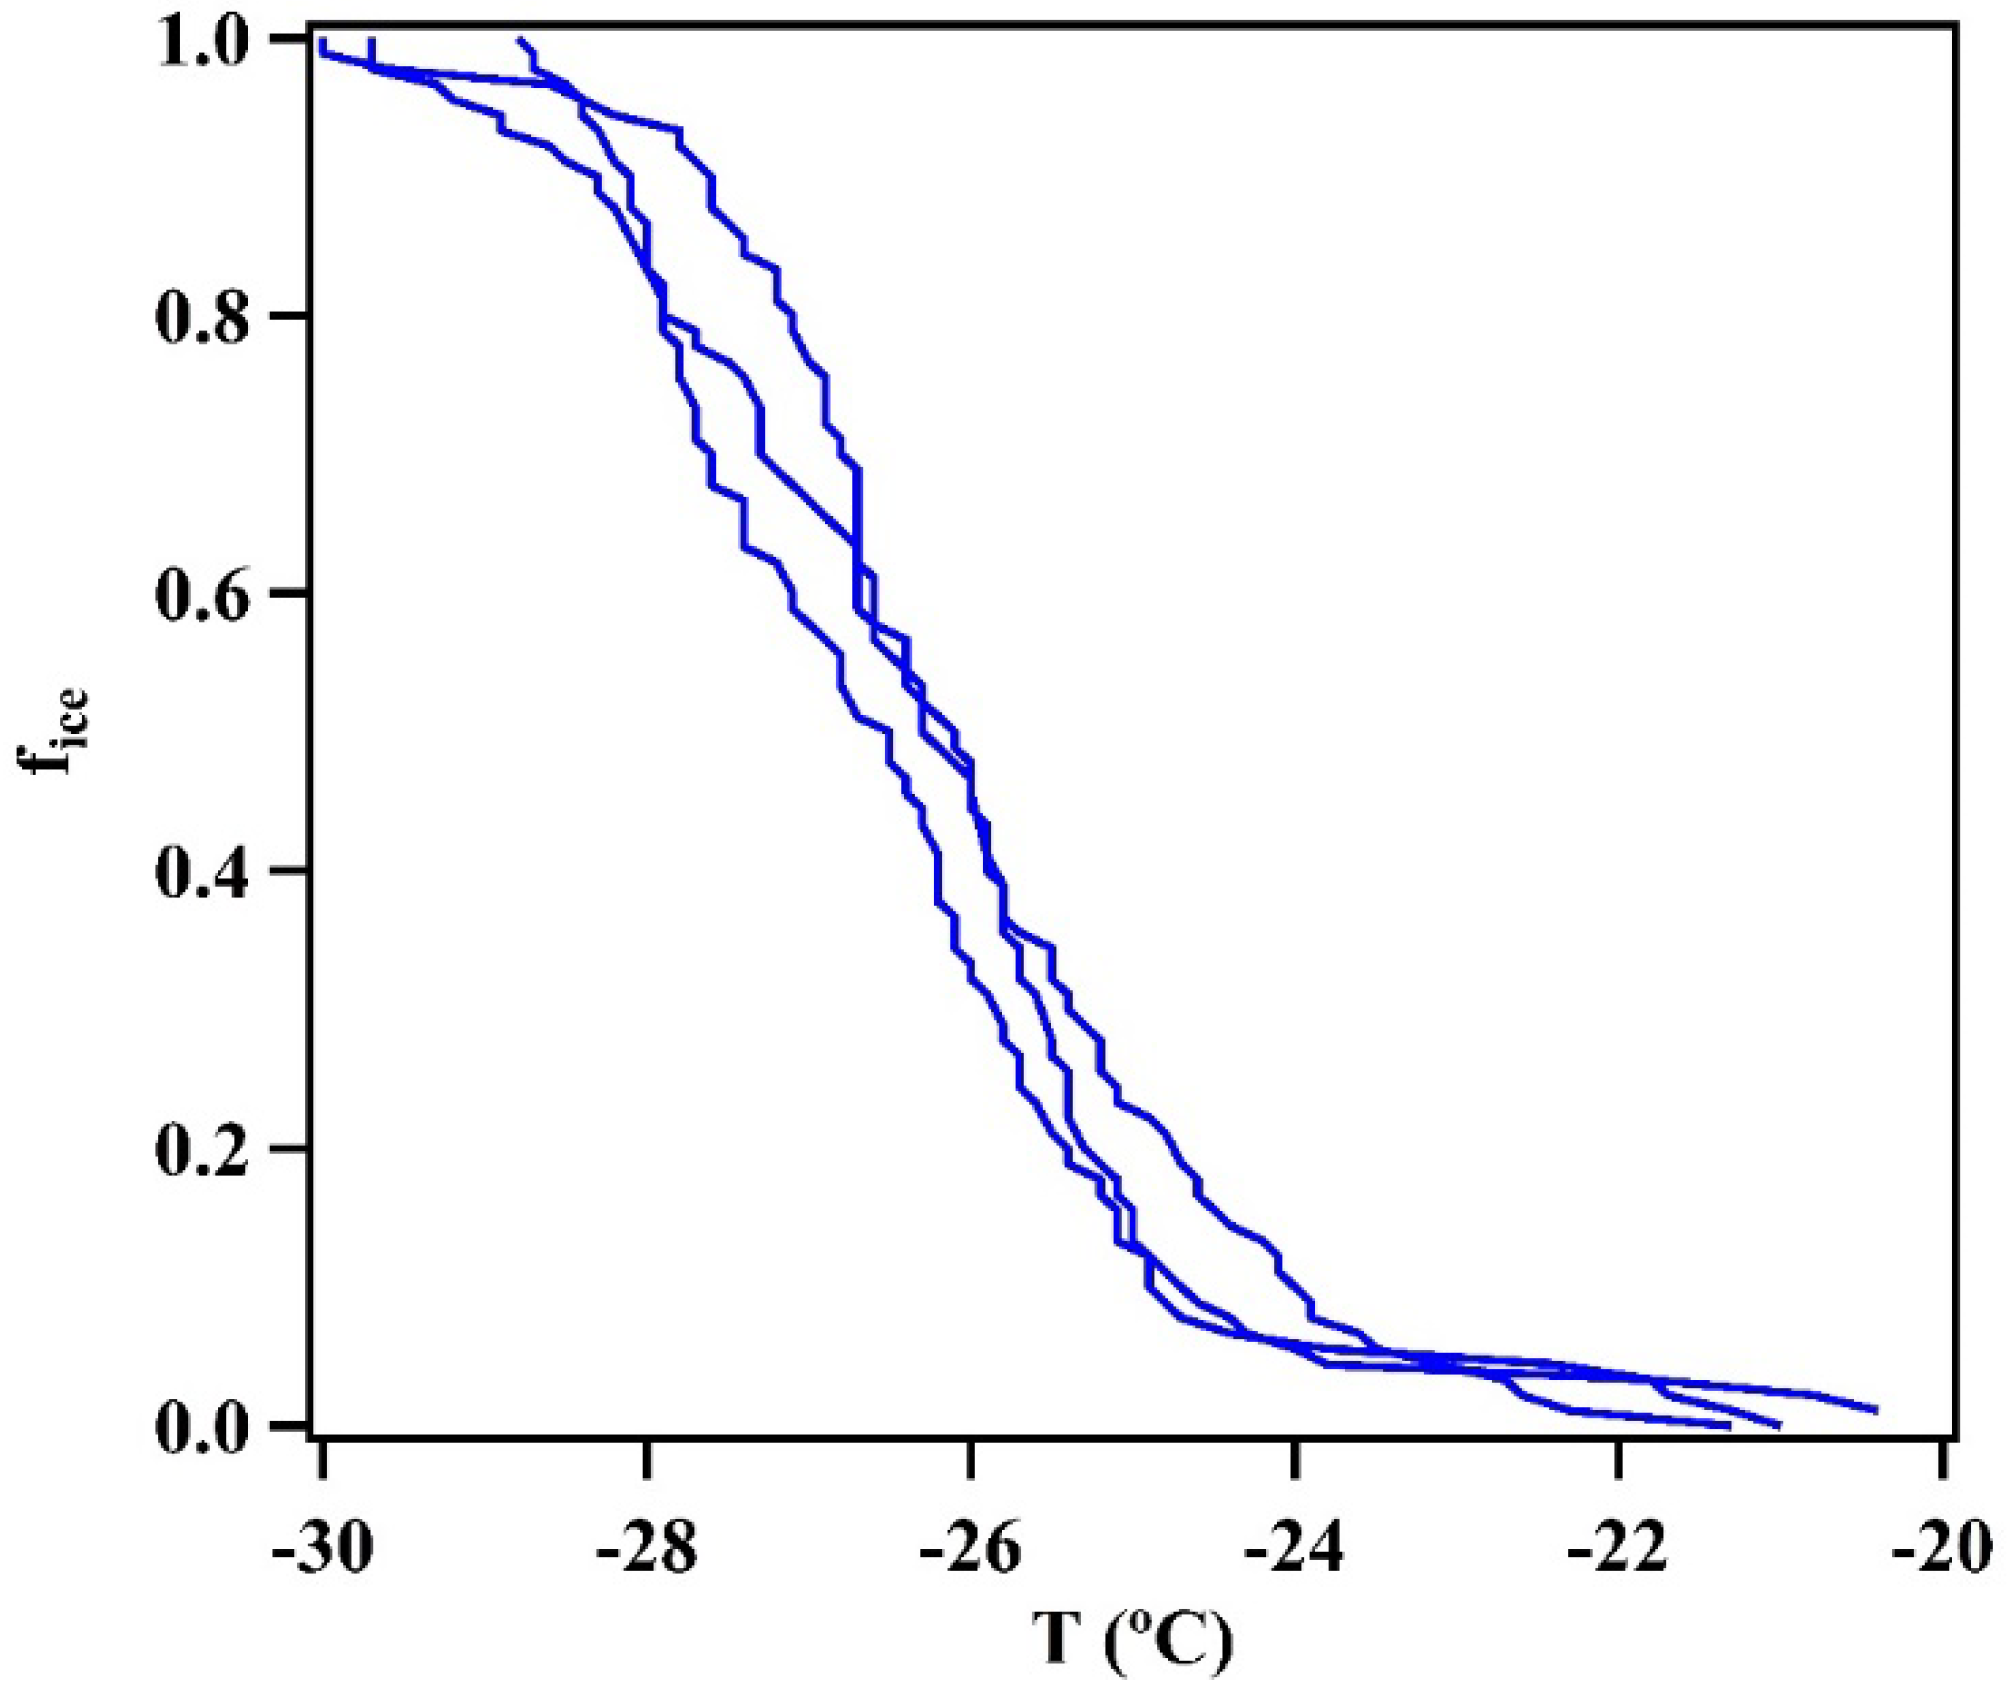
The distilled water was prepared by distilling deionized water (Milli-Q Advantage A10, Merk Millipore). The freezing experiments of distilled water droplets with 1 μL in volume were performed at a cooling rate of 1 °C/min. The results are displayed in Figure A2. The droplets started to freeze at around −20 °C, and all droplets froze at approximately −30 °C. This temperature range is higher than those detected by other cold-stage based instruments [35,36]. Such discrepancy might be caused by the different substrate materials or water impurities. The volume of droplets could affect the frozen temperature of pure water as well. Polen et al. [36] summarized the freezing of water in different conditions (i.e., supporting substrates, water sources, droplet sizes, etc.). Stopelli, et al. [18] reported the median freezing temperature of water at −15 °C with a droplet volume of 400 μL. This value was reported to be −34 °C by Wright and Petters [35], with a droplet diameter of 100–200 μm, and droplets were dispersed into squalene. The frozen temperature reported by Broadley, et al. [37] was even lower, with a droplet diameter of 10–20 μm, and the deposited droplets were covered by silicone oil. The oil environment enabled lower freezing temperatures; however, minimal assessment has been done to determine the effect of these oils on ice nucleation of droplets. Our results were comparable to other instruments in which hydrophobic glass slides were also used as supporting substrates: for example, Chen et al. [38] reported that 50% of the droplets were frozen at approximately −28 °C for 1 μL droplets, and Whale et al. [39] reported the freezing temperature for 50% of the droplets as −26 °C for 1 μL droplets. In general, our results indicate a reasonable water background by using the PKU-INA.
3. Results and Discussions
3.1. Temperature Calibration
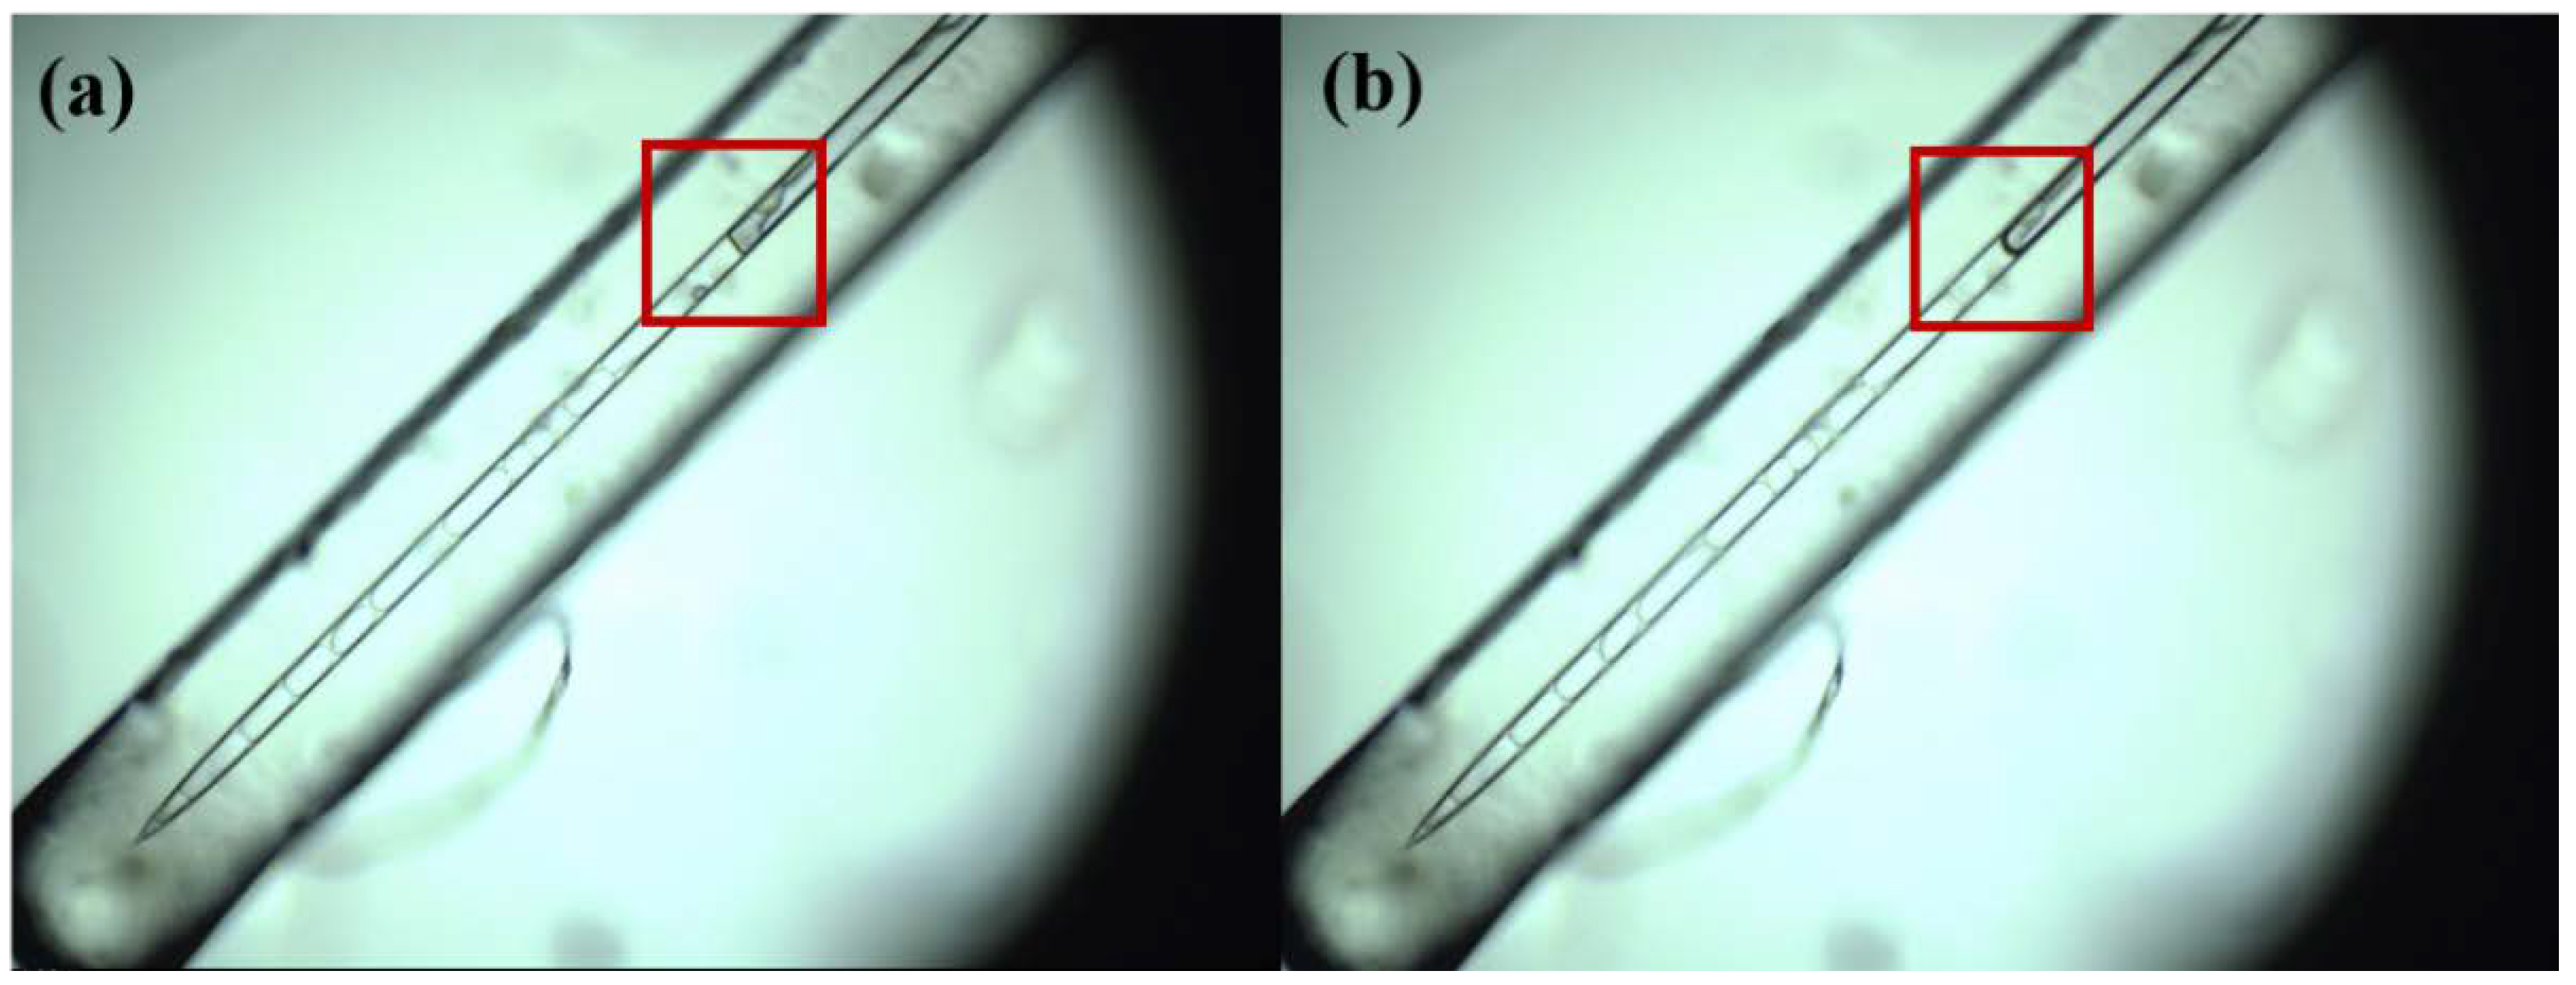
A capillary tube filled with ultrapure water was placed on the cold stage and was then cooled down to −40 °C so that water in the capillary tube was frozen. After that, the cold stage was heated up to −5 °C at a heating rate of 5 °C/min, and then, it was heated up to 1 °C at a heating rate of 0.1 °C/min. Images of the capillary tube before and after freezing are displayed in Figure 3, showing a significant change in the morphology when the ice was melted to water, i.e., the ice surface was rather flat (Figure 3a), while the liquid water surface was significantly curved (Figure 3b). The melting of ice was identified when a significant change in surface morphology (from flat to curved) was observed during the heating process. The ice melting temperature was determined to be −0.1 °C, and the temperatures reported in this work have been first corrected for the difference between measured and actual melting temperatures (−0.1 and 0 °C, respectively) of ice.
To calibrate the temperature discrepancy of the cold-stage result from different cooling rates, distilled water, tridecane, and undecane, with a volume of 0.5 μL, were pipetted onto the hydrophobic glass placed on the cold stage. In each experiment, 20 droplets were evenly distributed on the glass slide, frozen, and then heated at a given heating rate to measure the phase transition temperature. The transition could be identified from the change in the maximal gray value of images, as described in Section 2.1. In each experiment, the difference in measured temperatures for the 20 droplets was <0.1 °C, suggesting that the spatial heterogeneity in temperature on the glass slide was very small. Each single experiment was repeated three times, and the experimental phase transition temperature, Texp, was defined as the average value of transition temperatures measured in the three repeats.
Phase transition temperatures (Texp) of these three compounds at different heating rates (0.1–10 °C/min) were measured, and all the data are summarized in Table 1. Figure 4a plots Texp measured in our work versus those reported in the literature (Tlit) at a heating rate of 10 °C/min. A calibration curve was obtained by linear fit of Texp against Tlit, and the temperature after calibration, Tcal, could be then derived using the calibration curve. Please note that calibration curves vary with heating rates. As shown in Figure 4b, the difference in Tcal and Tlit (defined as Tcal − Tlit) at different temperatures was smaller than 0.4 °C, comparable to that (0.3 °C) reported by Budke and Koop [25]. Larger droplets were used in our work (0.5 μL versus 0.05 μL by Budke and Koop), probably leading to larger difference in measured and actual temperatures.
3.2. Immersion Freezing of Illite NX
Figure 5 shows the ƒice of distilled water and illite NX suspensions with different mass concentrations (from 10−6 to 1 mg/mL) as a function of temperature. All the droplets that contained illite NX particles were frozen between −28 and −10 °C. The freezing temperature decreased with increasing mass concentration of illite NX in the suspension, and the freezing behavior of suspensions with illite mass concentrations lower than 10−2 mg/mL was similar to that of distilled water.
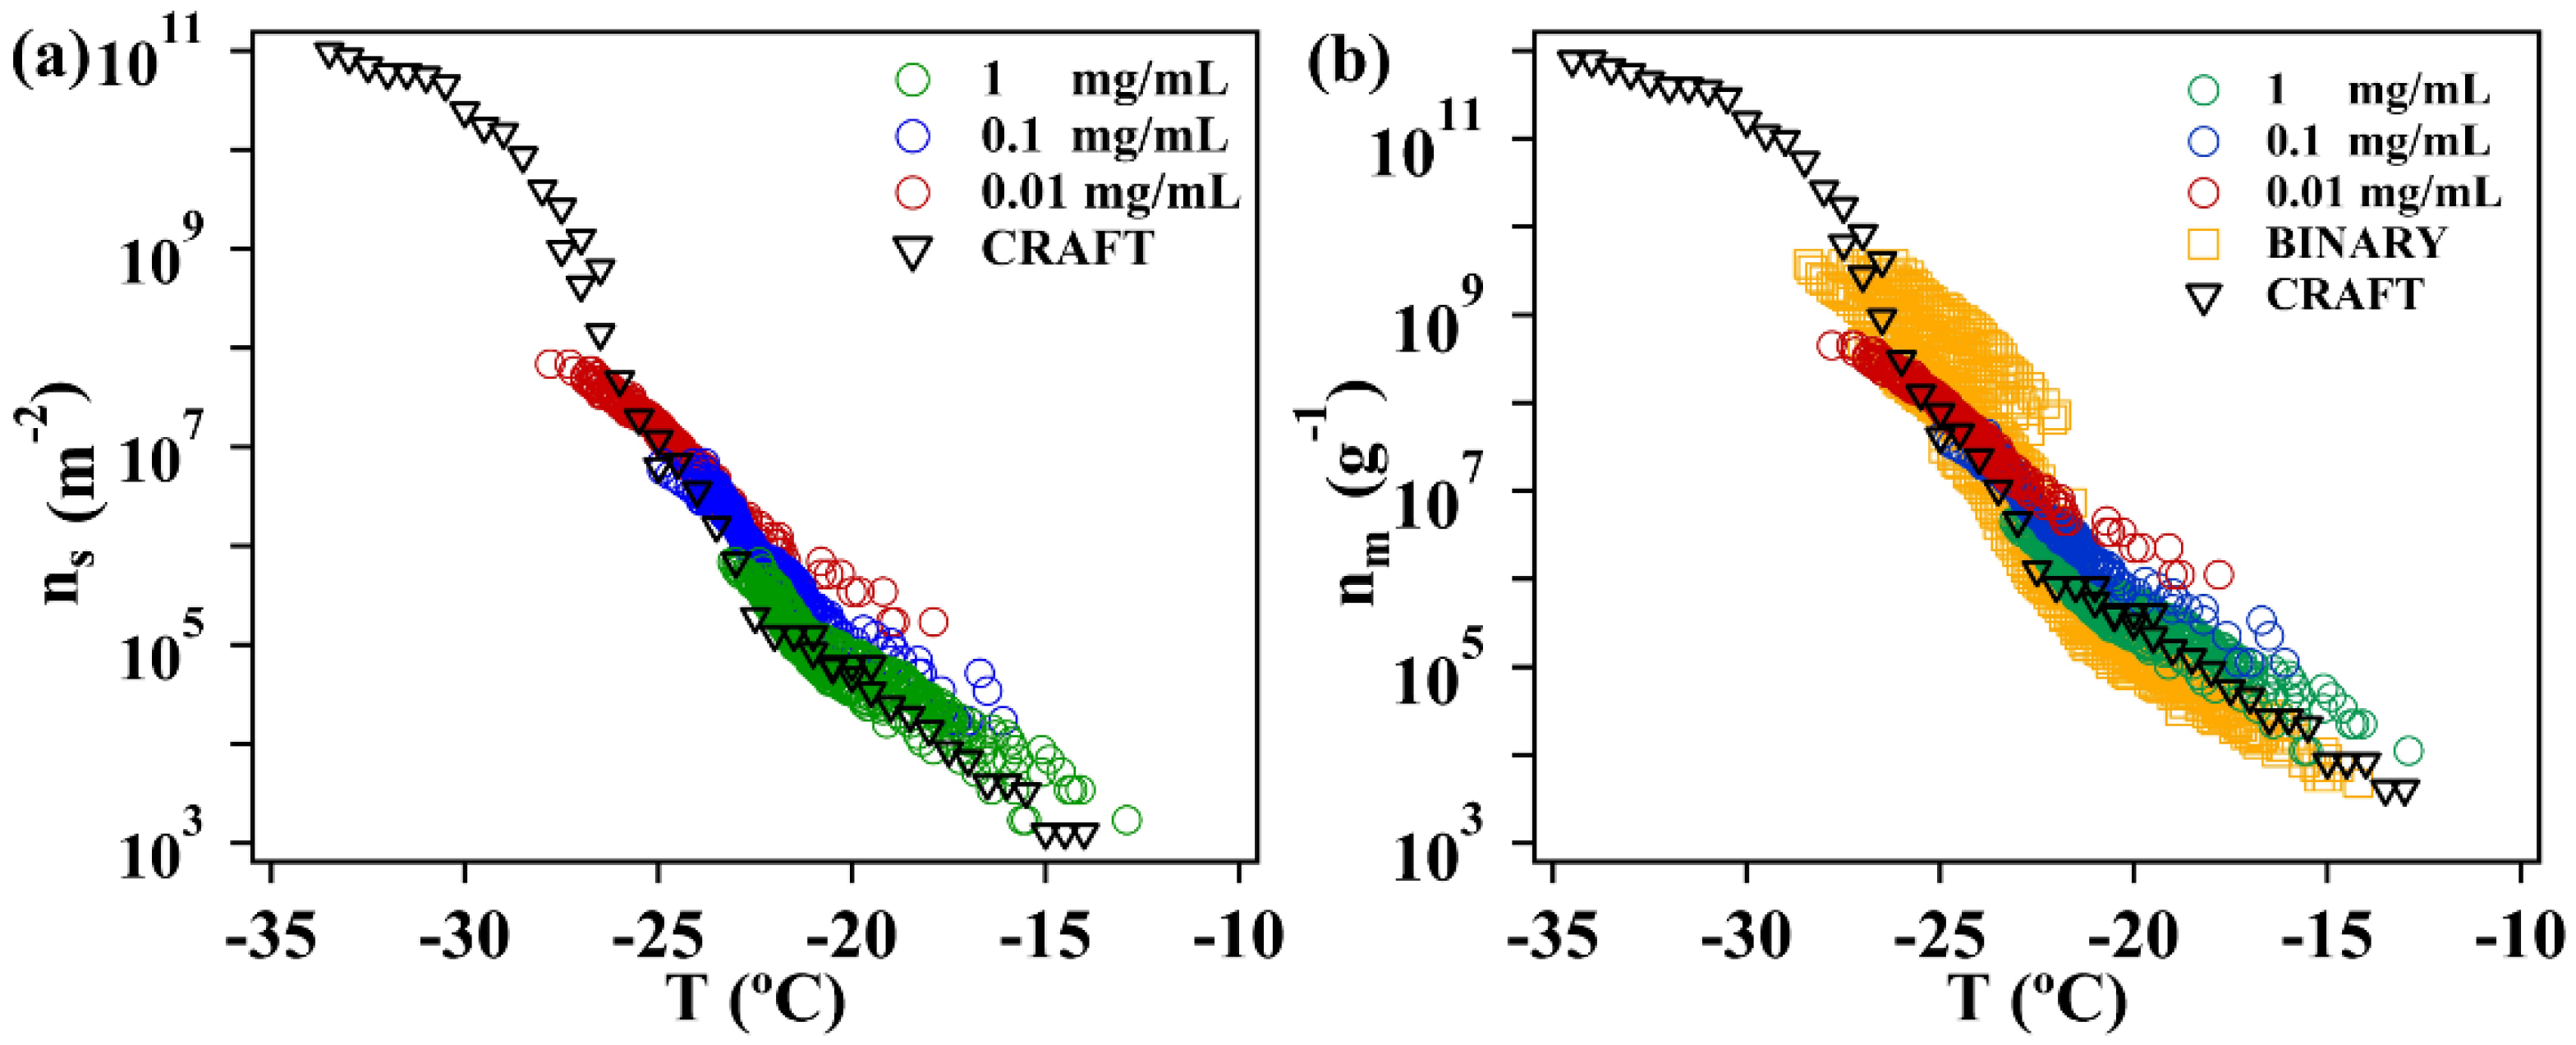
Figure 6a displays the ice active site densities per unit surface of illite NX, ns, which were derived using Equation (4), and the specific surface area of illite NX was assumed to be 6.54 m2/g [15,25]. Since the freezing behaviors of illite NX suspensions with mass concentrations of <10−4 mg/mL were not significantly different from that of distilled water, ns, they were not reported for these suspensions. The experimental results reported by Tobo [25], which are in good agreement with those measured by 15 other instruments that participated in the comparison campaign, are also plotted in Figure 6a. It can be observed from Figure 6a that for the temperature range covered in our work, ns measured using the PKU-INA varied from 1.70 × 10³ to 6.88 × 10⁷ m−2, showing good agreement with those measured using the CRAFT [25]; more specifically, the ratios of ns measured in our work compared to those determined by Tobo [25] at the same temperature were found to be in the range of 0.3–4.7; and for comparison, large discrepancies in ns values of illite NX were found when measured by 17 different instruments, up to three orders of magnitude [15]. Therefore, the results measured in our work are in good agreement with those reported by Tobo [25]. It should be pointed out that pure water droplets started to be frozen at temperatures between −22 and −20 °C for the PKU-INA but between −30 and −28 °C for the CRAFT, and this might be attributed to the fact that in these two instruments, different materials were used to support droplets (a thin Vaseline was used in the CRAFT, and a hydrophobic glass was used in the PKU-INA) [25].
We also calculated the ice active site densities per unit mass, nm, using Equation (3). As shown in Figure 6b, nm varied from 1.17 × 10⁴ to 4.50 × 10⁸ g−1. The results measured by the BINARY [24] and the CRAFT [25] are also displayed Figure 6b for comparison. It can be concluded from Figure 6b that our results agree with those measured using the BINARY and the CRAFT. To summarize, experimental evaluations presented in this section suggest that the newly developed PKU-INA in our work can reliably measure heterogeneous ice nucleation activities in the immersion freezing mode.
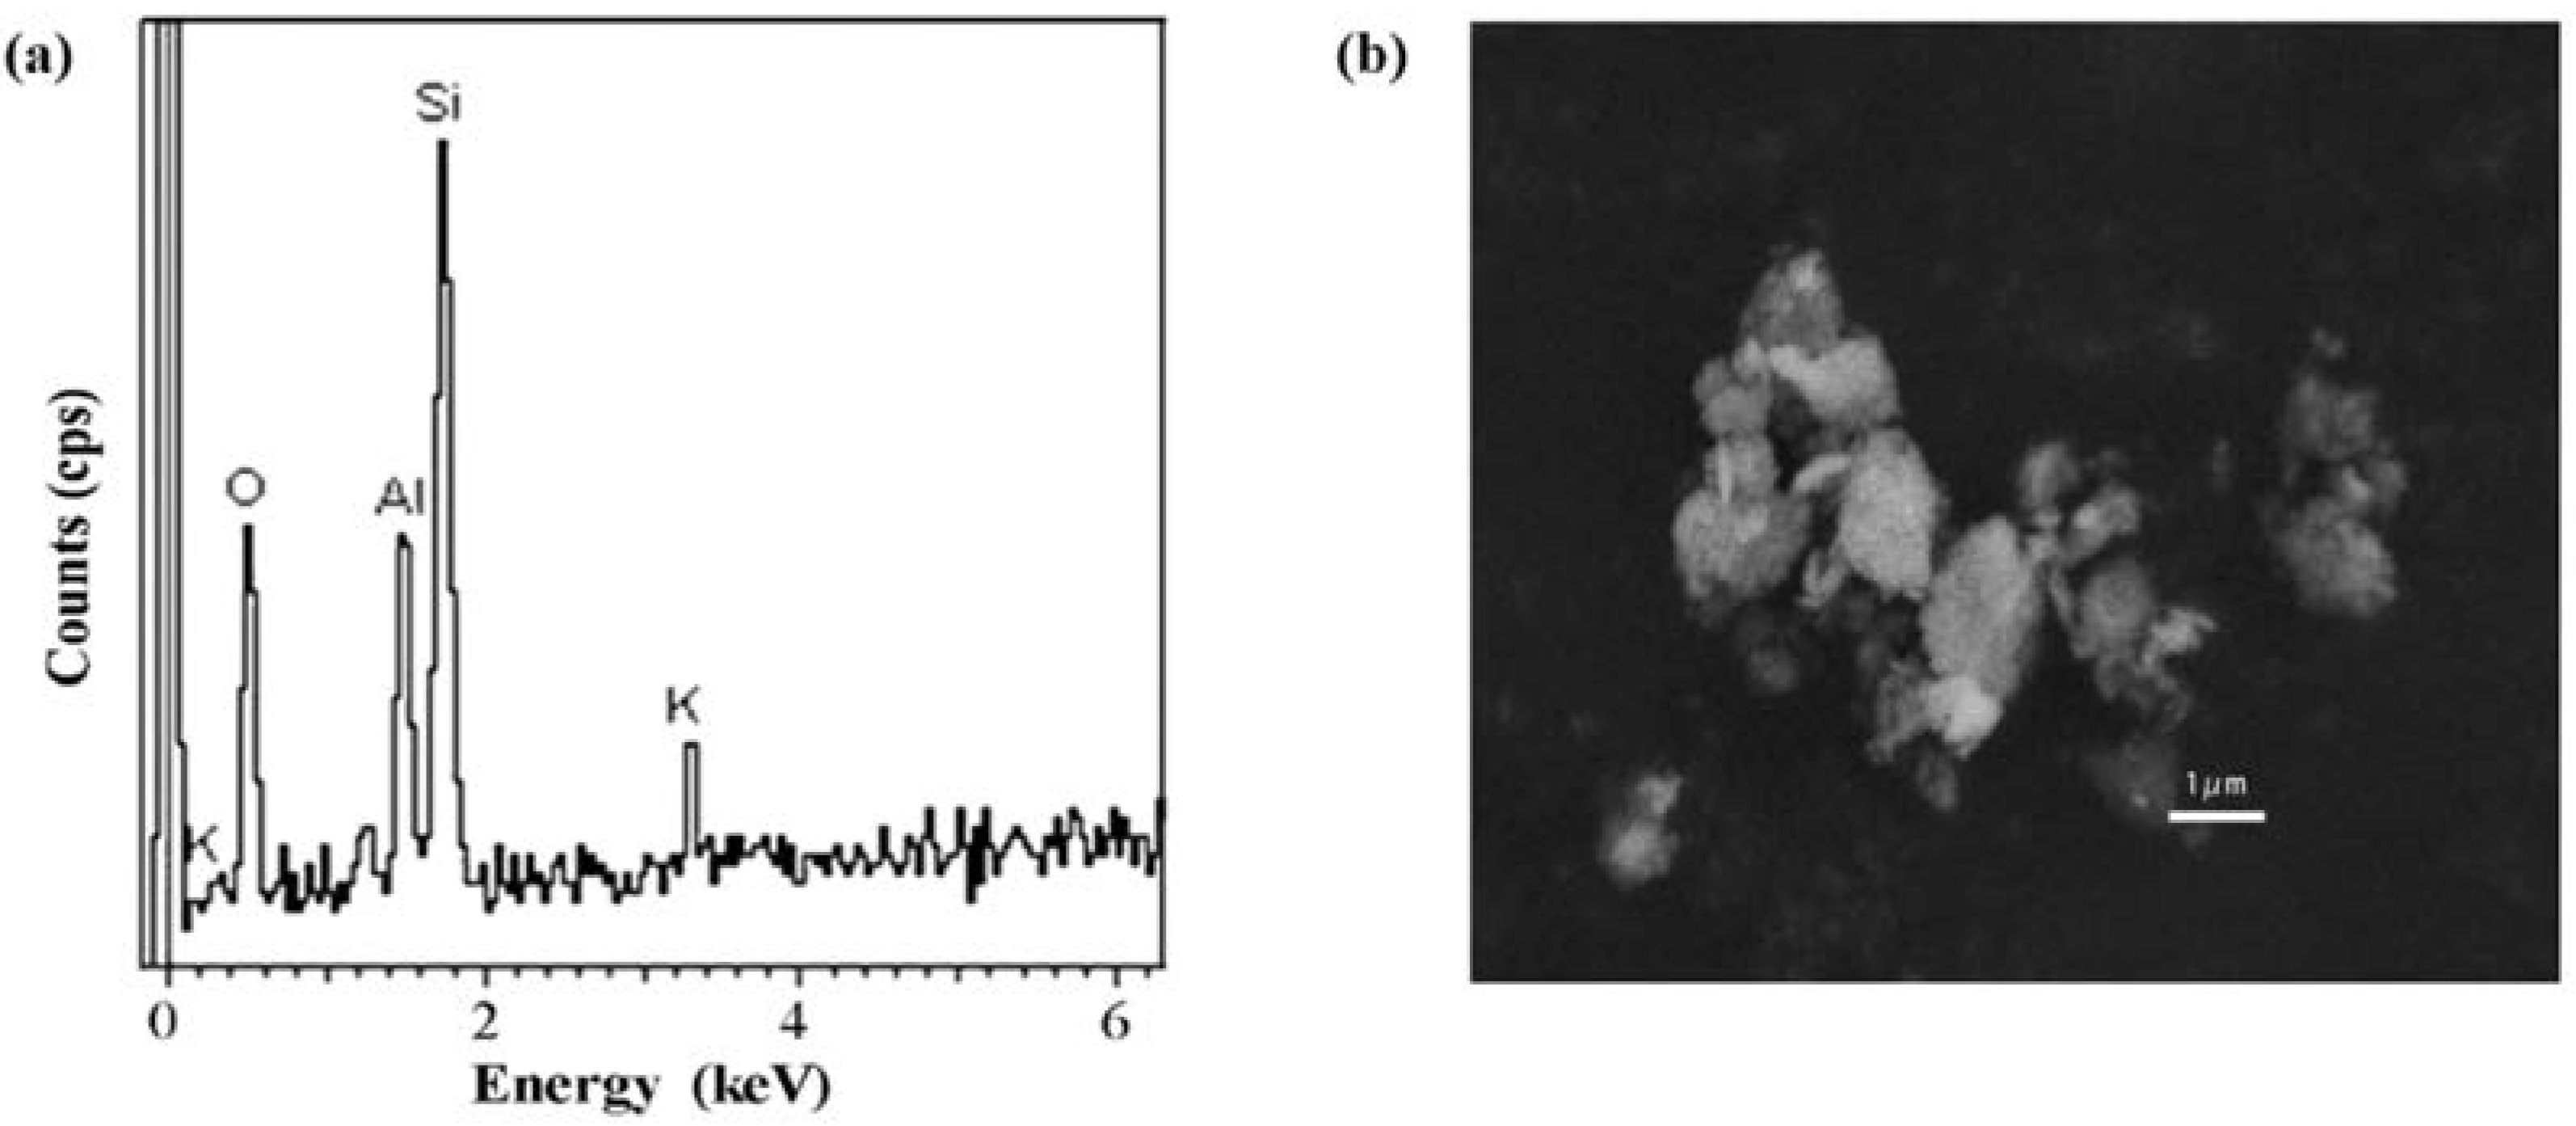
To check whether there were any modifications to illite NX properties during storage and transport [15,37], chemical and physical characterization were also done. The SSA of illite NX was determined to be 106.3 m2/g, which is similar to those (104.2 and 124.4 m2/g) reported by Broadley, et al. [37] and Hiranuma, et al. [15], respectively. EDX measurements suggested that the most abundant elements in illite NX are Al, Si, and O, which are the main elements of aluminosilicate [15] (summarized in Figure A3a). The SEM image, as displayed in Figure A3b, shows that the illite NX particles were agglomerates with diameters in the range of 1–2 μm, made up of many submicrometer-sized grains. These measurements indicated that the illite NX used in our study has similar chemical and physical properties of those used in the previous studies.
4. Conclusions
In this work, we developed a new instrument (PeKing University Ice Nucleation Array, PKU-INA) for measurements of ice nucleation activities of atmospheric particles in the immersion freezing mode for the temperature range of −30–0 °C. The instrument is based on a cold-stage coupled with a microscope and a CCD camera, enabling droplet images to be recorded in real time. A custom-made spacer was used to provide separated environments for each individual droplet, and up to 90 droplets could be investigated at the same time. Furthermore, automatic characterization of freezing temperature of each droplet has been achieved via analysis of the change in brightness of images using a Matlab program developed in this work.
We also carried out systematic characterization and performance evaluation of this new instrument. A careful temperature calibration protocol was developed by measuring the freezing temperatures of water, tridecane, and undecane at different cooling rates (0.1–10 °C/min), and after calibration, the uncertainties in measured temperatures did not exceed 0.4 °C. In addition, the freezing temperatures of droplets containing different mass concentrations of illite NX were investigated. The ice nucleation activities of illite NX determined in our work using the PKU-INA were found to be in good agreement with those reported by other instruments with similar principles, suggesting good performance of our instrument for the investigation of heterogeneous ice nucleation in the immersion freezing mode.
Author Contributions
Conceptualization, J.C. (Jie Chen) and Z.W.; Formal analysis, H.W.; Methodology, J.C. (Jie Chen); Software, X.P.; Validation, M.T., Y.Z., and J.C. (Jingchuan Chen); Writing–Review and Editing, J.C. (Jie Chen).
Funding
This research was funded by the National Natural Science Foundation of China, grant number [41475127 and 41571130021] and the Chinese Academy of Sciences international collaborative project, grant number [132744KYSB20160036].
Acknowledgments
We would like to particularly thank Heike Wex for providing illite NX samples, Yutaka Tobo for sharing the CRAFT data, and Cheng Zhang for carrying out BET measurements. Mingjin Tang also would like to thank the CAS Pioneer Hundred Talents program for providing a starting grant.
Conflicts of Interest
The authors declare no conflict of interest.
Appendix A
Figure A1.
Gray value changes of different droplets in different temperatures.

Figure A2.
The temperature freezing dependency of distilled water droplets of 1 μL.

The freezing experiments of distilled water droplets of 1 μL were performed at a cooling rate of 1 °C/min. The results are displayed in Figure A3.
Figure A3.
Typical energy dispersive X-ray (EDX) spectra (a) and SEM image (b) of illite NX particles used in this work.
Figure A3.
Typical energy dispersive X-ray (EDX) spectra (a) and SEM image (b) of illite NX particles used in this work.
References
- DeMott, P.J.; Prenni, A.J.; Liu, X.; Kreidenweis, S.M.; Petters, M.D.; Twohy, C.H.; Richardson, M.S.; Eidhammer, T.; Rogers, D.C. Predicting global atmospheric ice nuclei distributions and their impacts on climate. Proc. Natl. Acad. Sci. USA 2010, 107, 11217–11222. [Google Scholar] [CrossRef] [PubMed] [Green Version]
- Wilson, T.W.; Ladino, L.A.; Alpert, P.A.; Breckels, M.N.; Brooks, I.M.; Browse, J.; Burrows, S.M.; Carslaw, K.S.; Huffman, J.A.; Judd, C.; et al. A marine biogenic source of atmospheric ice-nucleating particles. Nature 2015, 525, 234–238. [Google Scholar] [CrossRef] [PubMed] [Green Version]
- Kanji, Z.A.; Ladino, L.A.; Wex, H.; Boose, Y.; Burkert-Kohn, M.; Cziczo, D.J.; Krämer, M. Chapter 1: Overview of ice nucleating particles. Am. Meteorol. Soc. 2017, 58, 1–33. [Google Scholar]
- Pruppacher, H.R.; Klett, J.D.; Wang, P.K. Microphysics of clouds and precipitation. Aerosol Sci. Technol. 1998, 28, 381–382. [Google Scholar] [CrossRef]
- Cantrell, W.; Heymsfield, A. Production of ice in tropospheric clouds: A review. Bull. Am. Meteorol. Soc. 2005, 86, 795–808. [Google Scholar] [CrossRef]
- Vali, G.; DeMott, P.J.; Möhler, O.; Whale, T.F. Technical note: A proposal for ice nucleation terminology. Atmos. Chem. Phys. 2015, 15, 10263–10270. [Google Scholar] [CrossRef]
- Hoose, C.; Möhler, O. Heterogeneous ice nucleation on atmospheric aerosols: A review of results from laboratory experiments. Atmos. Chem. Phys. 2012, 12, 9817–9854. [Google Scholar] [CrossRef]
- Tang, M.; Cziczo, D.J.; Grassian, V.H. Interactions of water with mineral dust aerosol: Water adsorption, hygroscopicity, cloud condensation, and ice nucleation. Chem. Rev. 2016, 116, 4205–4259. [Google Scholar] [CrossRef] [PubMed]
- Murray, B.J.; O’Sullivan, D.; Atkinson, J.D.; Webb, M.E. Ice nucleation by particles immersed in supercooled cloud droplets. Chem. Soc. Rev. 2012, 41, 6519–6554. [Google Scholar] [CrossRef] [PubMed]
- Westbrook, C.D.; Illingworth, A.J. The formation of ice in a long-lived supercooled layer cloud. The formation of ice in a long-lived supercooled layer cloud. Q. J. R. Meterol. Soc. 2013, 139, 2209–2221. [Google Scholar] [CrossRef]
- Hiranuma, N.; Hoffmann, N.; Steinke, I.; Kiselev, A.; Dreyer, A.; Zhang, K.; Kulkarni, G.; Koop, T.; Möhler, O. Influence of surface morphology on the heterogeneous ice nucleation efficiency of hematite articles. Atmos. Chem. Phys. 2014, 14, 2315–2324. [Google Scholar] [CrossRef]
- Knopf, D.A.; Alpert, P.A.; Wang, B.; Aller, J.Y. Stimulation of ice nucleation by marine diatoms. Nat. Geosci. 2010, 4, 88. [Google Scholar] [CrossRef]
- Wang, B.; Knopf, D.A. Heterogeneous ice nucleation on particles composed of humic-like substances impacted by O3. J. Geophysi. Res. 2011, 116. [Google Scholar] [CrossRef]
- Hiranuma, N.; Brooks, S.D.; Moffet, R.C.; Glen, A.; Laskin, A.; Gilles, M.K.; Liu, P.; Macdonald, A.M.; Strapp, J.W.; McFarquhar, G.M. Chemical characterization of individual particles and residuals of cloud droplets and ice crystals collected on board research aircraft in the isdac 2008 study. J. Geophysi. Res. 2013, 118, 6564–6579. [Google Scholar] [CrossRef]
- Hiranuma, N.; Augustin-Bauditz, S.; Bingemer, H.; Budke, C.; Curtius, J.; Danielczok, A.; Diehl, K.; Dreischmeier, K.; Ebert, M.; Frank, F.; et al. A comprehensive laboratory study on the immersion freezing behavior of illite nx particles: A comparison of 17 ice nucleation measurement techniques. Atmos. Chem. Phys. 2015, 15, 2489–2518. [Google Scholar] [CrossRef]
- Wex, H.; Augustin-Bauditz, S.; Boose, Y.; Budke, C.; Curtius, J.; Diehl, K.; Dreyer, A.; Frank, F.; Hartmann, S.; Hiranuma, N.; et al. Intercomparing different devices for the investigation of ice nucleating particles using snomax® as test substance. Atmos. Chem. Phys. 2015, 15, 1463–1485. [Google Scholar] [CrossRef]
- Stopelli, E.; Conen, F.; Zimmermann, L.; Alewell, C.; Morris, C.E. Freezing nucleation apparatus puts new slant on study of biological ice nucleators in precipitation. Atmos. Meas. Tech. 2014, 7, 129–134. [Google Scholar] [CrossRef] [Green Version]
- Rogers, D.C. Development of a continuous flow thermal gradient diffusion chamber for ice nucleation studies. Atmos. Res. 1988, 22, 149–181. [Google Scholar] [CrossRef]
- Stetzer, O.; Baschek, B.; Lüönd, F.; Lohmann, U. The zurich ice nucleation chamber (zinc)-a new instrument to investigate atmospheric ice formation. Aerosol Sci. Technol. 2008, 42, 64–74. [Google Scholar] [CrossRef]
- Chou, C.; Stetzer, O.; Weingartner, E.; Jurányi, Z.; Kanji, Z.A.; Lohmann, U. Ice nuclei properties within a saharan dust event at the jungfraujoch in the swiss alps. Atmos. Chem. Phys. 2011, 11, 4725–4738. [Google Scholar] [CrossRef]
- Garimella, S.; Kristensen, T.B.; Ignatius, K.; Welti, A.; Voigtlander, J.; Kulkarni, G.R.; Sagan, F.; Kok, G.L.; Dorsey, J.; Nichman, L. The spectrometer for ice nuclei (spin): An instrument to investigate ice nucleation. Atmos. Meas. Tech. 2016, 9, 2781–2795. [Google Scholar] [CrossRef]
- Bigg, E.K. The supercooling of water. Proc. Phys. Soc. 1953, 66, 688. [Google Scholar] [CrossRef]
- Conen, F.; Henne, S.; Morris, C.E.; Alewell, C. Atmospheric ice nucleators active ≥12 °C can be quantified on pm10 filters. Atmos. Meas. Tech. 2012, 5, 321–327. [Google Scholar] [CrossRef] [Green Version]
- Budke, C.; Koop, T. Binary: An optical freezing array for assessing temperature and time dependence of heterogeneous ice nucleation. Atmos. Meas. Tech. 2015, 8, 689–703. [Google Scholar] [CrossRef]
- Tobo, Y. An improved approach for measuring immersion freezing in large droplets over a wide temperature range. Sci. Rep. 2016, 6, 32930. [Google Scholar] [CrossRef] [PubMed] [Green Version]
- Murray, B.J.; Broadley, S.L.; Wilson, T.W.; Bull, S.J.; Wills, R.H.; Christenson, H.K.; Murray, E.J. Kinetics of the homogeneous freezing of water. Phys. Chem. Chem. Phys. 2010, 12, 10380–10387. [Google Scholar] [CrossRef] [PubMed]
- Reicher, N.; Segev, L.; Rudich, Y. The weizmann supercooled droplets observation on a microarray (wisdom) and application for ambient dust. Atmos. Meas. Tech. 2018, 11, 233–248. [Google Scholar] [CrossRef]
- DeMott, P.J.; Möhler, O.; Stetzer, O.; Vali, G.; Levin, Z.; Petters, M.D.; Murakami, M.; Leisner, T.; Bundke, U.; Klein, H.; et al. Resurgence in ice nuclei measurement research. Bull. Am. Meteorol. Soc. 2011, 92, 1623–1635. [Google Scholar] [CrossRef]
- Polen, M.; Lawlis, E.; Sullivan, R.C. The unstable ice nucleation properties of snomax® bacterial particles. J. Geophysi. Res. 2016, 121. [Google Scholar] [CrossRef]
- Jung, S.; Tiwari, M.K.; Poulikakos, D. Frost halos from supercooled water droplets. Proc. Natl. Acad. Sci. USA 2012, 109, 16073–16078. [Google Scholar] [CrossRef] [PubMed] [Green Version]
- Sarge, S.M.; Höhne, G.W.H.; Cammenga, H.K.; Eysel, W.; Gmelin, E. Temperature, heat and heat flow rate calibration of scanning calorimeters in the cooling mode. Thermochim. Acta. 2000, 361, 1–20. [Google Scholar] [CrossRef]
- Gatta, G.D.; Richardson, M.J.; Sarge, S.M.; Stolen, S. Standards, calibration, and guidelines in microcalorimetry. Part 2. Calibration standards for differential calorimetry. Pure Appl. Chem. 2006, 78, 1455–1476. [Google Scholar]
- Mondieig, D.; Rajabalee, F.; Metivaud, V.; Oonk, H.A.J.; Cuevas-Diarte, M. N-alkane binary molecular alloys. Chem. Mater. 2004, 16, 786–798. [Google Scholar] [CrossRef]
- Messerly, J.F.; Guthrie, G.B.; Todd, S.S.; Finke, H.L. Low-temperature thermal data for pentane, n-heptadecane, and n-octadecane. Revised thermodynamic functions for the n-alkanes, c5-c18. J. Chem. Eng. Data 1967, 12, 338–346. [Google Scholar] [CrossRef]
- Wright, T.P.; Petters, M.D. The role of time in heterogeneous freezing nucleation. J. Geophys. Res. 2013, 118, 3731–3743. [Google Scholar] [CrossRef] [Green Version]
- Polen, M.; Brubaker, T.; Somers, J.; Sullivan, R.C. Cleaning up our water: Reducing interferences from non-homogeneous freezing of pure water in droplet freezing assays of ice nucleating particles. Atmos. Meas. Tech. Discuss. 2018. in review. [Google Scholar] [CrossRef]
- Broadley, S.L.; Murray, B.J.; Herbert, R.J.; Atkinson, J.D.; Dobbie, S.; Malkin, T.L.; Condliffe, E.; Neve, L. Immersion mode heterogeneous ice nucleation by an illite rich powder representative of atmospheric mineral dust. Atmos. Chem. Phys. 2012, 12, 287–307. [Google Scholar] [CrossRef] [Green Version]
- Chen, J.; Wu, Z.; Augustin-Bauditz, S.; Grawe, S.; Hartmann, M.; Pei, X.; Liu, Z.; Ji, D.; Wex, H. Ice-nucleating particle concentrations unaffected by urban air pollution in beijing, china. Atmos. Chem. Phys. 2018, 18, 3523–3539. [Google Scholar] [CrossRef]
- Whale, T.F.; Murray, B.J.; O’Sullivan, D.; Wilson, T.W.; Umo, N.; Baustian, K.J.; Atkinson, J.D.; Workneh, D.; Morris, G. A technique for quantifying heterogeneous ice nucleation in microlitre supercooled water droplets. Atmos. Meas. Tech. 2015, 8, 2437–2447. [Google Scholar] [CrossRef] [Green Version]
Figure 1.
Schematic diagram of the PeKing University Ice Nucleation Array (PKU-INA). (1) cold-stage; (2) spacer; (3) glass slides; (4) ring light emitting diode (LED) light; (5) lens; (6) charge-coupled (CCD) camera; (7) circulating cooling water; (8) inlet for the high-purity nitrogen flow; (9) outlet for the high-purity nitrogen flow.

Figure 2.
The gray value of a typical water droplet as a function of temperature during a cooling process.
Figure 2.
The gray value of a typical water droplet as a function of temperature during a cooling process.

Figure 3.
Images of a capillary tube filled with ultrapure water placed on the cold stage. (a) Water in the capillary tube was frozen to ice; (b) water in the capillary tube was melted to liquid.
Figure 3.
Images of a capillary tube filled with ultrapure water placed on the cold stage. (a) Water in the capillary tube was frozen to ice; (b) water in the capillary tube was melted to liquid.

Figure 4.
Temperature calibration process (tridecane, undecane, distilled water). (a) The experimental transition temperature (Texp) plotted with literature phase transition temperatures (Tlit) with a heating rate of 10 °C/min; (b) remaining temperature uncertainties between temperature after calibration Tcal − Tlit.
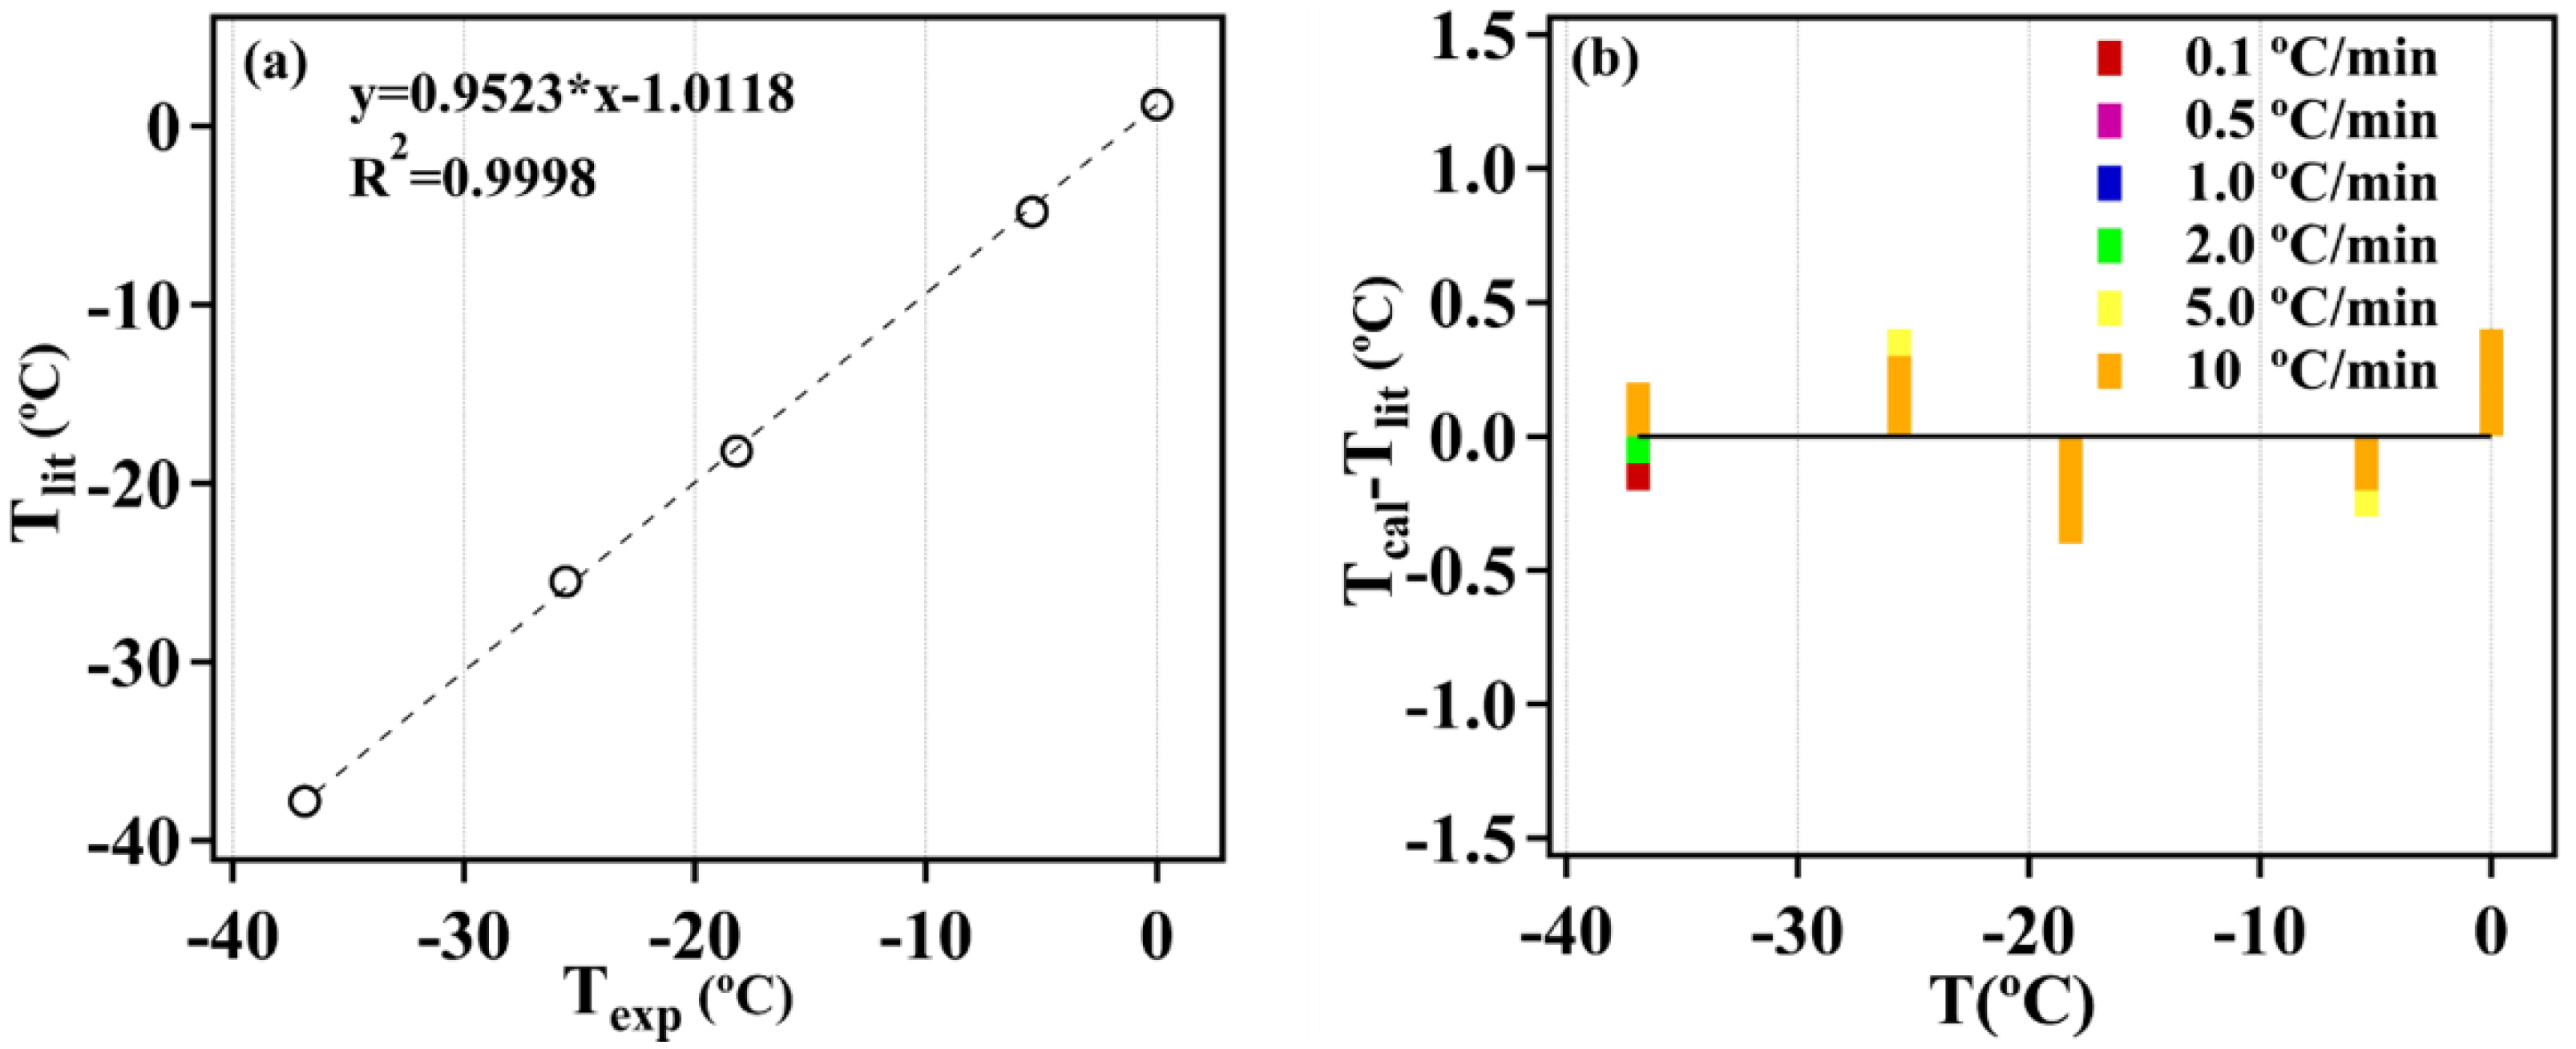
Figure 5.
The frozen fraction (ƒice) of distilled water (orange curve) and illite NX suspensions with different mass concentrations (from 1 × 10⁻⁴ to 1 mg/mL), as measured in this work using the PKU-INA.
Figure 5.
The frozen fraction (ƒice) of distilled water (orange curve) and illite NX suspensions with different mass concentrations (from 1 × 10⁻⁴ to 1 mg/mL), as measured in this work using the PKU-INA.
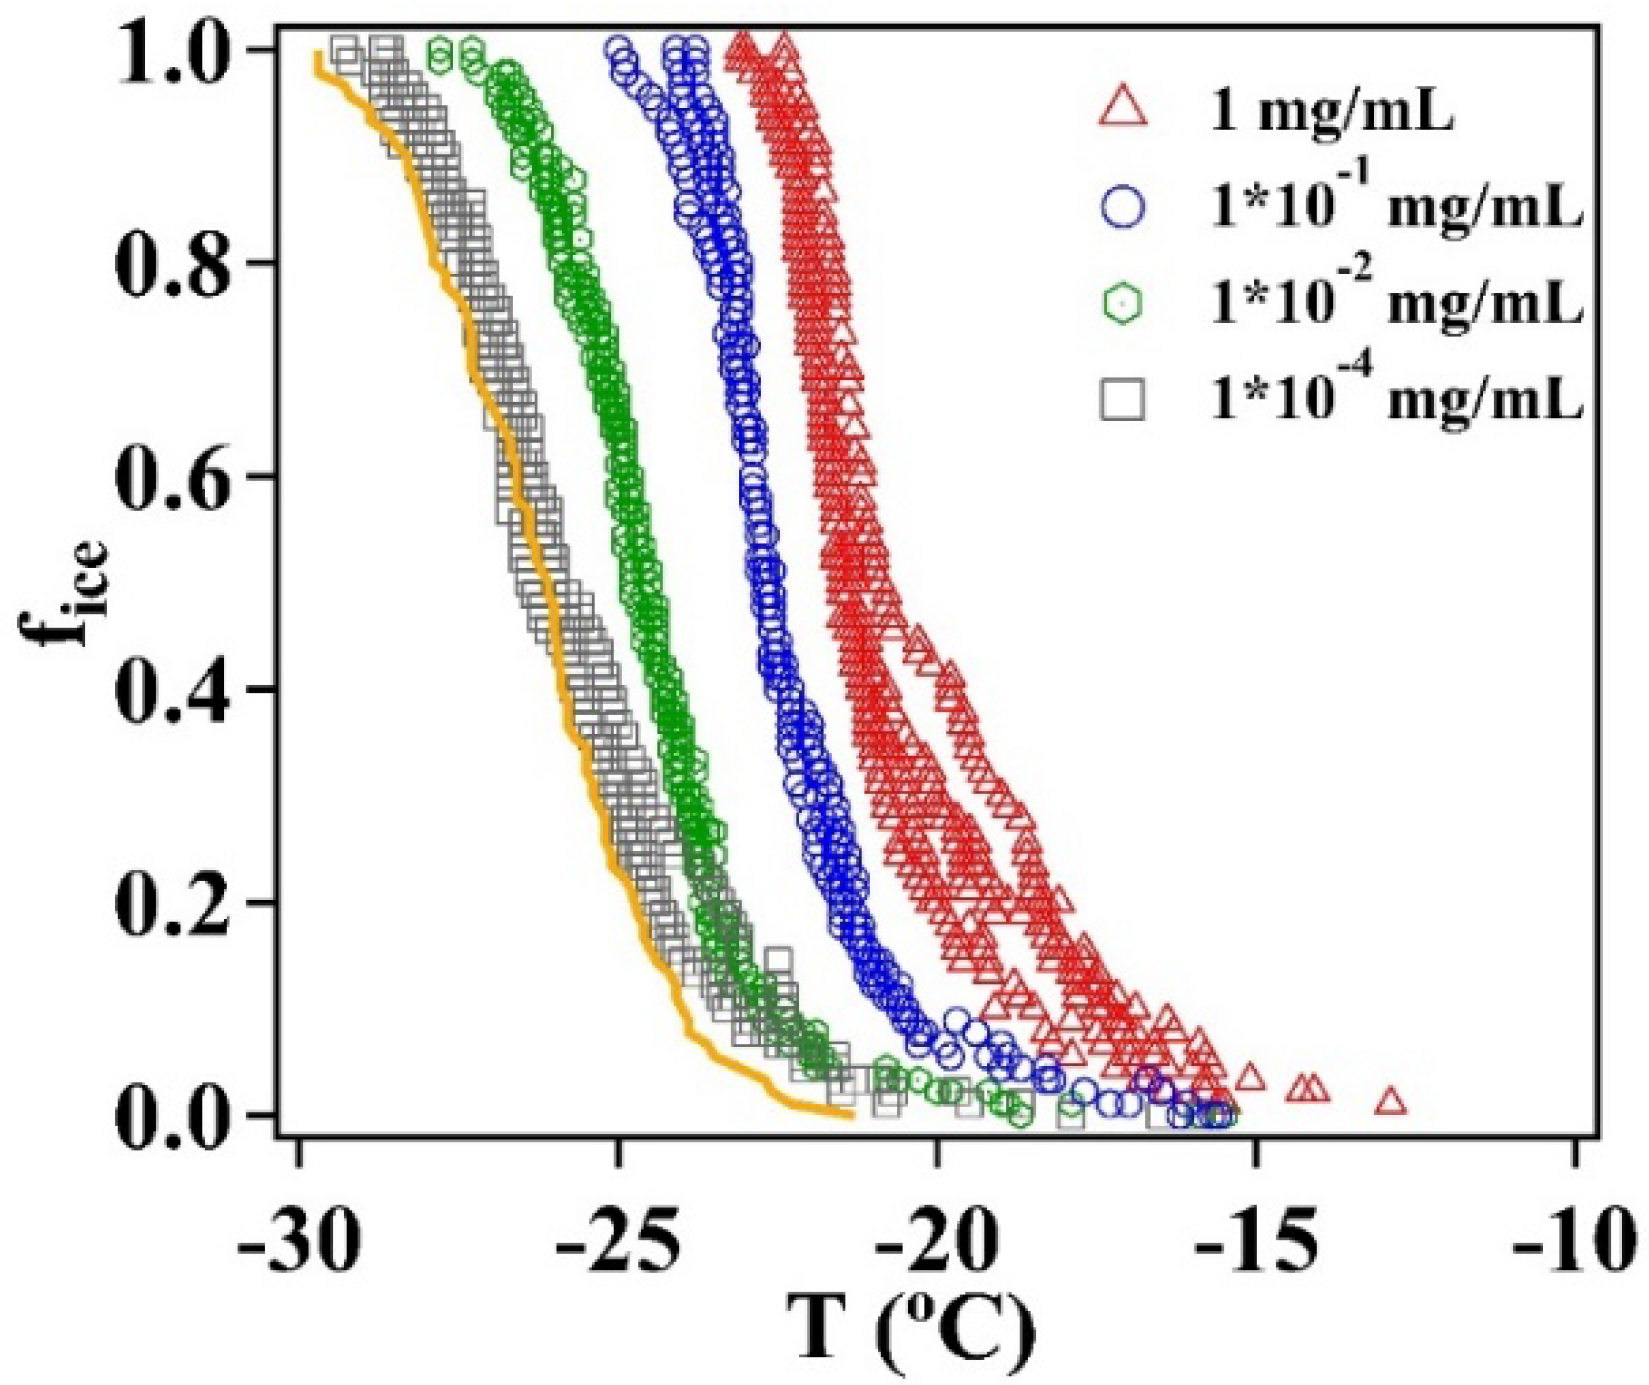
Figure 6.
(a) Comparison of the ice active density per unit surface (ns) of illite NX determined in our work using the PKU-INA (circles) to those determined using the Cryogenic Refrigerator Applied to Freezing Test (CRAFT) (triangles). (b) Comparison of the ice active density per unit mass (nm) of illite NX determined in our work using the PKU-INA (circles) with those determined using CRAFT (triangles) and the Bielefeld Ice Nucleation ARraY (BINARY) (squares).

Table 1.
Literature (Tlit) phase transition point and experimentally determined phase transition temperatures (Texp) at different heating rates as shown in Figure 4a.
Table 1.
Literature (Tlit) phase transition point and experimentally determined phase transition temperatures (Texp) at different heating rates as shown in Figure 4a.
| Heating Rate (°C/min) | 0.1 | 0.5 | 1 | 2 | 5 | 10 | |
|---|---|---|---|---|---|---|---|
| T (°C) | Tlit | Texp | Texp | Texp | Texp | Texp | Texp |
| Water | 0 | 0.9 | 1.2 | 1.5 | 1.7 | 2.3 | 2.7 |
| Tridecane (sl) | −5.4 | −5 | −4.8 | −4.7 | −4.5 | −4.2 | −3.7 |
| Tridecane (ss) | −18.2 | −18.4 | −18.3 | −18.2 | −18.1 | −17.9 | −17.5 |
| Undecane (sl) | −25.6 | −25.6 | −25.5 | −25.4 | −25.1 | −24.9 | −24.6 |
| Undecane (ss) | −36.9 | −38 | −37.8 | −37.7 | −37.6 | −37.3 | −36.8 |
© 2018 by the authors. Licensee MDPI, Basel, Switzerland. This article is an open access article distributed under the terms and conditions of the Creative Commons Attribution (CC BY) license (http://creativecommons.org/licenses/by/4.0/).
Share and Cite
MDPI and ACS Style
Chen, J.; Pei, X.; Wang, H.; Chen, J.; Zhu, Y.; Tang, M.; Wu, Z. Development, Characterization, and Validation of a Cold Stage-Based Ice Nucleation Array (PKU-INA). Atmosphere 2018, 9, 357. https://doi.org/10.3390/atmos9090357
AMA Style
Chen J, Pei X, Wang H, Chen J, Zhu Y, Tang M, Wu Z. Development, Characterization, and Validation of a Cold Stage-Based Ice Nucleation Array (PKU-INA). Atmosphere. 2018; 9(9):357. https://doi.org/10.3390/atmos9090357
Chicago/Turabian StyleChen, Jie, Xiangyu Pei, Hong Wang, Jingchuan Chen, Yishu Zhu, Mingjin Tang, and Zhijun Wu. 2018. "Development, Characterization, and Validation of a Cold Stage-Based Ice Nucleation Array (PKU-INA)" Atmosphere 9, no. 9: 357. https://doi.org/10.3390/atmos9090357
Note that from the first issue of 2016, this journal uses article numbers instead of page numbers. See further details here.