Development of an Urban High-Resolution Air Temperature Forecast System for Local Weather Information Services Based on Statistical Downscaling


Abstract
:1. Introduction
2. Data and Method
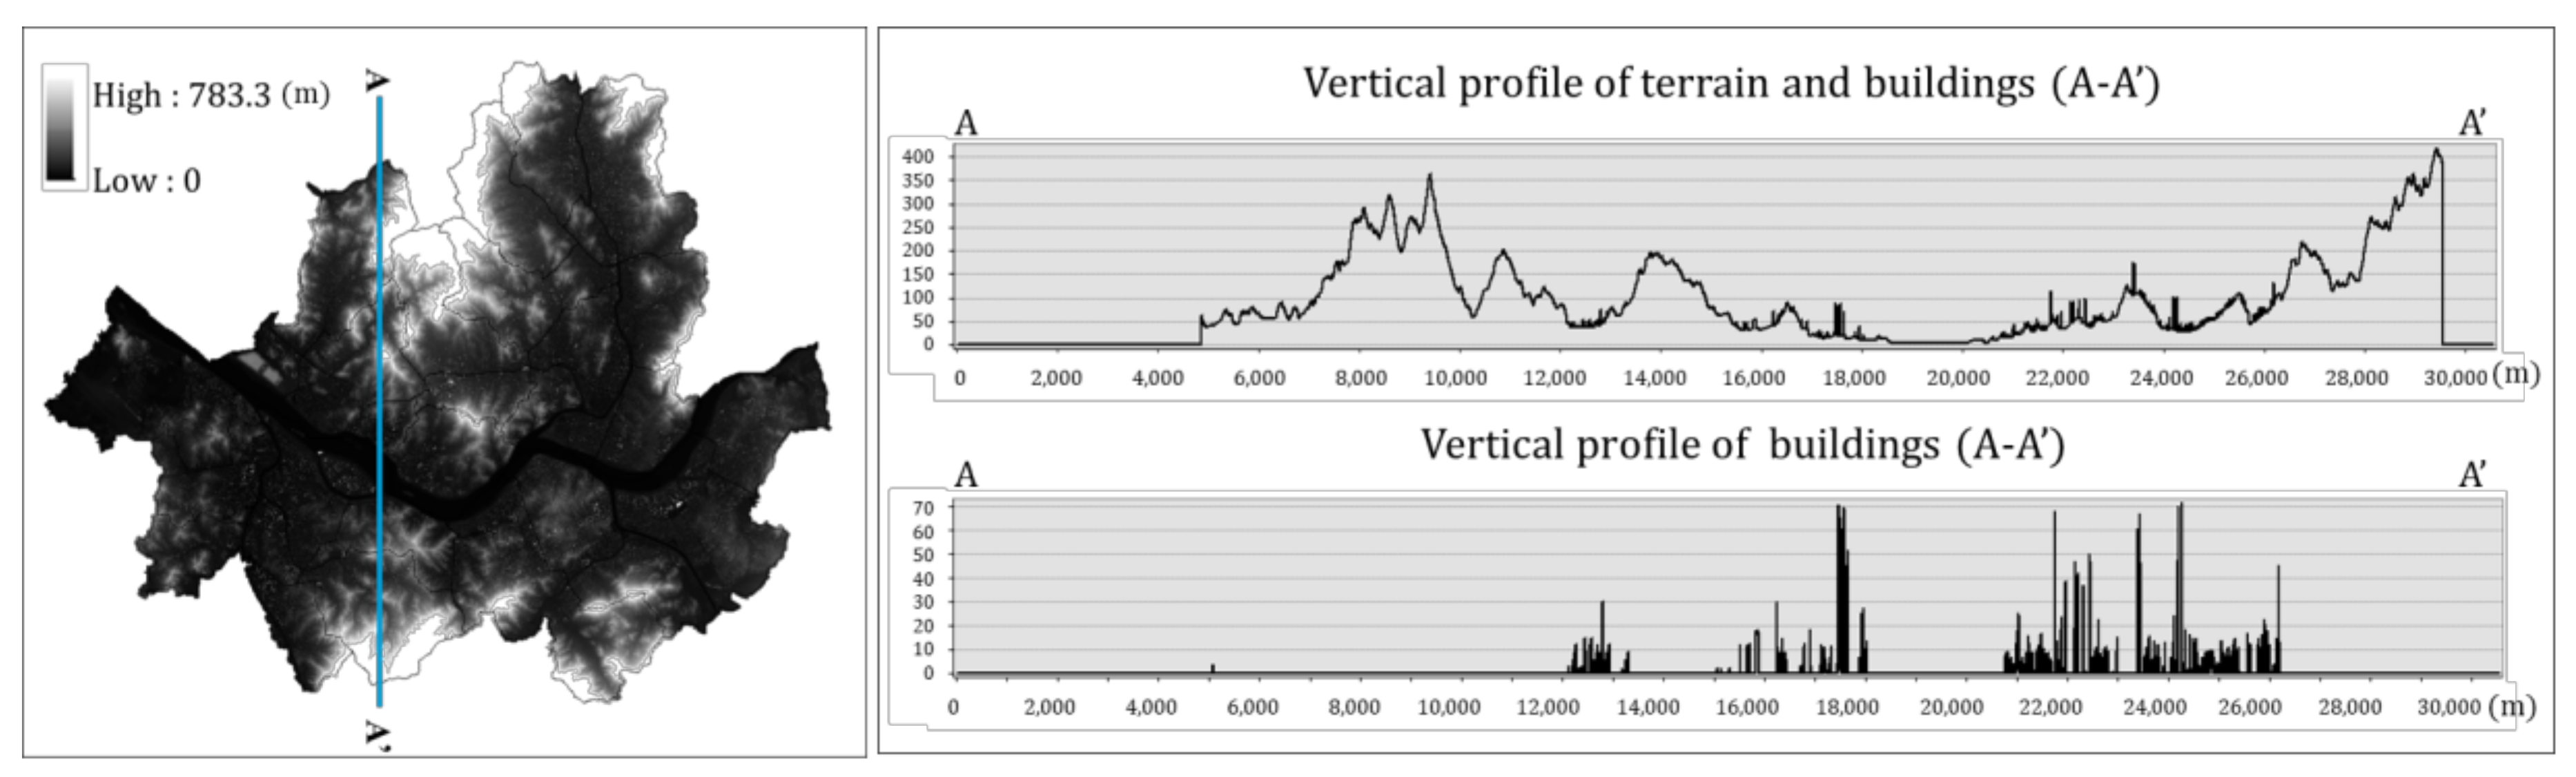
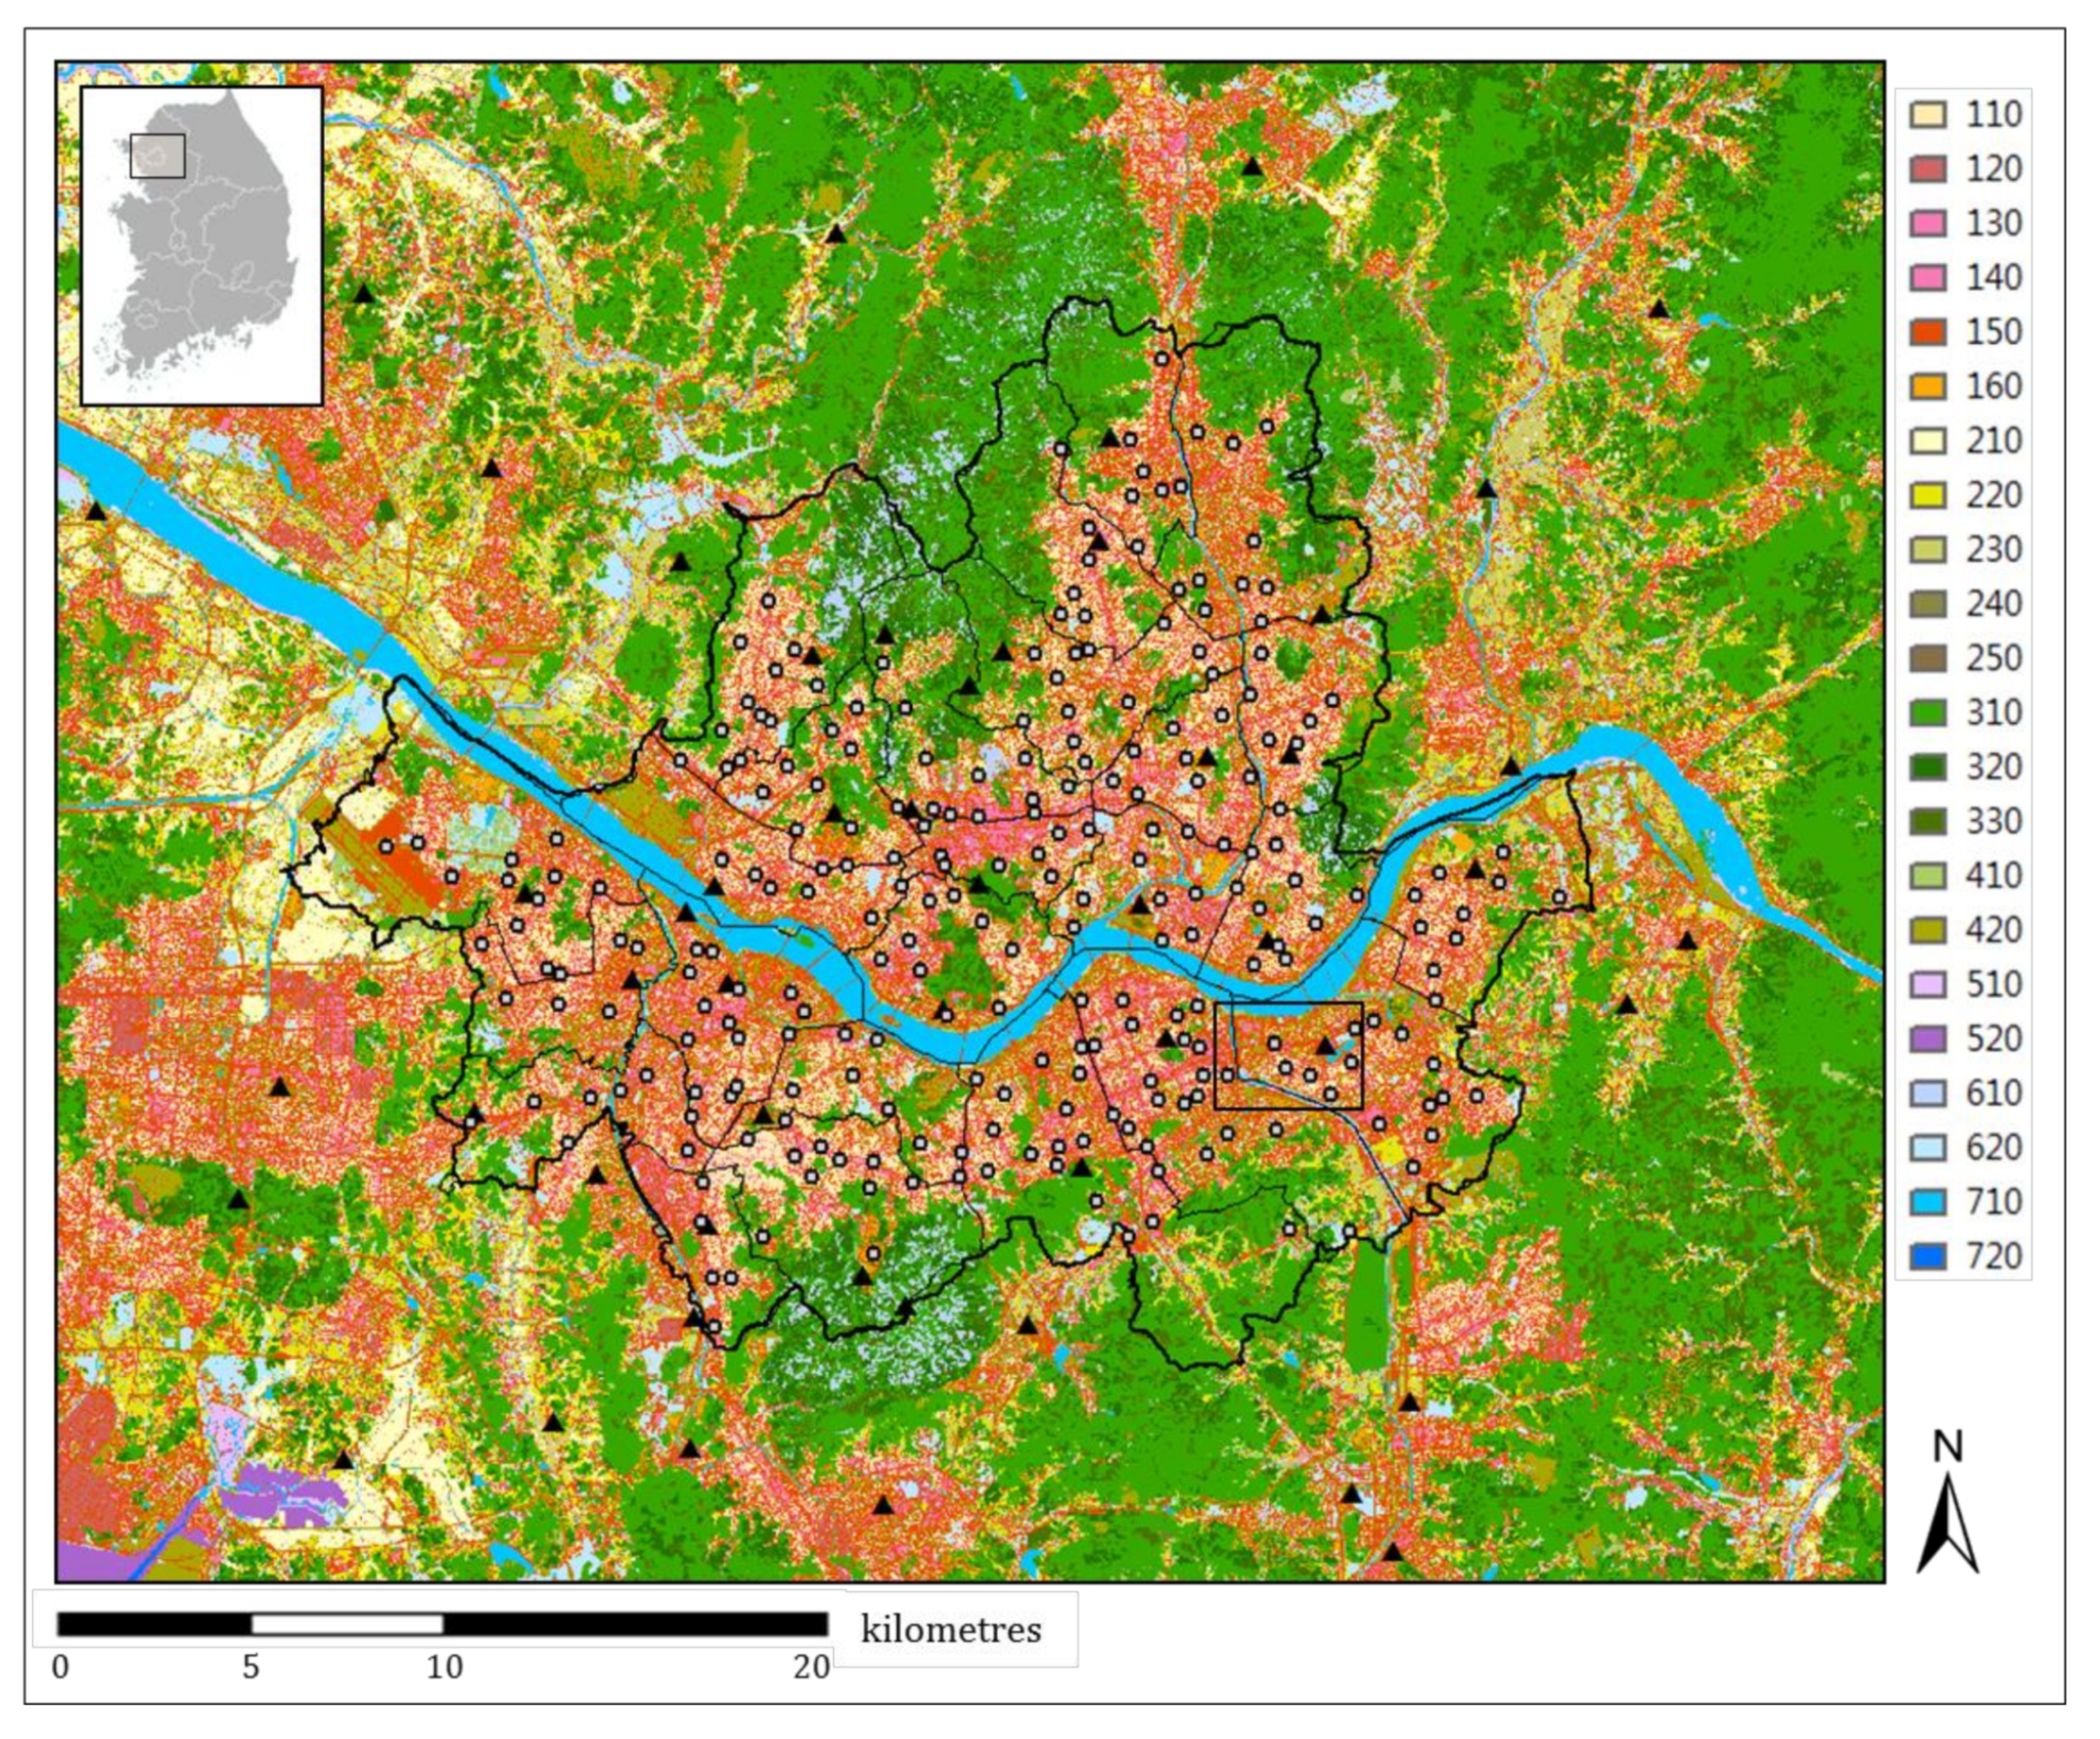
2.1. Target Domain
2.2. Unified Model (UM) Local Data Assimilation and Prediction System (LDAPS) Forecasting Data
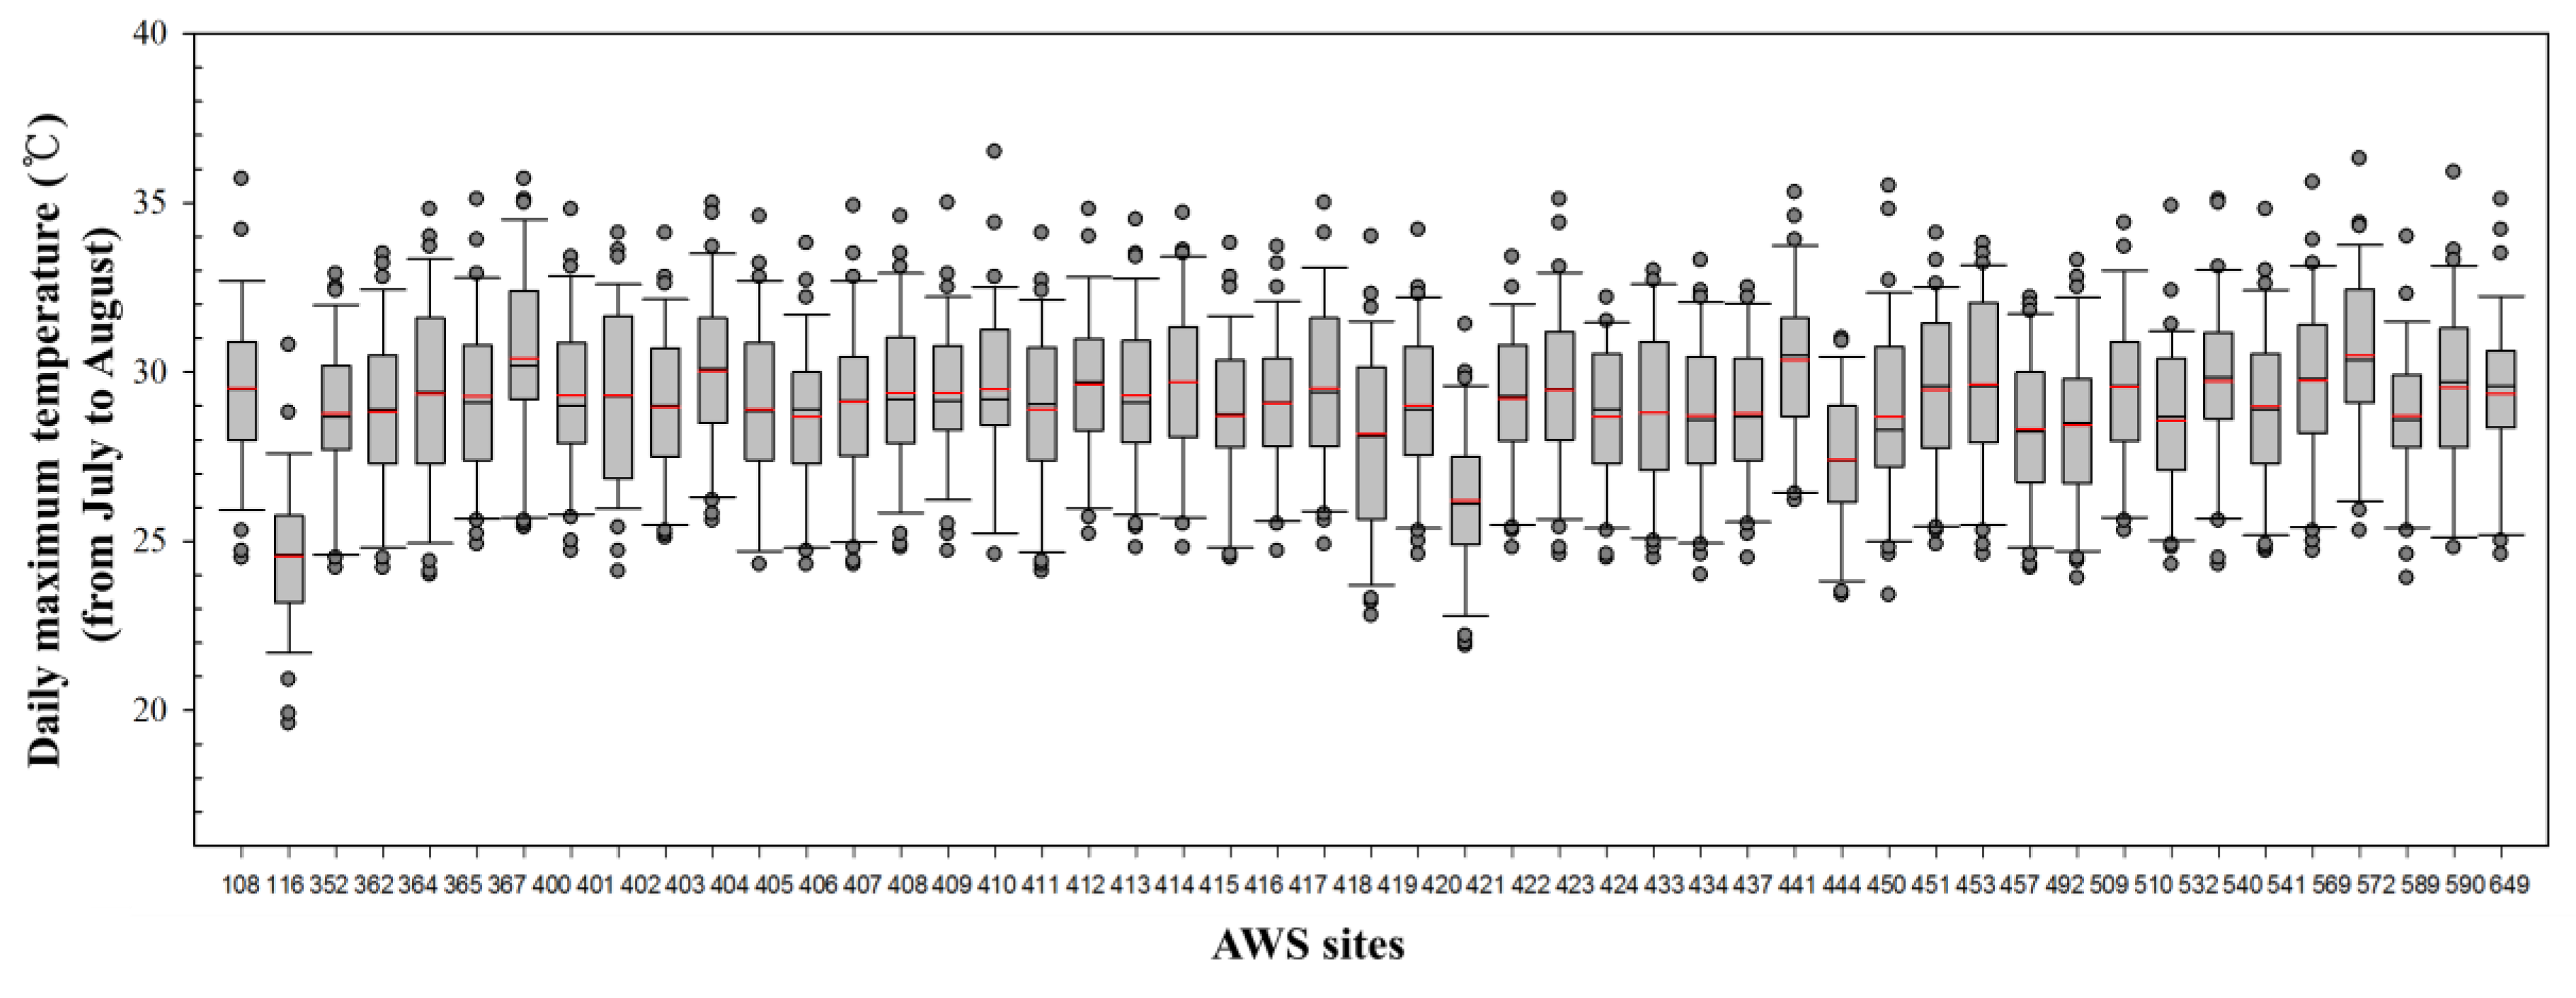
2.3. Ground Observation Data
2.4. Urban Surface Parameters Using the Climate Analysis Seoul (CAS) Workbench
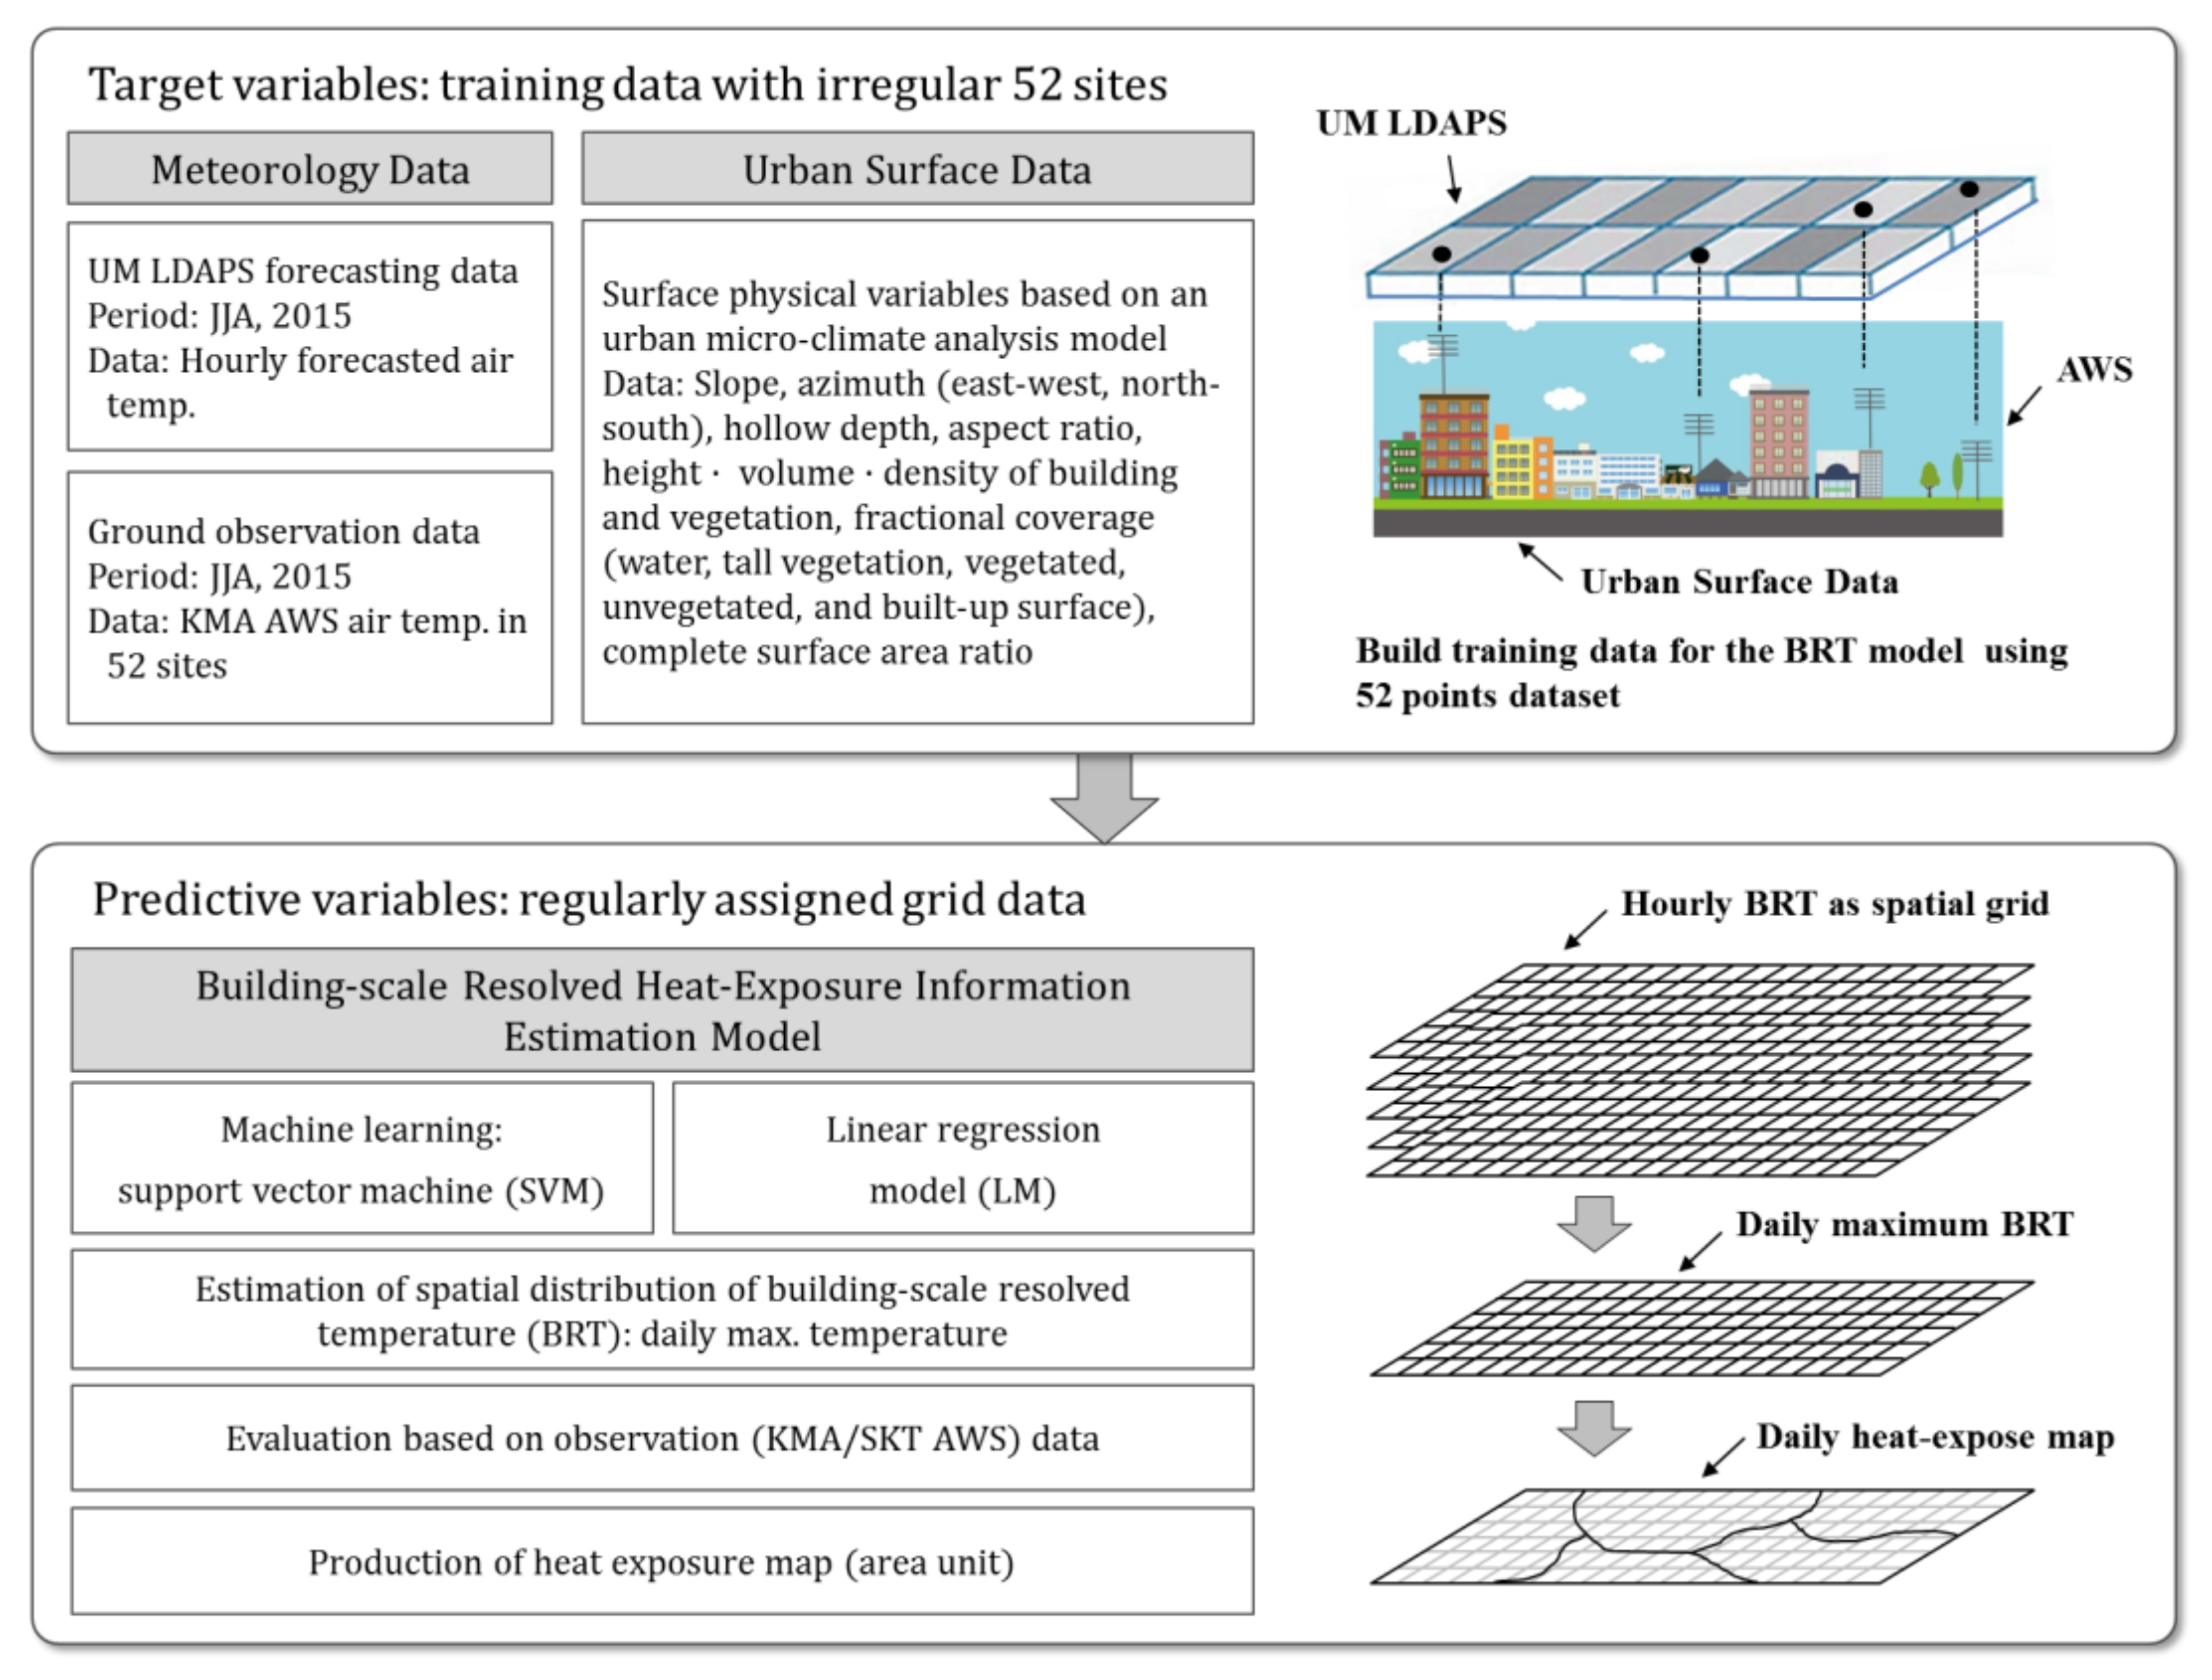
2.5. Building-Scale Resolved Air Temperature (BRT) Model Development and Process
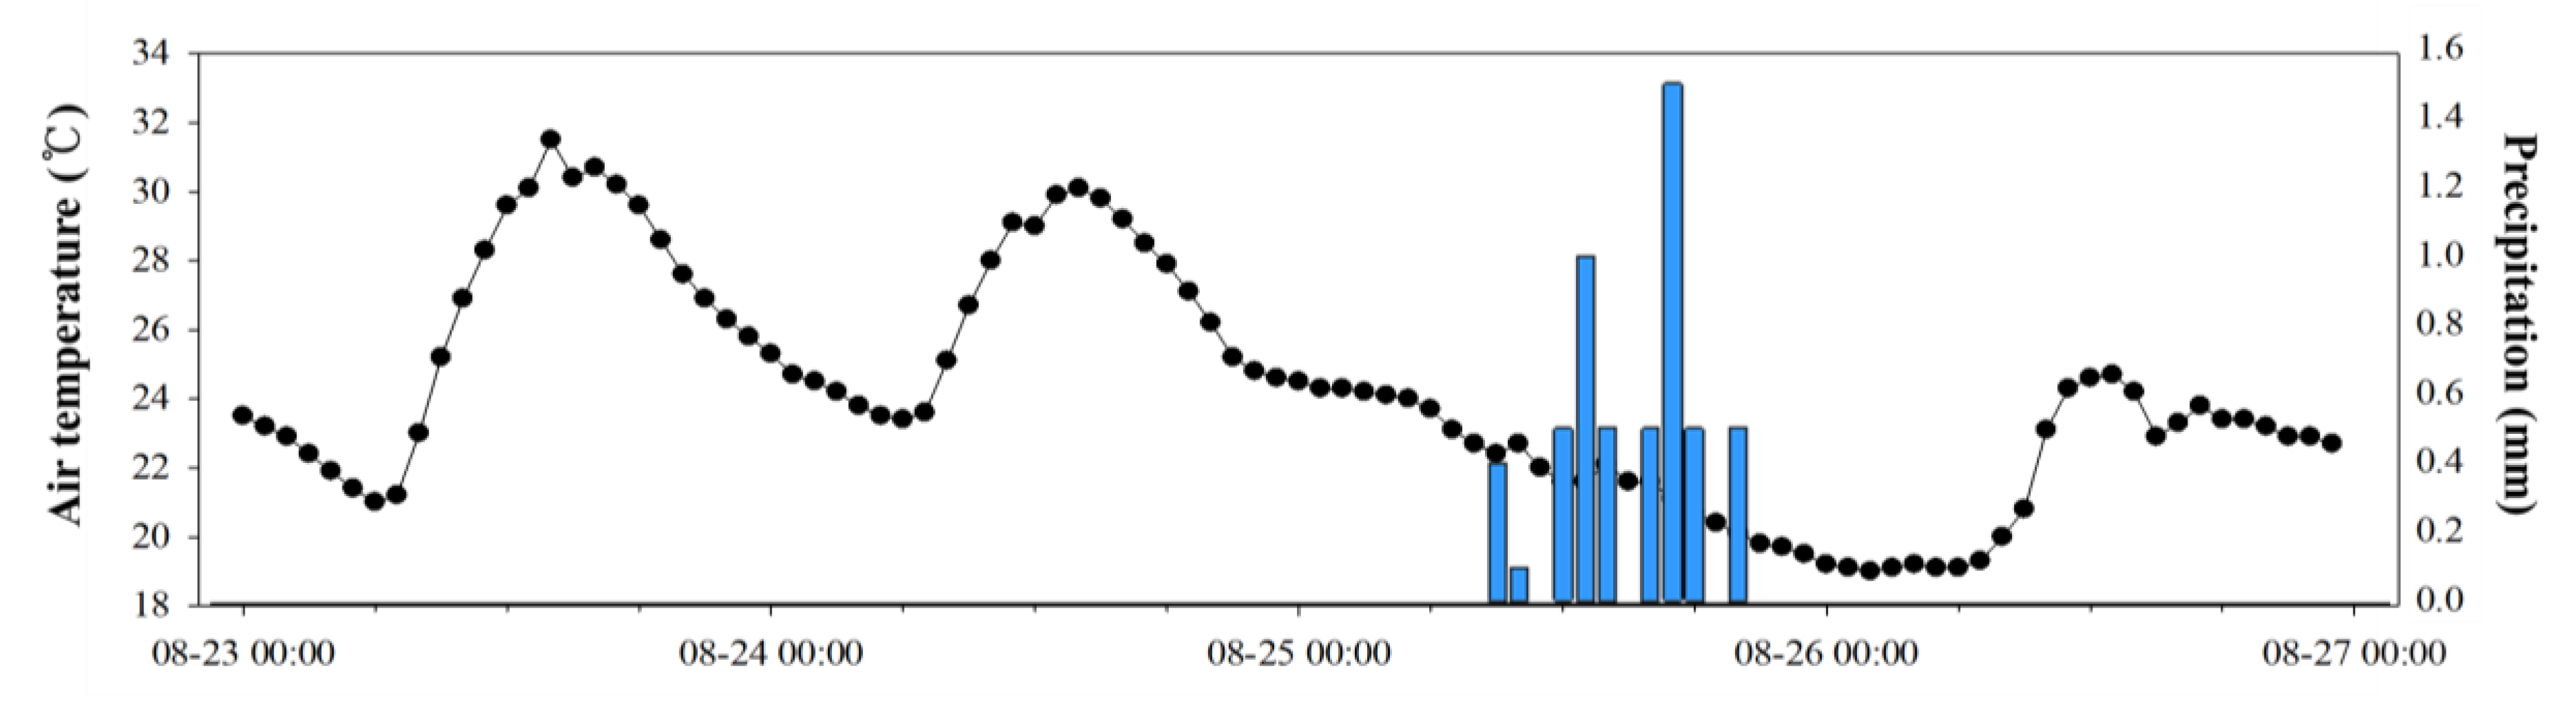
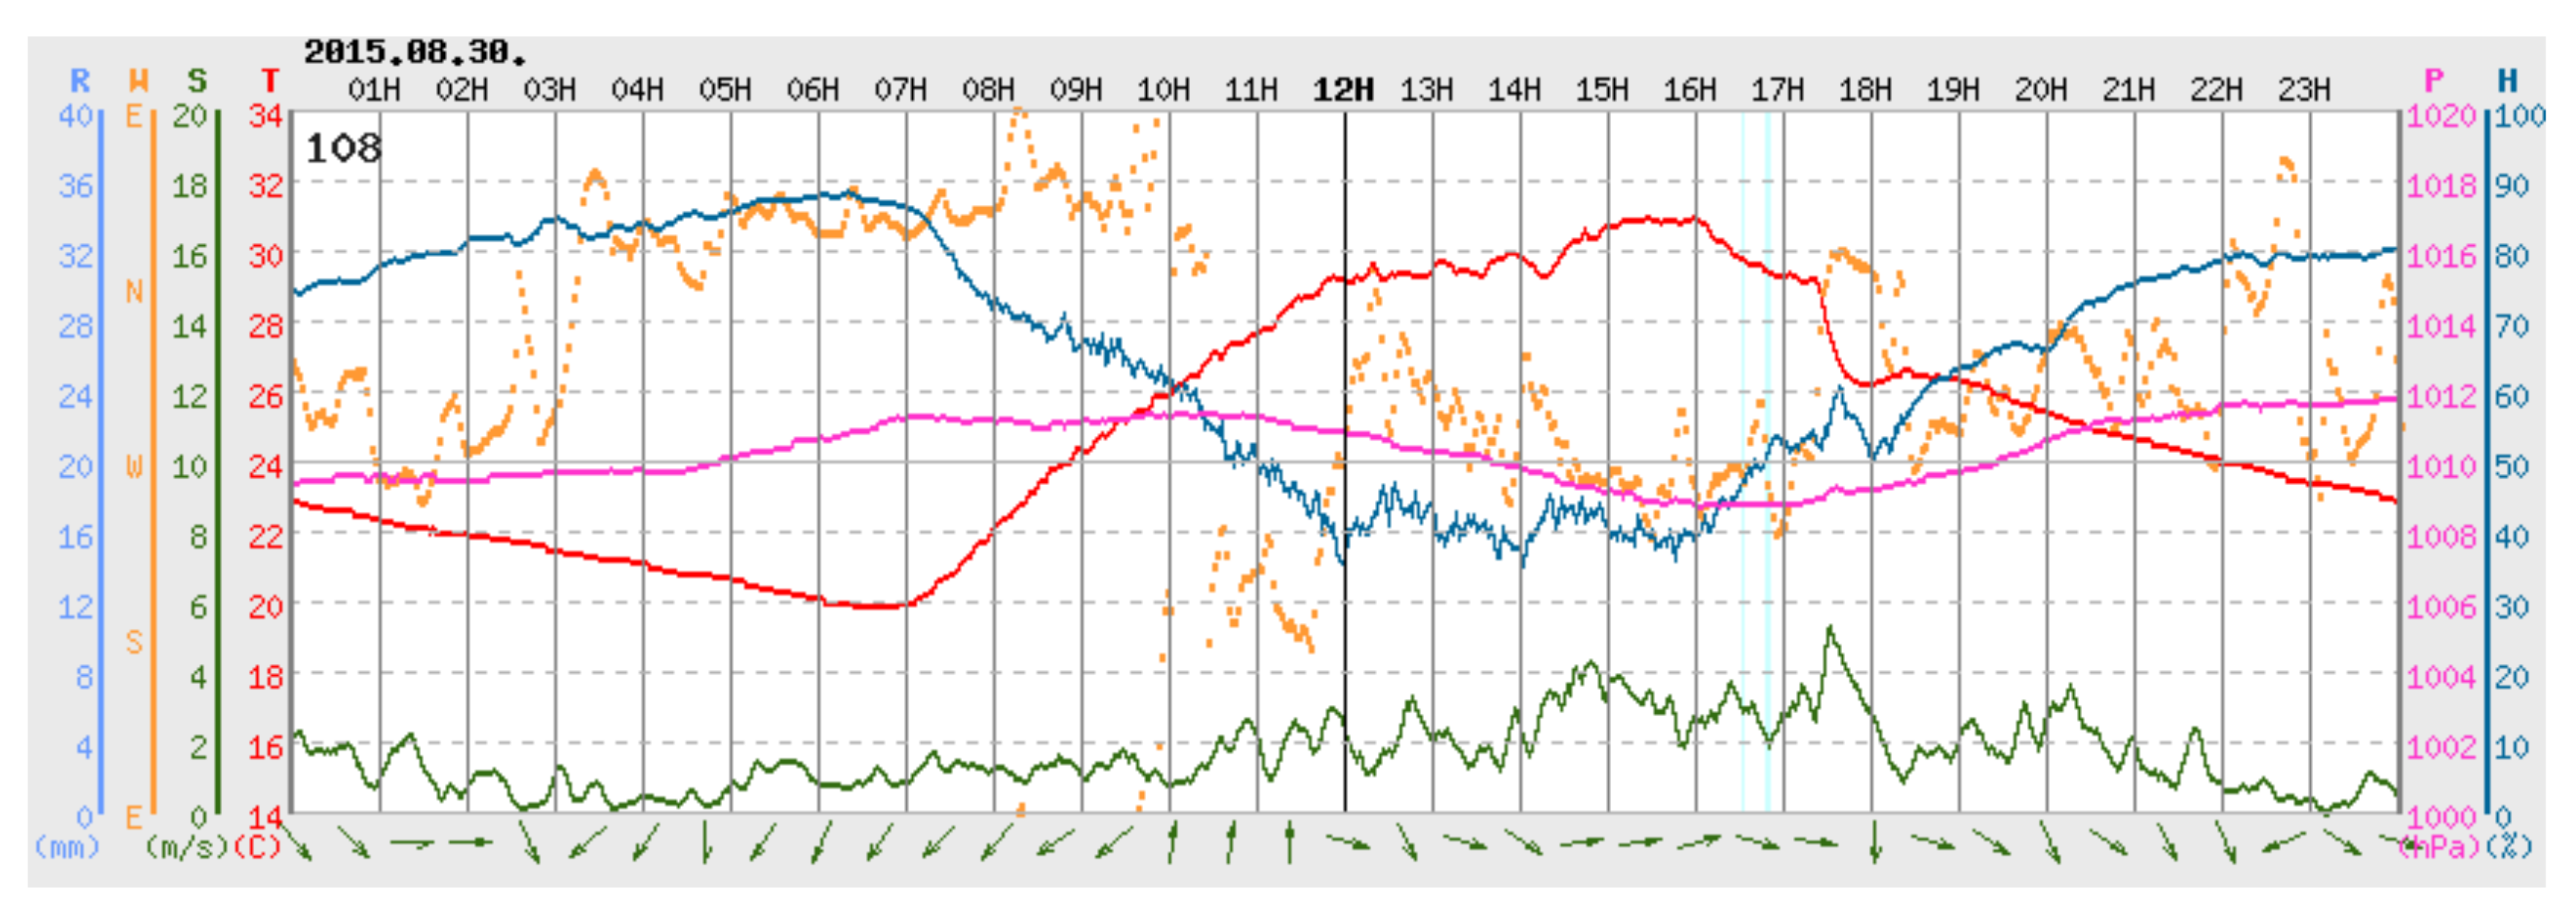
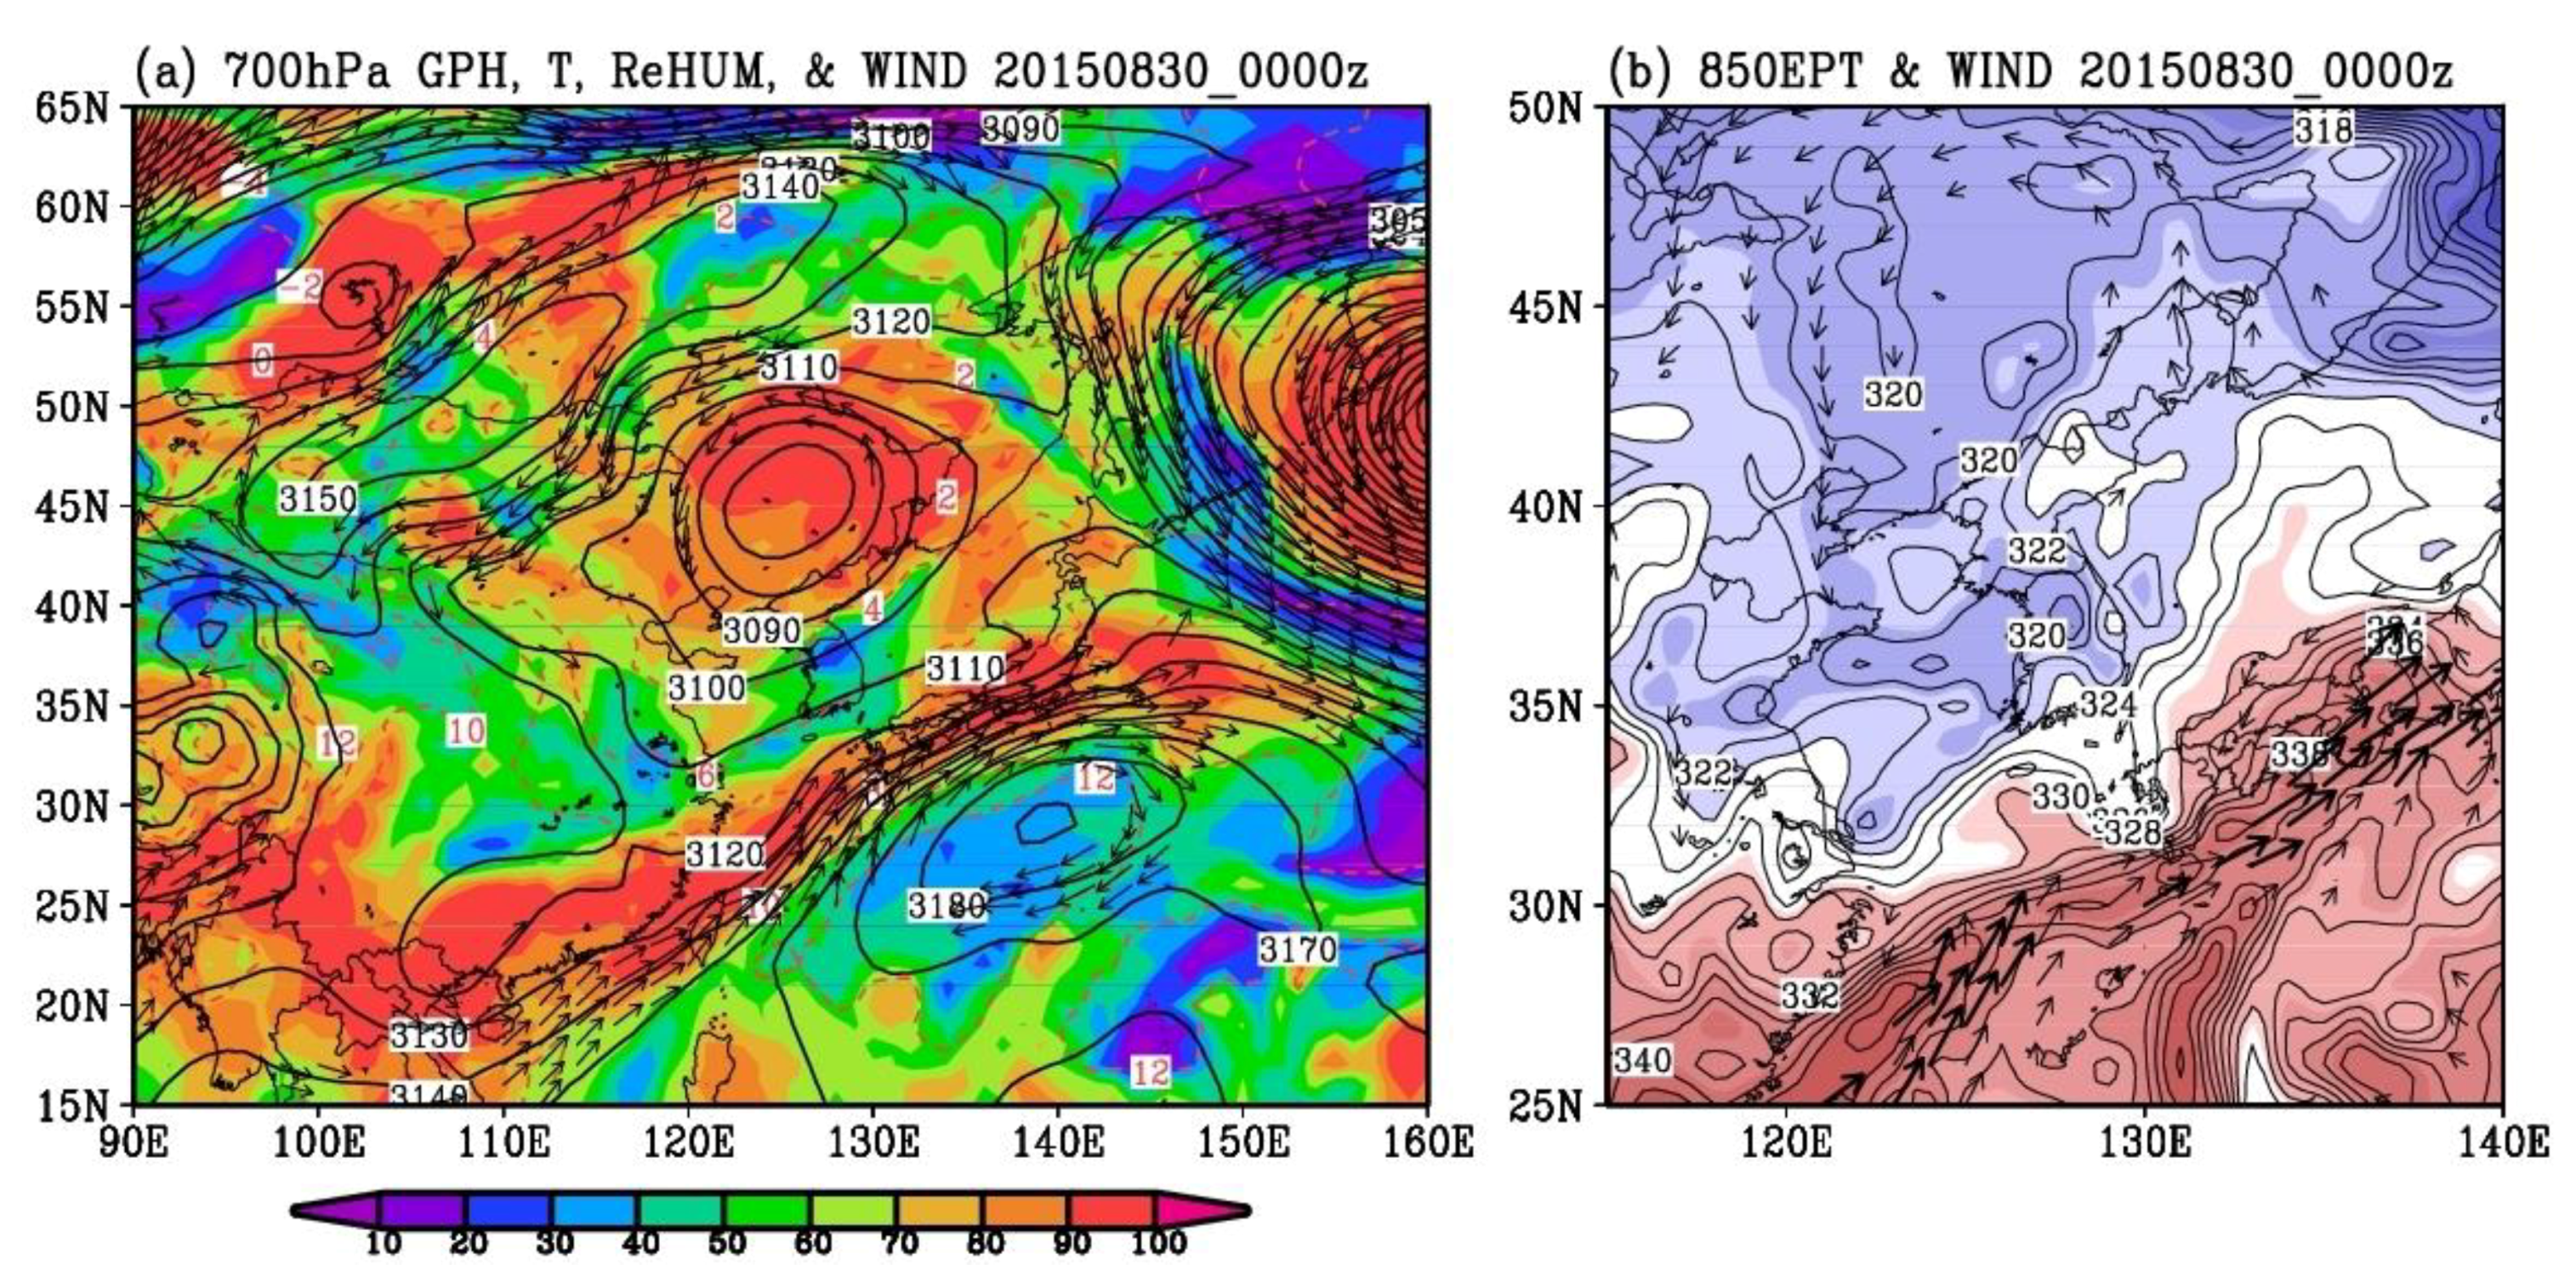
3. Preliminary Study Results: Characteristics of Meteorological Data in Seoul
4. Results and Discussion
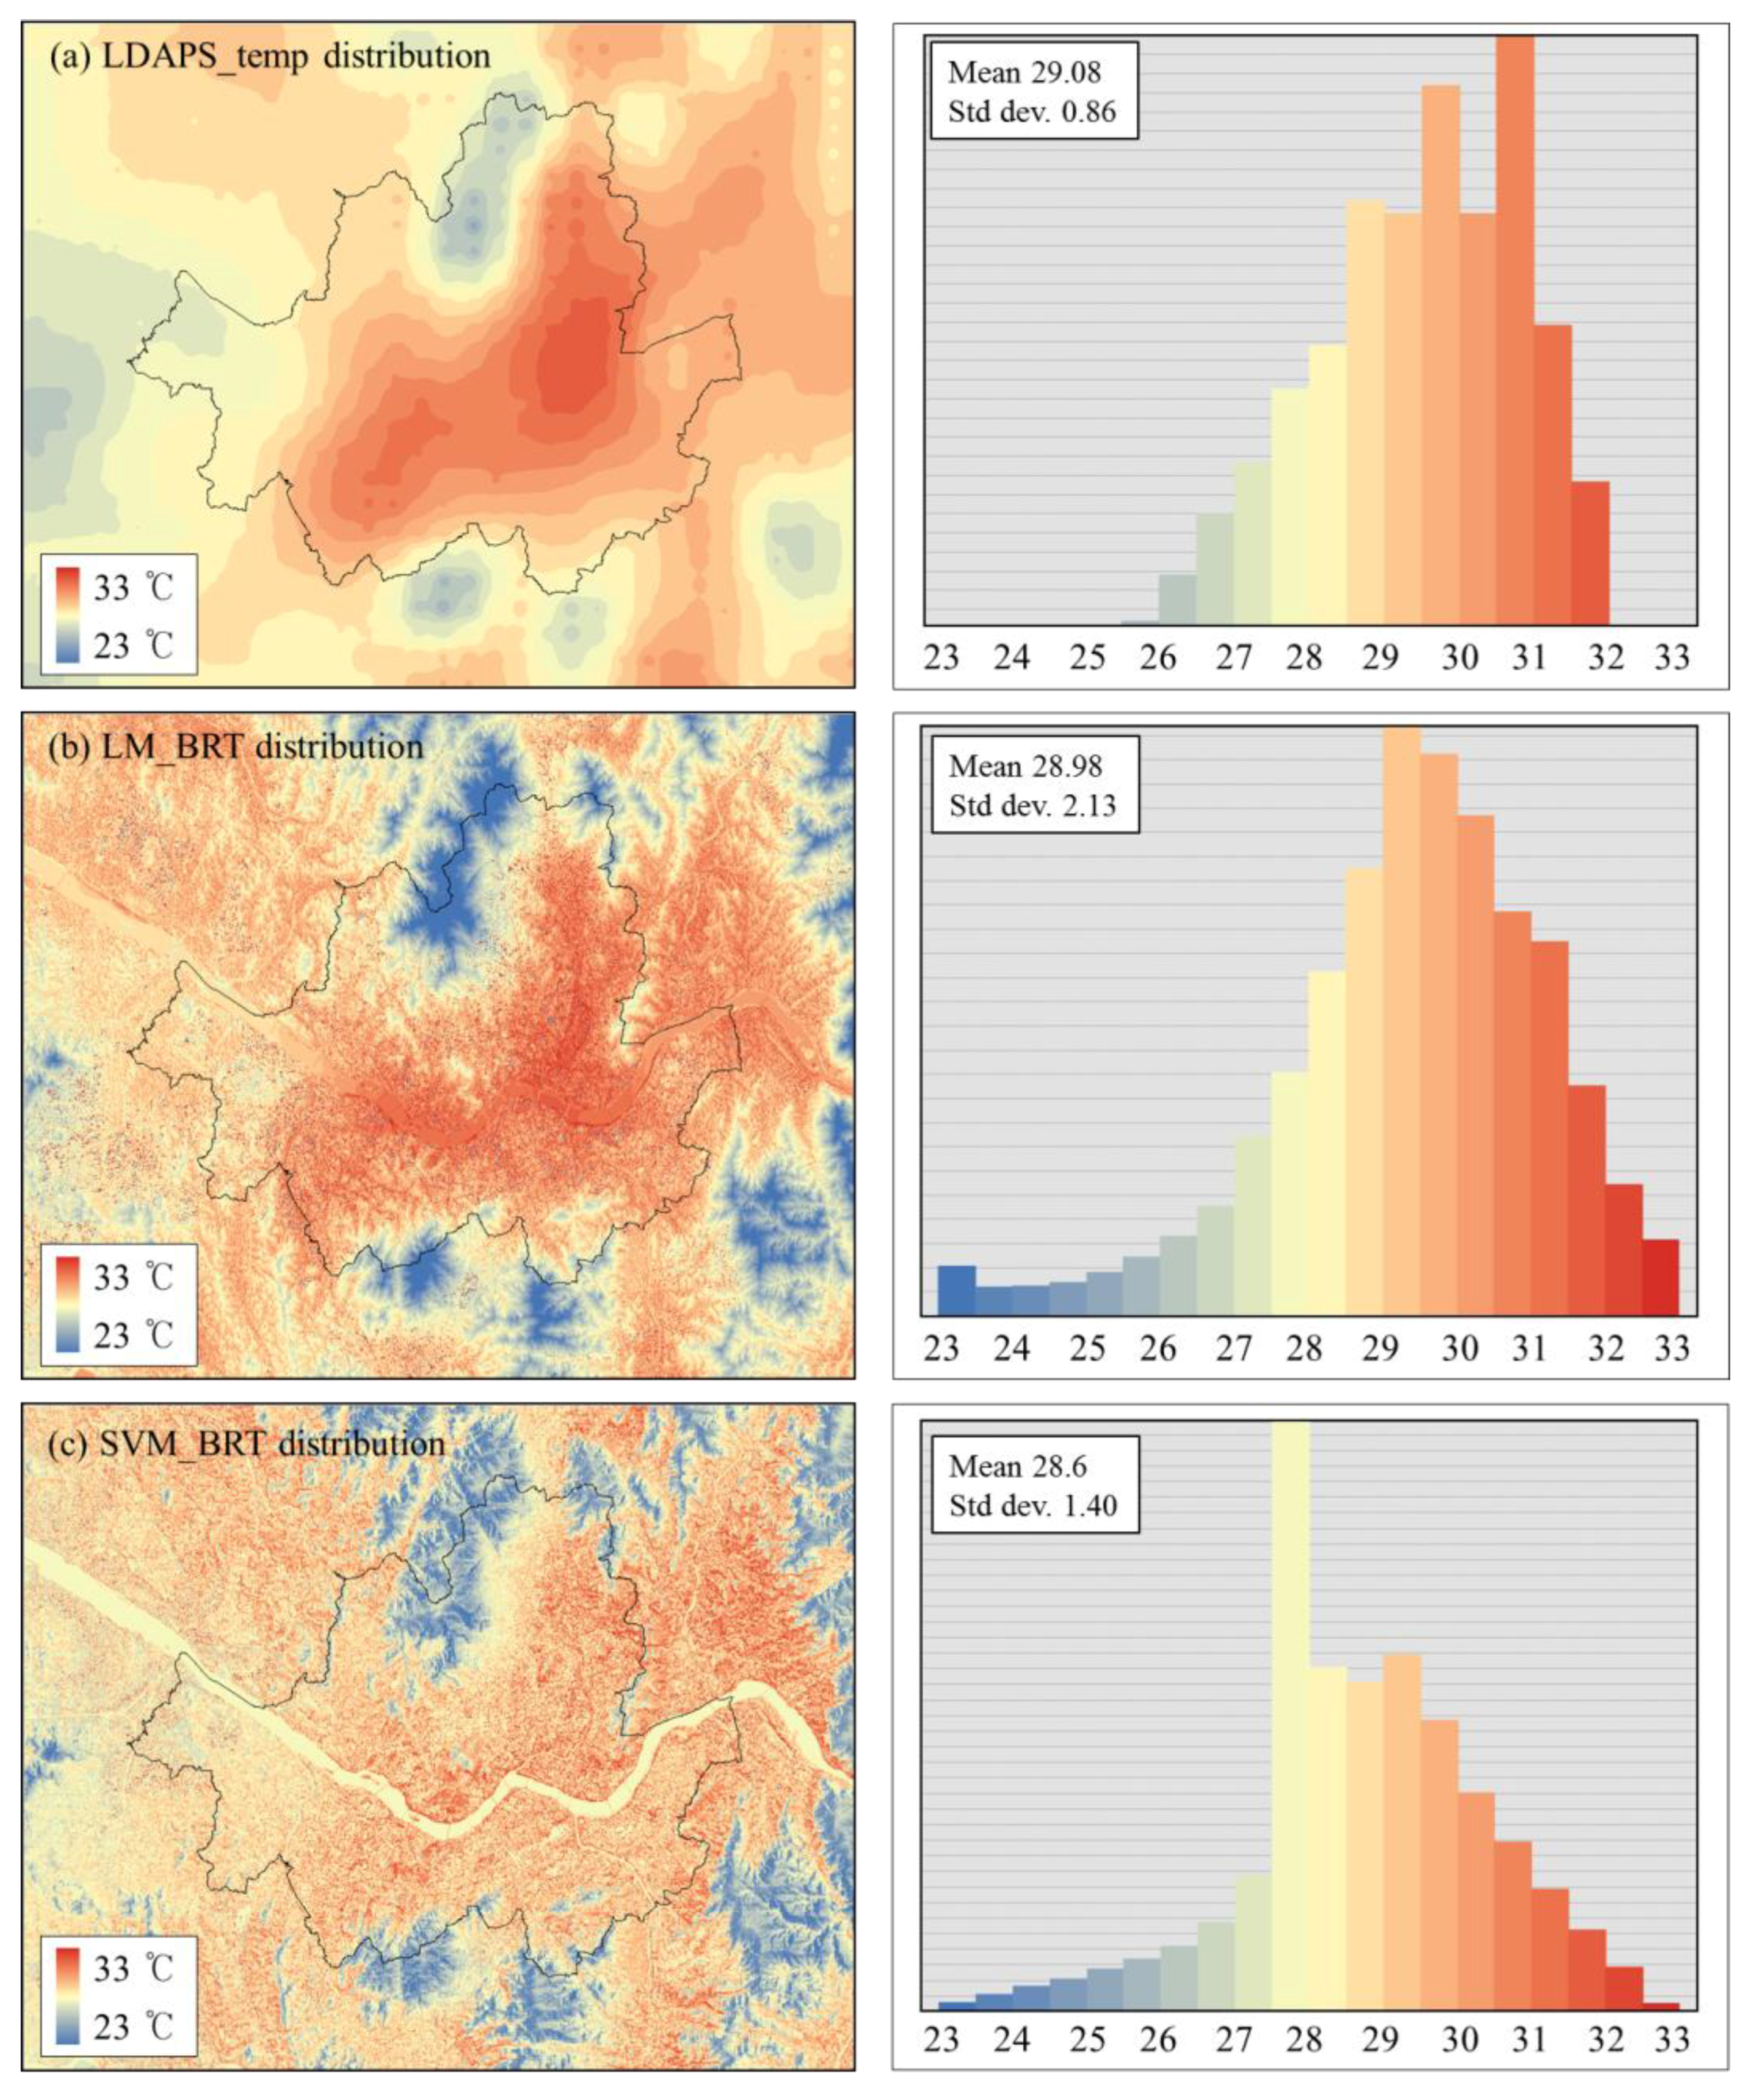
4.1. Estimation of BRT
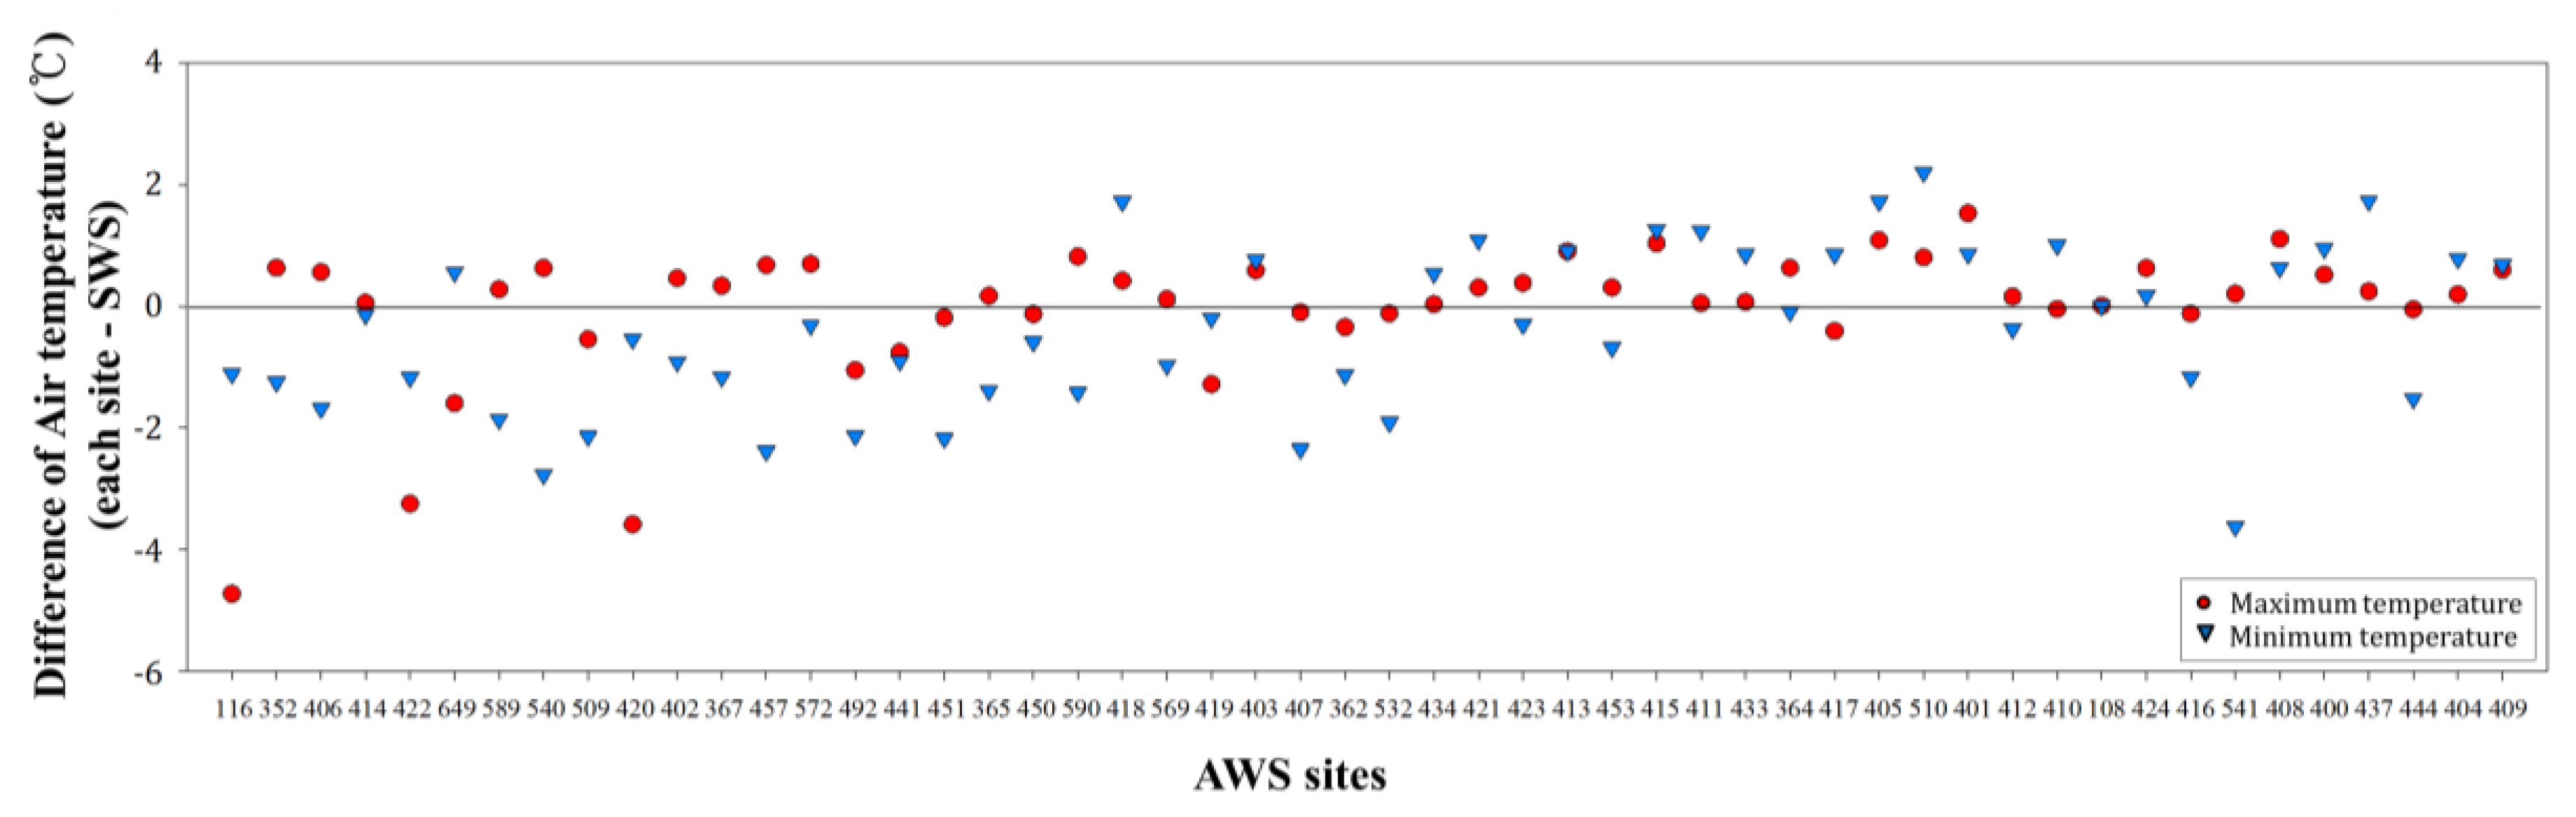
4.2. BRT Evaluation Using Korea Meteorological Administration (KMA) Ground Observation Data
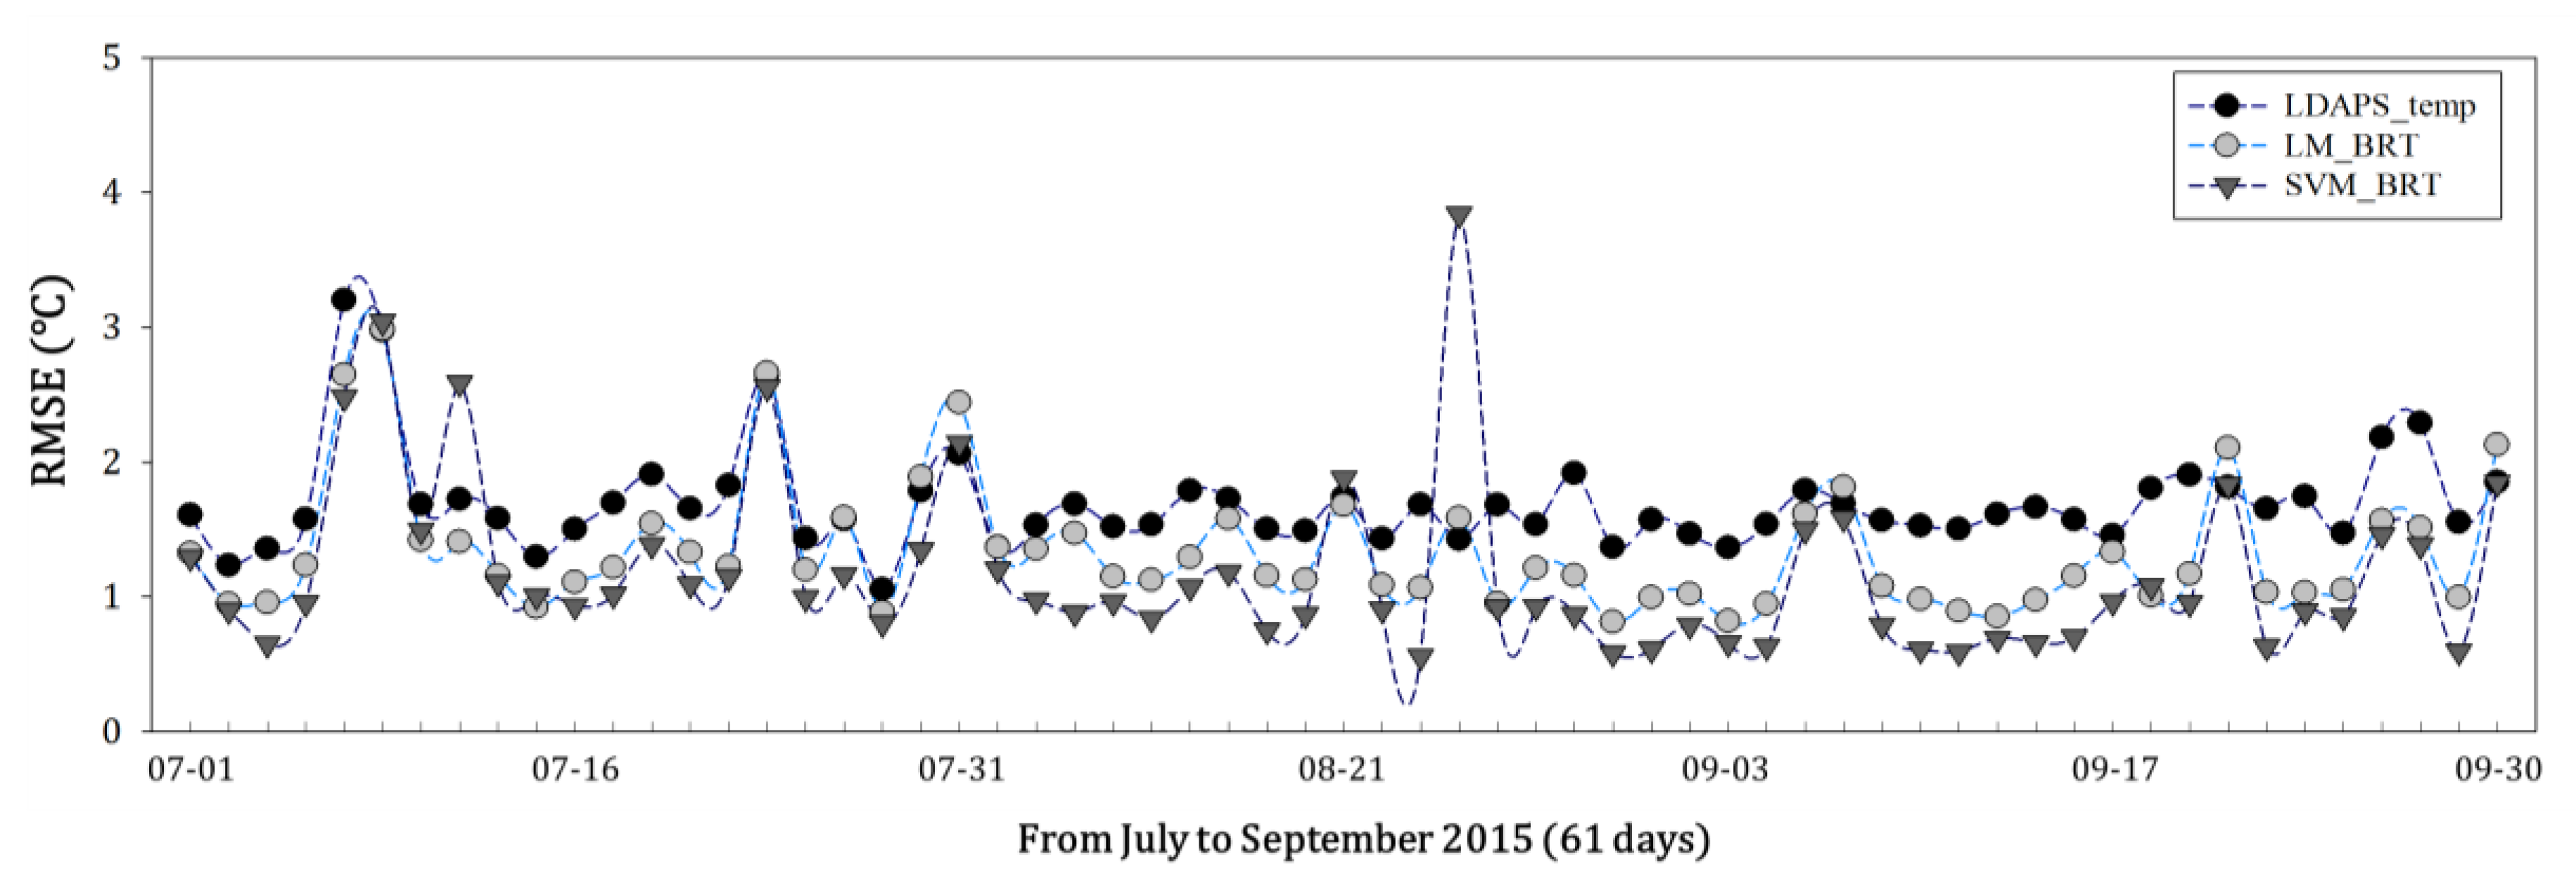
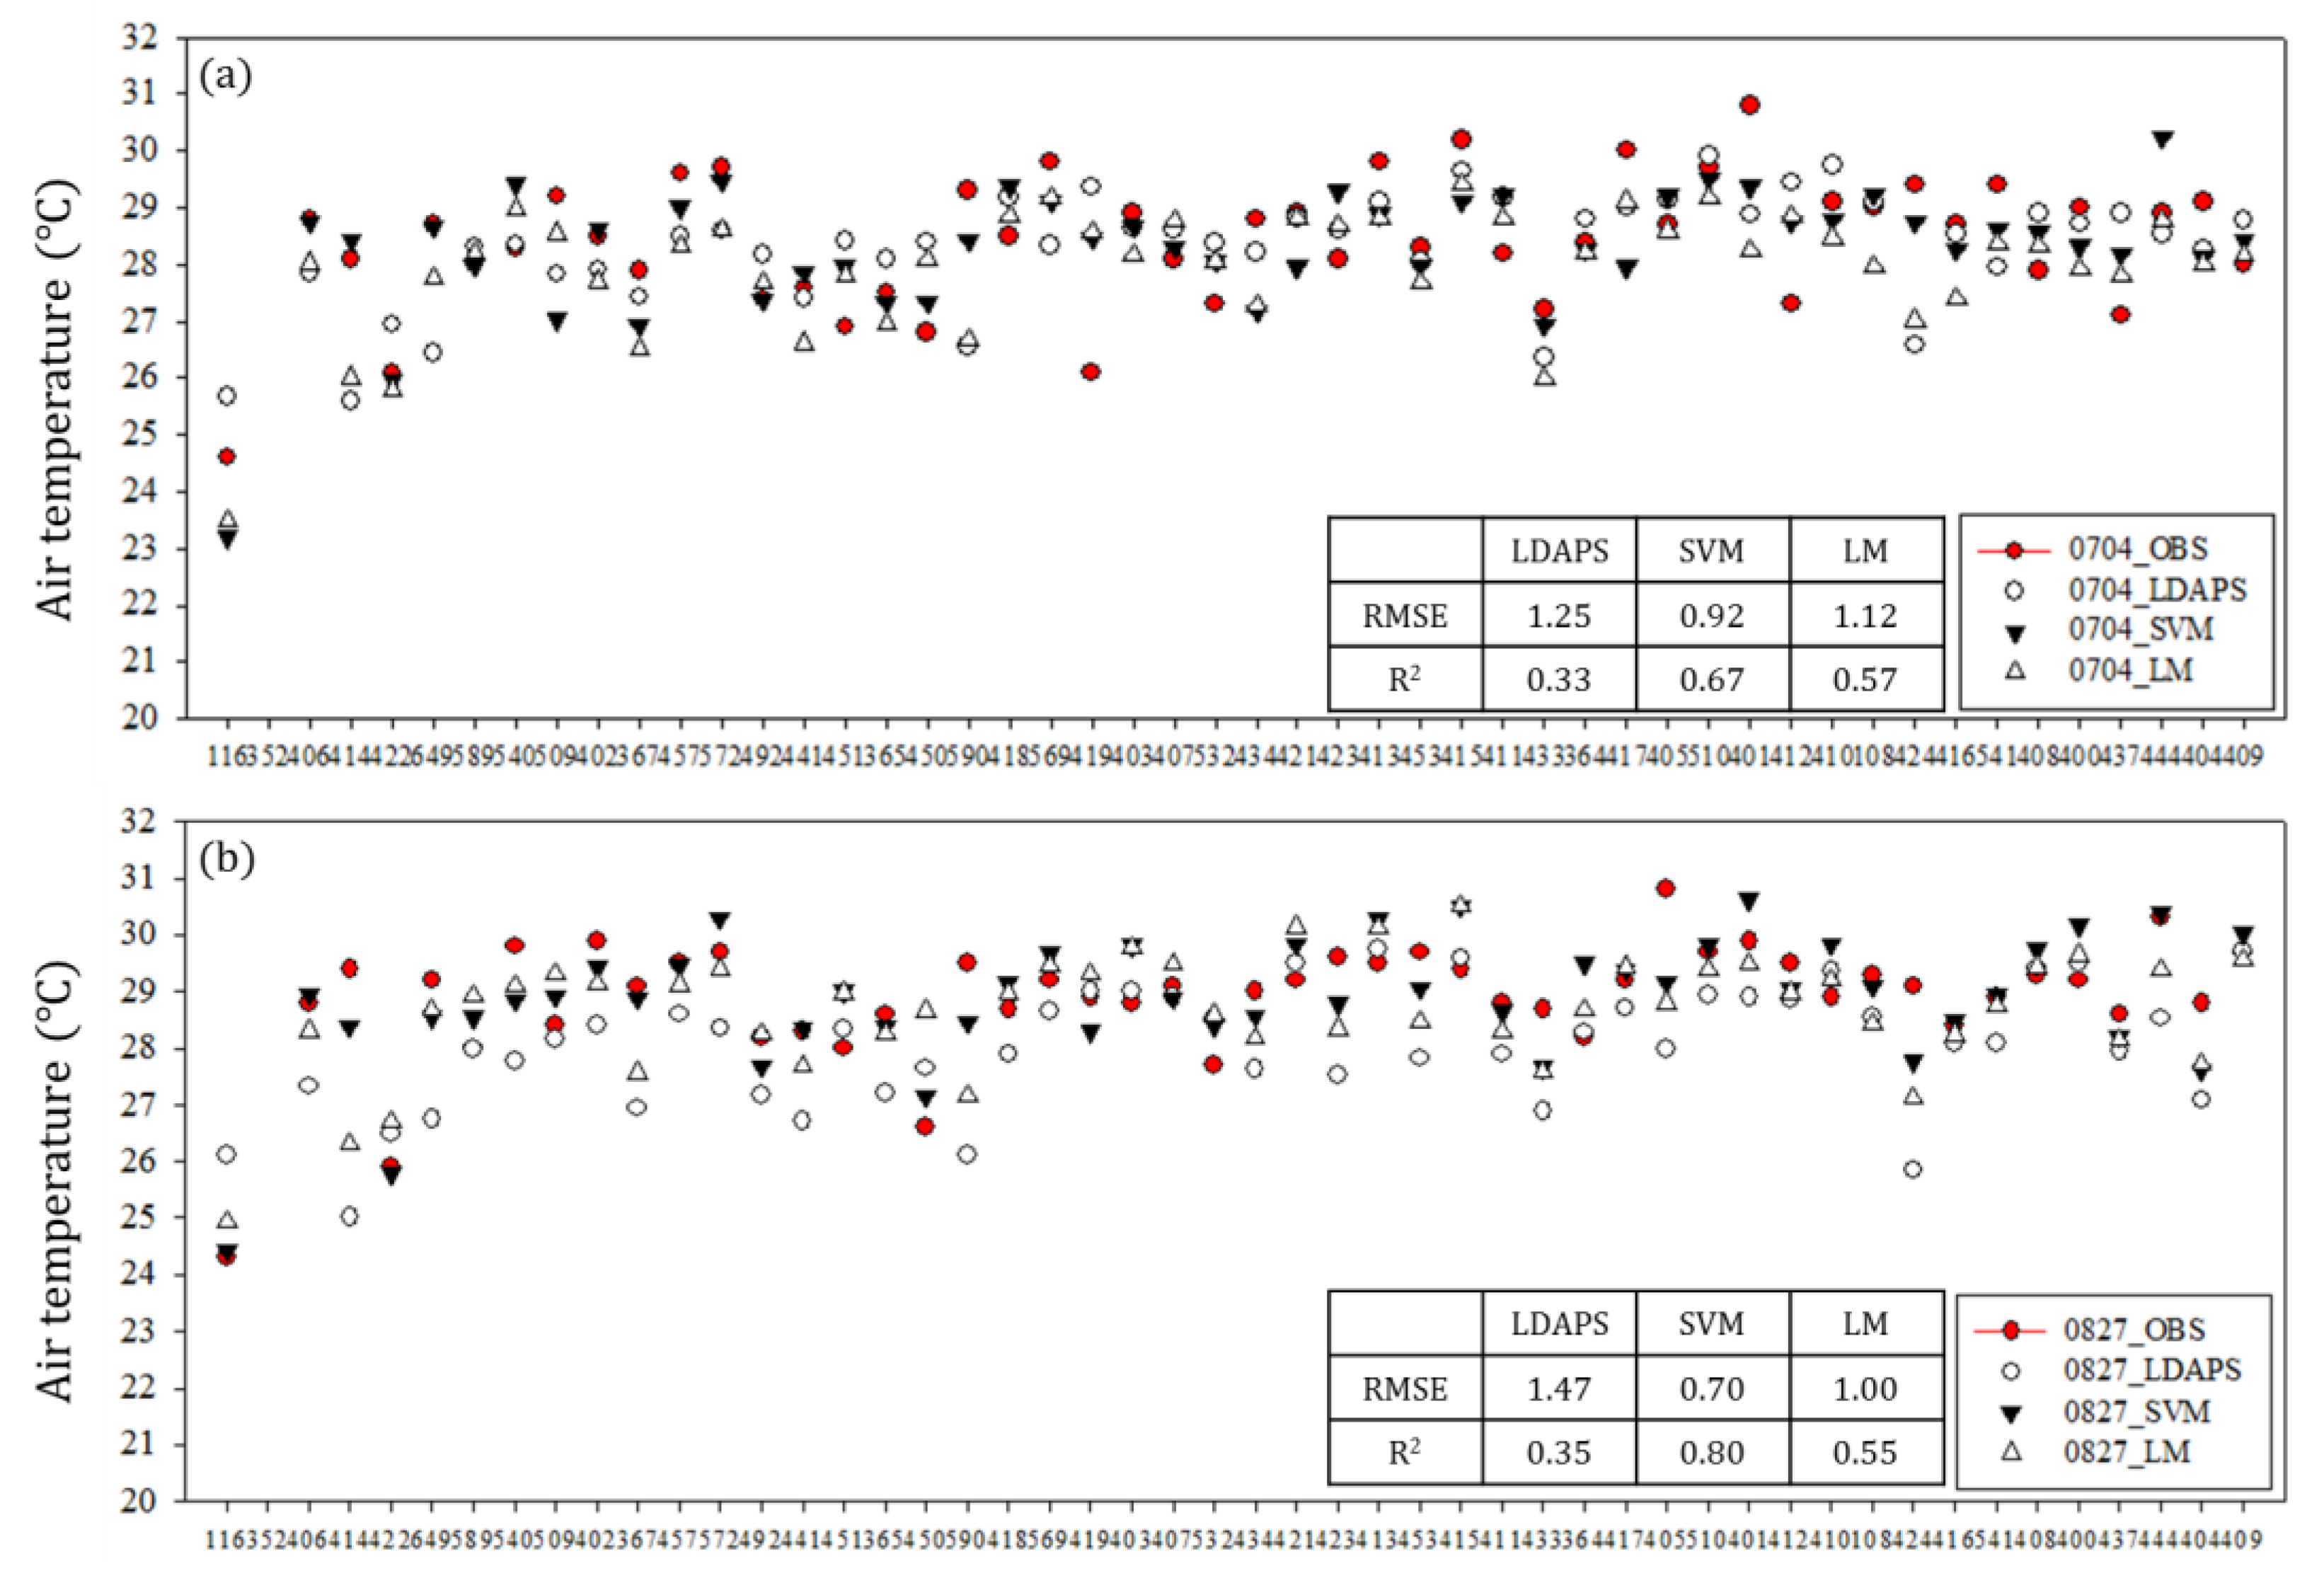
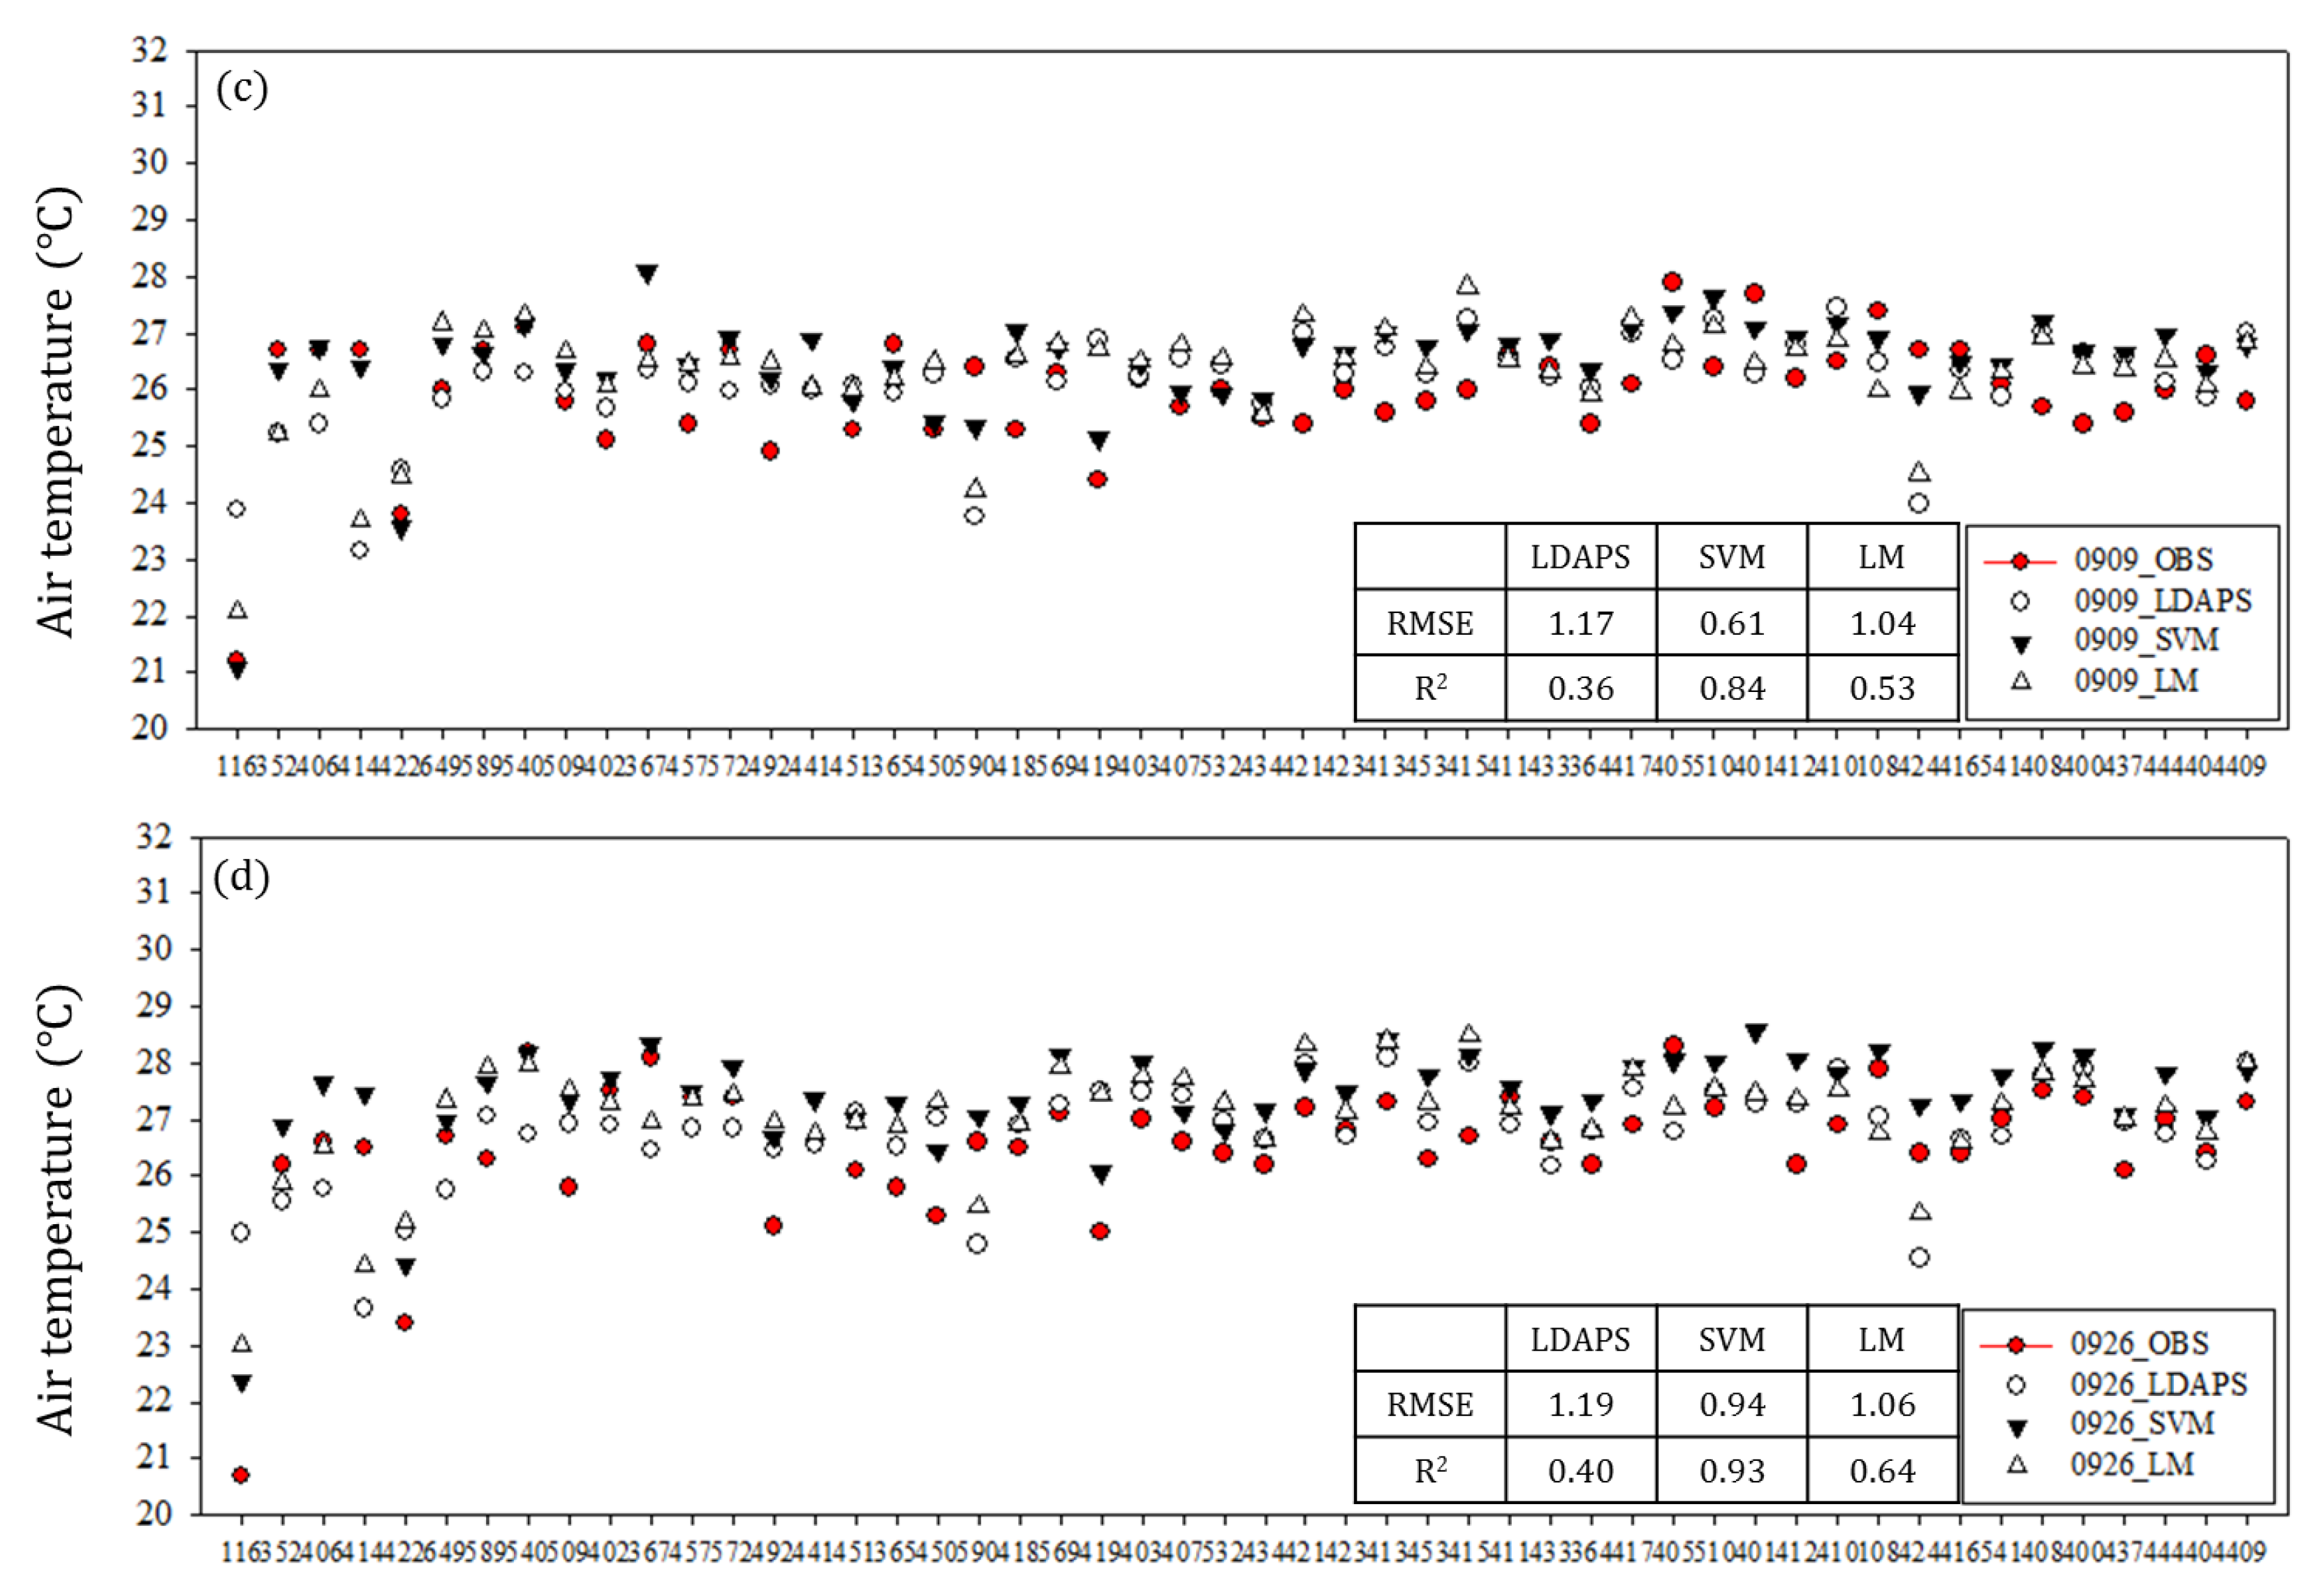
4.2.1. Evaluation of Time Series Results of Daily Maximum Temperatures
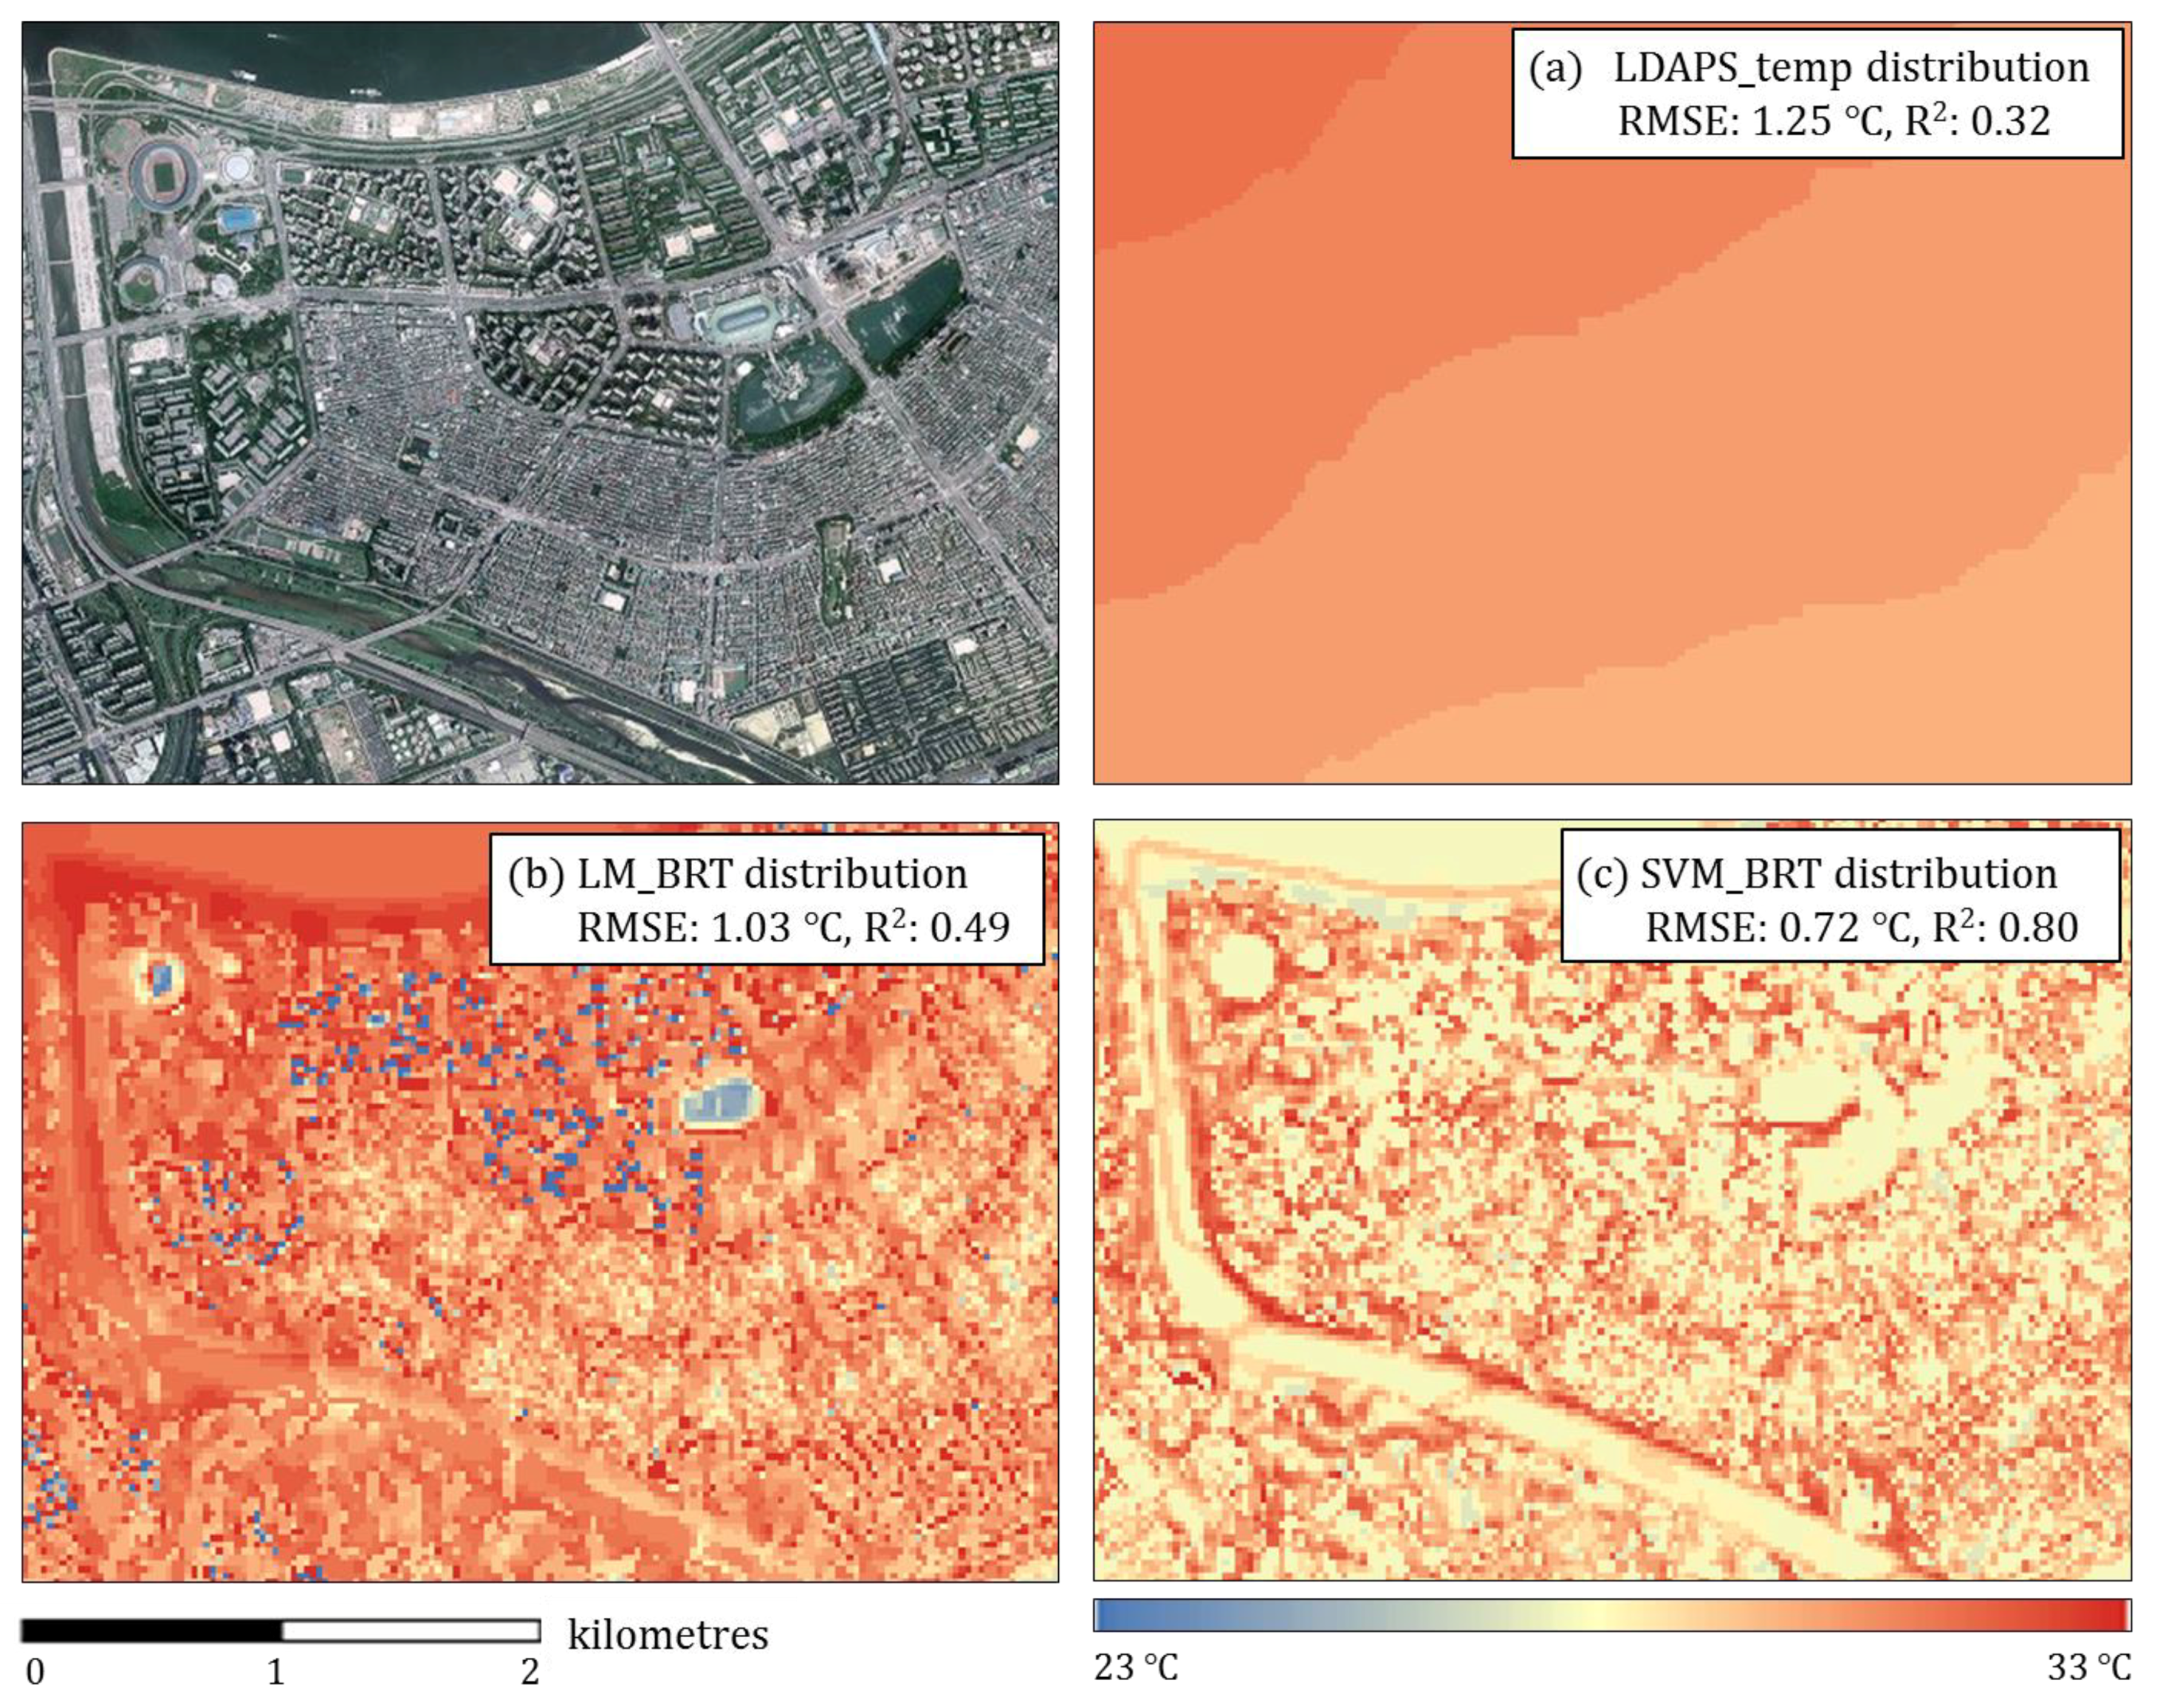
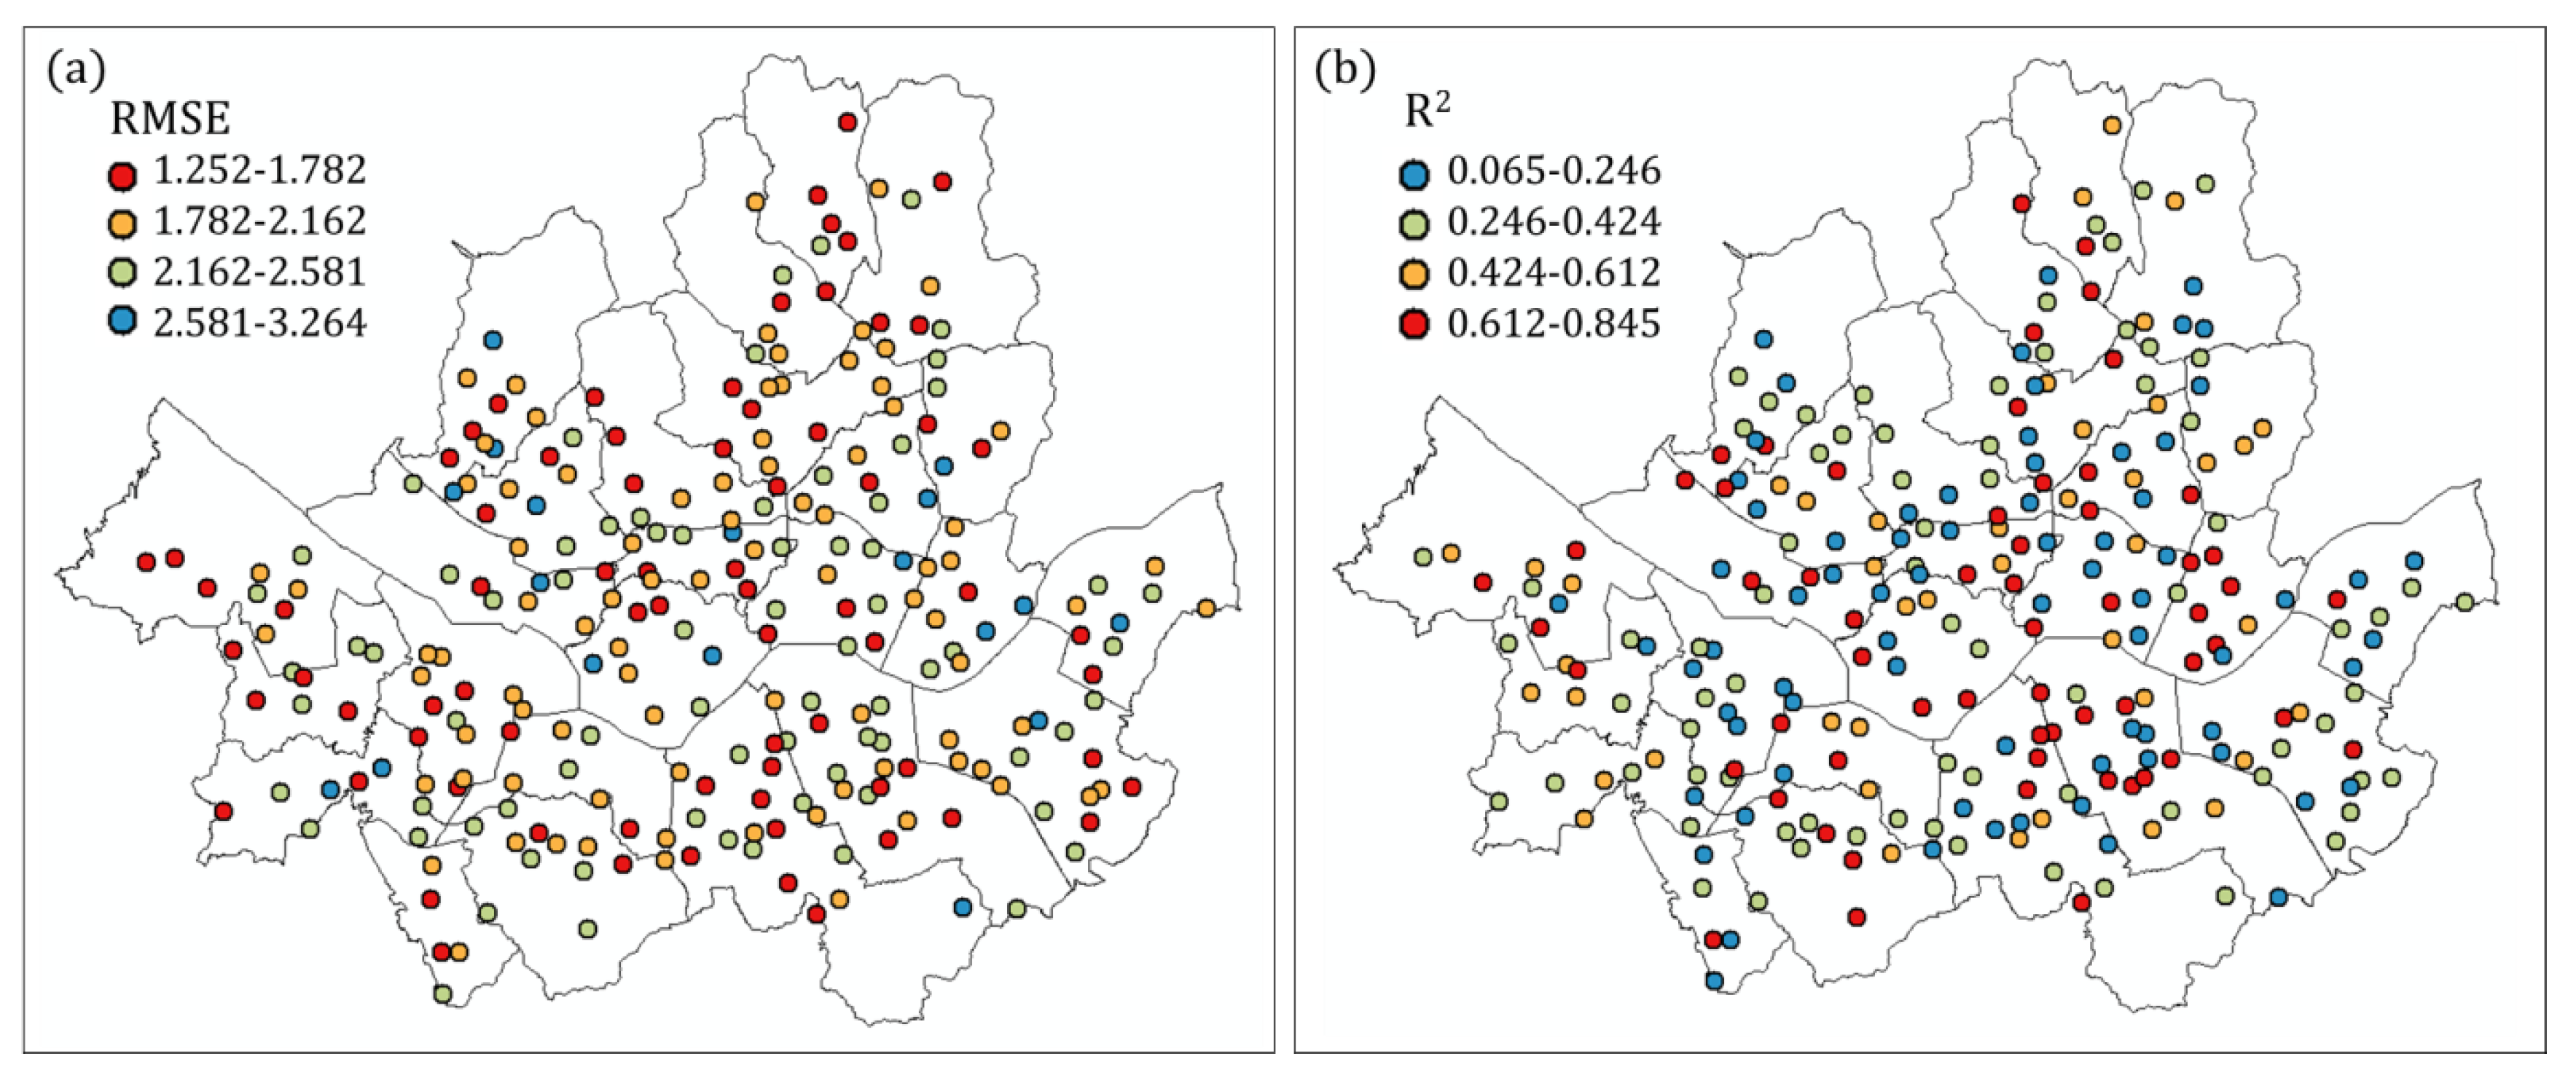
4.2.2. Evaluation of the Spatial Distribution of Daily Maximum Temperature
4.2.3. BRT Evaluation Using SKT Observation Data
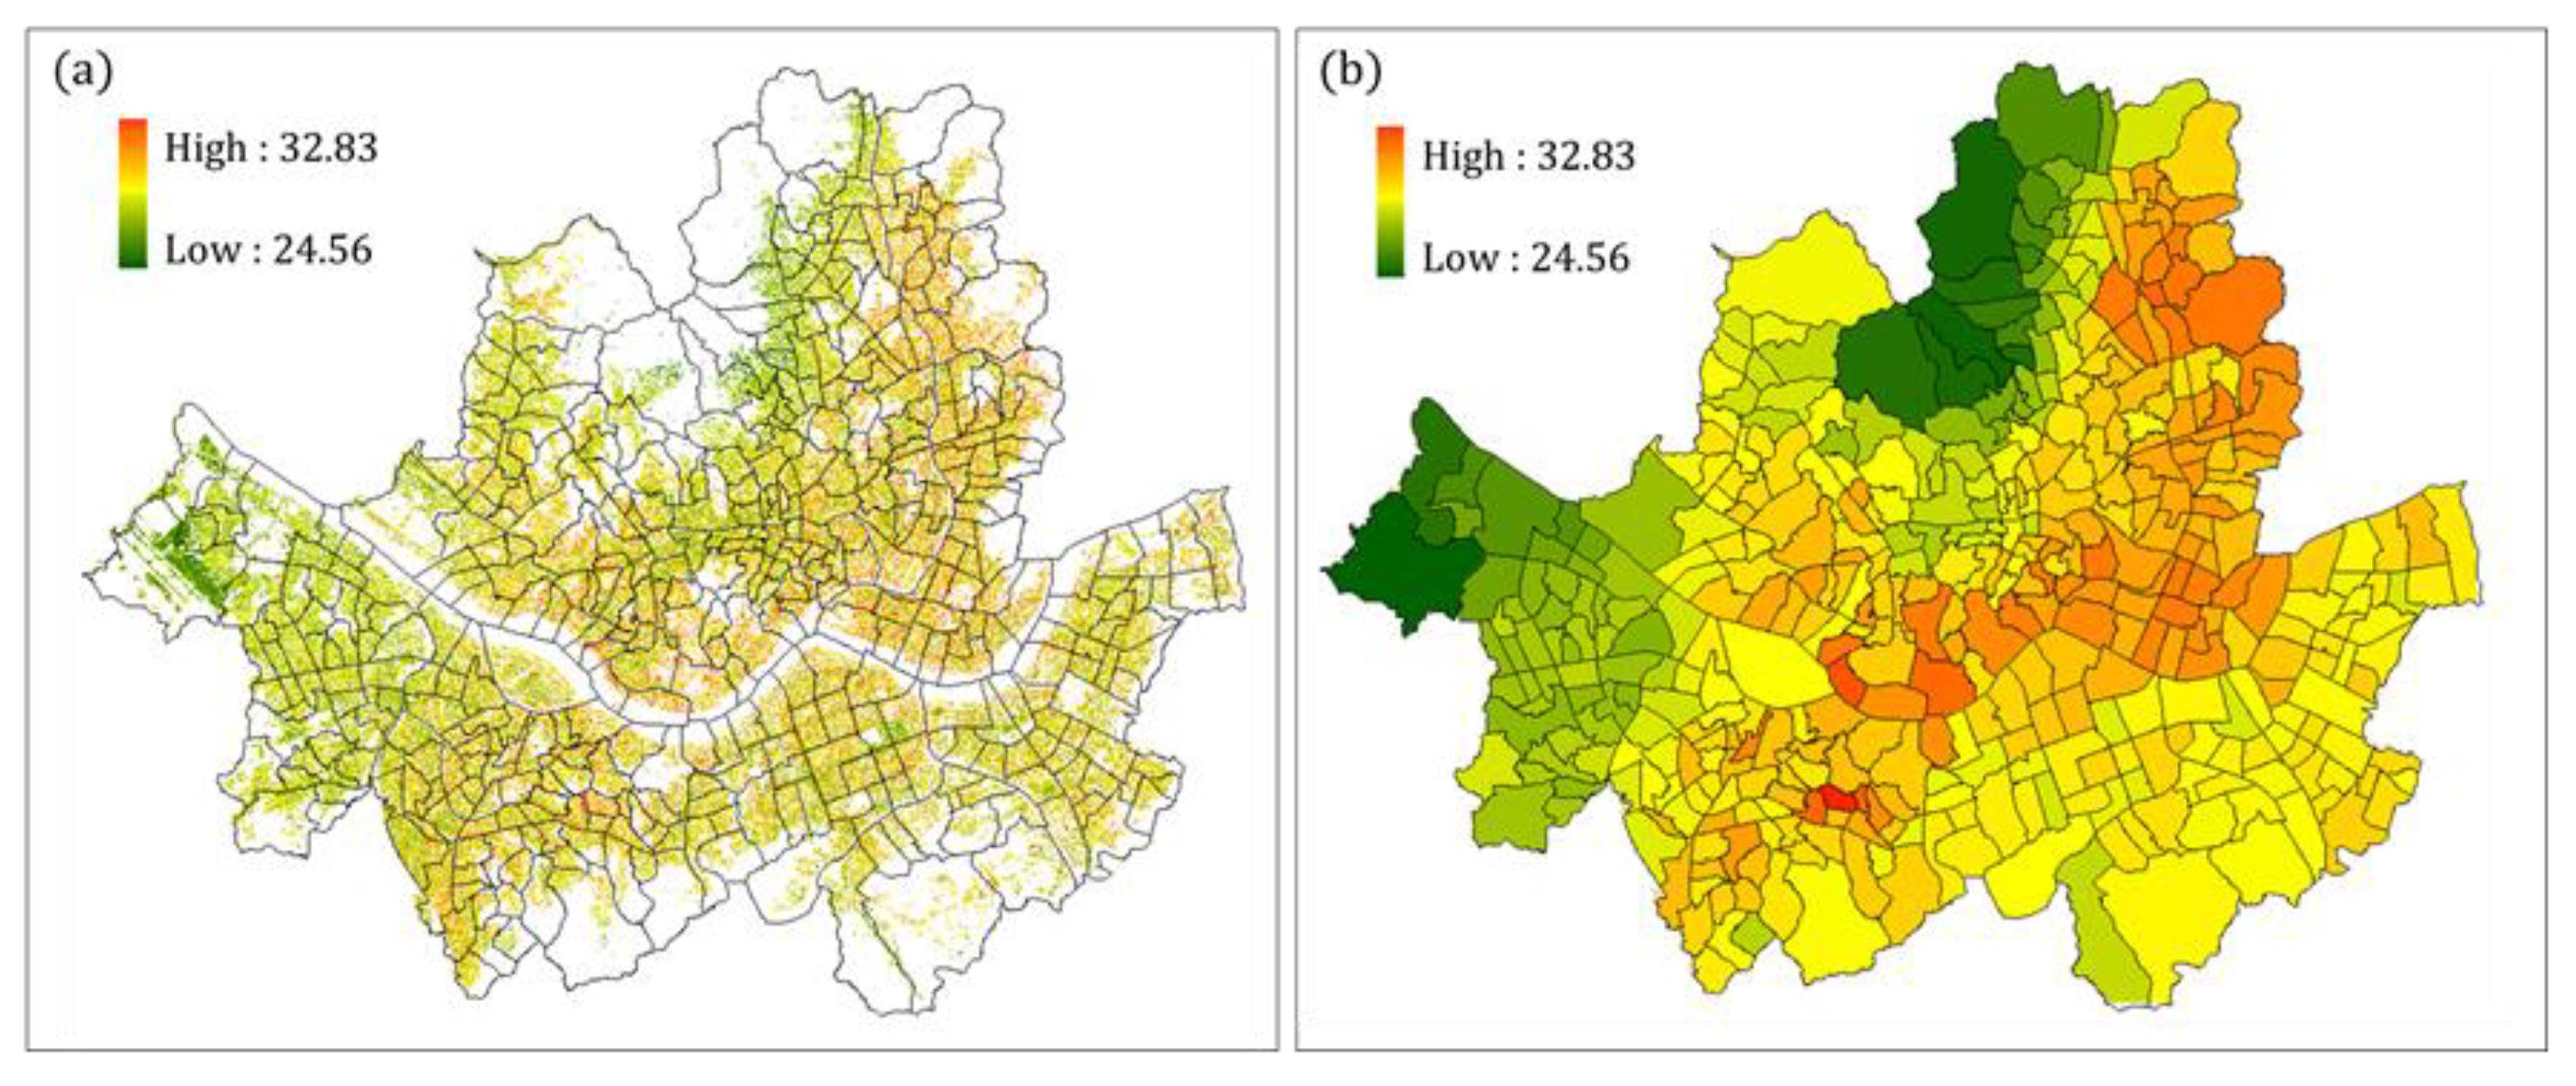
4.3. Heat Exposure Map for Local Weather Services
5. Conclusions
Author Contributions
Acknowledgments
Conflicts of Interest
References
- Fink, A.H.; Brucher, T.; Kruger, A.; Leckebusch, G.C.; Pinto, J.G.; Ulbrich, U. The 2003 European summer heatwaves and drought—Synoptic diagnosis and impacts. Weather 2004, 59, 209–215. [Google Scholar] [CrossRef] [Green Version]
- Ebi, K.L.; Teisberg, T.J.; Kalkstein, L.S.; Robinson, L.; Weiher, R.F. Heat watch/warning systems save lives: Estimated costs and benefits for Philadelphia 1995–1998. Bull. Am. Meteorol. Soc. 2004, 85, 1067–1073. [Google Scholar] [CrossRef]
- Kalkstein, L.S.; Greene, J.S.; Mills, D.; Perrin, A.; Samenow, J.; Cohen, J.-C. Analog European heat waves for U.S. cities to analyze impacts on heat-related mortality. Bull. Am. Meteorol. Soc. 2008, 89, 75–86. [Google Scholar] [CrossRef]
- Greene, J.S.; Kalkstein, L.S.; Kim, K.R.; Choi, Y.J.; Lee, D.G. The application of the European heat wave of 2003 to Korean cities to analyze impacts on heat-related mortality. Int. J. Biometeorol. 2016, 60, 231–243. [Google Scholar] [CrossRef] [PubMed]
- Masato, G.; Bone, A.; Charlton-Perez, A.; Cavany, S.; Neal, R.; Dankers, R. Improving the Health Forecasting Alert System for Cold Weather and Heat-Waves In England: A Proof-of-Concept Using Temperature-Mortality Relationships. PLoS ONE 2015, 10, e0137804. [Google Scholar] [CrossRef] [PubMed]
- Chen, B.; Tang, X. Translating weather forecast into impact-relevant information: Practice of impact-based forecast in weather forecast operation. In Proceedings of the World Weather Open Science Conference, Montréal, QC, Canada, 16–21 August 2014; Available online: https://www.rmets.org/events/world-weather-open-science-conference-2014 (accessed on 28 November 2017).
- Bouchet, V.; Jalkanen, L.; Carmichael, G. Megacities and large urban complexes: Next phase of the GURME project. In Proceedings of the WWOSC 2014 Annual Meeting, Montréal, QC, Canada, 16–21 August 2014. [Google Scholar]
- Lee, C. Urban meteorological networks: An urban climatologists panacea? In Proceedings of the International Conference on Urban Climate, Toulouse, France, 20–24 July 2015; Available online: http://www.meteo.fr/icuc9 (accessed on 28 November 2017).
- Baklanov, A. From urban meteorology, climate and environment research to urban integrated services. In Proceedings of the ICUC Annual Meeting, Toulouse, France, 20–24 July 2015. [Google Scholar]
- Leroyer, S.; Belair, S.; Abrahamowicz, M.; Spacek, L.; Filion, A.-B. Numerical weather prediction system dedicated to urban comfort and safety during the 2015 Pan-American games in Toronto. In Proceedings of the ICUC Annual Meeting, Toulouse, France, 20–24 July 2015. [Google Scholar]
- Grimmond, C.S.B.; Tan, J.; Fu, X.; Ward, H. Urban Climate Services in China: Current capabilities and future needs. In Proceedings of the ICUC Annual Meeting, Toulouse, France, 20–24 July 2015. [Google Scholar]
- Yi, C.; Kwon, H.G.; Kim, K.R.; An, S.M.; Choi, Y.J.; Scherer, D. Climate information application for improved planning and management of cities. In Proceedings of the ICUC Annual Meeting, Toulouse, France, 20–24 July 2015. [Google Scholar]
- Ronda, R.; Steeneveld, G.-J.; Attema, J.; Heusinkveld, B.; Holtslag, B. Summer in the city: Towards high resolution forecasting of urban weather. In Proceedings of the ICUC Annual Meeting, Toulouse, France, 20–24 July 2015. [Google Scholar]
- IPCC. Summary for Policymakers. Climate Change 2014: Impacts, Adaptation, and Vulnerability; Part A: Global and Sectoral Aspects; Contribution of Working Group II to the Fifth Assessment Report of the Intergovernmental Panel on Climate Change; Cambridge University Press: Cambridge, UK; New York, NY, USA, 2014; pp. 1–32. [Google Scholar]
- Tsangari, H.; Paschalidou, A.; Vardoulakis, S.; Heaviside, C.; Konsoula, Z.; Christou, S.; Georgiou, K.; Ioannou, K.E.; Mesimeris, T.; Kleanthous, S.; et al. Human mortality in Cyprus: The role of temperature and particulate air pollution. Reg. Environ. Chang. 2016, 16, 1905–1913. [Google Scholar] [CrossRef]
- Akbari, H.; Taha, H. The impact of trees and white surfaces on residential heating and cooling energy use in four Canadian cities. Energy 1992, 17, 141–149. [Google Scholar] [CrossRef]
- Institute Meteorological Science of Korea. Report on Advanced Research on Meteorological Sciences: Advanced Research on Industrial Meteorology; National Institute Meteorological Science of Korea: Seoul, Korea, 2009.
- Tran, H.; Uchihama, D.; Ochi, S.; Yasuoka, Y. Assessment with satellite data of the urban heat island effects in Asian mega cities. Int. J. Appl. Earth Obs. Geoinf. 2006, 8, 34–48. [Google Scholar] [CrossRef]
- Narumi, D.; Kondo, A.; Shimoda, Y. Effects of anthropogenic heat release upon the urban climate in a Japanese megacity. Environ. Res. 2009, 109, 421–431. [Google Scholar] [CrossRef] [PubMed]
- Kyselý, J.; Kim, J. Mortality during heat waves in South Korea, 1991 to 2005: How exceptional was the 1994 heat wave. Clim. Res. 2009, 38, 105–116. [Google Scholar] [CrossRef]
- Korea Meteorological Administration. Report on 2016 Abnormal Climate Report; Korea Meteorological Administration: Seoul, Korea, 2016.
- Davis, R.E.; Knappenberger, P.C.; Novicoff, W.M.; Michaels, P.J. Decadal changes in summer mortality in US cities. Int. J. Biometeorol. 2003, 47, 166–175. [Google Scholar] [PubMed]
- Hajat, S.; Vardoulakis, S.; Heaviside, C.; Eggen, B. Climate change effects on human health: Projections of temperature-related mortality for the UK during the 2020s, 2050s and 2080s. J. Epidemiol. Community Health 2014, 68, 641–648. [Google Scholar] [CrossRef] [PubMed]
- Kim, J.; Lee, D.; Kysely, J. A synoptic and climatological comparison of record-breaking heat waves in Korea and Europe. Atmosphere Korea 2008, 18, 355–365. [Google Scholar]
- Kim, J.; Lee, D.; Kysely, J. Characteristics of heat acclimatization for major Korean cities. Atmosphere Korea 2009, 19, 309–318. [Google Scholar]
- Kim, J.; Lee, D.; Park, I.S.; Choi, B.C.; Kim, J.S. Influences of heat waves on daily mortality in South Korea. Atmosphere Korea 2006, 16, 269–278. [Google Scholar]
- Lee, D.; Choi, Y.J.; Kim, K.R.; Byon, J.Y.; Kalkstein, L.S.; Scott, C.S. Development of heat-health warning system based on regional properties between climate and human Health. Clim. Chang. Res. 2010, 1, 109–120. [Google Scholar]
- Lee, D.; Byon, J.Y.; Choi, Y.J.; Kim, K.R.; Kalkstein, L.S. An operational heat-health warning system for Seoul: During the summer of 2008. In Proceedings of the Korea Meteorology Society, Seoul, Korea, 23–24 April 2009. [Google Scholar]
- Yi, C.; Kim, K.R.; An, S.M.; Choi, Y.J.; Holtmann, A.; Jänicke, B.; Fehrenbach, U.; Scherer, D. Estimating spatial patterns of air temperature at building-resolving spatial resolution in Seoul, Korea. Int. J. Climatol. 2016, 36, 533–549. [Google Scholar] [CrossRef]
- Jänicke, B.; Meier, F.; Lindberg, F.; Schubert, S.; Scherer, D. Towards a city-wide analysis of mean radiant temperature at high spatial resolution An example from Berlin, Germany. Urban Clim. 2016, 15, 8398. [Google Scholar] [CrossRef]
- Kim, K.R.; Yi, C.; Lee, J.S.; Meier, F.; Jänicke, B.; Fehrenbach, U.; Scherer, D. BioCAS: Biometeorological Climate impact Assessment System for building-scale impact assessment of heat-stress related mortality. DIE ERDE J. Geogr. Soc. Berlin 2014, 145, 62–79. [Google Scholar]
- Yi, C.; An, S.M.; Kim, K.R.; Kwon, H.G.; Min, J.S. Surface Micro-Climate Analysis Based on Urban Morphological Characteristics: Temperature Deviation Estimation and Evaluation. Atmosphere Korea 2016, 26, 445–459. [Google Scholar] [CrossRef]
- Harlan, S.L.; Brazel, A.J.; Prashad, L.; Stefanov, W.L.; Larsen, L. Neighborhood microclimates and vulnerability to heat stress. Soc. Sci. Med. 2006, 63, 2847–2863. [Google Scholar] [CrossRef] [PubMed]
- Shahmohamadi, P.; Che-Ani, A.I.; Etessam, I.; Maulud, K.N.A.; Tawil, N.M. Healthy environment: The need to mitigate urban heat island effects on human health. Procedia Eng. 2011, 20, 61–70. [Google Scholar] [CrossRef]
- Korea Meteorological Administration. Report on Seoul Incheon Gyeonggi-Do Climate Change Forecast; Korea Meteorological Administration: Seoul, Korea, 2012.
- Stewart, I.D.; Oke, T.R. Local climate zones for urban temperature studies. Bull. Am. Meteorol. Soc. 2012, 93, 1879–1900. [Google Scholar] [CrossRef]
- Korea Meteorological Administration. Numerical Data Application Manual; KMA: Seoul, Korea, 2011; pp. 13–17. ISBN 11-1360395-000252-01.
- Korea Meteorological Administration. Quality Control Manual for National Climate Data; KMA: Seoul, Korea, 2011; p. 44.
- Oh, G.L.; Lee, S.J.; Choi, B.C.; Kim, J.; Kim, K.R.; Choi, S.W.; Lee, B.L. Quality control of agro-meteorological data measured at Suwon Weather Station of Korea Meteorological Administration. Korean J. Agric. For. Meteorol. 2015, 17, 25–34. [Google Scholar] [CrossRef]
- Grimmond, C.S.B.; Roth, M.; Oke, T.R.; Au, Y.C.; Best, M.; Betts, R.; Carmichael, G.; Cleugh, H.; Dabberdt, W.; Emmanuel, R.; et al. Climate and more sustainable cities: Climate information for improved planning and management of cities (producers/capabilities perspective). Procedia Environ. Sci. 2010, 1, 247–274. [Google Scholar] [CrossRef]
- Bechtel, B.; Wiesner, S.; Zakšek, K. Estimation of dense time series of urban air temperatures from multitemporal geostationary satellite data. IEEE J. Sel. Top. Appl. Earth Obs. Remote Sens. 2014. [Google Scholar] [CrossRef]
- Hoffmann, P.; Krueger, O.; Schlünzen, K.H. A statistical model for the urban heat island and its application to a climate change scenario. Int. J. Climatol. 2012, 32, 1238–1248. [Google Scholar] [CrossRef]
- Arnds, D.; Böhner, J.; Bechtel, B. Spatio-temporal variance and meteorological drivers of the urban heat island in a European city. Theor. Appl. Climatol. 2015, 1–19. [Google Scholar] [CrossRef]
- Lantz, B. Machine Learning with R; Packt Publishing Ltd.: Birmingham, UK, 2013. [Google Scholar]
- CRAN Task View: Machine Learning & Statistical Learning. Available online: https://cran.r-project.org/web/views/MachineLearning.html (accessed on 30 January 2018).
- Wu, X.; Kumar, V.; Quinlan, J.R.; Ghosh, J.; Yang, Q.; Motoda, H.; McLachlan, G.J.; Ng, A.; Liu, B.; Philip, S.Y.; et al. Top 10 algorithms in data mining. Knowl. Inf. Syst. 2008, 14, 1–37. [Google Scholar] [CrossRef]
- Yi, C.; Kim, K.R.; Choi, Y.J.; Won, H.Y.; Scherer, D. Nocturnal Surface Cooling and Cold Air Transport Analysis Based on High Density Observation-A Case Study of Eunpyeong New Town in Seoul. J. Korean Assoc. Geogr. Inf. Stud. 2012, 15, 124–137. [Google Scholar] [CrossRef]
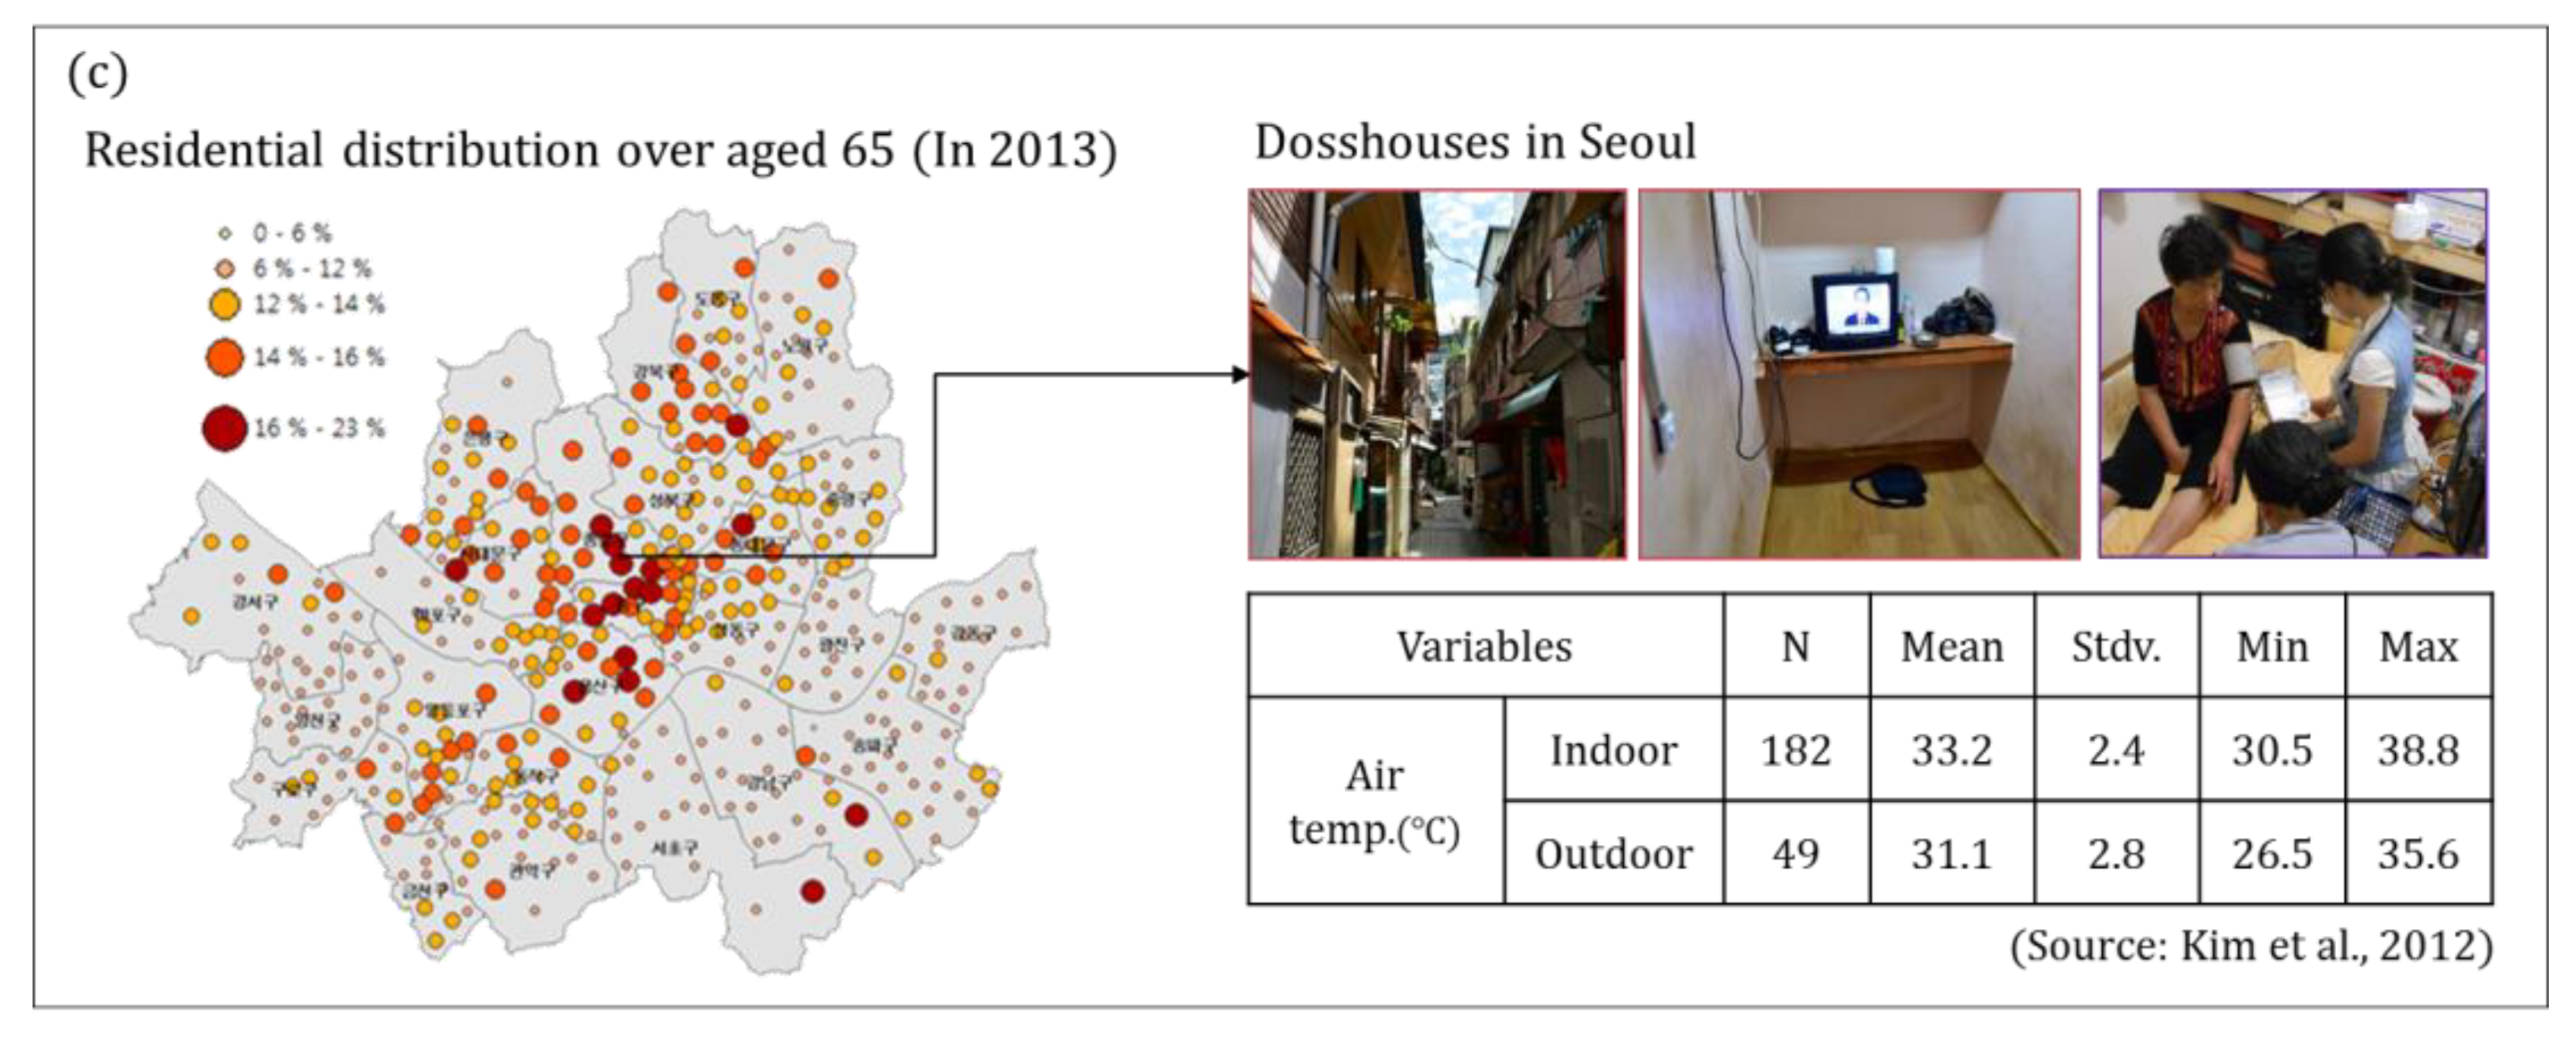
- Kim, Y.M.; Kim, S.; Cheong, H.K.; Ahn, B.; Choi, K. Effects of heat wave on body temperature and blood pressure in the poor and elderly. In Proceedings of the Korean Society of Environmental Health and Toxicology, Seoul, Korea, 10 May 2012. [Google Scholar]


| Class | Description | Ha | % |
|---|---|---|---|
| 110 | Residential area | 8171 | 13.46 |
| 120 | Industrial area | 120 | 0.20 |
| 130 | Commercial area | 4542 | 7.48 |
| 140 | Cultural and recreational area | 570 | 0.94 |
| 150 | Traffic area | 16,342 | 26.92 |
| 160 | Public utility area | 1491 | 2.46 |
| 210 | Rice paddy | 279 | 0.46 |
| 220 | Upland field | 806 | 1.33 |
| 230 | Facility plantation | 243 | 0.40 |
| 240 | Orchard | 43 | 0.07 |
| 250 | Other plantations | 108 | 0.18 |
| 310 | Broadleaf forest | 9817 | 16.17 |
| 320 | Coniferous forest | 2605 | 4.29 |
| 330 | Mixed stand forest | 1883 | 3.10 |
| 410 | Natural grassland | 1158 | 1.91 |
| 420 | Artificial grassland | 5731 | 9.44 |
| 510 | Inland wetland/shore vegetation | 215 | 0.35 |
| 610 | Natural bare soil | 870 | 1.43 |
| 620 | Artificial bare soil | 2405 | 3.96 |
| 710 | Inland water | 3300 | 5.44 |
| Aspect | CSAR | Dzdx | Dzdy |
 |  |  |  |
| Aspect angle (deg) i.e., azimuth of the slope | Complete surface aspect ratios derived from BH | Topographic gradient in the x-direction (m/m) | Topographic gradient in the y-direction (m/m) |
| Building Height | Vegetation Height | Hollow Depth | Slope |
 |  |  |  |
| Building height derived from airborne LiDAR (m) | Vegetation height derived from airborne LiDAR (m) | Hollow depth by building and terrain (m) | Slope angle (deg) |
| BS Area | US Area | TV Area | VS Area |
 |  |  |  |
| Fractional coverage (FC) of Building surface | FC of unvegetated surface | FC of tall vegetated surface | FC of vegetated surface |
| WS | z | Areal Type | BHBS |
 |  |  |  |
| FC of water surface | Sea level (m) | Forms of land cover | Building volume |
| Data | Description | Purpose |
|---|---|---|
| UM LDAPS | Forecasting data from the numerical model | 52 data points corresponding to predicted variables of KMA AWSs for spatial matching: independent variables (JJA 2015) as training data for the BRT model (excluding precipitation days) |
| Grid data: BRT production for spatial distribution | ||
| KMA AWS | Observation data at 52 sites | 52 data points: dependent variables (JJA 2015) as training data for the BRT model (excluding precipitation days) |
| Verification of estimated temperature (JAS 2015) | ||
| SKT AWS | Observation data at 255 sites | Verification of estimated temperature (JAS 2015) (excluding precipitation days) |
| 255 data points | ||
| Urban surface parameters | Surface characteristics data (16 types) from the CAS workbench | 52 data points: independent variables as training data for the BRT model |
| Grid data: BRT production for spatial distribution |
| Condition | Days | RMSE | R2 | ||||
|---|---|---|---|---|---|---|---|
| LDAPS | LM | SVM | LDAPS | LM | SVM | ||
| Threshold temperature of Seoul (above 29.4 °C) | 28 | 1.713 | 1.309 | 1.076 | 0.012 | 0.573 | 0.787 |
| General summer (less than 29.4 °C) | 33 | 1.659 | 1.348 | 1.249 | 0.005 | 0.590 | 0.752 |
| Total | 61 | 1.686 | 1.328 | 1.163 | 0.003 | 0.581 | 0.769 |
| Condition | Days | RMSE (SVM_BRT) | R2 (SVM_BRT) | ||||
|---|---|---|---|---|---|---|---|
| Mean | Min | Max | Mean | Min | Max | ||
| Threshold temperature of Seoul (above 29.4 °C) | 28 | 1.752 | 0.881 | 4.303 | 0.434 | 0.060 | 0.752 |
| General summer (less than 29.4 °C) | 33 | 2.327 | 0.918 | 4.095 | 0.383 | 0 | 1.000 |
| Total | 61 | 2.039 | 1.252 | 3.265 | 0.408 | 0.066 | 0.845 |
© 2018 by the authors. Licensee MDPI, Basel, Switzerland. This article is an open access article distributed under the terms and conditions of the Creative Commons Attribution (CC BY) license (http://creativecommons.org/licenses/by/4.0/).
Share and Cite
Yi, C.; Shin, Y.; Roh, J.-W. Development of an Urban High-Resolution Air Temperature Forecast System for Local Weather Information Services Based on Statistical Downscaling. Atmosphere 2018, 9, 164. https://doi.org/10.3390/atmos9050164
Yi C, Shin Y, Roh J-W. Development of an Urban High-Resolution Air Temperature Forecast System for Local Weather Information Services Based on Statistical Downscaling. Atmosphere. 2018; 9(5):164. https://doi.org/10.3390/atmos9050164
Chicago/Turabian StyleYi, Chaeyeon, Yire Shin, and Joon-Woo Roh. 2018. "Development of an Urban High-Resolution Air Temperature Forecast System for Local Weather Information Services Based on Statistical Downscaling" Atmosphere 9, no. 5: 164. https://doi.org/10.3390/atmos9050164