Article

Advanced Ultraviolet Radiation and Ozone Retrieval for Applications (AURORA): A Project Overview

by
Ugo Cortesi
1,*,
Simone Ceccherini
1,
Samuele Del Bianco
1,
Marco Gai
1,
Cecilia Tirelli
1,
Nicola Zoppetti
1,
Flavio Barbara
1,
Marc Bonazountas
2,
Argyros Argyridis
2,
André Bós
3,
Edo Loenen
3,
Antti Arola
4,
Jukka Kujanpää
5,
Antti Lipponen
4,
William Wandji Nyamsi
4,
Ronald Van der A
6,
Jacob Van Peet
6,
Olaf Tuinder
6,
Vincenzo Farruggia
7,
Andrea Masini
7,
Emilio Simeone
7,
Rossana Dragani
8,
Arno Keppens
9,
Jean-Christopher Lambert
9,
Michel Van Roozendael
9,
Christophe Lerot
9,
Huan Yu
9 and
Koen Verberne
10
add Show full author list remove Hide full author list
1
Istituto di Fisica Applicata Nello Carrara del Consiglio Nazionale delle Ricerche (IFAC-CNR), I-50019 Sesto Fiorentino, Italy
2
Epsilon International SA, Marousi GR-15125, Greece
3
Science and Technology B.V., Delft 2616 LR, The Netherlands
4
Finnish Meteorological Institute, 70211 Kuopio, Finland
5
Finnish Meteorological Institute, 00101 Helsinki, Finland
6
Royal Netherlands Meteorological Institute, Debilt 3731 GA, The Netherlands
7
Flyby, S.r.l., I-57128 Livorno, Italy
8
European Centre for Medium-range Weather Forecasts (ECMWF), Reading RG2 9AX, UK
9
Royal Belgian Institute for Space Aeronomy (BIRA-IASB), B-1180 Brussels, Belgium
10
Datacraft, Rotterdam 3025 AE, The Netherlands
*
Author to whom correspondence should be addressed.
Atmosphere 2018, 9(11), 454; https://doi.org/10.3390/atmos9110454
Submission received: 31 July 2018 / Revised: 5 November 2018 / Accepted: 6 November 2018 / Published: 18 November 2018
(This article belongs to the Special Issue Atmospheric Composition Modeling)

Abstract

:
With the launch of the Sentinel-5 Precursor (S-5P, lifted-off on 13 October 2017), Sentinel-4 (S-4) and Sentinel-5 (S-5)(from 2021 and 2023 onwards, respectively) operational missions of the ESA/EU Copernicus program, a massive amount of atmospheric composition data with unprecedented quality will become available from geostationary (GEO) and low Earth orbit (LEO) observations. Enhanced observational capabilities are expected to foster deeper insight than ever before on key issues relevant for air quality, stratospheric ozone, solar radiation, and climate. A major potential strength of the Sentinel observations lies in the exploitation of complementary information that originates from simultaneous and independent satellite measurements of the same air mass. The core purpose of the AURORA (Advanced Ultraviolet Radiation and Ozone Retrieval for Applications) project is to investigate this exploitation from a novel approach for merging data acquired in different spectral regions from on board the GEO and LEO platforms. A data processing chain is implemented and tested on synthetic observations. A new data algorithm combines the ultraviolet, visible and thermal infrared ozone products into S-4 and S-5(P) fused profiles. These fused products are then ingested into state-of-the-art data assimilation systems to obtain a unique ozone profile in analyses and forecasts mode. A comparative evaluation and validation of fused products assimilation versus the assimilation of the operational products will seek to demonstrate the improvements achieved by the proposed approach. This contribution provides a first general overview of the project, and discusses both the challenges of developing a technological infrastructure for implementing the AURORA concept, and the potential for applications of AURORA derived products, such as tropospheric ozone and UV surface radiation, in sectors such as air quality monitoring and health.

1. Introduction

In the past decade, data synergy strategies have been used for the generation of operational products from space-borne missions sensing the Earth’s atmosphere (e.g., [1,2] and references therein). Nonetheless, they have not yet reached the level of maturity needed for extensive applications and their products are normally classified as research products. This tendency was also confirmed in the context of the atmospheric Sentinel operational missions of the ESA/EU Copernicus program to be launched from 2023 onwards. Sentinel-4 (S-4) will perform observations from the geostationary orbit of the MTG-S (Meteosat Third Generation-Sounder) satellite with first priority on monitoring air quality over Europe. Sentinel-5 (S-5) will operate from the polar sun-synchronous low Earth orbit (LEO) of MetOp-SG (Meteorological Operational satellite—Second Generation) focusing on air quality, stratospheric ozone, solar radiation and climate.
The atmospheric Sentinel missions will rely on:
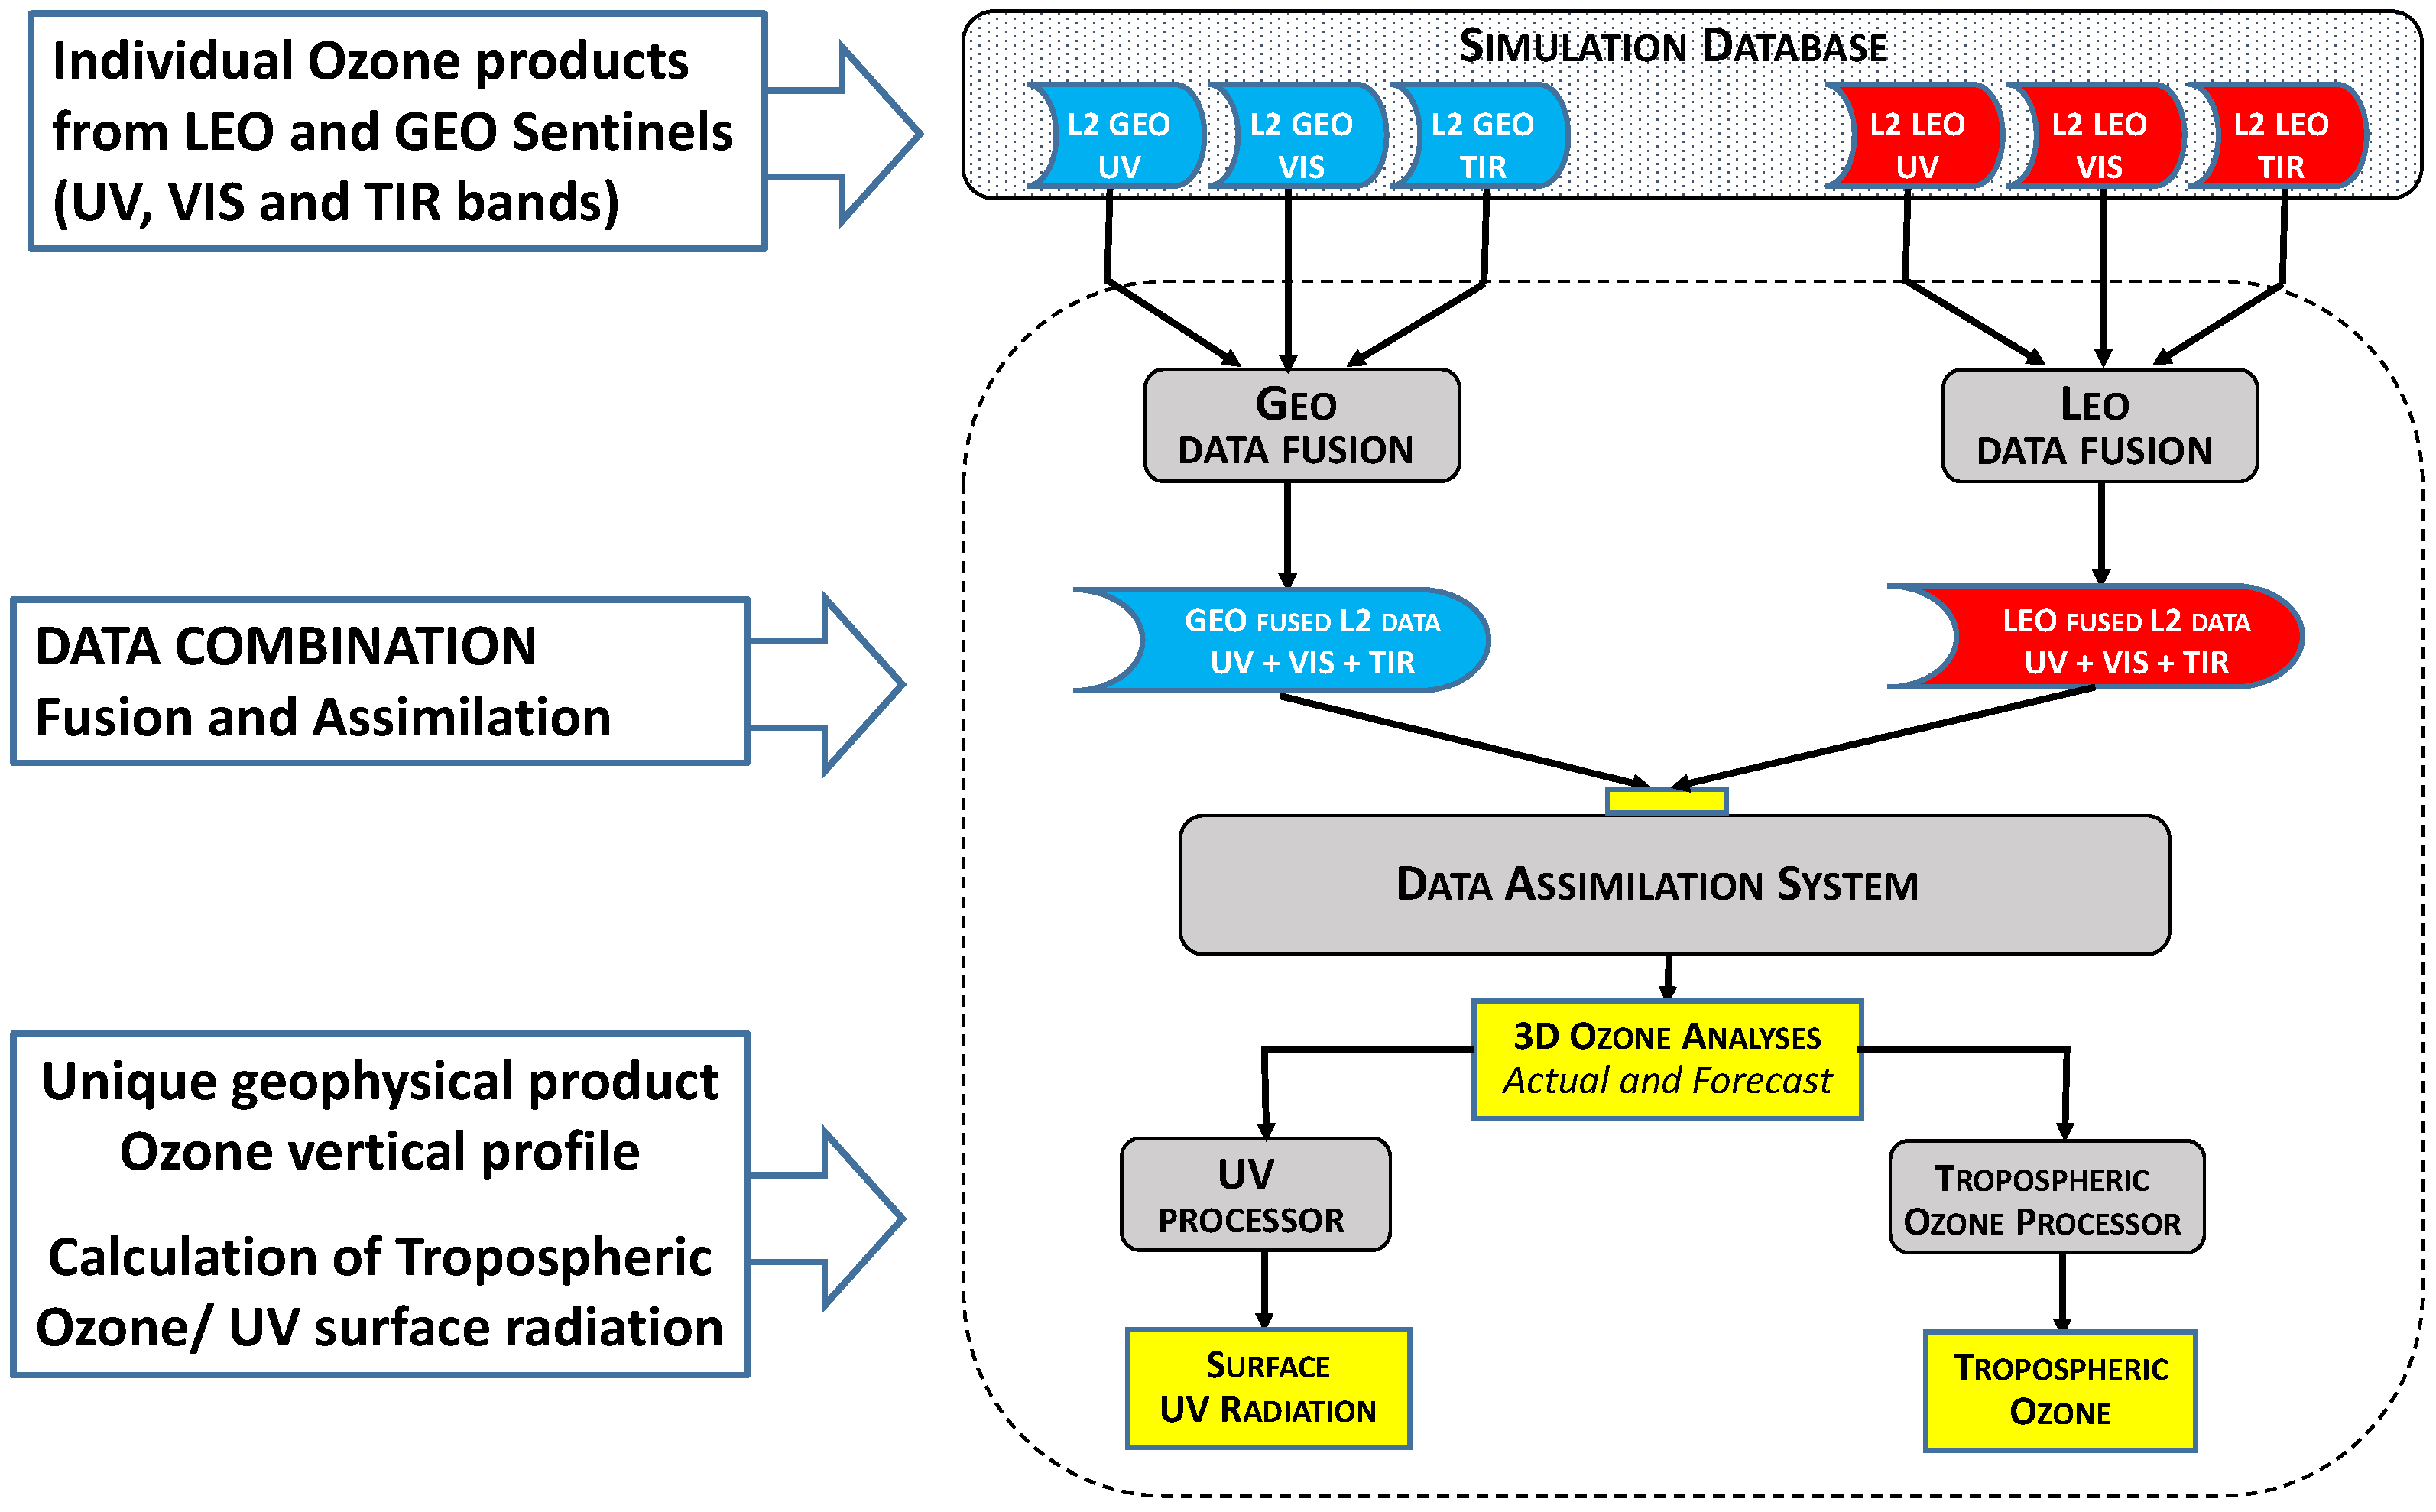
  • measurements acquired at wavelengths from the ultraviolet to the reflected infrared by the UVN (Ultraviolet-Visible-Near Infrared) spectrometer of S-4, and by the UVNS (Ultraviolet-Visible-Near Infrared Shortwave) spectrometer of S-5; and
  • data in the spectral range of the emitted infrared made available by the EUMETSAT IRS (Infrared Sounder) and by IASI-NG (Infrared Atmospheric Sounding Interferometer—Next Generation) also part of the MTG-S and of the MetOp-SG payloads, respectively.
With the aim of minimizing the data gap between on-going LEO missions and the S-5 (currently planned for launch in 2023), the S-5 Precursor (S-5P) mission was launched on 13 October 2017. It carries the TROPOMI (Tropospheric ozone Monitoring Instrument)instrument, which has an observing capability that spans the ultraviolet to shortwave infrared spectral band.
Although not included as part of the operational processing of the atmospheric Sentinel, synergistic approaches to data analysis deserve high priority in the investigation of scientific and technological advancements required to achieve the above mentioned upgrading from research to operational algorithms and systems. This challenge is taken up by the three year project AURORA (Advanced Ultraviolet Radiation and ozone Retrieval for Applications) funded by the European Commission under Call Space, EO-2-2015: Stimulating wider research use of Copernicus Sentinel Data of the Horizon 2020 Framework Program. The idea at the core of the project is to investigate the potential of the joint use of an innovative data fusion method and state-of-the-art data assimilation systems to generate advanced quality geophysical products, merging the complementary and redundant information content of multiple independent measurements of the same air mass into a single outcome (Figure 1). The focus of the study in terms of atmospheric target is the vertical profile of ozone. The motivation for this choice is twofold. On the one hand, ozone is among the minor constituents of the terrestrial atmosphere that benefit greatly from synergistic data processing, as demonstrated by previous studies [3,4,5,6]. On the other hand, accurate knowledge of the vertical distribution of ozone from the surface to the top of the atmosphere is of immediate relevance for all primary objectives of the atmospheric Sentinel measurements: from air quality, to climate, to stratospheric ozone and to solar radiation.

2. Objectives and Scope

The overarching objective of the AURORA project is to reduce the complexity of managing the high data volume provided by the atmospheric Sentinels of the Copernicus program and increase product quality with respect to the operational outcome of individual instruments. The main priorities and overall scope of the work plan build upon three pillars: science, technology and application. These pillars contribute to an end-to-end procedure that, starting from measurements acquired in different spectral regions by the (GEO) S-4 and the (LEO) S-5P and S-5 instruments, generates a unique geophysical ozone product, in both analysis and forecast modes, from the assimilation of fused data.
As can be anticipated from reading Section 1, AURORA aims to accelerate and capitalize on the transition of synergistic data products from research to operation. The focus is on the vertical distribution of atmospheric ozone and, in particular, on the determination of partial columns of tropospheric ozone, the total ozone column and the UV surface radiation. Demonstrating the applicability of the AURORA concept to ozone is, however, a predecessor to potential exploitation to other atmospheric targets and to a wider set of advanced products.
The activity for the design, development and implementation of a prototype processing system capable of working with synthetic data in conditions that replicate as closely as possible those of the operational environment is currently on-going. The intent is to make ready an integrated assembly of procedures and modules for synergistic exploitation of S-4, S-5p and S-5 operational data once they become available. At the same time, the system is developed to maximize compatibility with existing or planned services such as CAMS (Copernicus Atmospheric Monitoring Service) and C3S (Copernicus Climate Change Service) to potentially foster a future integration of sub-systems created and tested in AURORA into these services.
Finally, one of the central drivers of AURORA is the pressing need of a growing number of end-users—from scientific to commercial communities—to have rapid and comprehensive access to the information contained in massive amount of spaceborne measurements of the same target on the part of multiple independent datasets. For these reasons, another specific objective is to make all the available information accessible in the most user-friendly way possible by means of software interfaces constructed for each source of data, a database with geographical extension (geo-database), web-services with innovative visualization tools, and automatic data access. The application-oriented goal of the activity is the development of two downstream services that start from requirements expressed by identified potential customers and reach a pre-market version at the end of the project [8]).

3. Atmospheric Scenarios and Data Simulation

Simulations of various ozone products (total column and profiles) from the future S-4 and S-5 instruments are carried out using retrievals applied to synthetic spectra generated in the UV, VIS and TIR (abbreviations not defined in the text can be found in the glossary at the end of the article) spectral ranges for selected atmospheric scenarios defining the state of the atmosphere, providing information on meteorology, atmospheric composition and surface albedo. Two important considerations have been made for the atmospheric scenarios:
  • They have been produced with a system that is substantially different from the one used for the assimilation of simulated data.
  • They need to provide a realistic characterization of the state of the atmosphere.
The MERRA2 reanalysis [9] was selected as the most complete data source for the required fields. In addition, the ozone climatology of McPeters and Labow [10] was selected as a priori in the different retrieval algorithms to avoid a regularization in the direction of the true atmospheric state.
Geo-locations, observation geometry angles (e.g., solar zenith angle) and observation times are generated for the period 1 April–31 July 2012 for both the S-4 (geostationary coverage of Europe with a revisit time of 1 h) and S-5 (global coverage from polar-orbit with a revisit time of one day). To be able to develop the whole data chain within the project duration, the pragmatic decision of limiting the amount of considered pixels had to be taken with a view of devoting attention to this particular aspect in follow-on projects. For this reason, and irrespective of the spectral range, we sampled 1 in every 10 S-4 scan lines, of which we selected 1 in every 10 pixels. In the case of S-5, different selection criteria were used in the three spectral ranges. For TIR, we sampled 1 in every 5 scan lines and 1 in every 4 pixels; for VIS, we sampled 1 in every 7 scan lines and 1 in every 7 pixels; and for UV, all pixels were simulated. Furthermore, only clear-sky conditions (defined as the pixels with a cloud fraction ≤1%, according to MERRA2 reanalysis data) were considered.
The TIR simulator uses an optimal estimation retrieval approach in the wavelength range 1030–1080 nm. It uses the line-by-line radiative transfer model (RTM) KLIMA [11], and a dedicated model to simulate the cloud and aerosol effects [12,13,14]. Since the aerosol coefficients given by the MERRA2 reanalysis are given for the visual range, they are converted for use in the TIR range. The TIR simulator’s output contains ozone profiles, covariance matrices and averaging kernels required for the assimilation.
The VIS simulator performs a spectral fit in the VIS wavelength range using a DOAS approach [15]. The fit of ozone slant columns is performed with the QDOAS software, a multi-purpose DOAS analysis software developed at BIRA-IASB. Slant columns are then converted into total columns with air mass factors computed with the linearized discrete ordinate radiative transfer scattering code (LIDORT, [16]). The VIS-simulator’s output consists of total ozone columns, their associated uncertainty and averaging kernels.
The UV simulator uses the KNMI DISAMAR (Determining Instrument Specifications and Analyzing Methods for Atmospheric Retrieval) [17] package, based on the optimal estimation approach [18]. The RTM is the Layer Based Orders of Scattering (LABOS) algorithm which is a variant of the adding method [19]. The small effect of aerosols [20] is ignored, and cloud-free scenes are assumed for both S-4 and S-5. The output of the UV simulator contains ozone profiles, covariance matrices and averaging kernels.

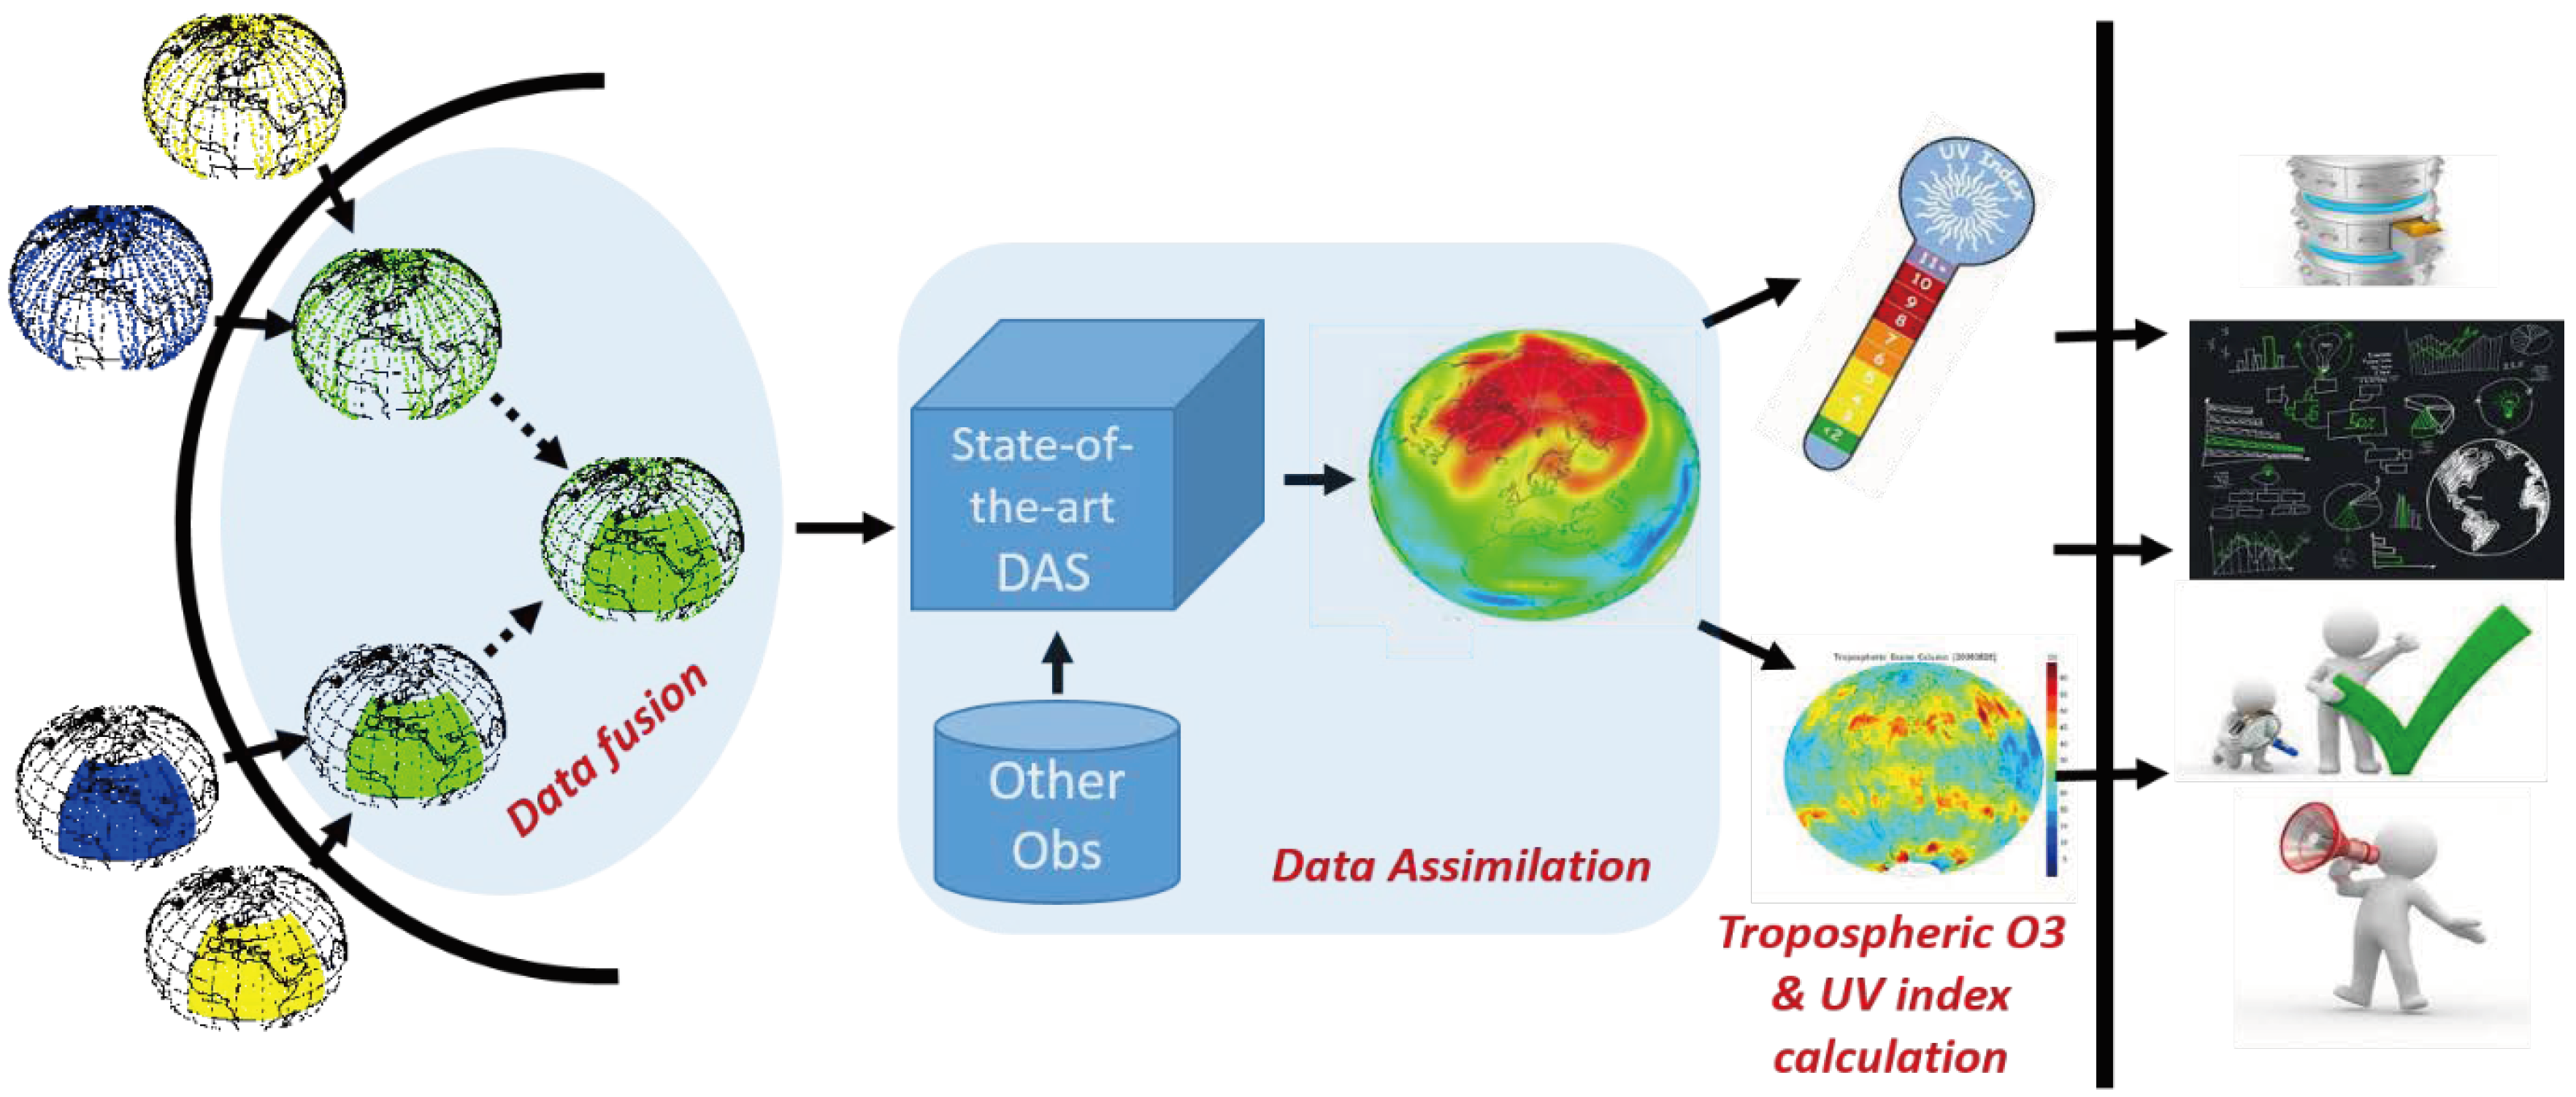
4. AURORA Data Processing Chain

A sequential chain was set-up to produce the AURORA outputs (tropospheric O 3 and surface UV radiation products, i.e., UV Index and UVA surface irradiances) starting from the S-4 and S-5 (simulated) ozone data retrieved in different spectral ranges (Section 3). The components of this chain include data fusion, data assimilation and forecasting, and additional post-processing for the calculation of the AURORA outputs (Figure 2).
Data Fusion (DF) is an a posteriori method to combine observations of the same geophysical parameter retrieved from measurements acquired by different instruments into a single estimate. The aim is to exploit the information content of the measurements to generate a comprehensive, concise, and—compared to individual retrievals—more accurate description of the given parameter state [21]. Traditionally, this is achieved via simultaneous retrievals. Compared to the latter, DF methods are simpler because they do not require the implementation of a forward model, but they can lead to information loss [22]. The method applied in AURORA is the Complete DF (CDF, [23]) for atmospheric vertical profiles. CDF limits the loss of information by accounting for both the retrieval errors and the sensitivity of the retrieved profiles to the true profile, described by the averaging kernels. As part of the AURORA studies, a generalized approach was developed to extend the applicability of the CDF method to the fusion of products not referring to the same true values and represented on different vertical grids, i.e., in presence of coincidence and interpolation errors [24]. Consequently, in the AURORA data processing chain, the generalized-CDF solution, fused O3 product, is assimilated in state-of-the-art Data Assimilation Systems (DASs) to provide accurate ozone analyses and forecasts.
Two DASs are used: the ECMWF IFS and the KNMI TM5DAM. These two DASs serve major stakeholders in the user community, thus facilitating the AURORA outreach activities.
The IFS is a comprehensive Earth-system model to simulate the atmospheric dynamics and the physical processes that occur in the Earth [25,26]. Observations, including those for ozone, are assimilated in 12-hourly time windows with a four-dimensional variational data assimilation scheme [27] formulated in terms of increments (e.g., [28]). Ozone is a prognostic variable in the IFS [29]. A scheme [30] is used to parameterize the homogeneous ozone chemistry with an additional term based on chlorine activation that accounts for the heterogeneous ozone loss (e.g., [31]).
The IFS configuration used in AURORA, and operational at the time dedicated developments for its experimentation started, does not use the prognostic ozone interactively in the radiation scheme [32]. The latter relies on an updated 2D ozone climatology [33] generated from the CAMS Interim reanalysis [34]. The assimilation of ozone retrievals in IFS is performed assuming that the observation operator, which transforms the model state in an observation equivalent, can be approximated as a box-car function (in practice, for any given observed vertical layer, the used function is zero everywhere except over the layer it refers to, where it is equal to one). As part of the AURORA project, the ozone observation operator will be improved to make use of the observation averaging kernels. Furthermore, the ozone observation vertical correlations, which are neglected in the operational IFS, will also be included. An ozone variational bias correction (VarBC; [35]) is available in the IFS to correct for the systematic biases in the ozone data, and anchored in the operational system to SBUV ozone profiles. However, VarBC will not be used in AURORA as its experimentation will use only simulated data, for which it is not trivial to identify a suitable anchor.
IFS runs in two configurations. The first configuration is similar to that used to produce for the ECMWF weather forecasts and its climate reanalyses (http://climate.copernicus.eu/). The latter will be referred to as the NWP configuration. The second one benefits from an enhanced tropospheric chemistry and was developed under several EU-funded projects (the GEMS and MACC series, e.g., [36,37] and predecessor) aiming at building an operational capability to monitor the atmosphere (http://atmosphere.copernicus.eu/). In particular, as part of GEMS and MACC, the IFS was extended to forecast and assimilate reactive trace gases such as tropospheric ozone [38,39], CO2 and CH4 [26,40], and aerosols [41,42]. The latter is referred to as the CAMS configuration.
Some differences between the ozone analyses in the two configurations exist and are discussed in [31]. Those differences refer mostly to the use of ozone observations, and on the tropospheric ozone that relies on a full chemistry system for the CAMS configuration while the stratospheric ozone model [30] is also extended and applied to the troposphere. The TM5DAM is based on the TM5 [43,44], a global chemistry-transport model that simulates the concentrations of atmospheric trace gases including GHG, such as carbon dioxide and methane, chemically active species (e.g., O3), and aerosols. For computational considerations, a simplified configuration, in which only O3 and its variance are modeled as tracers, is run. In this, the stratospheric ozone chemistry is parameterized according to version 2.1 of the the scheme described by Cariolle and Teyssedre [30] while the tropospheric ozone is nudged towards the climatology described by Fortuin and Kelder [45]. The ECMWF operational meteorological fields provide the dynamical forcing for the model. Ozone profiles are assimilated using a sequential Kalman filter [46]. An improved version of the assimilation algorithm has been tested to assimilate simultaneously ozone profiles from GOME-2 and OMI Two experiments are envisaged with both DASs, one using the fused products and a control experiment that assimilates the standard Level 2 O3 retrievals. The potential advantage of assimilating the former over the latter is in the exploitation of the additional information that DF technique can preserve from the synergistic combination of standard retrievals. The output of the DASs consists of analysis and forecast fields (up to five days) of ozone total columns and profiles. These analyses and forecasts are then processed to derive tropospheric O3 data and UV radiation at the surface.
The integration of an ozone profile from surface to tropopause, required to compute the tropospheric O3 products, is mathematically straightforward. However, inaccuracies can derive from secondary tropopauses, pressure-to-altitude conversions, and the method used to identify the tropopause. AURORA uses the WMO lapse-rate tropopause method, which requires a sufficiently fine-gridded vertical temperature profile of the order of 1 km [47,48]. The algorithm benefits from the development performed within the ESA funded O3-CCI (http://cci.esa.int/). The outputs are analyses and forecasts of tropospheric ozone columns and profiles with uncertainty estimates, and the tropopause altitude. The AURORA surface UV radiation products consist of local noon time UV index, UVB and UVA surface irradiance provided in both clear-sky and cloudy conditions. The UV processor is based on the one developed for the OMI and O3M SAF (http://o3msaf.fmi.fi/,nowAC-SAF) satellite UV-algorithms (e.g., for GOME-2). It uses information on surface albedo, aerosol properties at UV wavelengths, and ozone. The products in cloudy conditions require additional information on cloud attenuation. This is provided by satellite VIS imagery on board of geostationary satellites (such as Meteosat Second Generation).
The Data Processing Chain is integrated in the technological infrastructure of AURORA.
The result of the integration is a Prototype for Data Processing (PDP) allowing a dynamic use of the DPC in order to emulate as closely as possible an “operational” condition.
PDP follows a distributed approach:
  • all the data related to the processing (simulated Level 2, intermediate and final products) are stored in a centralized database in cloud (GEO-DB);
  • each processing tool runs on partner premises and communicates with the database to read input data and upload products; and
  • the elaboration is supervised by a task scheduler that manages and controls the execution of distributed processing.
At the current stage of the project, the tools are developed and tested both in terms of scientific analysis and communication with the GEO-DB. Only data-fusion and VMR-to-column converter are fully integrated in the prototype; the integration of TM5, UV-processing and tropospheriocO3-tools are in progress. A preliminary experiment for the dynamic use of the prototype was conducted, to evaluate the performance of the prototype in executing the whole processing of the AURORA simulated L2 data. Results of the preliminary experiment:
  • Download L2 data from GEO-DB takes 2.5 s per orbit (average);
  • Fusion + VMR to column conversion + upload results to GEO-DB;
  • The full processing of one day of L2 data takes about 20 min.
    Note that the full processing in the condition of this preliminary experiment consists of:
    -
    complete upload to GEO-DB of all L2 simulated orbits of the day;
    -
    complete Fusion+conversion process + upload fused data to GEO-DB; and
    -
    only data exchange for assimilation, tropospheric O3 calculation and UV radiation products calculation.

5. Preliminary Results of Data Fusion

The fusion of the L2 simulated Sentinels 4 and 5 measurements has already been performed and preliminary analysis of the fused data clearly shows the quality improvement in the fused data with respect to the L2 data. The differences between the fused profiles and the true profiles are on average comparable or smaller than the differences between the profiles retrieved from the L2 measurements and the true profiles, which indicates that the fusion is able to correctly merge the information coming from the different measurements. The increase in information of the fused products with respect to the L2 products is highlighted by a decrease in the errors and an increase in the number of degrees of freedom. As an example that quantifies the information gain obtained with the data fusion, in Table 1, we report the average number of degrees of freedom of the L2 products and of the fused products for the simulated GEO measurements during the first week of April 2012.
We can see that on average the fused profiles have 0.82 degrees of freedom more than the TIR profiles, 2.31 degrees of freedom more than the UV profiles and 4.75 degrees of freedom more than the VIS profiles.
An important advantage in the use of fused data instead of the L2 data is the reduction of the profiles to be assimilated. This reduction is a factor 3 in the case of fusion of GEO-GEO measurements, a factor 2.2 in the case of fusion of LEO-LEO measurements and a factor 2.5 in the case of fusion of GEO-LEO measurements. A complete and exhaustive analysis of the quality of the fused products obtained in the AURORA project will be reported in a separated paper.

6. Data Handling and Visualization

One of the AURORA’s challenges is the handling of the big amount of data acquired from different satellite and non-satellite sources, i.e., the MERRA2 fields, all the intermediate and final products, and the independent data for validation. These datasets should be rapidly acquired, harmonized and stored in a geospatial database (geo-database) designed to manage big data efficiently and provide quick access for both the project’s internal purposes (e.g., data processing part of the project, by the two AURORA applications, for the validation) and external usage.
The data handling needs to account for different aspects (e.g., the way data can be organized, stored, queried, and exploited by other services, or how datasets from different sources can be integrated) to determine a set of rules to access all datasets in a common way.
A Global System Architecture that takes into account the need to efficiently address the big data challenges (data acquisition and storage, data processing and remote data access) is under development. With this in mind, a set of specifications (e.g., on functionality, performance, interface, environment, etc.) for the AURORA system and related services have been defined and documented. This technological infrastructure supports acquisition, simulation, processing, archiving activities within the project, and includes three main architectural components: a geo-database, and two web interfaces, namely inner layer web-service and outer layer web-service.
The geo-database contains all data used or produced in AURORA. The inner layer web-service is the entry-point for adding/reading data from the geo-database. It supports the data processing chain and provides a quick access to the data stored into the geo-database. The outer layer web-service is used to retrieve final products from the geo-database that can be either presented in the output visualization tool (dashboard) or delivered to users.
In the design and development of the geo-database, attention was paid to comply with the requirements on efficient data acquisition and exchange that would be needed to ensure that aspects developed and tested during the project are considered for future integration in existing operational services (such as CAMS, C3S, etc.).
The design of the AURORA web service follows the classical multi-tier (layer) system. In this, each layer interacts with the others through a set of messages written in a standard format. A Web Map Service, based on 3D geo-browsing technologies, and integrated with computational and visual techniques, connects the geo-spatial data, stored in CF-compliant NetCDF files to the inner layer’s server.

7. Performance Assessment and Data Validation

The Committee on Earth Observation Satellites (GEO-CEOS) and its Quality Assurance framework for Earth Observation (QA4EO) [49] recommend that all Copernicus data and derived products are associated with a fully traceable set of quality indicators (QI). These QI should enable the evaluation of the fitness for purpose with respect to the user requirements. With respect to the AURORA outputs, a distinction is made between scientific requirements in line with community-practice, and more ambitious and application-oriented exploitation requirements [50]. The science-driven process that produces the QI and verifies their compliance with the user requirements is denoted as data validation. QI traceability is guaranteed by both a comprehensive documentation of their definition and a performance assessment (PA) of the full data processing chain.
The PA of the AURORA processing chain is an internal consistency evaluation of all the AURORA products, including those from intermediate steps, e.g., the L2 retrieval simulations in the three spectral ranges, the fused products, and the analyses and forecasts produced by the DASs. At each stage of the processing chain, the PA consists of comparisons of the products from the considered stage with both the available ozone fields from previous steps (see Table 2) and the “true” state, which is directly obtained from the atmospheric scenarios. These comparisons are quantified using either the mean or median and spread of (relative) differences between subsequent data stages and by the propagation of uncertainty contributions by means of the retrieval, fusion and assimilation procedures.
The PA additionally ascertains whether
  • the full prototype data processor respects all requirements in terms of sequence of operations, process synchronization, and execution time;
  • the intermediate and final data products are identical to the products computed using standalone tools; and
  • the geo-database, web service for queries, and data transfer respect the project requirements.
Data validation of the intermediate and final ozone products are based on comparisons with independent real data that represent the geophysical reality. Quality indicators are therefore based on
  • the estimation of the bias and spread of the data as compared to Fiducial Reference Measurements (FRMs, see Table 2);
  • the identification of the temporal and spatial domains over which the bias and spread estimates are valid;
  • the comparison with ex-ante uncertainty estimates taking into account sampling and smoothing difference errors [51]; and
  • the assessment of the dependence of the bias and spread estimates on parameters such as time, latitude, solar zenith angle, atmospheric temperature, fractional cloud cover, etc.
Where applicable, diagnostics related to the information content of the data (e.g., vertical resolution, altitude registration error and vertical sensitivity) have been studied using retrieval-related vertical averaging kernels [52]. The ozone FRMs consist of ozonesonde and lidar measurements at about 150 ground stations around the globe that are collected in the NDACC, SHADOZ, and GAW network databases. Considering measurement coincidences within 100 km and 3 h, 29 stations with quality-checked FRMs are available during the April–July 2012 period. The UV irradiance validation has become relatively standardized during the past two decades [53,54]. It normally makes use of ground-based spectral measurements, but broadband data also are considered. The UV FRM are provided by five instrument networks, namely the NOAA-EPA Brewer Spectrophotometer UV and ozone Network, the COST-713 UV Index Database, the European UV Database, the National Science Foundation UV database, and (optionally) the Public Health England network. Using 20 km and 1 h collocations, these networks provide useful reference data at about 40 ground-based stations distributed over Europe, the US, and the Antarctic. As the generation of surface UV data products from vertical ozone profiles is based on radiative transfer models, the related quality indicators are determined by the accuracy of UV-affecting parameters such as ozone, cloud parameters, snow coverage and aerosol optical depth. For several FRM sites, ancillary measurements of these parameters are available and included in the analysis.

8. Innovation and Exploitation

The focus of the applications for AURORA data products centers on services for the public health sector. Two services are considered. The first one uses the AURORA data products in air quality applications relevant for diseases such as asthma and Chronic Obstructive Pulmonary Disease (COPD). According to the World Health Organization, it is estimated that there are about 235 million asthma patients and 64 million (in 2004) COPD patients worldwide (e.g., [55,56]).
The second service uses the AURORA data products to infer UV radiation levels. UV radiation is associated with non-melanoma skin cancers and malignant melanoma [57]. It is difficult to determine trends in non-melanoma skin cancer, due to limited registration of occurrences of this disease. It is estimated that there are between 2 and 3 million non-melanoma skin cancers cases worldwide annually [58] and the trend is on the increase. For instance, the annual increase rate registered in the United States is about 4% [58].
The monitoring capabilities of UV radiation levels and air quality benefit from enhanced atmospheric satellite data, such as AURORA-like data products, with consequences in different areas of the health sector. Here, the expression products refer to data products resulting from a processing chain that combines high resolution remotely sensed observations, data fusion and state-of-the-art data assimilation systems, supported by appropriate technological applications and visualization tools. Three dedicated application areas based on AURORA-like data are under consideration in this project that address, in a crescendo, individuals, municipalities, and transnational organizations.
  • UV exposure and air quality for individuals: Air pollution can substantially vary with time in urban areas. Not only can severe air pollution episodes seriously affect people who suffer from chronic lung diseases, they can also limit outdoor activities of healthy people. Mobile applications can be developed to help citizens plan outdoor activities when air quality is a concern. Another application of AURORA-like data is in the field of UV exposure and can particularly—though not exclusively—be useful for tourists. Prolonged exposure to UV radiation can be harmful. Mobile applications can be designed to help tourists to make decisions to limit UV exposure. Furthermore, given the large number of professions performed outdoors, an understanding of environmental impact on employee health is important for employers. Applications based on air quality and UV exposure can be developed of gaining such insights.
  • Air quality monitoring for cities: We are increasingly aware of the impacts of increased urbanization around the world, in combination with increased traffic and industry, on air quality and of its related socio-economic consequences. Effective measures to improve air quality require accurate information over entire urban areas. It is difficult to obtain such information from ground-based sensors globally. AURORA-like data have the potential to foster the development of air quality services for cities. While the core project will focus mainly over Europe, a collaboration with the TEMPO and GEMS communities, currently under discussion, can pave the way replicating these services in North American and Asian cities.
  • UV and air quality measurements for transnational organizations: The routine monitoring of air quality and UV radiation levels cross border is also of primary relevance for organizations that aim to provide information to policy makers, such as (transnational) environmental agencies. The prospect of a collaboration with the TEMPO and GEMS communities could extend the area of influence beyond Europe to East Asia and North America.

9. Conclusions

This paper has provided an initial overview of the AURORA project, co-funded by the H2020 research program. It has illustrated the background and basic rationale of the ongoing and planned activities, in addition to its primary scientific, technological and applicative objectives. AURORA adopts state-of-the-art technological solutions to take on the demanding task of bridging the gap between scientific advances and innovative applications and services based on the mass of new generation satellite data.
The concept of incorporation drives the project and puts the priorities and future outcomes into perspective. On the one hand, the core idea at the root of AURORA is the scientific proof-of-concept of the potential of data fusion techniques and data assimilation models for analysis and forecast of atmospheric measurements from space. The ultimate goal of the effort is to demonstrate the superior performance of a synergistic approach to processing remote-sounding observations. In this way, it fosters longer-term adoption of synergistic products by operational missions such as Copernicus atmospheric Sentinel and, in particular, by existing services such as CAMS and C3S.
On the other hand, high priority is also assigned to the development, implementation and testing of a technological infrastructure capable of running the complete data processing chain of AURORA. This is not only propaedeutic to upgrading synergistic data processing from research to operation. It also serves the short-to-medium term purpose of delivering advanced quality ozone products to potential stakeholders and early adopters of the AURORA concept, who might be interested in developing new applications and services from direct and derived products of assimilation of fused atmospheric Sentinel data.
AURORA is committed to disseminating project results, initiatives and opportunities for interaction and collaboration within the project lifetime, as well as for follow-up activities. Regular updates on the evolution of the work plan and on specific events are published on the home page of AURORA (http://www.aurora-copernicus.eu/). The web-site of the project is also hosting a Call for Ideas for university students and high school students in member states of the European Union proposing applications or services based on AURORA’s products.

Author Contributions

The authorship of the present paper includes members of the research and industrial teams of the AURORA Consortium, who substantially contributed to project activities and to the writing of the paper. U.C. is the scientific coordinator of the AURORA project and wrote the paper by integrating individual sections prepared by the partners; S.D.B. and C.T. acted in the role of project manager for the first and for the second and third year of AURORA, respectively; S.C. coordinated the task of data fusion in close cooperation with C.T. and N.Z.; S.D.B. performed the simulations of S4 and S5 measurement products in the TIR spectral region; M.G. is responsible for the task of testing the AURORA full data processing chain; F.B. provided support for definition and testing of the technological infrastructure and the data processing chain; M.B. is leader of activities for remote data access and visualization; Ar.Ar. developed and implemented part of the visualization tools under responsibility of Epsilon; A.B. and E.L. are the key persons of the S&T partner responsible for development of an application based on AURORA tropospheric ozone products for demonstration purpose; An.Ar. is leading the FMI team, in particular for the task related to the calculation of UV surface radiation products in collaboration with A.L. and W.W.N.; J.K. performed the simulations of S4 and S5 measurement products in the UV spectral region; R.v.d.A. lead the work-package for the generation of synthetic data from the atmospheric Sentinels; J.v.P. and O.T. conducted the assimilation experiments with the data assimilation system TM5 at KNMI, respectively, in the second and in the third year of the project; A.M. is responsible for development and implementation of the technological infrastructure for AURORA data processing chain with the key support of V.F.; E.S. is working to upgrade an application, previously developed by Flyby, for the demonstration of the added value of the AURORA UV products; R.D. is leading the workpackage for Data fusion, assimilation and forecasting, generated the atmospheric scenario database to be used as the “virtual truth” by S4 and S5 data simulations and is conducting the the assimilation experiments with the data assimilation system (C-)IFS at ECMWF; A.K. is leading the work-package of Performance assessment and data validation in collaboration with J.-C.L.; M.v.R. is responsible of the simulations of S4 and S5 measurement products in the VIS spectral region, with contributions from C.L. and Y.H., and for the task on calculation of tropospheric ozone products, with contributions from A.K.; and K.V. is the innovation manager of AURORA providing key contribution to the aspects of AURORA data exploitation and leading the task of market analysis. The synthetic information provided above intends to offer a survey of major individual contributions by the members of the AURORA Consortium co-authoring the paper; it is far from exhaustive, in particular as not including key parts of the activity most relevant for internal interfaces and external links with other projects/programs.

Funding

The AURORA project is supported by the Horizon 2020 research and innovation program of the European Union (Call: H2020-EO-2015; Topic: EO-2-2015) under Grant Agreement No. 687428.

Acknowledgments

The AURORA Consortium gratefully acknowledges the valuable and constant support on the many aspects of the project provided by the members of the External Expert Advisory Board: Marina Khazova (Public Health England), William Lahoz (Norwegian Institute for Air Research), Alan O’Neill (University of Reading) and Dimitris Stathakis (University of Thessaly).

Conflicts of Interest

The authors declare no conflict of interest.

Abbreviations

The following abbreviations are used and not defined in the text:
AcronymDefinition
AC-SAFAtmospheric Composition - Satellite Application Facility
CFClimate and Forecast
DOASDifferential Optical Absorption Spectroscopy
ESAEuropean Space Agency
GAWGlobal Atmosphere Watch
GEMSGeostationary Environmental. Monitoring Spectrometer
GEOGeostationary Orbit
GHGGreen-house Gases
GISGeographic Information System
GOME-2The second Global Ozone Monitoring Experiment
IFSIntegrated Forecasting System
KLIMAKyoto protocoL and Informed Management of the Adaptation
LEOLow Earth Orbit
LIDORTLInearized Discrete Ordinate Radiative Transfer
MACCMonitoring Atmospheric Composition and Climate
NDACCNetwork for the Detection of Atmospheric Composition Change
NOAANational Oceanic and Atmospheric Administration
O3-CCIThe Ozone Climate Change Initiative
O3M SAFSatellite Application Facility on Ozone and Atmospheric Chemistry Monitoring
OMIOzone Monitoring Instrument
RTMRadiative Transfer Model
SHADOZSouthern Hemisphere ADditional OZonesondes
TEMPOTropospheric Emissions: Monitoring POllution
TIRThermal InfraRed
TM5Transport Model version 5
TM5DAMTM5 Data Assimilation Model
UVUltraViolet
UVAUltraViolet A
UVBUltraViolet B
VISVisible
WMOWorld Meteorological Office

References

  1. Deeter, M.N.; Emmons, L.K.; Francis, G.L.; Edwards, D.P.; Gille, J.C.; Warner, J.X.; Khattatov, B.; Ziskin, D.; Lamarque, J.F.; Ho, S.P.; et al. Operational carbon monoxide retrieval algorithm and selected results for the MOPITT instrument. J. Geophys. Res. 2003, 108, 4399. [Google Scholar] [CrossRef]
  2. Deeter, M.N.; Martínez-Alonso, S.; Edwards, D.P.; Emmons, L.K.; Gille, J.C.; Worden, H.M.; Sweeney, C.; Pittman, J.V.; Daube, B.C.; Wofsy, S.C. The MOPITT Version 6 product: Algorithm enhancements and validation. Atmos. Meas. Tech. 2014, 7, 3623–3632. [Google Scholar] [CrossRef]
  3. Cuesta, J.; Eremenko, M.; Liu, X.; Dufour, G.; Cai, Z.; Höpfner, M.; von Clarmann, T.; Sellitto, P.; Foret, G.; Gaubert, B.; et al. Satellite observation of lowermost tropospheric ozone by multispectral synergism of IASI thermal infrared and GOME-2 ultraviolet measurements over Europe. Atmos. Chem. Phys. 2013, 13, 9675–9693. [Google Scholar] [CrossRef] [Green Version]
  4. Fu, D.; Worden, J.R.; Liu, X.; Kulawik, S.S.; Bowman, K.W.; Natraj, V. Characterization of ozone profiles derived from Aura TES and OMI radiances. Atmos. Chem. Phys. 2013, 13, 3445–3462. [Google Scholar] [CrossRef] [Green Version]
  5. Hache, E.; Attié, J.L.; Tourneur, C.; Ricaud, P.; Coret, L.; Lahoz, W.A.; El Amraoui, L.; Josse, B.; Hamer, P.; Warner, J.; et al. The added value of a visible channel to a geostationary thermal infrared instrument to monitor ozone for air quality. Atmos. Meas. Tech. 2014, 7, 2185–2201. [Google Scholar] [CrossRef] [Green Version]
  6. Cortesi, U.; Del Bianco, S.; Ceccherini, S.; Gai, M.; Dinelli, B.M.; Castelli, E.; Oelhaf, H.; Woiwode, W.; Höpfner, M.; Gerber, D. Synergy between middle infrared and millimeter-wave limb sounding of atmospheric temperature and minor constituents. Atmos. Meas. Tech. 2016, 9, 2267–2289. [Google Scholar] [CrossRef] [Green Version]
  7. Dragani, R. Joint project trials new way to exploit satellite retrievals. ECMWF Newsl. 2016, 149, 20–24. [Google Scholar] [CrossRef]
  8. Keppens, A.; Loenen, E.; Simeone, E. Real-time health Advice from Space. GIM Int. 2007, 31, 28–31. [Google Scholar]
  9. Gelaro, R.; McCarty, W.; Suárez, M.J.; Todling, R.; Molod, A.; Takacs, L.; Randles, C.A.; Darmenov, A.; Bosilovich, M.G.; Reichle, R.; et al. The Modern-Era Retrospective Analysis for Research and Applications, Version 2 (MERRA-2). J. Clim. 2017, 30, 5419–5454. [Google Scholar] [CrossRef]
  10. McPeters, R.D.; Labow, G.J. Climatology 2011: An MLS and sonde derived ozone climatology for satellite retrieval algorithms. J. Geophys. Res. Atmos. 2012, 117. [Google Scholar] [CrossRef] [Green Version]
  11. Cortesi, U.; Del Bianco, S.; Gai, M.; Laurenza, L.M.; Ceccherini, S.; Carli, B.; Barbara, F.; Buchwitz, M. Sensitivity analysis and application of KLIMA algorithm to GOSAT and OCO validation. Tech. Sci. Res. Rep. 2014, 6, 1–153. [Google Scholar]
  12. Yang, P.; Gao, B.C.; Baum, B.A.; Hu, Y.X.; Wiscombe, W.J.; Tsay, S.C.; Winker, D.M.; Nasiri, S.L. Radiative properties of cirrus clouds in the infrared (8–13 μm) spectral region. J. Quant. Spectrosc. Radiat. Transf. 2001, 70, 473–504. [Google Scholar] [CrossRef]
  13. Hess, M.; Koepke, P.; Schult, I. Optical properties of aerosols and clouds: The software package OPAC. Bull. Am. Meteorol. Soc. 1998, 79, 831–844. [Google Scholar] [CrossRef]
  14. Liu, Z.; Liu, Q.; Lin, H.C.; Schwartz, C.S.; Lee, Y.H.; Wang, T. Three-dimensional variational assimilation of MODIS aerosol optical depth: Implementation and application to a dust storm over East Asia. J. Geophys. Res. Atmos. 2011, 116. [Google Scholar] [CrossRef] [Green Version]
  15. Platt, U. Differential optical absorption spectroscopy (DOAS). In Air Monitoring by Spectroscopic Techniques; Siegrist, M., Ed.; John Wiley and Sons: Hoboken, NJ, USA, 1994; Volume 127, pp. 27–84. [Google Scholar]
  16. Spurr, R.; Kurosu, T.; Chance, K. A linearized discrete ordinate radiative transfer model for atmospheric remote-sensing retrieval. J. Quant. Spectrosc. Radiat. Transf. 2001, 68, 689–735. [Google Scholar] [CrossRef]
  17. de Haan, J.F. DISAMAR: Determining Instrument Specifications and Analyzing Methods for Atmospheric Retrieval, Algorithm Description and Background Information; Technical Report; RP-TROPOMI-KNMI-066 DISAMAR V2.2.1 Documentation; KNMI: Debilt, The Netherlands, 2011. [Google Scholar]
  18. Rodgers, C.D. Inverse Methods for Atmospheric Sounding: Theory and Practice; World Scientific: Singapore, 2000. [Google Scholar]
  19. de Haan, J.F.; Bosma, P.; Hovenier, J. The adding method for multiple scattering calculations of polarized light. Astron. Astrophys. 1987, 183, 371–391. [Google Scholar]
  20. Liu, X.; Chance, K.; Sioris, C.; Spurr, R.; Kurosu, T.; Martin, R.; Newchurch, M. Ozone profile and tropospheric ozone retrievals from the Global Ozone Monitoring Experiment: Algorithm description and validation. J. Geophys. Res. Atmos. 2005, 110. [Google Scholar] [CrossRef] [Green Version]
  21. Ceccherini, S.; Cortesi, U.; Del Bianco, S.; Raspollini, P.; Carli, B. IASI-METOP and MIPAS-ENVISAT data fusion. Atmos. Chem. Phys. 2010, 10, 4689–4698. [Google Scholar] [CrossRef] [Green Version]
  22. Aires, F.; Aznay, O.; Prigent, C.; Paul, M.; Bernardo, F. Synergistic multi-wavelength remote sensing versus a posteriori combination of retrieved products: Application for the retrieval of atmospheric profiles using MetOp-A. J. Geophys. Res. Atmos. 2012, 117. [Google Scholar] [CrossRef] [Green Version]
  23. Ceccherini, S.; Carli, B.; Raspollini, P. Equivalence of data fusion and simultaneous retrieval. Opt. Express 2015, 23, 8476–8488. [Google Scholar] [CrossRef] [PubMed]
  24. Ceccherini, S.; Carli, B.; Tirelli, C.; Zoppetti, N.; Del Bianco, S.; Cortesi, U.; Kujanpää, J.; Dragani, R. Importance of interpolation and coincidence errors in data fusion. Atmos. Meas. Tech. 2018, 11, 1009–1017. [Google Scholar] [CrossRef] [Green Version]
  25. ECMWF. Documentation of the ECMWF Integrated Forecasting System (IFS). 2017. Available online: https://www.ecmwf.int/en/forecasts/documentation-and-support/changes-ecmwf-model/ifs-documentation (accessed on 15 September 2018).
  26. Agustí-Panareda, A.; Massart, S.; Chevallier, F.; Boussetta, S.; Balsamo, G.; Beljaars, A.; Ciais, P.; Deutscher, N.M.; Engelen, R.; Jones, L.; et al. Forecasting global atmospheric CO2. Atmos. Chem. Phys. 2014, 14, 11959–11983. [Google Scholar] [CrossRef]
  27. Rabier, F.; Järvinen, H.; Klinker, E.; Mahfouf, J.F.; Simmons, A. The ECMWF operational implementation of four-dimensional variational assimilation. I: Experimental results with simplified physics. Quart. J. R. Meteorol. Soc. 2000, 126, 1143–1170. [Google Scholar] [CrossRef]
  28. Courtier, P.; Thépaut, J.N.; Hollingsworth, A. A strategy for operational implementation of 4D-Var, using an incremental approach. Quart. J. R. Meteorol. Soc. 1994, 120, 1367–1387. [Google Scholar] [CrossRef]
  29. Dethof, A.; Holm, E. Ozone assimilation in the ERA-40 reanalysis project. Quart. J. R. Meteorol. Soc. 2004, 130, 2851–2872. [Google Scholar] [CrossRef] [Green Version]
  30. Cariolle, D.; Teyssedre, H. A revised linear ozone photochemistry parameterization for use in transport and general circulation models: Multi-annual simulations. Atmos. Chem. Phys. 2007, 7, 2183–2196. [Google Scholar] [CrossRef]
  31. Dragani, R. A comparative analysis of UV nadir-backscatter and infrared limb-emission ozone data assimilation. Atmos. Chem. Phys. 2016, 16, 8539–8557. [Google Scholar] [CrossRef] [Green Version]
  32. Hogan, R.; Ahlgrimm, M.; Balsamo, G.; Beljaars, A.; Berrisford, P.; Bozzo, A.; Giuseppe, F.D.; Forbes, R.; Haiden, T.; Lang, S.; et al. Radiation in Numerical Weather Prediction; Technical Report 816; ECMWF: Reading, UK, 2017. [Google Scholar]
  33. Bozzo, A.; Remy, S.; Benedetti, A.; Flemming, J.; Bechtold, P.; Rodwell, M.; Morcrette, J.J. Implementation of a CAMS-Based Aerosol Climatology in the IFS; Technical Report 801; ECMWF: Reading, UK, 2017. [Google Scholar]
  34. Flemming, J.; Benedetti, A.; Inness, A.; Engelen, R.J.; Jones, L.; Huijnen, V.; Remy, S.; Parrington, M.; Suttie, M.; Bozzo, A.; et al. The CAMS interim Reanalysis of Carbon Monoxide, Ozone and Aerosol for 2003–2015. Atmos. Chem. Phys. 2017, 17, 1945–1983. [Google Scholar] [CrossRef]
  35. Dragani, R. Variational Bias Correction of Satellite Ozone Data; Technical Report R43.8/RD/0934; ECMWF: Reading, UK, 2009. [Google Scholar]
  36. Flemming, J.; Inness, A.; Flentje, H.; Huijnen, V.; Moinat, P.; Schultz, M.; Stein, O. Coupling global chemistry transport models to ECMWF’s integrated forecast system. Geosci. Model Dev. 2009, 2, 253–265. [Google Scholar] [CrossRef]
  37. Hollingsworth, A.; Engelen, R.; Benedetti, A.; Dethof, A.; Flemming, J.; Kaiser, J.; Morcrette, J.; Simmons, A.; Textor, C.; Boucher, O.; et al. Toward a monitoring and forecasting system for atmospheric composition: The GEMS project. Bull. Am. Meteorol. Soc. 2008, 89, 1147–1164. [Google Scholar] [CrossRef]
  38. Inness, A.; Blechschmidt, A.M.; Bouarar, I.; Chabrillat, S.; Crepulja, M.; Engelen, R.J.; Eskes, H.; Flemming, J.; Gaudel, A.; Hendrick, F.; et al. Data assimilation of satellite-retrieved ozone, carbon monoxide and nitrogen dioxide with ECMWF’s Composition-IFS. Atmos. Chem. Phys. 2015, 15, 5275–5303. [Google Scholar] [CrossRef] [Green Version]
  39. Flemming, J.; Huijnen, V.; Arteta, J.; Bechtold, P.; Beljaars, A.; Blechschmidt, A.M.; Diamantakis, M.; Engelen, R.J.; Gaudel, A.; Inness, A.; et al. Tropospheric chemistry in the Integrated Forecasting System of ECMWF. Geosci. Model Dev. 2015, 8, 975–1003. [Google Scholar] [CrossRef] [Green Version]
  40. Engelen, R.J.; Andersson, E.; Chevallier, F.; Hollingsworth, A.; Matricardi, M.; McNally, A.P.; Thépaut, J.N.; Watts, P.D. Estimating atmospheric CO2 from advanced infrared satellite radiances within an operational 4D-Var data assimilation system: Methodology and first results. J. Geophys. Res. Atmos. 2004, 109. [Google Scholar] [CrossRef]
  41. Benedetti, A.; Morcrette, J.J.; Boucher, O.; Dethof, A.; Engelen, R.; Fisher, M.; Flentje, H.; Huneeus, N.; Jones, L.; Kaiser, J.; et al. Aerosol analysis and forecast in the European Centre for Medium-Range Weather Forecasts Integrated Forecast System: 2. Data assimilation. J. Geophys. Res. (Atmos.) 2009, 114. [Google Scholar] [CrossRef]
  42. Morcrette, J.J.; Boucher, O.; Jones, L.; Salmond, D.; Bechtold, P.; Beljaars, A.; Benedetti, A.; Bonet, A.; Kaiser, J.W.; Razinger, M.; et al. Aerosol analysis and forecast in the European Centre for Medium-Range Weather Forecasts Integrated Forecast System: Forward modeling. J. Geophys. Res. Atmos. 2009, 114. [Google Scholar] [CrossRef] [Green Version]
  43. Huijnen, V.; Williams, J.; Weele, M.V.; Noije, T.V.; Krol, M.; Dentener, F.; Segers, A.; Houweling, S.; Peters, W.; Laat, J.D.; et al. The global chemistry transport model TM5: Description and evaluation of the tropospheric chemistry version 3.0. Geosci. Model Dev. 2010, 3, 445–473. [Google Scholar] [CrossRef]
  44. Krol, M.; Houweling, S.; Bregman, B.; Broek, M.; Segers, A.; Velthoven, P.V.; Peters, W.; Dentener, F.; Bergamaschi, P. The two-way nested global chemistry-transport zoom model TM5: Algorithm and applications. Atmos. Chem. Phys. 2005, 5, 417–432. [Google Scholar] [CrossRef]
  45. Fortuin, J.P.F.; Kelder, H. An ozone climatology based on ozonesonde and satellite measurements. J. Geophys. Res. 1998, 103, 31709–31734. [Google Scholar] [CrossRef] [Green Version]
  46. Segers, A.; Eskes, H.; Van Der, A.; Van Oss, R.; Van Velthoven, P. Assimilation of GOME ozone profiles and a global chemistry–transport model using a Kalman filter with anisotropic covariance. Quart. J. R. Meteorol. Soc. 2005, 131, 477–502. [Google Scholar] [CrossRef] [Green Version]
  47. Reichler, T.; Dameris, M.; Sausen, R. Determining the tropopause height from gridded data. Geophys. Res. Lett. 2003, 30. [Google Scholar] [CrossRef] [Green Version]
  48. World Meteorological Organization. Commission For Aerology (CAe), Abridged Final Report of the Second Session; Report nr. WMO–No. 65. RP. 27; World Meteorological Organization, Secretariat of the World Meteorological Organization: Geneva, Switzerland, 1957. [Google Scholar]
  49. QA4EO Task Team. A Quality Assurance Framework for Earth Observation: Principles Version 4.0; QA4EO Task Team: Hampshire, UK, 2010. [Google Scholar]
  50. Cortesi, U.; The AURORA Consortium. AURORA Requirements Document. In AURORA Project Deliverable 2.1; AURORA: Frascati, Italy, 2016. [Google Scholar]
  51. Verhoelst, T.; Granville, J.; Hendrick, F.; Köhler, U.; Lerot, C.; Pommereau, J.P.; Redondas, A.; Van Roozendael, M.; Lambert, J.C. Metrology of ground-based satellite validation: Co-location mismatch and smoothing issues of total ozone comparisons. Atmos. Meas. Tech. 2015, 8, 5039–5062. [Google Scholar] [CrossRef] [Green Version]
  52. Keppens, A.; Lambert, J.C.; Granville, J.; Miles, G.; Siddans, R.; van Peet, J.C.A.; van der A, R.J.; Hubert, D.; Verhoelst, T.; Delcloo, A.; et al. Round-robin evaluation of nadir ozone profile retrievals: Methodology and application to MetOp-A GOME-2. Atmos. Meas. Tech. 2015, 8, 2093–2120. [Google Scholar] [CrossRef] [Green Version]
  53. Bernhard, G.; Arola, A.; Dahlback, A.; Fioletov, V.; Heikkilä, A.; Johnsen, B.; Koskela, T.; Lakkala, K.; Svendby, T.; Tamminen, J. Comparison of OMI UV observations with ground-based measurements at high northern latitudes. Atmos. Chem. Phys. 2015, 15, 7391–7412. [Google Scholar] [CrossRef] [Green Version]
  54. Tanskanen, A.; Lindfors, A.; Määttä, A.; Krotkov, N.; Herman, J.; Kaurola, J.; Koskela, T.; Lakkala, K.; Fioletov, V.; Bernhard, G.; et al. Validation of daily erythemal doses from Ozone Monitoring Instrument with ground-based UV measurement data. J. Geophys. Res. Atmos. 2007, 112. [Google Scholar] [CrossRef] [Green Version]
  55. WHO. Chronic Obstructive Pulmonary Disease (COPD). 2017. Available online: www.who.int/respiratory/copd/en/ (accessed on 4 September 2017).
  56. WHO. Asthma. 2003. Available online: www.who.int/respiratory/asthma/en/ (accessed on 4 September 2017).
  57. WHO. Health Effects of UV Radiation. 2017. Available online: www.who.int/uv/health/uv$_$health2/en/index1.html (accessed on 4 September 2017).
  58. WHO. Skin Cancers. 2017. Available online: www.who.int/uv/faq/skincancer/en/index1.html (accessed on 4 September 2017).
Figure 1. Schematic diagram of the AURORA data flow, adapted from Figure-3 of [7].
Atmosphere 09 00454 g001
Figure 2. Input and output products at the various stages of the AURORA data processing chain.
Atmosphere 09 00454 g002
Table 1. Average number of degrees of freedom of TIR, UV, VIS and fused measurements related to the first week of April 2012.
Thermal InfraredUltravioletVisibleFused
Number of degrees of freedom4.903.410.975.72
Table 2. Quality indicators for different modules of the AURORA data processing chain, where FRM stands for Fiducial Reference Measurement.
AURORA Processing ChainPerformance AssessmentData Validation
Atmospheric model as “virtual truth” (VT)//
Ozone profile retrieval- VT- FRM
Fusion of retrievals- VT- FRM
- Retrieved data
Assimilation/forecasting- VT- FRM
- Fused data

