A Review of Atmosphere–Ocean Forcings Outside the Tropical Pacific on the El Niño–Southern Oscillation Occurrence


1
Center for Monsoon System Research, Institute of Atmospheric Physics, Chinese Academy of Sciences, Beijing 100029, China
2
Climate Research Division, Environment and Climate Change Canada, Toronto, ON M3H 5T4, Canada
3
State Key Laboratory of Numerical Modeling for Atmospheric Sciences and Geophysical Fluid Dynamics, Institute of Atmospheric Physics, Chinese Academy of Sciences, Beijing 100029, China
*
Author to whom correspondence should be addressed.
Atmosphere 2018, 9(11), 439; https://doi.org/10.3390/atmos9110439
Submission received: 17 September 2018
/
Revised: 6 November 2018
/
Accepted: 7 November 2018
/
Published: 12 November 2018
(This article belongs to the Special Issue Large-Scale Atmospheric Circulation Variability and Its Climate Impacts)
Abstract
:The El Niño–Southern Oscillation (ENSO) is the strongest interannual air–sea coupled variability mode in the tropics, and substantially impacts the global weather and climate. Hence, it is important to improve our understanding of the ENSO variability. Besides the well-known air–sea interaction process over the tropical Pacific, recent studies indicated that atmospheric and oceanic forcings outside the tropical Pacific also play important roles in impacting and modulating the ENSO occurrence. This paper reviews the impacts of the atmosphere–ocean variability outside the tropical Pacific on the ENSO variability, as well as their associated physical processes. The review begins with the contribution of the atmosphere–ocean forcings over the extratropical North Pacific, Atlantic, and Indian Ocean on the ENSO occurrence. Then, an overview of the extratropical atmospheric forcings over the Northern Hemisphere (including the Arctic Oscillation and the Asian monsoon systems) and the Southern Hemisphere (including the Antarctic Oscillation and the Pacific–South American teleconnection), on the ENSO occurrence, is presented. It is shown that the westerly (easterly) wind anomaly over the tropical western Pacific is essential for the occurrence of an El Niño (a La Niña) event. The wind anomalies over the tropical western Pacific also play a key role in relaying the impacts of the atmosphere–ocean forcings outside the tropical Pacific on the ENSO variability. Finally, some relevant questions, that remain to be explored, are discussed.
1. Introduction
The El Niño–Southern Oscillation (ENSO) is the strongest interannual variability in the tropical Pacific [1,2,3]. The occurrence of ENSO events can significantly impact the climate, weather, marine, fisheries, and ecosystems around the Pacific and remote regions, via atmospheric and oceanic teleconnections [4,5,6,7,8,9,10,11,12,13,14,15] and references therein. For example, ENSO events can exert pronounced influences on the East Asian monsoon activity and related precipitation anomalies via modulating the subtropical high over the western North Pacific [4,8,11]. Climate and weather variations over Europe and North America were also significantly modulated by the ENSO [10,12,13]. In addition, ENSO has notable contributions to the sea surface temperature (SST) variations over many remote regions (e.g., extratropical Pacific, Indian Ocean, and Atlantic Ocean) [5,6,7]. SST warming (cooling) tends to appear in the Indian Ocean and northern tropical Atlantic during the following spring and summer, when an El Niño (a La Niña) event occurs in the preceding winter [5,6,7]. Furthermore, studies demonstrated that tropical cyclone (TC) activities over the western North Pacific and Atlantic are significantly impacted by the ENSO events [14,15]. For instance, more TCs are generated in the southeastern part of the western North Pacific during El Niño developing summer [14]. Due to the substantial impacts of ENSO, identifying the factors contributing to the ENSO variability and the underlying dynamics have been extensively investigated by the scientific community over the past several decades. It is generally accepted that the atmosphere–ocean interaction and oceanic dynamical processes within the tropical Pacific are crucial in generating and maintaining the ENSO cycle [1,2,3]. Specifically, initial sea surface temperature (SST) anomalies in the tropical central-eastern Pacific (TCEP) could develop into an ENSO (El Niño or La Niña) event via the Bjerknes positive air–sea feedback mechanism. In addition, the associated tropical oceanic waves (including the eastward propagating equatorial Kelvin wave and westward propagating Rossby waves) would reduce the amplitude of the SST anomalies over the TCEP, and eventually alter the signal of the SST anomalies there [16,17,18]. Based on these theories, dynamical and statistical models of ENSO have been established to simulate and forecast ENSO events, and have shown substantial skills on the seasonal timescale. Nevertheless, challenges remain in the simulation and prediction of ENSO, for example, the failed prediction of the 2014 El Niño event using most theoretical models [19,20,21,22].
Besides the tropical Pacific, a number of studies have demonstrated that the atmosphere–ocean forcings outside the tropical Pacific are also important in forming and maintaining the ENSO variability. For example, studies indicated that the North Pacific Oscillation (NPO), an intrinsic atmospheric variability over the extratropical North Pacific (NP), can exert significant impacts on the outbreak of ENSO events via the so-called “seasonal footprinting mechanism (SFM)” [23,24]. Nakamura et al. [25] found that the spring Arctic Oscillation (AO), the dominant atmospheric variability over the extratropical Northern Hemisphere, significantly influences ENSO events in the following winter via modulating the westerly wind bursts (WWBs) over the tropical western Pacific (TWP). Besides the NPO and the AO influences, there are other factors outside the tropical Pacific that contribute to the ENSO variability, such as the East Asian monsoon variability, the atmospheric circulation anomalies in the Southern Hemisphere, and the SST variability over the Indian and Atlantic Oceans. In this paper, we review these forcings outside the tropical Pacific on the occurrences of ENSO events to the best of our knowledge. The paper is organized as follows: Section 2 describes the data and method used in producing the plots shown in this review. Section 3 presents an overview of the atmosphere–ocean forcings outside the tropical Pacific on ENSO. Section 4 provides a summary and some discussion.
2. Data and Methods
The atmospheric data we used, including monthly sea level pressure (SLP), geopotential height and horizontal winds, were obtained from the National Centers for Environmental Prediction–National Center for Atmospheric Research (NCEP-NCAR) reanalysis dataset from 1948 to the present [26]. These atmospheric data have a horizontal resolution of 2.5° × 2.5°. The monthly SST data were extracted from the National Oceanic and Atmospheric Administration (NOAA) Extended Reconstructed SST version 3b (ERSSTv3b) dataset [27]. The SST dataset has a horizontal resolution of 2° × 2°, and is available from 1854 to the present.
The AO index is defined as the principal component (PC) time series corresponding to the first empirical orthogonal function (EOF) mode of SLP anomalies north of 20° N [28,29,30,31]. NPO index is defined as the PC time series of the second EOF mode of SLP anomalies over 20°–60° N and 120° E–80° W [32]. The spring northern tropical Atlantic (NTA) SST index is defined as the regional SST anomalies averaged over 0°–20° N and 0°–60° W. The Atlantic Niño SST index is calculated as the area-averaged SST anomalies over the central-eastern Atlantic (i.e. 3° S–3° N and 20° W–0° E) [33]. The Indian Ocean dipole (IOD) SST index is defined as the difference in area-averaged SST anomalies between tropical eastern (50°–70° E and 10° S–10° N) and western (90°–110° E and 10° S–0° N) Indian Ocean [34,35]. The North Atlantic Oscillation (NAO) index is obtained from the National Oceanic and Atmospheric Administration Climate Prediction Center (http://www.cpc.ncep.noaa.gov/data/).
3. Atmosphere–Ocean Forcings of ENSO
This section presents an overview of the contributions of the atmosphere–ocean forcings outside the tropical Pacific on the tropical ENSO variability. Impacts of the atmosphere–ocean variability over the North Pacific, Atlantic, and Indian Ocean, as well as the atmospheric variability from the extratropical Northern Hemisphere (NH) and Southern Hemisphere (SH), on the ENSO occurrence, will be presented.
3.1. Atmosphere–Ocean Variability over North Pacific
The NPO is the dominant atmospheric variability mode over the extratropical NP [36,37]. The spatial pattern of the NPO can be represented by the second EOF mode of SLP anomalies over the NP, and is characterized by a meridional dipole pattern of the SLP anomalies between the subtropics and mid-latitudes of the NP (Figure 1) [32,38,39,40,41].
During the recent two decades, a number of studies have investigated the impact of the NPO on ENSO variability. Vimont et al. [23,24] firstly demonstrated that the NPO-like atmospheric circulation anomalies during boreal winter can exert significant impacts on ENSO events during the subsequent winter via the seasonal footprinting mechanism (SFM). The SFM can be briefly summarized as follows: when the south pole of the NPO is covered by negative SLP anomalies during boreal winter, a significant cyclonic anomaly appears over the subtropical NP (Figure 2). The southwesterly wind anomalies to the west flank of the anomalous cyclone reduce the climatological northeasterly wind and decrease surface evaporation and upward net heat fluxes, which further result in SST warming over the subtropical NP. The SST footprinting over the subtropics induced by the winter NPO could be maintained into the following spring–summer. and propagate equatorward via a positive surface wind–evaporation–SST (WES) feedback mechanism [42]. During the following spring and summer, the SST warming footprinting over the subtropical NP (0°–20° N) further induces significant surface westerly wind anomalies over the TWP, leading to a significant El Niño-like SST warming in the TCEP during the following winter via the ocean–atmosphere interaction and oceanic dynamics over the tropical Pacific. Via this "seasonal footprinting mechanism" process, the winter NPO-related atmospheric variability can exert substantial impacts on the following winter ENSO variability (Figure 2).
Vimont et al. [43] further investigated the SFM in a coupled general circulation model (CGCM) from the Commonwealth Scientific and Industrial Research Organization (CSIRO). The model can capture the important role of the relaxed trade winds in producing SST warming over the subtropical NP during winter. In addition, they found that the SFM could explain about 20%–40% of the ENSO variability on the interannual timescale, and about 70% of the tropical Pacific variability on the decadal-to-interdecadal timescale in this model. Alexander et al. [44] also tested the SFM using coupled model experiments. They examined the SFM processes via imposing wintertime NPO-induced surface heat flux forcing in a CGCM, and showed that the SFM hypothesis can be well captured by the CGCM. In addition, SST warming in the TCEP appears in about 70% of their ensemble experiments.
Pegion and Alexander [45] evaluated the ability of the NCEP/Climate Forecast System, version 2 (CFSv2) in simulating the SFM related to the NPO–ENSO connection. They showed that the CFSv2 can capture, reasonably well, the primary feature associated with the SFM and its connection with ENSO. However, the probabilistic predictions of ENSO are less reliable during positive or negative NPO events than those when the NPO is normal. Park et al. [39] found that the occurrence ratio of El Niño events is about 41% during the period 1949–2009 under the condition of positive NPO forcing during its preceding winter. This suggests that the winter NPO-related atmospheric forcing over the NP cannot always lead to an El Niño event. They further separated positive NPO years into two groups: the winter positive NPO that can and cannot lead to El Niño events via the SFM (i.e., NPO-El Niño and NPO-normal). Significant differences are seen in the wintertime NPO structure between the NPO-El Niño and NPO-normal cases. In particular, the southern lobe of the NPO-normal has a more zonally elongated structure than that of the NPO-El Niño, which is unfavorable for the existence of the SST warming footprint in the subtropical NP during spring–summer, and the associated westerly wind anomalies over the TWP.
Chen et al. [46] demonstrated that the spring AO has a notable modulation influence on the NPO-El Niño connection (Figure 3). When the spring AO is in its positive phase, a positive winter NPO could lead to pronounced El Niño-like warming in the TCEP via the SFM. In particular, 8 out of 9 +NPO/+AO years are followed by El Niño years in the following winter over the period from 1957 to 2011. By contrast, when the spring AO is in its negative phase, the relation between the positive NPO and El Niño is not robust at all. None of the 6 +NPO/−AO years is followed by an El Niño over the same period. The mechanism for the modulation of the NPO-El Niño relation by the spring AO was found to be through modulating the SST footprinting in the subtropical northern Pacific [46].
Recent studies suggested that ENSO may be classified into two types: the eastern-Pacific (EP)- and central-Pacific (CP)-type El Niño events [47,48,49,50,51]. The CP ENSO is also called Date Line El Niño, El Niño Modoki, or warm pool El Niño. Some studies indicated that the wintertime NPO-generated SST anomalies in the following winter are mainly located over the tropical central Pacific. Hence, the wintertime NPO tends to show a closer relationship with the CP El Niño than with the EP El Niño [52,53]. In addition, Yu et al. [54] found that the relationship between the winter NPO and the tropical central Pacific SST anomalies in the following winter has experienced a significant interdecadal change around 1990. They showed that the winter NPO can impact the following winter SST variability in the CP only during the period after 1990, and argued that this interdecadal change in the NPO–tropical Pacific SST relation may be an important reason for increase in the frequency of the CP ENSO event since 1990. Yeh et al. [55] also indicated that changes in the NPO–ENSO connection are related to changes in the NPO's structure. In addition, Wang et al. [56] examined the performance of the coupled models from the CMIP5 in simulating the relationship between the NPO and El Niño Modoki. They found that the ability of the CMIP5 models in capturing the NPO–El Niño Modoki relationship is mainly attributed to the model's ability in simulating the intensity of the wind–evaporation–sea surface temperature (WES) feedback over the subtropical NP.
There have been a number of methods in defining the NPO [38,39,40,41]. For example, some studies employed the EOF method to define the NPO index, while some others defined the NPO index as the difference of SLP anomalies over the mid-latitudes and the subtropics of NP. In addition, studies indicated that the southern lobe of the winter NPO plays a more important role in impacting the following winter ENSO via the SFM [53,57,58]. Overall, previous studies mainly used SLP anomalies over the southern lobe of the NPO to investigate the SFM [57,58,59]. Recently, Chen and Wu [60] showed that the relationship between the winter NPO and the winter ENSO one year after is sensitive to the definition of the NPO index, indicating that the definition of the NPO should be taken into account when analyzing the SFM, especially in climate models.
Besides the atmospheric variability, several studies indicated that the SST variability over the North Pacific also significantly impacts on the ENSO occurrence. Wang et al. [61] reported that the SST anomalies in the western NP (122°–132° E and 18°–28° N), centered at the upstream Kuroshio Current and east of Taiwan, during the boreal winter, are an effective predictor for the development of the ENSO in the following winter. The western NP SST bears some resemblance to the Meridional Mode (MM) in the subtropical central and eastern Pacific. Previous studies indicated that the MM mode is one of the main conduits by which the SFM influences ENSO [62]. However, in contrast to the MM mode, the western NP SST anomalies are related to an SST anomaly dipole between southeastern Asia and the western tropical Pacific. This SST anomaly dipole would induce significant equatorial zonal wind anomalies and further impact the following winter ENSO occurrence.
Ding et al. [63] found that the NP Victoria Mode (VM), the second EOF mode of the SST anomalies over the extratropical NP, during the boreal spring, also has a significant impact on the development of the ENSO in the following winter. They showed that the spring VM could be considered as an effective ocean conduit by which the extratropical atmospheric anomalies over the NP impact the following winter ENSO, via the surface air–sea coupling in the tropical/subtropical NP and evolution of subsurface ocean temperature anomalies along the equator. In addition, Zhang et al. [64] recently indicated that the NP subtropical SST front (NPSTF) can also exert impacts on the following winter ENSO event. They showed that when the spring NPSTF is stronger, a cyclonic (anticyclonic) anomaly would be induced to its north (south) in the low-level. The northerly wind anomalies related to the anomalous anticyclone enhance the climatological trade wind over the subtropical Northeast Pacific, leading to SST cooling via WES feedback. The SST cooling and related atmospheric circulation anomalies propagate southwards from subtropical to the central-eastern equatorial Pacific in the following summer. Subsequently, the equatorial central-eastern Pacific SST cooling develops into a La Niña-like SST in the following winter via a Bjerknes-like positive air–sea feedback.
3.2. Atmosphere–Ocean Variability over Atlantic
The North Atlantic Oscillation (NAO) is the leading atmospheric variability over the North Atlantic region [65,66,67]. The spatial pattern of the NAO is featured by a meridional dipole in the SLP and geopotential height anomalies between mid-and high-latitudes of the North Atlantic (Figure 4). Oshika et al. [68] found that the December NAO has a significant impact on the ENSO variability. During the negative (positive) phase of the December NAO, an El Niño (a La Niña) event tends to occur in the following winter. They further showed that the Eurasian snow cover plays an important role in relaying the impact of the December NAO on the subsequent winter ENSO. During the negative phase of the December NAO, a significant increase in the amount of snow fall appears in Eastern Europe and western Russia. The snow anomalies maintain and move northeastward from winter to early spring, which cool the local surface atmosphere. The cooling of the atmosphere triggers a downstream propagating stationary atmospheric Rossby wave, which would induce a significant anticyclonic anomaly over the Tibetan plateau and a high surface pressure anomaly over southeastern Asia. The high surface pressure, in turn, enhances the Asian cold surge activity and induces significant westerly wind anomalies over the TWP via an enhancement of the atmospheric heating around the western Pacific [69]. The westerly wind anomalies further contribute to the development of El Niño events in the following winter via triggering positive air–sea feedback and oceanic dynamics. Nakamura et al. [70] further confirmed the significant NAO–ENSO connection and related physical processes by analyzing multi-model ensemble analyses from CMIP5 climate models.
In addition to the NAO, studies also demonstrated a significant modulation of the SST variability over Atlantic on the ENSO variability [33,71,72,73,74,75,76]. Wang et al. [74] showed that SST anomalies over the North Atlantic mid-latitudes in the boreal summer can exert significant impacts on the winter ENSO event in the next year. When summer SST anomalies in the North Atlantic mid-latitudes are negative, a significant cyclonic circulation anomaly can be induced over the North Atlantic in the lower troposphere from October to the following April. The North Atlantic atmospheric circulation change further induces significant atmospheric heating over the North Atlantic, and stimulates an eastward propagating atmospheric Rossby wave, with two anomalous anticyclones around England and Lake Baikal, and two anomalous cyclones around the North Atlantic and over the Caspian Sea. In particular, the anomalous anticyclone over the Lake Baikal increases the continental northerly winds, and enhances the East Asian winter monsoon (EAWM). The enhancement of the EAWM results in significant westerly wind anomalies over the TWP during the subsequent winter and spring, via intrusion of the cold surge activity. The induced strong westerly wind anomalies further lead to El Niño events in the following winter. Wang et al. [75] also examined the impact of the summer North Atlantic SST on the winter ENSO in the next year based on numerical experiments using an atmospheric general circulation model (AGCM). Their AGCM experiments confirmed the observational results that negative summer SST anomalies in the North Atlantic mid-latitudes would trigger an eastward propagating atmospheric wave train, which induces pronounced westerly wind anomalies over the tropical western Pacific via enhancing the EAWM, and impacts the ENSO variability.
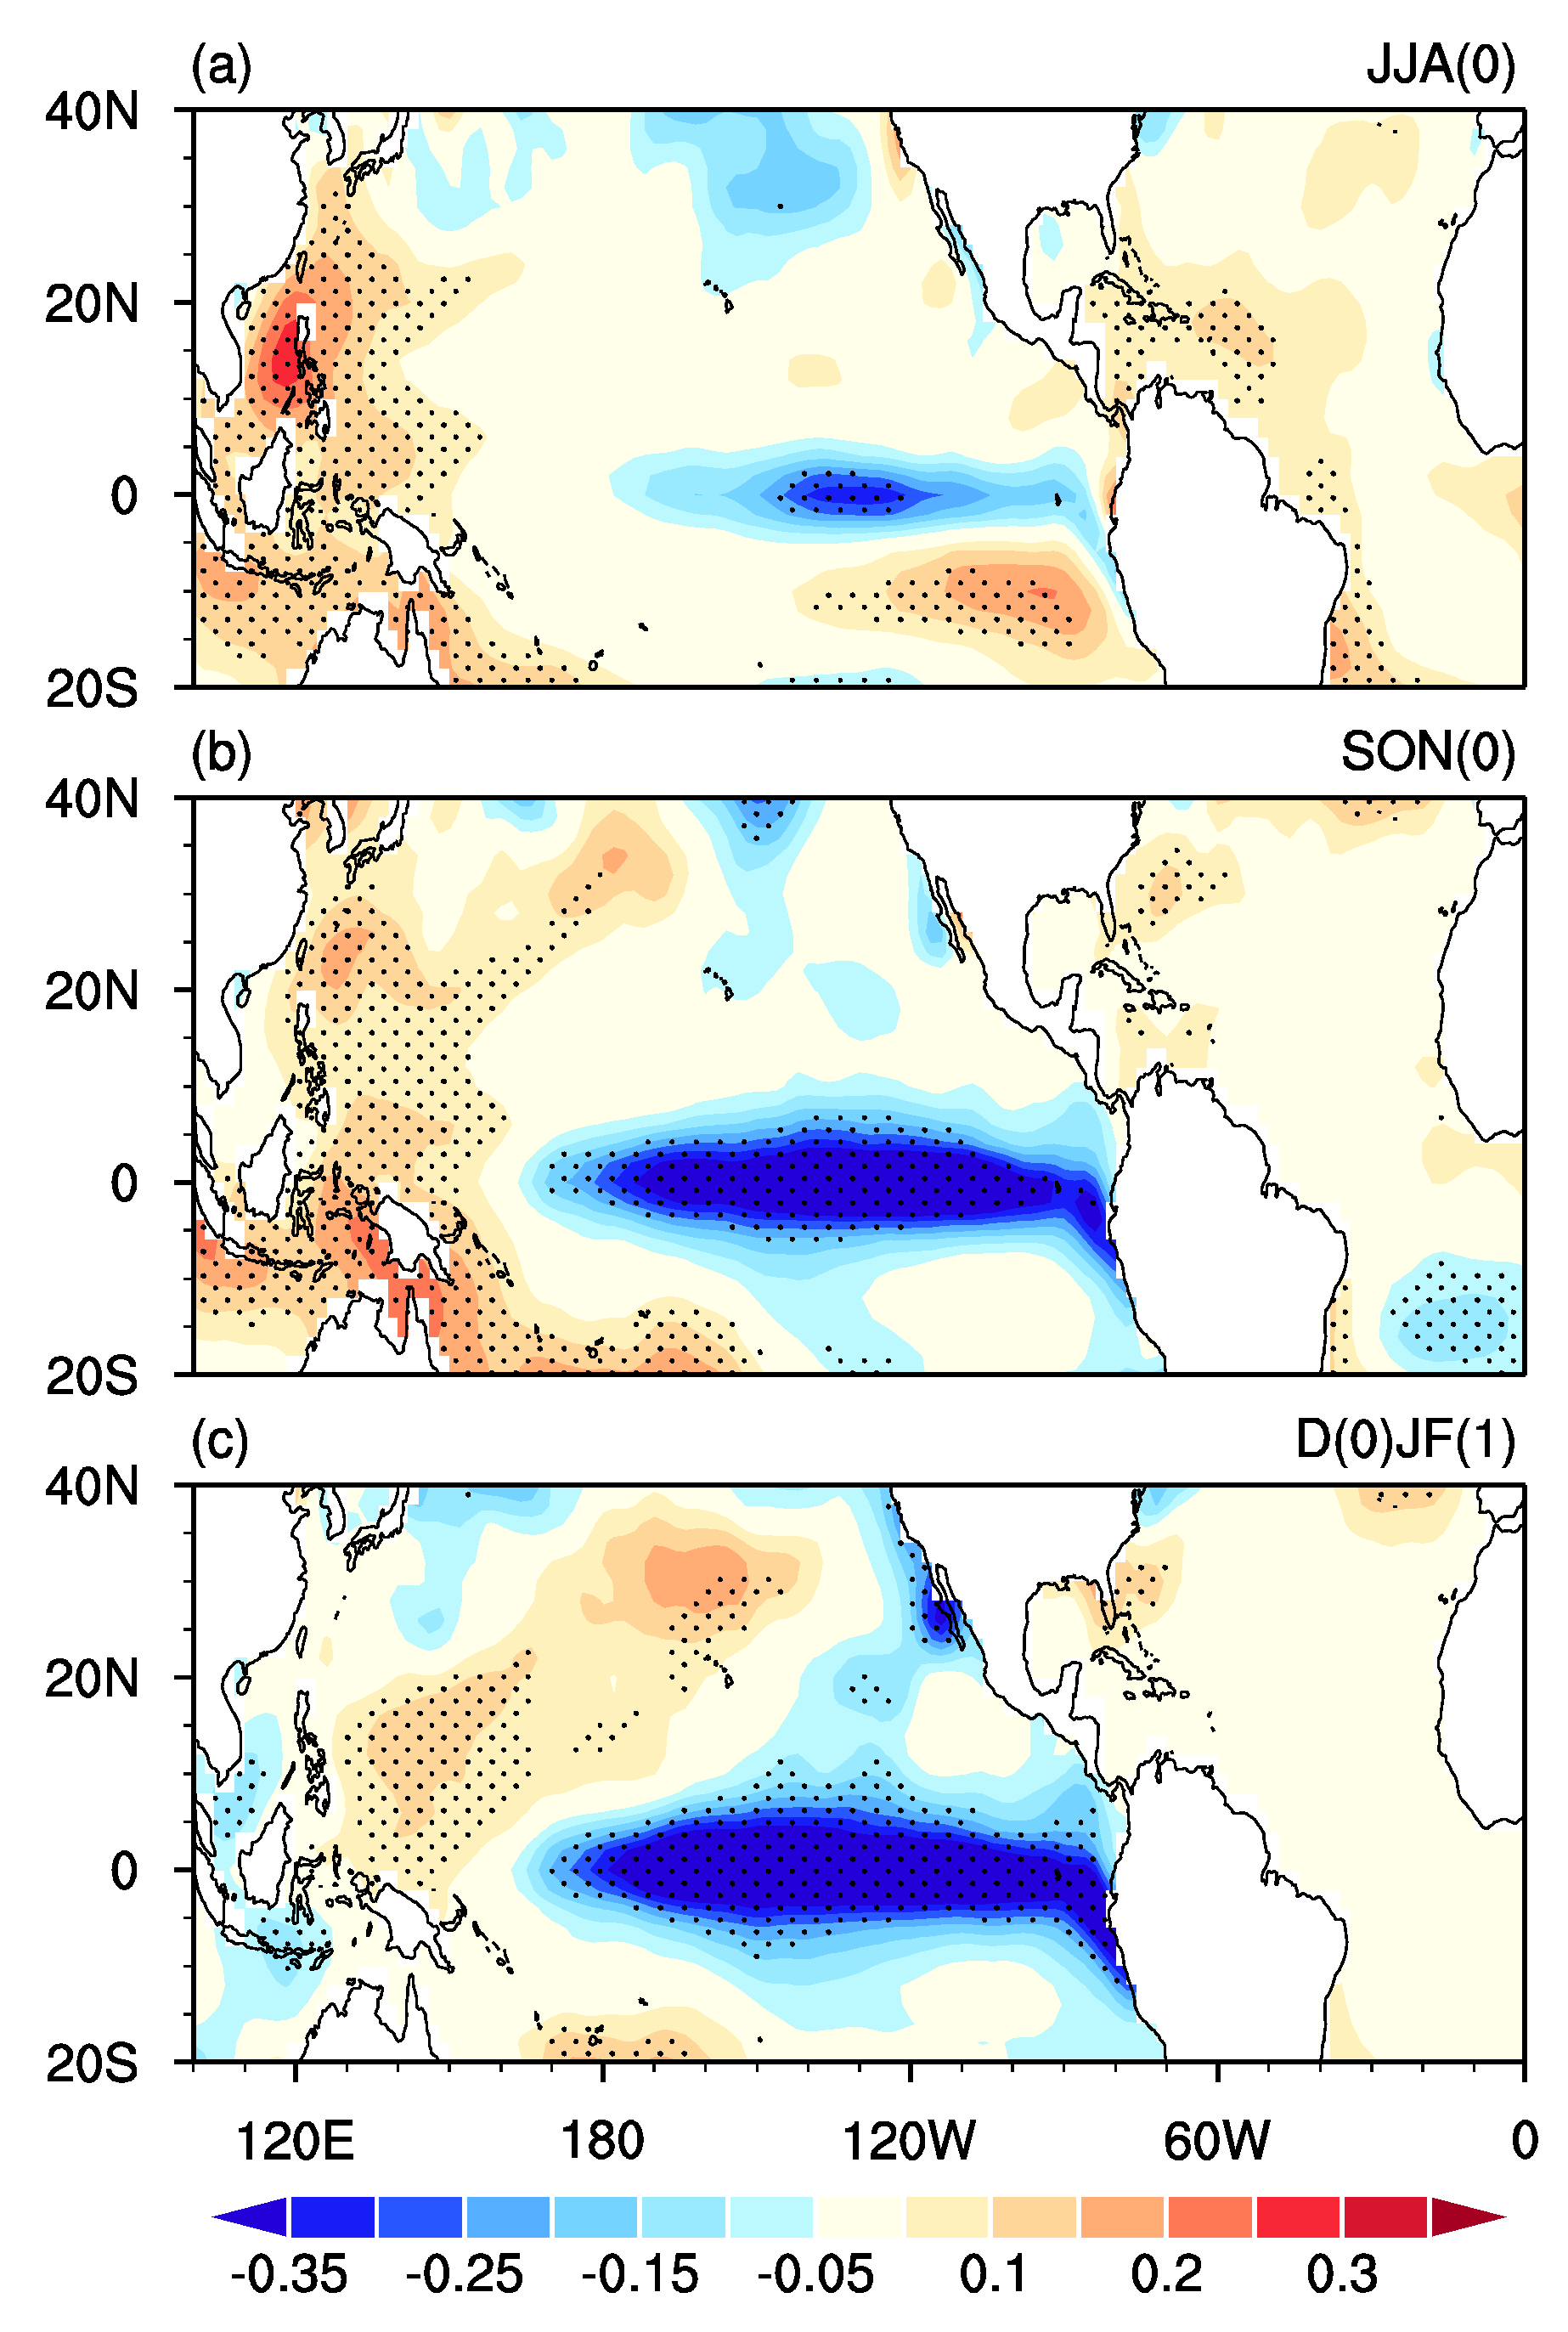
Recently, Ham et al. [76] showed that the Northern tropical Atlantic (NTA) SST mode, one of the most important components of the tropical Atlantic SST variability [77,78,79], in the boreal spring, has a significant impact on the CP ENSO in the subsequent winter (Figure 5). Specifically, SST warming in the NTA region during the boreal spring would induce significant atmospheric heating anomalies there, especially over the equatorial Atlantic, where the Atlantic intertropical convergence zona (ITCZ) is located. The atmospheric heating results in a significant cyclonic anomaly over the subtropical eastern Pacific in the lower troposphere as a Matsuno–Gill-type atmospheric response, together with pronounced northeasterly wind anomalies to its western flank. These northeasterly wind anomalies lead to SST cooling over the subtropical northeast Pacific via enhancement of the climatological trade wind and advection of cold and dry air from higher latitudes, which further result in a sinking motion and negative precipitation anomalies over the tropical central Pacific. The associated suppression in the convection over the tropical central NP region near the vicinity of the ITCZ generates a significant low-level anomalous anticyclone over the subtropical western NP, and increases the northerly wind anomalies on its eastern flank which, in turn, sustain the negative precipitation and SST there. The coupling among the negative SST, northerly wind, and negative precipitation anomalies result in a westward and equatorward extension of the anticyclonic anomaly and precipitation anomalies from spring to summer. As a result, significant easterly wind anomalies are formed in the TWP during the following summer, which further contribute to the development of the La Niña-like SST cooling in the following winter (Figure 5).
Ham et al. [76] further demonstrated that ENSO events induced by the preceding spring NTA SST anomalies tend to be the CP-type ENSO, with the center of SST anomalies located in the central Pacific, rather than the EP-type ENSO (Figure 5). The spring NTA SST–ENSO relation has also been examined using the CMIP3 and CMIP5 simulations. Ham et al. [80] found that most of the climate models that participated in the CMIP3 and CMIP5 can simulate well the significant connection between the spring NTA SST and following winter ENSO. In addition, the westward propagation of the NTA SST-associated signals from Atlantic to Pacific, along the off-equatorial Pacific ITCZ, can be obtained by the multi-model ensemble (MME), implying that the physical process contributing to the spring NTA SST–ENSO connection could be reproduced in the CMIP models.
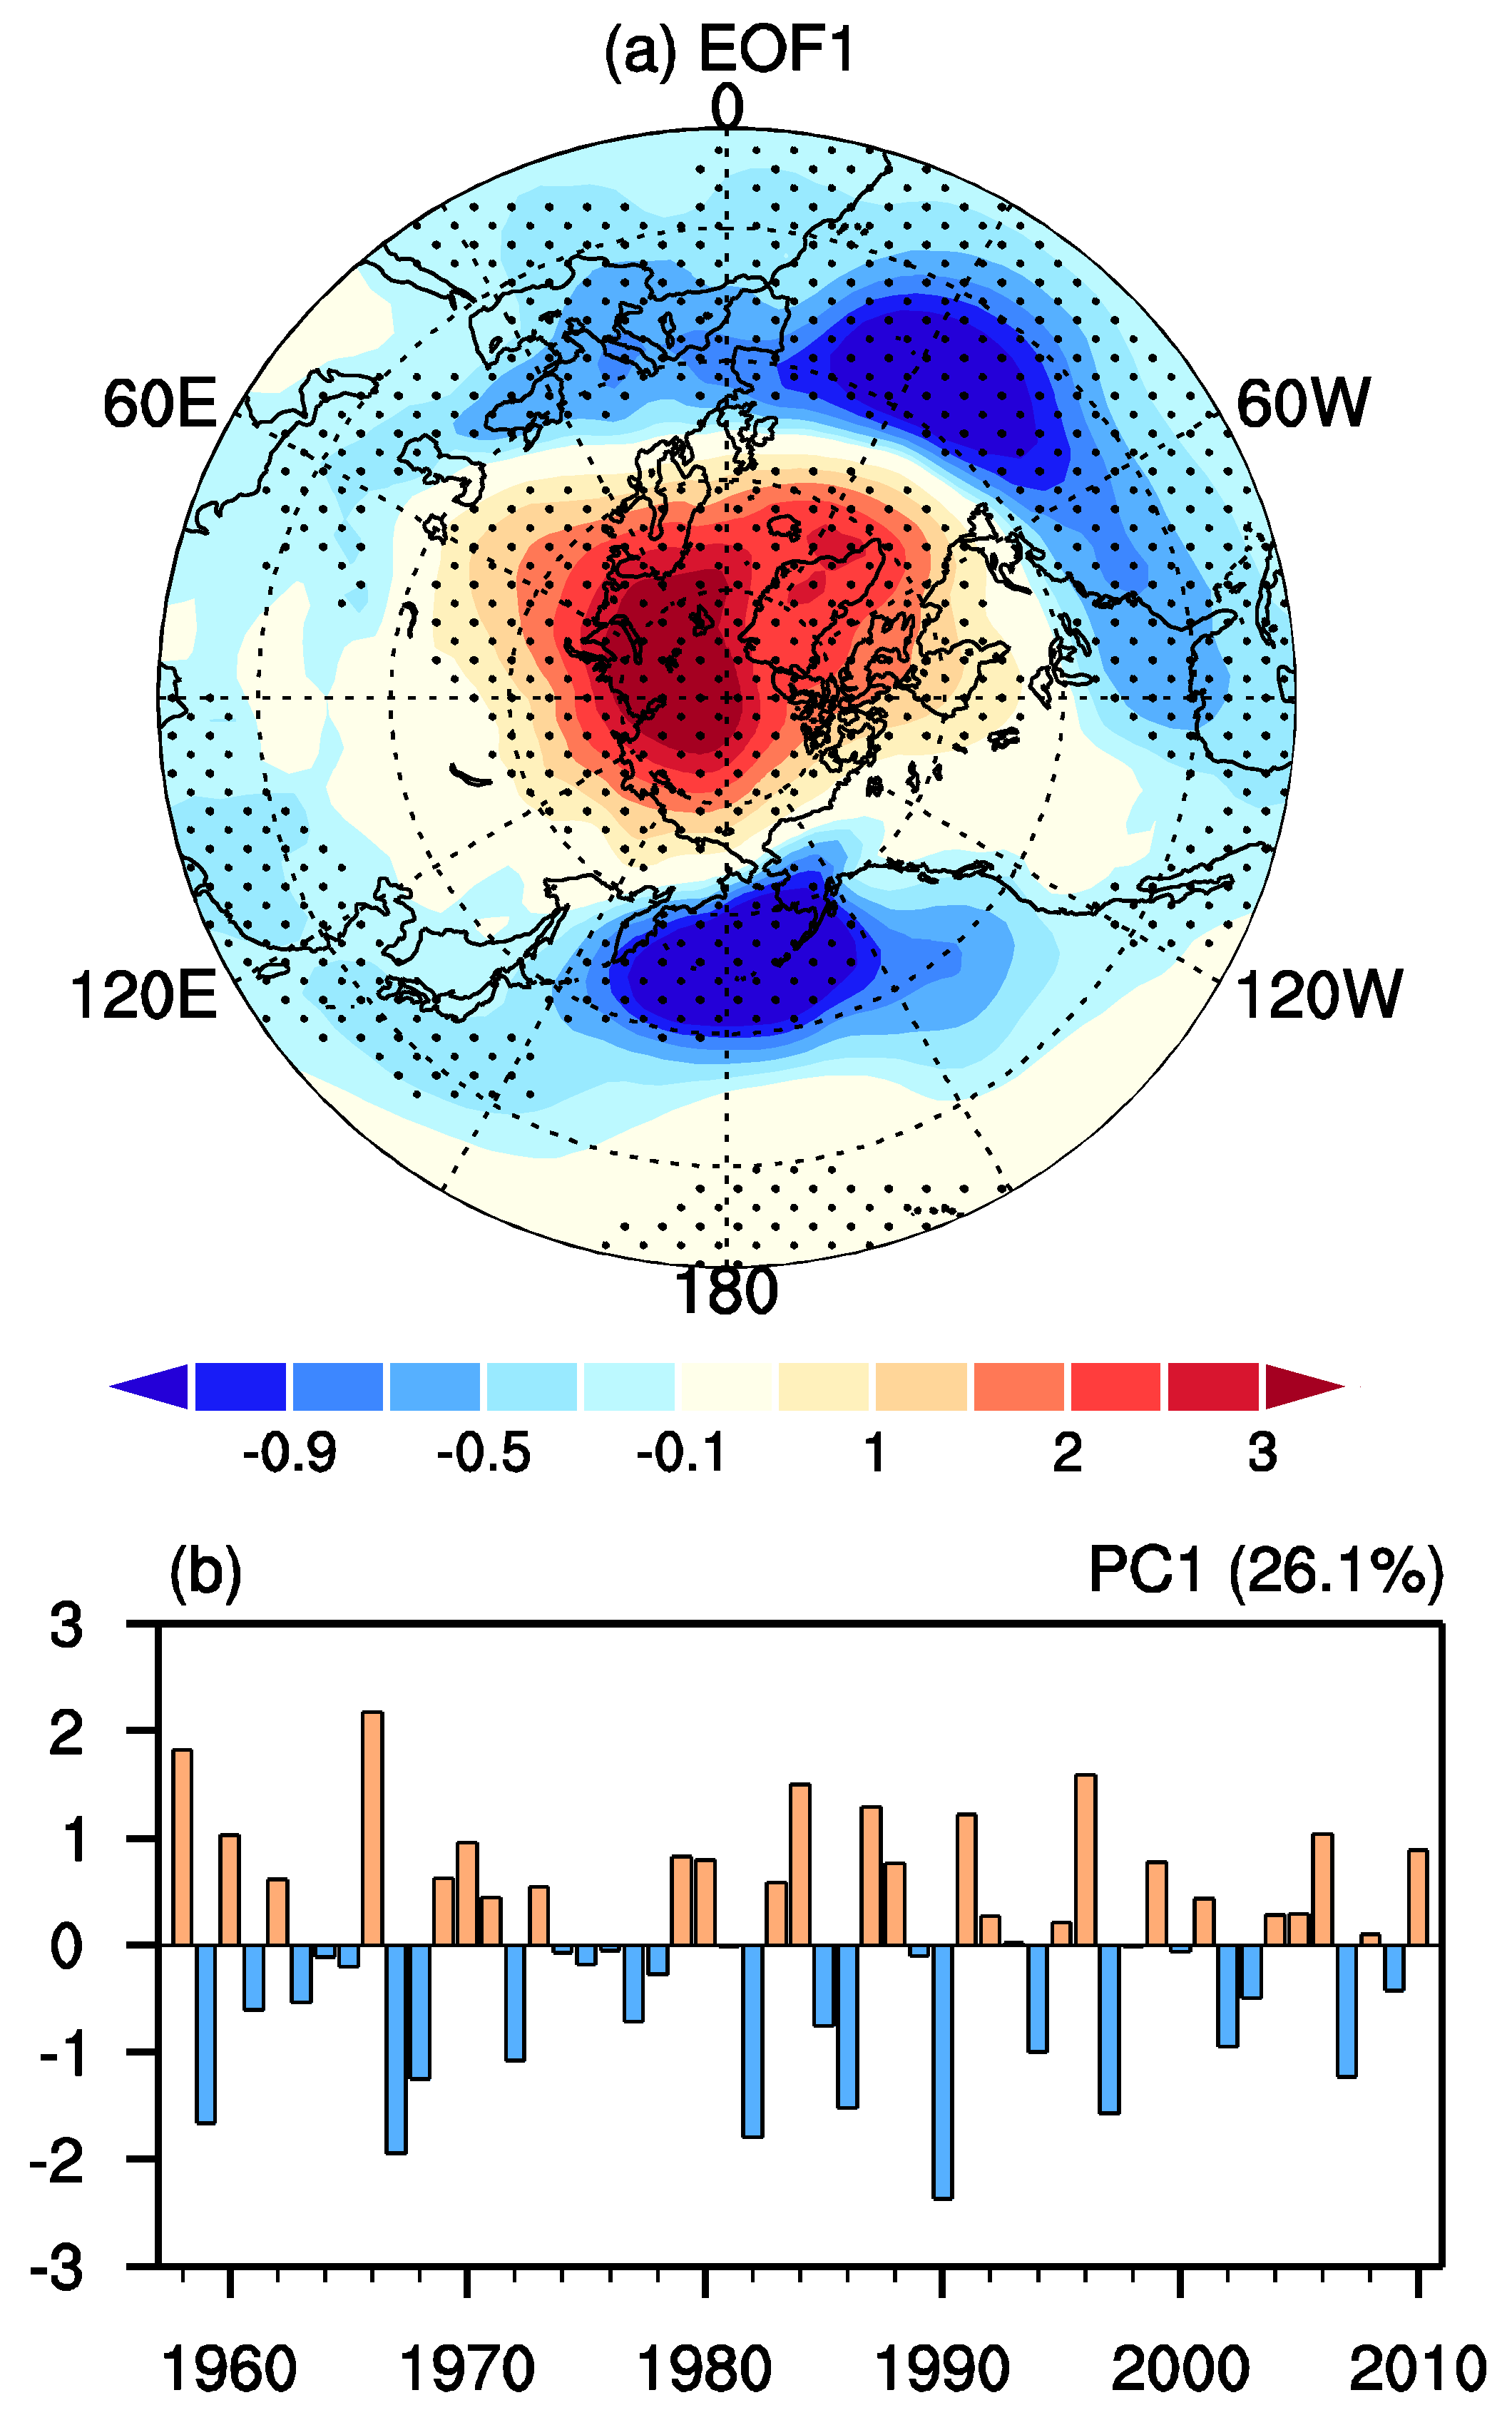
Chen and Wu [81] found that the impact of the spring NTA SST on the following winter ENSO experienced a significant interdecadal change around the early 1980s. Before the early-1980s, the impact of the spring NTA SST on ENSO is extremely weak. After the interdecadal change, the spring NTA SST–ENSO relation became strong and significant (Figure 6). The spring NTA SST-induced cyclonic anomaly over the subtropical northeastern Pacific and the anticyclonic anomalies over the subtropical western-central Pacific are much stronger after, than before, the early-1980s. As such, the induced easterly wind anomalies over the TWP are much stronger after the early-1980s, which are favorable for occurrence of a La Niña event in the following winter. By contrast, the easterly wind anomalies over the TWP are weak and insignificant. Hence, the spring NTA SST–ENSO connection is weak before the early-1980s. The change in the intensity of the spring NTA SST-induced atmospheric circulation anomalies is also found to be attributed to the change in the spring climatology of precipitation over the tropical Atlantic region.
Previous studies also demonstrated that the occurrence of an Atlantic Niño (Niña) event during the boreal summer is favorable for the development of a La Niña (an El Niño) event in the following winter (Figure 7) [33]. These studies indicated that the summer Atlantic Niño impacts the following winter La Niña via inducing an anomalous Walker circulation with upward motion anomalies over the Atlantic, and downward motion anomalies over the tropical central Pacific. The resultant increase in the low-level divergence in the tropical central Pacific would shallow the equatorial thermocline and favor development of a La Niña in the following winter [33]. Processes are generally opposite for the impact of the Atlantic Niña on the following winter El Niño event. In addition, it is suggested that the Atlantic Multidecadal Oscillation (AMO), the dominant mode of SST variability in the North Atlantic on the multidecadal timescale [82], can influence the multidecadal ENSO variability via changing the Walker circulation in the Pacific Ocean [71,72,73].
3.3. SST Variability over Indian Ocean
The SST variability over the Indian Ocean also shows a significant modulation on the tropical ENSO variability [22,34,35,83,84,85,86,87,88]. Studies indicated that the Indian Ocean basin mode (IOBM), the leading EOF mode of SST variability over the Indian Ocean [88], can significantly modulate the ENSO variability [22,83,84,85,86,87,88]. Wu and Kirtman [83] found that the Indian Ocean SST warming could lead to significant easterly wind anomalies at low-level over the tropical eastern Indian Ocean and western Pacific, via changing the convective heating over the Indian Ocean and related Walker circulation anomalies over the tropical Indian and Pacific Oceans. The resultant anomalous low-level easterly wind anomalies over the TWP would further impact the ENSO variability via triggering the air–sea interaction over the tropical Pacific and through oceanic dynamics. Dong and McPhaden [22] demonstrated that the SST warming in the Indian Ocean, from May to July in 2014, played an important role in impeding occurrence of an El Niño event in the following winter.
The Indian Ocean dipole (IOD), the second EOF mode of Indian Ocean SST variability [89], during boreal autumn (i.e., September–November) has also been found to exert significant influences on the wintertime ENSO event in the next year [34,35]. In particular, a positive (negative) phase of the autumn IOD is an efficient predictor of a La Niña (an El Niño) event in the next year (Figure 8). The impact of the IOD on ENSO is mainly through modulating the zonal wind anomalies over the Pacific Ocean [34,35]. It should be mentioned that ENSO is also an important driver of the IOBM and IOD related SST variations [88].
3.4. Atmospheric Forcings over the Extratropical Northern Hemisphere
In this subsection, we present a review of the impact of the Arctic Oscillation and Asian monsoon activity on the ENSO occurrence.
3.4.1. Impacts of AO on ENSO
The AO is the leading atmospheric variability over the NH extratropics on the interannual timescale [28,29,30]. The spatial pattern of the AO is characterized by an annular oscillation in the SLP, and geopotential height anomalies between the Arctic and the northern mid-latitudes (Figure 9), as well as a vertically barotropic structure [28,29,30].
Nakamura et al. [25] firstly reported that the boreal spring AO has a significant impact on the ENSO occurrence in the following winter via modulating the WWB over the TWP. WWBs over the TWP are important triggers for the outbreak of ENSO events in the following winter through stimulating the eastward propagating equatorial warm Kelvin wave [90,91,92,93]. Nakamura et al. also showed that the significant spring AO–ENSO connection is independent of the ENSO cycle. In a following study, Nakamura et al. [94] suggested that the formation of the WWBs over the TWP, in association with the positive phase of the spring AO, may be attributed to an enhancement of the frequent of the Asian cold surge. Chen et al. [31] confirmed the spring AO–ENSO relationship, but argued that it is the interaction between synoptic scale eddies and the low frequency mean flow and the associated vorticity transportation over NP that play important roles in the generation of the spring AO-related cyclonic anomaly over the subtropical western NP. They found that significant westerly wind anomalies tend to appear over the TWP to the south flank of the anomalous cyclone. Meanwhile, the pronounced atmospheric heating anomalies over the subtropical western-central Pacific, partially due to the SST warming induced by the anomalous cyclone, play a key role in maintaining the westerly wind anomalies over the TWP from spring to summer. The westerly wind anomalies over the TWP further lead to SST warming in the TCEP during the following summer via triggering an eastward propagating warm equatorial Kelvin wave, which would eventually develop into an El Niño event via a Bjerknes-like positive air–sea feedback mechanism (Figure 10).
The recent strong 2015–16 El Niño event provides a good example showing the contribution of the spring AO on ENSO [95] (Figure 11). In particular, the anomalous strong positive spring AO in 2015 contributes partially to the formation of the strong westerly wind anomalies over the equatorial western Pacific during boreal spring, which play a key role in the onset of the strong 2015–16 El Niño event via triggering an eastward propagating equatorial warm Kelvin wave (Figure 11). The spring AOs were also in strong positive phases before the occurrences of the strong 1982–83 and 1997–98 El Niño events (Figure 9b), suggesting that the spring AO may be one of the most important triggers of strong El Niño events [95]. However, it should be noted that other factors, such as the cold surge activity related to the East Asian monsoon activity, the tropical cyclone, and the Madden–Julian oscillation (MJO), are also important for the formation of the westerly wind anomalies over the equatorial western Pacific related to the strong 1982–83, 1997–98, and 2015–16 El Niño events, as indicated in previous studies [96,97,98,99,100,101].
The impact of the spring AO on the subsequent winter ENSO was found to be asymmetric [102]. Specifically, during positive spring AO years, pronounced El Niño-like SST warming appears in the TCEP in the subsequent winter. By contrast, during negative spring AO years, the negative SST anomalies are weak and insignificant in the TCEP. In addition, Chen et al. [103] reported that the impact of the spring AO on the subsequent winter ENSO has undergone significant interdecadal changes in the past. Impacts of the spring AO on ENSO are weak during the periods before the early-1970s and after the mid-1990s, while the spring AO–ENSO connection is strong and statistically significant in the 1970s and 1980s (Figure 12). They suggested that the change in the spring NP storm track intensity contributes mainly to the interdecadal change of the AO–ENSO connection around the early-1970s. Furthermore, the observed connection between the spring AO and following winter ENSO has also been evaluated in the CMIP5 climate models [104]. It is found that the ability of the CMIP5 models in capturing the spring AO-related cyclonic anomaly over the subtropical NP is closely related to the model’s performance in reproducing the NP spring storm track intensity and the Pacific component of the spring AO.
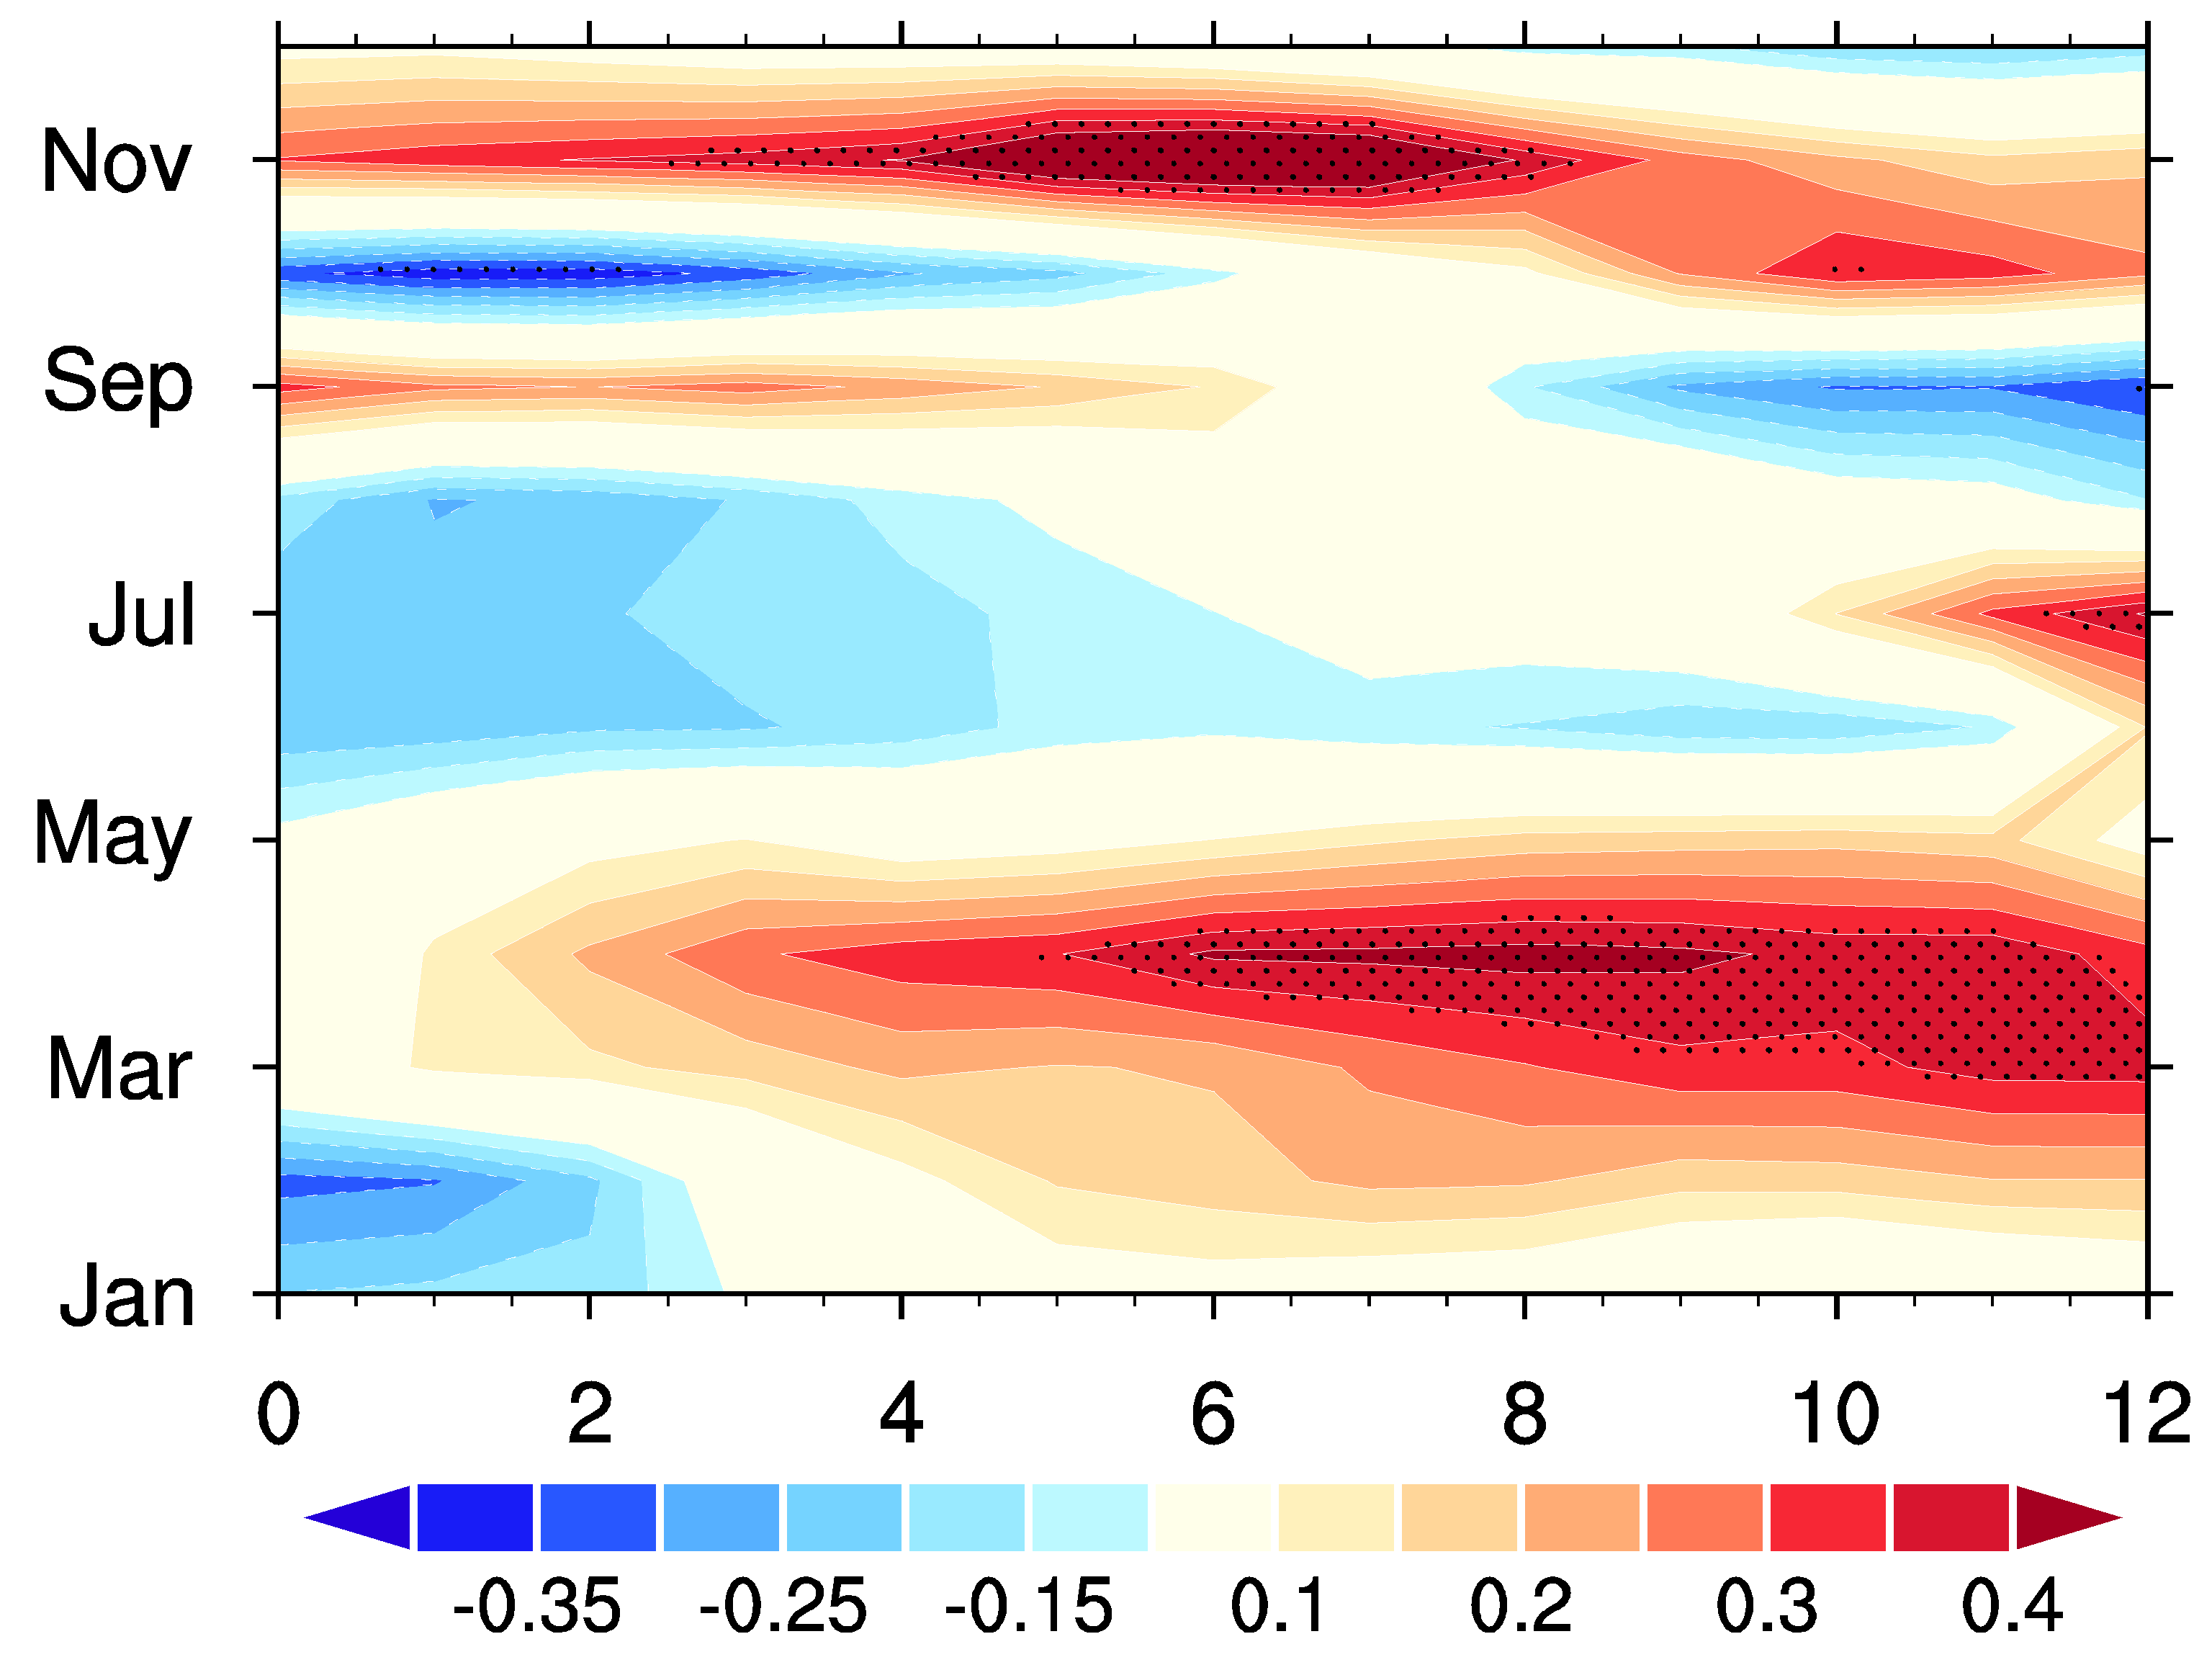
Besides the spring AO, AO in November may also exert substantial impacts on the SST anomalies over the TCEP during the following spring and summer [105] (Figure 13). The significant influence of the November AO on the following spring–summer SST, over the tropical Pacific, is found to be independent of the ENSO cycle. In addition, the impact of the November AO on the following tropical Pacific SST bears some resemblance to that related to the spring AO [31].
Although the impact of the November AO on SST anomalies in the TCEP during the winter one year later is weak, Chen et al. [106] argued that the November AO-induced SST anomalies could perturb the spring AO-generated SST anomalies during the following summer, which would further alter the development of ENSO subsequently in the winter, via modulating the intensity of the positive air–sea interaction in the tropical Pacific. In particular, when November and the following spring AO are in phase, the spring AO can exert a notable impact on the following winter ENSO (Figure 14). By contrast, when November and spring AO are out of phase, the spring AO–winter ENSO relation tends to be very weak (Figure 14). The impact of the November AO on the spring AO–ENSO connection is found to be primary via the constructive and destructive superposition of the November and spring AO-induced SST anomalies in the tropical Pacific during spring and summer, which further impact the development of the SST anomalies there via the positive air–sea feedback.
The impact of the November AO on the following spring–summer SST in the tropical Pacific also experienced a marked enhancement around the late-1970s, as with the spring AO [107]. The November AO–tropical SST connection was insignificant before, but became strong and significant after the late-1970s. After the late-1970s, a marked cyclonic anomaly occurs over the subtropical NP and significant westerly wind anomalies appear over the TWP, in association with the positive November AO. Hence, the November AO has a notable impact on the following spring–summer SST in the TCEP.
3.4.2. Impacts of Asian monsoons on ENSO
The East Asian winter monsoon (EAWM) is an important component of the global climate system [108,109,110,111]. The most pronounced character of the EAWM is the strong northwesterly wind originating from the Siberian High, and flowing along the east coast of East Asia into the South China Sea. Li et al. [112] showed that a stronger EAWM activity during boreal winter may induce an El Niño event in the following winter. Specifically, when the EAWM is strong, the northerly winds flowing along the east coast of the East Asia into the South China Sea and the western Pacific increase. The increase of the northerly wind activity over the tropical western NP would generate significant atmospheric heating there, and induce pronounced cyclonic circulation anomalies. Subsequently, the westerly wind burst related to this anomalous cyclone over the TWP impacts the ENSO occurrence in the following winter, via the anomalous oceanic dynamics and air–sea interaction. In addition, previous studies also indicated that the Indian summer monsoon (ISM) can exert effects on the ENSO evolution during the following winter via modulating the westerly wind anomalies over the tropical western Pacific [113,114,115].
3.5. Atmospheric Forcings over the Extratropical Southern Hemisphere
The Antarctic Oscillation (AAO) is the dominant pattern of the atmospheric variability over the SH [116]. The spatial pattern of the AAO is featured by an oscillation in SLP anomalies between middle and high latitudes of the SH. Zheng et al. [117] found that the austral summer (December–February, DJF) AAO impacts the SST anomalies over the TCEP during following austral autumn (March–May, MAM). Specifically, the DJF AAO-related atmospheric circulation anomalies induce a dipole SST anomaly pattern over the SH, which can maintain into the following MAM. The large-scale SST pattern at MAM modulates the trade winds over the tropical central-eastern Pacific and, hence, the SST anomalies over the Niño-3.4 region.
Besides the AAO, the Pacific–South American (PSA) pattern, the second EOF mode of atmospheric circulation anomalies over the south Pacific, was also found to be significantly connected to the subsequent ENSO occurrence. Ding et al. [118] demonstrated that, similar to the NPO, the austral summer PSA pattern impacts ENSO events in the following austral summer via the SFM over the south Pacific. In particular, they found that the PSA-like atmospheric anomalies over the southern extratropics during the austral summer can induce a quadrupole SST anomaly pattern in the south Pacific. The negative SST anomalies off the east coast of Australia can extend northwestward to the north coast of Australia via a positive WES feedback mechanism, which further leads to significant westerly wind anomalies over the equatorial western-central Pacific, and eventually impacts the development of the El Niño occurrence in the following austral summer.
Ding et al. [119] further investigated the joint influence of the NPO and PSA patterns on the following winter ENSO occurrence using observational and climate model output data. Their results indicated that the ability of the winter NPO (PSA) in triggering an ENSO event one year later depends on the sign of the simultaneous winter PSA (NPO). When the winter NPO and PSA indices have the same sign, both the NPO and the PSA have a close relationship with the following winter ENSO. By contrast, when the two indices have the opposite sign, the influence of the NPO and PSA on ENSO disappears. In another study, Ding et al. [120] showed that the connection between the austral summer PSA pattern and the subsequent austral summer ENSO is unstable, and has experienced significant interdecadal changes. Significant PSA–ENSO connections appeared over the periods 1956–1975 and 1990–2004, but were extremely weak during the periods 1928–1956 and 1975–1990. They argued that the change in the PSA–ENSO connection tends to be related to the strength of the PSA during the austral summer, and is also attributed to the Pacific decadal oscillation and the long-term variation of the AAO.
4. Summary and Discussions
ENSO is the strongest interannual atmosphere–ocean coupling mode in the tropics. Understanding the ENSO variability and its forming mechanisms has important implications for the prediction of weather and climate over many parts of the globe. It is well known that the air–sea interaction and oceanic dynamics in the tropical Pacific are important in generating and maintaining the ENSO variability. Besides the processes in the tropical Pacific, more and more evidence has indicated that atmosphere–ocean forcings outside the tropical Pacific also play non-negligible roles in impacting and modulating the ENSO occurrence. This paper provides an overview of the contribution of atmospheric and oceanic forcings outside the tropical Pacific on ENSO.
The atmospheric forcings on the ENSO occurrence, as reviewed, include (1) boreal winter NPO [23,24], the second EOF mode of atmospheric circulation anomalies over the extratropical NP, (2) boreal spring AO [25,31], the leading EOF mode of atmospheric circulation anomalies over the extratropical NH, (3) Asian monsoon systems [112,113,114], (4) December NAO [68], the leading EOF mode of atmospheric circulation anomalies over the North Atlantic, (5) austral summer AAO [117], the leading EOF mode of atmospheric circulation anomalies over the extratropical SH, and (6) austral summer PSA [118], the second EOF mode of atmospheric circulation anomalies over the extratropical SH.
In general, the westerly wind anomalies over the tropical western Pacific are crucial in relaying the impacts of the above described extratropical atmospheric forcings on the ENSO variability. It has been demonstrated that the westerly wind anomaly over the TWP is an important trigger for the ENSO outbreak. The boreal spring AO could induce a significant cyclonic anomaly over the subtropical NP and related westerly wind anomalies over the TWP, via the interaction between synoptic scale eddies, and the low frequency mean flow and the associated vorticity transportation. The NPO, AAO, and PSA would induce tropical atmospheric circulation anomalies and the westerly wind anomalies over the TWP via the SFM-like mechanism. The enhancement of the EAWM activity could induce pronounced westerly wind anomalies over the TWP via the East Asian monsoon cold surge. In addition, the positive December NAO would induce Eurasian snow cover anomalies and cool the surface atmosphere, which further trigger an eastward propagating Rossby wave train and enhance the East Asian monsoon cold surge. The enhanced cold surge, in turn, induces significant westerly wind bursts over the TWP.
We also review the contribution of the oceanic forcings outside the tropical Pacific on the ENSO occurrence, including (1) North Atlantic SST variability [33,71,72,73,74,75,76], including the NTA SST, Atlantic Niño, and the AMO, (2) SST variability over the extratropical North Pacific [61,63,64], and (3) Indian Ocean SST variability, including the IOBM and IOD related SST anomalies [22,34,35,87,88].
Like the atmospheric forcing-induced process, the westerly wind anomalies over the TWP also play a key role in relaying the impacts of these SST forcings on the ENSO variability. In addition, above SST forcings induce wind anomalies over the TWP, mainly via the atmospheric bridge to the Pacific. For example, the boreal summer SST anomalies over the North Atlantic mid-latitudes would trigger a Rossby wave train, propagating from the North Atlantic to East Asia. The winter atmospheric circulation anomalies induced by the preceding summer SST anomalies over the North Atlantic could induce westerly wind anomalies over the TWP via modulating the EAWM intensity. In addition, the NTA-related SST warming could induce a significant anticyclonic anomaly over the WNP and related westerly wind anomalies over the TWP via the subtropical atmospheric teleconnection.
The atmosphere–ocean forcings outside the tropical Pacific contribute to the tropical ENSO variability. However, there are many relevant questions that remain to be investigated. In particular:
(1) It is still unclear whether there exist significant connections among the various forcing factors identified above. Previous studies indicated that there exists a significant coupling between the NAO and the North Atlantic SST anomalies [121,122,123,124,125,126]. On the one hand, the NAO-related atmospheric circulation anomalies lead to a tripole SST anomaly pattern over the North Atlantic via modulating the surface heat fluxes. On the other hand, the triple SST anomaly would, in turn, generate a NAO-like atmospheric variability via the eddy feedback mechanism. In addition, the winter NPO would induce a tripole SST anomaly pattern in the NP, which bears resemblance to that associated with the spring VM. Hence, it is of great interest to explore the joint impacts of these forcing factors on ENSO.
(2) It remains to be explored, the ability of the up-to-date climate models in simulating the impacts of many of these atmosphere–ocean forcings on ENSO. In particular, the performance of the climate models, that participated in the CMIP5 and CMIP6, in reproducing these forcing contributions on ENSO, awaits examination. The factors responsible for the model biases in capturing the observed contributions should be assessed. These have important implications in improving the ENSO prediction skill.
(3) Recent studies revealed interdecadal changes in the impact of the atmosphere–ocean variability on the ENSO occurrence. Understanding the factors contributing to the interdecadal change is crucial for the ENSO prediction. However, given the relatively short observational period, the interdecadal change needs to be confirmed, and its mechanisms need to be examined using a longer time series. The abundant datasets from the CMIP climate model output, including the preindustrial, historical, and future projected experiments, provide an excellent source to address these issues and to further separate the role of internal climate variability and external forcings in modulating the contribution of the atmosphere–ocean variability outside the tropical Pacific on ENSO.
(4) This study reviews the impact of the atmosphere–ocean forcings outside the tropical Pacific on the tropical ENSO variability. It should be noted that the ENSO-associated SST anomalies over the tropical Pacific also influence atmospheric circulation and SST anomalies outside the tropical Pacific [127,128,129,130,131,132]. For example, studies indicated that ENSO brings significant SST anomalies in the extratropical Pacific, Indian, and Atlantic Oceans, via the ENSO-associated atmospheric circulation anomalies [5,6,7,128]. The Indian summer monsoon and East Asian monsoon systems are significantly influenced by the ENSO cycle [4,8,129]. In addition, previous studies suggested that SST anomalies in the tropical Pacific affect the AO, NPO, NAO, and PSA teleconnection patterns [130,131,132]. Hence, more investigations are needed to fully understand the two-way interaction between ENSO and the atmosphere–ocean system outside the tropical Pacific.
Funding
This research received no external funding.
Acknowledgments
We thank two anonymous reviewers for their constructive suggestions and comments, which helped to improve the paper. This study is jointly supported by the National Natural Science Foundation of China grants (41605050, 41530425, 41775080, and 41721004), the Chinese Academy of Sciences Key Research Program of Frontier Sciences (QYZDY-SSW-DQC024), and the Young Elite Scientists Sponsorship Program by CAST (2016QNRC001).
Conflicts of Interest
The authors declare no conflict of interest.
References
- Bjerknes, J. Atmospheric teleconnections from the equatorial Pacific. Mon. Weather Rev. 1969, 97, 163–172. [Google Scholar] [CrossRef]
- Philander, S.G. El Niño, La Niña, and the Southern Oscillation; Academic Press: London, UK, 1990; Volume 46, 289p. [Google Scholar]
- Neelin, J.D.; Battisti, D.S.; Hirst, A.C.; Jin, F.F.; Wakata, Y.; Yamagata, T.; Zebiak, S.E. ENSO theory. J. Geophys. Res. 1998, 103, 14261–14290. [Google Scholar] [CrossRef] [Green Version]
- Wang, B.; Wu, R.; Fu, X. Pacific-East Asian teleconnection: How does ENSO affect East Asian climate? J. Clim. 2000, 13, 1517–1536. [Google Scholar] [CrossRef]
- Alexander, M.A.; Bladé, I.; Newman, M.; Lanzante, J.R.; Lau, N.C.; Scott, J.D. The atmospheric bridge: The influence of ENSO teleconnections on air-sea interaction over the global oceans. J. Clim. 2002, 15, 2205–2231. [Google Scholar] [CrossRef]
- Alexander, M.A.; Scott, J.D. The influence of ENSO on air-sea interaction in the Atlantic. Geophys. Res. Lett. 2002, 29, 1701. [Google Scholar] [CrossRef]
- Chiang, J.C.H.; Sobel, A.H. Tropical tropospheric temperature variations caused by ENSO and their influence on the remote tropical climate. J. Clim. 2002, 15, 2616–2631. [Google Scholar] [CrossRef]
- Huang, R.H.; Chen, W.; Yan, B.L.; Zhang, R.H. Recent advances in studies of the interaction between the East Asian winter and summer monsoons and ENSO cycle. Adv. Atmos. Sci. 2004, 21, 407–424. [Google Scholar]
- Chen, S.F.; Song, L.Y. The leading interannual variability modes of winter surface air temperature over Southeast Asia. Clim. Dyn. 2018, 1–20. [Google Scholar] [CrossRef]
- McPhaden, M.J. El Niño and La Niña: Causes and global consequences. In Encyclopedia of Global Environmental Change; MacCracken, M.C., Perry, J.S., Eds.; Wiley: Chicester, UK, 2002; Volume 1, pp. 353–370. [Google Scholar]
- Wu, R.; Hu, Z.Z.; Kirtman, B.P. Evolution of ENSO-related rainfall anomalies in East Asia. J. Clim. 2003, 16, 3742–3758. [Google Scholar] [CrossRef]
- Yu, B.; Zwiers, F. The impact of combined ENSO and PDO on the PNA climate: A 1,000 -year climate modeling study. Clim. Dyn. 2007, 29, 837–851. [Google Scholar] [CrossRef]
- Graf, H.F.; Zanchettin, D. Central Pacific El Niño, the “subtropical bridge,” and Eurasian climate. J. Geophys. Res. 2012, 117, D01102. [Google Scholar] [CrossRef]
- Chan, J.C.L. Interannual and interdecadal variations of tropical cyclone activity over the western North Pacific. Meteorol. Atmos. Phys. 2005, 89, 143–152. [Google Scholar] [CrossRef]
- Gray, W.M. Atlantic seasonal hurricane frequency. Part I: El Niño and 30 mb quasi-biennial oscillation influences. Mon. Weather Rev. 1984, 112, 1649–1668. [Google Scholar] [CrossRef]
- Battisi, D.S.; Hirst, A.G. Interannual variability in a tropical atmosphere-ocean model: Influence of the basic state, ocean geometry and nonlinearly. J. Atmos. Sci. 1989, 46, 1687–1712. [Google Scholar] [CrossRef]
- Jin, F.F. An equatorial ocean recharge paradigm for ENSO. Part I: Conceptual model. J. Atmos. Sci. 1997, 54, 811–829. [Google Scholar] [CrossRef]
- Schopf, P.S.; Suarez, M.J. Vacillations in a coupled ocean-atmosphere model. J. Atmos. Sci. 1988, 45, 549–566. [Google Scholar] [CrossRef]
- Tollefson, J. El Niño tests forecasters. Nature 2014, 508, 20–21. [Google Scholar] [CrossRef] [PubMed] [Green Version]
- Menkes, C.E.; Lengaigne, M.; Vialard, J.; Puy, M.; Marchesiello, P.; Cravatte, S.; Cambon, G. About the role of Westerly Wind Events in the possible development of an El Niño in 2014. Geophys. Res. Lett. 2014, 41, 6476–6483. [Google Scholar] [CrossRef]
- Zhu, J.; Kumar, A.; Huang, B.; Balmaseda, M.; Hu, Z.Z.; Marx, L.; Kinter, J.L., III. The role of off-equatorial surface temperature anomalies in the 2014 El Niño prediction. Sci. Rep. 2016, 6, 19677. [Google Scholar] [CrossRef] [PubMed] [Green Version]
- Dong, L.; McPhaden, M.J. Unusually warm Indian Ocean sea surface temperature help to arrest development of El Niño in 2014. Sci. Rep. 2018, 8, 2249. [Google Scholar] [CrossRef] [PubMed]
- Vimont, D.J.; Battisti, D.S.; Hirst, A.C. Footprinting: A seasonal connection between the tropics and mid-latitudes. Geophys. Res. Lett. 2001, 28, 3923–3926. [Google Scholar] [CrossRef] [Green Version]
- Vimont, D.J.; Wallace, J.M.; Battisti, D.S. The seasonal footprinting mechanism in the Pacific: Implications for ENSO. J. Clim. 2003, 16, 2668–2675. [Google Scholar] [CrossRef]
- Nakamura, T.; Tachibana, Y.; Honda, M.; Yamane, S. Influence of the Northern Hemisphere annular mode on ENSO by modulating westerly wind bursts. Geophys. Res. Lett. 2006, 33, L07709. [Google Scholar] [CrossRef]
- Kalnay, E.; Kanamitsu, M.; Kistler, R.; Collins, W.; Deaven, D.; Gandin, L.; Iredell, M.; Saha, S.; White, G.; Woollen, J. The NCEP/NCAR 40-year reanalysis project. Bull. Am. Meteorol. Soc. 1996, 77, 437–471. [Google Scholar] [CrossRef]
- Smith, T.M.; Reynolds, R.W.; Peterson, T.C.; Lawrimore, J. Improvements to NOAA’s historical merged land-ocean surface temperature analysis (1880–2006). J. Clim. 2008, 21, 2283–2296. [Google Scholar] [CrossRef]
- Thompson, D.W.J.; Wallace, J.M. The Arctic Oscillation signature in the wintertime geopotential height and temperature fields. Geophys. Res. Lett. 1998, 25, 1297–1300. [Google Scholar] [CrossRef]
- Thompson, D.W.J.; Wallace, J.M. Annular Modes in the extratropical circulation. Part I: Month-to-Month Variability. J. Clim. 2000, 13, 1000–1016. [Google Scholar] [CrossRef]
- Thompson, D.W.J.; Wallace, J.M.; Hegerl, G.C. Annular Modes in the extratropical circulation. Part II: Trends. J. Clim. 2000, 13, 1018–1036. [Google Scholar] [CrossRef]
- Chen, S.F.; Yu, B.; Chen, W. An analysis on the physical process of the influence of AO on ENSO. Clim. Dyn. 2014, 42, 973–989. [Google Scholar] [CrossRef]
- Yu, J.Y.; Kim, S.T. Relationships between extratropical sea level pressure variations and the central Pacific and eastern Pacific types of ENSO. J. Clim. 2011, 24, 708–720. [Google Scholar] [CrossRef]
- Rodrıguez-Fonseca, B.; Polo, I.; Garcıa-Serrano, J.; Losada, T.; Mohino, E.; Mechoso, R.; Kucharski, F. Are Atlantic Niños enhancing Pacific ENSO events in recent decades? Geophys. Res. Lett. 2009, 36, L20705. [Google Scholar] [CrossRef]
- Izumo, T.; Vialard, J.; Lengaigne, M.; Montegut, C.; Behera, S.K.; Luo, J.J.; Cravatte, S.; Masson, S.; Yamagata, T. Influence of the state of the Indian Ocean Dipole on the following year’s El Niño. Nat. Geosci. 2010, 3, 168–172. [Google Scholar] [CrossRef]
- Izumo, T.; Vialard, J.; Dayan, H.; Lengaigne, M.; Suresh, I. A simple estimation of equatorial Pacific response from windstress to untangle Indian Ocean Dipole and Basin influences on El Niño. Clim. Dyn. 2016, 46, 2247–2268. [Google Scholar] [CrossRef]
- Walker, G.T.; Bliss, E.W. World weather V. Mem. R. Meteorol. Soc. 1932, 4, 53–84. [Google Scholar]
- Wallace, J.; Gutzler, D. Teleconnections in the geopotential height field during the Northern Hemisphere winter. Mon. Weather Rev. 1981, 109, 784–812. [Google Scholar] [CrossRef]
- Chen, S.F.; Song, L.Y. Definition sensitivity: Impact of winter North Pacific Oscillation on the surface air temperature over Eurasia and North America. Adv. Atmos. Sci. 2018, 35, 702–712. [Google Scholar] [CrossRef]
- Park, J.Y.; Yeh, S.W.; Kug, J.S.; Yoon, J. Favorable connections between seasonal footprinting mechanism and El Niño. Clim. Dyn. 2013, 40, 1169–1181. [Google Scholar] [CrossRef]
- Linkin, M.E.; Nigam, S. The north pacific oscillation-west Pacific teleconnection pattern: Mature-phase structure and winter impacts. J. Clim. 2008, 21, 1979–1997. [Google Scholar] [CrossRef]
- Song, L.Y.; Li, Y.; Duan, W.S. The influence of boreal winter extratropical North Pacific Oscillation on Australian spring rainfall. Clim. Dyn. 2016, 47, 1181–1196. [Google Scholar] [CrossRef]
- Xie, S.P.; Philander, S.G.H. A coupled ocean-atmosphere model of relevance to the ITCZ in the eastern Pacific. Tellus Ser. A-Dyn. Meteorol. Oceanol. 1994, 46, 340–350. [Google Scholar] [CrossRef]
- Vimont, D.J.; Battisti, D.S.; Hirst, A.C. The seasonal footprinting mechanism in the CSIRO general circulation models. J. Clim. 2003, 16, 2653–2667. [Google Scholar] [CrossRef]
- Alexander, M.A.; Vimont, D.J.; Chang, P.; Scott, J.D. The impact of extratropical atmospheric variability on ENSO: Testing the seasonal footprinting mechanism using coupled model experiments. J. Clim. 2010, 23, 2885–2901. [Google Scholar] [CrossRef]
- Pegion, K.; Alexander, M. The seasonal footprinting mechanism in CFSv2: Simulation and impact on ENSO prediction. Clim. Dyn. 2013, 41, 1671–1683. [Google Scholar] [CrossRef]
- Chen, S.F.; Chen, W.; Yu, B.; Graf, H. Modulation of the seasonal footprinting mechanism by the boreal spring Arctic Oscillation. Geophys. Res. Lett. 2013, 40, 6384–6389. [Google Scholar] [CrossRef] [Green Version]
- Larkin, N.K.; Harrison, D.E. On the definition of El Niño and associated seasonal average U.S. weather anomalies. Geophys. Res. Lett. 2005, 32, L13705. [Google Scholar] [CrossRef]
- Ashok, K.; Behera, S.; Rao, A.S.; Weng, H.; Yamagata, T. El Niño Modoki and its teleconnection. J. Geophys. Res. 2007, 112, C11007. [Google Scholar] [CrossRef]
- Yu, J.Y.; Kao, H.Y. Decadal changes of ENSO persistence barrier in SST and ocean heat content indices: 1958–2001. J. Geophys. Res. 2007, 112, D13106. [Google Scholar] [CrossRef]
- Kug, J.S.; Jin, F.F.; An, S.I. Two types of El Niño events: Cold tongue El Niño and warm pool El Niño. J. Clim. 2009, 22, 1499–1515. [Google Scholar] [CrossRef]
- Kao, H.Y.; Yu, J.Y. Contrasting eastern-Pacific and central-Pacific types of El Niño. J. Clim. 2009, 22, 615–632. [Google Scholar] [CrossRef]
- Yu, J.Y.; Kao, H.Y.; Lee, T. Subtropics-related interannual sea surface temperature variability in the central equatorial Pacific. J. Clim. 2010, 23, 2869–2884. [Google Scholar] [CrossRef]
- Furtado, J.C.; Lorenzo, E.D.; Anderson, B.T.; Schneider, N. Linkages between the North Pacific Oscillation and central tropical Pacific SSTs at low frequencies. Clim. Dyn. 2012, 39, 2833–2846. [Google Scholar] [CrossRef]
- Yu, J.Y.; Lu, M.M.; Kim, S.T. A change in the relationship between tropical central Pacific SST variability and the extratropical atmosphere around 1990. Environ. Res. Lett. 2012, 7, 034025. [Google Scholar] [CrossRef] [Green Version]
- Yeh, S.W.; Yi, D.W.; Sung, M.K.; Kim, Y.H. An eastward shift of the North Pacific Oscillation after the mid-1990s and its relationship with ENSO. Geophys. Res. Lett. 2018, 45, 6654–6660. [Google Scholar] [CrossRef]
- Wang, X.; Chen, M.; Wang, C.; Yeh, S.; Tan, W. Evaluation of performance of CMIP5 models in simulating the North Pacific Oscillation and El Niño Modoki. Clim. Dyn. 2018, 1–12. [Google Scholar] [CrossRef]
- Anderson, B.T. Tropical Pacific sea-surface temperatures and preceeding sea level pressure anomalies in the subtropical North Pacific. J. Geophys. Res. 2003, 108, 148–227. [Google Scholar] [CrossRef]
- Anderson, B.T. On the joint role of subtropical atmospheric variability and equatorial subsurface heat content anomalies in initiating the onset of ENSO events. J. Clim. 2007, 20, 1593–1599. [Google Scholar] [CrossRef]
- Deser, C.; Phillips, A.S.; Tomas, R.A.; Okumura, Y.M.; Alexander, M.A.; Capotondi, A.; Scott, J.D.; Kwon, Y.; Ohba, M. ENSO and the Pacific decadal variability in the community climate system model version. J. Clim. 2012, 4, 2622–2651. [Google Scholar] [CrossRef]
- Chen, S.F.; Wu, R. Impacts of winter NPO on subsequent winter ENSO: Sensitivity to the definition of NPO index. Clim. Dyn. 2018, 50, 375–389. [Google Scholar] [CrossRef]
- Wang, S.Y.; L’Heureux, M.; Chia, H.H. ENSO prediction one year in advance using western North Pacific sea surface temperatures. Geophys. Res. Lett. 2012, 39, L05702. [Google Scholar] [CrossRef]
- Chang, P.; Zhang, L.; Saravanan, R.; Vimont, D.J.; Chiang, J.C.; Ji, L.; Seidel, H.; Tippett, M.K. Pacific meridional mode and El Niño-Southern Oscillation. Geophys. Res. Lett. 2007, 34, L16608. [Google Scholar] [CrossRef]
- Ding, R.Q.; Li, J.P.; Tseng, Y.H.; Sun, C.; Guo, Y.P. The Victoria mode in the North Pacific linking extratropical sea level pressure variations to ENSO. J. Geophys. Res. 2015, 120, 27–45. [Google Scholar] [CrossRef] [Green Version]
- Zhang, L.; Xu, H.; Shi, N.; Ma, J. Impact of the North Pacific subtropical sea surface temperature front on El Niño-Southern Oscillation. Int. J. Climatol. 2018, 38, e729–e740. [Google Scholar] [CrossRef]
- van Loon, H.; Rogers, J.C. The seesaw in winter temperatures between Greenland and northern Europe. Part I: General description. Mon. Weather Rev. 1978, 106, 296–310. [Google Scholar] [CrossRef]
- Hurrell, J.W. Decadal trends in the North Atlantic oscillation. Science 1995, 269, 676–679. [Google Scholar] [CrossRef] [PubMed]
- Hurrell, J.W.; van Loon, H. Decadal variations in climate associated with the North Atlantic Oscillation. In Climatic Change at High Elevation Sites; Diaz, H.F., Beniston, M., Bradley, R., Eds.; Springer: Dordrecht, The Netherlands, 1997; pp. 69–94. [Google Scholar]
- Oshika, M.; Tachibana, Y.; Nakamura, T. Impact of the winter North Atlantic Oscillation (NAO) on the Western Pacific (WP) pattern in the following winter through Arctic sea ice and ENSO: Part I—Observational evidence. Clim. Dyn. 2015, 45, 1355–1366. [Google Scholar] [CrossRef]
- Yu, L.A.; Rienecker, M.M. Evidence of an extratropical atmospheric influence during the onset of the 1997–98 El Niño. Geophys. Res. Lett. 1998, 25, 3537–3540. [Google Scholar] [CrossRef]
- Nakamura, T.; Hara, M.; Oshika, M.; Tachibana, Y. Impact of the winter North Atlantic Oscillation (NAO) on the Western Pacific (WP) pattern in the following winter through Arctic sea ice and ENSO. Part II: Multi-model evaluation of the NAO–ENSO linkage. Clim. Dyn. 2015, 45, 3547–3562. [Google Scholar] [CrossRef]
- Martin-Rey, M.; Polo, I.; Rodrıguez-Fonseca, B.; Losada, T.; Lazar, A. Is There Evidence of Changes in Tropical Atlantic Variability Modes under AMO Phases in the Observational Record? J. Clim. 2018, 31, 515–536. [Google Scholar] [CrossRef]
- Levine, A.F.Z.; McPhaden, M.J.; Frierson, D.M.W. The impact of the AMO on multidecadal ENSO variability. Geophys. Res. Lett. 2017, 44, 3877–3886. [Google Scholar] [CrossRef]
- Dong, B.; Sutton, R.T.; Scaife, A.A. Multidecadal modulation of El Niño-Southern Oscillation (ENSO) variance by Atlantic Ocean sea surface temperatures. Geophys. Res. Lett. 2006, 33, L08705. [Google Scholar] [CrossRef]
- Wang, X.; Wang, C.Z.; Zhou, W.; Wang, D.X.; Song, J. Teleconnected influence of North Atlantic sea surface temperature on the El Niño onset. Clim. Dyn. 2011, 37, 663–676. [Google Scholar] [CrossRef]
- Wang, X.; Wang, C.Z.; Zhou, W.; Liu, L.; Wang, D.X. Remote influence of North Atlantic SST on the equatorial westerly wind anomalies in the western Pacific for initiating an El Niño event: An atmospheric general circulation model study. Atmos. Sci. Lett. 2013, 14, 107–111. [Google Scholar] [CrossRef]
- Ham, Y.-Y.; Kug, J.-S.; Park, J.Y.; Jin, F.-F. Sea surface temperature in the north tropical Atlantic as a trigger for El Niño/Southern Oscillation events. Nat. Geosci. 2013, 6, 112–116. [Google Scholar] [CrossRef]
- Huang, B.; Schopf, P.S.; Shukla, J. Intrinsic ocean–atmosphere variability of the tropical Atlantic Ocean. J. Clim. 2004, 17, 2058–2077. [Google Scholar] [CrossRef]
- Chen, S.F.; Wu, R.; Chen, W. The changing relationship between interannual variations of the North Atlantic Oscillation and northern tropical Atlantic SST. J. Clim. 2015, 28, 485–504. [Google Scholar] [CrossRef]
- Chen, S.F.; Wu, R.; Chen, W.; Yao, S. Enhanced linkage between Eurasian winter and spring dominant modes of atmospheric interannual variability since the early-1990s. J. Clim. 2018, 31, 3575–3595. [Google Scholar] [CrossRef]
- Ham, Y.G.; Kug, J.S. Role of North Tropical Atlantic SST on the ENSO Simulated Using CMIP3 and CMIP5 Models. Clim. Dyn. 2015, 45, 3103–3117. [Google Scholar] [CrossRef]
- Chen, S.F.; Wu, R. An enhanced influence of sea surface temperature in the tropical northern Atlantic on the following winter ENSO since the early 1980s. Atmos. Ocean. Sci. Lett. 2017, 10, 175–182. [Google Scholar] [CrossRef]
- Kerr, R.A. A North Atlantic climate pacemaker for the centuries. Science 2000, 288, 1984–1986. [Google Scholar] [CrossRef] [PubMed]
- Wu, R.; Kirtman, B.P. Understanding the impacts of the Indian Ocean on ENSO variability in a coupled GCM. J. Clim. 2004, 17, 4019–4031. [Google Scholar] [CrossRef]
- Kug, J.; Li, T.; An, S.; Kang, I.; Luo, J.; Masson, S.; Yamagata, T. Role of the ENSO-Indian Ocean coupling on ENSO variability in a coupled GCM. Geophys. Res. Lett. 2006, 33, L09710. [Google Scholar] [CrossRef]
- Yu, J.Y.; Mechoso, C.; McWilliams, J.; Arakawa, A. Impacts of the Indian Ocean on the ENSO cycle. Geophys. Res. Lett. 2002, 29. [Google Scholar] [CrossRef]
- Behera, S.; Yamagata, T. Influence of the Indian Ocean on the Southern Oscillation. J. Meteorol. Soc. Jpn. 2003, 81, 169–177. [Google Scholar] [CrossRef]
- Okumura, Y.M.; Deser, C. Asymmetry in the duration of El Niño and La Niña. J. Clim. 2010, 23, 5826–5843. [Google Scholar] [CrossRef]
- Xie, S.P.; Hu, K.; Hafner, J.; Tokinaga, H.; Du, Y.; Huang, G.; Sampe, T. Indian Ocean Capacitor Effect on Indo–Western Pacific Climate during the Summer following El Niño. J. Clim. 2009, 22, 730–747. [Google Scholar] [CrossRef] [Green Version]
- Saji, N.H.; Goswami, B.N.; Viayachandran, P.N.; Yamagata, T. A dipole mode in the tropical Indian Ocean. Nature 1999, 401, 360–363. [Google Scholar] [CrossRef] [PubMed]
- Barnett, T. Interaction of the monsoon and Pacific trade wind system at interannual time scales Part I: The equatorial zone. Mon. Weather Rev. 1983, 111, 756–773. [Google Scholar] [CrossRef]
- Barnett, T.; Dümenil, L.; Schlese, U.; Roeckner, E.; Latif, M. The effect of Eurasian Snow cover on regional and global climate variations. J. Atmos. Sci. 1989, 46, 661–686. [Google Scholar] [CrossRef]
- Huang, R.H.; Zhang, R.H.; Yan, B.L. Dynamical effect of the zonal wind anomalies over the tropical western Pacific on ENSO cycles. Sci. China Ser. D Earth Sci. 2001, 44, 1089–1098. [Google Scholar] [CrossRef]
- Lengaigne, M.; Guilyardi, E.; Boulanger, J.P.; Menkes, C.; Delecluse, P.; Inness, P.; Cole, J.; Slingo, J. Triggering of El Niño by westerly wind events in a coupled general circulation model. Clim. Dyn. 2004, 23, 601–620. [Google Scholar] [CrossRef]
- Nakamura, T.; Tachibana, Y.; Shimoda, H. Importance of cold and dry surges in substantiating the NAM and ENSO relationship. Geophys. Res. Lett. 2007, 34, L22703. [Google Scholar] [CrossRef]
- Chen, S.F.; Wu, R.; Chen, W.; Yu, B.; Cao, X. Genesis of westerly wind bursts over the equatorial western Pacific during the onset of the strong 2015-16 El Niño. Atmos. Sci. Lett. 2016, 17, 384–391. [Google Scholar] [CrossRef]
- McPhaden, M.J. Genesis and evolution of the 1997–98 El Niño. Science 1999, 283, 950–954. [Google Scholar] [CrossRef] [PubMed]
- Puy, M.; Vialard, J.; Lengaigne, M.; Guilyardi, E.; DiNezio, P.N.; Voldoire, A.; ·Balmaseda, M.; ·Madec, G.; ·Menkes, C.; McPhaden, M.J. Influence of Westerly Wind Events stochasticity on El Niño amplitude: The case of 2014 vs. 2015. Clim. Dyn. 2017. [Google Scholar] [CrossRef]
- McPhaden, M.J.; Zhang, X.; Hendon, H.H.; Wheeler, M.C. Large scale dynamics and MJO forcing of ENSO variability. Geophys. Res. Lett. 2006, 33, L16702. [Google Scholar] [CrossRef]
- McPhaden, M.J. Evolution of the 2002–03 El Niño. Bull. Am. Meteorol. Soc. 2004, 85, 677–695. [Google Scholar] [CrossRef]
- Hendon, H.; Wheeler, M.; Zhang, C. Seasonal dependence of the MJO-ENSO relationship. J. Clim. 2007, 20, 531–543. [Google Scholar] [CrossRef]
- Chen, L.; Li, T.; Wang, B.; Wang, L. Formation Mechanism for 2015/16 Super El Niño. Sci. Rep. 2017, 7, 2975. [Google Scholar] [CrossRef] [PubMed]
- Chen, S.F.; Chen, W.; Yu, B. Asymmetric influence of boreal spring Arctic Oscillation on subsequent ENSO. J. Geophys. Res. 2014, 119, 135–150. [Google Scholar] [CrossRef]
- Chen, S.F.; Yu, B.; Chen, W. An interdecadal change in the influence of the spring Arctic Oscillation on the subsequent ENSO around the early 1970s. Clim. Dyn. 2015, 44, 1109–1126. [Google Scholar] [CrossRef]
- Chen, S.F.; Chen, W.; Yu, B. The influence of boreal spring Arctic Oscillation on the subsequent winter ENSO in CMIP5 models. Clim. Dyn. 2017, 48, 2949–2965. [Google Scholar] [CrossRef]
- Chen, S.F.; Wu, R.; Chen, W.; Yu, B. Influence of the November Arctic Oscillation on the subsequent tropical Pacific sea surface temperature. Int. J. Climatol. 2015, 35, 4307–4317. [Google Scholar] [CrossRef]
- Chen, S.F.; Chen, W.; Yu, B. Modulation of the relationship between spring AO and the subsequent winter ENSO by the preceding November AO. Sci. Rep. 2018, 8, 6943. [Google Scholar] [CrossRef] [PubMed]
- Chen, S.F.; Wu, R.; Chen, W. A strengthened impact of November Arctic oscillation on subsequent tropical Pacific sea surface temperature variation since the late-1970s. Clim. Dyn. 2018, 51, 511–529. [Google Scholar] [CrossRef]
- Chen, W.; Graf, H.F.; Huang, R.H. The interannual variability of East Asian winter monsoon and its relation to the summer monsoon. Adv. Atmos. Sci. 2000, 17, 46–60. [Google Scholar]
- Lau, K.M.; Li, M.T. The monsoon of East Asia and its global associations—A survey. Bull. Am. Meteorol. Soc. 1984, 65, 114–125. [Google Scholar] [CrossRef]
- Lau, K.M.; Chang, C.P. Planetary scale aspects of the winter monsoon and atmospheric teleconnections. In Monsoon Meteorology; Chang, C.P., Krishnamurti, T.N., Eds.; Oxford University Press: New York, NY, USA, 1987; pp. 161–202. [Google Scholar]
- Ding, Y.H. Monsoon over China; Kluwer Academic: Boston, MA, USA, 1994; 420p. [Google Scholar]
- Li, C.Y. Interaction between anomalous winter monsoon in East Asia and EI Niño Events. Adv. Atmos. Sci. 1990, 7, 36–46. [Google Scholar]
- Yasunari, T. Impact of Indian monsoon on the coupled atmosphere/ocean system in the tropical Pacific. Meteorol. Atmos. Phys. 1990, 44, 29–41. [Google Scholar] [CrossRef]
- Webster, P.; Yang, S. Monsoon and ENSO: Selectively interactive system. Q. J. R. Meteorol. Soc. 1992, 118, 877–926. [Google Scholar] [CrossRef]
- Wainer, I.; Webster, P. Monsoon/El Niño-Southern Oscillation relationships in a simple coupled ocean-atmosphere model. J. Geophys. Res. 1996, 101, 25599–25614. [Google Scholar] [CrossRef]
- Gong, D.Y.; Wang, S.W. Definition of Antarctic oscillation index. Geophys. Res. Lett. 1999, 26, 459–462. [Google Scholar] [CrossRef]
- Zheng, F.; Li, J.P.; Ding, R.Q. Influence of the preceding austral summer Southern Hemisphere annular mode on the amplitude of ENSO decay. Adv. Atmos. Sci. 2017, 34, 1358–1379. [Google Scholar] [CrossRef]
- Ding, R.Q.; Li, J.P.; Tseng, Y.H. The impact of South Pacific extratropical forcing on ENSO and comparisons with the North Pacific. Clim. Dyn. 2015, 44, 2017–2034. [Google Scholar] [CrossRef]
- Ding, R.Q.; Li, J.P.; Tseng, Y.H.; Sun, C.; Xie, F. Joint impact of North and South Pacific extratropical atmospheric variability on the onset of ENSO events. J. Geophys. Res. 2017, 122, 279–298. [Google Scholar] [CrossRef]
- Ding, R.Q.; Li, J.P.; Tseng, Y.H.; Ha, K.J.; Zhao, S.; Lee, J.Y. Interdecadal change in the lagged relationship between the Pacific–South American pattern and ENSO. Clim. Dyn. 2016, 47, 2867–2884. [Google Scholar] [CrossRef]
- Deser, C.; Timlin, M.S. Atmosphere–ocean interaction on weekly timescales in the North Atlantic and Pacific. J. Clim. 1997, 10, 393–408. [Google Scholar] [CrossRef]
- Czaja, A.; Frankignoul, C. Observed impact of Atlantic SST anomalies on the North Atlantic oscillation. J. Clim. 2002, 15, 606–623. [Google Scholar] [CrossRef]
- Cassou, C.; Deser, C.; Terray, L.; Hurrell, J.W.; Drévillon, M. Summer sea surface temperature conditions in the North Atlantic and their impact upon the atmospheric circulation in early winter. J. Clim. 2004, 17, 3349–3363. [Google Scholar] [CrossRef]
- Pan, L.L. Observed positive feedback between the NAO and the North Atlantic SSTA tripole. Geophys. Res. Lett. 2005, 32, L06707. [Google Scholar] [CrossRef]
- Wu, L.X.; Liu, Z.Y. Is tropical Atlantic variability driven by the North Atlantic Oscillation? Geophys. Res. Lett. 2002, 29, 1653. [Google Scholar] [CrossRef]
- Wu, L.X.; Liu, Z.Y. North Atlantic decadal variability: Airsea coupling, oceanic memory, and potential Northern Hemisphere resonance. J. Clim. 2005, 18, 331–349. [Google Scholar] [CrossRef]
- Czaja, A.; Van der Vaart, P.; Marshall, J. 2002: A diagnostic study of the role of remote forcing in tropical Atlantic variability. J. Clim. 2002, 15, 3280–3290. [Google Scholar] [CrossRef]
- Klein, S.A.; Soden, B.J.; Lau, N.C. Remote sea surface temperature variations during ENSO: Evidence for a tropical atmospheric bridge. J. Clim. 1999, 12, 917–932. [Google Scholar] [CrossRef]
- Kumar, K.K.; Rajagopalan, B.; Cane, M.A. On the weakening relationship between the Indian monsoon and ENSO. Science 1999, 284, 2156–2159. [Google Scholar] [CrossRef] [PubMed]
- Jia, X.J.; Lin, H.; Derome, J. The influence of tropical Pacific forcing on the Arctic Oscillation. Clim. Dyn. 2009, 32, 495–509. [Google Scholar] [CrossRef]
- Chen, S.F.; Wu, R.; Chen, W. Modulation of spring northern tropical Atlantic sea surface temperature on the ENSO-related Asian summer monsoon connection. Int. J. Climatol. 2018, 38, 5020–5029. [Google Scholar] [CrossRef]
- Zhao, W.; Chen, W.; Chen, S.F.; Yao, S.L.; Nath, D. Interannual variations of precipitation over the monsoon transitional zone in China during August-September: Role of sea surface temperature anomalies over the tropical Pacific and North Atlantic. Atmos. Sci. Lett. 2018. [Google Scholar] [CrossRef]
Figure 1.
(a) Sea level pressure (SLP) anomalies (hPa) regressed upon the normalized principal component (PC) time series corresponding to the second empirical orthogonal function (EOF2) of the SLP anomalies over North Pacific (20°–60° N and 120° E–80° W). (b) The normalized PC time series of the EOF2. Stippling regions in (a) indicate SLP anomalies significant at the 95% confidence level based on the two-tailed Student's t test. The Figure is reproduced following the method used in Linkin and Nigam [40].

Figure 2.
Sea surface temperature (SST) anomalies (°C) at (a) MAM(0), (b) JJA(0), (c) SON(0), and (d) D(0)JF(1) regressed upon the normalized preceding winter (D(-1)JF(0)) North Pacific Oscillation (NPO) index. (e–h) As in (a–d), but for seasonal evolutions of precipitation (shadings, mm day−1) and 850 hPa winds (vectors, m s−1) anomalies. Stippling regions in (a–d) and (e–h) indicate SST and precipitation anomalies significant at the 95% confidence level, respectively. The figure is reproduced following the method used in Vimont et al. [23].

Figure 3.
Composite anomalies of SST (unit: °C) at MAM (0), JJA(0), SON(0), and D(0)JF(+1) for (a–d) +NPO, (e–h) +NPO/+AO, and (i–l) +NPO/−AO years, respectively. Stippling regions in (a)–(d) indicate SST anomalies significant at the 95% confidence level. Stippling regions in (e)–(l) indicate composite SST anomalies during +NPO/+AO years are significantly different from those during +NPO/−AO years at the 95% confidence level. The Figure is reproduced following the method used in Chen et al. [46].

Figure 4.
Anomalies of December (a) SLP (hPa) and (b) geopotential height (m) at 500 hPa regressed upon the normalized simultaneous December North Atlantic Oscillation (NAO) index. Stippling regions indicate anomalies significant at the 95% confidence level.
Figure 4.
Anomalies of December (a) SLP (hPa) and (b) geopotential height (m) at 500 hPa regressed upon the normalized simultaneous December North Atlantic Oscillation (NAO) index. Stippling regions indicate anomalies significant at the 95% confidence level.

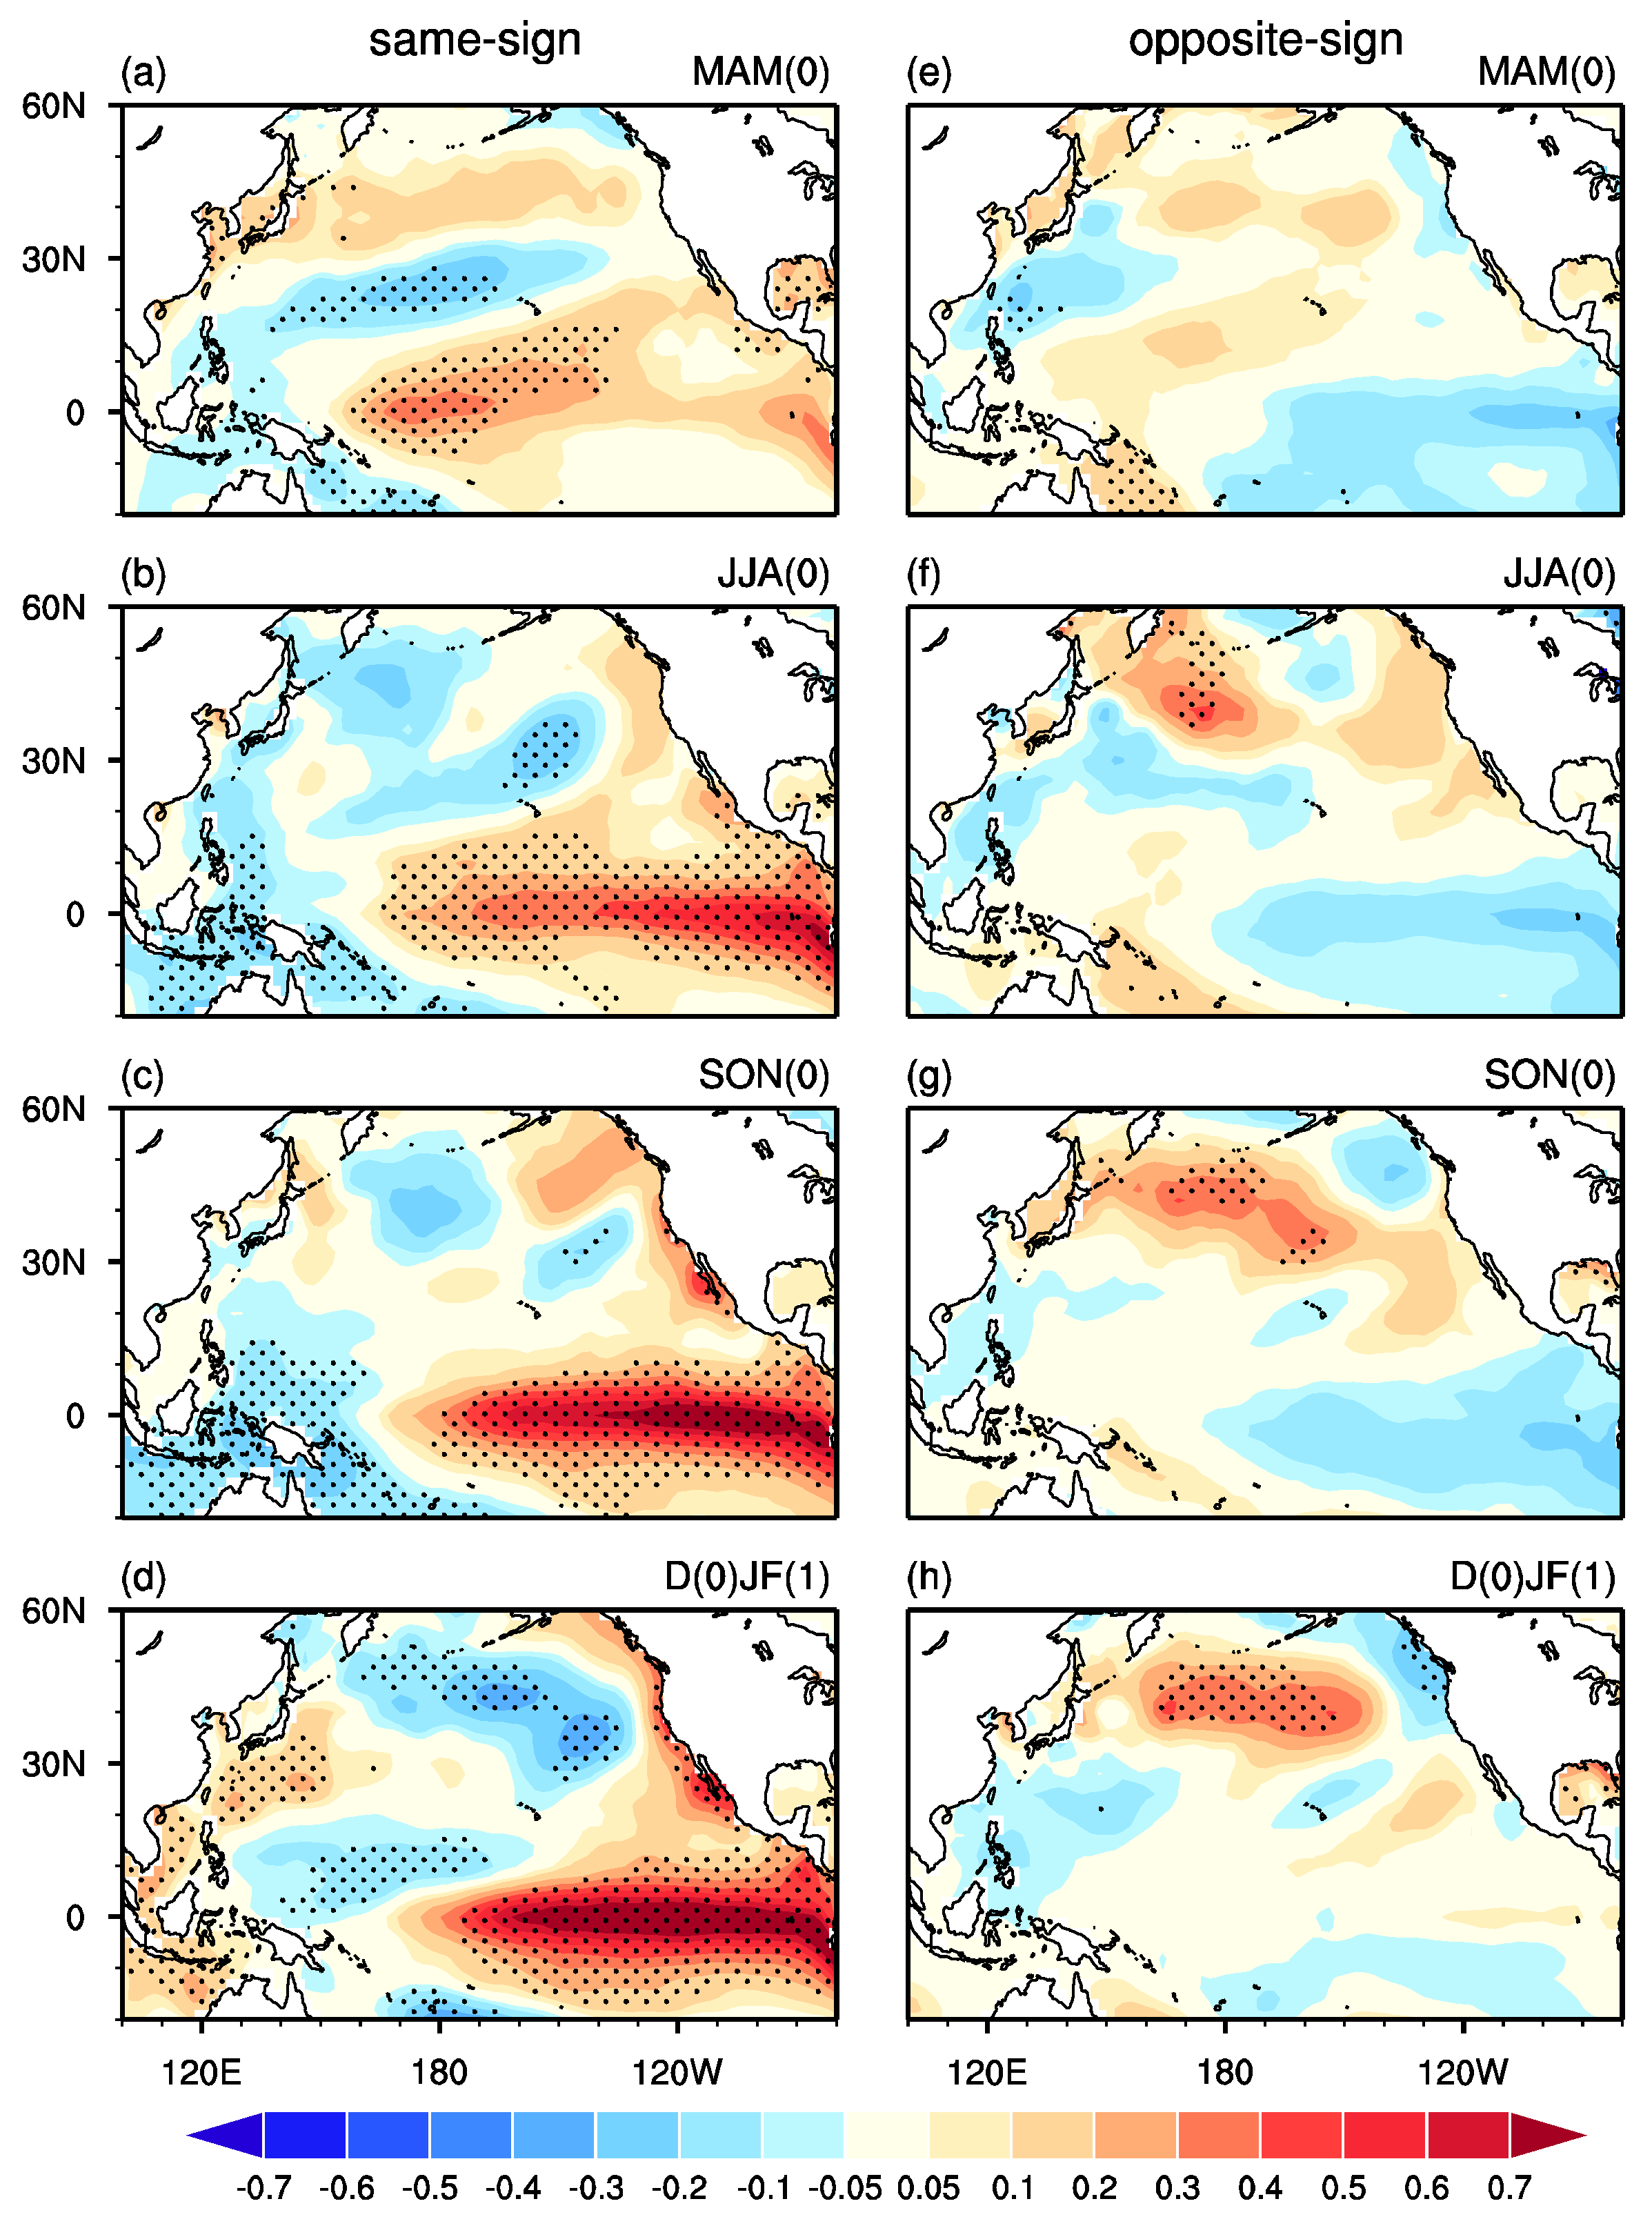
Figure 5.
SST anomalies (°C) at (a) MAM(0), (b) JJA(0), (c) SON(0), and (d) D(0)JF(1) obtained by regression upon the normalized spring (MAM(0)) Northern tropical Atlantic (NTA) index. (e–h) As in (a–d), but for seasonal evolutions of precipitation (shadings, mm day−1) and 850 hPa winds (vectors, m s−1) anomalies. Stippling regions in (a–d) and (e–h) indicate SST and precipitation anomalies significant at the 95% confidence level, respectively. NTA index is defined as the region-averaged SST anomalies over 0°–20° N and 0°–60° W. Figure is reproduced following the method used in Ham et al. [76].

Figure 6.
A 25-year running correlation coefficients between the spring NTA index and the following winter Niño-3.4 index (red line). Horizontal blue line indicates the correlation coefficient significant at the 95% confidence level. Figure is reproduced following the method used in Chen and Wu [81].

Figure 7.
SST anomalies (°C) at (a) JJA(0), (b) SON(0), and (c) D(0)JF(1) obtained by regression upon the normalized JJA(0) Atlantic Niño index during 1979–2016. Stippling regions indicate SST anomalies significant at the 95% confidence level.
Figure 7.
SST anomalies (°C) at (a) JJA(0), (b) SON(0), and (c) D(0)JF(1) obtained by regression upon the normalized JJA(0) Atlantic Niño index during 1979–2016. Stippling regions indicate SST anomalies significant at the 95% confidence level.

Figure 8.
SST anomalies (°C) at (a) JJA(0), (b) SON(0), and (c) D(0)JF(1) obtained by regression upon the preceding Autumn (SON(−1)) Indian Ocean dipole (IOD) SST index during 1979–2016. Stippling regions indicate SST anomalies significant at the 95% confidence level.
Figure 8.
SST anomalies (°C) at (a) JJA(0), (b) SON(0), and (c) D(0)JF(1) obtained by regression upon the preceding Autumn (SON(−1)) Indian Ocean dipole (IOD) SST index during 1979–2016. Stippling regions indicate SST anomalies significant at the 95% confidence level.

Figure 9.
(a) Spring SLP anomalies regressed upon the normalized PC times series of EOF1 of SLP anomalies north of 20° N. (b) Normalized PC time series of EOF1. Stippling regions in (a) indicate SLP anomalies significant at the 95% confidence level. The figure is reproduced according to the method used in Chen et al. [31].

Figure 10.
SST anomalies (°C) at (a) MAM(0), (b) JJA(0), (c) SON(0), and (d) D(0)JF(1) regressed upon the normalized spring (MA(0)) AO index. (e–h) As in (a–d), but for seasonal evolutions of precipitation (shadings, mm day−1) and 850 hPa winds (vectors, m s−1) anomalies. Stippling regions in (a–d) and (e–h) indicate SST and precipitation anomalies significant at the 95% confidence level, respectively. The figure is reproduced based on the method used in Chen et al. [31].

Figure 11.
Time–longitude cross-section (2° S–2° N-averaged) of the (a) SST (daily mean, °C) and (b) OHC in the upper 300m (pentad mean, 108 J m−2) anomalies in 2015. (c) Time–longitude cross-section (5° S–5° N-averaged) of the 850 hPa zonal wind anomalies (daily mean, m s−1) in 2015. Anomalies in (a) and (c) are obtained by subtracting the climatology daily mean for period 1982–2011. Anomalies in (b) are obtained by subtracting the climatology pentad mean for period 1982–2011. Black arrows in (b) denotes eastward propagations of equatorial Kelvin wave. The figure is reproduced based on the method used in Chen et al. [95].

Figure 12.
A 25-year running correlation of the spring AO index with the following winter Niño-3.4 index (red line). Horizontal blue line indicates the correlation coefficient significant at the 95% confidence level. The figure is reproduced following the method used in Chen et al. [103].
Figure 12.
A 25-year running correlation of the spring AO index with the following winter Niño-3.4 index (red line). Horizontal blue line indicates the correlation coefficient significant at the 95% confidence level. The figure is reproduced following the method used in Chen et al. [103].

Figure 13.
Lead–lag correlation coefficients between monthly AO index and Niño-3.4 index for period 1979–2011. Negative (positive) lag represents that AO index lags (leads) Niño-3.4 index. Stippling regions indicate correlation coefficients significant at the 95% confidence level. The figure is reproduced based on the method used in Chen et al. [105].

Figure 14.
SST anomalies (oC) at (a,e) MAM(0), (b,f) JJA(0), (c,g) SON(0), and (d,f) D(0)JF(1) regressed upon the spring (MAM(0)) AO index, constructed respectively, for the cases when the spring AO index and the preceding November AO index have the (left) same and (right) opposite signs. Stippling regions denote SST anomalies significant at the 95% confidence level. The figure is reproduced following the method used in Chen et al. [106].

© 2018 by the authors. Licensee MDPI, Basel, Switzerland. This article is an open access article distributed under the terms and conditions of the Creative Commons Attribution (CC BY) license (http://creativecommons.org/licenses/by/4.0/).
Share and Cite
MDPI and ACS Style
Chen, S.; Yu, B.; Chen, W.; Wu, R. A Review of Atmosphere–Ocean Forcings Outside the Tropical Pacific on the El Niño–Southern Oscillation Occurrence. Atmosphere 2018, 9, 439. https://doi.org/10.3390/atmos9110439
AMA Style
Chen S, Yu B, Chen W, Wu R. A Review of Atmosphere–Ocean Forcings Outside the Tropical Pacific on the El Niño–Southern Oscillation Occurrence. Atmosphere. 2018; 9(11):439. https://doi.org/10.3390/atmos9110439
Chicago/Turabian StyleChen, Shangfeng, Bin Yu, Wen Chen, and Renguang Wu. 2018. "A Review of Atmosphere–Ocean Forcings Outside the Tropical Pacific on the El Niño–Southern Oscillation Occurrence" Atmosphere 9, no. 11: 439. https://doi.org/10.3390/atmos9110439
Note that from the first issue of 2016, this journal uses article numbers instead of page numbers. See further details here.