The Dynamical Linkage of Atmospheric Blocking to Drought, Heatwave and Urban Heat Island in Southeastern US: A Multi-Scale Case Study

1
International Center for Climate and Global Change Research, School of Forestry and Wildlife Sciences, Auburn University, Auburn, AL 36849, USA
2
Department of Geosciences, Auburn University, Auburn, AL 36849, USA
*
Author to whom correspondence should be addressed.
Atmosphere 2018, 9(1), 33; https://doi.org/10.3390/atmos9010033
Submission received: 8 November 2017
/
Revised: 16 January 2018
/
Accepted: 19 January 2018
/
Published: 22 January 2018
(This article belongs to the Special Issue Temperature Extremes and Heat/Cold Waves)
Abstract
:Atmospheric blocking is a long standing structure stalled in the mid-troposphere which is often associated with extreme weather events such as droughts, heatwaves, flood and cold air outbreak. A striking atmospheric blocking is identified to persist over the US during 13–17 August 2007, exacerbating the existing drought over the Southeastern US. This pronounced blocking event not only intensified the concurrent drought conditions, but also led to a record-breaking heatwave over the Southeast of the US. The excessive heat observed during this heatwave is attributable to the subsidence-associated adiabatic warming as well as the dry-and-warm air advection over Alabama and the neighboring states. At the local scale, we choose Birmingham, AL, as the study area for exploring the blocking influence on urban heat island. Based on the remote sensing data, the surface (skin) urban heat island is found to be 8 C in this area on the block-onset day. This provides partial evidences that the surface urban heat island intensity is likely amplified by the blocking-induced heat waves. The present work provides a unique case study in which blocking, drought, heatwave and urban heat island all occur concurrently, and interplay across a spectrum of spatial scales. We conclude that atmospheric blocking is capable of reinforcing droughts, initiating heatwaves, and probably amplifying the urban heat island intensity during the concurrent period.
1. Introduction
Atmospheric blocking is a large-scale atmospheric dynamic feature, which is commonly identified in the mid-troposphere over the mid-latitudes as shown in many studies such as Rex [1], Austin [2], Colucci [3], Dole and Gordon [4]. In terms of the midtropospheric geopotential height field, atmospheric blocking can be characterized as several types including the Greek letter shape, high-over-low dipole pattern, and cutoff high or low pattern. When atmospheric blocking takes place, the normally west-to-east moving weather system would be stalled over a certain region for consecutive days up to even months. In turn, this often leads to extreme weather events such as drought, heat waves, floods, and cold air outbreaks. For instance, the 2011–2014 California drought was closely associated with a predominant blocking ridge which persisted over the North Pacific Ocean for a span of several months, as studied by Wang et al. [5], Teng and Branstator [6], Seager et al. [7], Williams et al. [8]. This drought has caused severe damage on the State’s water supply, agricultural production, and many other economic factors. Another example is the 2003 European heatwave, as examined by Chase et al. [9], Fischer and Seneviratne [10], which resulted from a striking atmospheric blocking dominant over the North Atlantic for most of July and August of 2003. This blocking-associated heatwave event has caused more than 70,000 fatalities in the European countries [11]. These blocking-associated extreme weather events exemplify the importance of studying the dynamical linkage between them and blocking.
The climatology of atmospheric blocking in both Northern and Southern Hemisphere have been reported in details in numerous studies including Barriopedro et al. [12], Renwick [13], Sáez de Adana and Colucci [14]. Generally, in terms of location of blocking occurrence in the Northern Hemisphere, there are two primary basins featuring the peak frequency of blocking, namely, North Pacific Ocean and North Atlantic Ocean, respectively. In terms of seasonal variability of blocking, the peak season for blocking occurrence is generally in winter, often associated with cold air outbreak or drought. When blocking takes place in summer, it could lead to heatwave, drought or flood. Atmospheric blocking also has variability at inter-annual and inter-decadal scales. There have been many studies concerning the influence of El Nino-Southern Oscillation (ENSO) and Pacific Decadal Oscillation (PDO) on blocking frequency of occurrence and intensity as reported by studies including Barriopedro et al. [12], Renwick [13], Sáez de Adana and Colucci [14], Dong et al. [15].
So far numerous studies have been carried out focusing on how extreme weather events would respond to global warming. In particular, the center of the debate is how the polar amplification would affect future extreme weather events via modulating atmospheric blocking. Here the polar amplification refers to the polar region being warmed faster than elsewhere due to ice sheet albedo feedback. Francis and Vavrus [16] pointed out that, due to the reduced zonal wind caused by the polar amplification, the atmospheric blocking tends to occur more often such that more frequent extreme weather events would occur. Nevertheless, Wallace et al. [17] opposed this finding by stating that we must evaluate the change of blocking in response to climate change from the perspective of dynamic mechanisms of blocking, in a systematical way. There are both linear and nonlinear feedbacks involved within the response of blocking to climate change. The interactions of these processes are so complex that they are worth of in-depth investigation with both modeling and observational studies. Hassanzadeh et al. [18] further strengthened the point of Wallace et al. [17], using an idealized general circulation model (GCM) to simulate the response of blocking to the weakened meridional temperature gradient caused by global warming.
In terms of spatial scale, atmospheric blocking is a large-scale dynamic feature spanning a few hundred kilometers. While for drought and heatwaves, they are more of regional features at a few ten kilometers. Regarding previous studies on the causality of extreme weather events by blocking, so far the minimum spatial scale involved tends to be at the regional scale. Nevertheless, the impact of atmospheric blocking on extreme weather events at further smaller spatial scale, such as city-scale, has not yet been quantified, to the best of the authors’ knowledge. For instance, the urban heat island (UHI), which features elevated temperature in metropolitan areas than the surrounding rural areas as revealed by many studies [19,20,21], is widely known to exacerbate heatwaves and drought, but it is commonly studied merely at a local scale instead of a spectrum of multiple scales including the scale of atmospheric blocking. Hence, in the present study, we are interested in investigating the cross-scale dynamical relations among atmospheric blocking, drought, heatwave and UHI.
In this work, we hypothesize that atmospheric blocking will intensify and sustain the associated extreme weather events (drought, heatwave and UHI in this case) across a spectrum of spatial scales. Specifically, we are intended to address the question: What is the dynamical impact of atmospheric blocking on extreme weather events across multiple scales? In this study, we selected the record-breaking 2007 drought in the Southeastern US for a case study. During this event, a striking atmospheric blocking high took place in August of 2007 and it is largely responsible for the concurrent exceptional drought conditions, severe heatwave and enhanced UHI intensity (UHII) in that region. As for the UHII assessment, in this study we focus on the metropolitan area of Birmingham, AL, USA as our study site. This is because of the unique concurrent drought and heatwave conditions present in Alabama during the middle of August of 2017.
The remainder of this study is organized as follows. Section 2 explains data used in this study with details. The definition and detection of blocking are also described in detail in this section. In Section 3, the dynamical linkage of blocking to the 2007 August drought, heatwave in Southeastern US, and UHI in Birmingham, AL, USA is investigated. Discussion is provided in Section 4. Finally, conclusions and further work are presented in Section 5.
2. Data
In this study, we are focused on the period of 9–17 August 2007 during which a blocking, drought and heatwave concurrently took place in the Southeastern US. In addition, the variations of UHII during this unique period will be examined as well.
The National Centers for Environmental Prediction (NCEP)-National Center for Atmospheric Research (NCAR) daily reanalysis data is used to detect blocking in the Northern Hemisphere as well as analyze the drought, heatwave and UHI selected in the present study. The daily fields of NCEP-NCAR reanalysis are mostly available at 17 vertical pressure levels (p = 1000, 925, 850, 700, 600, 500, 400, 300, 250, 200, 150, 100, 70, 50, 30, 20 and 10 hPa) on a 2.5 × 2.5 [22].
The observed precipitation data is from Global Precipitation Climatology Center (GPCC). It is on the global grid with 2.5 × 2.5 spatial resolution.
The UHI is expressed as the temperature difference between urban and rural areas in a metropolitan area. Here temperature can be measured in either air temperature or land surface (or skin) temperature [23]. Here we chose to use the land surface temperature (LST) which is converted from the remote sensing data of Landsat 5 TM following Sobrino et al. [24]. The details of LST conversion are provided in Section 3. The Landsat program provides the longest continuous space-based observation of Earth’s land [25].
3. Results
3.1. Linkage of Blocking to Southeastern Drought of 2007
The southeast of the US was struck by a record intense drought during the 2006–2008. Figure 1 shows the Palmer Drought Severity Index (PDSI) [26] time series in Alabama during January of 2005 till 2009. The PDSI values are associated with various drought conditions with PDSI ranging from to categorized as severe drought, and or less as extreme drought. It is apparent that the 2006–2008 drought stands out with persistent low PDSI values. In particular, the drought intensity reaches the peak for August and September of 2007, with PDSI being near or exceeding , which means exceptional drought.
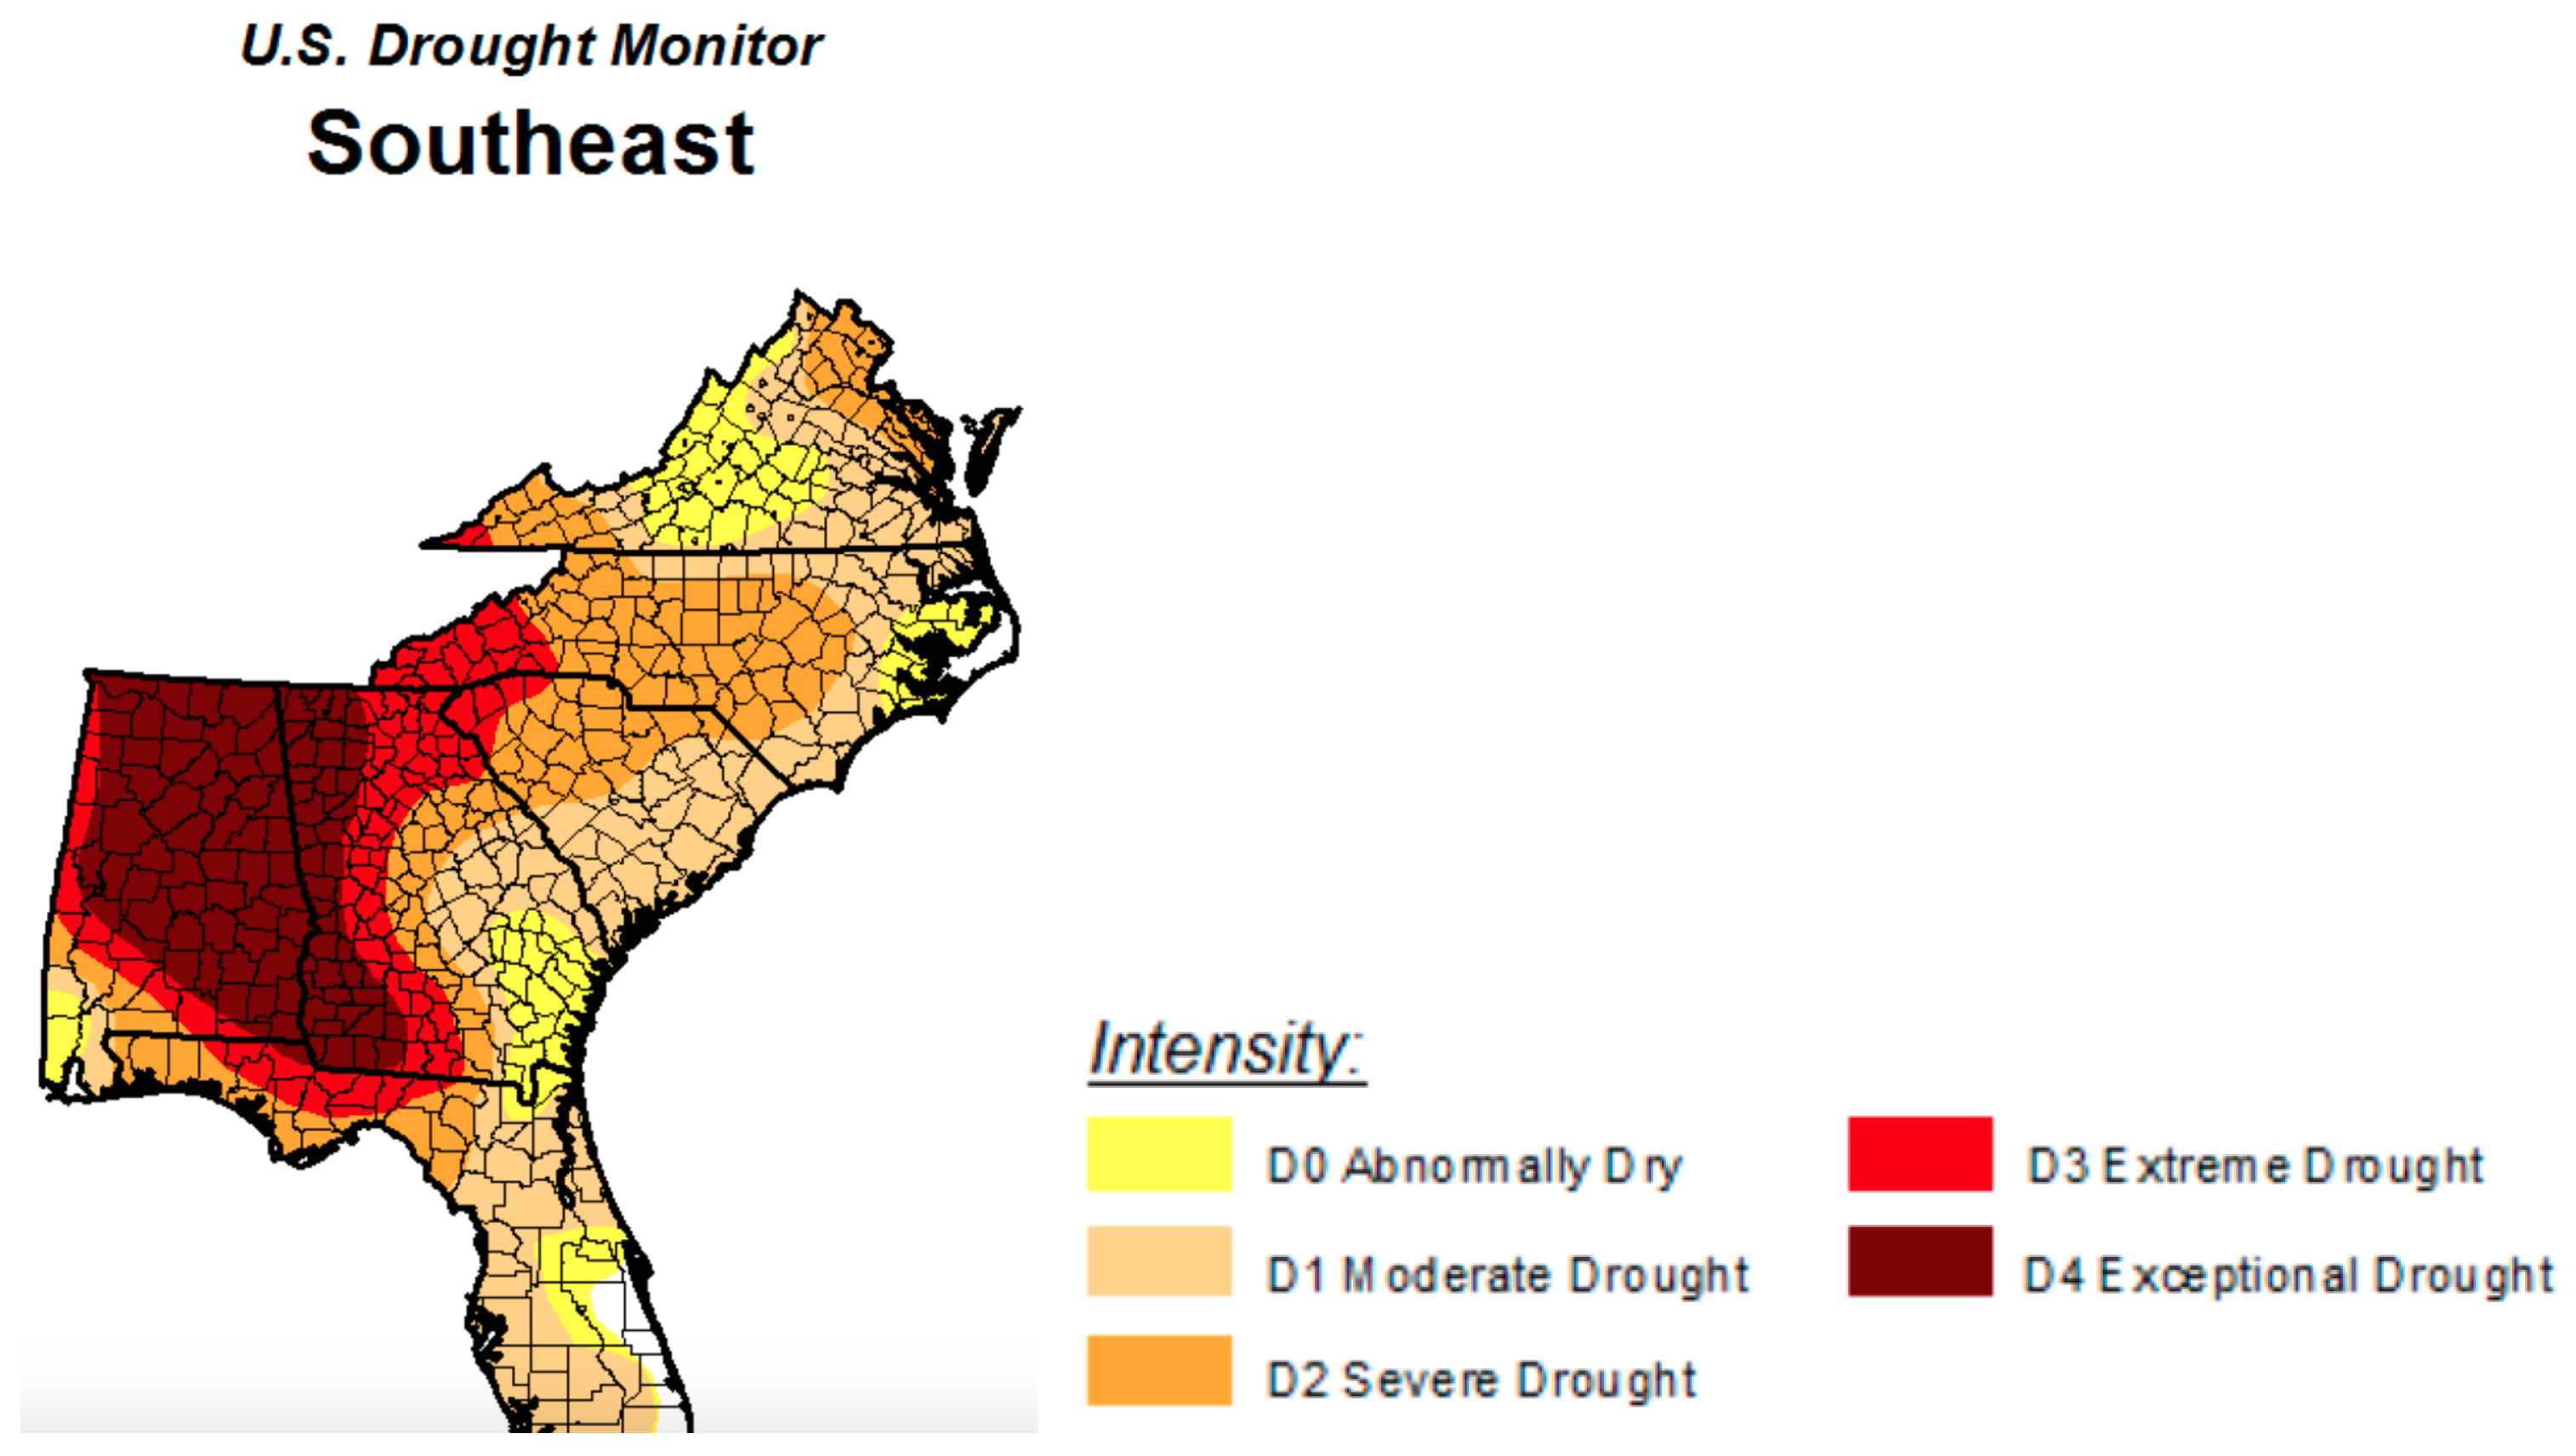
Figure 2 shows the 2-D drought intensity across the Southeastern US region for the week of 14 August 2007. The various drought intensity levels are represented by colors ranging from abnormally dry to exceptional drought. Specifically, the State of Alabama is noticeable for being under exceptional drought condition during this period. This 2-year drought, starting roughly from the beginning of 2006 and diminishing at the end of 2008, set record dry conditions in the Southeastern US and led to serious economic consequences. Based on Manuel [27], this drought caused losses to major field crops including corn, wheat, soybeans, cotton and hey totaled more than $1.3 billion. Furthermore, the severe water supply shortage due to this drought has even sparkled the Tri-State Water Wars among Alabama, Georgia and Florida [28].
The 2006–2008 Southeastern US drought is likely triggered by La Niña [29], at least partially, in early 2006. A strong-to-moderate La Niña condition was present in the equatorial Pacific at that time, leading to the below normal precipitation over the Southeastern US. On top of that, the occurrence of a blocking high during August 2007 significantly exacerbated the existing drought conditions [29].
Following Watson and Colucci [30], we used a modified version of the blocking detection algorithm which was originally proposed by Tibaldi and Molteni [31]. Atmospheric blocking is defined as the persistence of negative zonal index, which refers to that the 500-mb geopotential heights are higher at N than at N and this structure spans at least 20 degrees of longitude for at least five consecutive days. The block onset is defined as the first day on which this definition is satisfied for a particular blocking event. Details on blocking detection criteria can be found in Watson and Colucci [30].
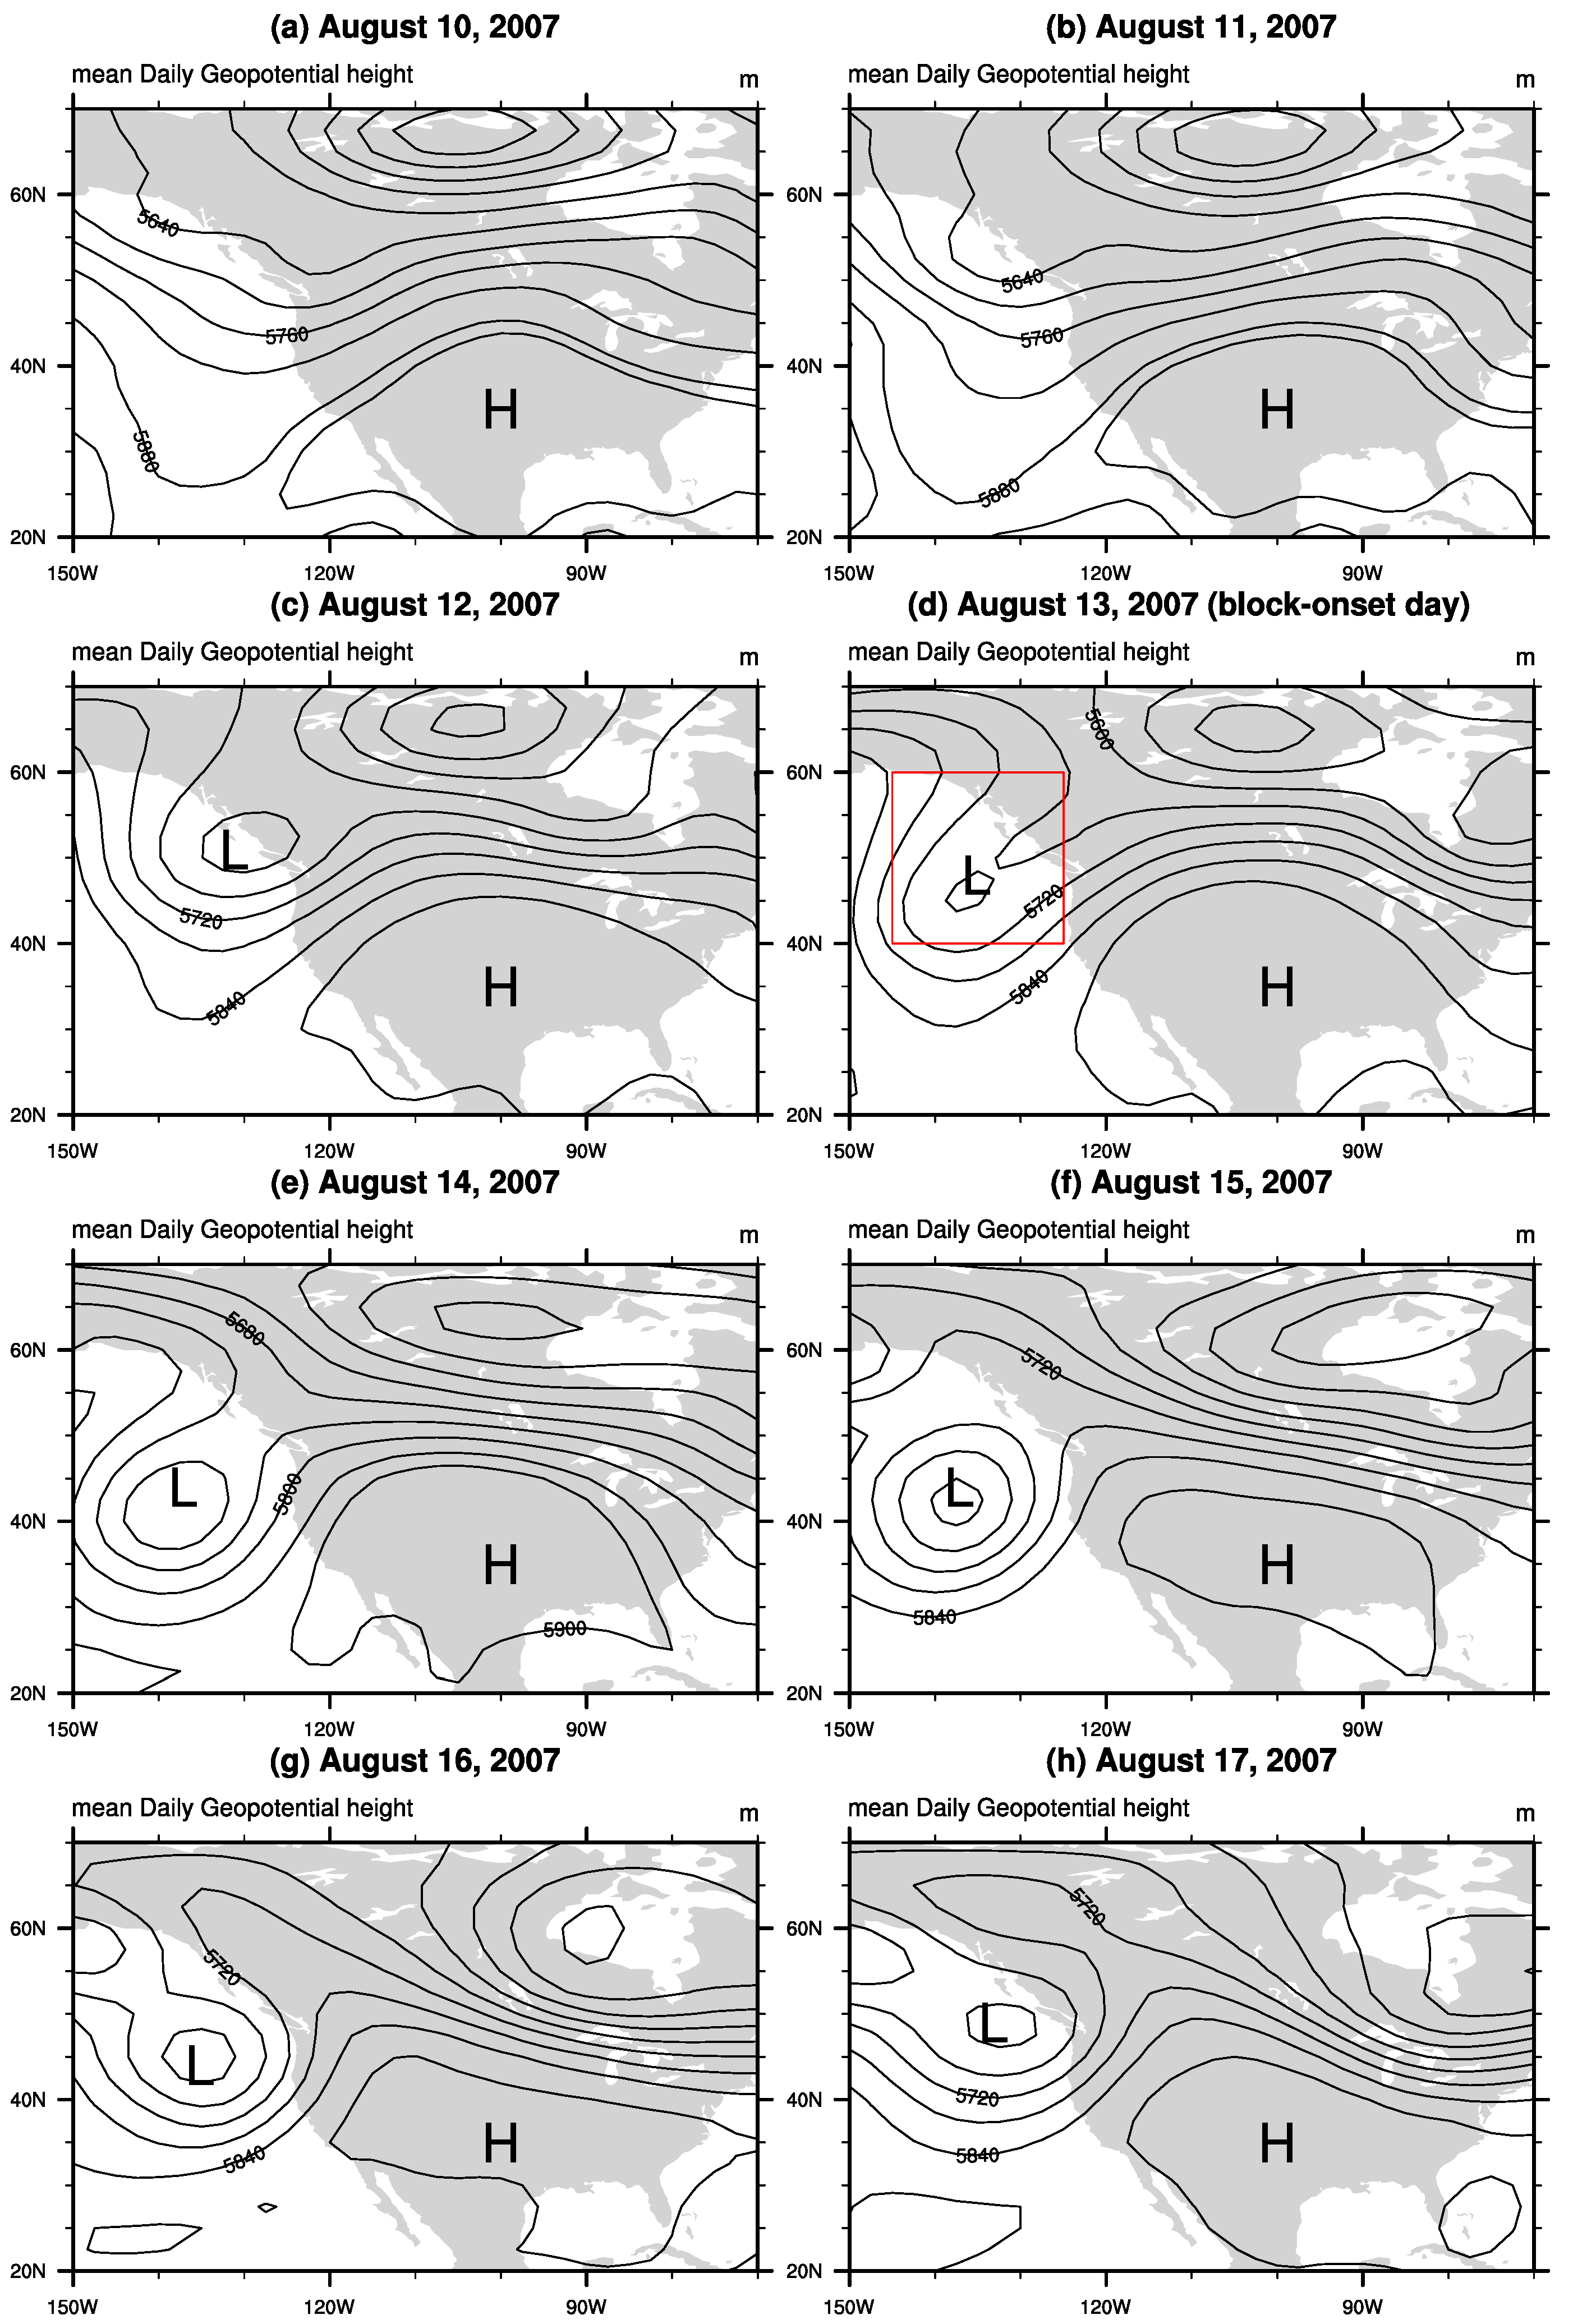
Figure 3 shows the onset and evolution of a blocking event during 10–17 August 2007, which includes the pre-blocking and blocking period. The block-onset day is identified as 13 August 2007, which features a marked ridge dominant over the entire US, with a deepened low pressure located upstream of the blocking high system. The reversal of the westerly wind can be readily observed over the block-onset region, which is one of the most characteristic conditions of blocking. This blocking event lasts five days and ends on 17 August 2007. Due to the presence of this blocking event, weather systems containing precipitation are diverted away from the standing blocking such that the region under blocking is commonly associated with below normal precipitation and scorching temperatures.
Figure 4 depicts the observed precipitation anomaly for August 2007 apart from the long-term mean August precipitation (1981–2010). It is noticeable that the Southeastern US region features severe precipitation deficit during this month, with the largest departure from normal precipitation being around 100 mm. Given the long-term monthly precipitation is around the same order of magnitude compared to this precipitation deficit, this indicates the very severe drought conditions. For instance, over the northern Alabama, the precipitation deficit for August 2007 is nearly equal to the long-term mean precipitation for August, implying the strikingly dry conditions over this period. This is clearly the manifestation of the intensified drought conditions by the blocking event which occurred concurrently over the same period, bringing more days with clear skies and minimal precipitation due to large subsidence. In terms of time scales, despite that the 2007 August blocking event only lasts for about one week, in contrast to the 2-year Southeastern US drought, the blocking is still capable of worsening the drought conditions during the blocking and even the post-blocking period. For instance, the soil conditions may become much drier during blocking period and this could have longer effect on the drought conditions even after the blocking decays. Hence, this shows clear evidences that blocking could intensify drought conditions during the concurrent period.
3.2. Linkage of Blocking to Southeastern Heatwave of 2007
Heat wave can be defined as the daily maximum temperature of more than five consecutive days exceeding the average maximum temperature by 5 C (World Meteorological Organization). The possible mechanisms governing heat waves are reasonably summarized by a recent review article by Horton et al. [32]. They pointed out that the underlying drivers for heat waves are atmospheric blocking, which is commonly associated with clear skies with increasing solar insulation on surface, adiabatic warming accompanied by sinking motion, and warm air advection. In terms of mechanisms of persistent boreal summer heat events associated with blocking, they summarized two alternatives: one is resonant circulation regimes leading to persistent blocking and the other is reduced baroclinicty and decreased eddy kinetic energy featured by the boreal summer season.
A record-breaking heat wave arrived across the Southeast of the US in early August of 2007. Frequent impressive strings of greater–than–38 C heat were reported. As a result of intense heat and minimal rainfall, severe stress is placed upon pastures, livestock and immature summer crops over this region [33]. In specific, Birmingham, Alabama, reached all-time record maximum temperature exceeding 38 C for at least 10 consecutive days from 6–15 August 2007, as depicted by Figure 5.
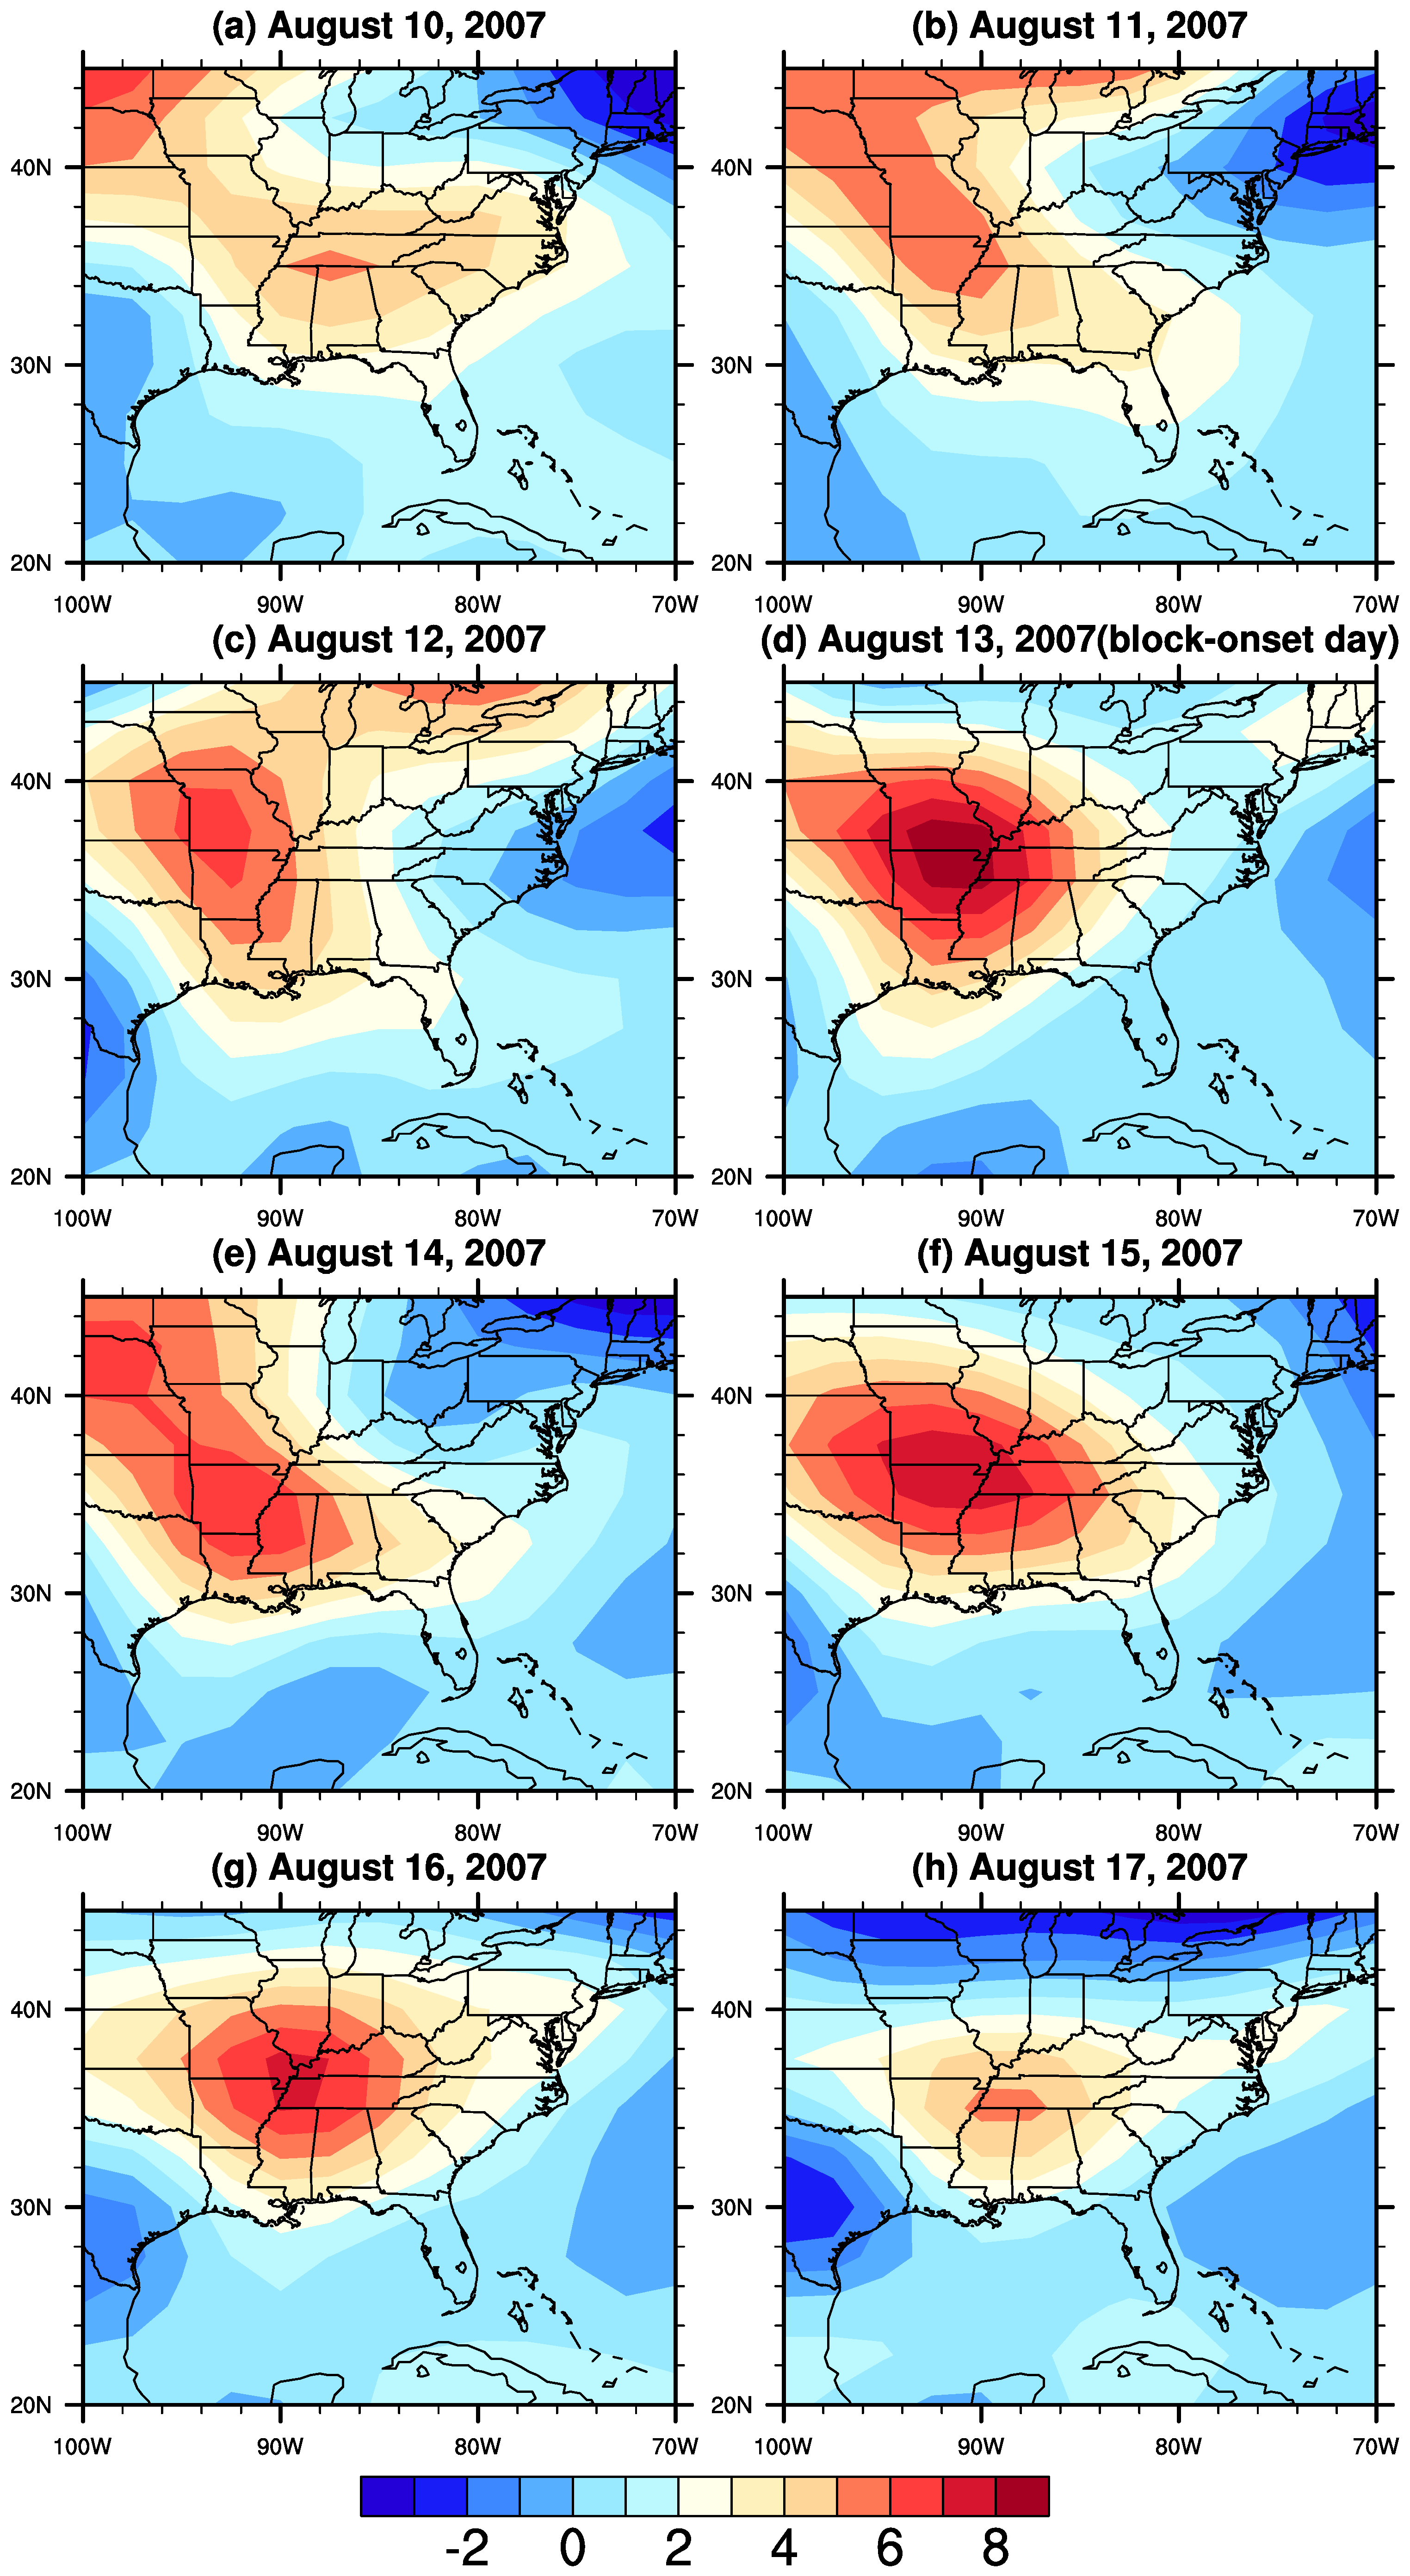
The August 2007 blocking event is indeed largely responsible for this historic heatwave over the Southeastern US. Figure 6 shows the 1000-mb (near surface) temperature anomaly apart from the 1981–2010 long-term mean temperature during 10–17 August 2007. It is evident that the above normal temperature anomaly is found over the middle and Southeastern states. Especially, starting from the blocking onset on 13 August 2007, this temperature anomaly field is intensified and migrates more towards the Southeast, with the largest temperature departure exceeding 8 C. This breaking heatwave lasted till 17 August 2007, which overlaps the ending time of the blocking event. As the block started to dissipate after 17 August 2007, the heatwave intensity also started to decrease and eventually dissolve.
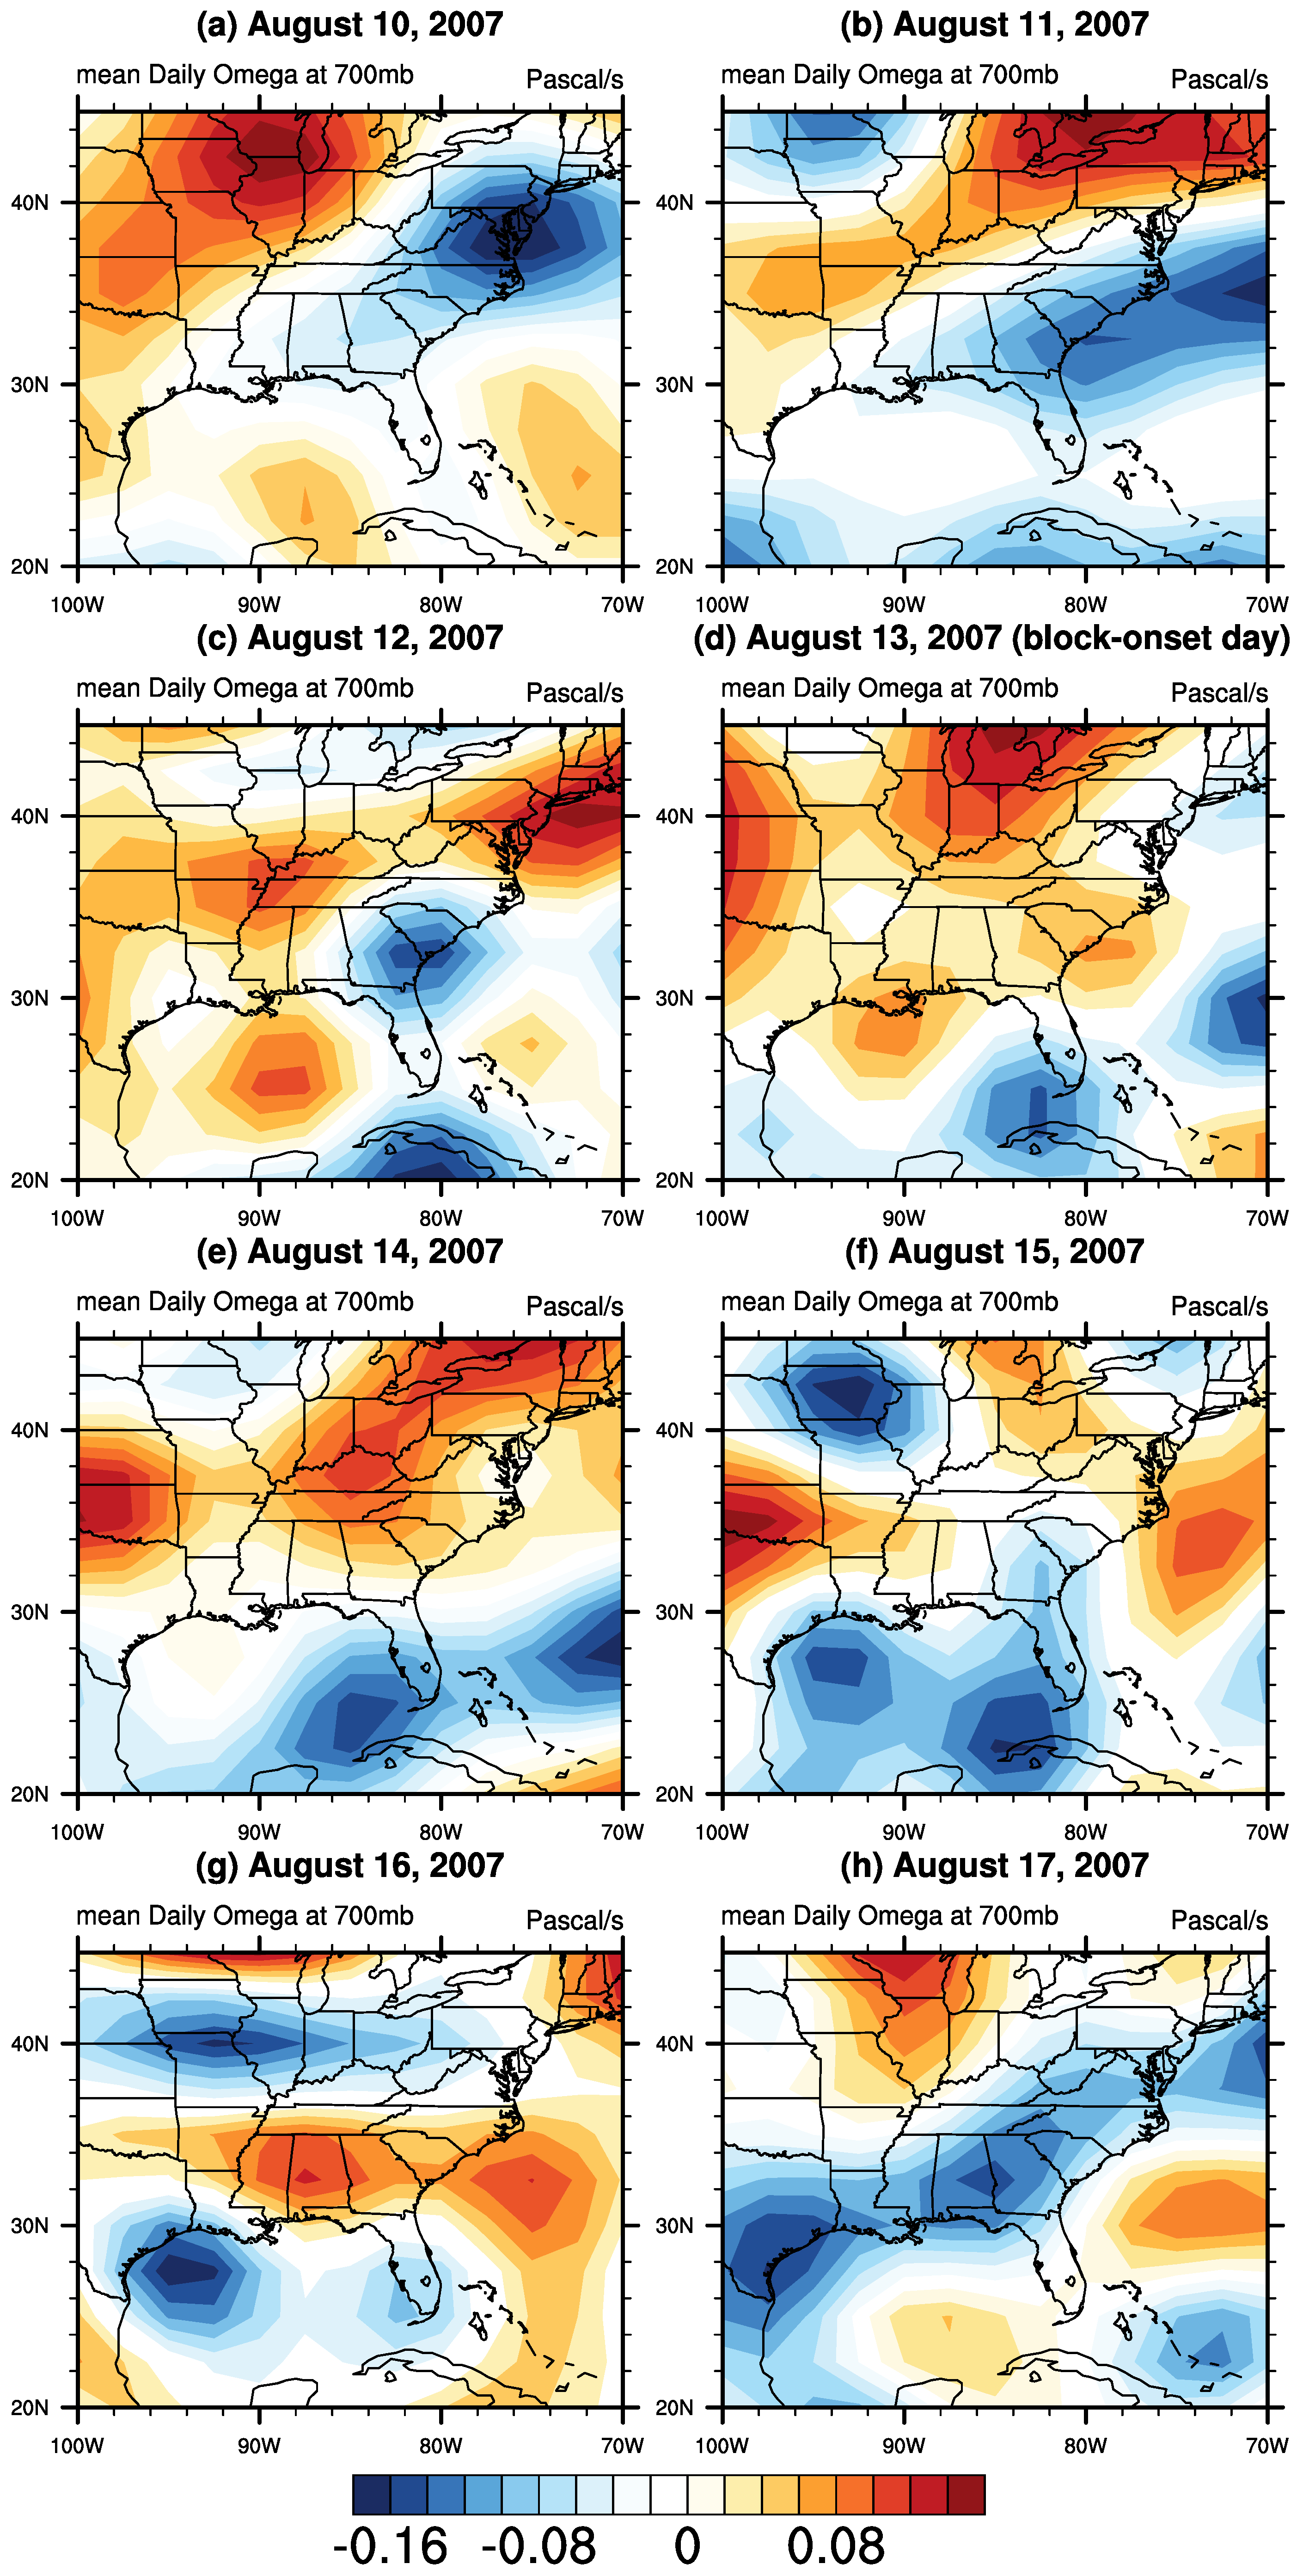
In order to interpret how this marked temperature anomaly is formed through the influence of blocking over the Southeastern US, we need to look further upon the interaction between blocking and heatwave during August 2007. Figure 7 depicts the low-level (700 mb) vertical motion field during 10–17 August 2007. It is worthwhile to note that when the vertical motion (omega) is negative in sign, it refers to the ascent motion, whereas positive signs correspond to the descent motion. During the three-day pre-block period, i.e., 10–12 August as shown in Figure 7a–c, the Southeastern US is primarily dominated by rising motion at low levels. Starting on the block-onset day, 13 August, the sinking motion begins to prevail over the Southeast and further intensifies through 16 August, which is one day prior to block decay. The adiabatic warming associated with this sweeping subsidence during the blocking period undoubtedly contributes to the formation of the above-normal-temperature anomaly during the August 2007 heatwave in the Southeastern US.
Moreover, Figure 8 shows the 850-mb relative humidity overlaid with 850-mb wind vectors during the concurrent blocking and heatwave period in August 2007. A low-level anticyclone is readily observed over the Eastern US during this period, which is attributable to the blocking structure. On 14 August, one day prior to block onset, a very dry center with less than 30% relative humidity is dominant over the Eastern US. With the low-level northernly flow, the very dry and hot air is advected to Alabama and neighboring states, leading to the elevated low-level air temperature over this area. Hence, both the adiabatic warming associated with strong subsidence and the dry-and-warm air advection due to blocking primarily account for the formation of the 2007 August heatwave over the Southeastern US. This is consistent with results from Gouveia et al. [34] and Amraoui et al. [35] who studied the two heatwaves in Greece during July and August 2007 respectively, during which a drought was present concurrently. Their studies showed that the enhanced subsidence and warm-and-dry air advection collectively contribute to the formation of heatwaves in Peloponnese Peninsula of Greece.
3.3. Linkage of Blocking to UHI in Birmingham, AL, USA
In this section, we desire to look further by exploring the impact of blocking on the urban heat island, at a local scale, during the concurrent drought and heatwave. Here we chose to look closely at Birmingham, AL, which is the largest city in Alabama. Birmingham has an estimated population of 212,157, and a metro population of 1,136,650, which is nearly 1/4 of the state’s total population. This Southeastern US city is located at 33.5207 N, 86.8025 W and has an urban footprint of 385 square kilometer. Figure 9a shows the map of Birmingham, in relative to Alabama and the US, respectively.
In order to accurately identify the specific UHI locations within Birmingham, land type classification is performed to distinguish the urban from the rural type. At first, an unsupervised classification using 12 classes is done to the Landsat image. Then these classes are reclassified to generate three overall classes, which are urban, rural and water, as shown in Figure 9b. The urban classification is found to mainly overlap the Birmingham metropolitan area.
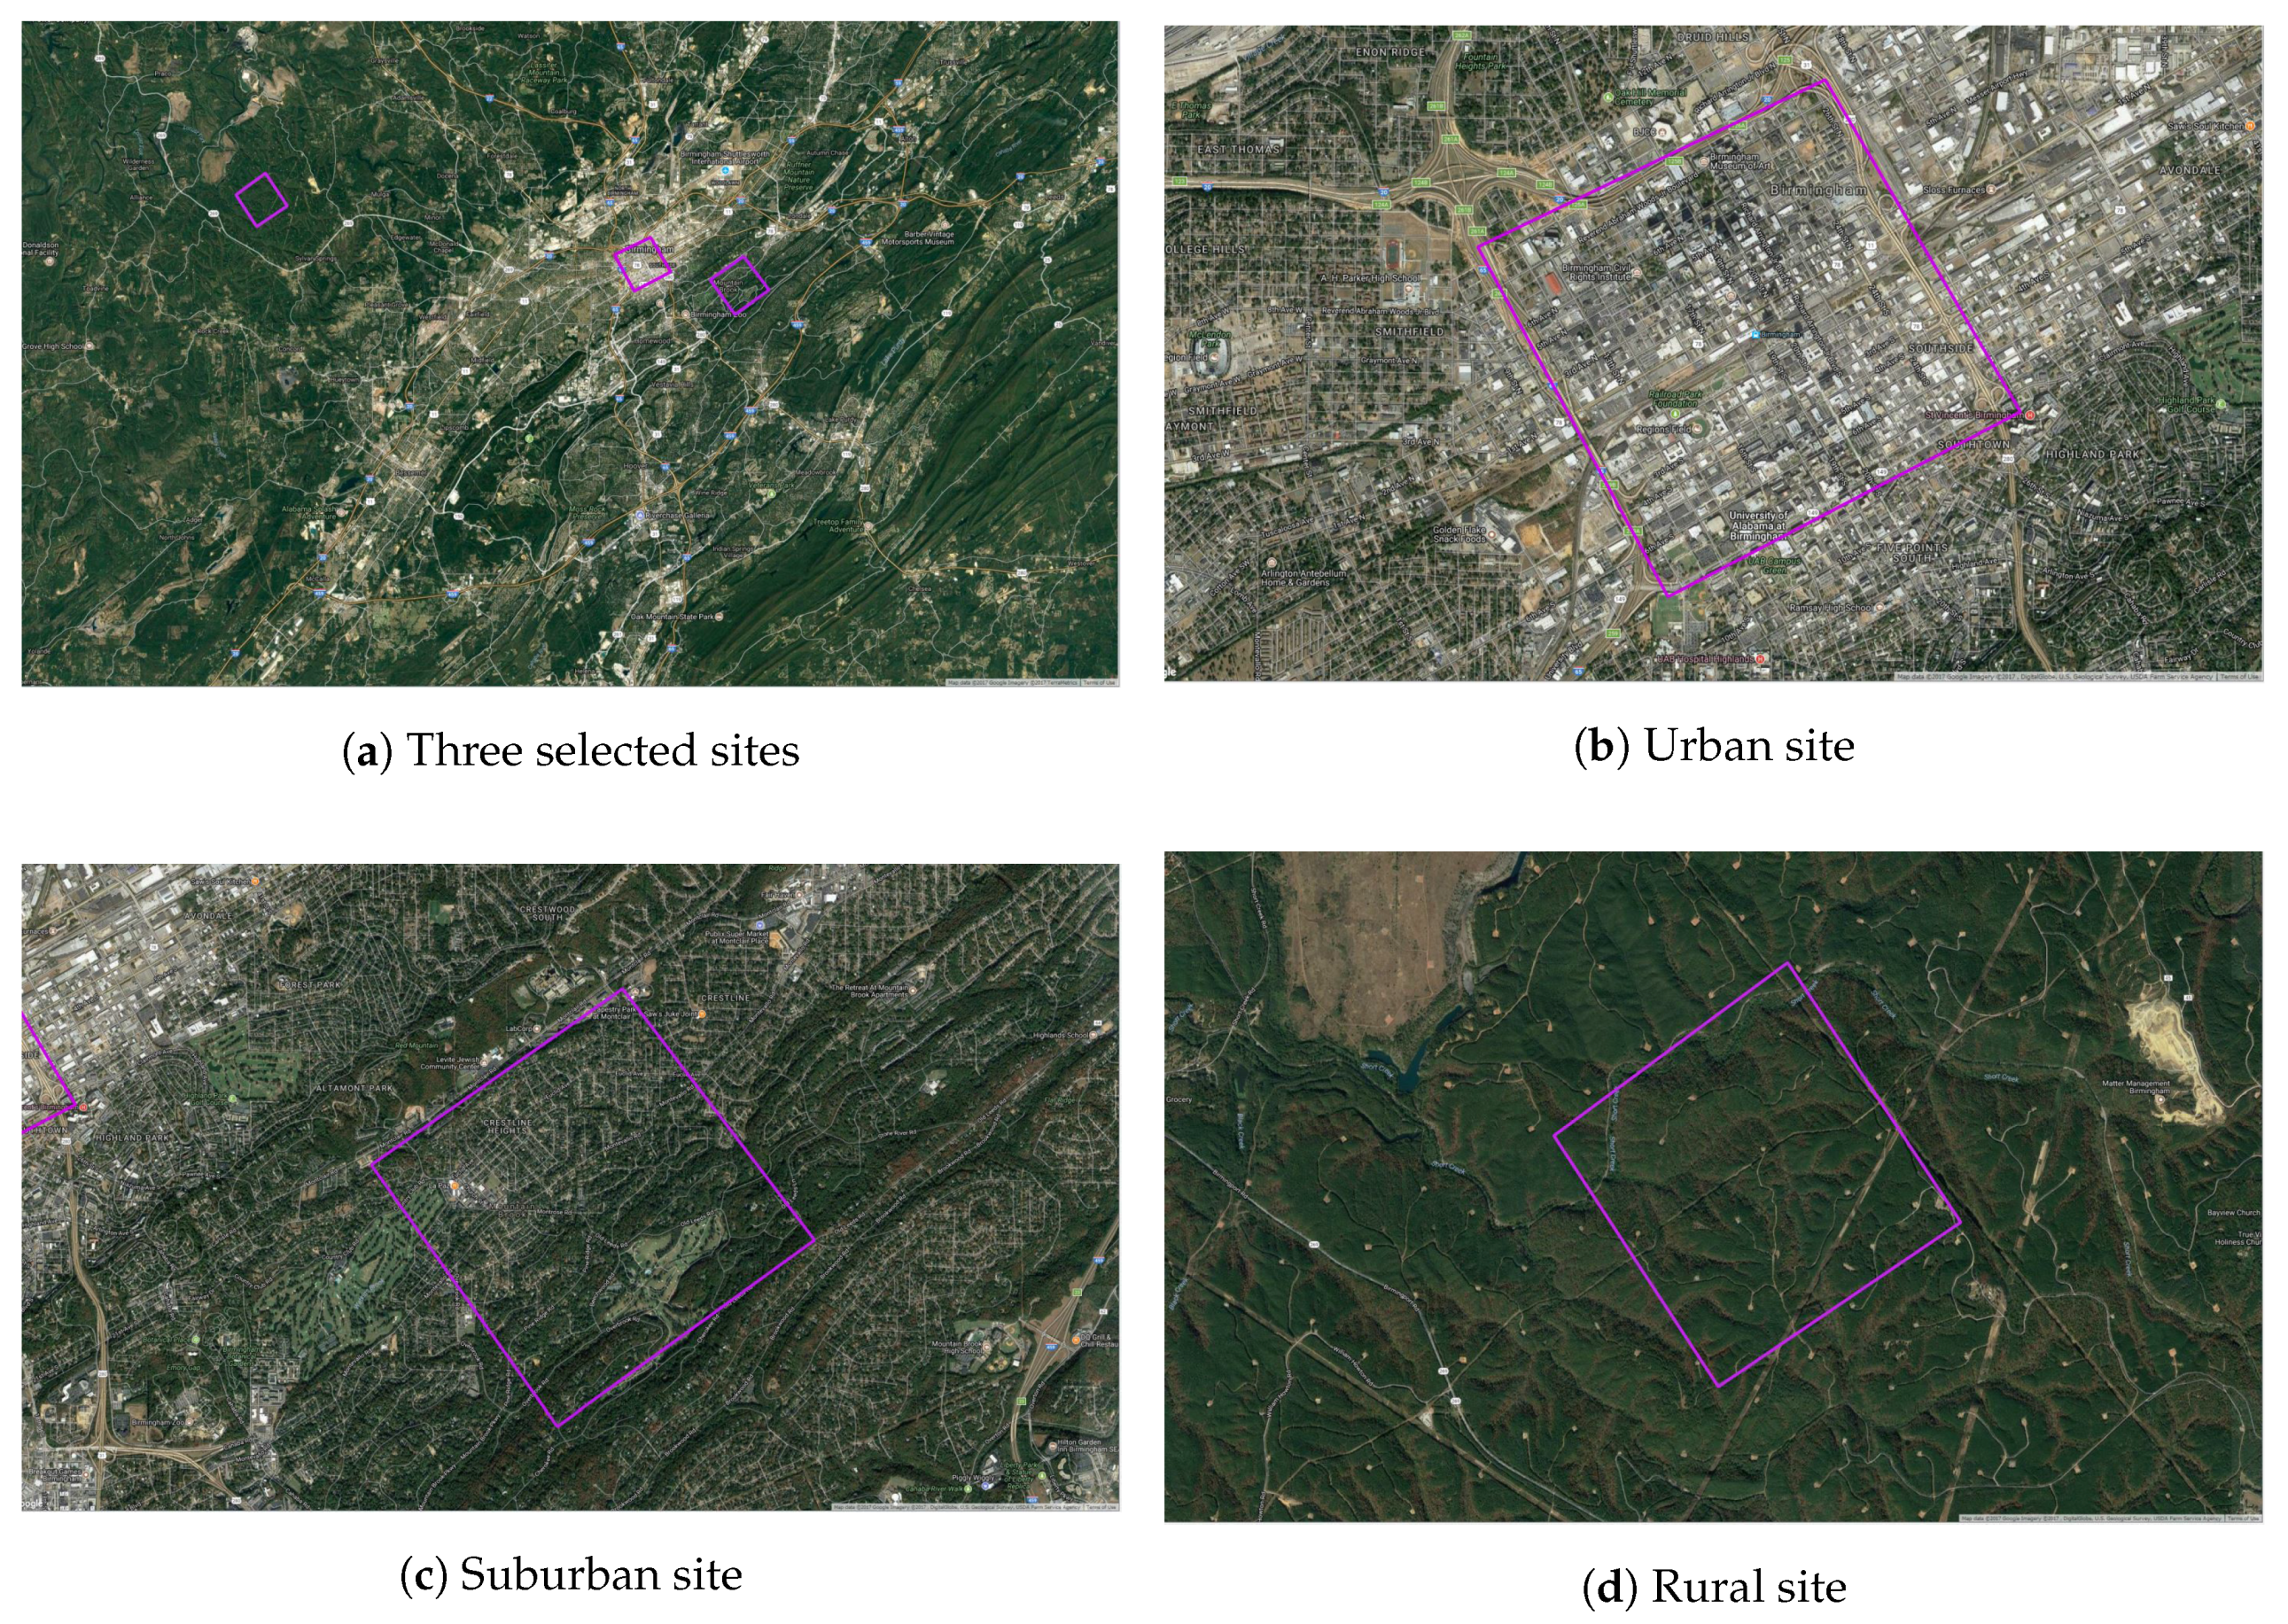
Three sites are chosen for investigating the variation of the UHII with the concurrent blocking, drought and heatwave. They primarily represent urban, suburban and rural areas, respectively, as shown in Figure 10a. Specifically, the criteria for choosing urban sites are areas covered by greater than 75% urban surfaces and dominated by concrete, asphalt and other impervious surfaces, whereas the criteria for rural sites are areas less than 20% urban surfaces and dominated by soil and vegetation, according to Hug [36]. The details of the three selected sites for this study are followed.
The urban site was selected for downtown Birmingham, being located within US highway 280 (east) and Interstate 65 (west), as shown in Figure 10b. To the north boundary is Interstate 20 and the south includes University Boulevard. Much of the surface characteristics include asphalt pavement for roads, concrete and steel buildings, and rooftops. Some of the urban characteristics include buildings from the University of Alabama at Birmingham and its medical center, and the historical railroad infrastructure, in addition to the business district. There exists very few vegetative landscape, with the exception of Kelly Ingram Park and Linn Park. By having such a large study area that extends over 7.8 square kilometer, selection bias was limited from including statistical outliers.
Interpolating from the approximate distance relationships of similar geographic regions [37], the suburban area was selected as a comparison site, as shown in Figure 10c, exhibiting more rural physical characteristics. To the north boundaries of Monclair Rd, the area encompasses much of the northern region of Mountain Brook, which is a suburban of Birmingham. Another characteristic of Mountain Brook is the affluence of the area, which has been shown to relate to more vegetation [38]. The suburban site is located within 2 miles (2.876 km) from the urban downtown site.
A principal characteristic of UHII is the anthropogenic effect that is caused from the engineered landscape. By selecting a rural area outside of any towns, the effects caused by housing structures and roads are severely limited, which affords the opportunity to obtain a true temperature value of a natural landscape without the effects brought by human activities [39]. This site is located 14.5 miles (23.39 km) from the urban downtown site, as shown in Figure 10d.
The thermal data in the Landsat satellite imagery is stored as Digital Numbers (DNs). In order to accurately estimate LST, the DNs first need to be converted into radiance values. Next, the processed image is converted to the brightness temperature by using Planck’s radiance function. In addition, the Landsat bands are converted to reflectance bands, which are used to calculate the normalized difference vegetation index (NDVI). The land surface emissivity is derived afterwards. With both the brightness temperature and land surface emissivity being available, the LST is computed with the inverse Planck’s radiance function. More details on the LST conversion can be found in Sobrino et al. [24].
The converted LST for Birmingham, AL, USA on 14 August 2007 is shown in Figure 11. The corresponding local time is CDT 11:18 a.m. for that day. It is noticeable that the Birmingham metropolitan area stands out as being covered in red in this figure. At the selected urban site, which is Downtown Birmingham, the area-averaged LST is 41 C. Over the selected suburban site, the area-averaged LST is 35 C; and over the rural site, it is 33 C. Therefore, the UHII based on the LST difference between the urban and rural sites is 8 C, on this specific day.
Hug [36] studied the UHII of Birmingham, AL, USA for 2014 with the aid of the observation and remote sensing data. Specifically, for evaluating the air UHII in Birmingham, Hug [36] used a device called “iButton” to collect the hourly 2-m air temperature during March–August 2014 and found that the mean daytime air UHII for the month of August 2014 is about 1.7 C. In addition, Hug [36] also used Landsat data to assess the daytime surface (skin) UHII of Birmingham on 26 March 2014 and 16 July 2014, respectively. On 26 March 2014, the daytime surface UHII is found to be about 5.0 C. On 16 July 2014, it is about 7.0 C for Birmingham, AL. Hence, the surface UHII of Birmingham found in our present study on 14 August 2007 appears to be within the reasonable range in comparison to the study of Hug [36]. Nevertheless, given Hug [36] provides the surface UHII in Birmingham on only two specific days of 2014, it is nearly impossible to derive a baseline value for the Birmingham surface UHII in the summer season such that our current result can compare against.
Meanwhile, numerous studies have been previously carried out upon the surface UHII evaluations which are summarized in two review articles by Phelan et al. [19] and Rasul et al. [20], respectively. The review article by Phelan et al. [19] collected the measured surface (skin) UHII of selected cities around the world for recent years. This study pointed out that these major cities experience UHI at a varying degrees, with the seasonal UHII ranging from 4 to 10 C. On the extreme end, Tran et al. [23] reported the daytime surface UHII in excess of 12 C for Tokyo, Japan in August 2001, while for Seoul of South Korea, Beijing of China and Shanghai of China, the daytime surface UHII is 8 C, 10 C and 7 C, respectively, for August 2001. Furthermore, according to Rasul et al. [20], the daytime surface UHII is reported to be 7.5 C for Vancouver of Canada, 7 C for Medellin of Colombia and 3.3 C for Athens, Greece. Therefore, in perspective of previous studies, the surface UHII experienced by Birmingham, AL, USA on 14 August 2007 as found in the current study tends to fall toward the relatively high extreme of UHII during the unusual period of concurrent blocking, drought and heatwave of 2007. This serves partial evidences that atmospheric blocking may be capable of strengthening the UHII through the heatwave. Nevertheless, more work is warranted in the regards of developing the baseline values of Birmingham surface UHII in the summer season so that we would be capable of systematically evaluating the amplifying effect of blocking-associated heat wave upon the surface UHII.
4. Discussion
Atmospheric blocking is an important large-scale dynamic feature which is commonly studied at the mid-tropospheric level. It often leads to extreme weather events including drought, heatwave, floods and cold air outbreak. Many studies have been done to investigate the dynamics involving how blocking initiates various extreme weather events [5,6,10,11,40,41]. Nevertheless, in terms of spatial scales, these studies tend to mostly focus on the regional scale and above. Only very few studies are focused on linking blocking to the local scale. For instance, both Amraoui et al. [35] and Gouveia et al. [34] examined the connection among blocking, drought and wildfires over the Mediterranean basin and Greece, respectively. Hence, in the present study, we chose to examine the dynamical linkages of atmospheric blocking to drought, heatwave and urban heat island at multiple-scales through a case study in the Southeastern US. Based on this thorough diagnostic study in the 2006–2008 drought event, we found that the August 2007 blocking has contributed to reinforcing the drought, initializing the heatwave and strengthening the UHI severity during the concurrent period with blocking.
Under global warming, more severe droughts and heatwaves tend to be projected for future climate. Nevertheless, Seager et al. [29] investigated a series of past Southeastern US droughts (1856–2007) with both observational and modeling studies and found that the summer-season precipitation variability in the Southeast of the US appears governed by purely internal atmospheric variability instead of anthropogenic climate change. In particular, they examined the same 2006–2008 drought event as we did here and showed that this severe drought has no signature of global warming caused by human activities. Hence, we need to always exercise with extreme caution when attempting to interpret the origin of the rising severe droughts and heatwaves.
In terms of internal atmospheric variability, the ENSO and blocking could be two major possibilities that cause the formation of severe droughts. For instance, the long standing 2011–2014 California drought has attracted much attention due to its prolonged duration and severity. Recent studies by Wang et al. [5], Teng and Branstator [6], Seager et al. [7] all pointed out that this significant drought is originated from a persistent blocking, instead of the ENSO phases. On the other hand, for the 2006–2008 Southeastern US drought, it is believed to be triggered by the La Niña at the beginning, and then intensified by the blocking during the summer of 2008. Therefore, thorough diagnostic study is warranted before the origin of a severe drought can be determined.
In terms of the interaction between UHI and heatwave, Li and Bou-Zeid [42] performed a modeling study with the Weather and Research Forecasting (WRF) model on two sites in Maryland of the US and found that the urban and rural temperatures do not respond to the heatwave in a same way. In specific, Li and Bou-Zeid [42] pointed out that the heatwave tends to intensify the UHII through enhancing the urban temperature more than increasing the ambient rural temperatures. This intensified UHI is attributable to the insufficient soil moisture over the urban area (leading to less latent heat by evapotransporation and more sensible heat) as well as low wind during the heatwave. In the present study, the influence of blocking on UHI is, in fact, fulfilled via the heatwave during the August 2007. The heatwave serves as the intermediate media between blocking and UHI, from the perspective of spatial scales. Meanwhile, the feedbacks between heat waves and UHI continues to be a hot topic drawing a lot of attention from the climate science community. For instance, a recent study by Li et al. [43] pointed out the contrasting responses of urban and rural surface energy budget to heat waves in Beijing, China. In another study, by Founda and Santamouris [44], a positive feedback between heat waves and UHI is discussed over the coastal sites of Greece.
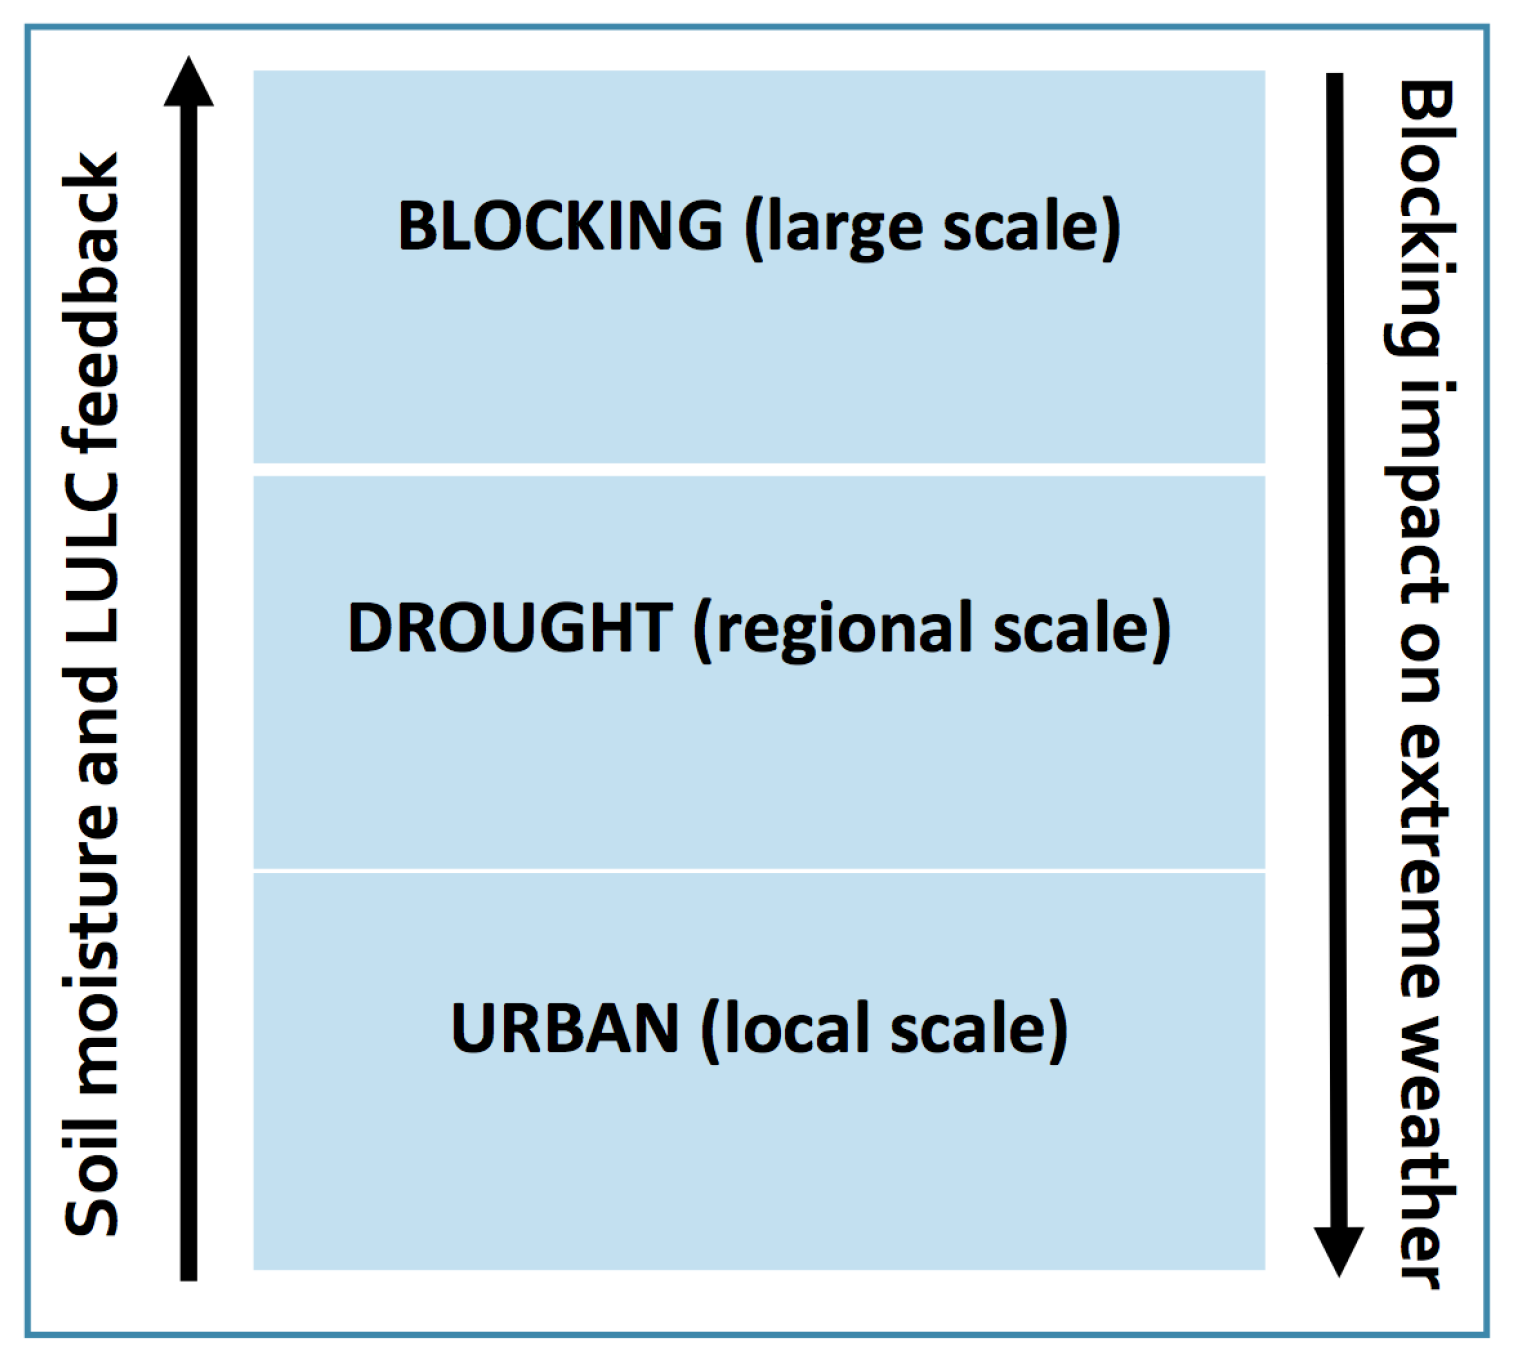
In the previous studies on the dynamical relation between blocking and extreme weather events, most of them tended to merely focus on the causality of extreme weather events by atmospheric blocking instead of feedback to the blocking. A few studies, such as Fischer and Seneviratne [10], Hirsch et al. [45], have investigated the feedback of droughts-, heatwaves-associated soil moisture variations and UHI-associated land use land cover (LULC) change to blocking. Specifically, Fischer and Seneviratne [10] studied the interaction between the 2003 European heatwave and the concurrent notable blocking, and found that the soil moisture deficit from the earlier months before the heatwave led to the reduced latent heating and enhanced sensible heating. This causes the formation of a low-level thermal low pressure center and the amplification of the upper-level ridge, which in turn helps amplify the blocking structure. As for the feedback of LULC change to blocking, Hirsch et al. [45] showed that the LULC change alters the atmospheric circulation through the similar soil moisture feedback such that the LULC change would influence the variability of blocking. Hence, it is worth studying how droughts, heatwave and urban heat island feedback to blocking via the surface flux balance and radiation budget in a systematic way. To put all these feedback together, we schematically depict the dynamical interaction among blocking, drought, heatwave and urban heat island through Figure 12.
5. Conclusions and Further Work
During 13–17 August 2007, a striking atmospheric blocking persisted over the US, exacerbating the existing drought over the Southeastern US. This drought was originally initiated near the beginning of 2006 by La Niña conditions. Due to the presence of the 2017 August blocking, severe precipitation deficit is observed concurrently, which is largely contributed by the blocking-induced increasing surface insolation with more days of clear sky and enhanced subsidence. The presence of the blocking event not only intensified the drought, but also led to a record-breaking heatwave over the Southeast of the US. In particular, on the block onset day 13 August 2007, a well-above normal temperature anomaly was observed over the Southeastern US, which is indicative of a marked heat wave. The excessive heat observed during this heatwave is attributable to the subsidence-associated adiabatic warming as well as the dry-and-warm air advection over the Alabama and neighboring states. This breaking heatwave lasts till 17 August 2007, which coincides with the breaking-down time of the block. At the local scale, we choose Birmingham, AL, as the study area for exploring the blocking influence on surface UHII. Based on the Landsat 5 TM thermal band 6 data, land surface temperature is converted over the Birmingham metropolitan area and the largest surface UHII is found to be 8 C in this area. This value appears within the reasonable range of surface UHII values compared to a similar study done in Birmingham, AL, USA. Nevertheless, more study is warranted to develop a long-term surface UHII baseline during the summer season of Birmingham, AL, USA such that we would be able to systematically assess the amplifying effect of blocking-induced heat wave events on the local surface UHII. Hence, the present work provides a unique case study in which blocking, drought, heatwave and UHI all occur concurrently, and interplay across a spectrum of spatial scales including large scale, regional scale and local scale. Blocking was found to reinforce the drought, initiate the heatwave and probably amplify the UHI through this unique case.
With the warming global climate, recently, the discussion on how atmospheric blocking would respond to polar amplification has become the center of hot debate. In particular, researchers desire to find out whether polar amplification would enhance the frequency or intensity of extreme weather events, via the variations of blocking behavior under global warming. As for future work, we intend to perform a systematic evaluation upon past blocking events (1948–2016) in accordance with past droughts, heatwaves and UHI at selected sites. We plan to address the question: How often are the past extreme weather events caused by atmospheric block and what is the response of blocking to polar amplification? In addition, we would be also interested in further exploring the feedback of extreme weather events (such as droughts and heatwaves) to blocking via atmosphere-land coupling including the feedback of soil moisture and land use land cover change to atmosphere.
Acknowledgments
This study was supported by the Intramural Grants Program of Auburn University, Alabama, United States. The authors would like to acknowledge Joshua S. Watson from National Weather Service of NOAA for contributing his algorithm for blocking detection. Furthermore, we also thank Donn Rodkohr from Auburn University for providing assistance with converting Landsat remote sensing data to LST. In addition, we greatly appreciate the very constructive comments raised by two anonymous reviewers. These comments have significantly helped improve the clarity and quality of this manuscript.
Author Contributions
Li Dong and Chandana Mitra conceived and designed the experiments; Li Dong performed analysis of the 2007 August blocking event and wrote the paper; Chandana Mitra provided guidance to Seth Greer and Ethan Burt on converting Landsat data to LST; Seth Greer and Ethan Burt performed the conversion of LST, and have equal contributions to this paper.
Conflicts of Interest
The authors declare no conflict of interest.
References
- Rex, D.F. Blocking action in the middle troposphere and its effect upon regional climate. I. An aerological study of blocking action. Tellus 1950, 2, 196–211. [Google Scholar]
- Austin, J.F. The blocking of middle latitude westerly winds by planetary waves. Q. J. R. Meteorol. Soc. 1980, 106, 327–350. [Google Scholar] [CrossRef]
- Colucci, S.J. Planetary-scale preconditioning for the onset of blocking. J. Atmos. Sci. 2001, 58, 933–942. [Google Scholar] [CrossRef]
- Dole, R.M.; Gordon, N.D. Persistent anomalies of the extratropical Northern Hemisphere wintertime circulation: Geopotential distribution and regional persistence characteristics. Mon. Weather Rev. 1983, 111, 1567–1586. [Google Scholar] [CrossRef]
- Wang, S.Y.; Hipps, L.; Gillies, R.R.; Yoon, J. Probable causes of the abnormal ridge accompanying the 2013-2014 California drought: ENSO precursor and anthropogenic warming footprint. Geophys. Res. Lett. 2014, 41, 3220–3226. [Google Scholar] [CrossRef]
- Teng, H.; Branstator, G. Causes of extreme ridges that induce California droughts. J. Clim. 2017, 30, 1477–1492. [Google Scholar] [CrossRef]
- Seager, R.; Hoerling, M.; Schubert, S.; Wang, H.; Lyon, B.; Kumar, A.; Nakamura, J.; Henderson, N. Causes of the 2011–2014 California drought. J. Clim. 2015, 28, 6998–7024. [Google Scholar]
- Williams, A.P.; Seager, R.; Abatzoglou, J.T.; Cook, B.I.; Smerdon, J.E.; Cook, E.R. Contribution of anthropogenic warming to California drought during 2012–2014. Geophys. Res. Lett. 2015, 42, 6819–6828. [Google Scholar] [CrossRef]
- Chase, T.N.; Wolter, K.; Rasool, I. Was the 2003 European summer heat wave unusual in a global context? Geophys. Res. Lett. 2006, 33. [Google Scholar] [CrossRef]
- Fischer, E.M.; Seneviratne, S.I. Soil moisture-atmosphere interactions during the 2003 European summer heat wave. J. Clim. 2007, 20, 5081–5099. [Google Scholar] [CrossRef]
- Garcia-Herrera, R.; Diaz, J.; Trigo, R.M.; Luterbacher, J.; Fischer, E.M. A review of the European summer heat wave of 2003. Crit. Rev. Environ. Sci. Technol. 2010, 40, 267–306. [Google Scholar] [CrossRef]
- Barriopedro, D.; Garcia-Herrera, R.; Lupo, A.R.; Hernández, E. A climatology of Northern Hemisphere blocking. J. Clim. 2006, 19, 1042–1063. [Google Scholar] [CrossRef]
- Renwick, J.A. ENSO-related variability in the frequency of South Pacific blocking. Mon. Weather Rev. 1998, 126, 3117–3123. [Google Scholar] [CrossRef]
- Sáez de Adana, F.J.; Colucci, S.J. Southern Hemisphere blocking onsets associated with upper-tropospheric divergence anomalies. J. Atmos. Sci. 2005, 62, 1614–1625. [Google Scholar] [CrossRef]
- Dong, L.; Vogelsang, T.J.; Colucci, S.J. Interdecadal trend and ENSO-related internal variability in Southern Hemisphere blocking. J. Clim. 2008, 21, 3068–3077. [Google Scholar] [CrossRef]
- Francis, J.; Vavrus, S.J. Evidence linking arctic amplification to extreme weather in mid-latitudes. Geophys. Res. Lett. 2012, 39. [Google Scholar] [CrossRef]
- Wallace, J.M.; Held, I.M.; Thompson, D.W.J.; Trenberth, K.E.; Walsh, J.E. Global warming and winter weather. Science 2014, 343, 729–730. [Google Scholar] [CrossRef] [PubMed]
- Hassanzadeh, P.; Kuang, Z.; Farrell, B. Responses of midlatitude blocks and wave amplitude to changes in the meridional temperature gradient in an idealized dry GCM. Geophys. Res. Lett. 2014, 41, 5223–5232. [Google Scholar] [CrossRef]
- Phelan, P.E.; Kaloush, K.; Miner, M.; Golden, J.; Phelan, B.; Silva, H., III; Taylor, R.A. Urban heat island: Mechanisms, implications, and possible remedies. Annu. Rev. Environ. Resour. 2015, 40, 285–307. [Google Scholar] [CrossRef]
- Rasul, A.; Balzter, H.; Smith, C.; Remedios, J.; Adamu, B.; Sobrino, J.A.; Srivanit, M.; Wang, Q. A review on remote sensing of urban heat and cool islands. Land 2017, 6, 38. [Google Scholar] [CrossRef]
- Debbage, N.; Shepherd, J.M. The urban heat island effect and city contiguity. Comput. Environ. Urban Syst. 2015, 54, 181–194. [Google Scholar] [CrossRef]
- Kalnay, E.; Kanamitsu, M.; Kistler, R.; Collins, W.; Deaven, D.; Gandin, L.; Iredell, M.; Saha, S.; White, G.; Woollen, J.; et al. The NCEP-NCAR 40-Year Reanalysis Project. Bull. Am. Meteorol. Soc. 1996, 77, 437–471. [Google Scholar] [CrossRef]
- Tran, H.; Uchihama, D.; Ochi, S.; Yasuoka, Y. Assessment with satellite data of the urban heat island effects in Asian mega cities. Int. J. Appl. Earth Obs. Geoinf. 2015, 14, 34–48. [Google Scholar]
- Sobrino, J.A.; Jimenez-Munoz, J.C.; Paolini, L. Land surface temperature retrieval from LANDSAT TM 5. Remote Sens. Environ. 2004, 40, 434–440. [Google Scholar] [CrossRef]
- Thorne, K.; Markharn, B.; Barker, P.S.; Biggar, S. Radiometric calibration of Landsat. Photogramm. Eng. Remote Sens. 1997, 63, 853–858. [Google Scholar]
- Palmer, W.C. Meteorological Drought; Department of Commerce: Washington, DC, USA, 1965; 58p.
- Manuel, J. Drought in the Southeast: Lessons for water management. Environ. Health Perspect. 2008, 116, 168–171. [Google Scholar] [CrossRef]
- Tri-State Water Wars among Alabama, Georgia and Florida. Available online: https://www.southernenvironment.org/cases-and-projects/tri-state-water-wars-al-ga-fl (accessed on 1 November 2017).
- Seager, R.; Tzanova, A.; Nakamura, J. Drought in the Southeastern United States: Causes, variability over the Last Millennium, and the potential for future hydroclimate change. J. Clim. 2009, 22, 5021–5045. [Google Scholar] [CrossRef]
- Watson, J.S.; Colucci, S.J. Evaluation of ensemble predictions of blocking in the NCEP global spectral model. Mon. Weather Rev. 2002, 130, 3008–3021. [Google Scholar] [CrossRef]
- Tibaldi, S.; Molteni, F. On the operational predictability of blocking. Tellus 1990, 42, 343–365. [Google Scholar] [CrossRef]
- Horton, R.M.; Mankin, J.S.; Lesk, C.; Coffel, E.; Raymond, C. A review of recent advances in research on extreme heat events. Curr. Clim. Chang. Response 2016, 2, 242–259. [Google Scholar] [CrossRef]
- National Drought Summary from United States Drought Monitor. Available online: http://droughtmonitor.unl.edu/DroughtSummary.aspx (accessed on 1 November 2017).
- Gouveia, C.M.; Bistinas, I.; Liberato, M.L.R.; Bastos, A.; Koutsias, N.; Trigo, R.M. The outstanding synergy between drought, heatwaves and fuel on the 2007 Southern Greece exceptional fire season. Agric. For. Meteorol. 2016, 218, 135–145. [Google Scholar] [CrossRef]
- Amraoui, M.; Liberato, M.L.R.; Calado, T.J.; DaCamara, C.C.; Pinto-Coelho, L.; Trigo, R.M.; Gouveia, C.M. Fire activity over Mediterranean Europe based on information from Meteosat-8. For. Ecol. Manag. 2013, 294, 62–75. [Google Scholar] [CrossRef]
- Hug, W.A. The Study of Urban Heat Islands in the Birmingham and Auburn-Opelika, Alabama Urban Areas, Using Satellite and Observational Techniques. M.S. Thesis, Auburn University, Auburn, AL, USA, 2014; 149p. [Google Scholar]
- Lu, G.Y.; Wong, D.W. An adaptive inverse-distance weighting spatial interpolation techniques. Comput. Geosci. 2008, 34, 1044–1055. [Google Scholar] [CrossRef]
- Zhu, P.; Zhang, Y. Demand for urban forests in United States cities. Landsc. Urban Plan. 2007, 84, 293–300. [Google Scholar] [CrossRef]
- Oke, T.R. The energetic basis of the urban heat island. Q. J. R. Meteorol. Soc. 1982, 108, 1–24. [Google Scholar] [CrossRef]
- Schneidereit, A.; Schubert, S.; Vargin, P.; Lunkkeit, F.; Zhu, X.; Peters, D.H.W.; Fraedrich, K. Large-scale flow and long-lasting blocking high over Russia: Summer 2010. Mon. Weather Rev. 2012, 140, 2967–2981. [Google Scholar] [CrossRef]
- Kingston, D.G.; Stagge, J.H.; Tallaksen, L.M.; Hannah, D.M. European-scale drought: Understanding connections between atmospheric circulation and meteorological drought indices. J. Clim. 2015, 28, 505–516. [Google Scholar] [CrossRef]
- Li, D.; Bou-Zeid, E. Synergistic interactions between urban heat island and heat waves: The impact in cities is larger than the sum of its parts. J. Appl. Meteorol. Climatol. 2013, 52, 2051–2064. [Google Scholar] [CrossRef]
- Li, D.; Sun, T.; Liu, M.; Yang, L.; Wang, L.; Gao, Z. Contrasting responses of urban and rural surface energy budgets to heat waves explain synergies between urban heat islands and heat waves. Environ. Res. Lett. 2015, 10, 054009. [Google Scholar] [CrossRef]
- Founda, D.; Santamouris, M. Synergies between urban heat island and heat waves in Athens (Greece), during an extremely hot summer (2012). Sci. Rep. 2017, 7, 10973. [Google Scholar] [CrossRef] [PubMed]
- Hirsch, A.L.; Pitman, A.J.; Kala, J. The role of land cover change in modulating the soil moisture-temperature land-atmosphere coupling strength over Australia. Geophys. Res. Lett. 2014, 41, 5883–5890. [Google Scholar] [CrossRef]
Figure 1.
Time series of Palmer Drought Severity (PDSI) Index for Alabama. Adopted from ncdc.noaa.gov.
Figure 1.
Time series of Palmer Drought Severity (PDSI) Index for Alabama. Adopted from ncdc.noaa.gov.
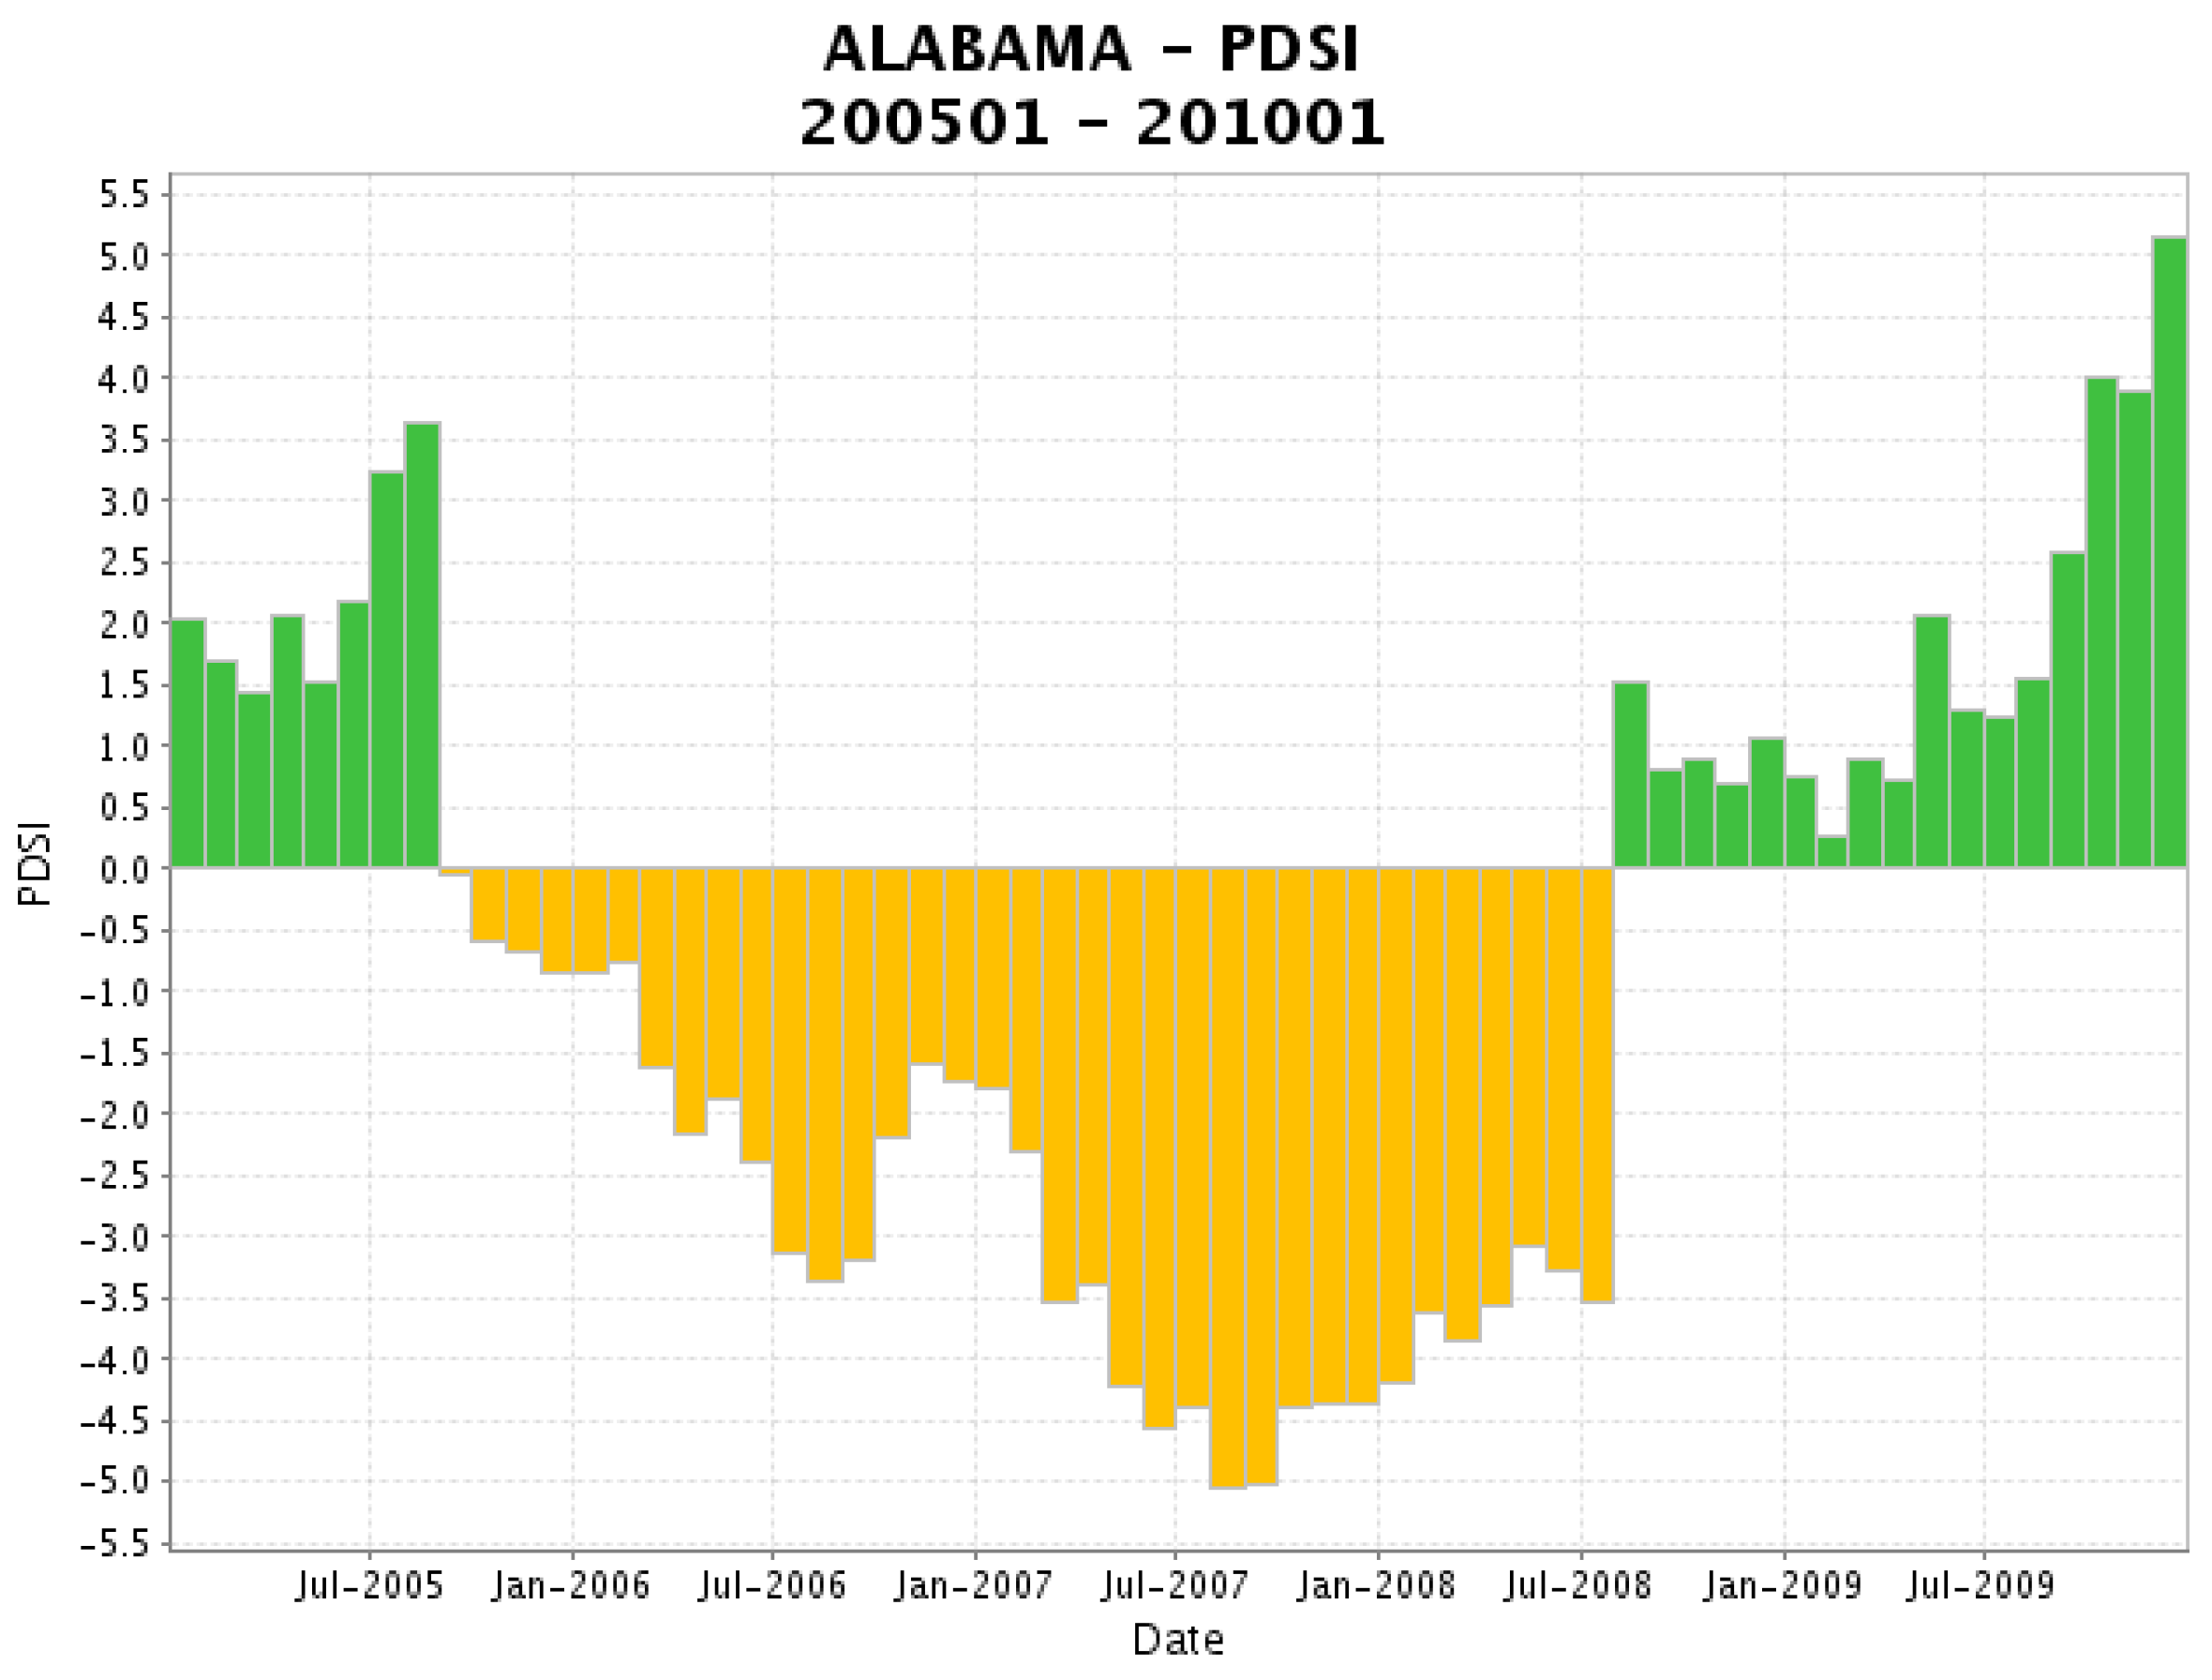
Figure 2.
Drought distribution over the Southeastern US during the week of 14 August 2007, issued by the US Drought Monitor at droughtmonitor.unl.edu.
Figure 2.
Drought distribution over the Southeastern US during the week of 14 August 2007, issued by the US Drought Monitor at droughtmonitor.unl.edu.

Figure 3.
500-mb geopotential heights during the evolution of the 2007 August blocking event from 10 August (a) to 17 August (h). The contour interval is 60 m. The block onset is on 13 August 2007. The block-onset region is outlined with a red rectangle on the block-onset day in (d).
Figure 3.
500-mb geopotential heights during the evolution of the 2007 August blocking event from 10 August (a) to 17 August (h). The contour interval is 60 m. The block onset is on 13 August 2007. The block-onset region is outlined with a red rectangle on the block-onset day in (d).

Figure 4.
Observed precipitation anomaly of August 2007, as shown in (a), apart from the long term mean August precipitation as shown in (b). The contour interval is 20 mm.
Figure 4.
Observed precipitation anomaly of August 2007, as shown in (a), apart from the long term mean August precipitation as shown in (b). The contour interval is 20 mm.
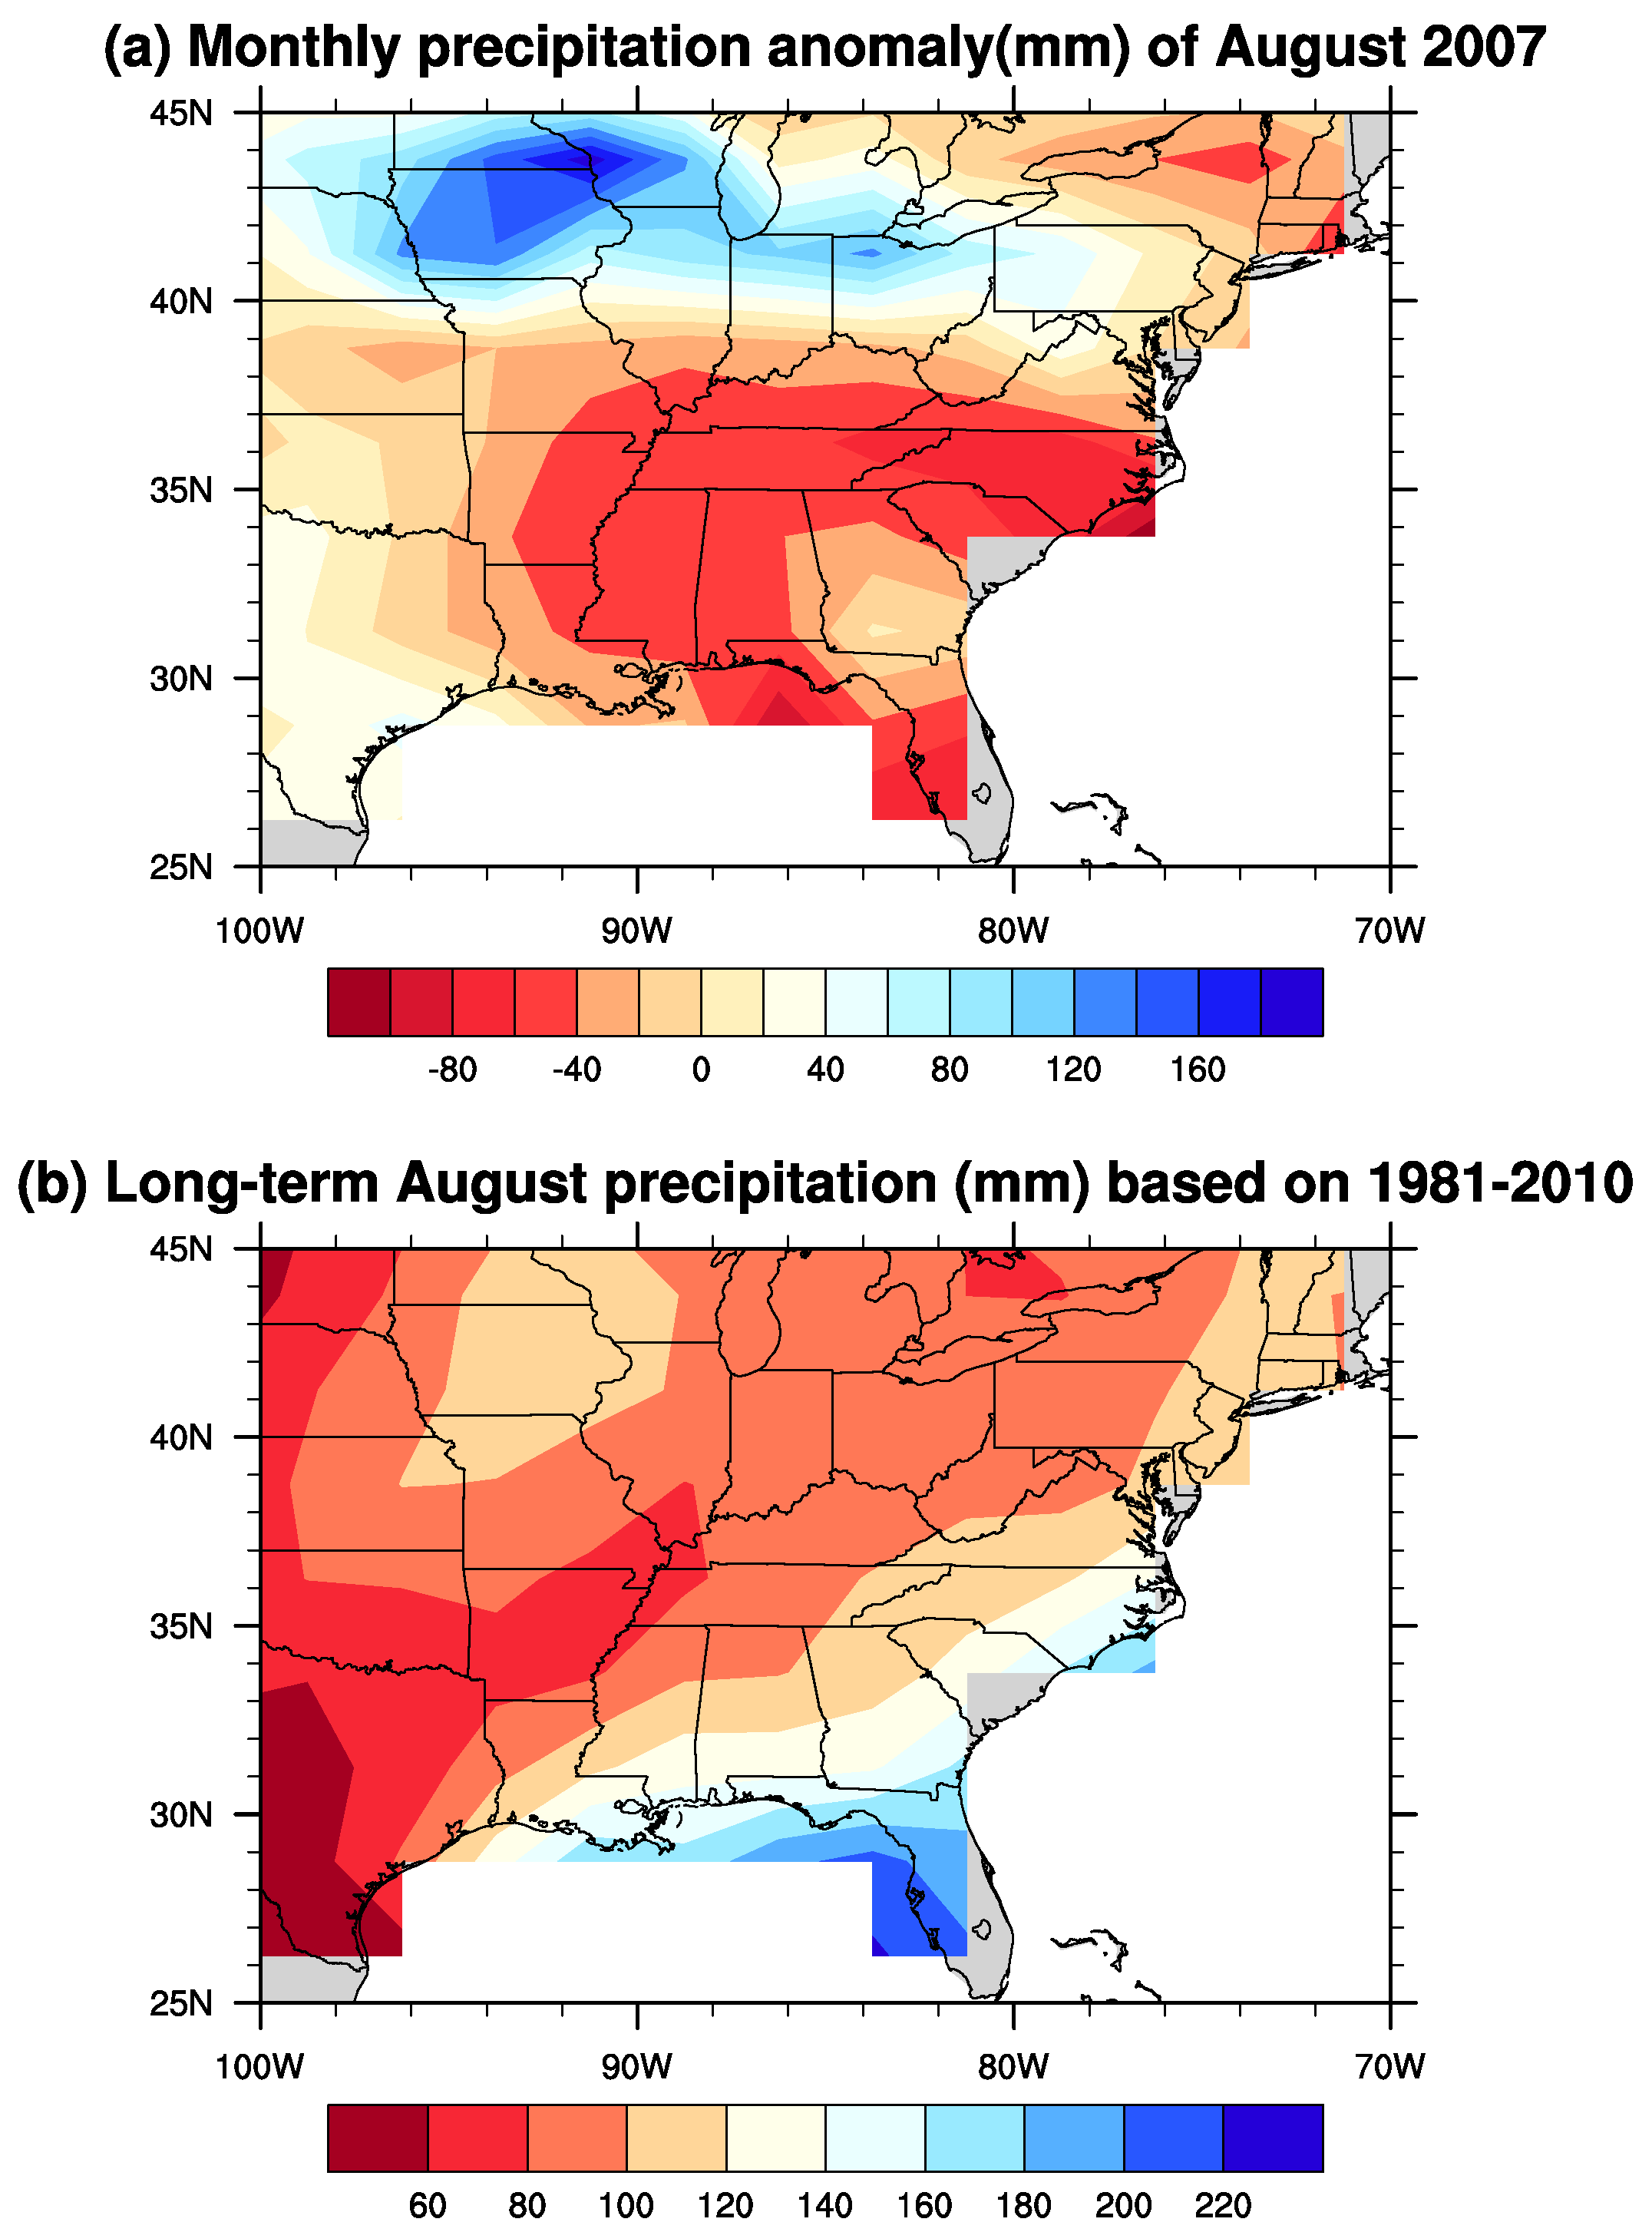
Figure 5.
Daily maximum and minimum temperatures of August 2007 in Birmingham, AL, USA in comparison to the long-term mean daily maximum and minimum temperatures of August, in units of C. The data source is National Weather Services.
Figure 5.
Daily maximum and minimum temperatures of August 2007 in Birmingham, AL, USA in comparison to the long-term mean daily maximum and minimum temperatures of August, in units of C. The data source is National Weather Services.
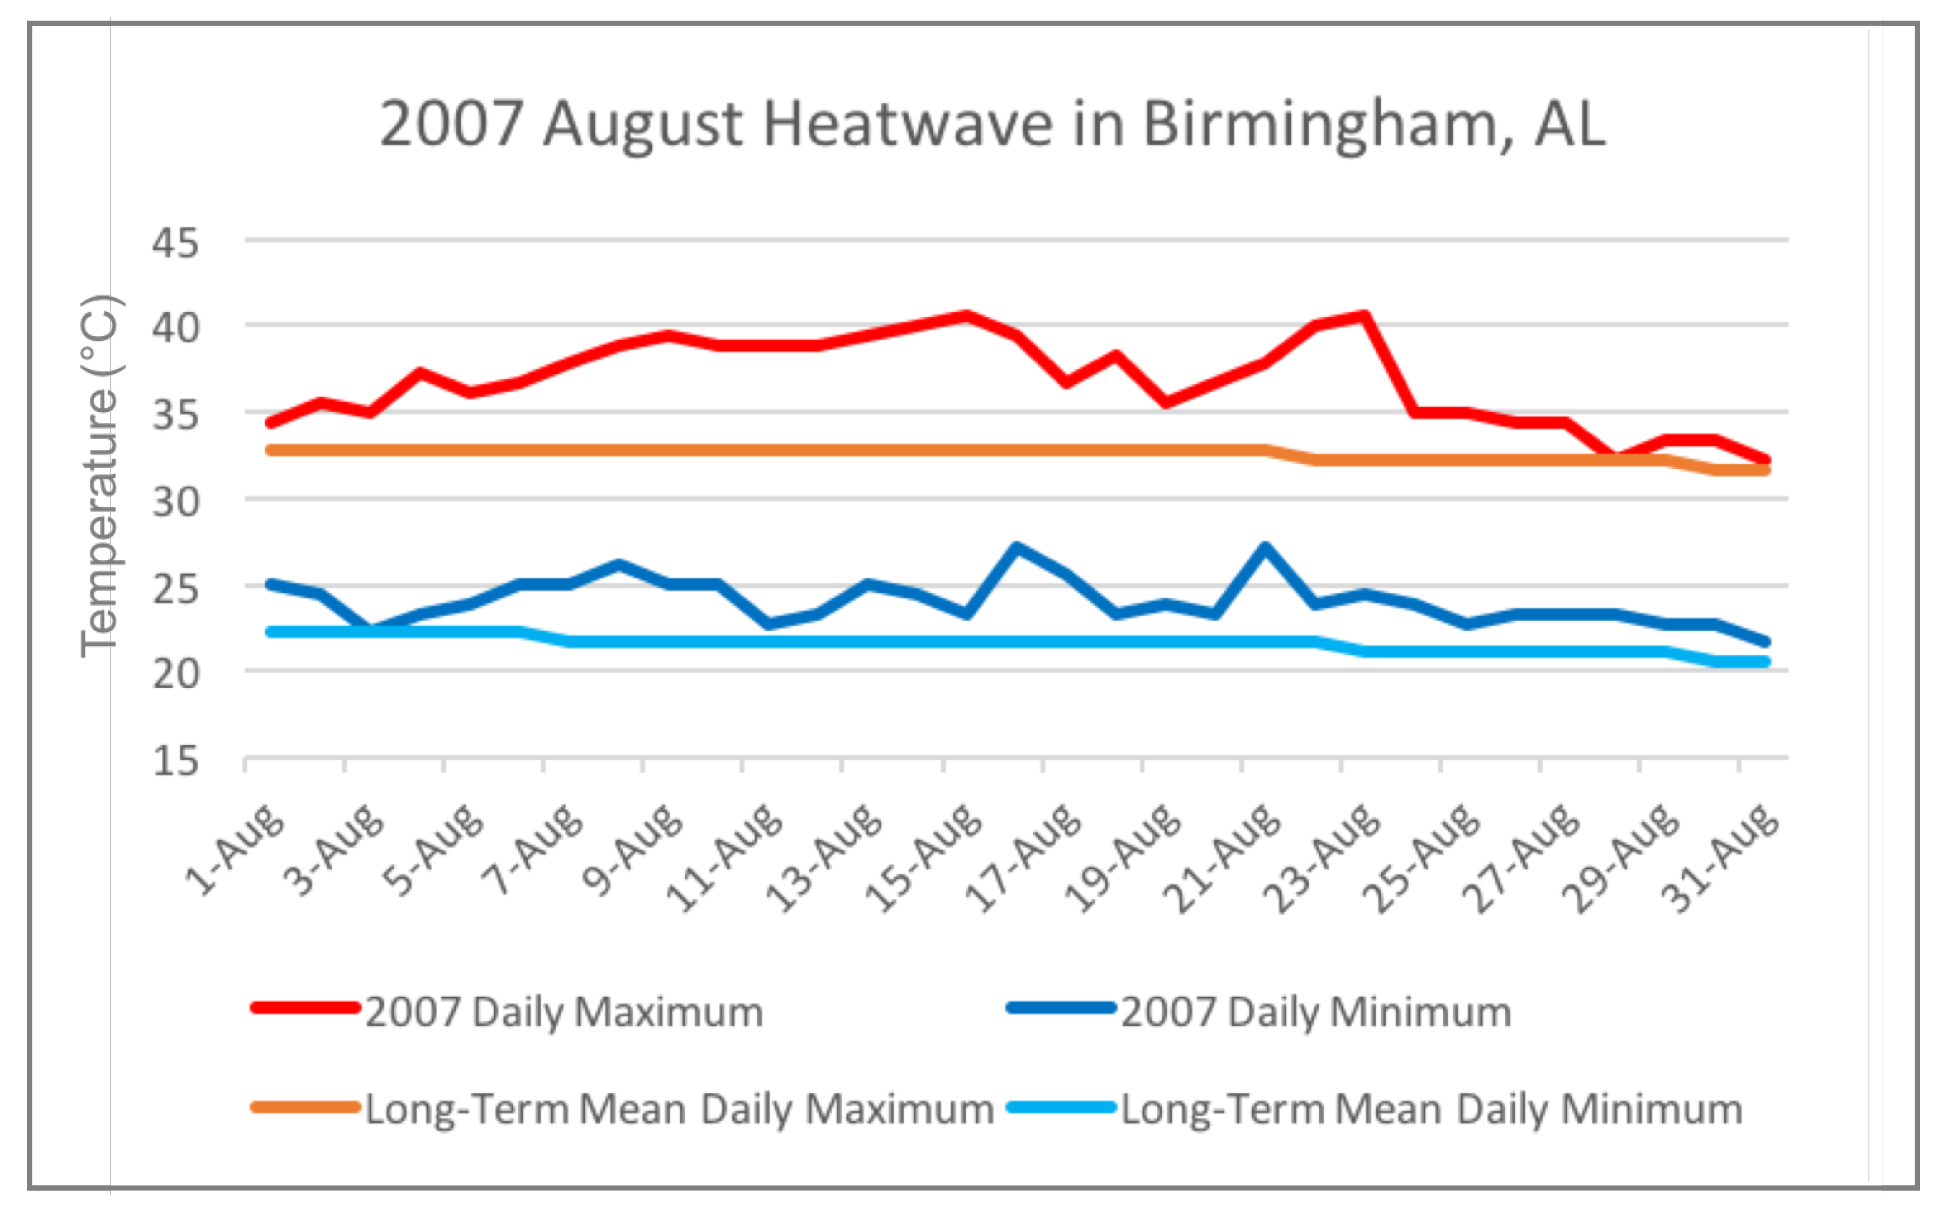
Figure 6.
1000-mb temperature anomaly from the long-term mean temperature from 10 August 2007 (a) to 17 August 2007 (h), in units of C, during the evolution of August 2007 blocking event.
Figure 6.
1000-mb temperature anomaly from the long-term mean temperature from 10 August 2007 (a) to 17 August 2007 (h), in units of C, during the evolution of August 2007 blocking event.

Figure 7.
700-mb vertical motion (omega) from 10 August 2007 (a) to 17 August 2007 (h), in units of Pa/s, during the evolution of August 2007 blocking event.
Figure 7.
700-mb vertical motion (omega) from 10 August 2007 (a) to 17 August 2007 (h), in units of Pa/s, during the evolution of August 2007 blocking event.

Figure 8.
850-mb relative humidity (%) from 10 August 2007 (a) to 17 August 2007 (h), overlaid with 850-mb wind vector (ms), during the evolution of August 2007 blocking event.
Figure 8.
850-mb relative humidity (%) from 10 August 2007 (a) to 17 August 2007 (h), overlaid with 850-mb wind vector (ms), during the evolution of August 2007 blocking event.
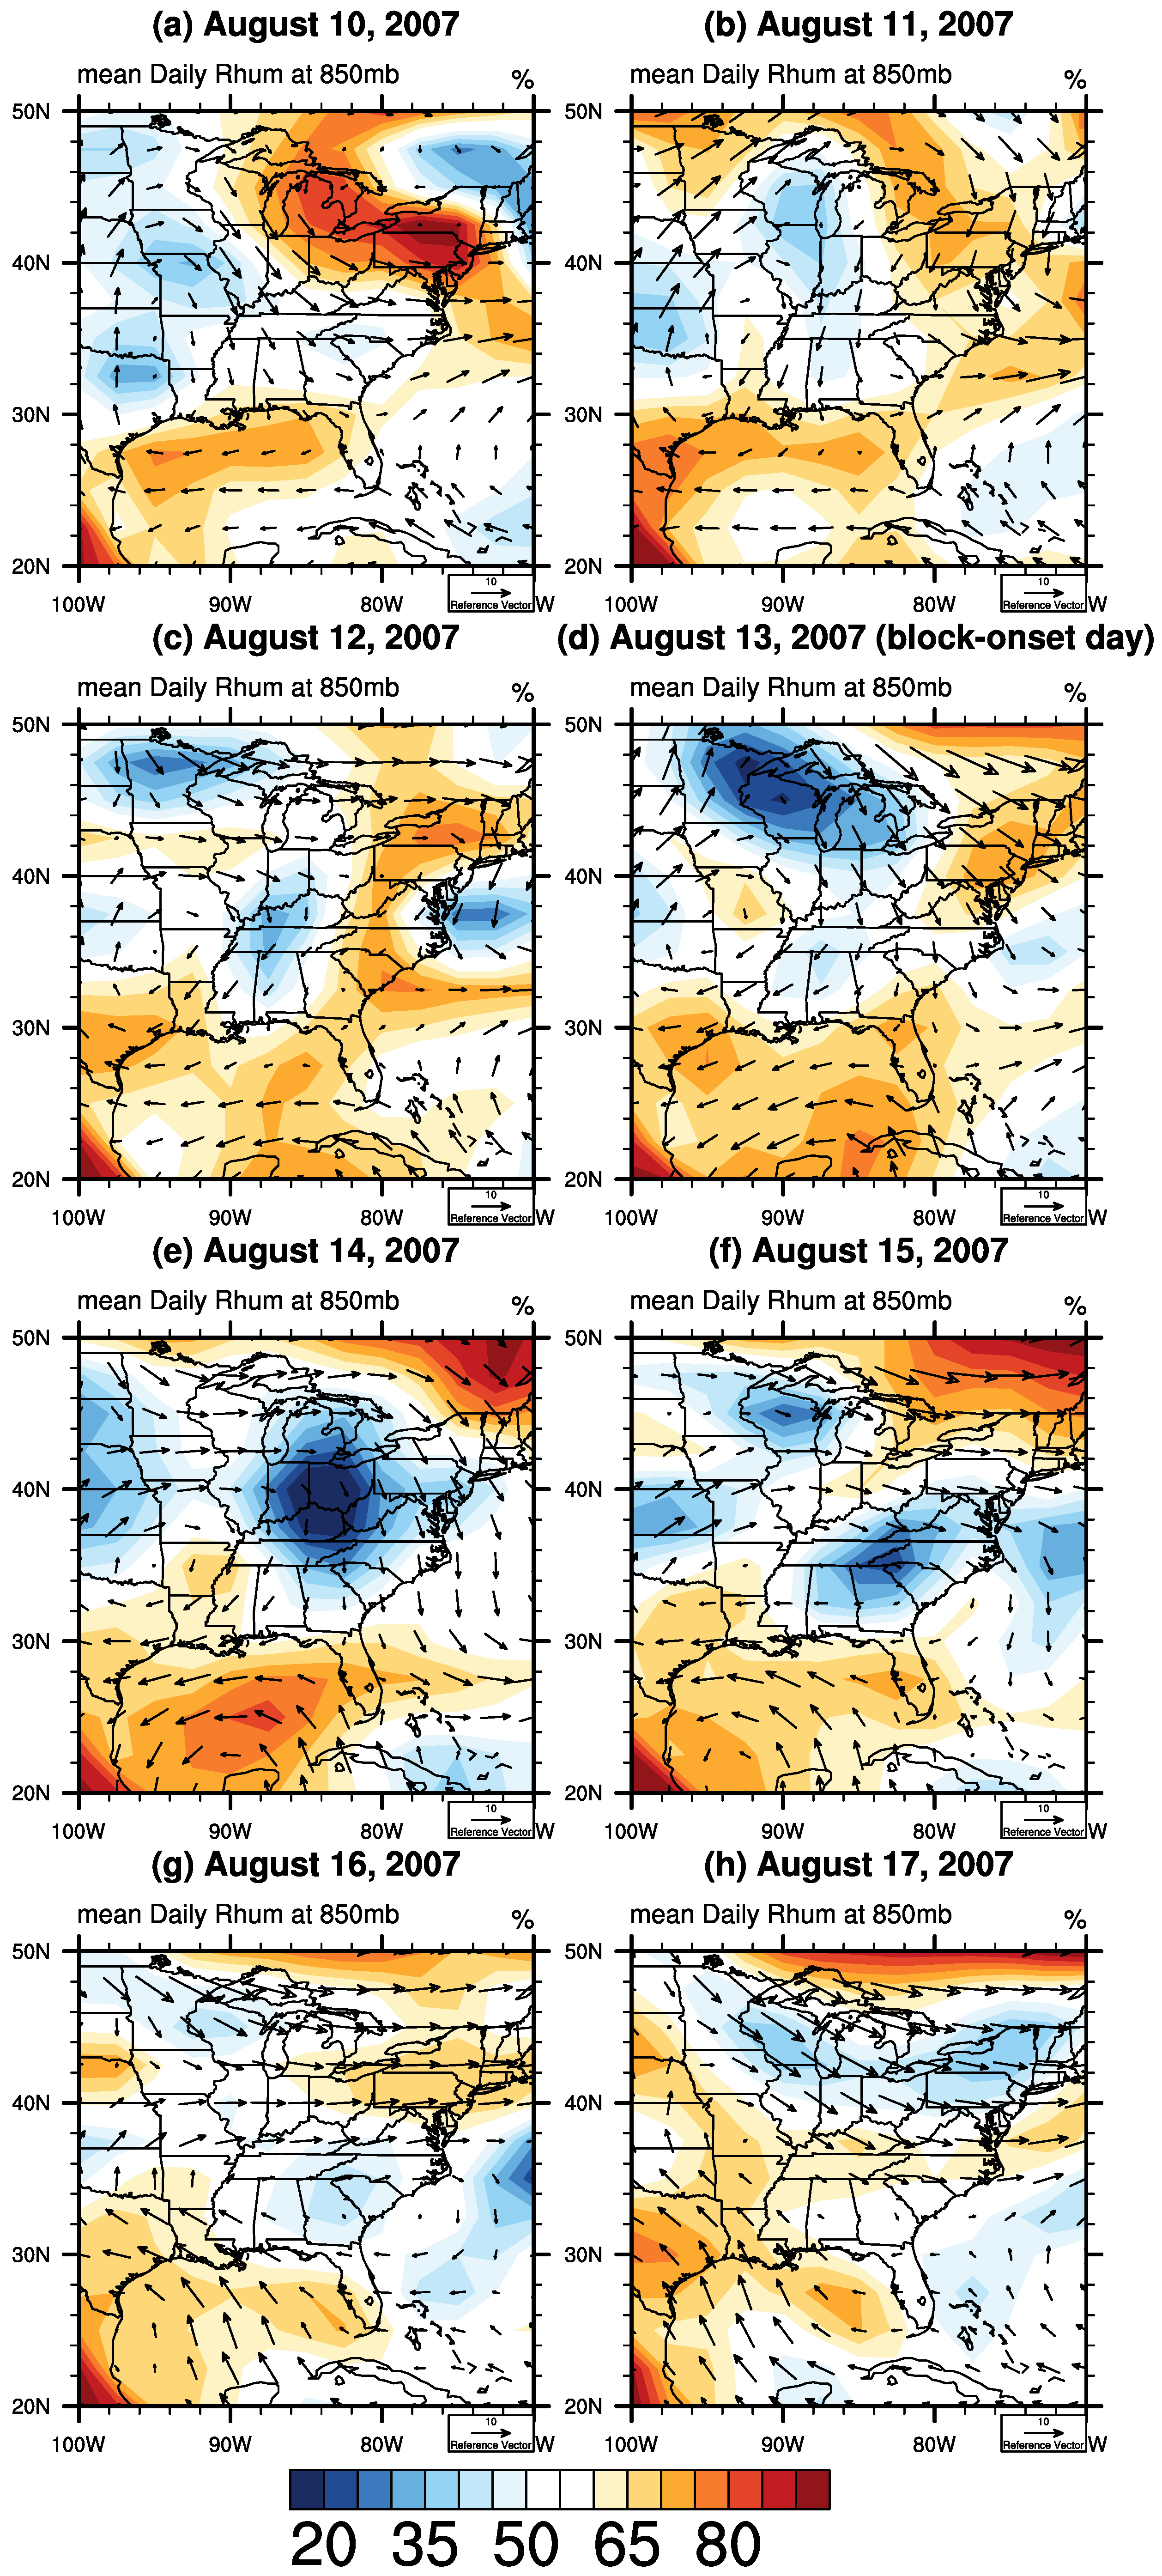
Figure 9.
The map of Birmingham, AL, USA in (a), in relative to Alabama and the US, adopted from Google Earth Imagery; The land use land cover classification of Birmingham, AL, in (b) with red for urban, green for rural and blue for water classifications.
Figure 9.
The map of Birmingham, AL, USA in (a), in relative to Alabama and the US, adopted from Google Earth Imagery; The land use land cover classification of Birmingham, AL, in (b) with red for urban, green for rural and blue for water classifications.
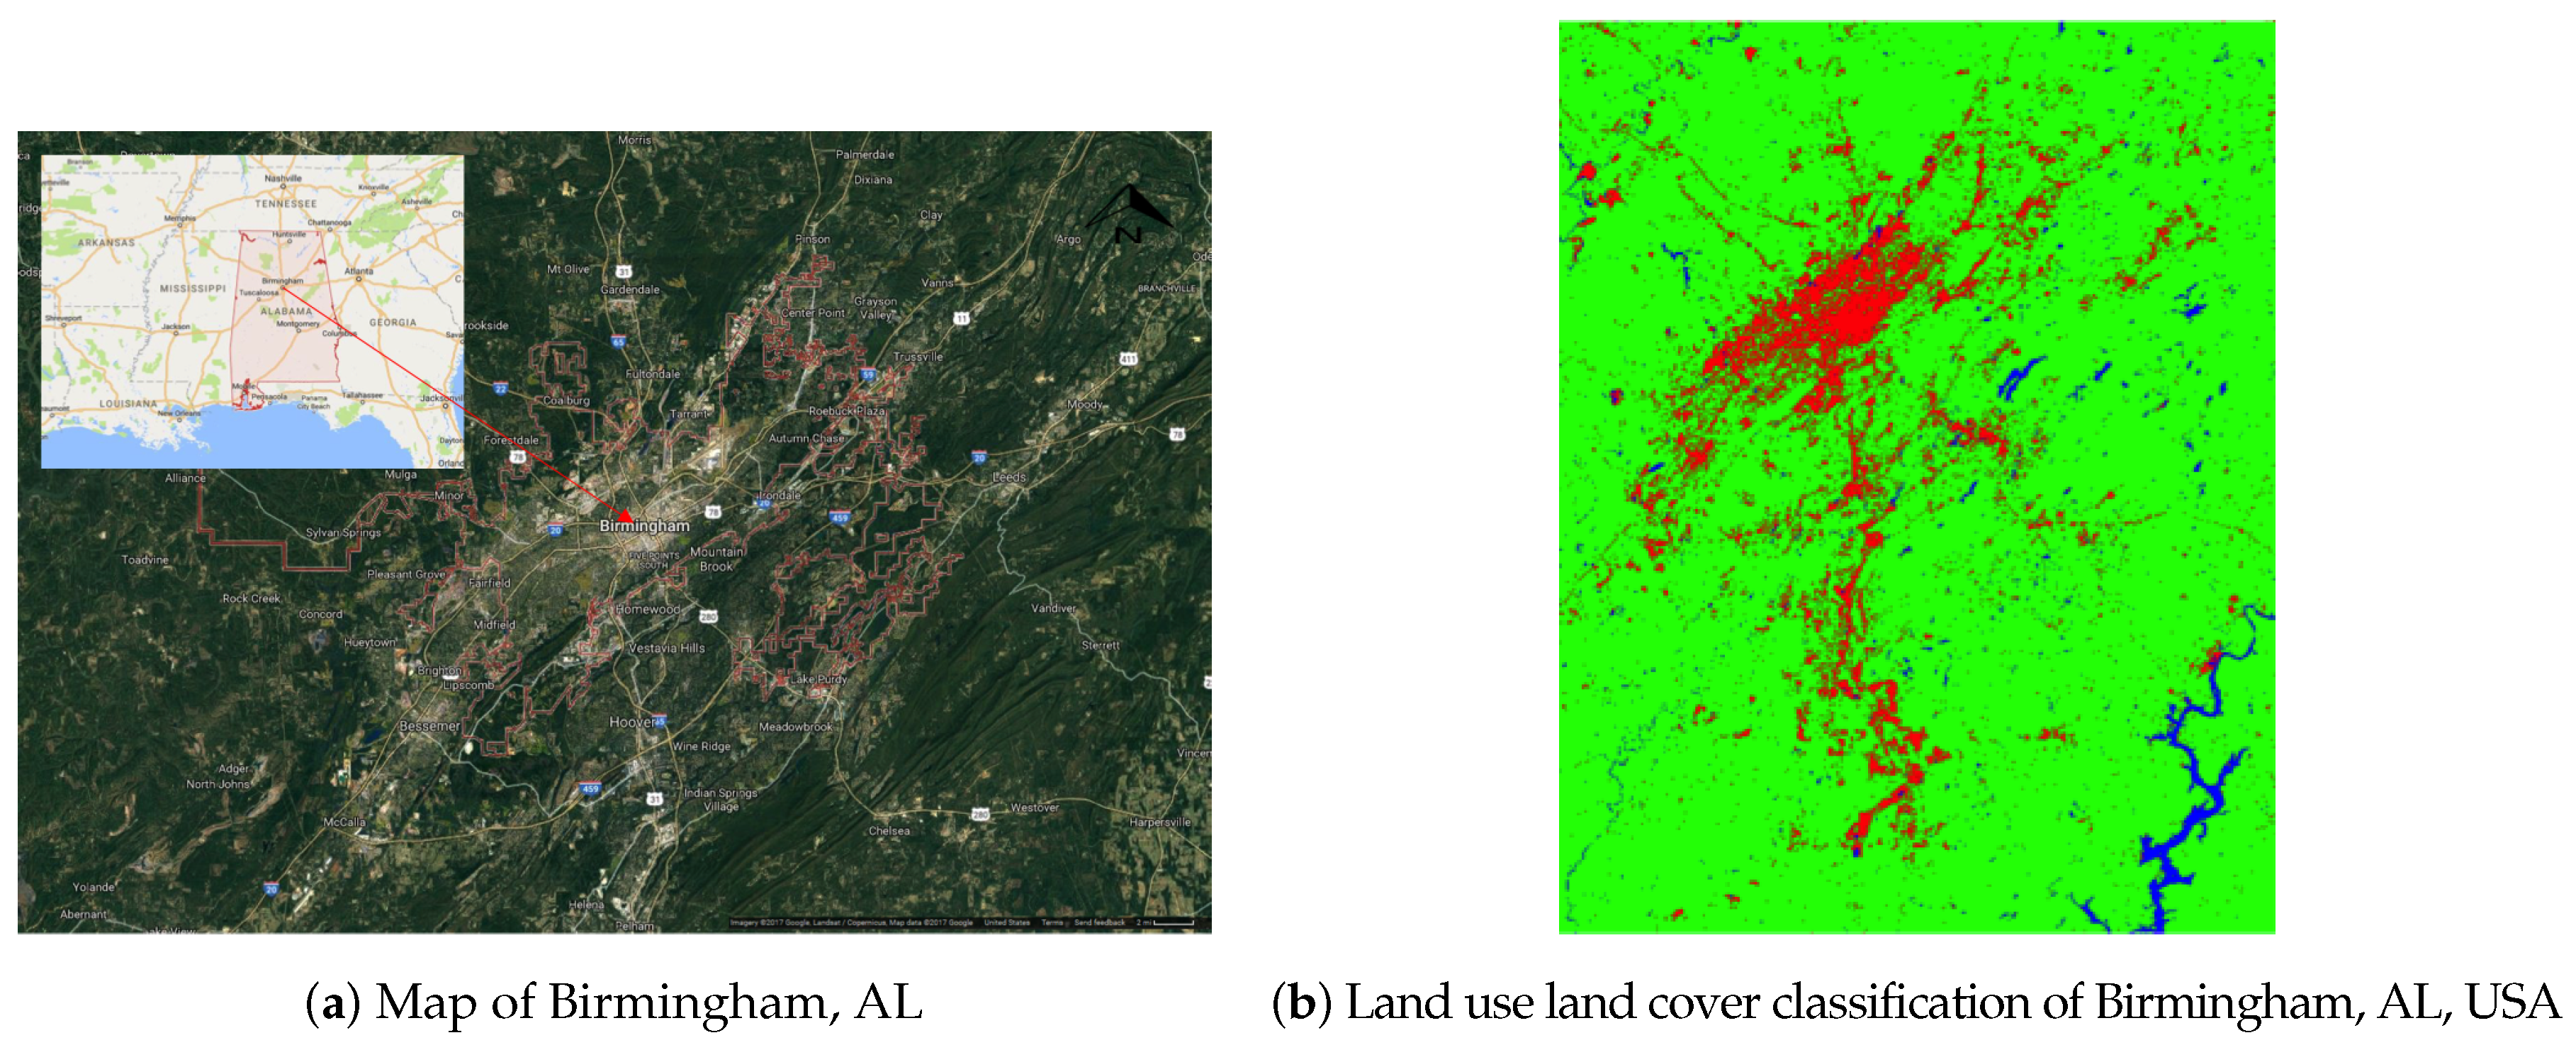
Figure 10.
(a) Selected three sites, outlined in purple boxes, for UHII study in Birmingham, AL, USA. From west to east, they are rural, urban and suburban areas, respectively; (b) The selected study area for the urban site, Downtown Birmingham, AL; (c) The selected study area for the suburban region of Mountain Brook, a subdivision of Birmingham, AL, USA; (d) The selected area for the rural site of Birmingham, AL, USA. All figures are adopted from Google Earth Imagery.

Figure 11.
Converted LST (land surface temperature) for the Birmingham metropolitan area of AL on 14 August 2007. The unit is C. The three boxes in purple refer to the selected rural, urban and suburban sites, from west to east, as in Figure 10.
Figure 11.
Converted LST (land surface temperature) for the Birmingham metropolitan area of AL on 14 August 2007. The unit is C. The three boxes in purple refer to the selected rural, urban and suburban sites, from west to east, as in Figure 10.
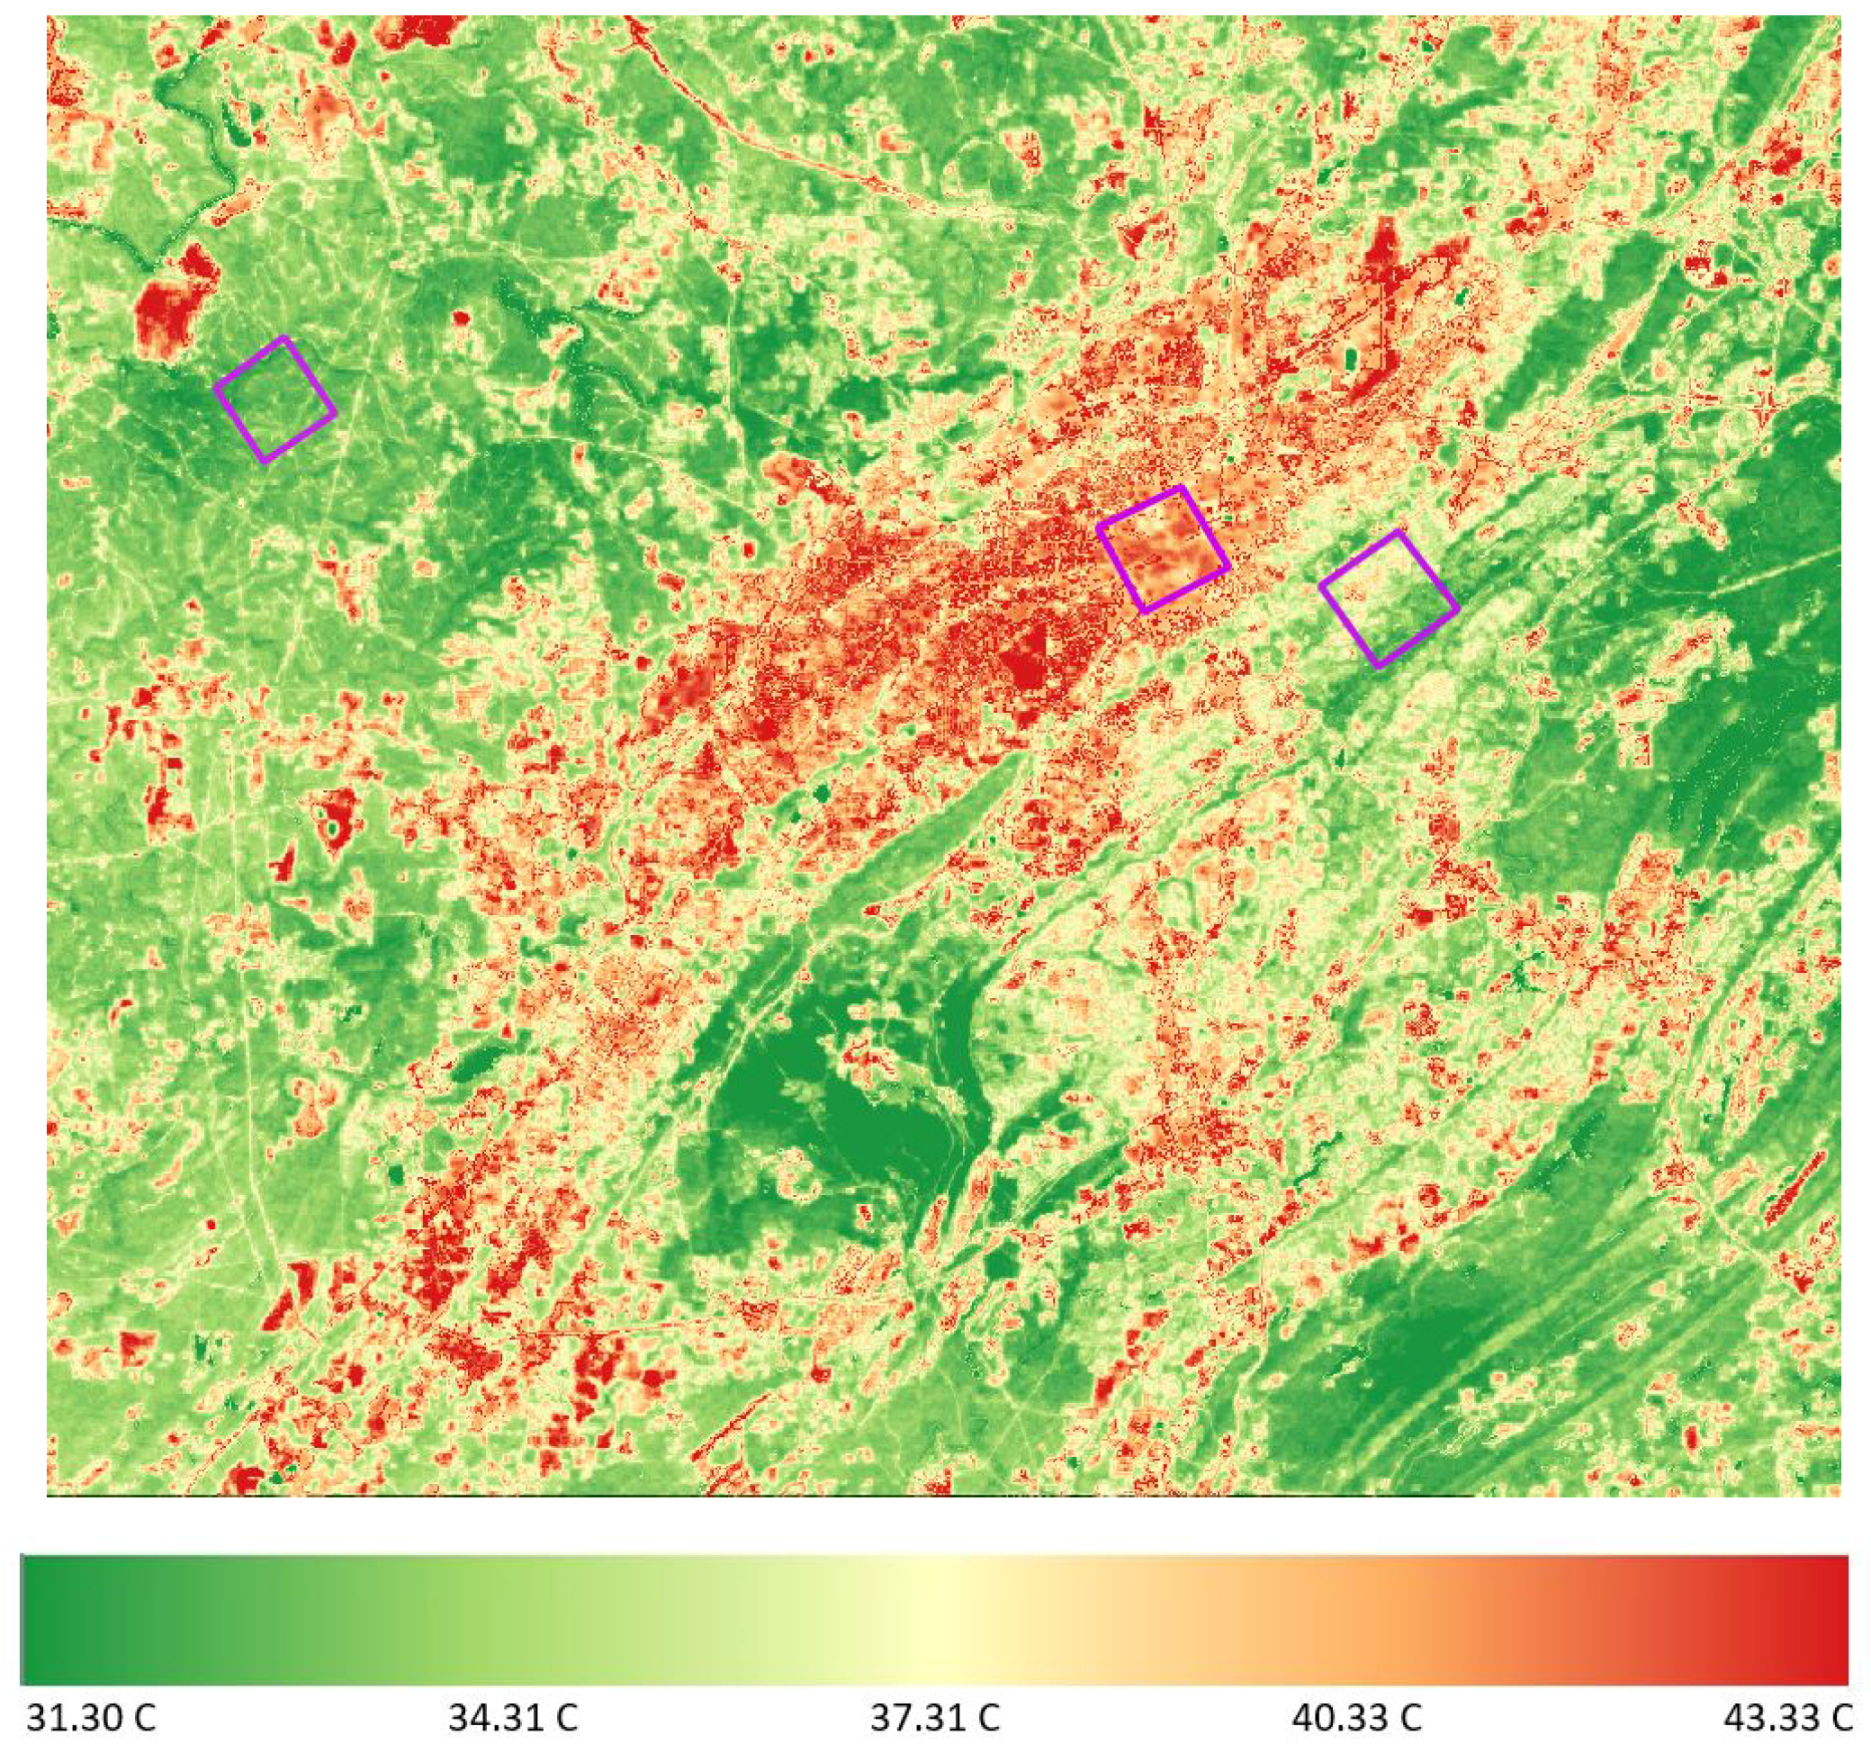
Figure 12.
Schematic illustration of the dynamical linkage and feedback among atmospheric blocking, drought, heatwave and urban heat island across multiple scales. Here land use land change is shortened for LULC.
Figure 12.
Schematic illustration of the dynamical linkage and feedback among atmospheric blocking, drought, heatwave and urban heat island across multiple scales. Here land use land change is shortened for LULC.

© 2018 by the authors. Licensee MDPI, Basel, Switzerland. This article is an open access article distributed under the terms and conditions of the Creative Commons Attribution (CC BY) license (http://creativecommons.org/licenses/by/4.0/).
Share and Cite
MDPI and ACS Style
Dong, L.; Mitra, C.; Greer, S.; Burt, E. The Dynamical Linkage of Atmospheric Blocking to Drought, Heatwave and Urban Heat Island in Southeastern US: A Multi-Scale Case Study. Atmosphere 2018, 9, 33. https://doi.org/10.3390/atmos9010033
AMA Style
Dong L, Mitra C, Greer S, Burt E. The Dynamical Linkage of Atmospheric Blocking to Drought, Heatwave and Urban Heat Island in Southeastern US: A Multi-Scale Case Study. Atmosphere. 2018; 9(1):33. https://doi.org/10.3390/atmos9010033
Chicago/Turabian StyleDong, Li, Chandana Mitra, Seth Greer, and Ethan Burt. 2018. "The Dynamical Linkage of Atmospheric Blocking to Drought, Heatwave and Urban Heat Island in Southeastern US: A Multi-Scale Case Study" Atmosphere 9, no. 1: 33. https://doi.org/10.3390/atmos9010033
Note that from the first issue of 2016, this journal uses article numbers instead of page numbers. See further details here.