Article

Observations of Local Meteorological Variability under Large-Scale Circulation Patterns over Athens, Greece

by
Christos H. Halios
1,*,
Helena A. Flocas
2,
Costas G. Helmis
2,
Dimosthenis N. Asimakopoulos
2 and
Panagiotis G. Mouschouras
3
1
Construction Management and Engineering, University of Reading, Reading RG66DF, UK
2
Department of Physics, Section of Environmental Physics and Meteorology, University of Athens, 15784 Athens, Greece
3
Sigma Business Network, 11741 Athens, Greece
*
Author to whom correspondence should be addressed.
Atmosphere 2018, 9(1), 25; https://doi.org/10.3390/atmos9010025
Submission received: 30 November 2017 / Revised: 12 January 2018 / Accepted: 18 January 2018 / Published: 23 January 2018
(This article belongs to the Special Issue Advances in Atmospheric Physics: Selected Papers from CEST2017)

Abstract

:
Linking synoptic circulation patterns to specific environmental problems is of significance in the Eastern Mediterranean region, which is characterized by increased seasonal climatic variability and a wealth of distinct weather patterns. This study aims to discuss the links between synoptic scale circulation, intra-day variability and sub-hourly temperature changes over Athens. Diurnal cycles of surface atmospheric variability were examined by applying Principal Component Analysis and Integral Quantities Analysis to a four months data set with surface meteorological elements. Sub-hourly temperature changes were identified by applying a simple linear technique. Principal Components, Integral Quantities and temperature change rates (geometric structures) were related with synoptic circulation categories. It was found that the presence of a Closed Low over the area results in intense along-mountain flows, whilst, after the passage of a trough, when a strong northwesterly flow is established over the area, surface recirculation flows develop. On 64% of the days, geometric structures were observed in the hourly temperature time-series, and they were found to occur across all synoptic situations. Cliff—ramps was the most common geometric structure, and step changes were found to be related with recirculation flows.

1. Introduction

It is widely recognized that we live in an era when technological innovation allows the integration of different sources of information in advanced predictive tools that will provide seamless prediction engaging atmospheric processes of a wide range of temporal and spatial scales [1]. Currently, few observation and model systems cross these scales, which traditionally concern scientists of different fields. Therefore, understanding the interactions between these scales is critical for the design of future parametrizations and observation networks [2]. In this context, tackling the interactions between large-scale atmospheric circulation and local scale meteorology, which characterizes the climate of a region, is significant. Few studies have reported results towards this direction: for example, the synoptic scale circulation was found to be related with microclimatic patterns in urban Mediterranean areas, such as urban heat island [3], air quality status [4,5,6], local flows [7,8] and thermodynamic instability [9].
The linkage of atmospheric circulation and environmental response can be approached either with a circulation to environment or an environment to circulation perspective [10]. In the former, a general circulation scheme is employed in connection with an environmental phenomenon, whilst the latter aims to define a specific circulation classification with respect to a specific environmental problem. This is particularly of significance in the Eastern Mediterranean region, which is characterized by increased seasonal climatic variability and a wealth of distinct weather patterns [11]. For example, in a study focusing on the period 1958–2000, an increase in frequency of the anticyclonic circulation types was found, associated with an upward trend of maximum temperatures in summer [12]. In [8], the response of the urban surface environment to different atmospheric synoptic forcing was examined in Athens, Greece, a location known to experience several different mesoscale modes [13]. It was found that similar surface thermodynamic fields develop under cyclonic categories, whilst similar mesoscale flows develop under different synoptic categories. Thus, a strong, steady wind flow characterized by high shear values develops under the cyclonic Closed Low and the anticyclonic High–Low (H–L) categories, in contrast to the variable weak flow under the anticyclonic Open Anticyclone category.
The study of the changing rates of meteorological variables with the form of geometric shapes such as ramp- or cliff-like signals, step changes and waves, which are shown in meteorological temporal series, has been long examined in the frame of coherent structures research, especially after several studies indicated that they might dominate the turbulent energy and mass exchange between the atmospheric surface layer and the layers above (e.g., [14]). Since 1958, when “assymetrical triangular waves of temperature” have been detected in the atmospheric boundary layer and have been attributed to convective plumes [15], numerous studies have reported geometrical shapes of coherent structures over a variety of surfaces: land (e.g., [16]), vegetation (e.g., [17]), and water (e.g., [18]). Furthermore, geometric structures are deemed significant in the context of wind energy production, because local events in the form of a large and fast power variation in a wind farm (ramps) can be on occasions critical enough to deserve special attention [19].
Geometric structures in meteorological temporal series were identified over the Greater Athens urban area using a simple linear technique developed by Belušić and Mahrt [20], and they were linked to mesoscale flows [21]. It was found that the temperature field appears much better organized than the wind field, with cliff—ramp structures dominating in the temperature time series. Temperature positive cliff—ramps and ramp—cliffs appear mainly during night time and under weak flow field, while stable, weak flow conditions dominate across all the wind speed structures.
Whilst, in [8], the aim was to tackle the links between synoptic scale circulation and mesoscale surface variability on a daily basis, the focus of the present study is to extend the examination to a wider range of scales by discussing the links between synoptic scale circulation, intra-day variability and sub-hourly temperature changes. The study focuses on the cold period of the year when intra-day and sub-hour variability is more significant.

2. Methods

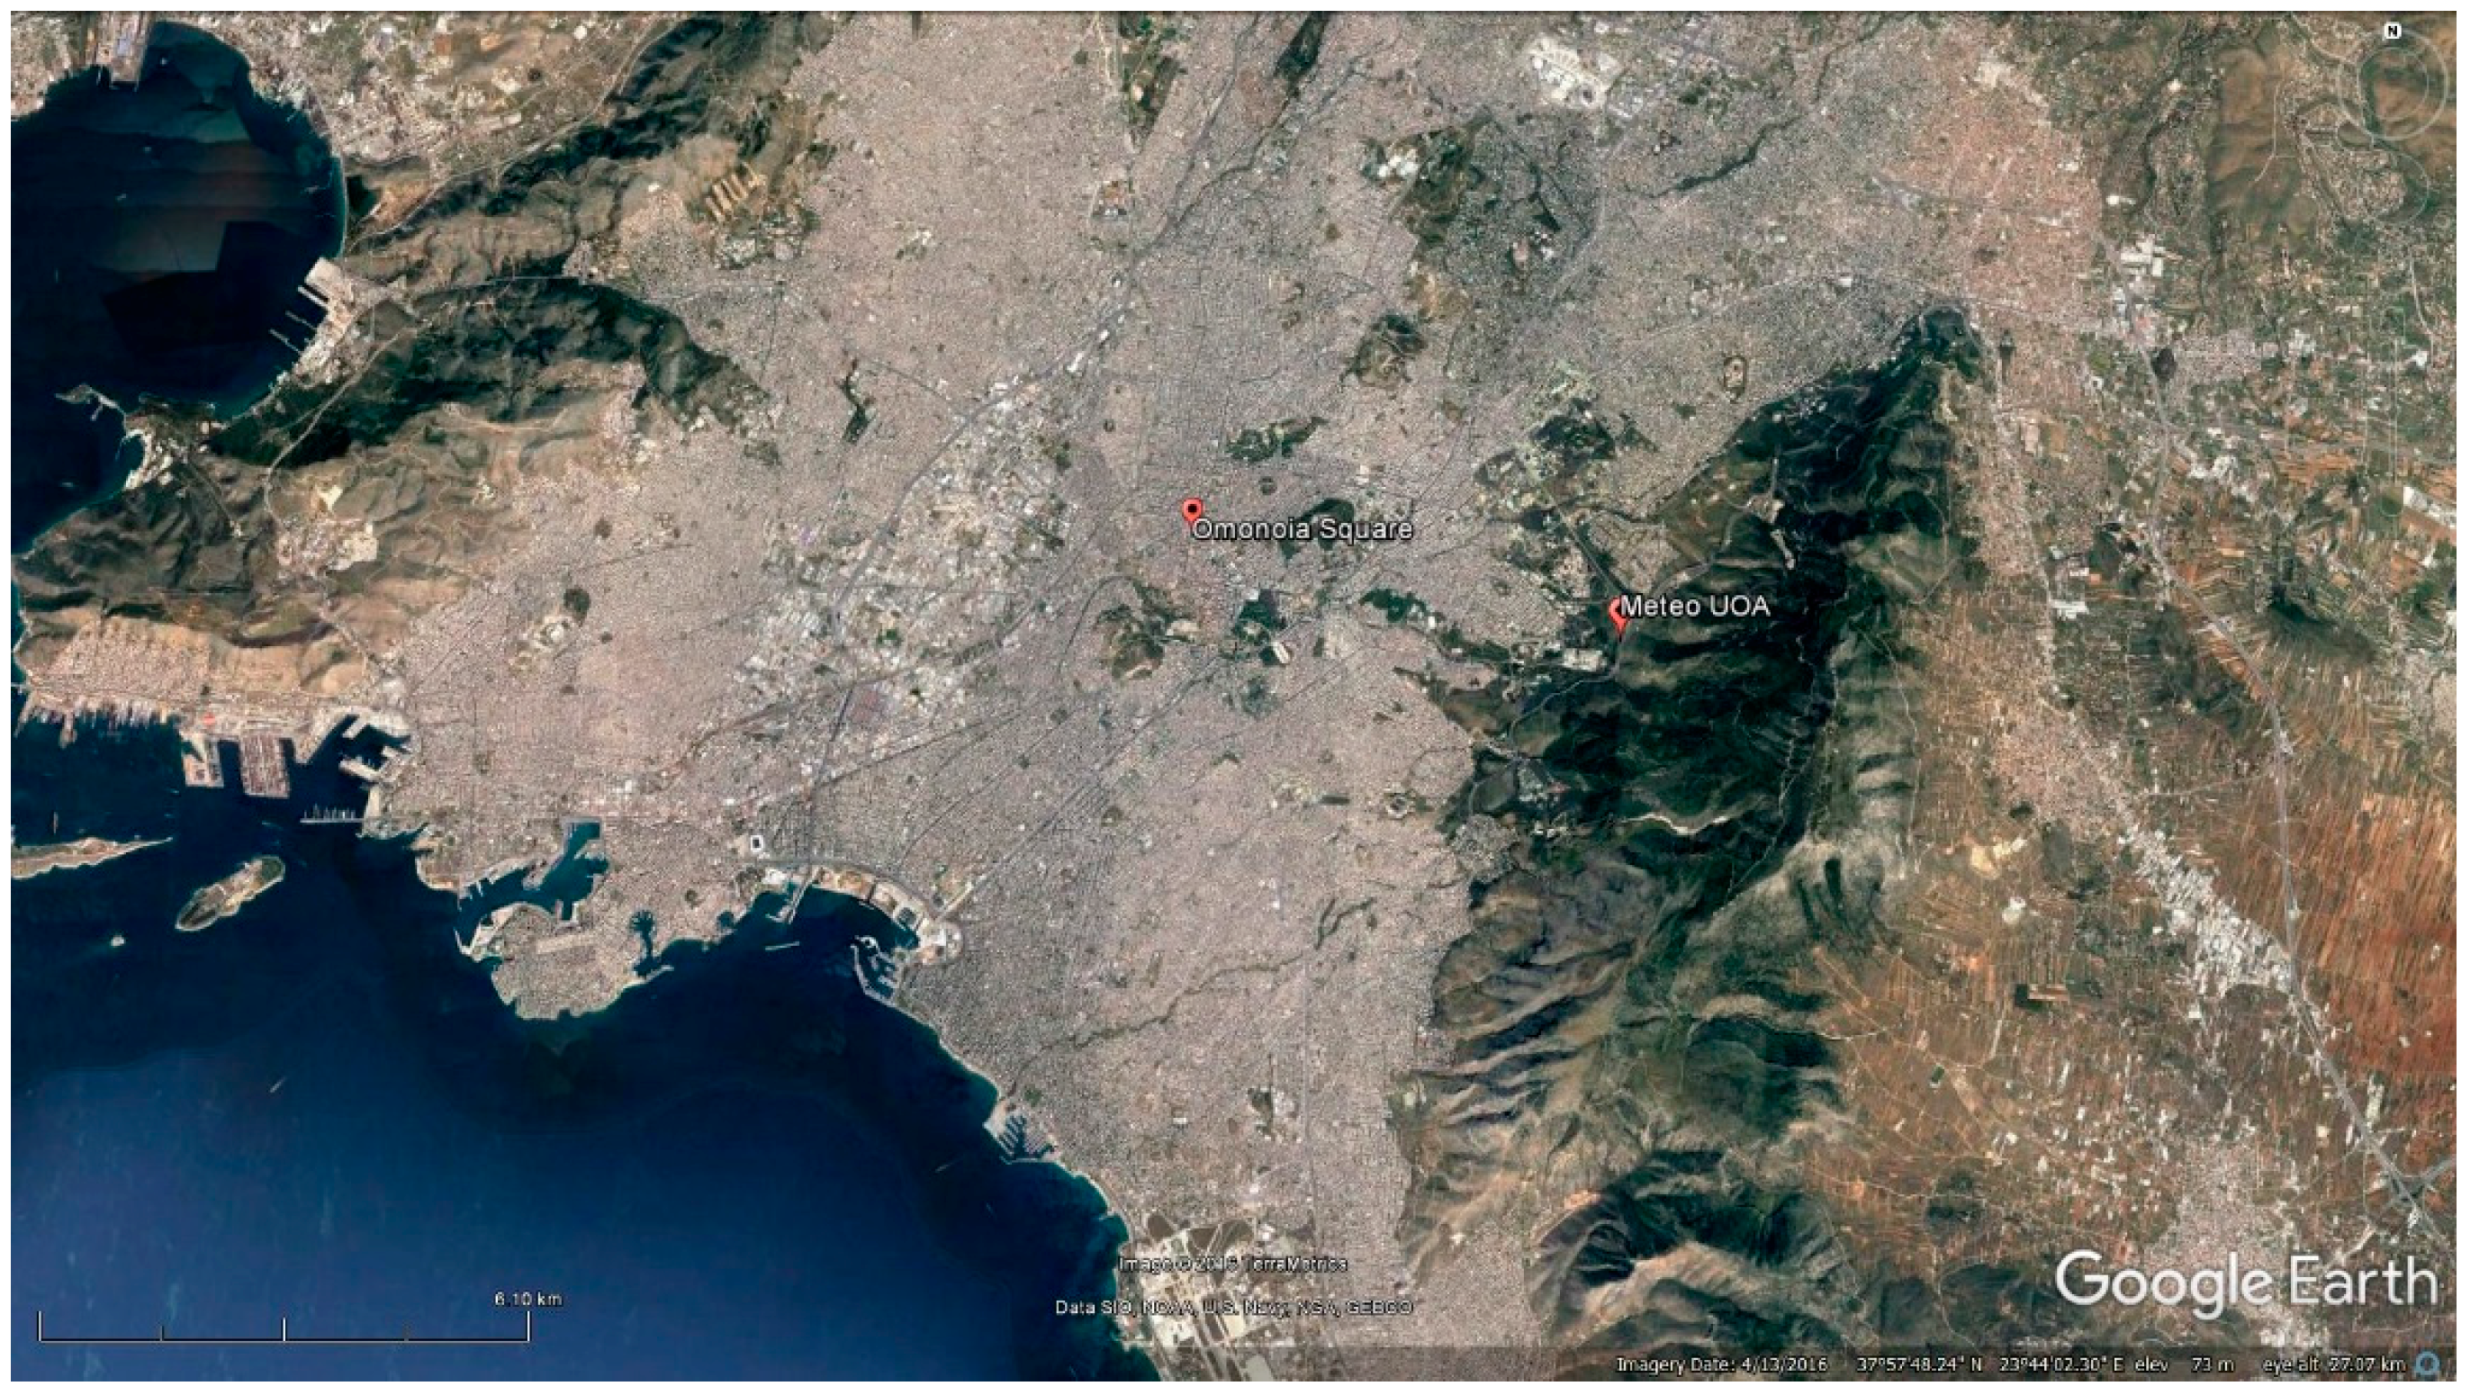
2.1. Experimental Site

Meteorological data collected with the Automatic Meteorological Station of the Lab of Meteorology of the Department of Environmental Physics and Meteorology, University of Athens, during the period 28 January 2000–22 May 2000 were used. This period covers a part of the cold period of the year (January–February), the transition period (March–April) and the warm period (May). The meteorological station is located on the University Campus in the western foothills of Hymettus mountain, 5 km from the city center (Figure 1). The experimental site and the instrumentation used are analytically described in [8,21]. For the present study, a dataset of 1 min measurements of atmospheric pressure (P, hPa), temperature (T, °C), relative humidity (RH, %), solar radiation (SR, Wm−2), wind speed and direction (WS (ms−1) and WD (degrees), respectively) was used measured at 10 m height and wind shear between 10 m and 5 m height. The methods used for the identification of geometric structures, mesoscale flows and synoptic scale circulation have been previously described in [8,21] respectively. In the following, the basic steps are briefly described.

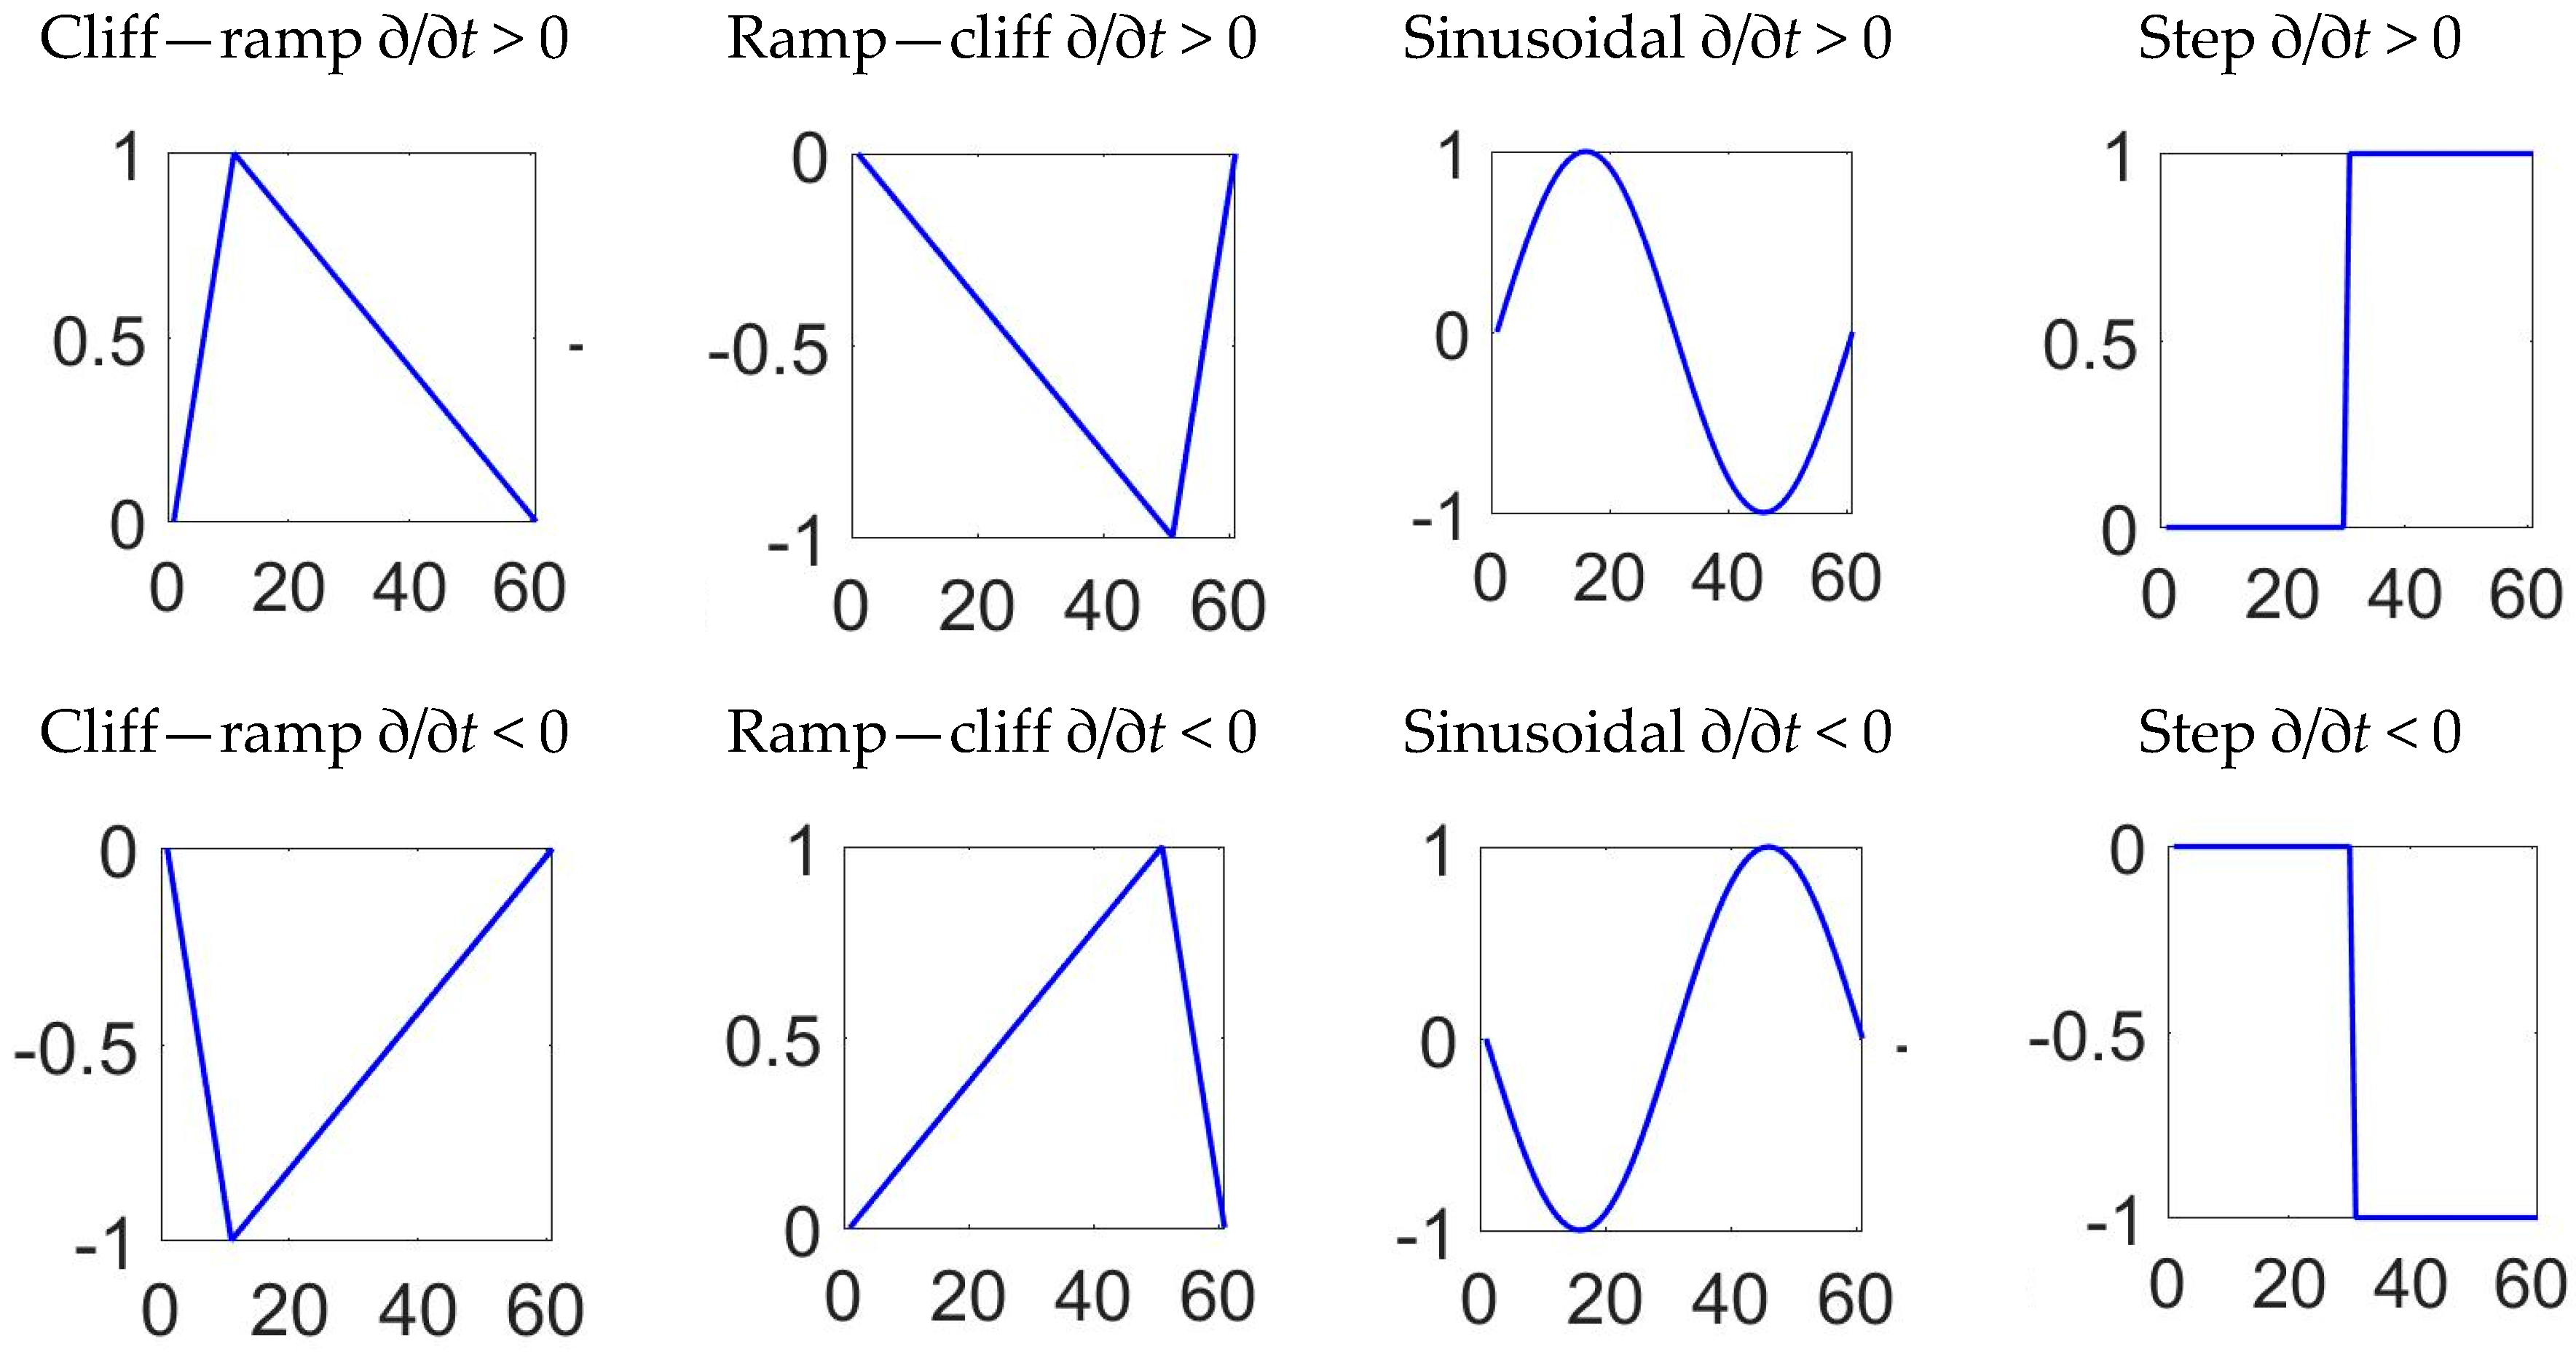
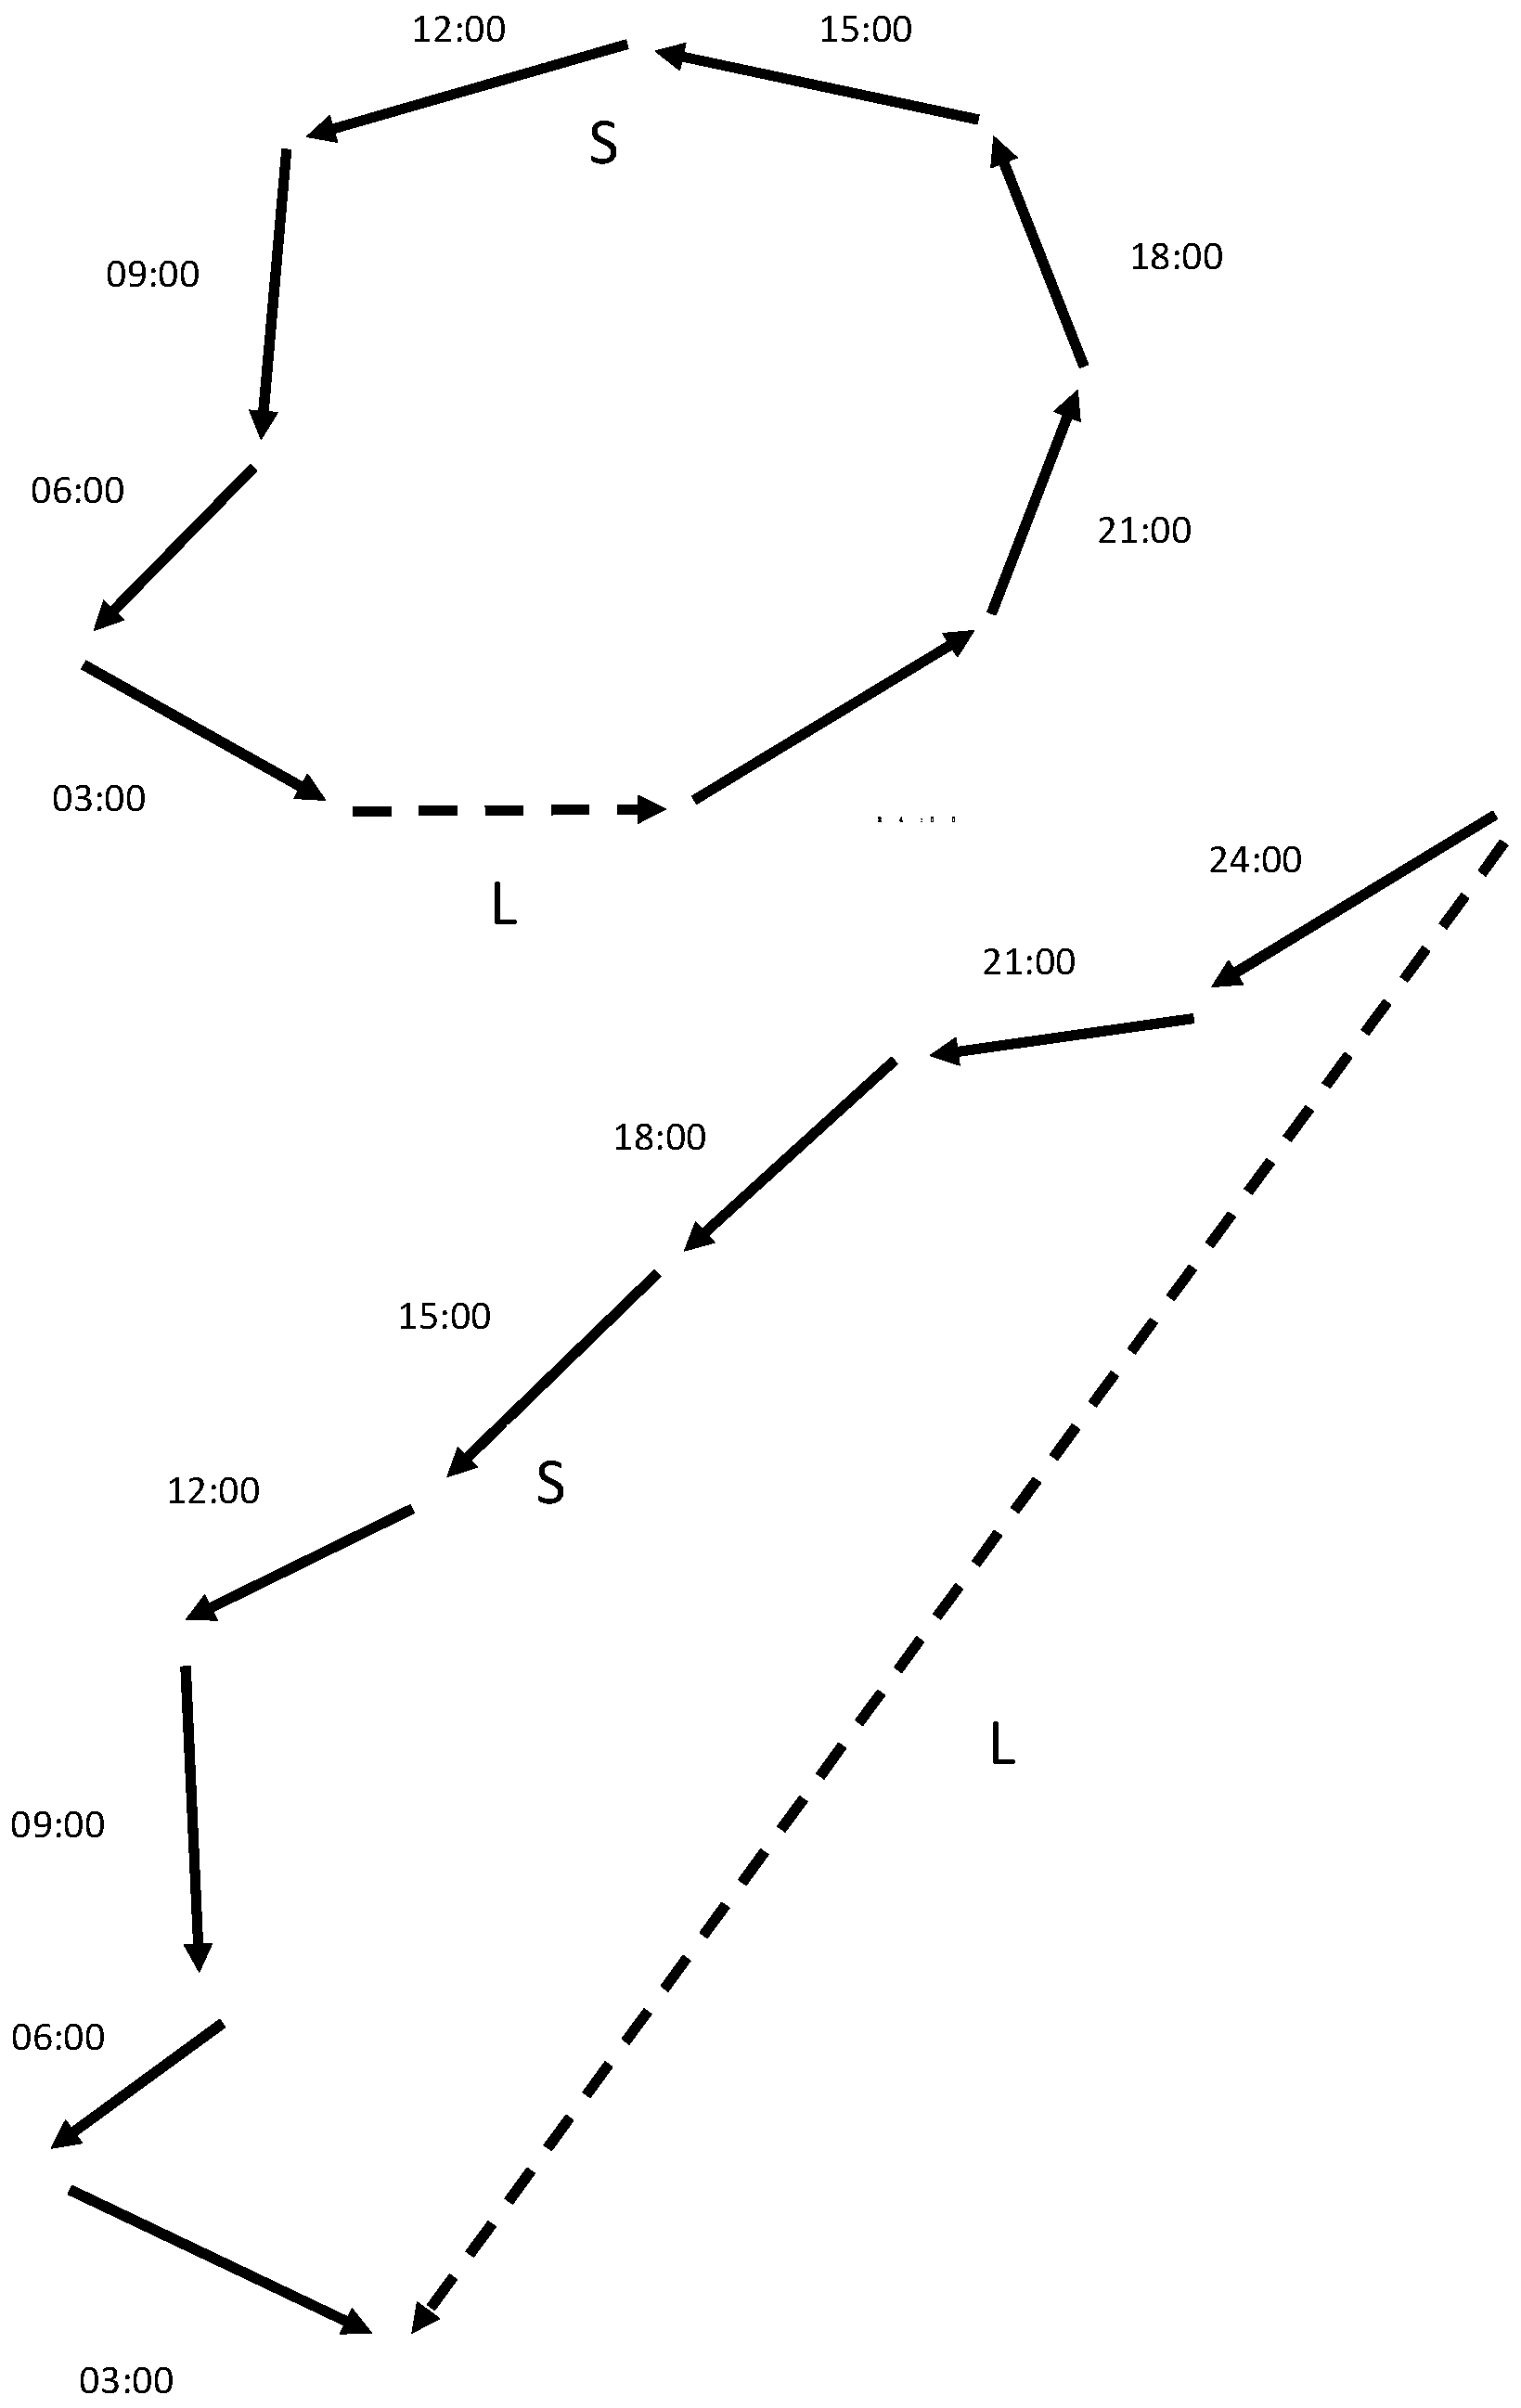
2.2. Geometric Structures

Geometric structures in temperature 1-min time series were identified following the methodology described in [20]. The basic steps of the methodology are as follows. (a) Four basic geometric shapes were chosen: (1) a ramp—cliff function (gradual rise in time series followed by a sudden drop); (2) a cliff—ramp function (or a reversed ramp—cliff: sudden rise followed by a gradual drop); (3) a step function; and (4) a simple sine function. Each shape can have two orientations: the shape can start with a positive or negative gradient (∂/∂t > 0 or ∂/∂t < 0 in Figure 2); (b) The resultant eight time series, each of 60 data points, move step-by-step through the temperature 1-min time series and every time the correlation coefficient is calculated. Parts which have a correlation coefficient >0.9 are selected and categorized under the specific structure; (c) The part of the time series that was just recognized as being part of the specific shape is deleted, and excluded from further analysis; (d) The procedure for the specific shape is completed after all parts with r > 0.9 have been selected; (e) The procedure begins for the next geometric shape. From this database, geometric structures with a well-defined range ΔT > 0.5 °C, well above the accuracy of the thermometer (0.1 + 0.005 T, where T is temperature [22]), have been selected and further processed.

2.3. Mesoscale Flows

The characteristics of the mesoscale flows and general meteorological conditions were studied using: (1) a Principal Component Analysis (PCA) for the determination of the dominant surface patterns; and (2) an analysis of Integral Quantities, which are used to characterize stagnation, recirculation and ventilation conditions [23].
With PCA, a dataset that contains many variables is reduced to a new dataset containing fewer new variables (Principal Components) that are linear combinations of the original variables, chosen to represent the maximum possible fraction of the variability contained in the original data. Thus, the given x 1 , x 2 , , x p variables, are combined with the following p linear combinations:
ξ ι = i = 1 p j = 1 p w i j x j
where ξ ι are the p Principal Components (PCs); w j 1 ,   w j 2 , w j n are the eigenvectors; and the jth eigenvalue is the variance of the jth PC. The parameter w is the PC loading, while ξ is the PC score. An extra operation usually performed during PCA is the rotation of the axes: the m first PCs are rotated (transformed) within their subspace, and the m rotated components are used. PCA was successfully employed to categorize the mesoscale flows in this particular location [8]. In the present study, PCA was applied to a dataset of 1 min measurements of atmospheric pressure (P, hPa), temperature (T, °C), relative humidity (RH, %), solar radiation (SR, Wm−2), the absolute values of the mean prevailing wind velocity components of WNW–ESE and SSW–NNE directions (perpendicular and parallel to Hymettus mountain, u and v, respectively, ms−1), standard deviations of the wind direction (WDsd, degrees), and wind speed (WSsd, ms−1), measured at 10 m above ground level (agl) and wind shear between 5 m and 10 m (ms−1). The original data were transformed according to the Box and Cox method [24].
In [23], a method was proposed for the objective measure of air mass stagnation, recirculation and ventilation, based on single station integral measures of wind data. The method was based on the north–south (vi) and east–west (ui) components of the wind speed. At each time step ti, “resultant transport distance” (L), “wind run” (S) and “recirculation factor” (R) are defined as L i = T [ ( j = i i τ / T + 1 u j ) 2 + ( j = i i τ / T + 1 v j ) 2 ] 1 2 , S i = T j = i i τ / T + 1 | V j | = T j = i i τ / T + 1 ( u j 2 + v j 2 ) 1 2 and R i = 1 S i L i , respectively. T is the averaging interval in hours (say, 1 h) and τ is the wind run time for integration (e.g., 24 h). In the present study and following [25], L, S and R values are looking backward in time, whereas, in [23], they were looking forward. T = 24 will be used hereafter. Figure 3 illustrates S and L for the cases of high and low recirculation (high and low R, respectively), based on hypothetical values (measurements every 2 h in this case). Generally speaking, Si is employed in order to characterize the wind field in terms of intensity, and Ri the recirculation. In [23], critical values of Si and Ri are proposed for the characterization of the flow: for Si < 120 km, the site is prone to stagnation; for Ri > 0.6, the site is prone to recirculation; and, for Ri < 0.2 and Si > 250 km, the site is prone to ventilation.

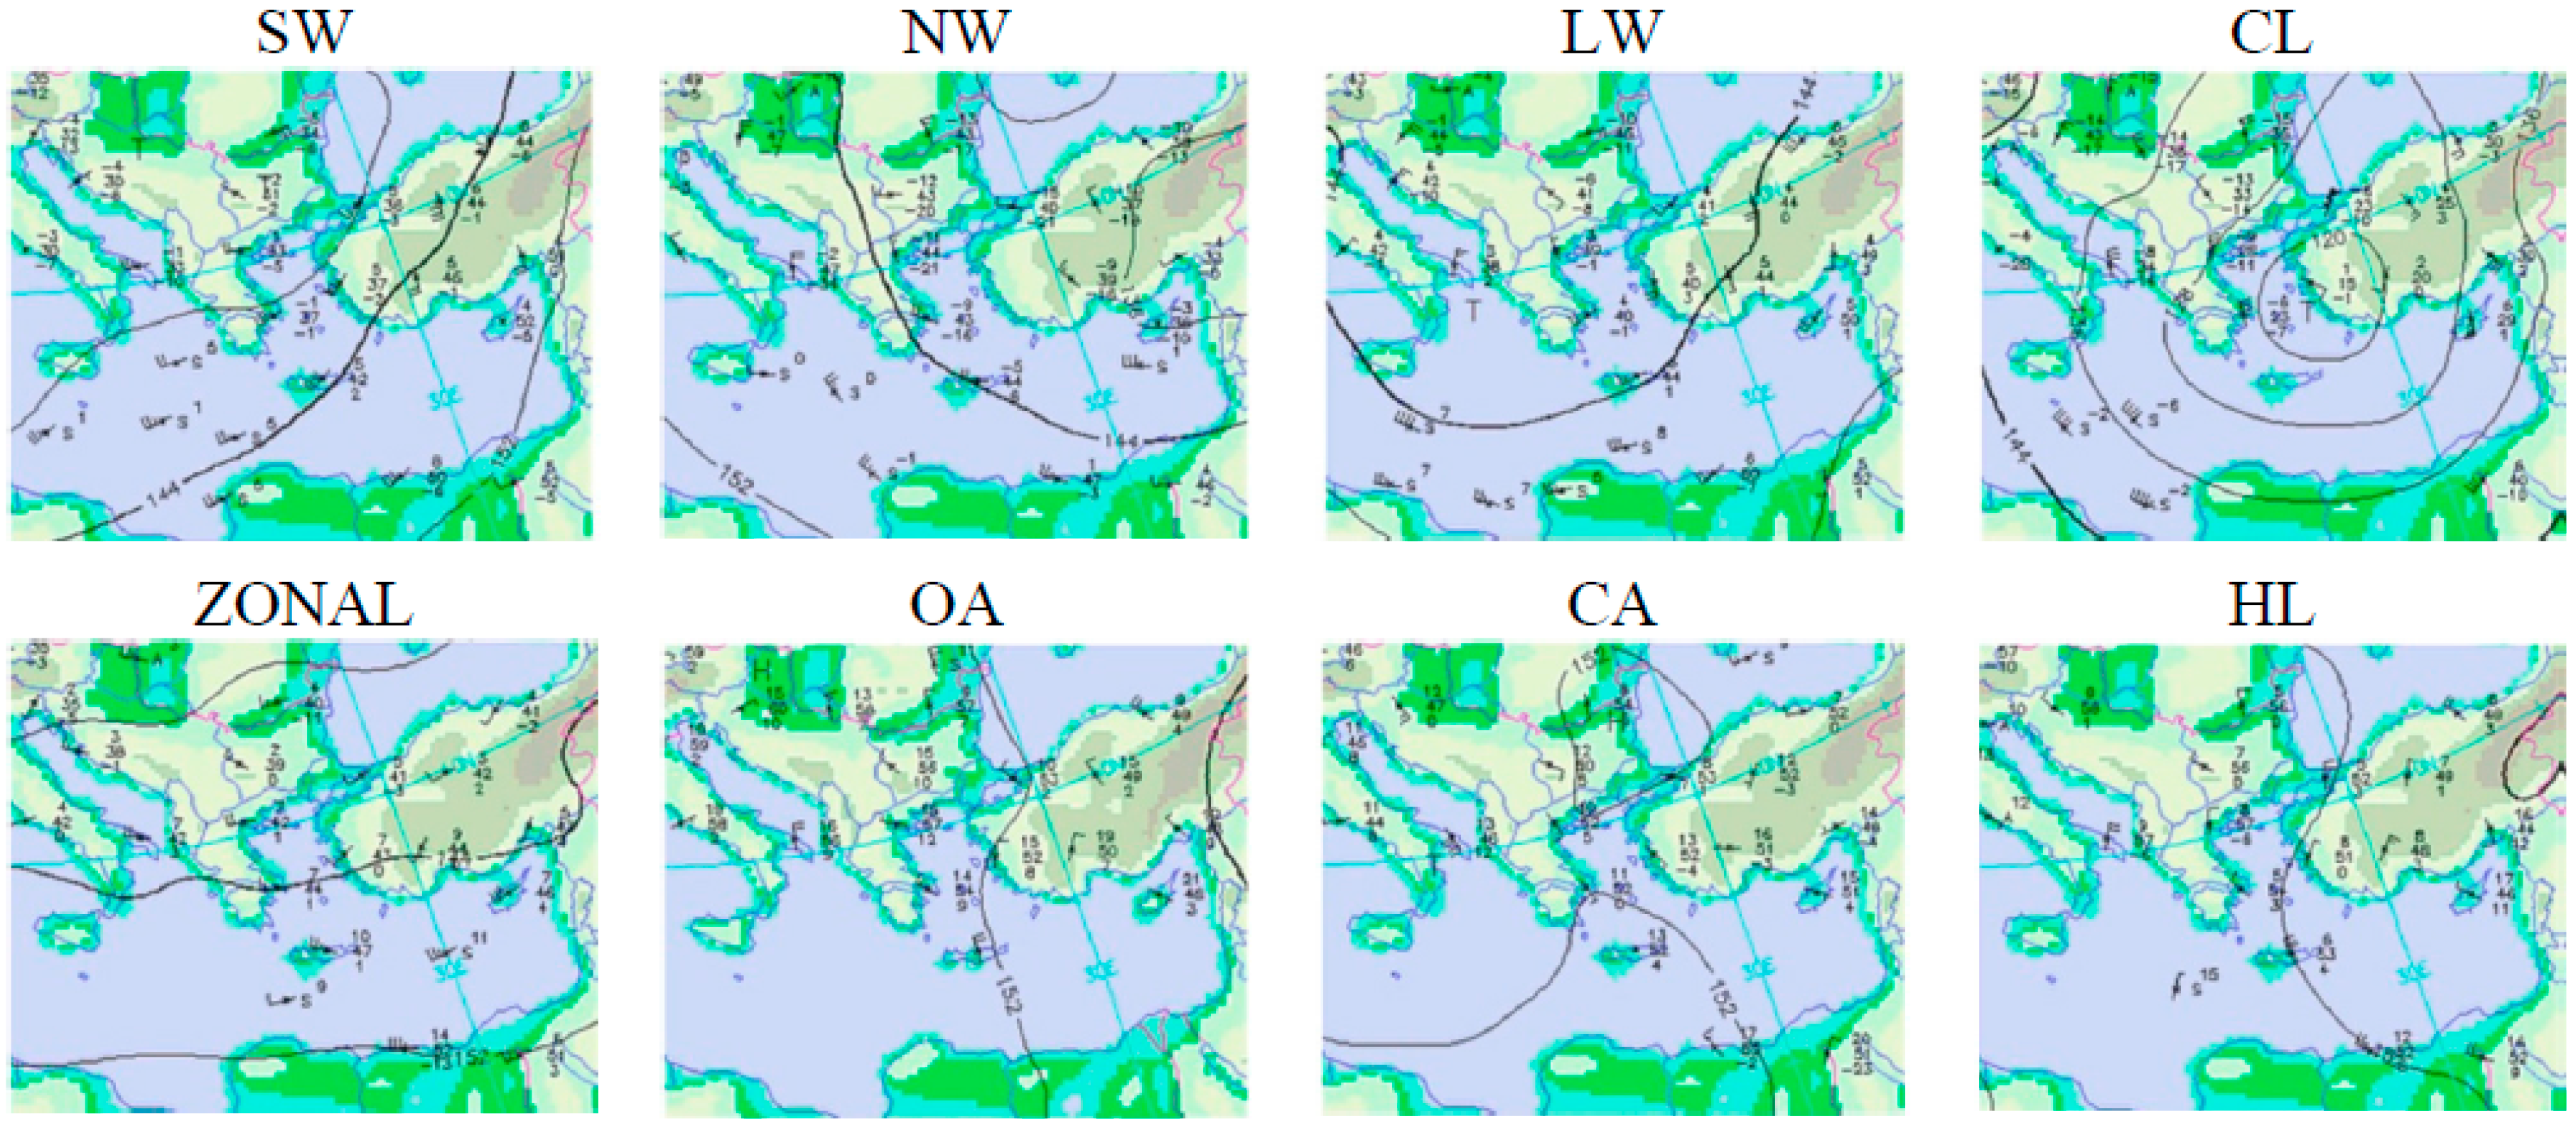
2.4. Classification of the Synoptic Scale Circulation

A day-by-day analysis of the synoptic scale circulation during the experimental period was applied following the scheme described by [8] and automated by [26]: the synoptic scale circulation that prevails over GAA are divided into eight statistically-distinct categories, based on the distribution of the geopotential height, at either the 850 or 700 hPa isobaric levels, and the flow direction. Each category presents a definite pattern concerning the position and orientation of synoptic systems and the resulting synoptic scale flow. The same scheme has been used in previous studies related to GAA to examine various environmental issues [3,6,27]. The eight categories are as follows. (1) Southwesterly flow (SW): The downstream part of a trough is observed over the GAA, resulting in southwesterly flow, being accompanied by advection of warm and moist air masses from Africa; (2) Northwesterly flow (NW): When the trough has passed, a strong northwesterly flow is established over GAA causing strong cold air advection; (3) Long-wave Trough (LW): A long-wave trough prevails over Greece with its axis being positioned over GAA. This category is mainly characterized by precipitation; (4) Closed Low (CL): A closed low forms over the GAA, resulting in intense winds, usually from the northern sector, and precipitation; (5) Zonal Flow (ZONAL): A westerly flow is established over the GAA, with substantially lower intensity in the warm period of the year; (6) Open Anticyclone (OA): A large scale anticyclone prevails over Greece related with weak variable winds, favoring the development of local flows over GAA; (7) Closed Anti-cyclone (CA): A closed anticyclone extends over the GAA with similar characteristics to the previous one, but causes weaker winds or calm conditions over the GAA; (8) High–Low Category (H–L): This is characterized by the presence of a low (or a trough) and an anticyclone (or a ridge) over Greece resulting in rather complicated regimes over the GAA. During summer, this category forms strong northeasterlies (the well known “Etesians”) that blow over the Aegean (Figure 4).

3. Results

The general characteristics of the mesoscale surface variability and synoptic scale circulations at this site were examined in [8]. In the following, the general hourly features are briefly reviewed and then links between the synoptic scale circulations and mesoscale features (surface variability, flows and geometric structures) are examined.

3.1. General Features

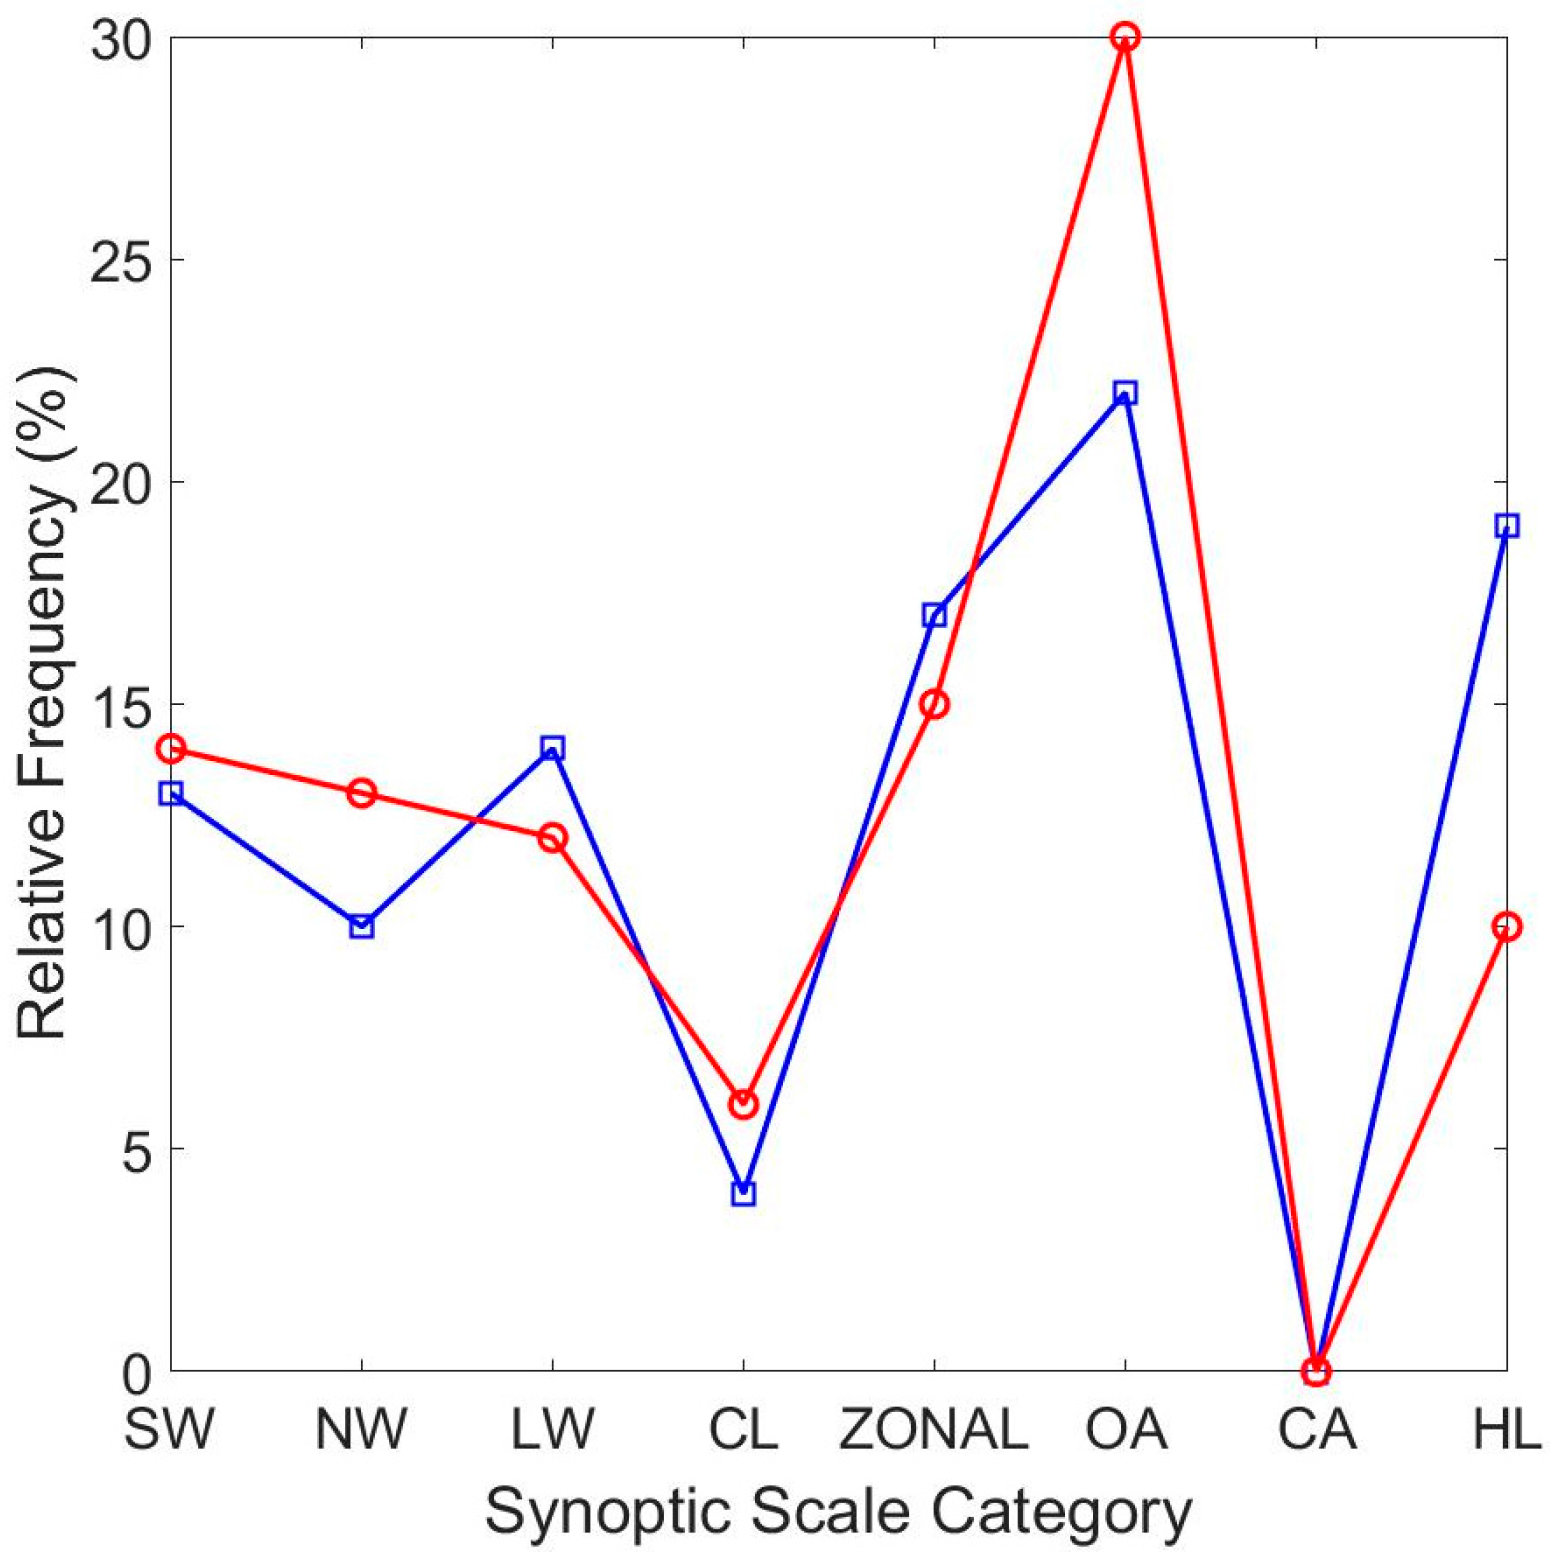
3.1.1. Synoptic Scale Circulation

The frequency of each synoptic category during the examined period is presented in Table 1 and was compared statistically with the corresponding frequency during the long-term period 1983–2015 to investigate if the experimental period is typical with respect to the synoptic scale circulation over Athens. For this purpose, a z test was used at a significance level a = 0.05 (Table 1). It was found that only CL and OA are characterized by lower frequency during the experimental period.

3.1.2. Surface Variability

Three PCs with eigenvalues higher than 1 account for 77.4% of the total variance and were rotated with varimax Rotation and are interpreted according to the values of the respective loadings (Table 2). PC2 contrasts temperature and solar radiation to humidity, whilst the other two PCs are related with the along (v) and across (u) axis mountain components of the wind (PC1 and PC3, respectively). PC1, related to the along-mountain wind component, is also highly correlated with intense changes in the wind speed and shear, and therefore is related with mechanically generated turbulence. PC3 is related mainly with the across-axis mountain component of the wind.

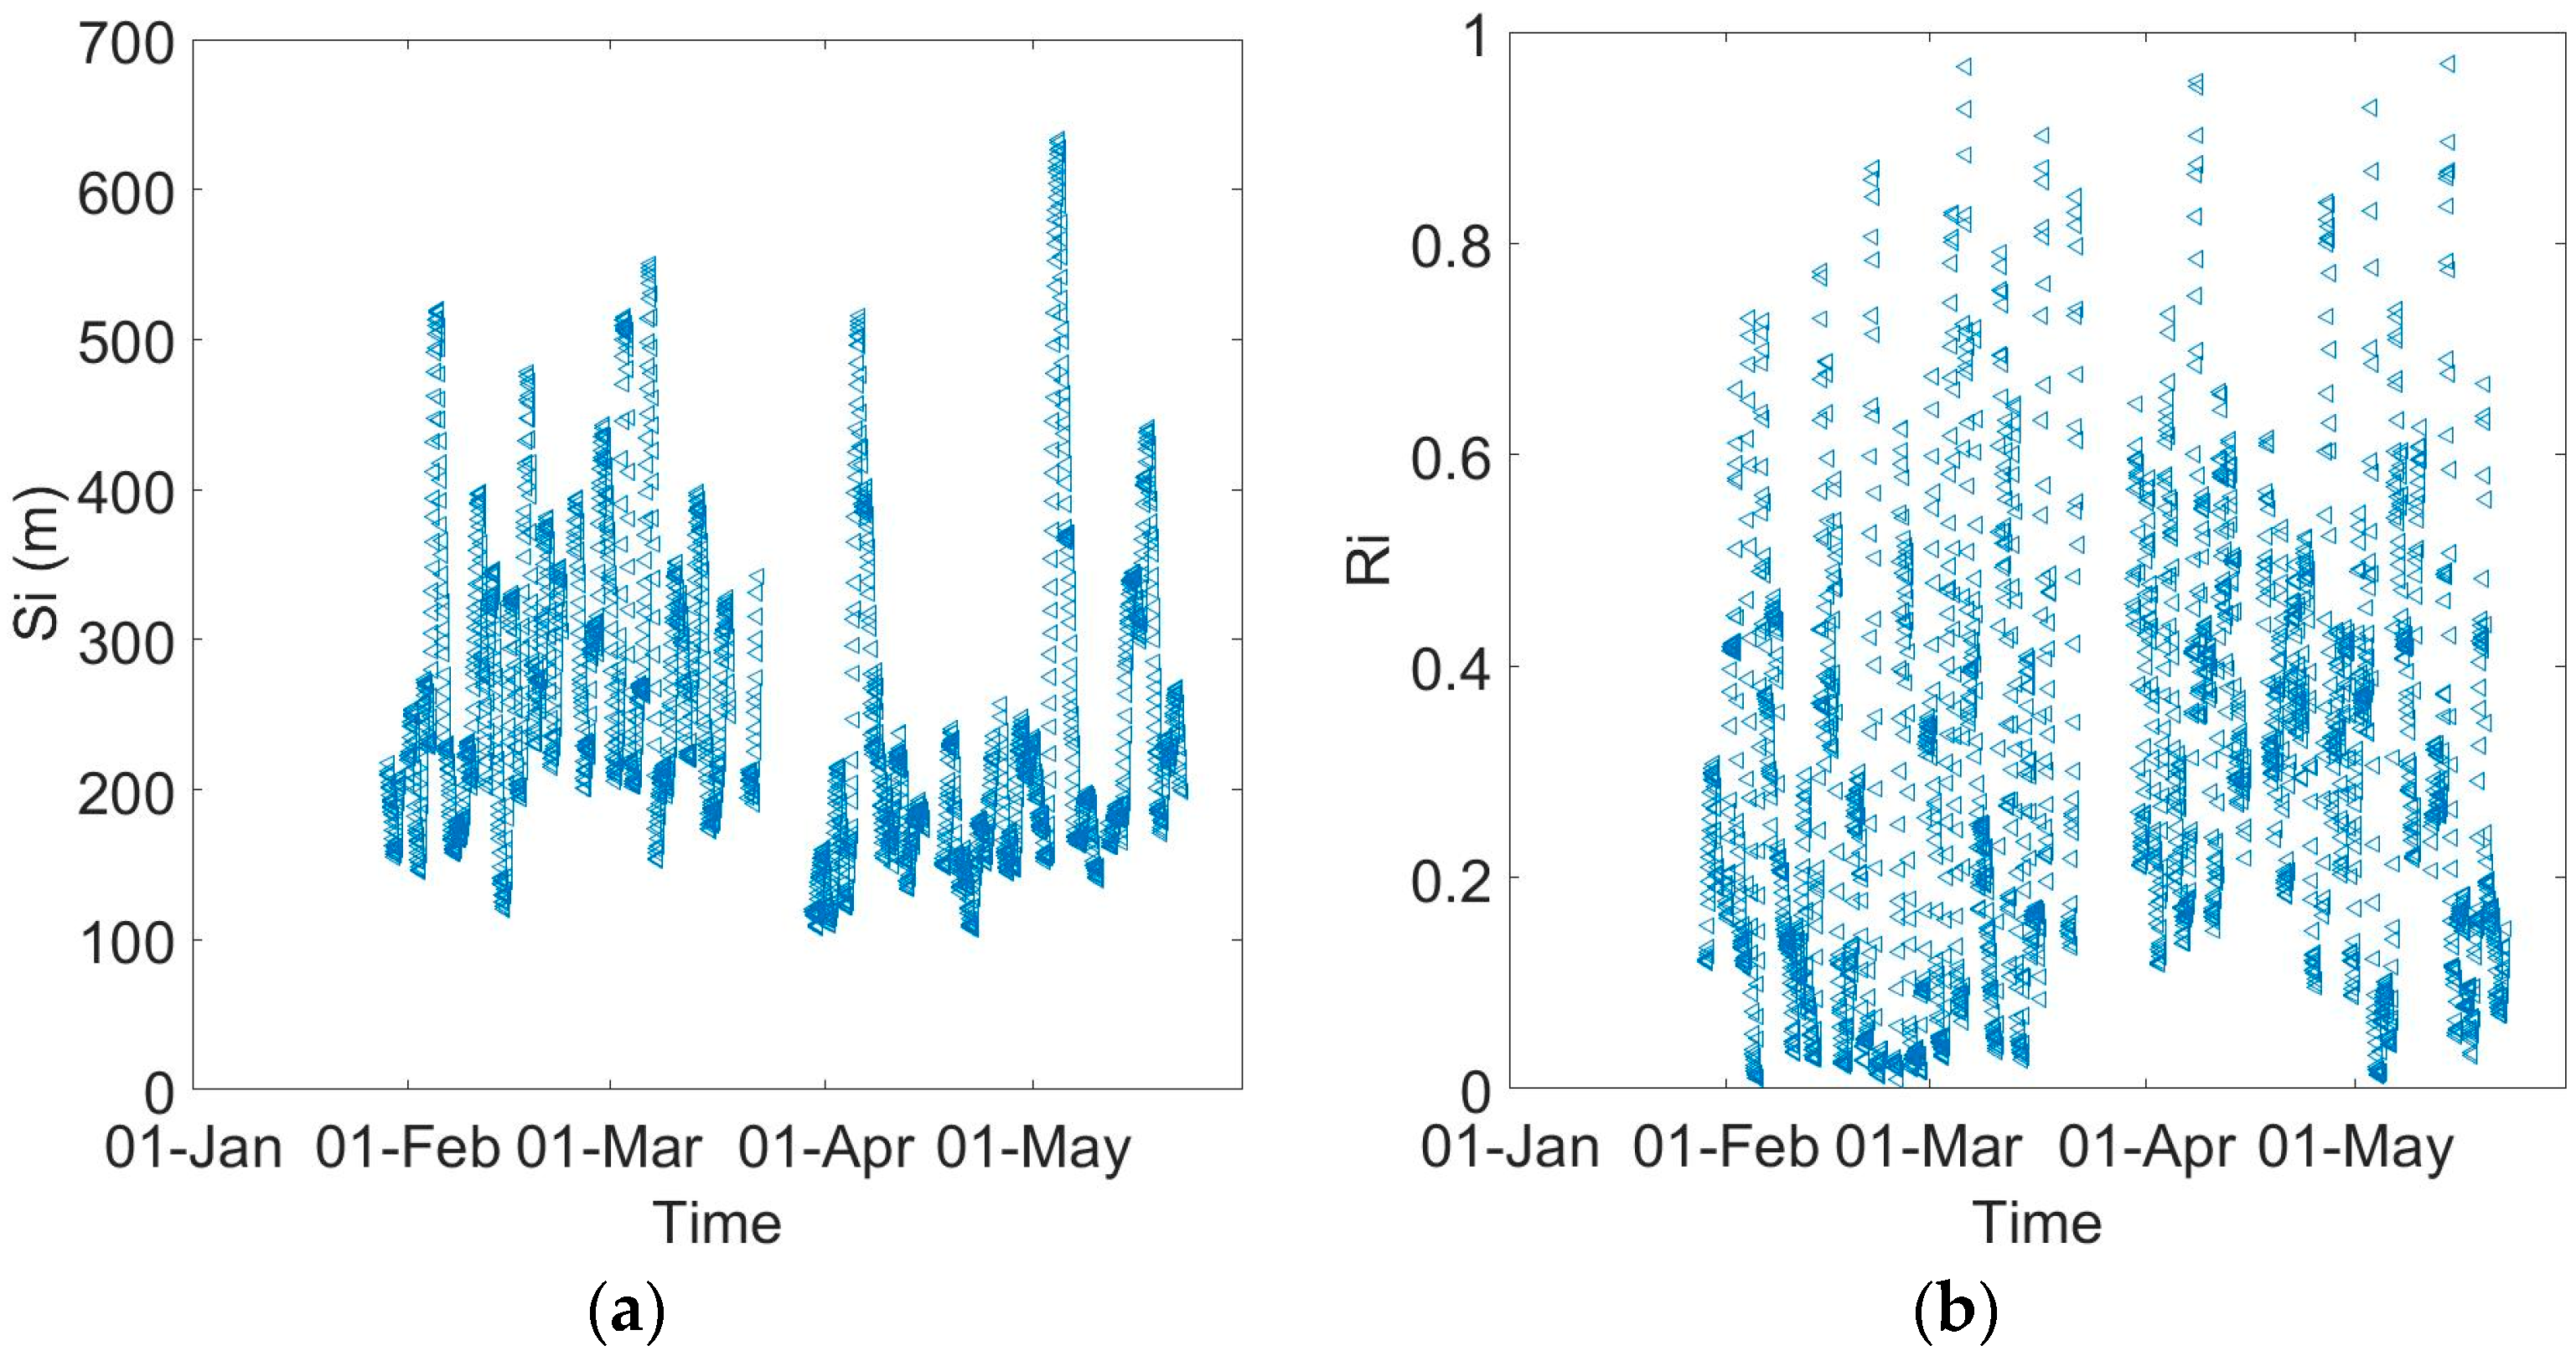
3.1.3. Mesoscale Circulation

Results from the two main Integral Quantities (wind run (Si) and recirculation factor (Ri)) are shown in Figure 5. Minimum and maximum values are 107 m and 633 m, and 0.01 and 0.97 for Si and Ri, respectively. Mean values were S i ¯ = 251   m and R i ¯ = 0.30 . Si distribution was rather skewed (25th, 50th and 75th percentiles of 178   m ,   223   m and 308 m , respectively). In [21], it was found that based on the values proposed by [20], 25% of the cases were categorized as ventilation conditions, 7% as recirculation conditions and 3% as stagnant conditions; the remaining 65% are categorized as intermediate conditions.

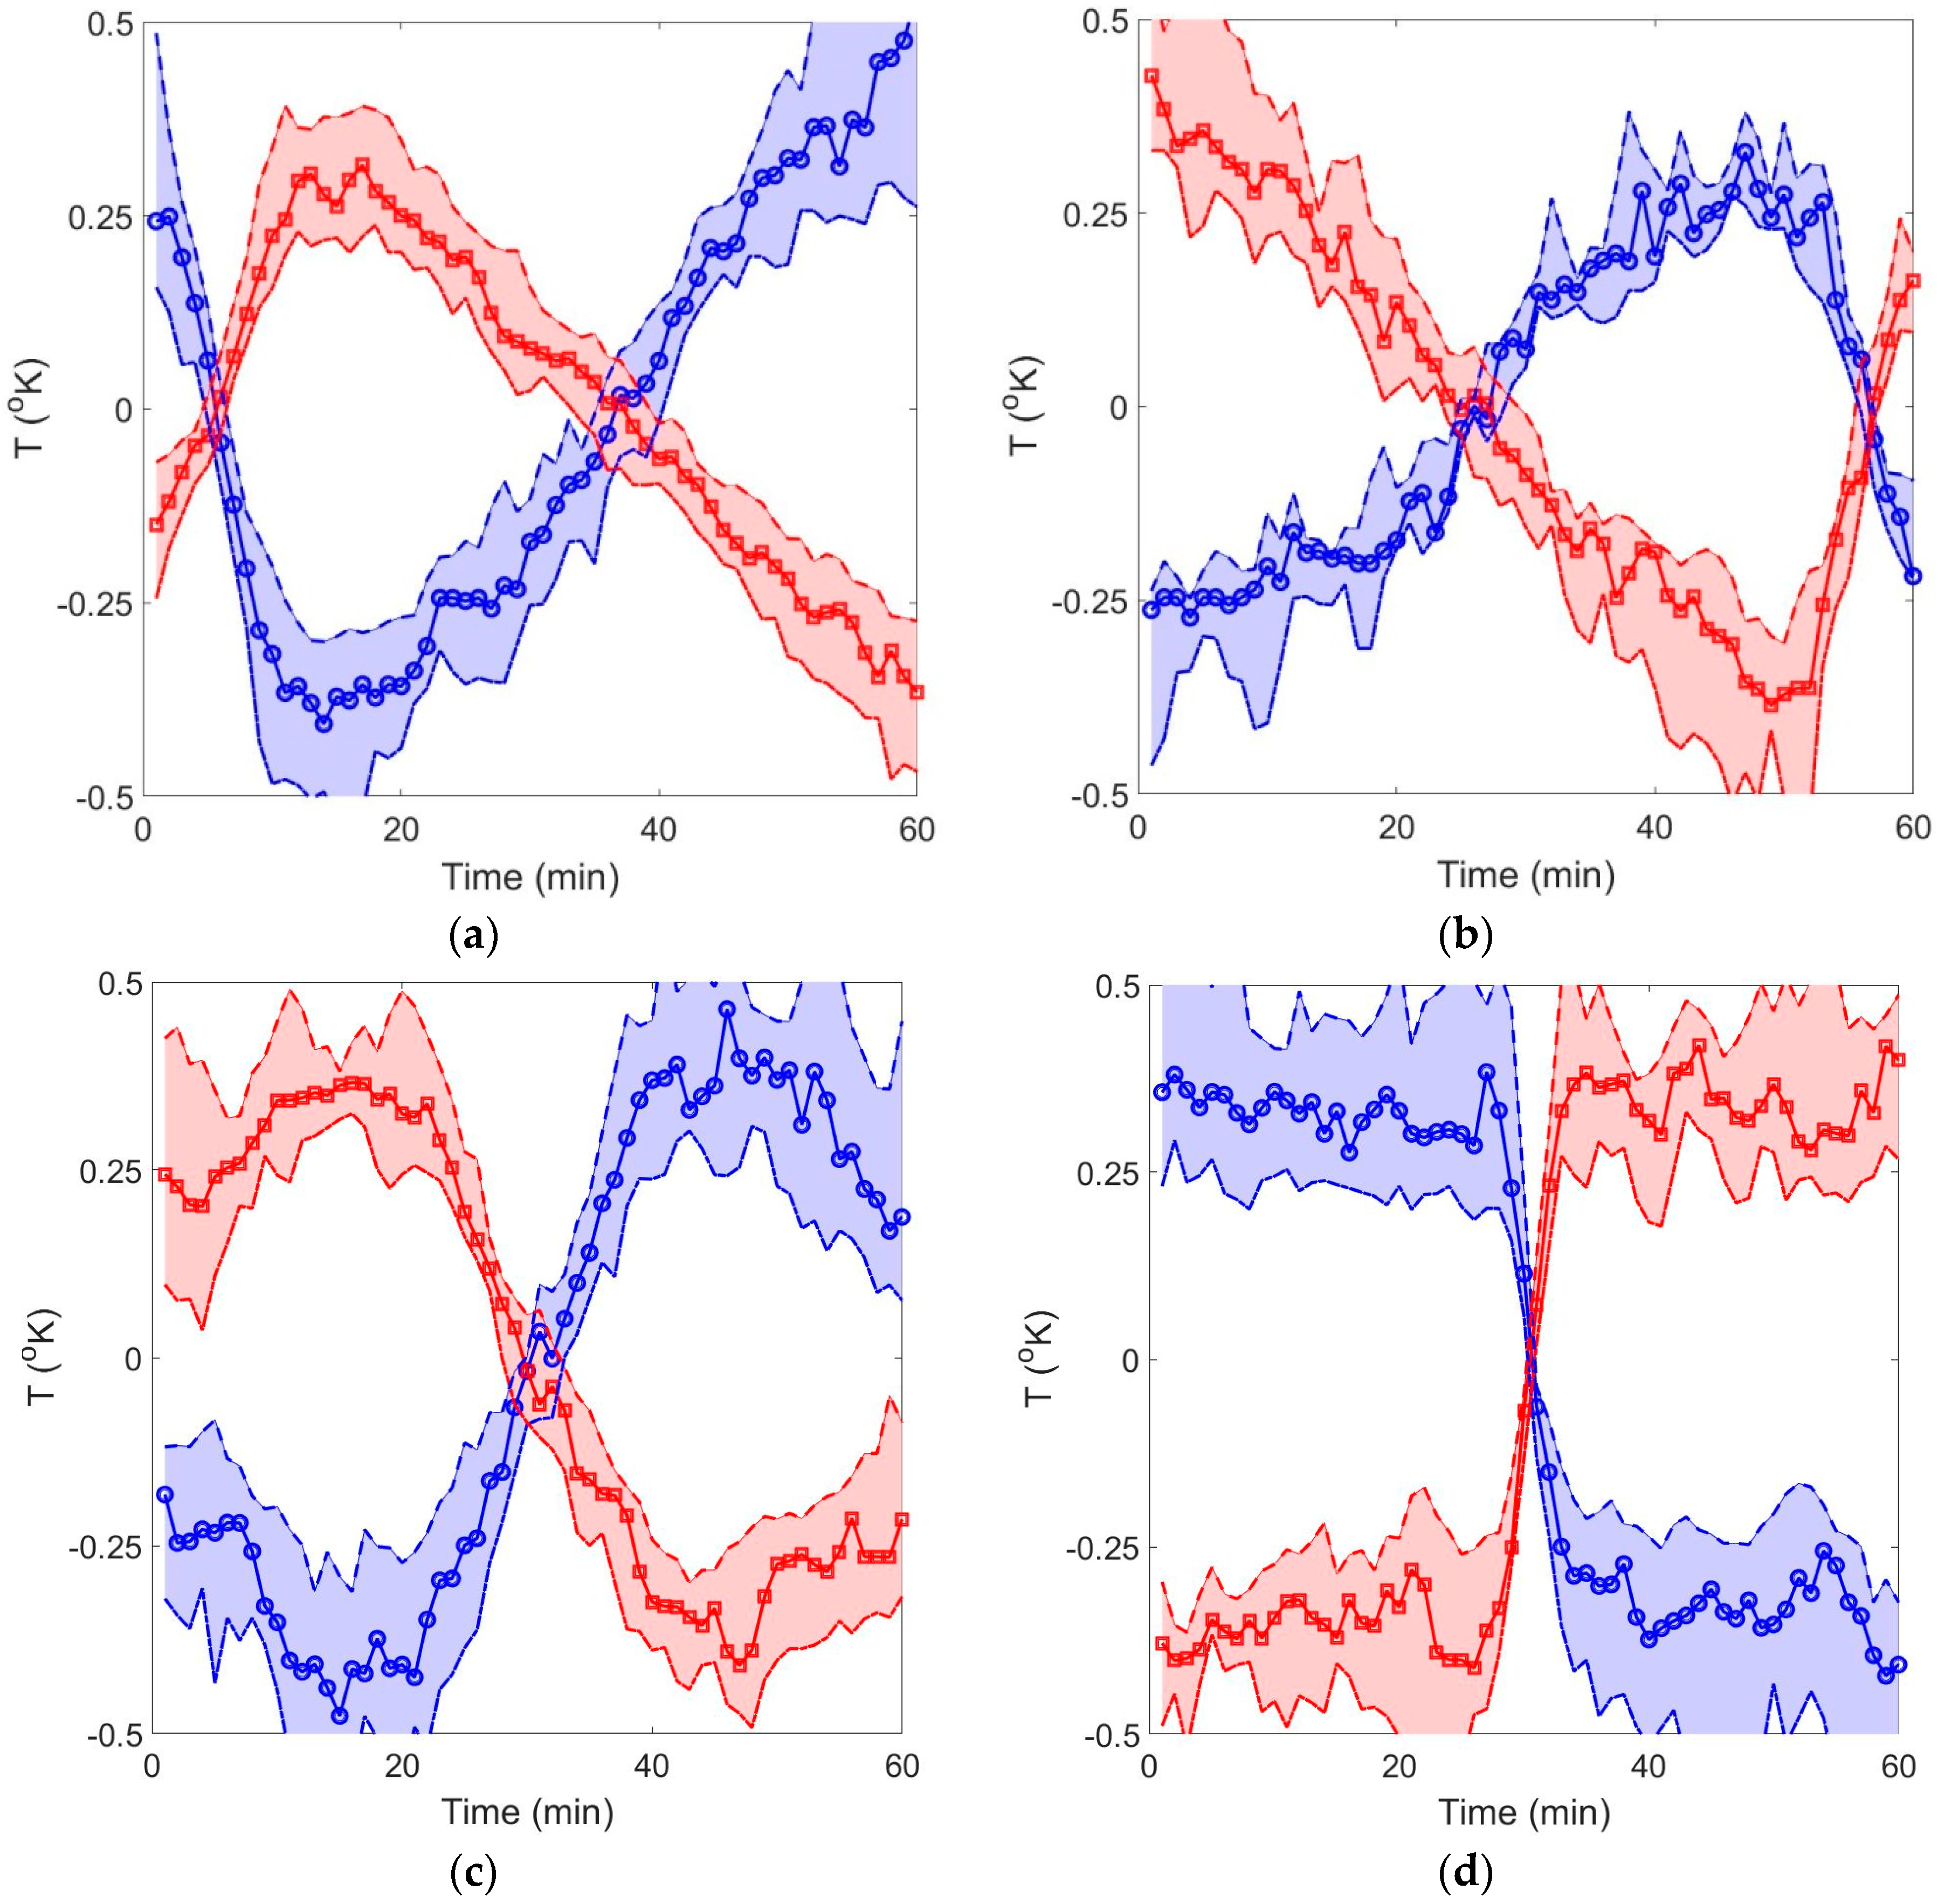
3.1.4. Geometric Structures

Structures with a range >0.5 °C have been considered, thus, out of a total of 174 structures identified, 32 were excluded. From the remaining 142 structures, 61 were identified as cliff—ramp (38 positive and 23 negative), 16 as ramp—cliff (11 positive and 5 negative), 34 as sinusoidal (16 positive and 18 negative) and 31 as step shapes (11 positive and 20 negative). The composite temporal evolution of the identified geometric structures across 1 h time interval is presented in Figure 6, as temperature fluctuations from the mean hourly temperature. It is evident that these well-defined geometric structures show a fairly wide hourly range, close in many cases to 1 °C.

3.2. Links between large-Scale Circulation, Mesoscale Surface Patterns and Geometric Structures

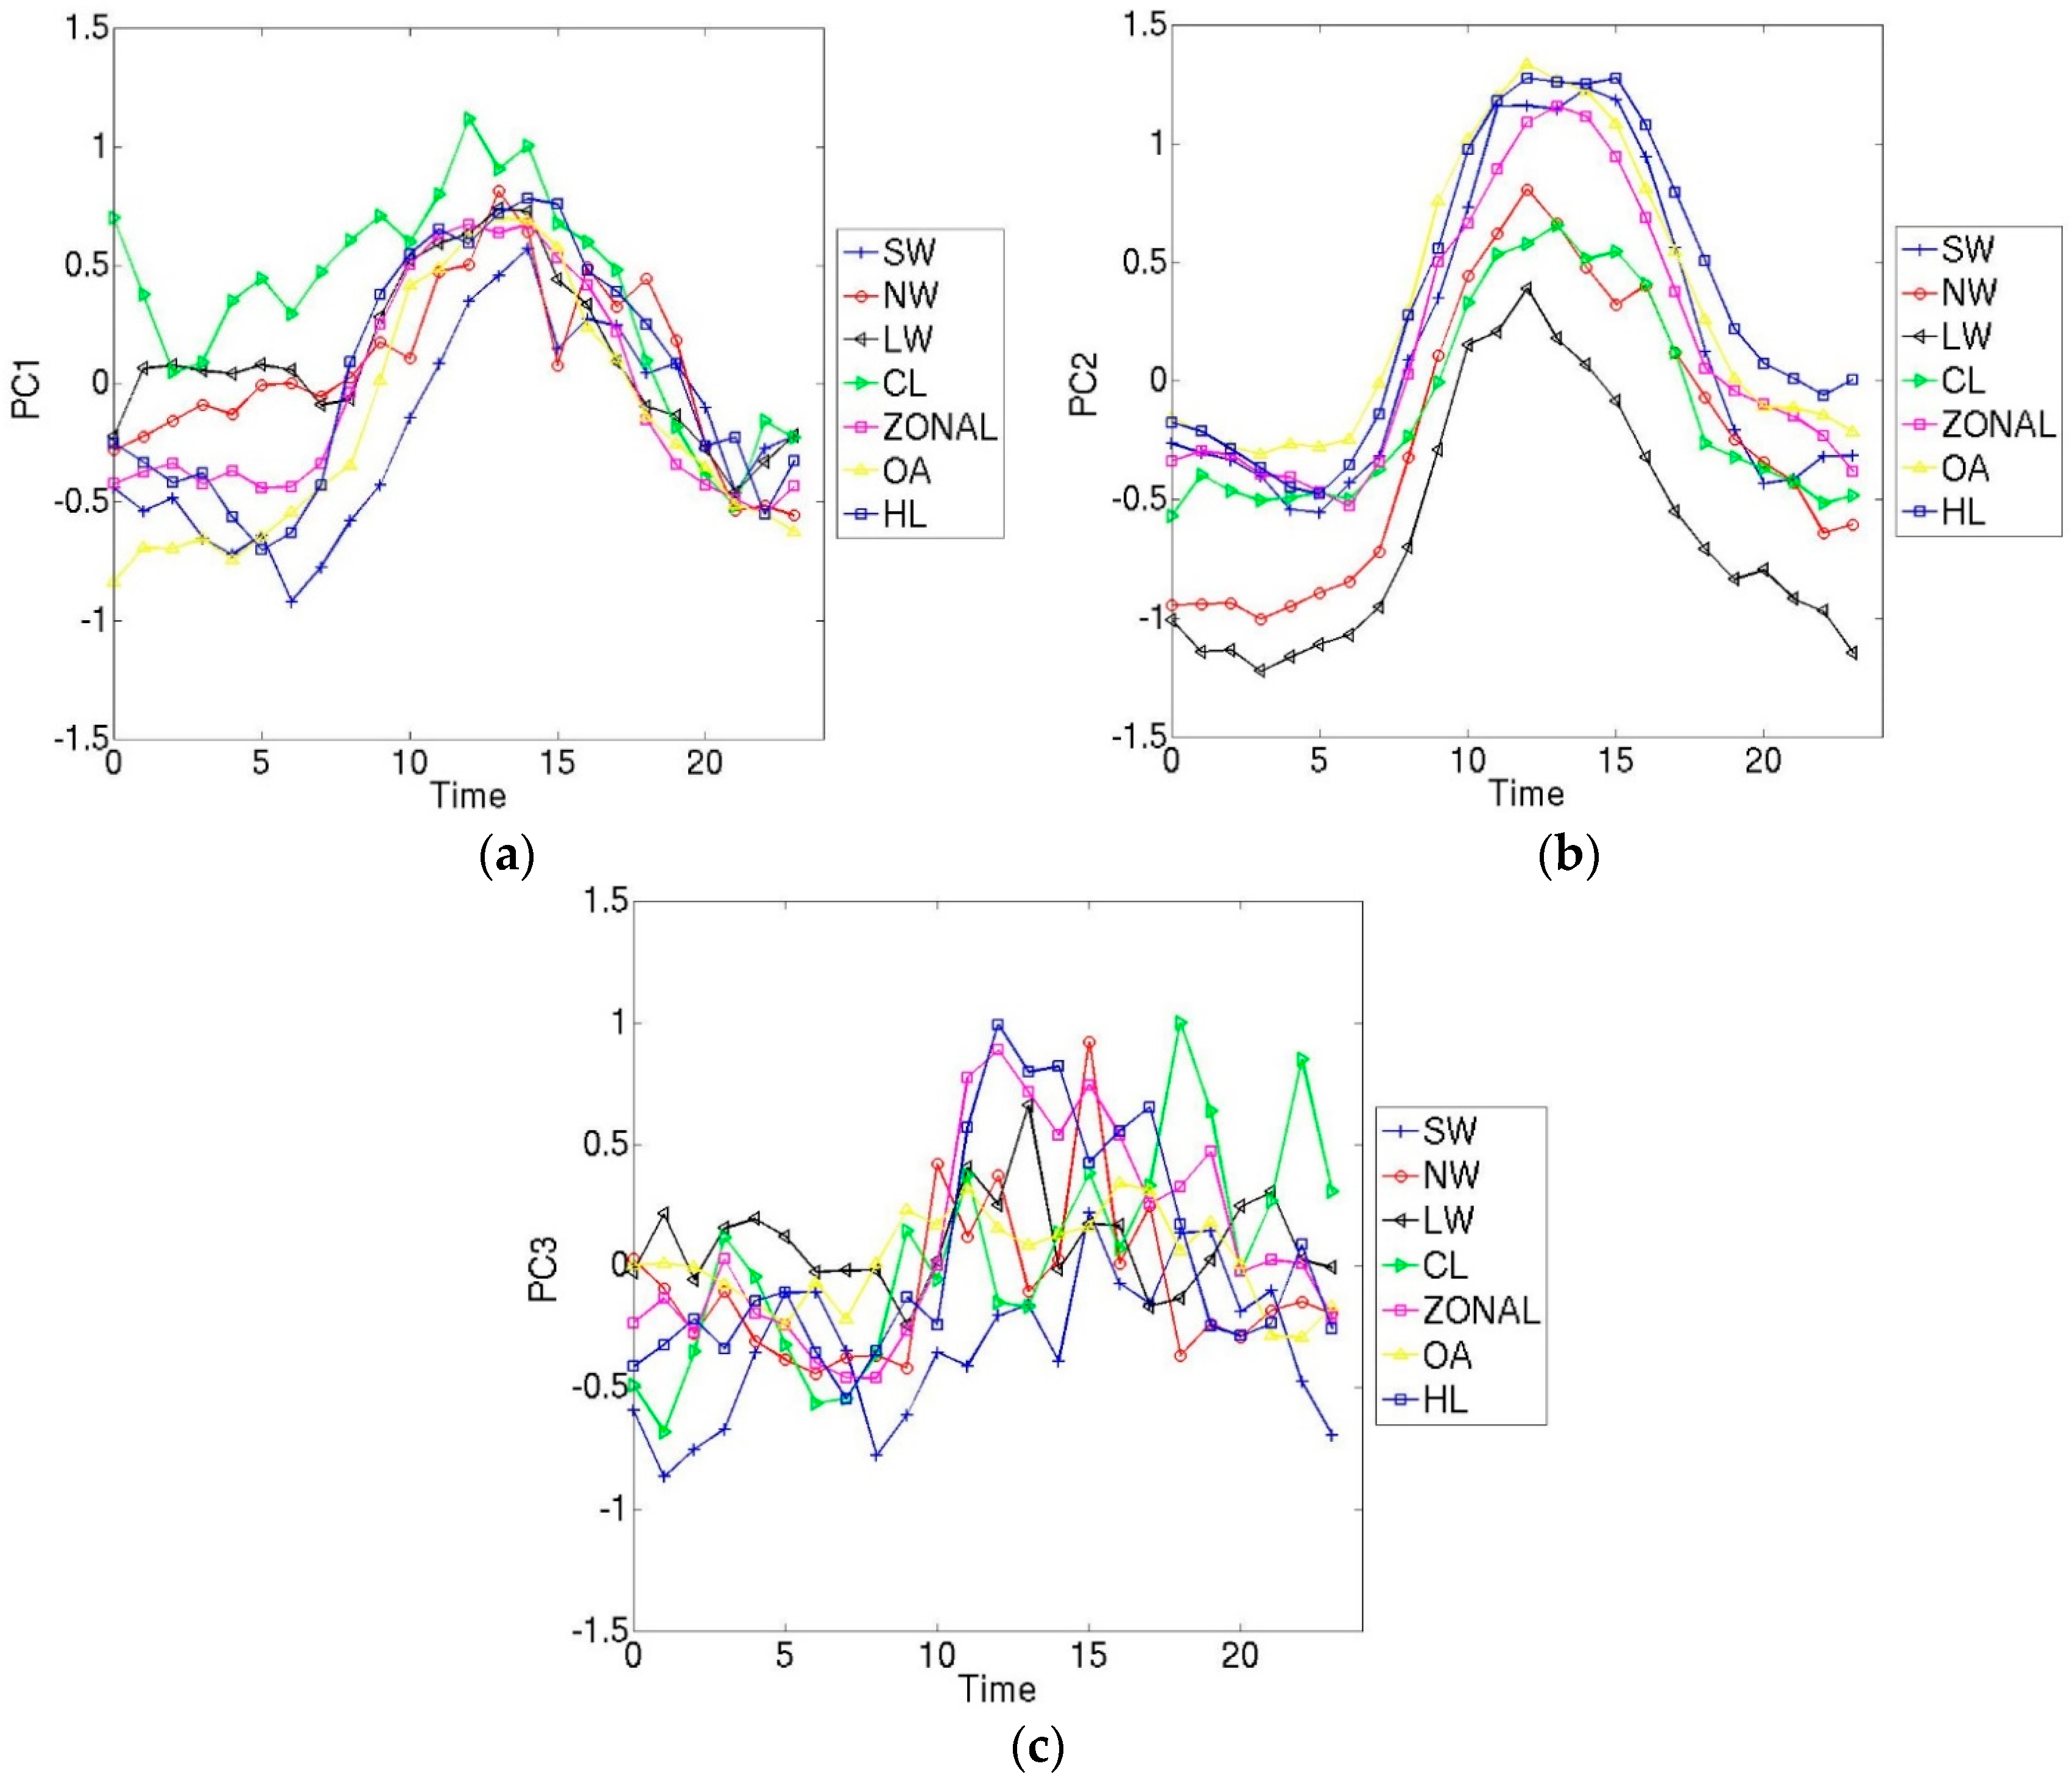
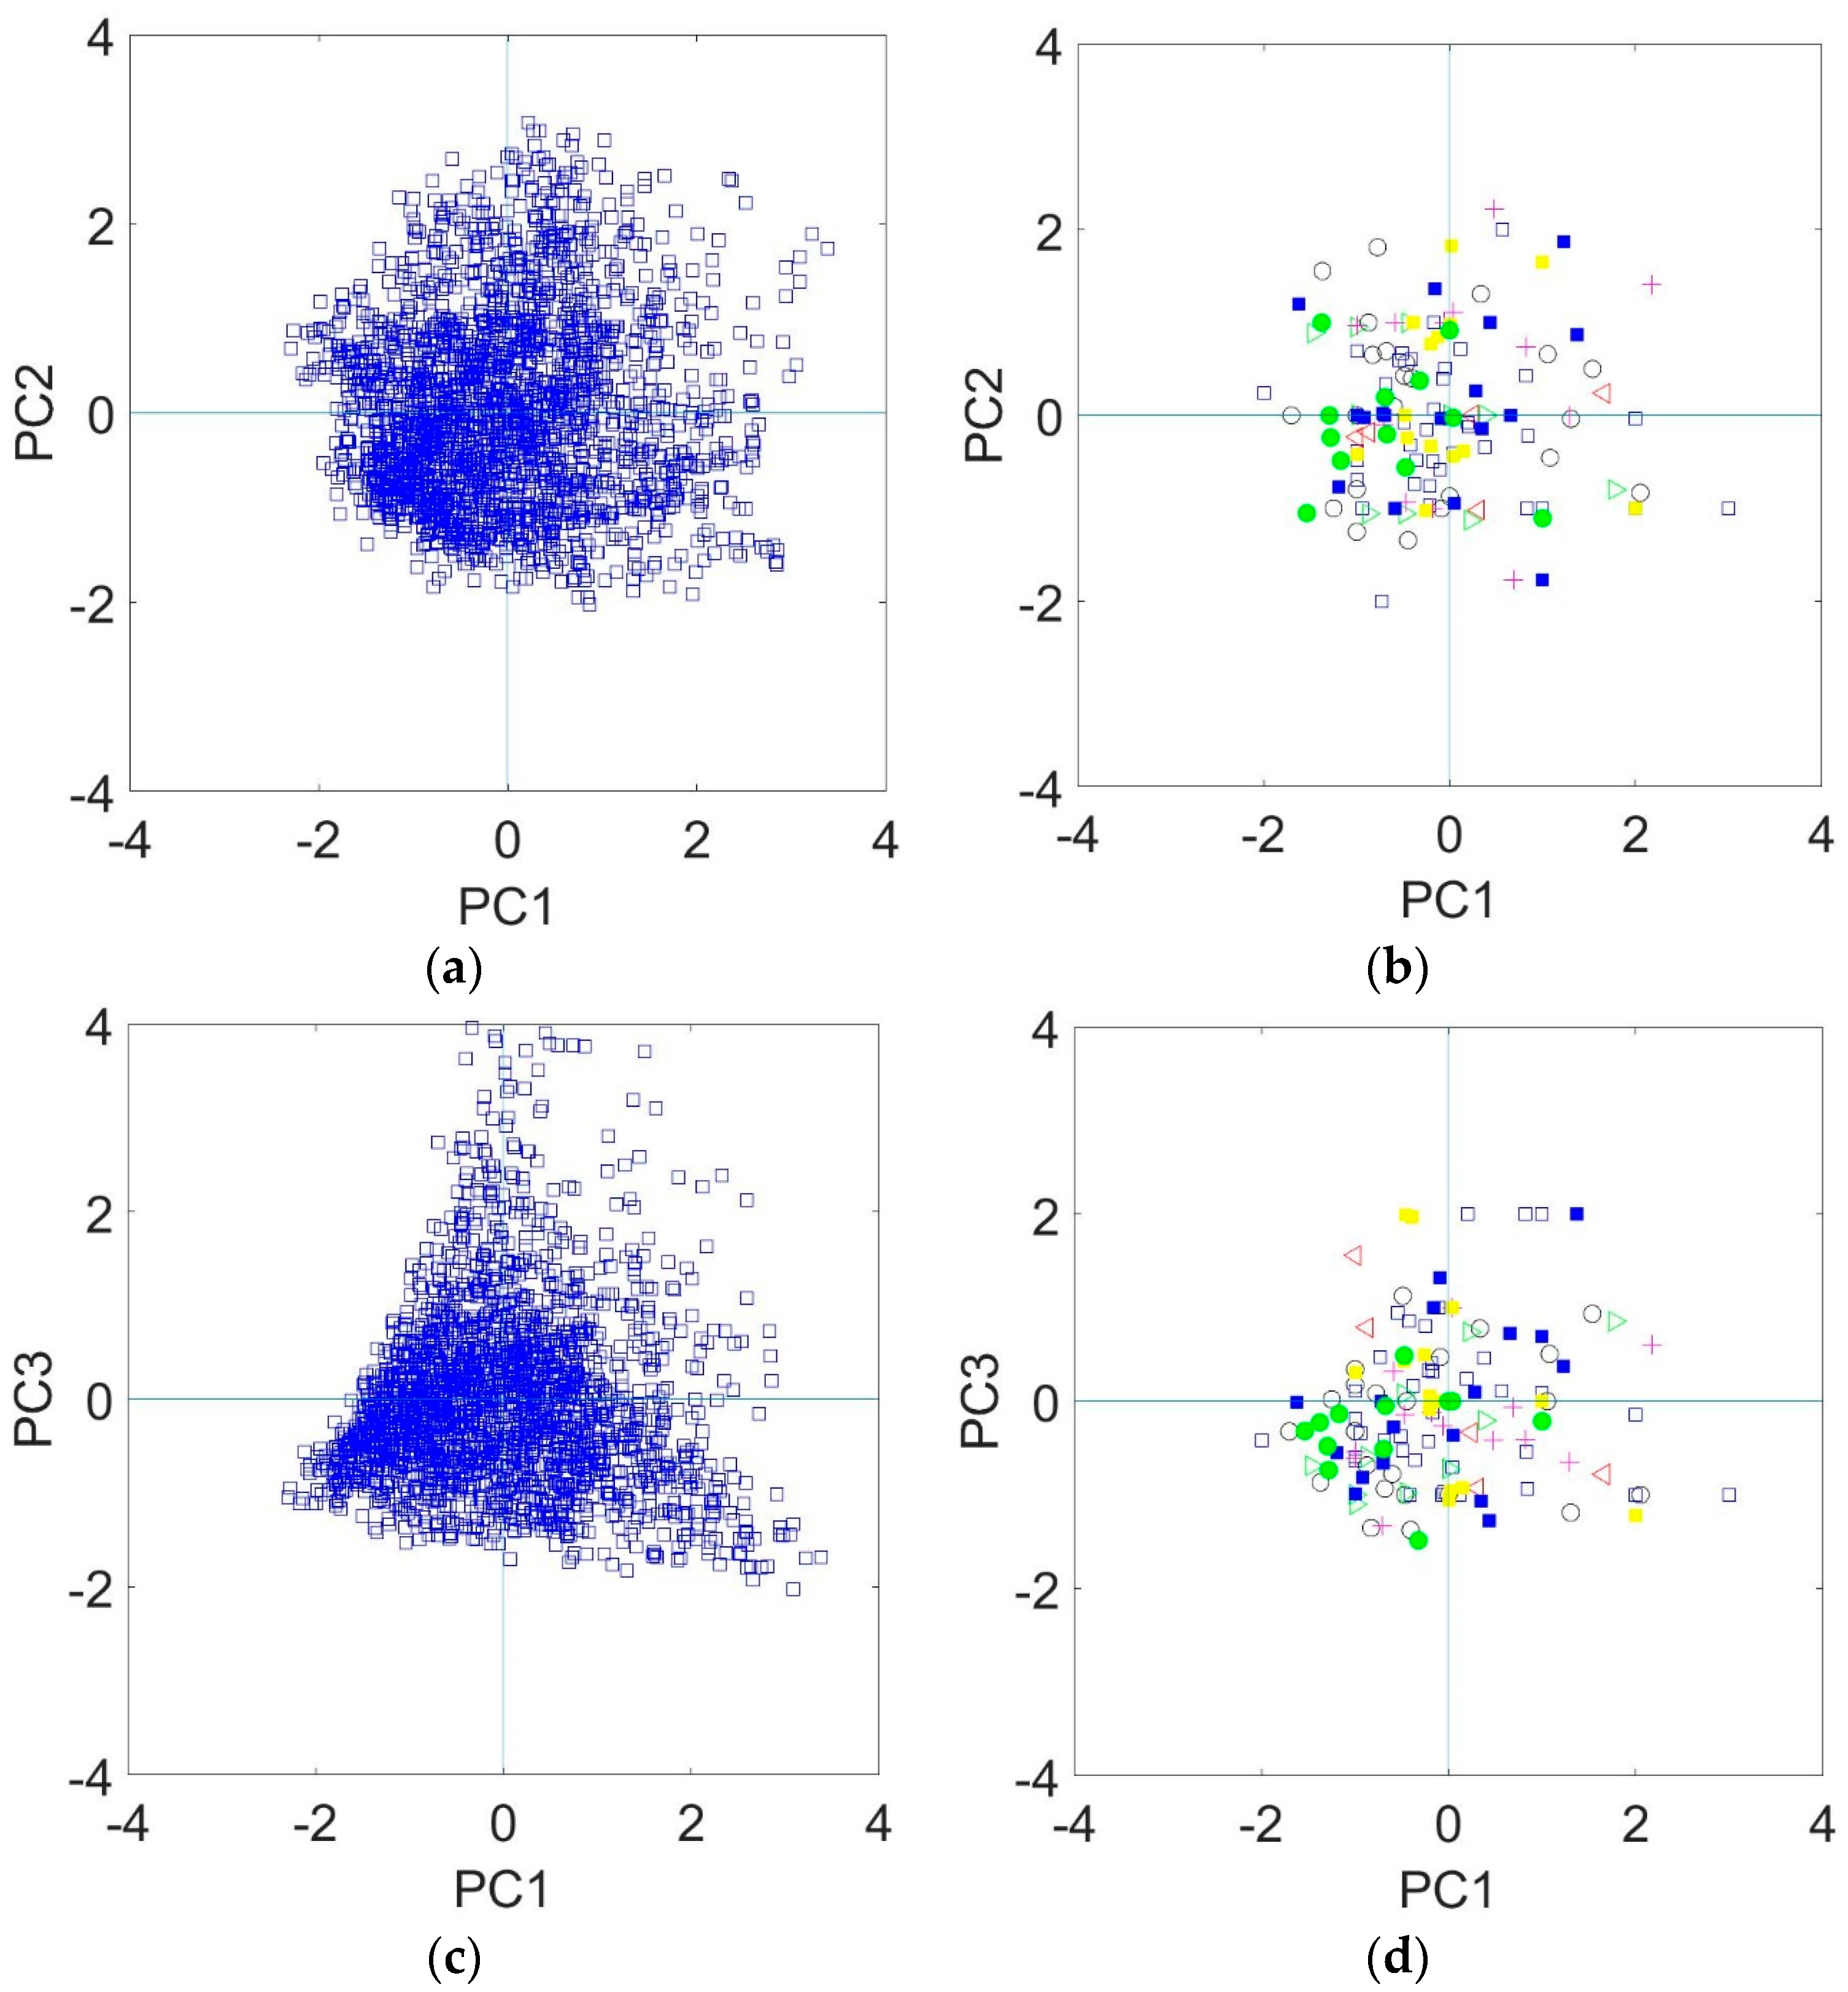
3.2.1. Large-Scale Circulation and Mesoscale Surface Variability

PC1, which is related with the along-mountain wind component, shows a clear diurnal signal with high values during midday and low values during nighttime (Figure 7a) for all synoptic categories, with the exception of the CL category, being characterized by high values through night time as well. High values are observed under the NW and H–L categories contrasting the SW category. These results referring to the January–May dataset partly agree with the six-year analysis presented in [8]: there, high values of the PC associated with the along-mountain wind component were found under CL and H–L categories, and contrasted to OA categories. One main difference between the results here and the ones in [8] is that here PC1 is associated with high wind direction standard deviation.
PC2 is related with the thermodynamic characteristics of the surface environment (Figure 7b) showing an expected, well-defined diurnal cycle for all categories. The LW category mainly contrasts the SW, H–L and OA categories, more likely due to their warmer regimes. A similar mean behavior was detected from the long-term database analysis in [8].
Contrary to PC1 and PC2, the diurnal evolution of PC3 looks much less well organized and more variable across the synoptic categories (Figure 7c). The diurnal signal appears well-defined under ZONAL categories, with high values during the day and low values during the night. These results agree with the findings in [8], regarding the mean PC behavior, where it was argued that weak topographically flows develop under the ZONAL category. In Figure 5c, a well-defined PC3 midday maximum is also apparent under the NW and H–L categories. PC3 under categories LW and OA appear a low intensity midday maximum, whilst, under SW and CL categories, the PC3 signal appears deformed.

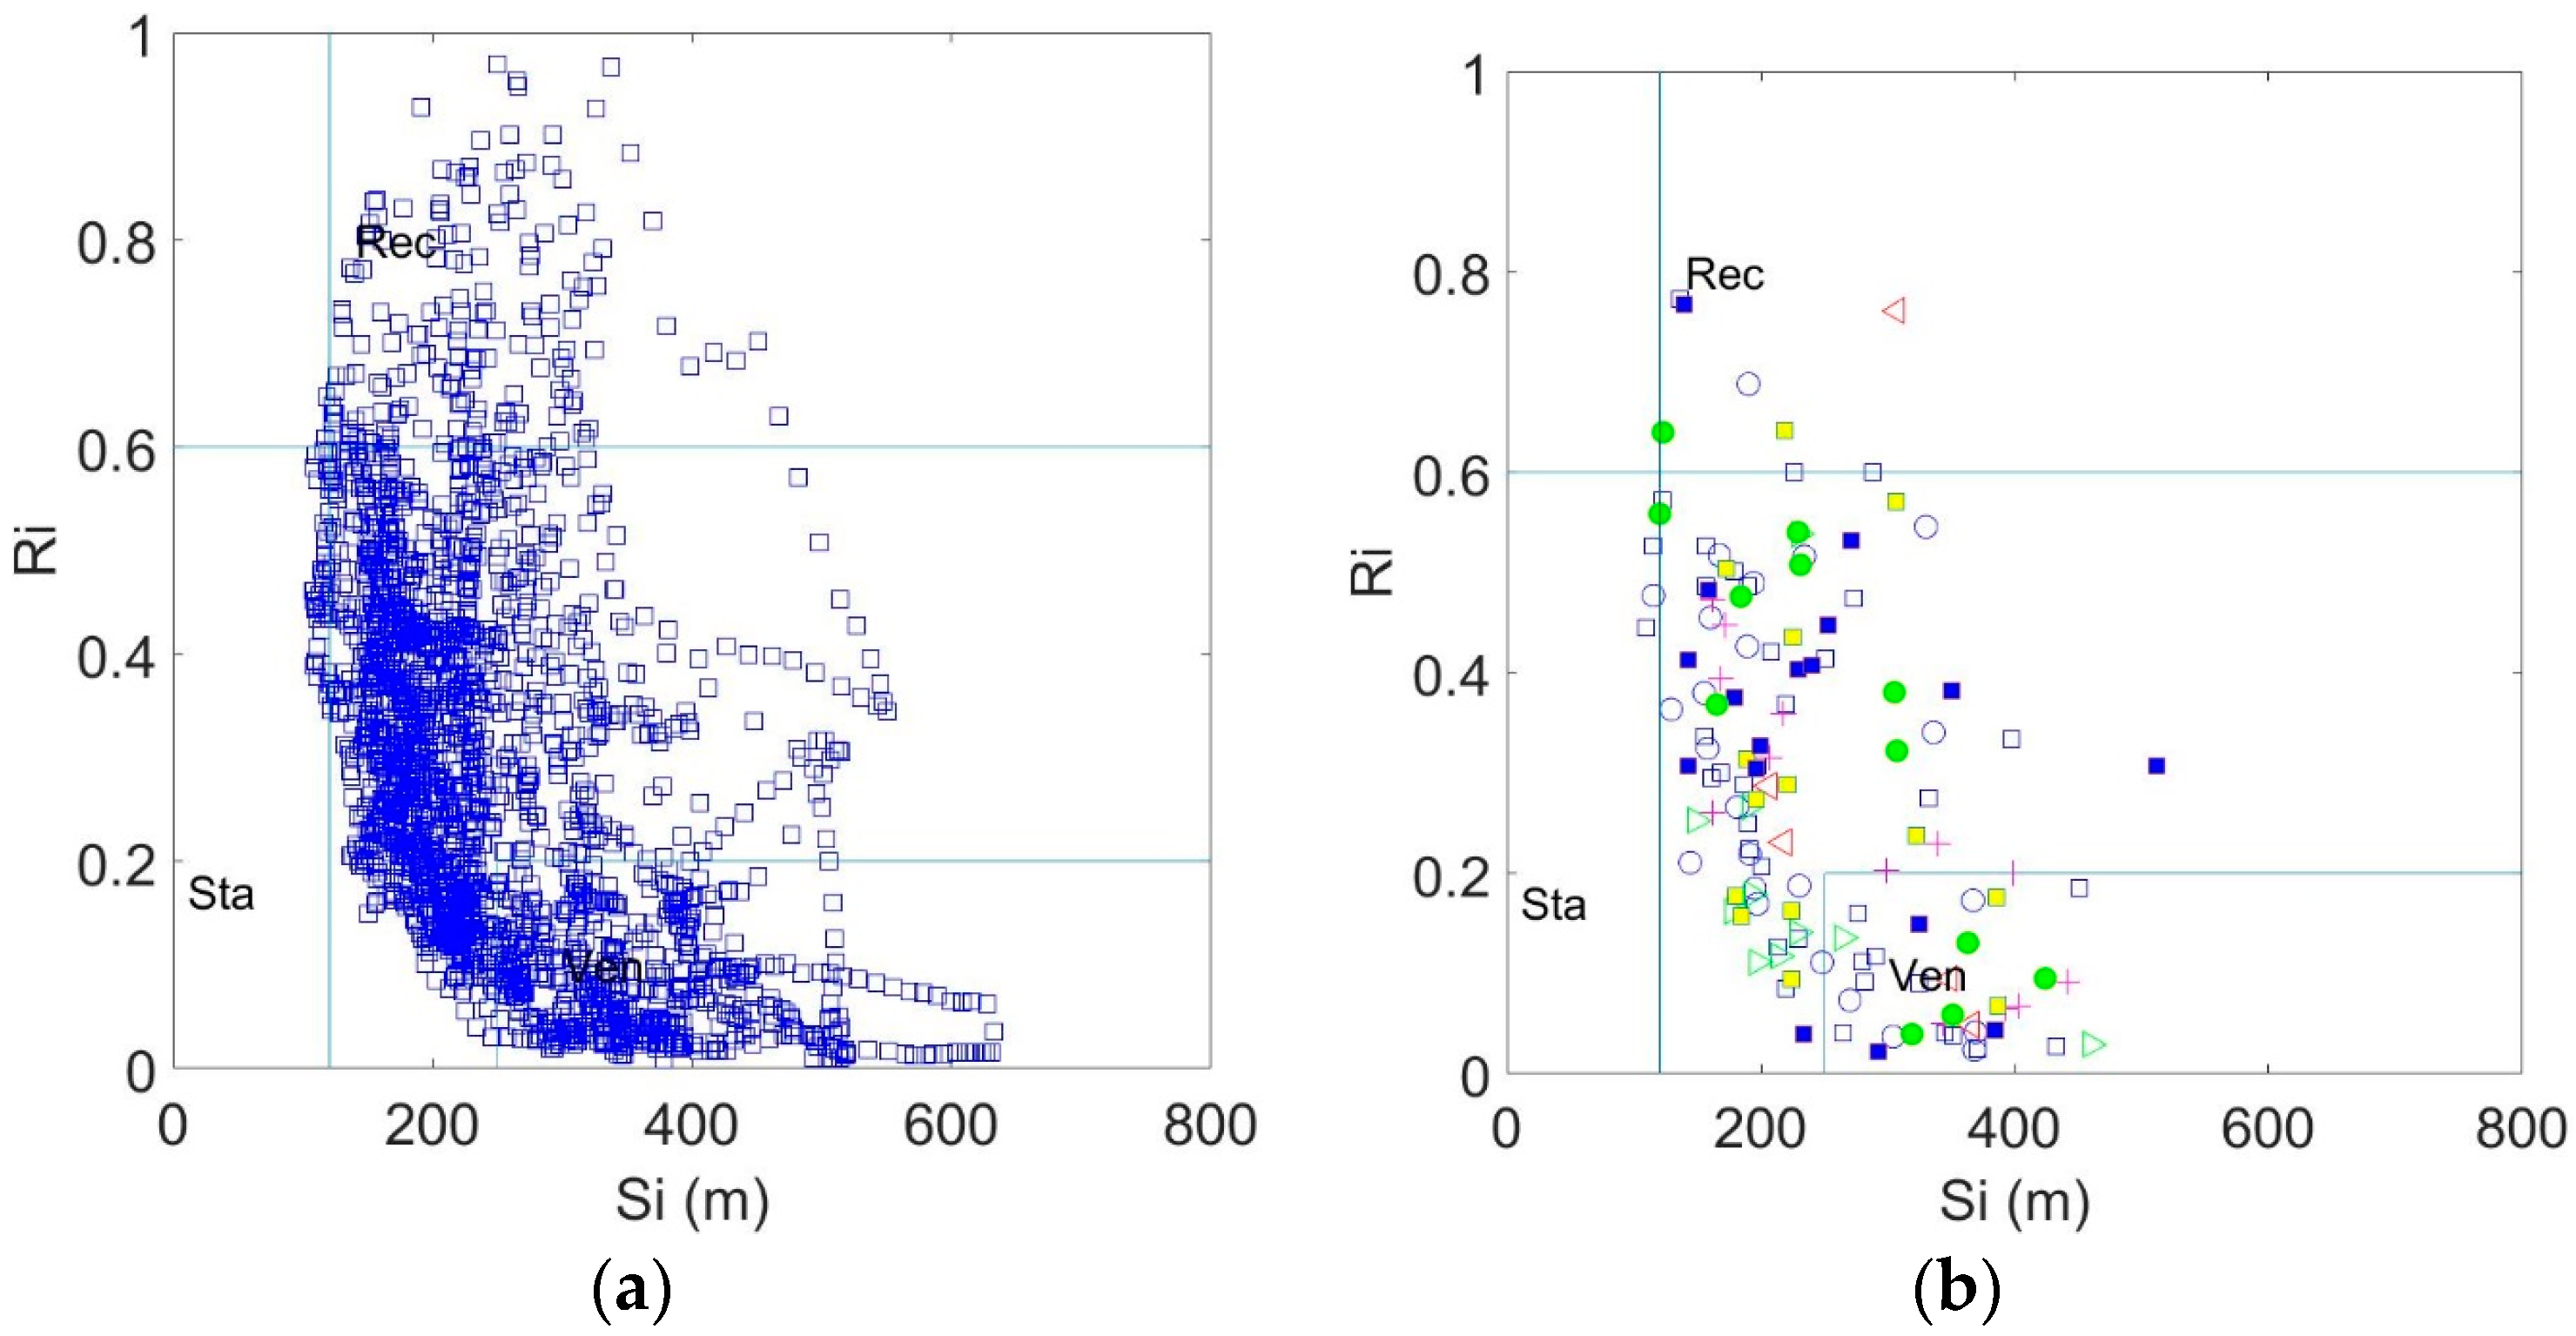
3.2.2. Large-Scale Circulation and Mesoscale Surface Flows: Integral Quantities

It is evident that wind run is enhanced with relatively narrow range of values during this mostly cold-period dataset ( S i ¯ ~ 251 m and σ S i ~   98 m for the mean and standard deviation, respectively). Mean values of the wind run Si varied across the different synoptic scale categories: 183 m, 235 m, 275 m, 324 m, 254 m, 249 m and 264 m were calculated for the SW, NW, LW, CL, ZONAL, OA, and H–L categories, respectively. The temporal evolution of the wind run under the SW, NW and CL categories representing low, moderate and high mean wind run values is shown in Figure 8a. Under the SW category, the mean wind run appears quite low, albeit with increasing rate during the afternoon. Si under NW category is almost constant throughout the day, whilst, under CL category, a diurnal cycle is evident with high values during the day and low values during the night. These mean wind run values are in accord with the results obtained from the PC analysis discussed in Section 3.1. Interestingly the diurnal behavior is not consistent with PC results in all cases. Thus, the wind run diurnal cycle is similar with the PC3 diurnal cycle under CL, but this is not the case for the SW category: the nighttime wind run high values are evident in neither PC1 nor PC2 analysis (Figure 6a,b).
Ri is rather low across all synoptic circulation patterns, with mean values being 0.36, 0.42, 0.21, 0.22, 0.25, 0.31 and 0.26 for the SW, NW, LW, CL, ZONAL, OA, and H–L categories, respectively. The intra-synoptic category Ri variability is high and reasonably uniform across all categories: mean values of the standard deviation are 0.20, 0.21, 0.18, 0.19, 0.16, 0.19 and 0.18 for the SW, NW, LW, CL, ZONAL, OA, and H–L categories, respectively. The Ri is particularly low under CL synoptic circulation (Figure 8b). This is probably expected, since, in this synoptic category, the wind flow is quite intense, and local flows do not easily develop. On the other hand, under the NW category, there is a distinct diurnal recirculation cycle with a peak in the morning hours.

3.2.3. Large-Scale Circulation and Geometric Structures

More geometric structures with negative gradient are observed under the ZONAL, OA and LW synoptic categories (Table 3). Thirty-one geometric structures are observed under the OA category, 27 under the ZONAL and 24 under the LW categories (relative frequencies 22%, 19% and 17%, respectively). The lowest values are observed for the CL category (relative frequency 4%). Relative frequencies here are defined as the ratio of the number of geometric structures under each category to the total number of geometric structures observed.
Several geometric structures are observed on the same days and in, Figure 9, the relative frequency of the number of days when at least one geometric structure was observed is presented. The trend of the relative frequencies is similar to the trend of the relative frequencies of days under each category. Therefore, it appears plausible that geometric structures occur under all synoptic categories.

3.2.4. Mesoscale Surface Patterns and Geometric Structures

Geometric structures are more likely to occur when the flow forcing is weak (Figure 10). PC1 and PC3 scores are in general almost equally divided between positive and negative values (52% and 57% of the all-data cases, respectively). When geometric structures are observed, more PC1 and PC3 scores are negative (61% and 62%, respectively), indicating a weakened flow forcing. The same result is also evident from the median PC1 and PC3 scores, being −0.12 and 0.14 for the all-data cases, and −0.25 and −0.23 for the cases with geometric structures, respectively.
The division of the cases between recirculation, stagnation and ventilation regimes is the same for the cases with geometric structures and the all-data cases (Figure 11a,b respectively). Eight percent of the hours appear under recirculation regime, 3% under stagnation and 25% under ventilation regime for the entire dataset. Respective values when geometric structures appear are 7%, 3% and 26%.
Differences in the mean recirculation and wind run values occur across the different geometric structures. For example, step shapes occur under higher Ri values (mean value 0.38 against 0.28 for the all-data cases). Nevertheless, the frequency of the number of cases occurring under the recirculation, stagnation and ventilation categories appear relatively uniform, varying little across the different geometric structures.

4. Discussion and Concluding Remarks

In this study, diurnal cycles of atmospheric variability and sub-hourly temperature changes in the form of geometric structures were linked with synoptic scale circulation categories.
Three PCs were identified accounting for the thermodynamic status of the surface environment (PC2), and flow forcing related with the along (PC1) and across (PC3) axis mountain components of the wind. PC1 shows a clear diurnal signal with high (low) values during midday (nighttime) for all synoptic categories, apart from the CL category: there high values were observed during the night time as well. This matches well with the results of [18], where CL was associated with surface low-pressure systems and therefore more persistent flow field in the area. PC3 diurnal signal looks much less well organized and more variable across the synoptic categories, with the prominent exception of the ZONAL category, apparently related with weak topographically induced flows [7].
Synoptic circulation categories were examined in relation to mesoscale flow fields, and intense wind flows under the CL synoptic circulation category. These were contrasted with the diurnal recirculation patterns with a peak in the late morning hours under NW synoptic category. Both results are consistent with [8], where it was suggested that the NW synoptic category has similar surface thermodynamic characteristics with the OA category, which is turn was found to be related with low intensity flow fields. It was also found that the CL category was favorable for the development of the along-mountain flows.
In total, 142 geometric structures with a range >0.5 °C (75th percentile ~ 1 °C) have been found: 61 were identified as cliff—ramps, 16 as ramp—cliffs, 34 as sinusoidal and 31 as step shapes. Geometric structures are more likely to occur when the flow forcing is weak. During this mostly cold-period dataset, comparably high winds were observed with relatively narrow wind speed range and small recirculation. Nevertheless, geometric structures were observed in 74 days out of a total of 115 days (64%) and it was observed that step changes have been associated with increased recirculation. In [8], it was suggested that geometric structures might be embedded in larger, organized flow structures such as sea breeze fronts or down-slope winds. This conclusion was supported by other studies, e.g. the study by Mahrt [28], where step changes in temperature time series associated with micro-front passage were detected, and the study by Koch [29], where wave-like motions such as solitary waves were reported as evolving from density currents in the stable lower atmosphere.
Even though surface thermodynamic and flow patterns vary un-evenly across the different synoptic categories, geometric structures are likely to occur across all synoptic situations. This study mainly covered the cold period of the year and therefore results reflect this limitation. Thus, conclusions cannot be directly deducted for the warm period; another study would be needed to specifically focus on the annual cycle of surface variability on the hour and sub-hour time scales in response to synoptic circulation systems. However, based on results found in the current study and well-established knowledge from past studies, some general statements might be drawn. The warm period of the year is characterized by the predominance of anticyclonic circulation on the one hand and the H–L category on the other hand [7,30]. Under the H–L category, the mesoscale flow forcing is the well-known Etesian wind system, which is quite intense [7]. Anticyclonic circulation is related with weak flows, which in the summer are favorable for the development of local flows related with recirculation patterns such as sea breezes [13]. It would be expected therefore that, for the warm period, the characteristics of the surface environment would appear distinctly different during days with H–L on the one hand and anticyclonic related weather systems on the other hand. In particular, fewer geometric structures would be expected to occur under the Etesian flow forcing, and more under the anticyclonic systems with the possible predominance of step changes.

Acknowledgments

The authors would like to acknowledge the efforts of Nikos Kaltsounidis to maintain the Laboratorie’s Automatic Meteorological Station. CH would like to thank Dr. Kostas Philippopoulos for fruitful discussions during the first stages of this work.

Author Contributions

Christos H. Halios conceived and designed the analysis; Christos H. Halios, Panagiotis G. Mouschouras and Helena A. Flocas analyzed the data; and Christos H. Halios, Helena A. Flocas, Dismosthenis N. Asimakopoulos and Costas G. Helmis wrote the paper.

Conflicts of Interest

The authors declare no conflict of interest.

References

  1. World Meteorological Organization. Seamless Prediction of the Earth System: From Minutes to Months; Brunet, G., Jones, S., Ruti, P.M., Eds.; World Meteorological Organization: Geneva, Switzerland, 2015. [Google Scholar]
  2. Barlow, J.; Best, M.; Bohnenstengel, S.I.; Clark, P.; Grimmond, S.; Lean, H.; Christen, A.; Emeis, S.; Haeffelin, M.; Harman, I.N.; et al. Developing a Research Strategy to Better Understand, Observe, and Simulate Urban Atmospheric Processes at Kilometer to Subkilometer Scales. Bull. Am. Meteorol. Soc. 2017, 98, ES261–ES264. [Google Scholar] [CrossRef]
  3. Mihalakakou, G.; Flocas, H.A.; Santamouris, M.; Helmis, C.G. The impact of synoptic scale atmospheric circulation on the urban heat island over Athens, Greece. J. Appl. Meteorol. 2002, 41, 519–527. [Google Scholar] [CrossRef]
  4. Kassomenos, P.; Flocas, H.A.; Skouloudis, A.N.; Lykoudis, S.; Asimakopoulos, V.D.; Petrakis, M. Relationship of air quality indicators and synoptic scale circulation at 850 hPa over Athens during 1983–1995. Environ. Technol. 1999, 19, 13–24. [Google Scholar]
  5. Flocas, H.A.; Kelesis, A.; Helmis, C.G.; Petrakakis, M.; Zoumakis, N. Synoptic and local scale atmospheric circulation associated with air pollution episodes in an urban Mediterranean region. Theor. Appl. Climatol. 2009, 95, 265–277. [Google Scholar] [CrossRef]
  6. Taylor, M.; Retalis, A.; Flocas, H. Particulate matter estimation with photochemistry: A modeling approach using neural networks and synoptic clustering. Aerosol Air Qual. Res. 2016, 16, 2067–2084. [Google Scholar] [CrossRef]
  7. Kassomenos, P.; Flocas, H.A.; Lykoudis, S.; Petrakis, M. Analysis of mesoscale patterns in relation to synoptic conditions over an urban Mediterranean basin. Theor. Appl. Climatol. 1998, 59, 215–229. [Google Scholar] [CrossRef]
  8. Halios, C.H.; Helmis, C.G.; Flocas, H.A.; Nyeki, S.; Assimakopoulos, D.N. On the variability of the surface environment response to synoptic forcing over complex terrain: A multivariate data analysis approach. Meteorol. Atmos. Phys. 2012, 118, 107–115. [Google Scholar] [CrossRef]
  9. Sioutas, M.; Flocas, H.A. Hailstorms in Northern Greece: Synoptic patterns and thermodynamic environment. Theor. Appl. Climatol. 2003, 75, 189–202. [Google Scholar] [CrossRef]
  10. Yarnal, B. Synoptic Climatology in Environmental Analysis: A Primer; Belhaven Press: London, UK, 1993. [Google Scholar]
  11. Maheras, P.; Patrikas, I.; Karacostas, T.; Anagnostopoulou, C. Automatic classification of circulation types in Greece: Methodology, description, frequency, variability and trend analysis. Theor. Appl. Climatol. 2000, 67, 205–223. [Google Scholar] [CrossRef]
  12. Maheras, P.; Flocas, H.; Tolika, K.; Anagnostopoulou, C.; Vafiadis, M. Circulation types and extreme temperature changes in Greece. Clim. Res. 2006, 30, 161–174. [Google Scholar] [CrossRef]
  13. Helmis, C.G.; Asimakopoulos, D.N.; Papadopoulos, K.H.; Kalogiros, J.A.; Kassomenos, P.; Papageorgas, P.G.; Blikas, S. Air mass exchange between the Athens Basin and the Messogia Plain of Attika, Greece. Atmos. Environ. 1997, 31, 3833–3849. [Google Scholar] [CrossRef]
  14. Gao, W.; Shaw, R.H.; Paw, U.R.T. Observation of organized structure in turbulent flow within and above a forest canopy. Bound. Layer Meteorol. 1989, 47, 349–377. [Google Scholar] [CrossRef]
  15. Taylor, R.J. Thermal Structures in the Lowest Layers of the Atmosphere. Aust. J. Phys. 1958, 11, 168–176. [Google Scholar] [CrossRef]
  16. Barthlott, C.; Drobinski, P.; Fesquet, C.; Dubos, T.; Pietras, C. Long-term study of coherent structures in the atmospheric surface layer. Bound. Layer Meteorol. 2007, 125, 1–24. [Google Scholar] [CrossRef]
  17. Serafimovich, A.; Thomas, C.; Foken, T. Vertical and Horizontal Transport of Energy and Matter by Coherent Motions in a Tall Spruce Canopy. Bound. Layer Meteorol. 2011, 140, 429–451. [Google Scholar] [CrossRef]
  18. Boppe, R.S.; Neu, W.L.; Shuai, H. Large-Scale Motions in the Marine Atmospheric Surface Layer. Bound. Layer Meteorol. 1999, 92, 165–183. [Google Scholar] [CrossRef]
  19. Gallego-Castillo, C.; Cuerva-Tejero, A.; Lopez-Garcia, O. A review on the recent history of wind power ramp forecasting. Renew. Sustain. Energy Rev. 2015, 52, 1148–1157. [Google Scholar] [CrossRef]
  20. Belušić, D.; Mahrt, L. Is geometry more universal than physics in atmospheric boundary layer flow? J. Geophys. Res. 2012, 117, D09115. [Google Scholar] [CrossRef]
  21. Halios, C.H.; Helmis, C.G.; Asimakopoulos, D.N. Studying geometric structures in meso-scale flows. Front. Environ. Sci. 2014, 2, 47. [Google Scholar] [CrossRef]
  22. Georgakis, C.; Santamouris, M.; Kaisarlis, G. The Vertical Stratification of Air Temperature in the Center of Athens. J. Appl. Meteorol. Climatol. 2010, 49, 1219–1232. [Google Scholar] [CrossRef]
  23. Allwine, K.J.; Whiteman, C.D. Single-station integral measures of atmospheric stagnation, recirculation and ventilation. Atmos. Environ. 1994, 28, 713–721. [Google Scholar] [CrossRef]
  24. Wilks, D.S. Statistical Methods in the Atmospheric Sciences, 2nd ed.; Academic Press: Cambridge, MA, USA, 2006. [Google Scholar]
  25. Levy, I.; Dayan, U.; Mahrer, Y. A five-year study of coastal recirculation and its effect on air pollutants over the East Mediterranean region. J. Geophys. Res. 2008, 113, D16121. [Google Scholar] [CrossRef]
  26. Zagouras, A.; Argiriou, A.; Flocas, H.A.; Economou, G.; Fotopoulos, S. An advanced Method for Classifying Atmospheric Circulation Types based on Prototypes Connectivity Graph. Atmos. Res. 2012, 118, 180–192. [Google Scholar] [CrossRef]
  27. Kassomenos, P.; Gryparis, A.; Samoli, E.; Katsouyianni, K.; Lycoudis, S.; Flocas, H.A. Atmospheric circulation types and daily mortality in Athens, Greece. Environ. Health Perspect. 2001, 109, 591–596. [Google Scholar] [CrossRef] [PubMed]
  28. Mahrt, L. Common microfronts and other solitary events in the nocturnal boundary layer. Q. J. R. Meteorol. Soc. 2010, 136, 1712–1722. [Google Scholar] [CrossRef]
  29. Koch, S.E.; Feltz, W.; Fabry, F.; Mariusz, P.; Geerts, B.; Bedka, K.M.; Miller, D.O.; Wilson, J.W. Turbulent mixing processes in bores and solitary waves deduced from profiling systems and numerical simulation. Mon. Weather Rev. 2008, 136, 1373–1400. [Google Scholar] [CrossRef]
  30. Kostopoulou, E.; Jones, P. Comprehensive analysis of the climate variability in the eastern Mediterranean. Part II: Relationships between atmospheric circulation patterns and surface climatic elements. Int. J. Climatol. 2007, 27, 1351–1371. [Google Scholar] [CrossRef]
Figure 1. The Greater Athens Area. In the map, the location of the University Campus (Meteo UOA—University of Athens) and the center of the city (Omonoia Square) are denoted.
Atmosphere 09 00025 g001
Figure 2. Schematics of geometric structures used in this study.
Atmosphere 09 00025 g002
Figure 3. Schematic illustration of the transport distance (L, dashed line) and wind run (S, solid line) for: high circulation (top); and low recirculation (bottom).
Atmosphere 09 00025 g003
Figure 4. Charts of the atmospheric circulation at the 850 hPa isobaric level for each of the eight synoptic categories over the Greater Athens Area (GAA).
Atmosphere 09 00025 g004
Figure 5. Time Series of (a) wind run (Si) and (b) recirculation factor (Ri).
Atmosphere 09 00025 g005
Figure 6. Composite plots of 1 min standardized temperature fluctuations time series: (a) cliff—ramps (b) ramp—cliffs; (c) sinusoidal; and (d) step. Lines with symbols show medians and dotted lines with shaded areas 25th and 75th percentiles (see text). Blue lines correspond to negative and red lines to positive gradients.
Atmosphere 09 00025 g006
Figure 7. Composite plots of the diurnal cycle of the mean values of the three Principal Components scores time series (a) PC1, (b) PC2, (c) PC3. Time is reported as Local Standard Time.
Atmosphere 09 00025 g007
Figure 8. Composite plots of the diurnal cycle of the two main Integral Quantities: wind run (Si) (a); and recirculation factor (Ri) (b). Thick lines with symbols show mean values. Dotted lines with shaded areas correspond to ±1 standard deviations. Time is reported as Local Standard Time.
Atmosphere 09 00025 g008
Figure 9. Red circles: Relative frequencies of days under each synoptic category (number of days under each category divided by total number days). Blue squares: Days with geometric structures under each synoptic category (number of days when at least one geometric structure was observed divided by total number of days with geometric structures).
Atmosphere 09 00025 g009
Figure 10. PCA score plot for: all data (a,d); and for the hours with geometric structures (b,c).
Atmosphere 09 00025 g010
Figure 11. Scatter plot of the hourly recirculation factor Ri vs. wind run Si and the corresponding classification according to [23]: all data (a); and data when geometric structures was detected (b).
Atmosphere 09 00025 g011
Table 1. Statistical test for the synoptic frequencies of the synoptic categories.
Categories2000(Relative Frequency)1983–2015(Relative Frequency)z Value
SW13.910.90.57
NW13.09.50.45
LW12.29.5−0.30
CL6.18.3−2.65
ZONAL14.87.41.47
OA30.434.9−2.37
CA0.01.9-
H–L9.617.71.17
Table 2. PC loadings from principal component analysis.
PC1PC2PC3
T−0.190.81−0.06
RH−0.06−0.76−0.76
WDsd0.620.460.19
Vsd0.890.120.32
SR0.350.720.19
absu0.150.090.96
absv0.91−0.06−0.19
shear0.83–0.020.33
Table 3. Number of occurrences of geometric structures under each synoptic category. In parenthesis the relative frequency is given.
TitleCliff—Ramp Ramp—CliffSinusoidalStepTotal
Synoptic Categories t < 0 t > 0 t < 0 t > 0 t < 0 t > 0 t < 0 t > 0
SW3 (2%)6 (4%)1 (1%)1 (1%)1 (1%)6 (4%)2 (1%)2 (1%)22 (15%)
NW2 (1%)5 (4%)0 (0%)0 (0%)2 (1%)1 (1%)4 (3%)2 (1%)16 (11%)
LW2 (1%)10 (7%)3 (2%)2 (1%)2 (1%)3 (2%)2 (1%)0 (0%)24 (17%)
CL0 (0%)0 (0%)0 (0%)0 (0%)3 (2%)0 (0%)2 (1%)0 (0%)5 (4%)
ZONAL4 (3%)7 (5%)0 (0%)5(4%)5(4%)2 (1%)3 (2%)1 (1%)27 (19%)
OA8 (6%)8 (6%)1 (1%)3 (2%)2 (1%)2 (1%)4 (3%)3 (2%)31 (22%)
CA0 (0%)0 (0%)0 (0%)0 (0%)0 (0%)0 (0%)0 (0%)0 (0%)0 (0%)
H–L4 (3%)2 (1%)0 (0%)0 (0%)3 (2%)2 (1%)3 (2%)3 (2%)17 (12%)

