Exposure to Black Carbon during Bicycle Commuting–Alternative Route Selection
by
 ,
,
Borut Jereb
1 ,
,
Tanja Batkovič
2,
Luka Herman
1,
Gregor Šipek
1,
Špela Kovše
1,
Asta Gregorič
2,3,* and
Griša Močnik
3,4 1
Faculty of Logistics, University of Maribor, 3000 Celje, Slovenia
2
University of Nova Gorica, 5000 Nova Gorica, Slovenia
3
Aerosol d.o.o., 1000 Ljubljana, Slovenia
4
Condensed Matter Physics, Jozef Stefan Institute, 1000 Ljubljana, Slovenia
*
Author to whom correspondence should be addressed.
Atmosphere 2018, 9(1), 21; https://doi.org/10.3390/atmos9010021
Submission received: 8 December 2017
/
Revised: 6 January 2018
/
Accepted: 12 January 2018
/
Published: 15 January 2018
(This article belongs to the Special Issue Carbonaceous Aerosols in Atmosphere)
Abstract
:Traffic air pollution significantly influences cyclists using cycling routes near main roads. We analyze the dependency of black carbon (BC) concentrations in relation to the proximity to their traffic sources. We performed static and mobile measurements of BC using aethalometers at chosen sites and cycling routes in Celje, Slovenia—static measurements at two road-side sites and an urban background site. Mobile measurements were performed simultaneously at an existing cycling route and an alternative route away from the busy roads. BC concentration apportioned to traffic decreases with the distance from the sources on the main road. The exposure of cyclists to BC can be greatly reduced by moving the cycling route away from busy roads, hence we propose an alternative route and show that traffic planning and management should include all modes of transport. Results imply that street intersections along the cycling routes influence the cyclists’ exposure and should be as few as possible when planning cycling routes in urban areas.
1. Introduction
Epidemiological studies provide sufficient evidence of the association of cardiopulmonary morbidity and mortality with black carbon (BC) exposure. The review of toxicological studies suggested that BC may not be a major directly toxic component of fine particulate matter (PM2.5), but it may operate as a universal carrier of a wide variety of chemicals of varying toxicity to the human body. A reduction in exposure to PM2.5 containing BC and other combustion-related particulate material for which BC is an indirect indicator, should lead to a reduction in the health effects associated with PM and simultaneously contribute to the mitigation of climate change [1]. BC (as a special PM2.5) causes serious health concerns: it is associated with asthma and other respiratory problems, heart attacks and lung cancer [2].
Many studies have confirmed highly spatially heterogeneous pollutant concentrations in urban areas, with rapid decrease of concentration with increasing distance from vehicle emissions, which significantly influences exposure levels (e.g., [3,4]). The main parameters which help to reduce near-roadway pollution are lower traffic densities and fewer intersections, since several studies have proven an increased exposure due to higher emissions from vehicle accelerations at intersections [5,6,7]. Urban built environment has a complex influence on pollutant dispersion characteristics near roads. A comprehensive study of the effects of built environment, traffic patterns and micrometeorology revealed that heterogeneous building morphology helps to reduce concentrations of traffic emissions by increasing the surface turbulence [7].
Improvement of travel behavior in urban and sub-urban areas primarily focuses on the encouragement of cycling as a healthier, environmental friendly and energy efficient alternative to public transport. However, health benefit of cycling competes with personal pollution inhalation dose received from traffic-related air pollution. Several studies focusing on bicycle route preferences [8,9,10,11] and exposure/distance trade-offs [12,13] were conducted recently. The main implication of this study in practice is to provide extensive grid of low-traffic routes, which allows bicyclists to minimize inhalation dose between any two points of transportation. In the study of health benefits of physical activity from cycling using the bicycle sharing scheme (Bicing) in Barcelona (Spain), positive effects were large compared with the risks from pollution inhalation dose and road traffic incidents [14]. By selecting low-traffic bicycle boulevards instead of heavily trafficked roads, cyclists can reduce their exposure to vehicle-related air pollution. Results encourage policy-makers and city planners to expand infrastructure to promote safe and healthy bicycle commuting [15]. According to the study performed by Ham et al. [16], commuter exposure differs significantly depending on the choice of transport. Several studies confirmed the importance of selection of bicycle route, which is not directly influenced by traffic-related air pollutants [14,17,18].
Transport regulation at local level for the abatement of air pollution has gained significant traction in the EU. Study of the effect of different transportation changes on air quality in city of Ljubljana (Slovenia) and Granada (Spain) was performed. Several air pollutants were measured before and after the implementation of the changes. In Ljubljana, a 72% reduction of local BC was observed after the restriction was implemented [19].
In this study, BC was chosen as an appropriate indicator of traffic-related PM pollution, since its emission is closely related to combustion of carbonaceous fuels, it is a major component of traffic emissions, and is at the same time a good indicator of adverse health effects caused by particulate air pollution [2]. Since BC is emitted directly from combustion sources and is chemically inert, it presents a unique indicator for the combustion efficiency of emission sources. BC concentration thus provides more reliable information on the activity of sources than measurements of overall particle mass concentration, such as PM2.5 or PM10, which are dominated by secondary aerosols. Besides emissions from traffic, an important source of BC is also incomplete combustion of biomass (related to domestic heating). Thus, for the study of traffic-related air pollution, BC concentration must be apportioned to sources, especially in areas where the contributions of both sources are comparable. Traffic-related BC emission is an important indicator for primary contribution of traffic to air pollution in major cities (e.g., [20]), whereas significant role of biomass burning emissions in winter is recognized in smaller cities and sub-urban areas, especially after the economic crises and increase of other fuel prices [21].
The aim of this study is to analyze the source-specific spatial and temporal BC variability in a small city and to evaluate the contribution of traffic-related air pollution to the inhalation exposure of non-motorized commuters by choosing an alternative cycling route, distant from the main road. The effect of road intersections on inhalation exposure is evaluated by a combination of stationary and mobile measurements of BC concentrations.
2. Methods
2.1. Measurement Locations
The study was performed in Celje, the 3rd largest city in Slovenia with about 38,000 residents (Figure 1). The interplay of specific geographic location at the lowest point of the basin surrounded by hills, causing frequent occurrences of temperature inversion and windless conditions, and emissions of air pollutants local and regional combustion sources, results in the highest number of days with exceedance of daily PM10 among Slovenian cities. Regional traffic through the city plays a major role with its contribution [22,23]. The city lies next to a motorway and railway junction of two vital European traffic corridors. Therefore, local government is implementing action plans [24] in order to reduce air pollution and, thus, exposure of local population to PM air pollution.
Black carbon measurements were carried out in the 2017 winter–spring period at different locations in the city separating the contribution to BC from traffic and biomass burning sources and determining their spatial distribution next to roads. Urban background measurements were conducted in two periods: January–February and March–May 2017, which allowed the evaluation of biomass burning contribution to BC and its seasonality due to different heating demand. Besides background measurements (site A, Figure 1), two short-term measurement campaigns at traffic sites were conducted in the periods 15–23 March and 20–30 April at intersection K4 and site B, respectively (Figure 1).
The site K4 is located at the intersection of two main streets in the city (Mariborska and Kidričeva Street) with eight traffic lanes in total and highest traffic density. The intersection is characterized by heavy and frequent stop-and-go traffic. To the north, Mariborska Street continues onto a highway. The aethalometer was installed 3 m above the pavement immediately next to the street.
The traffic site B is located close to the Mariborska Street, with the aethalometer installed 3 m above the bike lane which is 30 m away from the underpass. Some 50 m further, there is also a bus station. The intersection located 30 m away from our measuring place is smaller than the one at location K4, with four traffic lanes traversing. Next to the measurement site, the vehicles do not queue or accelerate.
The urban background location (A) was selected between the two traffic sites, behind a four-story building, 20 m away from Mariborska Street, which rises from the railway underpass right at that point. Besides static continuous measurements, mobile measurements were performed along the existing cycling route on the Mariborska Street and on the selected alternative cycling route simultaneously (Figure 1) on 31 May 2017. The only major source of BC during this period is expected to be diesel exhaust from traffic.
To evaluate the impact of route attributes to the preference of route choice, several parameters were considered. As identified in the published research, the most important ones are the length/travel time, elevation gradient, existence of bike lanes, traffic volume and several others e.g., [10] . The elevation and speed graphs of the mobile measurements of both routes are presented in Figure 2. The upper graph shows the main route (at Mariborska Street), which is 3.19 km long and took 10 min and 29 s to complete. It has five intersections with a traffic light, where the cyclists may need to stop. The lower graph shows the alternative route which is 3.03 km long and takes 9 min and 29 s. It features one intersection where cyclists may need to stop, one underpass and one road crosswalk. The altitude difference between the start and end point is 25 m. Mobile measurements started at the northmost point on Mariborska Street and continued along the street, and the alternative route journey started at the southmost point where Mariborska route ends and ended at the starting point of the mobile measurements. The cycling route at Mariborska, therefore, went slightly downhill and we expected that it is quicker than the alternative route which runs slightly uphill. However, the alternative path was quicker, because there is just one traffic light where the cyclists may need to stop. In this respect, the alternative route presents also the choice with lower exposure time.
2.2. Measurement Set-Up and Instrumentation
Measurements of black carbon concentrations were conducted using the Magee Scientific Aethalometer AE-33 (Aerosol d.o.o., Ljubljana, Slovenia). Two instruments were used, one of them installed at the background station (A), whereas the other one was installed inside a closed box mounted to the street light support pole 3 m above the bike lane at the intersection K4 and traffic site B, respectively. The aethalometer samples air through a filter tape with a flow rate of 5 L per min. The gradual accumulation of light absorbing carbonaceous aerosols causes a gradual decline in the optical transmission of light and an increase in attenuation. BC concentration is calculated based on measurements of the rate of increase of light attenuation at the 880-nm wavelength in 1-min time increments. The mass absorption cross section σair of 7.77 m2 g−1 and a multiple scattering parameter C = 1.57 are used to convert measurements of attenuation to BC mass concentration. BC source apportionment featured in the AE-33 software uses the so-called aethalometer model described by Sandradewi et al. [26] and is based on the source specific dependence of light absorption by aerosols. Fresh BC from diesel exhaust is assumed to have an absorption Ångström exponent (AAE) close to 1 [27], whereas biomass burning aerosols show an enhancement of light absorption at shorter wavelengths and, thus, a higher value of AAE, which is calculated based on the wavelength (λ) dependence of the aerosol absorption coefficient (babs is proportional to λ–AAE). The wavelength pair of 470 and 950 nm, and a combination of 1 and 2 AAE values were used for traffic and biomass burning contribution, respectively.
Mobile measurements along both cycling routes were conducted using the same AE-33 devices and the same time resolution (1-min). Measurements were carried out at walking speed using a cart in order to capture highly spatially resolved BC concentrations. GPS coordinates were recorded by an external GPS monitor connected to the AE-33.
The public database of meteorological observations provided by the Slovenian Environment Agency was used for interpretation of BC temporal variation. Air temperature (T), pressure (p), relative humidity (RH), wind speed (ws) and direction (wd) and amount of precipitation were measured with half-hour time resolution at the meteorological station located about 1 km east of our study area. Additionally, modelled atmospheric stability data were downloaded from the National Oceanic and Atmospheric Administration (NOAA) database. Dataset includes, among other parameters, modelled values of PBL (planetary boundary layer) height (zi) and Pasquill stability class (PSQ) [28], which classifies atmospheric stability into seven classes, sorted from A to G from the least to the most stable atmospheric conditions, A–D representing day-light, and F–G night-time conditions.
Road traffic flow along the main road (Mariborska Street) is shown in Figure 3—the data were obtained from the official road traffic counting by the Slovenian Infrastructure Agency (Ministry of Infrastructure, Republic of Slovenia). Measurements were performed during two typical working days and the average of both days represents the official measurement. Based on the data of the Statistical Office of Republic of Slovenia (SI-STAT) the ratio between gasoline and diesel cars in Slovenia is 55 (gasoline):45 (diesel). Data analyses were performed using R with the visualization packages “ggplot2” [29] and “ggmap” [30].
3. Results and Discussion
3.1. Traffic Density
The number of vehicles, passing the intersection K4 was 20,657 diesel vehicles, of which there were 16,175 diesel cars, 233 buses and 4249 freight vehicles. At site B, 12,920 diesel vehicles passed with 10,011 diesel cars, 204 buses and 2705 freight vehicles. All buses in Slovenia, except few intracity buses in Ljubljana and Maribor, use diesel fuel; the same is true for freight vehicles. Diurnal distribution is similar at both sites, with overall, 1.6-times more traffic at intersection K4 compared to site B. Although traffic counts are increased by 1.62- and 1.57-times for cars and freight vehicles, respectively, Mariborska Street represents the main bus line to the city center and, thus, only a 12% decrease of number of buses is observed from intersection K4 to site B.
3.2. Temporal Evolution of BC Concentrations and Their Spatial Distribution
Black carbon concentrations exhibit characteristic seasonal behavior with higher concentrations during colder seasons and lower concentrations in the warmer part of the year. The seasonality is governed partly by higher BC emission rates due to biomass burning in winter months which are enhanced by stronger atmospheric stability and low wind conditions.
Summary of BC concentration measurements during both periods, winter (January–February 2017) and spring (March–May 2017) for different measurement sites is presented in Table 1. Mean (± standard deviation) winter BC concentration measured at the background station was 6.0 ± 4.6 µg m−3 with the mean biomass burning (BB) fraction of 39 ± 18%. BC concentration was considerably lower in the spring period (2.8 ± 2.8 µg m−3) with the BB fraction between 20% and 30%. A decreasing BB contribution can be observed based on monthly statistics presented in Figure 4a. BC from biomass burning (BCBB) diminishes towards April and May, whereas traffic-related BC (BCTR) decreases towards an average value between 1–2 µg m−3. Despite only diurnal and weekly cycle (working days, weekend) expected for traffic-related BC emissions, the seasonal pattern of BCTR concentration results from the seasonality of planetary boundary layer (PBL). PBL plays an important role in controlling the dispersion of air pollutants emitted from ground sources. Thus, temperature inversion, as an extreme case of high PBL stability, and windless conditions favor the accumulation of BC in a thin atmospheric layer close to the ground. As can be observed from Figure 4b,c, PBL height decreases from A to D class and is generally lower than 100 m during night-time conditions (classes E, F and G). Higher PBL is associated with stronger dispersion and consequently lower pollutant concentrations (Figure 4b). This effect is more obvious for BC from biomass burning due to more homogeneous spatial distribution. On the contrary, traffic-related BC depends more on temporal variation of sources. The closer the source of emission, less dispersion is observed, regardless of PSQ class.
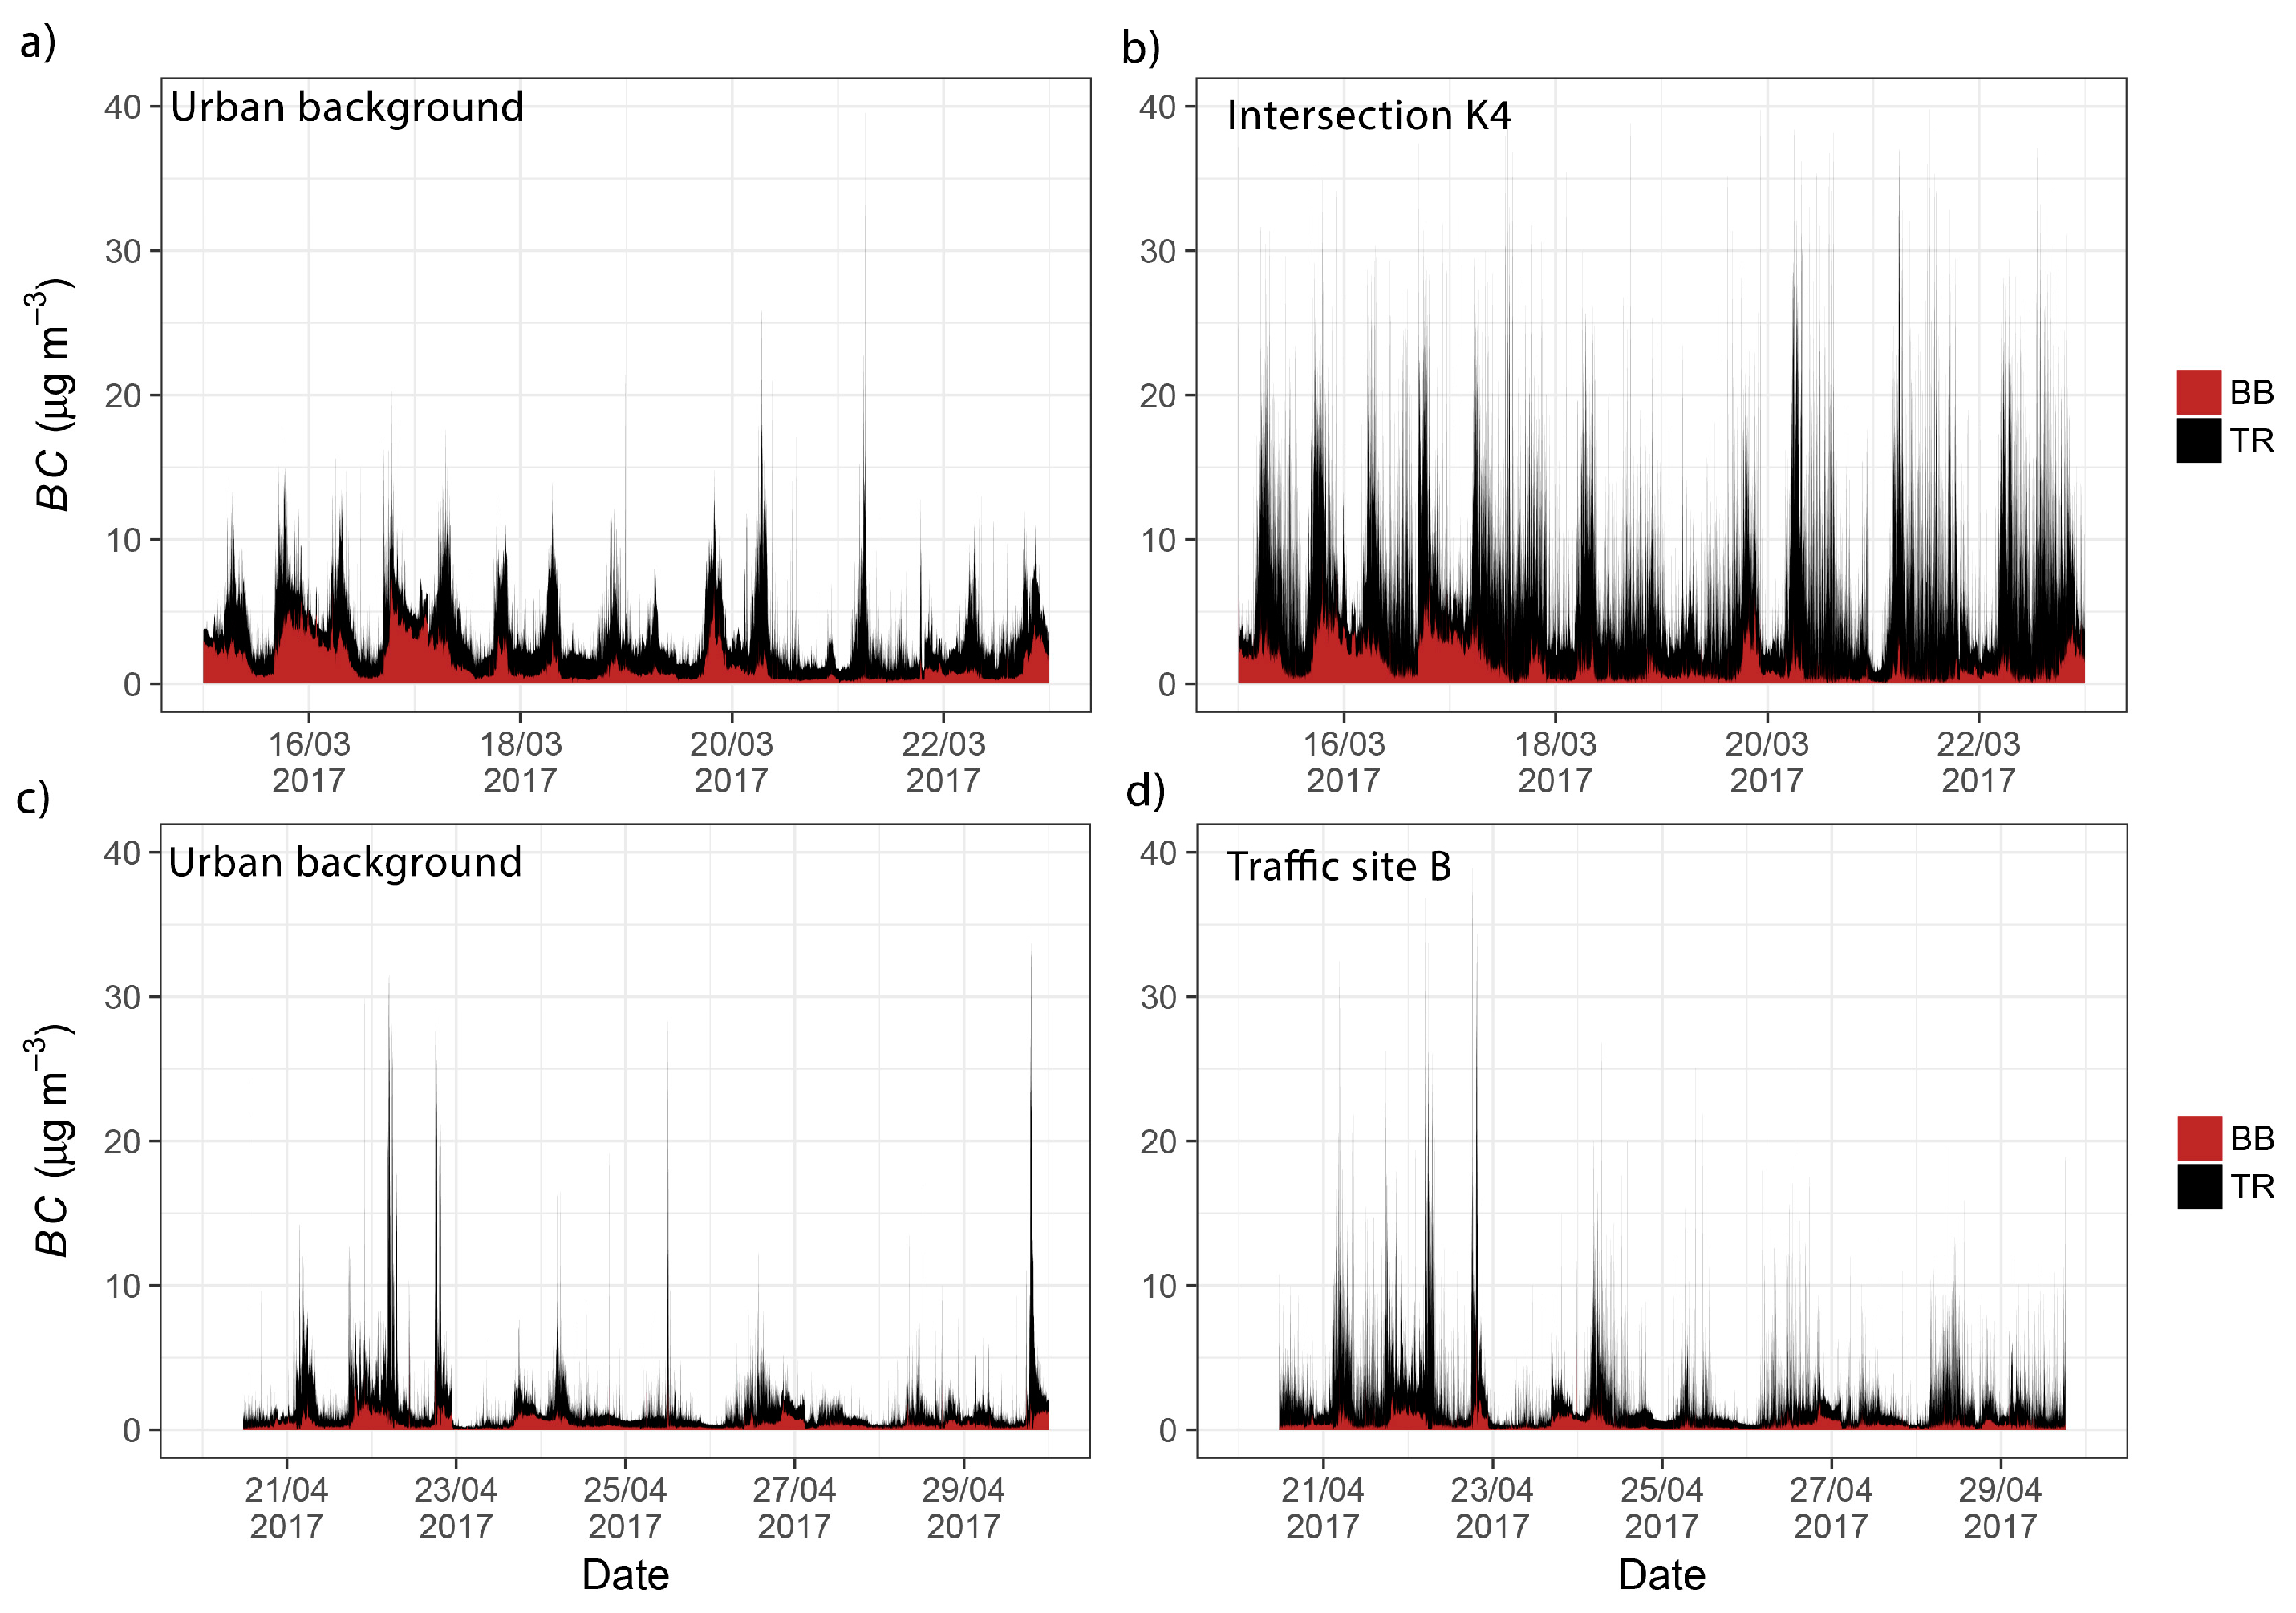
Distribution of BC concentration is in general right-skewed, with common short-term peaks resulting from BC emissions from the sources which are close to the measurement site. Higher and more frequent peaks can be observed at traffic sites K4 and B (Figure 5b,d) due to the proximity to traffic emissions. BCBB has the same temporal evolution at both concurrently measured sites (A and the corresponding traffic site; Figure 5a–d), showing that the distribution of primary components of wood smoke across the city is homogeneous. At site A, the contribution of BB decreased by 5% and total BC concentration by more than 50% (from 4.2 to 2 µg m−3) from March to April. Besides lower emission from biomass burning, the meteorological effects and change in the PBL dynamics (see explanation in the next paragraph) contribute most to lower BC concentration measured in the April campaign.
Traffic-related BC peaks reach up to 30–40 µg m−3 and 10–40 µg m−3 at intersection K4 and site B, respectively. Higher BCTR peaks at intersection K4 are the results of higher traffic density accompanied by the influence of acceleration due to traffic light dynamics. Considering the whole measurement campaign, traffic contributes 82% and 81% to total BC concentration for K4 and B site, respectively. Considering only traffic-related BC, the intersection K4 causes an increase of BCTR by a factor of 2.2 above background (mean value of BCTR: 6.5 µg m−3 at the intersection K4 compared to 2.9 µg m−3 at site A), whereas an increase by a factor of 1.4 was noticed for site B (mean value of BCTR: 2.1 µg m−3 at site B compared to 1.5 µg m−3 at site A). The factor differs for 1.6, which is explained by difference in traffic counts between both sites (Section 3.1). Diurnal variation of BC shows peaks, apportioned to traffic (Figure 6), which coincide with the traffic density peaks (see Figure 3).
Atmospheric stability and the resulting mixing layer height is a dominant factor influencing dispersion of air pollutants emitted from the surface sources (as observed from Figure 4). PBL daily evolution is mainly controlled by the intensity of solar radiation reaching the ground which results in convective mixing within the PBL causing the dilution of air pollutants during the day. BC concentration thus exhibits characteristic diurnal variation with higher concentrations early in the morning during the morning traffic rush hour and in the late afternoon. Increasing PBL mixing height during the day leads to lower BC concentration. Diurnal variation of BCBB and BCTR is presented in Figure 6 for the background (A) and traffic sites (K4, B) for March and April measurement campaigns. Yellow areas mark daylight hours, corresponding to increased PBL mixing. BCBB shows a similar pattern at all measurement sites, with high concentration during the night and lower during the day. On the other hand, higher concentrations of BCTR are observed between 6:00 and 8:00 (local time, LT) in the morning. Formation of turbulent PBL during the day causes a decrease of BC concentrations. This is more obvious at site A, which is not directly influenced by emissions from proximal traffic. On the other hand, measurements close to traffic emissions show high values during the whole day. Smaller increases in BCTR at K4 and B are observed in the afternoon (14:00–15:00 LT) compared to mornings. BC concentration increases again soon after the sunset as a result of both emissions and the shift from a well-mixed PBL to the nocturnal stable conditions. The evening peak thus shifts to later hours from winter months towards summer solstice and was observed at 18:00–19:00 LT during the March campaign and at 20:00–21:00 LT during the April campaign.
3.3. The Influence of Cycling Route on Inhalation Exposure to Traffic Related BC
Measurements of BC were conducted on 31 May 2017 along the existing main cycling route and its alternative (Figure 1), simultaneously at the same time twice in the morning (7:20 to 8:20 and from 8:55 to 9:50) and twice in the afternoon (14:15 to 15:00 and from 16:20 to 17:00) in order to remove the bias caused by the changing traffic density during the course of one measurement cycle. All measurements, from both repetitions along the same cycling route, are presented together in Figure 7. The summary statistics between both cycling routes is presented in Table 2. To observe the influence of intersections on BC concentration along both cycling routes, measurements were grouped in the intersection segment (approximately 20-m radius around the intersection area) and the straight part of the cycling route. Traffic density along the alternative cycling route is estimated to be about 50% lower (on average through the whole route) than at the main cycling route and is concentrated in the parts of the route along roads, whereas parts of the route leading through parks are distant from traffic influence. Although the number of mobile measurements along the same route are relatively low compared to recommendations given in the recent publication by Apte et al. [31], the results presented in this study were obtained by simultaneous measurements along both routes, thus, avoiding differences in measurements due to meteorology. Additionally, measurements were conducted with a walking speed and, thus, represent 1-min average of BC concentration along the route.
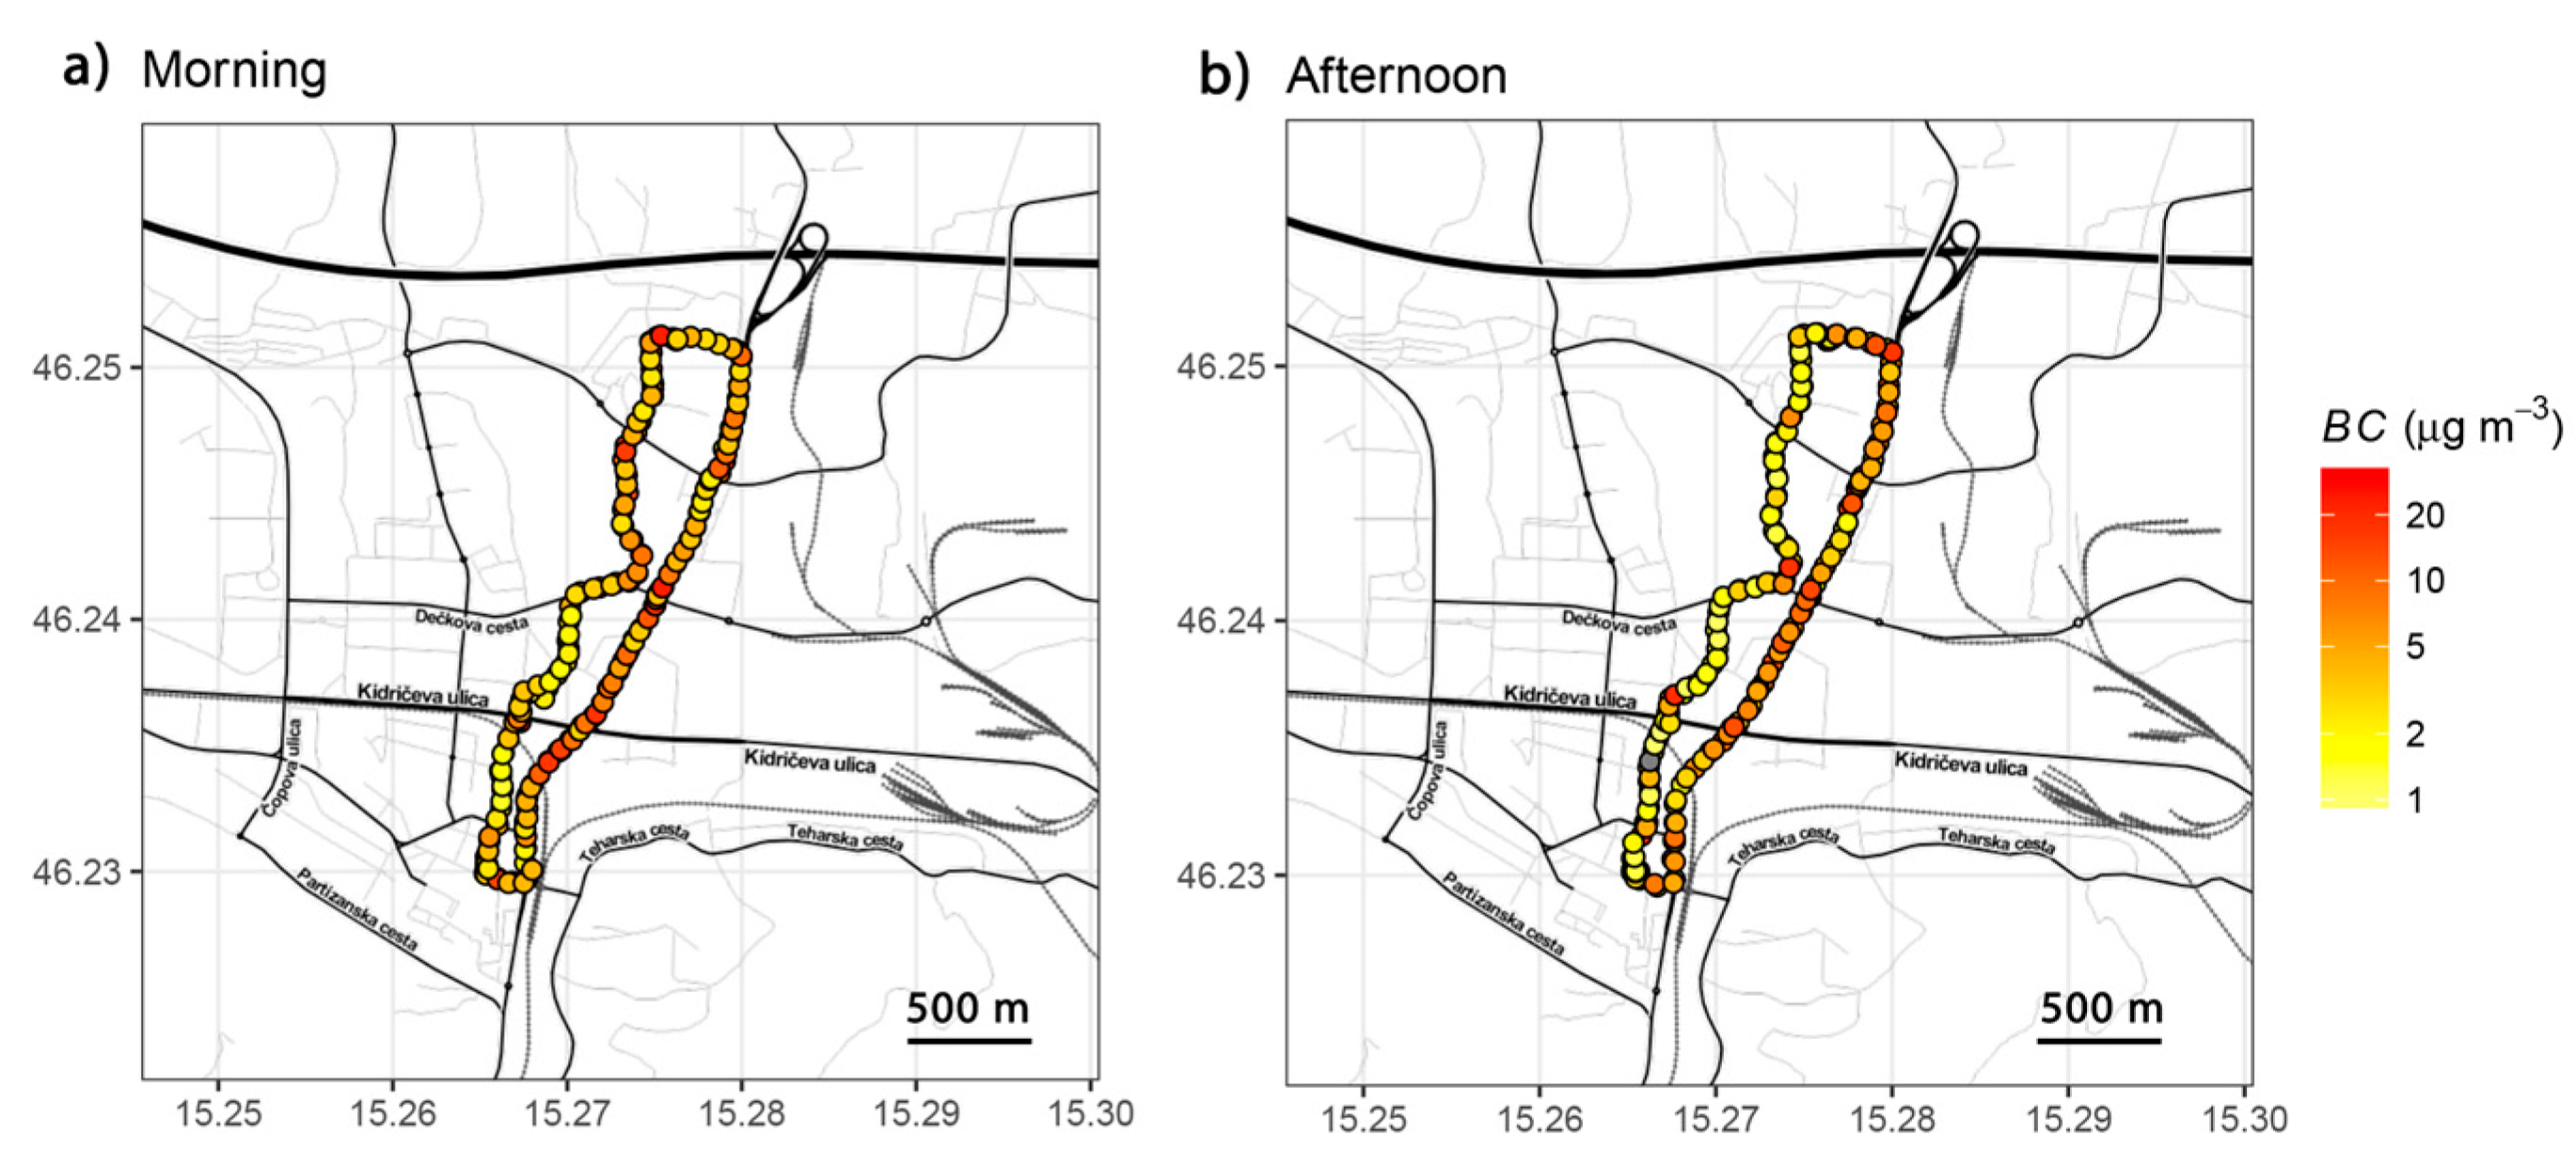
Contribution of biomass burning during the time of mobile measurements can be neglected, since the heating season is already over at the end of May. Source apportionment of measured BC concentrations shows less than 5% contribution of biomass burning, which is below the model uncertainty level. Results of mobile measurements show higher concentrations during the morning period, which is in accordance with diurnal variation of BCTR measured during the stationary measurements. Slightly lower concentrations were measured along the alternative cycling route, although no significant difference between both was noted during the morning measurements (t-test, p = 0.34 at 0.05 significance level). Mean values of 6.0 ± 5.1 and 5.3 ± 4.8 µg m−3 were recorded along the main and alternative cycling routes, respectively.
Afternoon measurements show similar concentrations to the morning ones along the main cycling route, whereas slightly lower BC concentrations were measured along the alternative route, which implies that BC concentrations close to strong traffic sources are influenced by traffic density alone, regardless of weather conditions and convective mixing. Mean values of 6.4 ± 4.9 and 4.5 ± 6.0 µg m−3 were measured along the main and alternative cycling route in the afternoon, respectively. More intense dispersion of pollutants in the early afternoon causes stronger gradients of concentrations with increasing distance from sources, which results in significantly lower concentrations at the alternative route (t-test, p = 0.02 at 0.05 significance level). However, peak values of 20–30 µg m−3 remain the same regardless of the time of day or the choice of the cycling route.
Much higher BC peaks were measured close to the intersections, where vehicles stop and accelerate, representing areas with the highest cyclists’ exposure. BC concentrations are decreasing with increasing distance from the intersections, which can be noticed especially for measurements performed along the alternative cycling route (Figure 7). Morning measurements show overall higher BC concentrations, which is in accordance with the static measurements. Thus, although higher mean BC was observed at intersections, concentrations are not significantly different from the rest of the cycling route. This effect was observed at both routes. However, in the afternoon, the influence of intersections at the main cycling route became significant (t-test, p = 0.01 at 0.05 significance level). Intersections at the alternative route, on the other hand, are much smaller with lower traffic density, which results in smaller influence of intersections.
Taking into account the length/exposure ratio of the main and alternative route, the results imply that the main parameter affecting the inhalation exposure is in fact the number of intersections at which cyclists have to stop, which not only increases the total concentration to which they are exposed, but also increases duration of exposure. The number of street intersections along the cycling route thus directly influence the cyclists’ exposure and should be reduced when planning cycling routes in urban areas.
4. Conclusions
The measurements in an urban environment, impacted by traffic and biomass burning have shown, that primary traffic air pollution, and black carbon in particular, impact the exposure of cyclists significantly. Results imply that the planning of cycling routes should aim for larger distances between cycling routes and motorized traffic, should take into account the number of intersections and consider at the same time exposure/distance trade-offs.
A combination of stationary and mobile measurements has provided important information regarding black carbon sources, the impact of atmospheric conditions and implication for the inhalation exposure of cyclists. We positioned the background measurement site A between the two traffic sites K4 and B. All three sites were along the main street through the city and were directly or indirectly impacted by the same traffic. The measuring sites A and B differ only in the distance from the road. Site A is 20 m from the road, while site B is less than 2 m from the road. Using the aethalometer source apportionment model, we have shown that BC from biomass burning presents a homogeneous background onto which local contributions from traffic are overlaid. The traffic contribution is related to the diesel traffic density and falls rapidly with the distance from the street.
Mobile measurements along the existing main cycling route and the proposed alternative one showed that the impact of traffic is limited primarily to the vicinity of the source of pollution, especially intersections with accelerating vehicles, while the impact diminishes already some 10 m away from traffic roads, with up to ten-times smaller BC concentrations.
We show that the proximity of cycling routes to dense traffic and a large number of intersections of motorized traffic should be avoided when planning the cycling routes in cities. Planning cycling routes some ten or even 100 m away from the main traffic roads to routes, where traffic is significantly lighter, reduces the inhalation exposure of cyclists by a significant amount in case traveling distance remains similar. Our results show that motorized traffic and cycling routes should be separated, and their management should be planned together. Local urban management should, at the same time, focus on the reduction of traffic-related air pollution, which becomes especially important during stable atmospheric conditions. The number of street intersections along the cycling routes should be reduced when planning cycling routes in urban areas to reduce cyclists’ exposure to air pollution.
Acknowledgments
This research was partly supported by the Republic of Slovenia—Ministry of Education, Science and Sport, European Commission—European Social Found and Public Scholarship, Development, Disability and Maintenance Found of the Republic of Slovenia through the project “BlackBycicle”. The research was also partly supported by the Municipality of Celje, company Aerosol, d.o.o. and the Faculty of Logistics, University of Maribor.
Author Contributions
Borut Jereb, Luka Herman, Gregor Šipek, Špela Kovše and Griša Močnik conceived, designed and performed the experiments; Asta Gregorič, Tanja Batkovič and Borut Jereb analyzed the data; Asta Gregorič, Griša Močnik and Borut Jereb wrote the paper.
Conflicts of Interest
At the time of the research, Asta Gregorič and Griša Močnik were also employed by the manufacturer of the Aethalometer instruments, used to measure black carbon. Other authors declare no conflict of interest. The funding sponsors had no role in the design of the study; in the collection, analyses, or interpretation of data; in the writing of the manuscript, and in the decision to publish the results.
References
- World Health Organization (WHO). Health Effects of Black Carbon; The WHO European Centre for Environment and Health: Bonn, Germany, 2012; p. 86. [Google Scholar]
- Janssen, N.A.; Hoek, G.; Simic-Lawson, M.; Fischer, P.; van Bree, L.; ten Brink, H.; Keuken, M.; Atkinson, R.W.; Anderson, H.R.; Brunekreef, B.; et al. Black carbon as an additional indicator of the adverse health effects of airborne particles compared with PM10 and PM2.5. Environ. Health Perspect. 2011, 119, 1691–1699. [Google Scholar] [CrossRef] [PubMed]
- Morawska, L.; Ristovski, Z.; Jayaratne, E.R.; Keogh, D.U.; Ling, X. Ambient nano and ultrafine particles from motor vehicle emissions: Characteristics, ambient processing and implications on human exposure. Atmos. Environ. 2008, 42, 8113–8138. [Google Scholar] [CrossRef] [Green Version]
- Marshall, J.D.; McKone, T.E.; Deakin, E.; Nazaroff, W.W. Inhalation of motor vehicle emissions: Effects of urban population and land area. Atmos. Environ. 2005, 39, 283–295. [Google Scholar] [CrossRef]
- Klems, J.P.; Pennington, M.R.; Zordan, C.A.; Johnston, M.V. Ultrafine particles near a roadway intersection: Origin and apportionment of fast changes in concentration. Environ. Sci. Technol. 2010, 44, 7903–7907. [Google Scholar] [CrossRef] [PubMed]
- Choi, W.; Hu, S.; He, M.; Kozawa, K.; Mara, S.; Winer, A.M.; Paulson, S.E. Neighborhood-scale air quality impacts of emissions from motor vehicles and aircraft. Atmos. Environ. 2013, 80, 310–321. [Google Scholar] [CrossRef]
- Choi, W.; Ranasinghe, D.; Bunavage, K.; DeShazo, J.R.; Wu, L.; Seguel, R.; Winer, A.M.; Paulson, S.E. The effects of the built environment, traffic patterns, and micrometeorology on street level ultrafine particle concentrations at a block scale: Results from multiple urban sites. Sci. Total Environ. 2016, 553, 474–485. [Google Scholar] [CrossRef] [PubMed]
- Menghini, G.; Carrasco, N.; Schüssler, N.; Axhausen, K.W. Route choice of cyclists in Zurich. Transp. Res. Part A Policy Pract. 2010, 44, 754–765. [Google Scholar] [CrossRef]
- Hood, J.; Sall, E.; Charlton, B. A GPS-based bicycle route choice model for San Francisco, California. Transp. Lett. 2011, 3, 63–75. [Google Scholar] [CrossRef]
- Broach, J.; Dill, J.; Gliebe, J. Where do cyclists ride? A route choice model developed with revealed preference GPS data. Transp. Res. Part A Policy Pract. 2012, 46, 1730–1740. [Google Scholar] [CrossRef]
- Kang, L.; Fricker, J.D. Bicyclist commuters’ choice of on-street versus off-street route segments. Transportation 2013, 40, 887–902. [Google Scholar] [CrossRef]
- Bigazzi, A.Y.; Broach, J.; Dill, J. Bicycle route preference and pollution inhalation dose: Comparing exposure and distance trade-offs. J. Transp. Health 2016, 3, 107–113. [Google Scholar] [CrossRef]
- Broach, J.; Bigazzi, A.Y. Existence and Use of Low-Pollution Route Options for Observed Bicycling Trips. Transp. Res. Rec. J. Transp. Res. Board 2017, 2662, 152–159. [Google Scholar] [CrossRef]
- Rojas-Rueda, D.; de Nazelle, A.; Tainio, M.; Nieuwenhuijsen, M.J. The health risks and benefits of cycling in urban environments compared with car use: Health impact assessment study. BMJ 2011, 343, d4521. [Google Scholar] [CrossRef] [PubMed] [Green Version]
- Jarjour, S.; Jerrett, M.; Westerdahl, D.; de Nazelle, A.; Hanning, C.; Daly, L.; Lipsitt, J.; Balmes, J. Cyclist route choice, traffic-related air pollution, and lung function: A scripted exposure study. Environ. Health 2013, 12, 14. [Google Scholar] [CrossRef] [PubMed]
- Ham, W.; Vijayan, A.; Schulte, N.; Herner, J.D. Commuter exposure to PM2.5, BC, and UFP in six common transport microenvironments in Sacramento, California. Atmos. Environ. 2017, 167, 335–345. [Google Scholar] [CrossRef]
- Cole-Hunter, T.; Jayaratne, R.; Stewart, I.; Hadaway, M.; Morawska, L.; Solomon, C. Utility of an alternative bicycle commute route of lower proximity to motorised traffic in decreasing exposure to ultra-fine particles, respiratory symptoms and airway inflammation—A structured exposure experiment. Environ. Health 2013, 12, 29. [Google Scholar] [CrossRef] [PubMed]
- Lonati, G.; Ozgen, S.; Ripamonti, G.; Signorini, S. Variability of black carbon and ultrafine particle concentration on urban bike routes in a mid-sized city in the Po Valley (northern Italy). Atmosphere 2017, 8, 40. [Google Scholar] [CrossRef]
- Titos, G.; Lyamani, H.; Drinovec, L.; Olmo, F.J.; Močnik, G.; Alados-Arboledas, L. Evaluation of the impact of transportation changes on air quality. Atmos. Environ. 2015, 114, 19–31. [Google Scholar] [CrossRef]
- Pakkanen, T.A.; Kerminen, V.-M.; Ojanen, C.H.; Hillamo, R.E.; Aarnio, P.; Koskentalo, T. Atmospheric black carbon in Helsinki. Atmos. Environ. 2000, 34, 1497–1506. [Google Scholar] [CrossRef]
- Denier van der Gon, H.A.C.; Bergström, R.; Fountoukis, C.; Johansson, C.; Pandis, S.N.; Simpson, D.; Visschedijk, A.J.H. Particulate emissions from residential wood combustion in Europe—Revised estimates and an evaluation. Atmos. Chem. Phys. 2015, 15, 6503–6519. [Google Scholar] [CrossRef] [Green Version]
- Jereb, B.; Čeh, I. Občinski Program Varstva Okolja Mestne Občine Celje 2016–2020; Mestna občina Celje: Celje, Slovenia, 2015. [Google Scholar]
- Jereb, B.; Čeh, I. The effect of traffic management on CO2 production. In MHCL 2017; Zrnić, N.Đ., Kartnig, G., Bošnjak, S., Eds.; Faculty of Mechanical Engineering: Belgrade, Serbia, 2017; pp. 161–164. [Google Scholar]
- Celostna Prometna Strategija Mestne Občine Celje, Celje—Privlačno, Povezano, Dostopno in Varno Mesto (Sustainable Urban Mobility Plan). Mestna občina Celje: Celje, Slovenia, 2017. Available online: https://moc.celje.si/images/Projekti_v_teku/CPS/publikacija-CPS-CE-low-res.pdf (accessed on 14 January 2018).
- Google Earth. Available online: http://earth.google.com/ (accessed on 15 October 2017).
- Sandradewi, J.; Prévôt, A.S.H.; Szidat, S.; Perron, N.; Alfarra, M.R.; Lanz, V.A.; Weingartner, E.; Baltensperger, U. Using aerosol light absorption measurements for the quantitative determination of wood burning and traffic emission contributions to particulate matter. Environ. Sci. Technol. 2008, 42, 3316–3323. [Google Scholar] [CrossRef] [PubMed]
- Schnaiter, M.; Horvath, H.; Möhler, O.; Naumann, K.H.; Saathoff, H.; Schöck, O.W. UV-VIS-NIR spectral optical properties of soot and soot-containing aerosols. J. Aerosol Sci. 2003, 34, 1421–1444. [Google Scholar] [CrossRef]
- Pasquill, F. The estimation of the dispersion of windborne material. Meteorol. Mag. 1961, 90, 33–49. [Google Scholar]
- Wickham, H. ggplot2: Elegant Graphics for Data Analysis; Springer: New York, NY, USA, 2009. [Google Scholar]
- Kahle, D.; Wickham, H. ggmap: Spatial Visualization with ggplot2. R J. 2013, 5, 144–161. [Google Scholar]
- Apte, J.S.; Messier, K.P.; Gani, S.; Brauer, M.; Kirchstetter, T.W.; Lunden, M.M.; Marshall, J.D.; Portier, C.J.; Vermeulen, R.C.H.; Hamburg, S.P. High-Resolution Air Pollution Mapping with Google Street View Cars: Exploiting Big Data. Environ. Sci. Technol. 2017, 51, 6999–7008. [Google Scholar] [CrossRef] [PubMed]
Figure 1.
(a) Location of Slovenia and Celje (marked with red dot). (b) Map of Celje with the highway and main roads (basemap source: © OpenStreetMap). Measurement sites: A—urban background and traffic sites: intersection K4 and site B. Dashed lines represent the existing main (red) and alternative (blue) cycling routes.
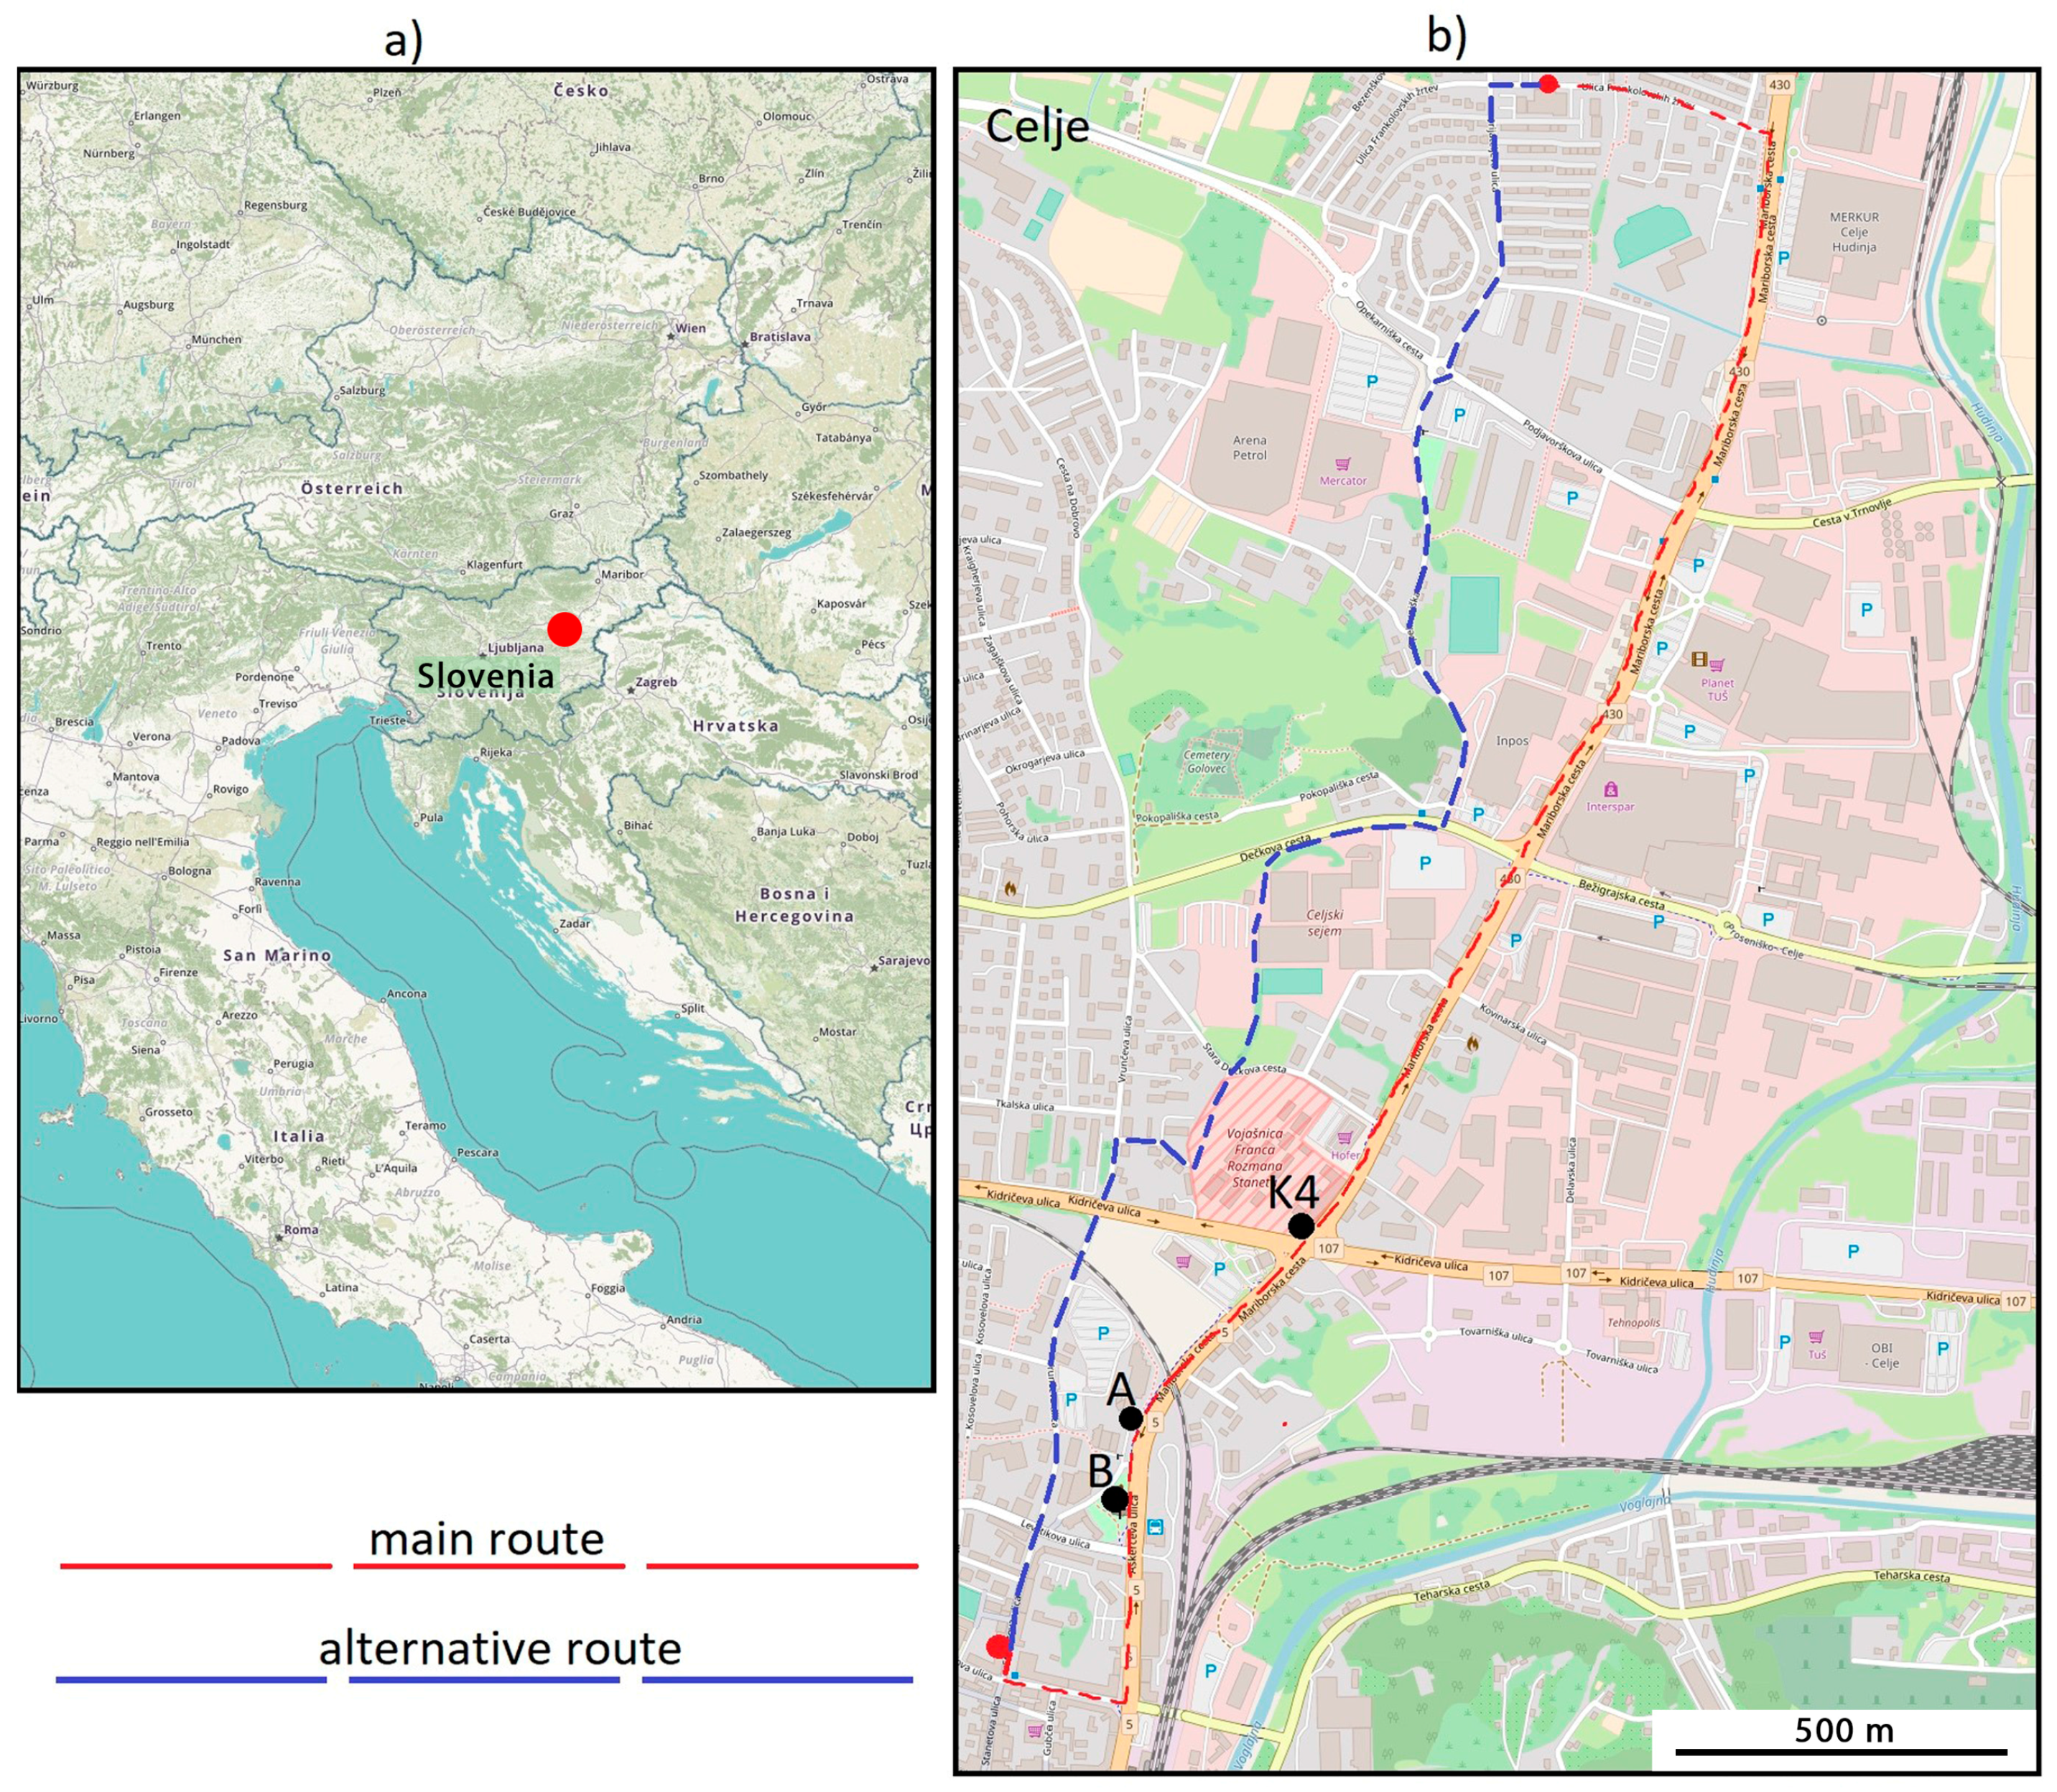
Figure 2.
Elevation (red) and speed (blue) graphs for the existing main (a) and alternative (b) cycling route [25]. Note the opposite cycling direction, marked by the opposite elevation gradient.
Figure 2.
Elevation (red) and speed (blue) graphs for the existing main (a) and alternative (b) cycling route [25]. Note the opposite cycling direction, marked by the opposite elevation gradient.
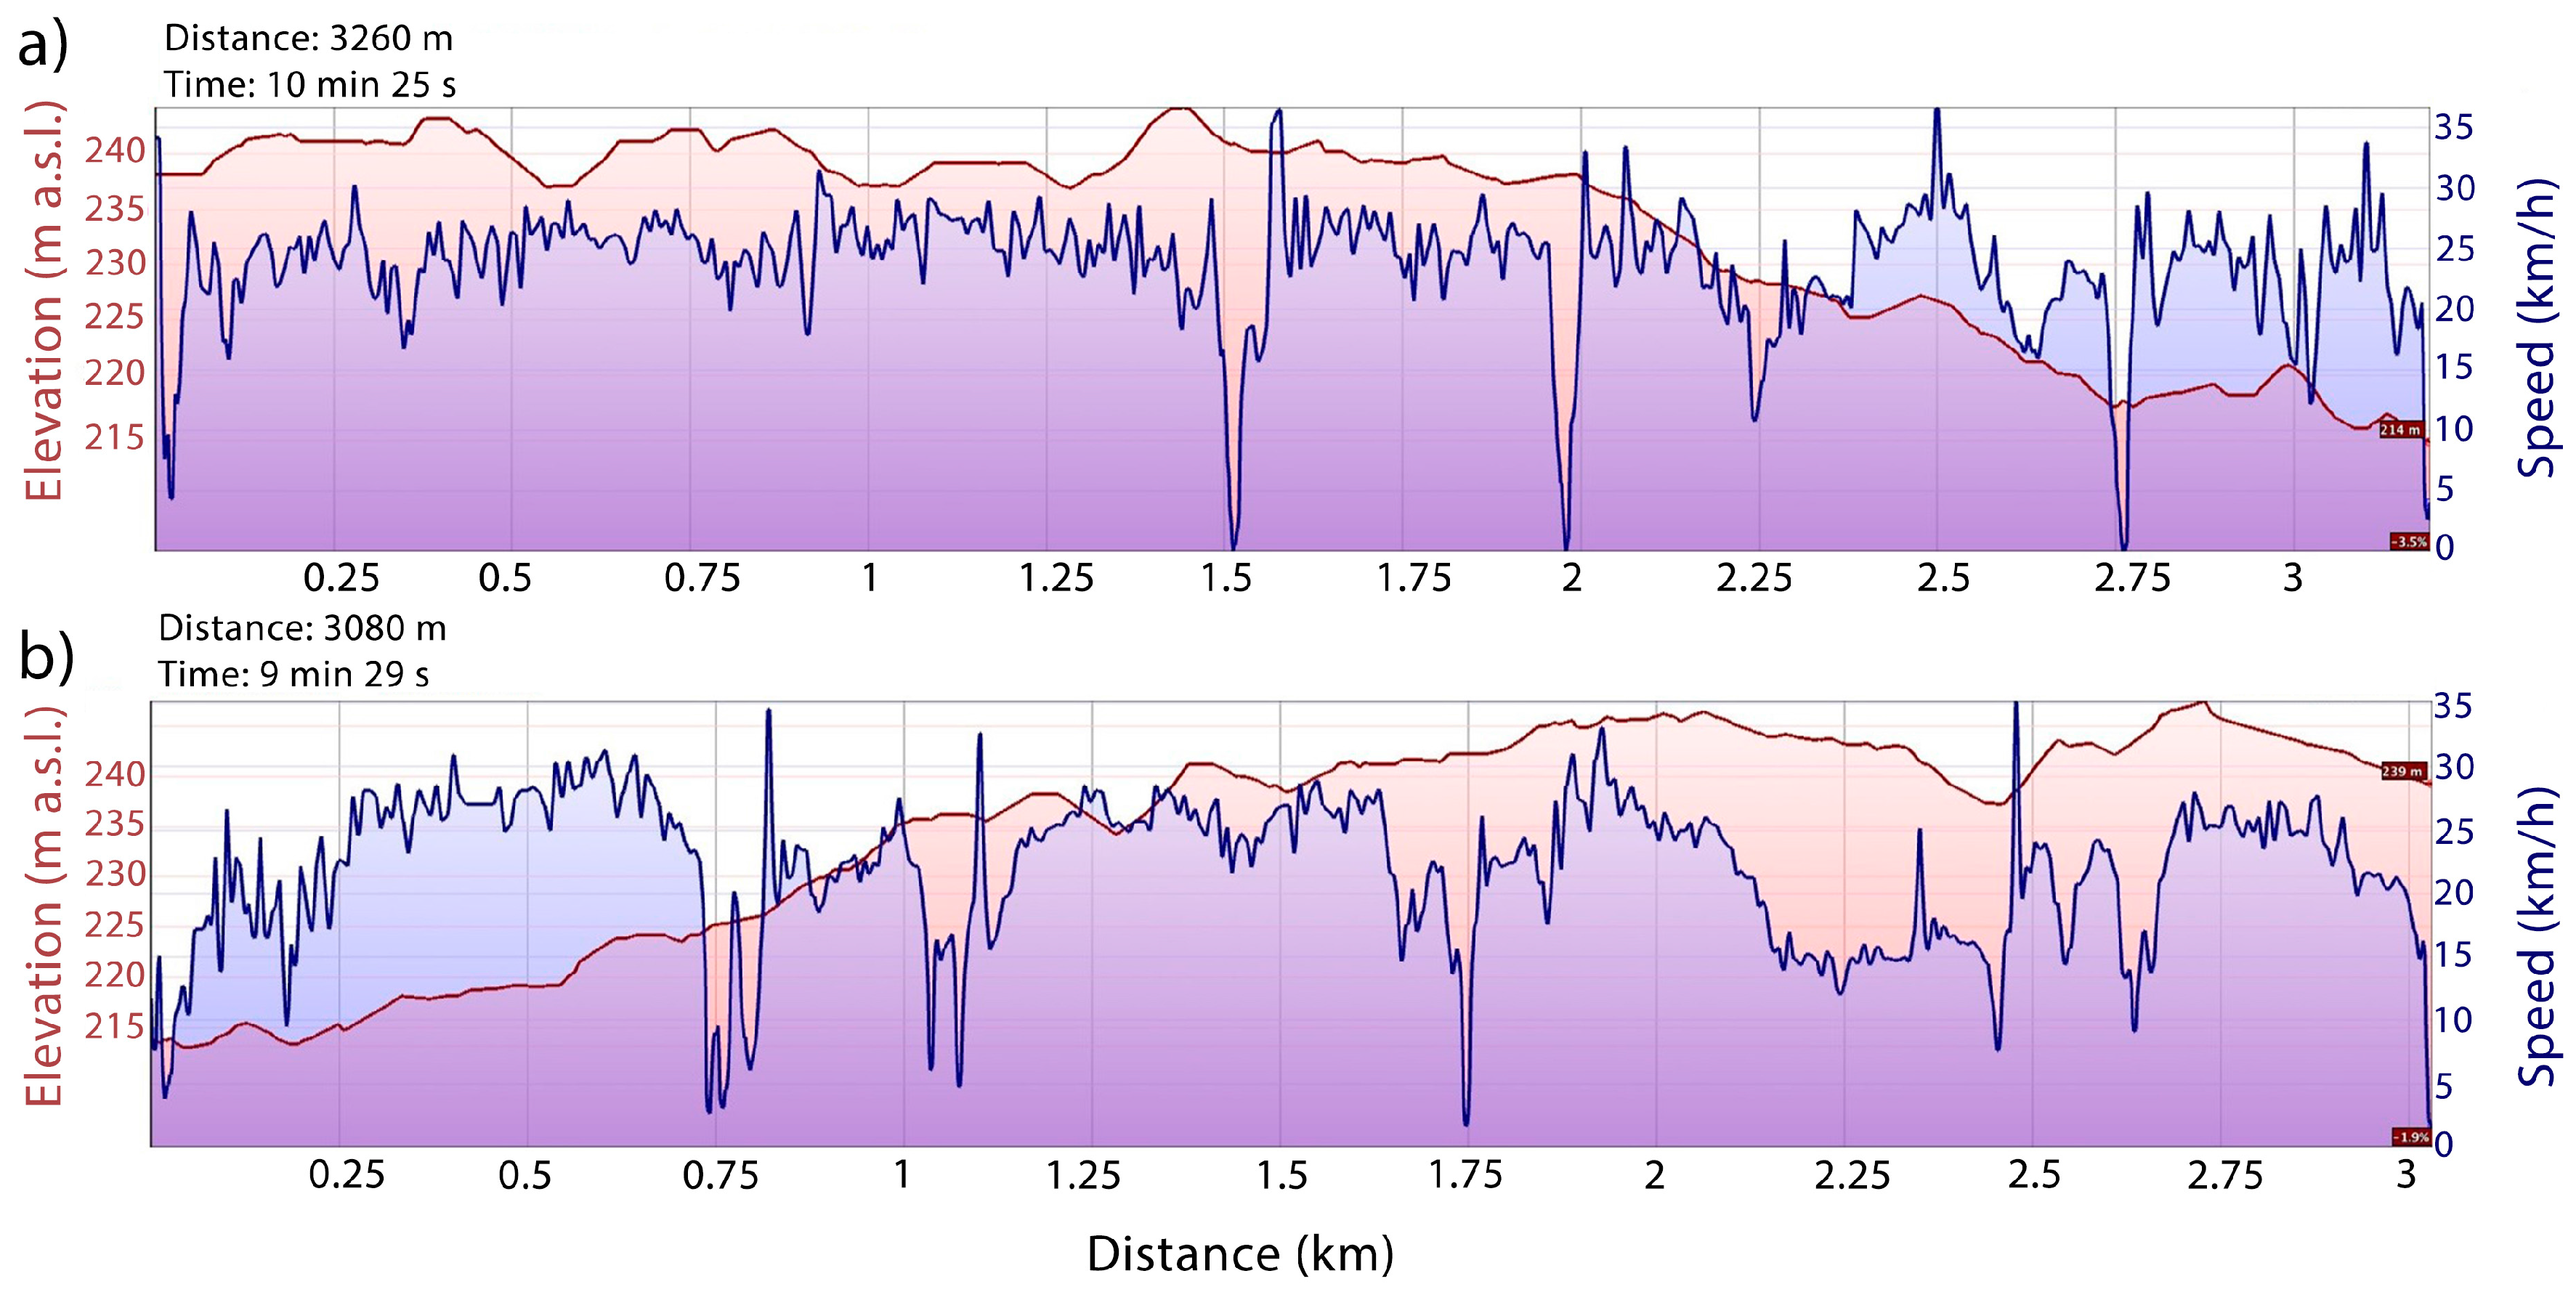
Figure 3.
Distribution of traffic flow for diesel vehicles at measuring points: (a) intersection K4 and (b) site B.
Figure 3.
Distribution of traffic flow for diesel vehicles at measuring points: (a) intersection K4 and (b) site B.
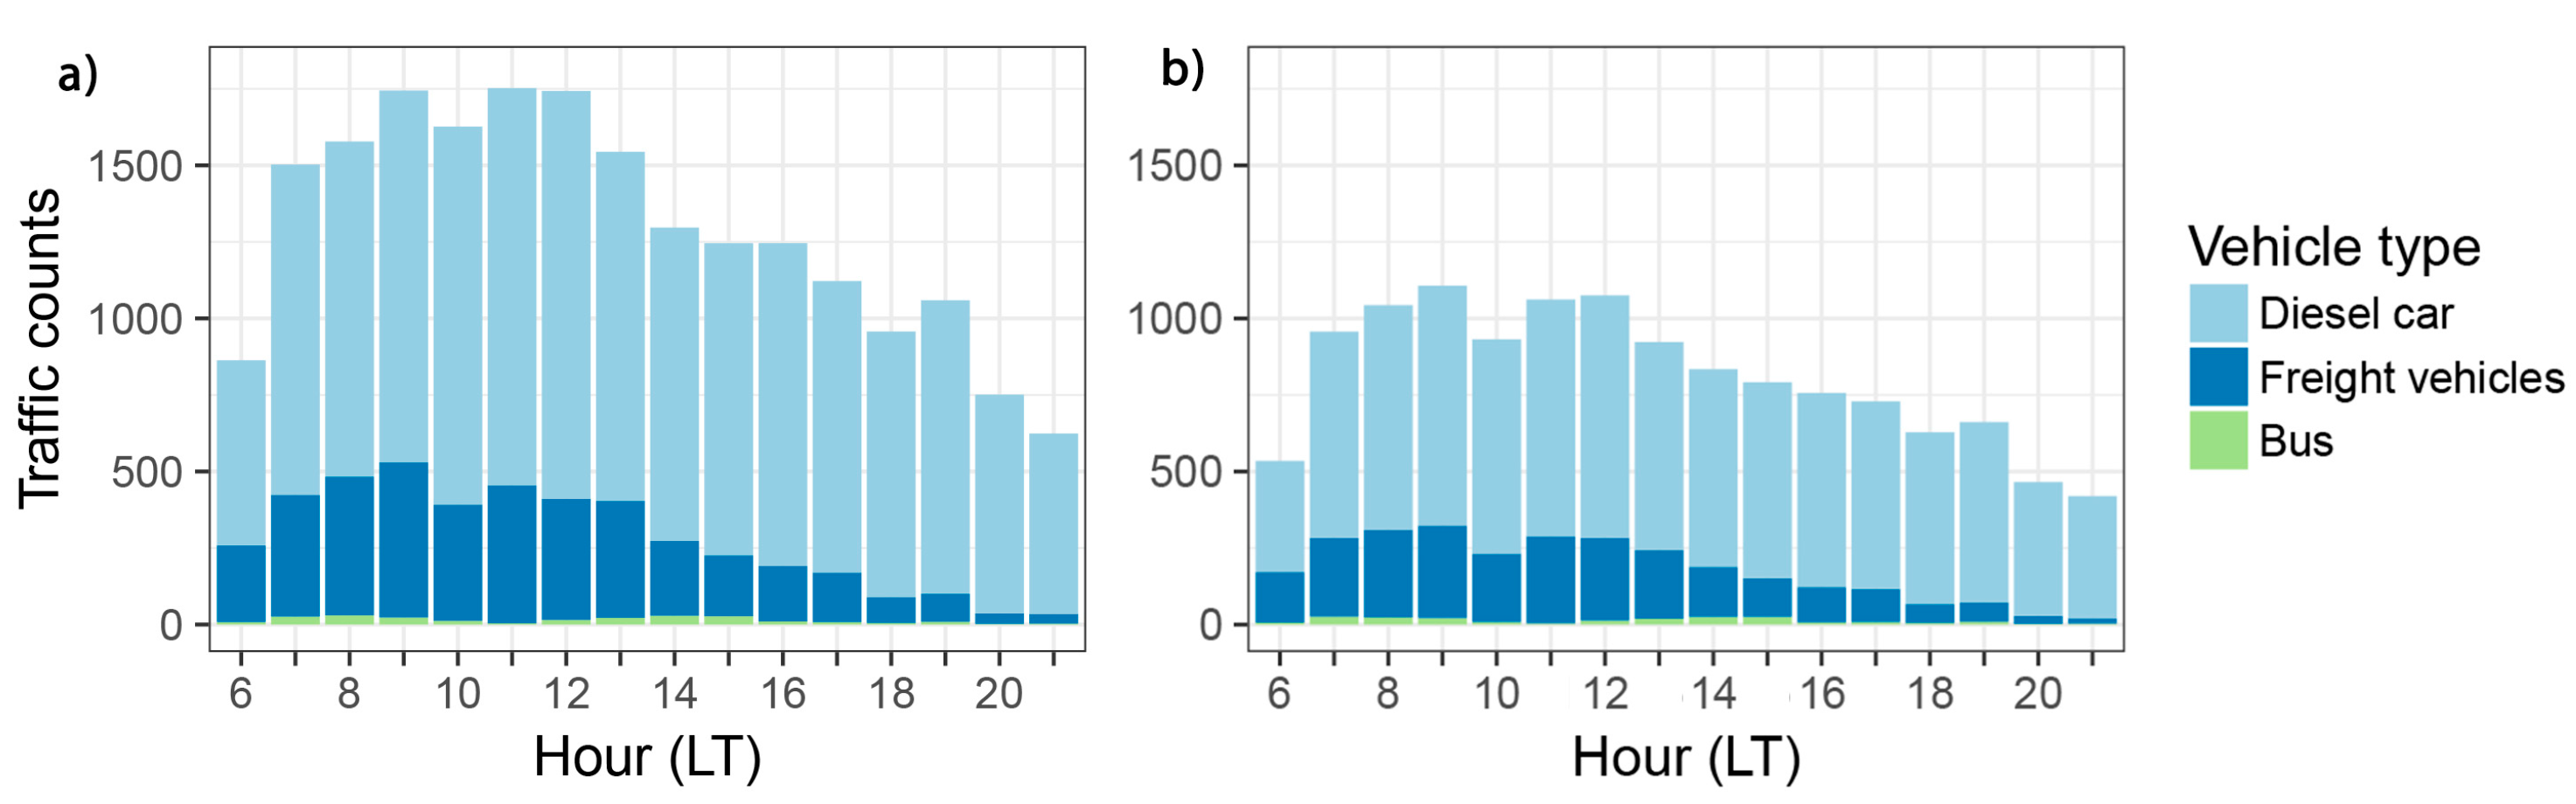
Figure 4.
(a,b) Summary statistics of BC (Black Carbon) concentration measured at site A apportioned to traffic (TR) and biomass burning (BB) presented with box plots for each month separately (a), and grouped in PSQ (Pasquill stability class) stability classes A–G (b); (c) summary statistics of PBL (planetary boundary layer) height (zi) grouped in PSQ stability classes A–G. (box: range between 25th and 75th percentile, central line: median, cross: mean, dots: outliers, upper and lower whiskers represent data within 1.5 × IQR (inter-quartile range) distance).

Figure 5.
Time variation of black carbon (BC) concentration apportioned to traffic (TR) and biomass burning (BB) during two measurement campaigns in March 2017 (a,b) and in April 2017 (c,d), measured simultaneously at the background location—A (a,c) and close to the street intersection K4 (b) and traffic site B (d).

Figure 6.
Diurnal variation (working days) of traffic (TR) and biomass burning (BB) BC concentration at the urban background location (a,c), and at traffic sites: intersection K4 (b) and site B (d) during measurement campaign in March and April 2017. Averages (1 h) are presented as box plots (box: range between 25th and 75th percentile, central line: median, dot: mean, upper and lower whiskers represent data within 1.5 × IQR (inter-quartile range) distance). Daylight duration in the period of measurements is highlighted in yellow. Time is presented in local time (LT). Note the different scales in March and April.
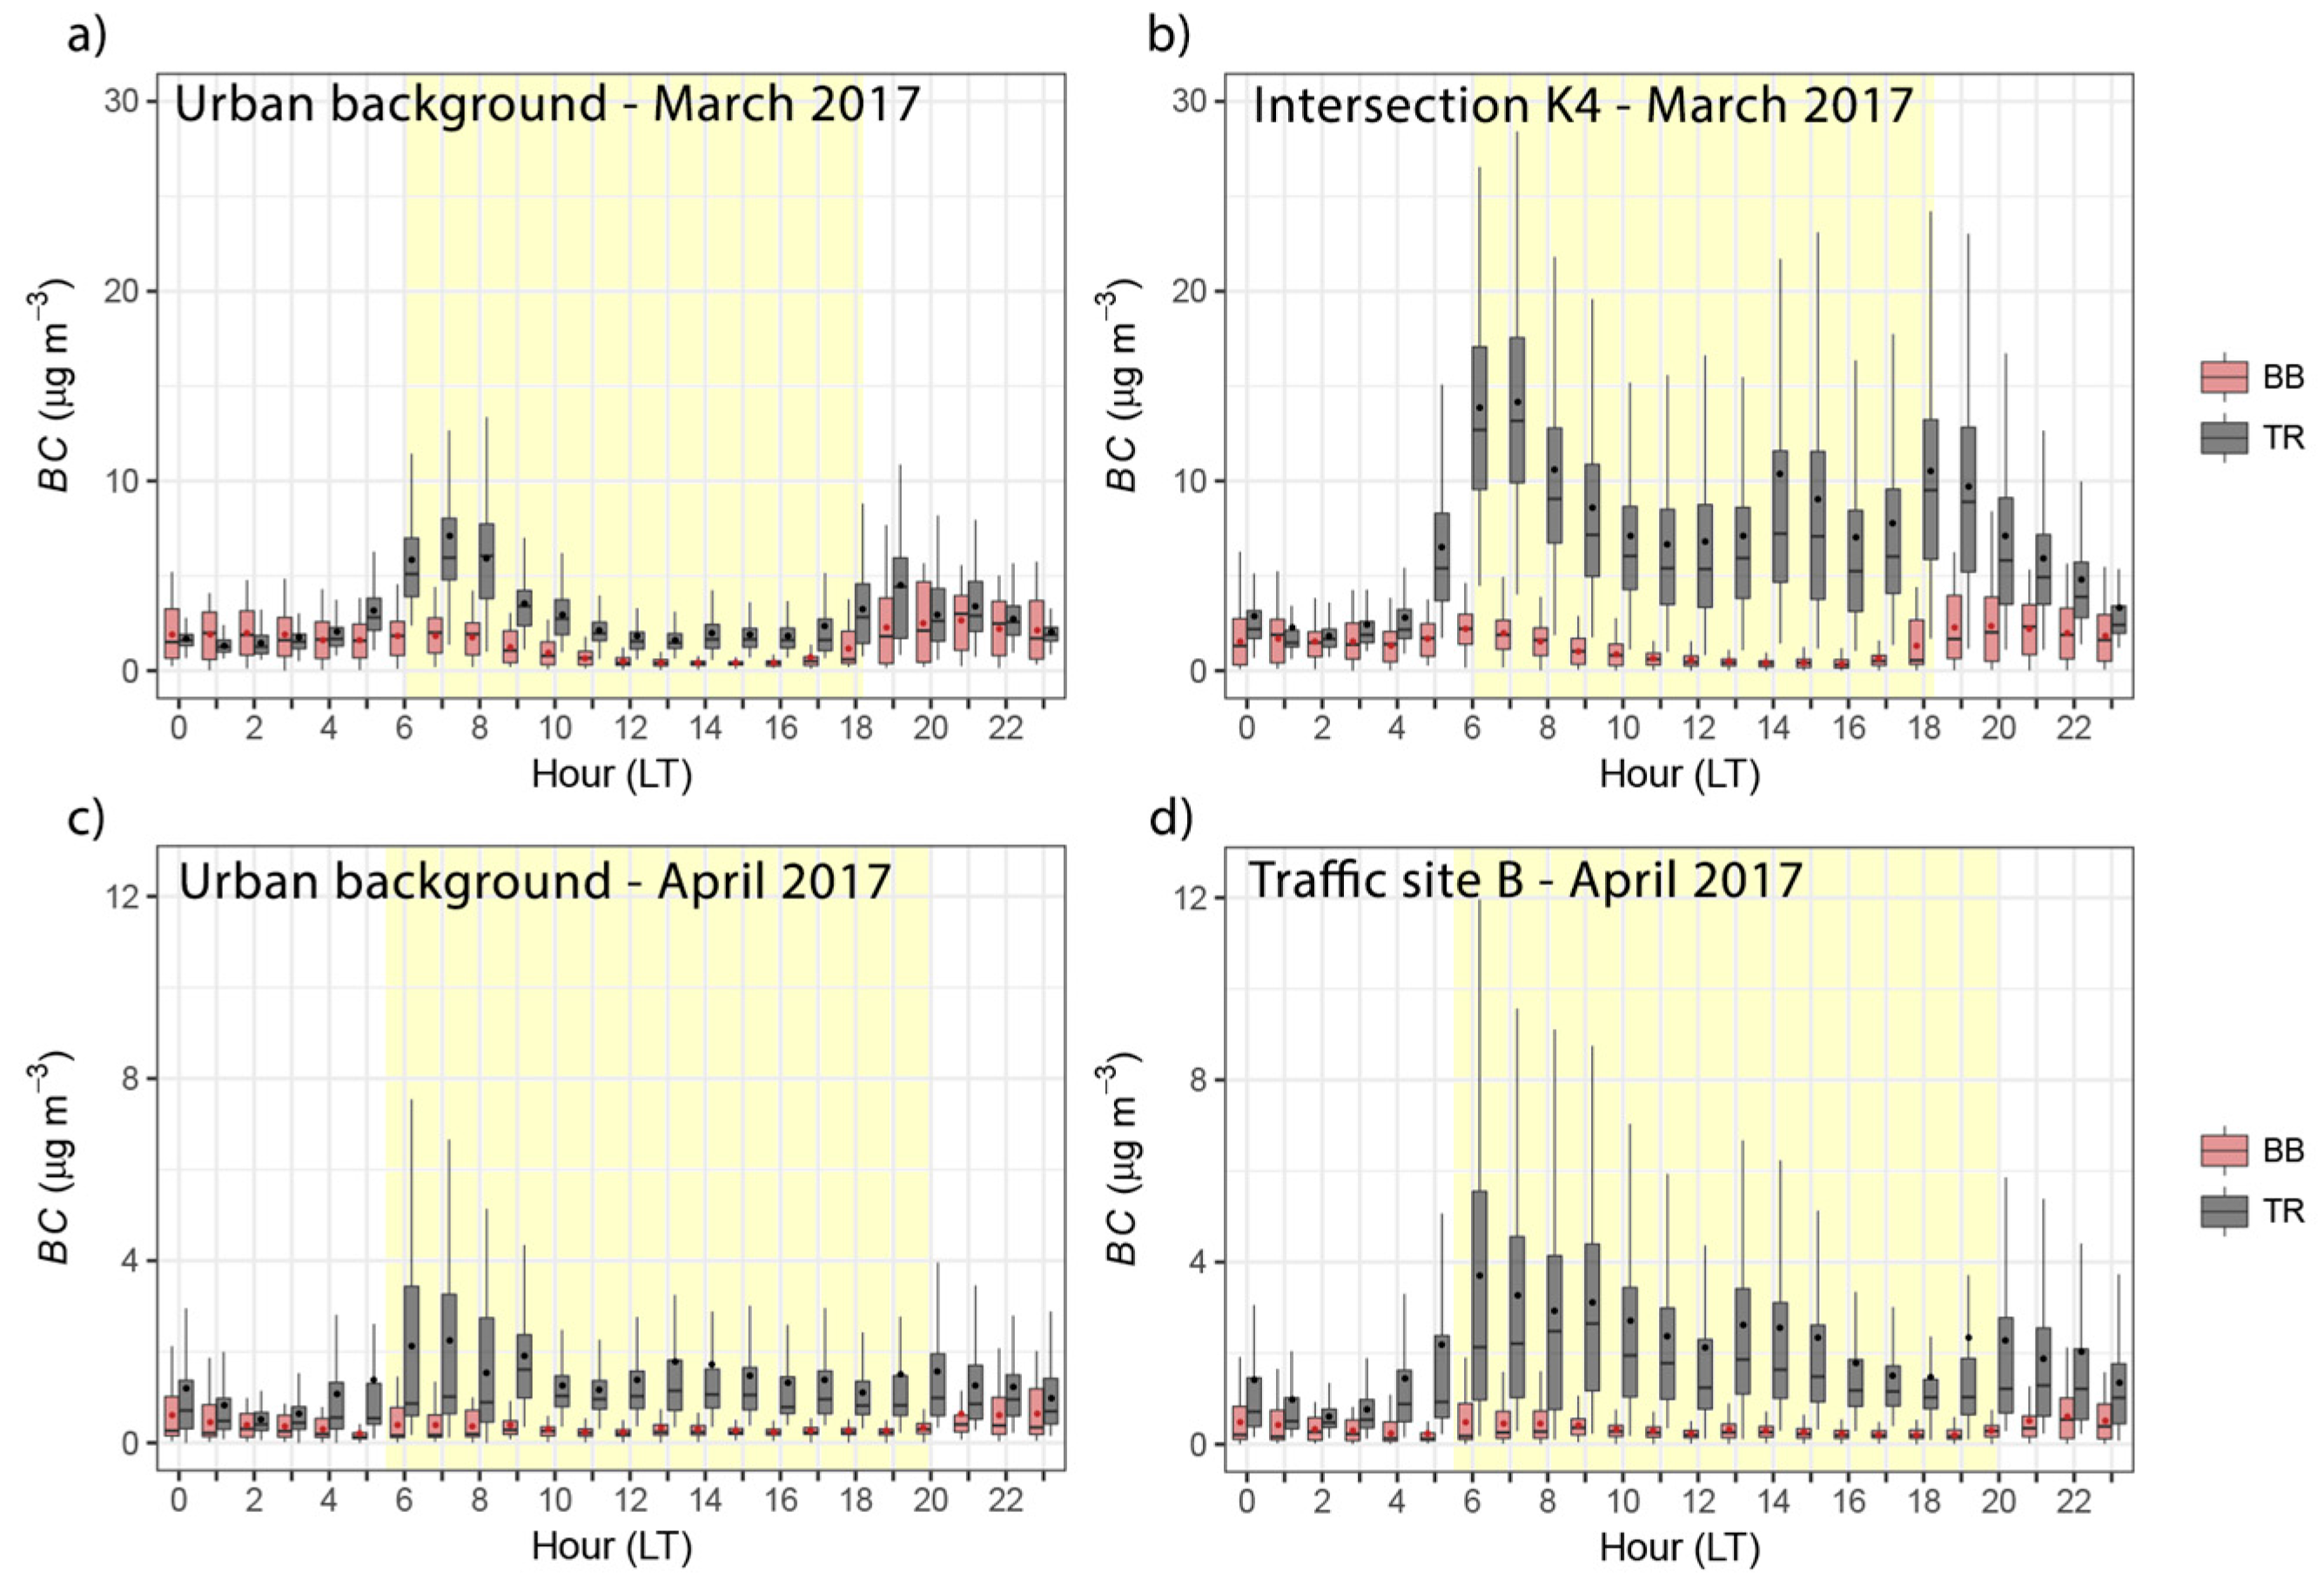
Figure 7.
Mobile measurements of BC concentration following the main and alternative cycling route (Figure 1) during the morning traffic rush hour (a) and in the afternoon (b). BC concentration is presented in color scale (logarithmic).
Figure 7.
Mobile measurements of BC concentration following the main and alternative cycling route (Figure 1) during the morning traffic rush hour (a) and in the afternoon (b). BC concentration is presented in color scale (logarithmic).


Table 1.
Summary (mean ± standard deviation) of BC (Black Carbon) concentration, biomass burning fraction (BB) and air temperature (T) for the first and the second part of measurement campaign at the background site A and for intersections K4 and site B.
Table 1.
Summary (mean ± standard deviation) of BC (Black Carbon) concentration, biomass burning fraction (BB) and air temperature (T) for the first and the second part of measurement campaign at the background site A and for intersections K4 and site B.
| Measurement Site | January–February | March–May | ||||
|---|---|---|---|---|---|---|
| BC (µg m−3) | BB (%) | T (°C) | BC (µg m−3) | BB (%) | T (°C) | |
| A | 6.0 ± 4.6 | 39 ± 18 | 1.1 ± 6.3 | 2.8 ± 2.8 * | 27 ± 15 | 10.7 ± 5.4 |
| A, March | 4.2 ± 2.8 | 30 ± 17 | 11.4 ± 5.6 | |||
| K4, 15–23 March | 7.9 ± 6.3 | 18 ± 16 | ||||
| A, April | 2.0 ± 3.6 | 25 ± 14 | 9.7 ± 4.8 | |||
| B, 20–30 April | 2.6 ± 4.0 | 19 ± 13 | ||||
* Measurement period: 13 March–8 May 2017.
Table 2.
Summary statistics of mobile BC measurements along the main and alternative route. Measurements are grouped to intersection segment (I) and straight segment (S) of the route (N—number of data points, SD—standard deviation).
Table 2.
Summary statistics of mobile BC measurements along the main and alternative route. Measurements are grouped to intersection segment (I) and straight segment (S) of the route (N—number of data points, SD—standard deviation).
| Route | BC (µg m−3) | ||||||
|---|---|---|---|---|---|---|---|
| N | Mean | SD | Min. | Median | Max. | ||
| main | Morning-I | 26 | 6.0 | 4.1 | 2.0 | 4.3 | 17.9 |
| Morning-S | 91 | 6.0 | 5.4 | 1.5 | 4.2 | 35.1 | |
| Morning-all | 117 | 6.0 | 5.1 | 1.5 | 4.2 | 35.1 | |
| Afternoon-I | 17 | 9.0 | 5.2 | 1.6 | 7.8 | 20.3 | |
| Afternoon-S | 61 | 5.7 | 4.5 | 1.7 | 4.4 | 28.2 | |
| Afternoon-all | 78 | 6.4 | 4.9 | 1.6 | 4.9 | 28.2 | |
| alternative | Morning-I | 15 | 4.1 | 2.8 | 1.6 | 3.4 | 13.1 |
| Morning-S | 83 | 5.5 | 5.1 | 1.4 | 3.5 | 24.0 | |
| Morning-all | 98 | 5.3 | 4.8 | 1.4 | 3.4 | 24.0 | |
| Afternoon-I | 19 | 4.8 | 4.6 | 1.1 | 3.3 | 19.4 | |
| Afternoon-S | 72 | 4.4 | 6.3 | 0.9 | 1.8 | 31.5 | |
| Afternoon-all | 91 | 4.5 | 6.0 | 0.9 | 2.0 | 31.5 | |
© 2018 by the authors. Licensee MDPI, Basel, Switzerland. This article is an open access article distributed under the terms and conditions of the Creative Commons Attribution (CC BY) license (http://creativecommons.org/licenses/by/4.0/).
Share and Cite
MDPI and ACS Style
Jereb, B.; Batkovič, T.; Herman, L.; Šipek, G.; Kovše, Š.; Gregorič, A.; Močnik, G. Exposure to Black Carbon during Bicycle Commuting–Alternative Route Selection. Atmosphere 2018, 9, 21. https://doi.org/10.3390/atmos9010021
AMA Style
Jereb B, Batkovič T, Herman L, Šipek G, Kovše Š, Gregorič A, Močnik G. Exposure to Black Carbon during Bicycle Commuting–Alternative Route Selection. Atmosphere. 2018; 9(1):21. https://doi.org/10.3390/atmos9010021
Chicago/Turabian StyleJereb, Borut, Tanja Batkovič, Luka Herman, Gregor Šipek, Špela Kovše, Asta Gregorič, and Griša Močnik. 2018. "Exposure to Black Carbon during Bicycle Commuting–Alternative Route Selection" Atmosphere 9, no. 1: 21. https://doi.org/10.3390/atmos9010021
Note that from the first issue of 2016, this journal uses article numbers instead of page numbers. See further details here.