Article

Diagnosing Changes of Winter NAO in Response to Different Climate Forcings in a Set of Atmosphere-Only Timeslice Experiments

1
Sichuan Province Key Laboratory of Plateau Atmosphere and Environment, College of Atmospheric Sciences, Chengdu University of Information Technology, Chengdu 610225, China
2
Laboratory for Climate Studies &CMA-NJU Joint Laboratory for Climate Prediction Studies, National Climate Center, China Meteorological Administration, Beijing 100081, China
3
Department of Atmospheric Science, School of Environmental Studies, China University of Geoscience, Wuhan 430074, China
4
Met Office Hadley Centre, Exeter EX1 3PB, UK
5
Center for Plateau Atmospheric and Environmental Research, Chengdu University of Information Technology, Chengdu 610225, China
*
Author to whom correspondence should be addressed.
Atmosphere 2018, 9(1), 10; https://doi.org/10.3390/atmos9010010
Submission received: 14 November 2017 / Revised: 31 December 2017 / Accepted: 2 January 2018 / Published: 4 January 2018
(This article belongs to the Section Meteorology)

Abstract

:
Changes of the winter North Atlantic Oscillation (NAO) variability in response to different climate forcings, and their possible causes, are decomposed and investigated using a set of atmosphere-only timeslice experiments forced by sea surface temperature (SST) from coupled runs. The results indicate that the effects of uniform SST warming and direct CO2 radiative forcing could enhance NAO variability, while SST pattern change could lead to large inter-model difference for model simulations. For the influences of uniform SST warming and the direct CO2 radiative effect, the most significant air temperature increases occur at mid-low latitudes instead of northern polar regions, which produces a greater meridional temperature gradient at mid-high latitudes, thus leading to enhanced westerly winds according to the thermal wind theory. The effects of uniform SST warming and CO2 direct radiative forcing could lead to intensification of winter NAO variability, although this result does not consider ocean-atmosphere coupling. The meridional temperature gradient decreases in most areas of the northern Atlantic under the forcing of SST pattern change, but with a larger inter-model uncertainty, which makes the change of winter NAO variability in response to SST pattern change an open issue.

1. Introduction

The North Atlantic Oscillation (NAO) is a major mode of interannual variability, and manifests as a seesaw in atmospheric mass between the subtropical Azores high and the polar Icelandic low, which is most pronounced during boreal winter [1,2]. The NAO is a focus for researchers as it has a great influence on climate change and variability in the mid-latitudes [3]. For example, the distinct phases of NAO have different impacts on precipitation and atmospheric blocking in Europe [4,5]. Further studies showed that the temperature and precipitation variability over East Asia during the period 1948–2009 are connected to the NAO through its influence on the East Asian monsoon and western Pacific subtropical high [6,7].
The components of the climate system in mid-latitudes are complex and various, which makes the understanding of the NAO a frustrating issue. Dong et al. [8] and Gong et al. [9] indicated that both the doubled CO2 concentration compared with 1961–1990 and the increased SST caused by the increased CO2 could induce NAO pattern change, which is associated with the changes of zonal wind, sea level pressure, and temperature [10], but the causation still seems to be uncertain [3,4]. Kelley et al. [4] found that 19 coupled model simulations from the third phase of the Coupled Model Intercomparison project (CMIP3) have differences in the location of the sea level pressure dipoles compared with the observed NAO, and Davini and Cagnazzo [11] demonstrated that some climate models are unable to correctly simulate the physical processes connected to the NAO, including the frequency of high-latitude blocking over Greenland and the related zonal wind anomalies, which may react differently to distinct scenarios of climate change. The Northern Annular Mode (NAM) has been viewed as having relevance to the NAO, both in space and time [12]. Cattiaux and Cassou [13] investigated the NAM change for the 21st century under the A2 scenario compared with 8.5 W/m2 Representative Concentration Pathway (RCP), and found that the ensemble mean of CMIP3 generated a positive NAM trend, while the ensemble mean of CMIP5 projections exhibited a negative result, and the discrepancy could be driven by the faster Arctic sea ice loss in early winter as well as the influence of stronger warming in the western tropical Pacific in CMIP5 relative to the projections in CMIP3, which is consistent with the results from Cattiaux et al. [14].
The comprehensive understanding of the mechanisms of NAO change, particularly under future scenarios, is essential for producing more accurate climate model simulations [15]. Besides the lack of research into physical processes, one of the important reasons for imperfect model simulations is the very limited outputs for investigating cloud-radiation interaction and cloud feedback mechanisms [16].
The Cloud Feedback Model Intercomparison Project (CFMIP) aims to understand how the climate will change under future scenarios, using a number of idealized experiments. The improved assessment of cloud feedbacks combined with decomposed forcings can be helpful for better understanding of physical processes as well as mechanisms behind the changes of NAO variability. In this study, a set of timeslice experiments (pilot versions of CFMIP-3 experiments) is applied to investigate (1) the changes of winter NAO variability under different forcings; and (2) the main reasons leading to the NAO variability changes in response to different forcings. The remainder of this paper is organized as follows. Experimental design including data and methods is introduced in Section 2. Section 3 describes the features of NAO pattern changes in each experiment. In Section 4, the possible mechanisms of NAO variability changes in response to different climate forcings are investigated in detail, and finally the summary and discussions are given in Section 5.

2. Models, Experiments, and Methods

2.1. Modelsand Observational Data

In this study, monthly mean outputs from HadGEM2-ES [17], CCSM4 [18], and CNRM-CM5 [19] from the CFMIP-3 pilot experiments are used (Table 1) to estimate the changes of winter NAO variability under different climate forcings. Since the horizontal resolutions of the models are different, all model data were interpolated into a 1.25° × 1.25° grid for comparison with each other.
The observational sea level pressure (SLP) data for the period 1948–2016 are derived from the National Centers for Environmental Prediction/National Center for Atmospheric Research (NCEP/NCAR).

2.2. Experiments

In Coupled General Circulation Models (CGCMs), quadrupled CO2 will induce SST increases, but this does not show a homogeneous distribution. Instead, the quadrupled CO2 will induce a patterned SST increase, which can be analyzed as a uniform SST warming, combined with the residual SST pattern change and a direct response to CO2 forcing. A set of atmosphere-only experiments is applied in this study to diagnose the changes of winter NAO variability as well as the connected causes in response to different aspects of forcing and SST warming. The experiments are piSST, piSST4K, piSST4 × CO2, and piSSTFuture. The piSST is an atmosphere-only (AGCM) experiment forced with monthly-varying SSTs and sea-ice from a 30-year climatology from the coupled piControl run using pre-industrial forcing. The other experiments are forced with a uniform SST increase of 4K (piSST4k), quadrupled CO2 concentrations (piSST4 × CO2), which is seen only by the radiation scheme, not by vegetation, a patterned SST anomaly (piSSTFuture-piSST4k), and all-forcings AGCM responses (piSSTTot, includes SST changes and the direct CO2 effect). For piSSTFuture, a patterned SST anomaly is applied on top of the monthly-varying piSST SSTs. This anomaly is a monthly climatology of the difference between each model’s own abrupt4 × CO2 and piControl runs (using the mean of years 91–140 of abrupt × CO2, and the parallel 50 years section of piControl), then scaled to have a global mean of 4K. Sea ice is unchanged from piSST for all experiments with HadGEM2 and CCSM4, but is allowed to vary in CNRM-CM5 in response to increased SSTs in piSSTFuture and piSST4K. The experimental designs are shown in Table 2. More details can be found in Chadwick et al. [20] and Webb et al. [21].

2.3. Methods

Since the piSST4K experiment is the same as the piSST experiment except for the imposed globally uniform +4K SST anomaly, the net response to the uniform SST +4K can be extracted by subtracting piSST from piSST4K. Similarly, the influence of the direct radiative effect associated with a quadrupling of atmospheric CO2 can be examined by taking the difference between piSST4 × CO2 and piSST. The NAO response to the SST pattern change can be examined by taking the difference between piSSTFuture and piSST4K. Finally, the total response can be investigated by subtracting piSST from piSSTTot. Note that the direct and SST-mediated CO2 radiative forcings are not tested here and could deserve further analyses given the complex and non-linear atmospheric dynamics of the northern mid-latitudes.
The NAO index (NAOI) is defined as the difference between 35° N and 65° N in the normalized monthly SLP zonal-averaged over the North Atlantic region from 80° W to 30° E [22], for each experiment’s climatology. In this study, the boreal winter mean time series of NAOI is used.

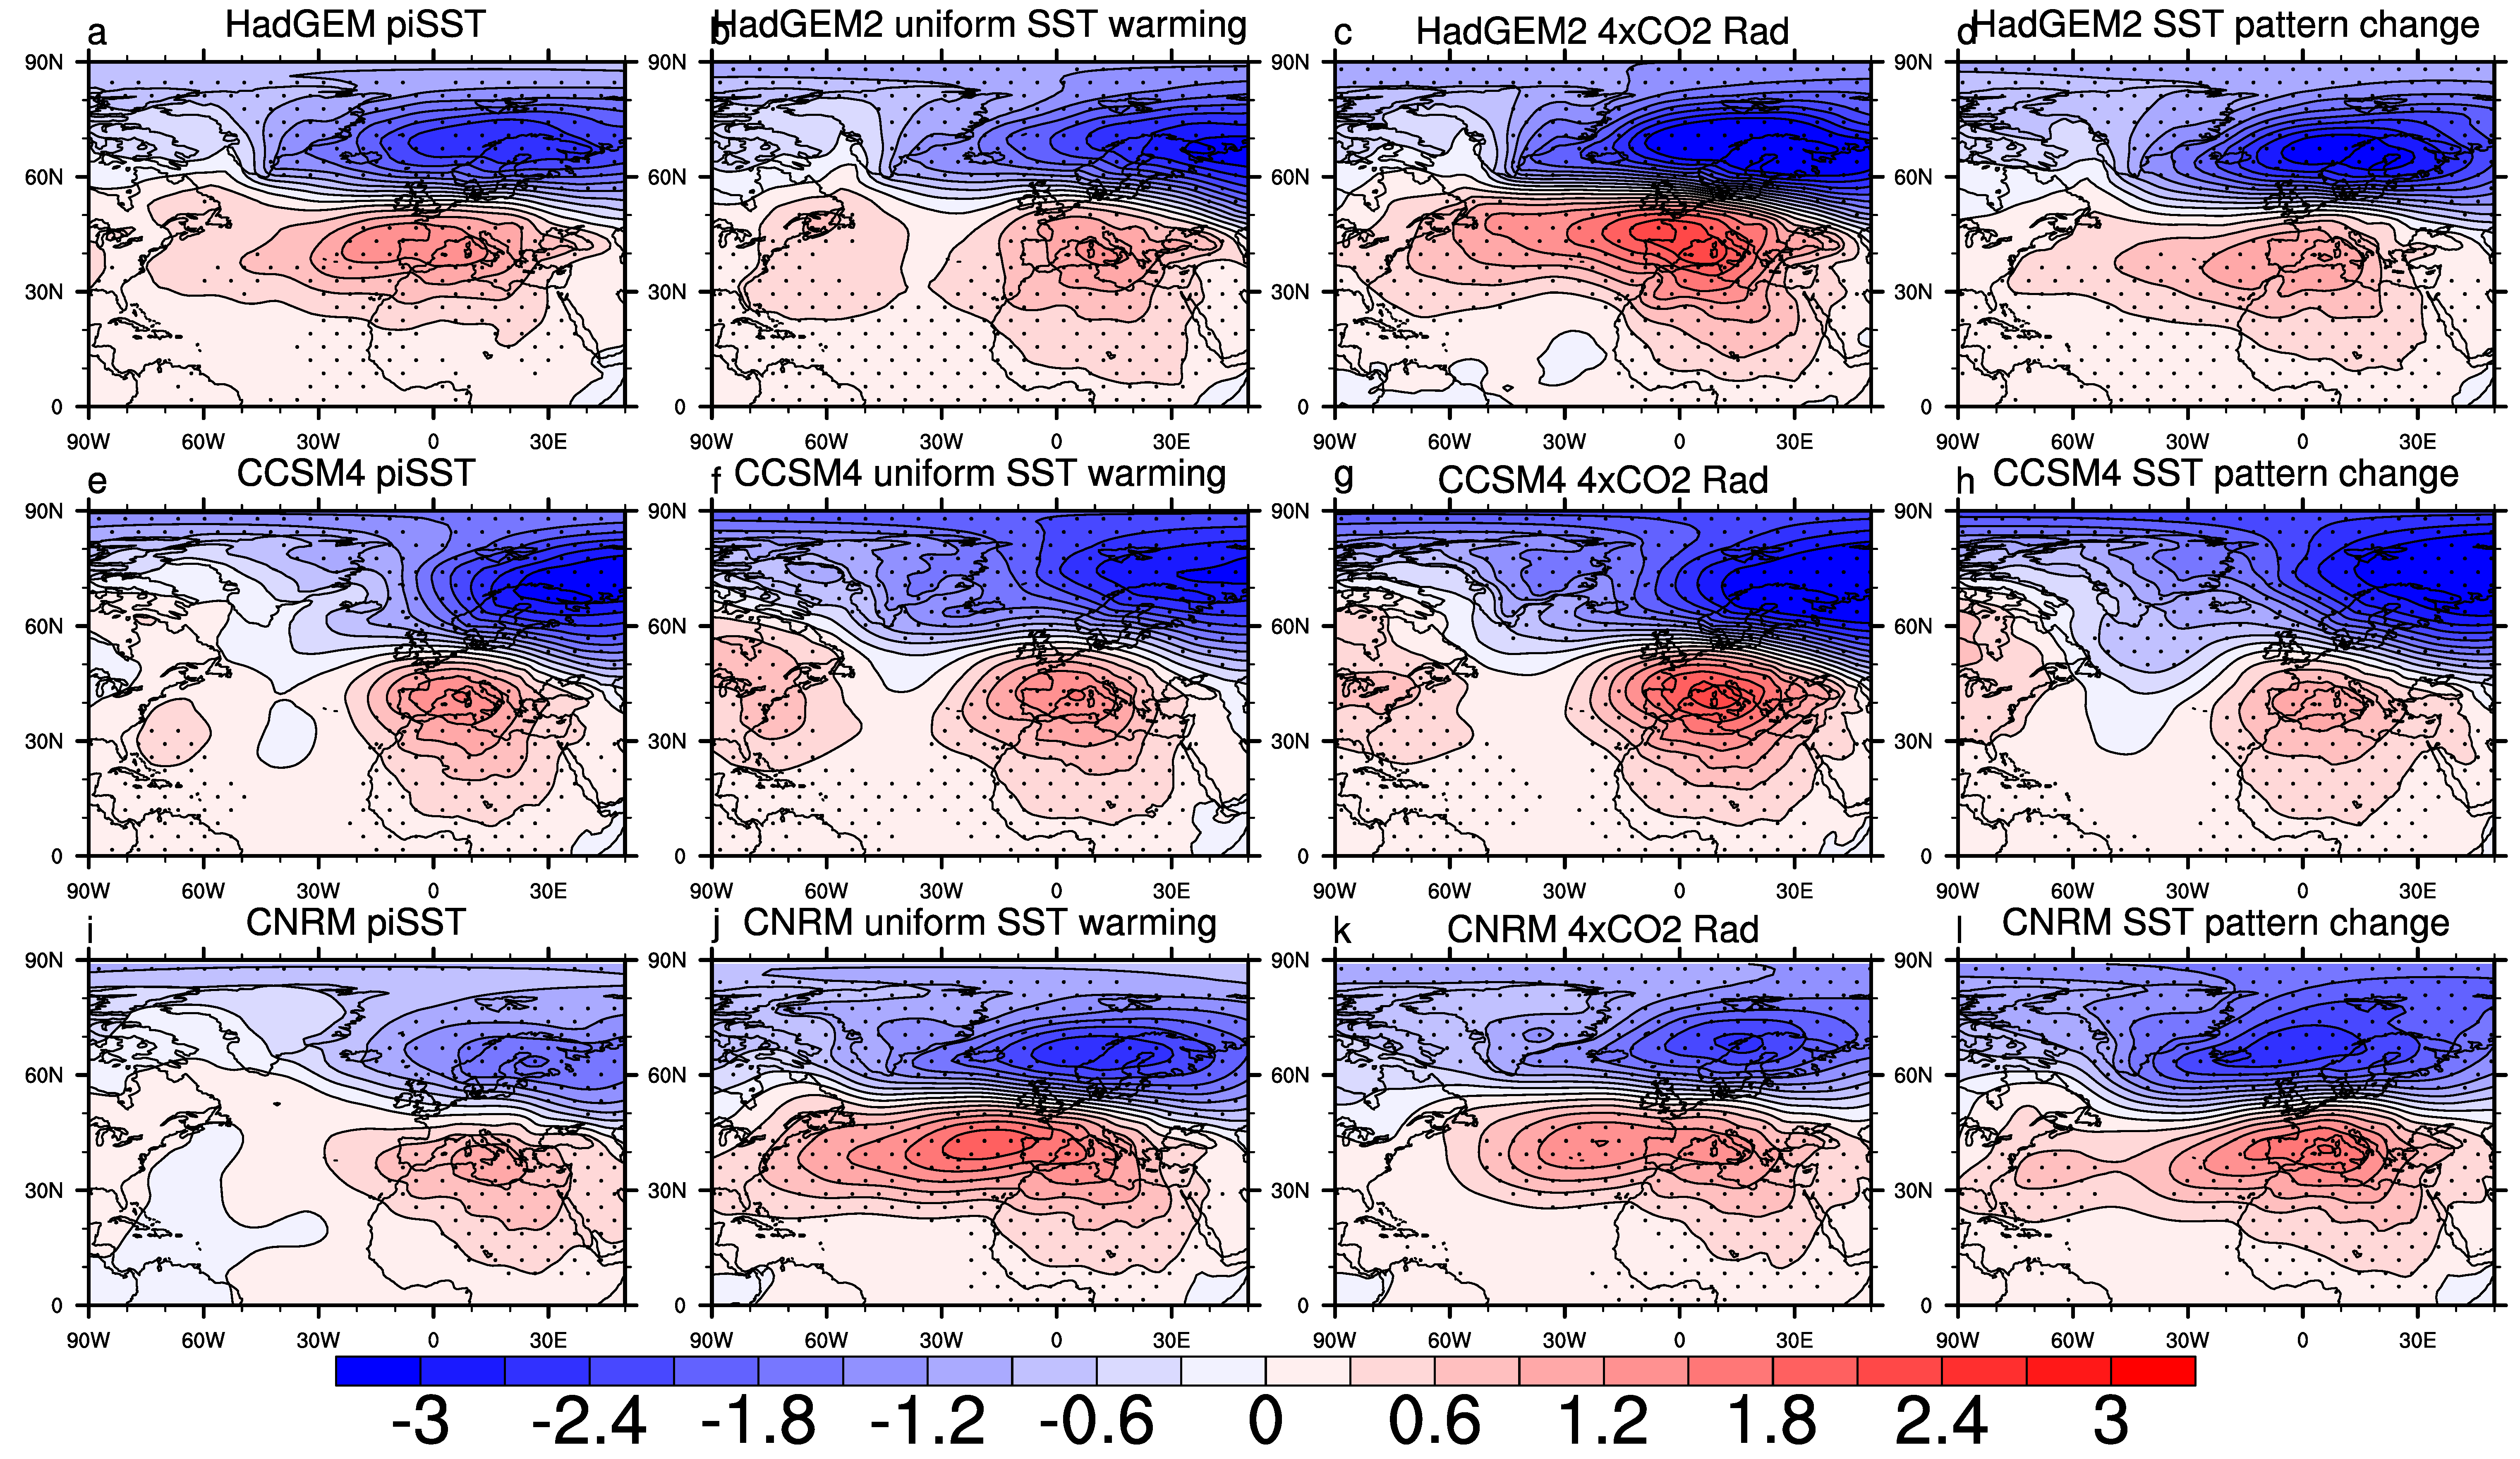
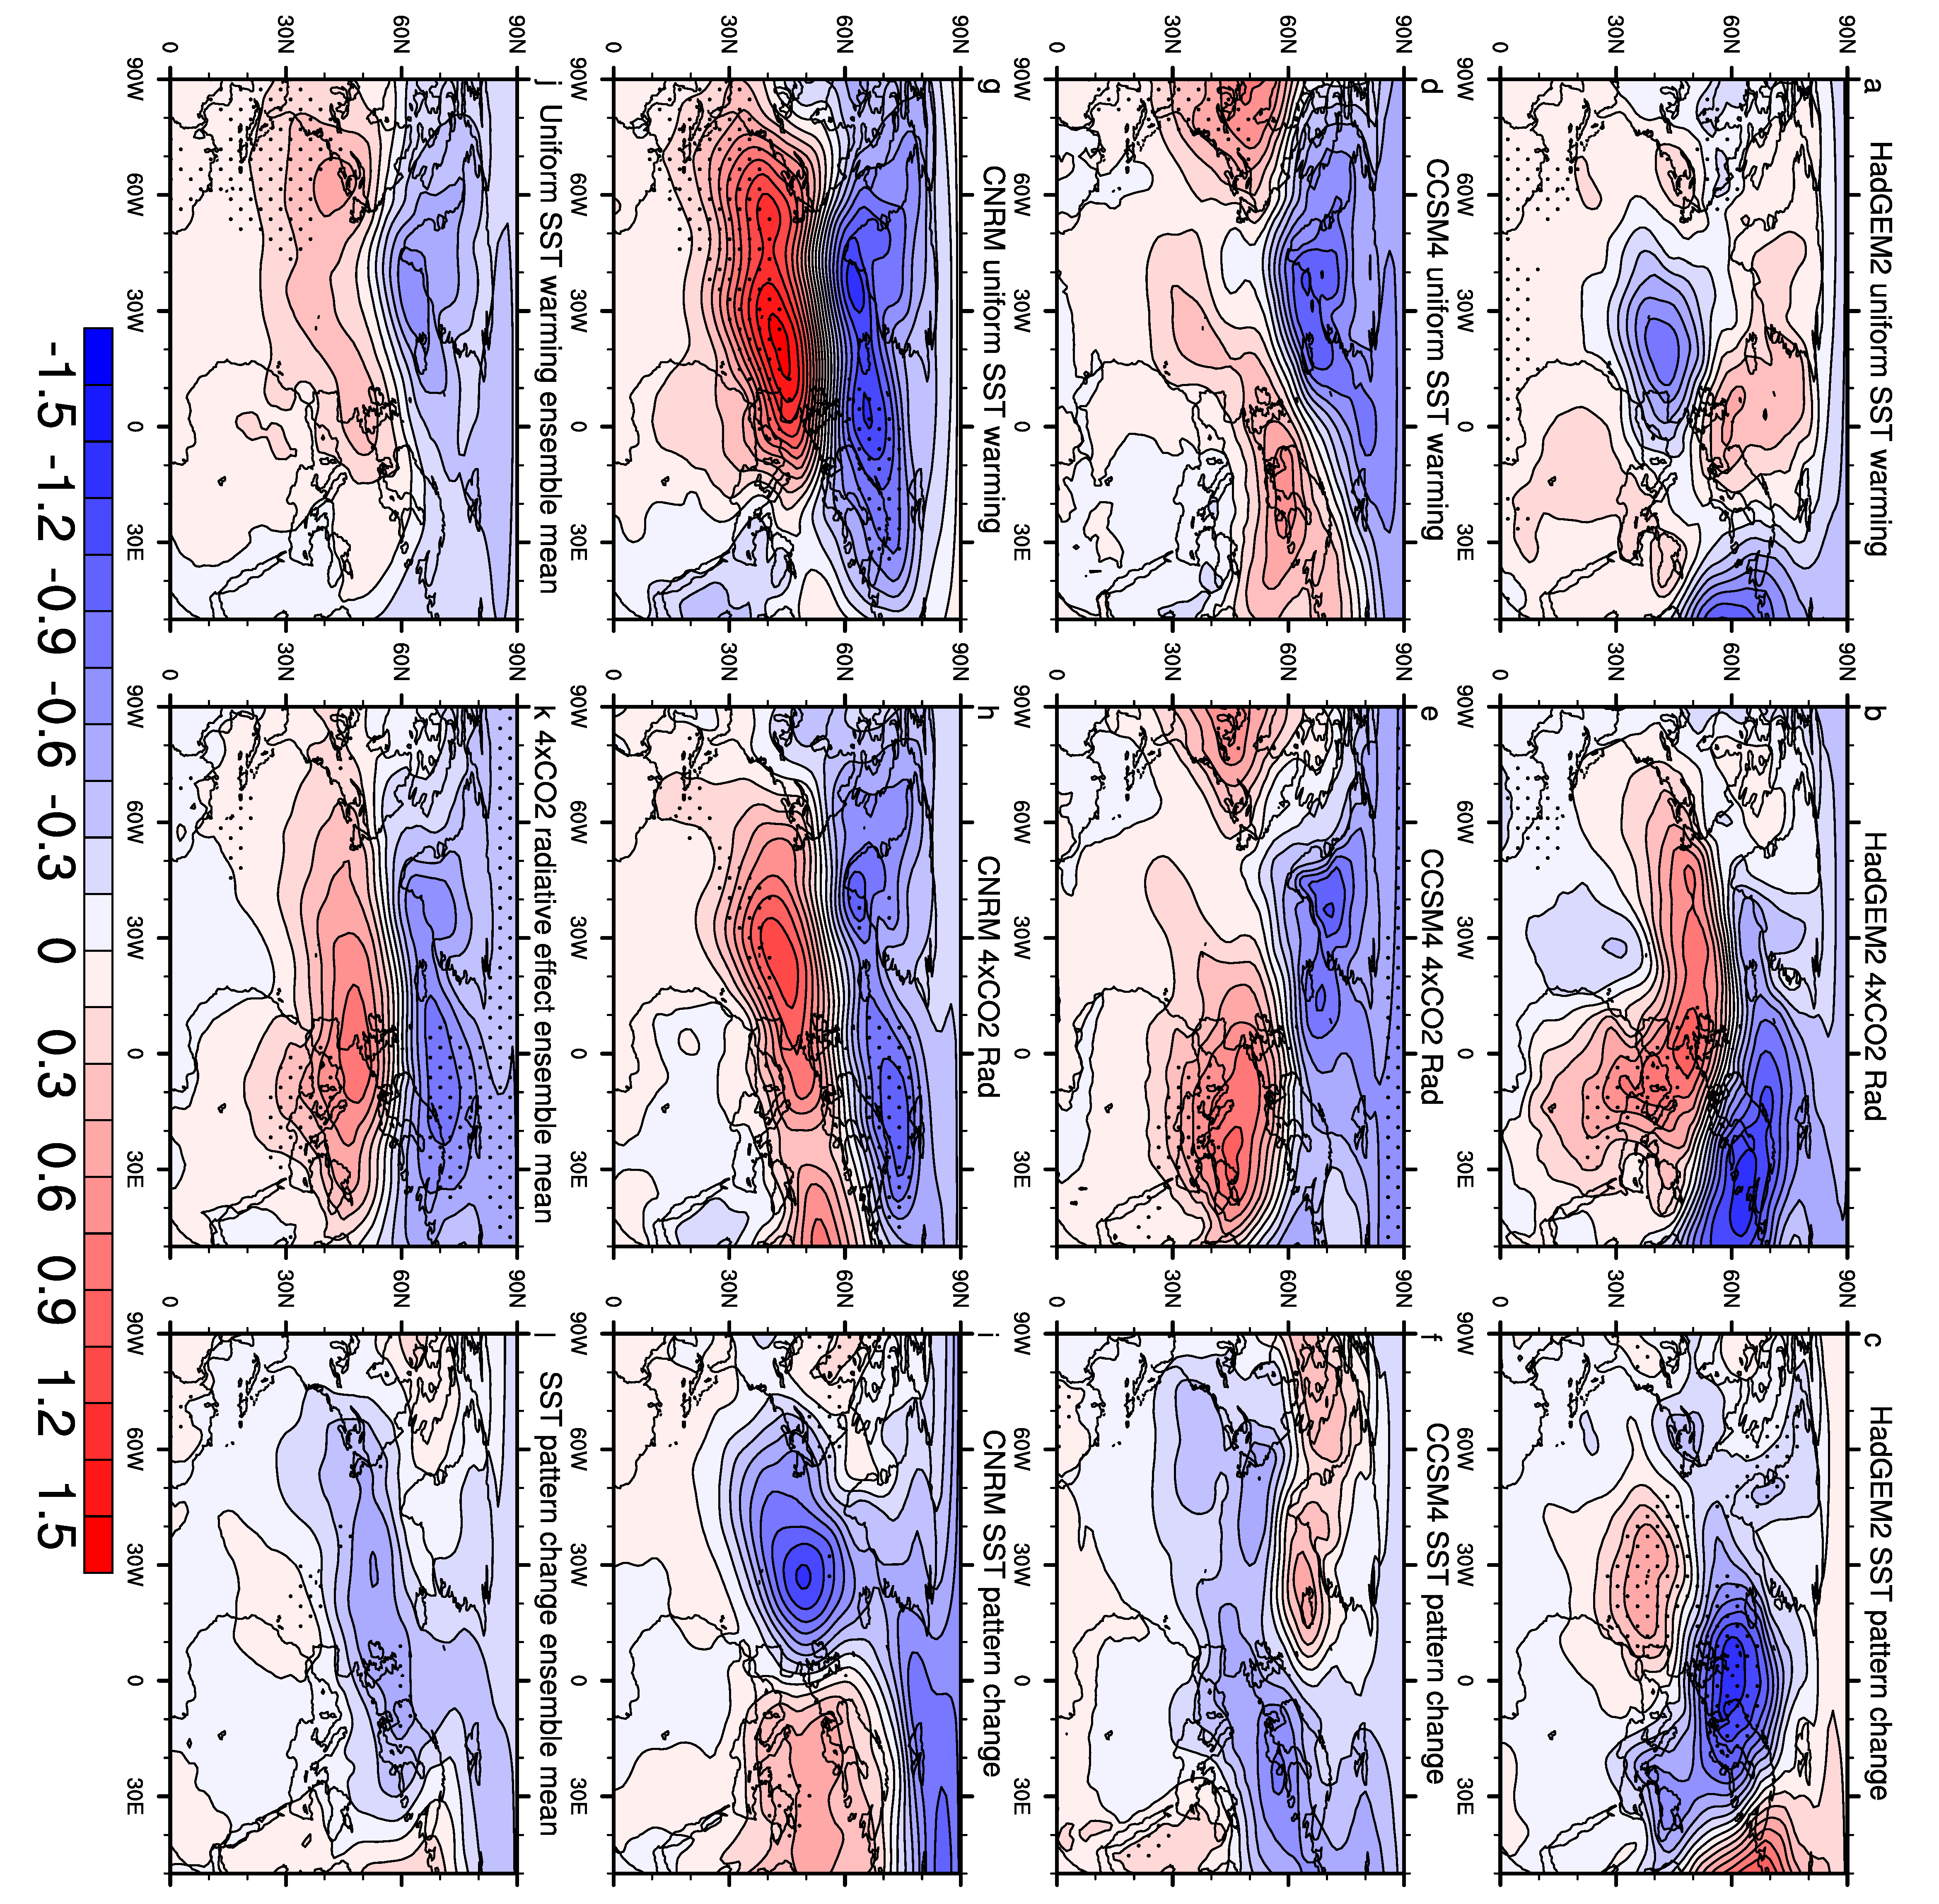
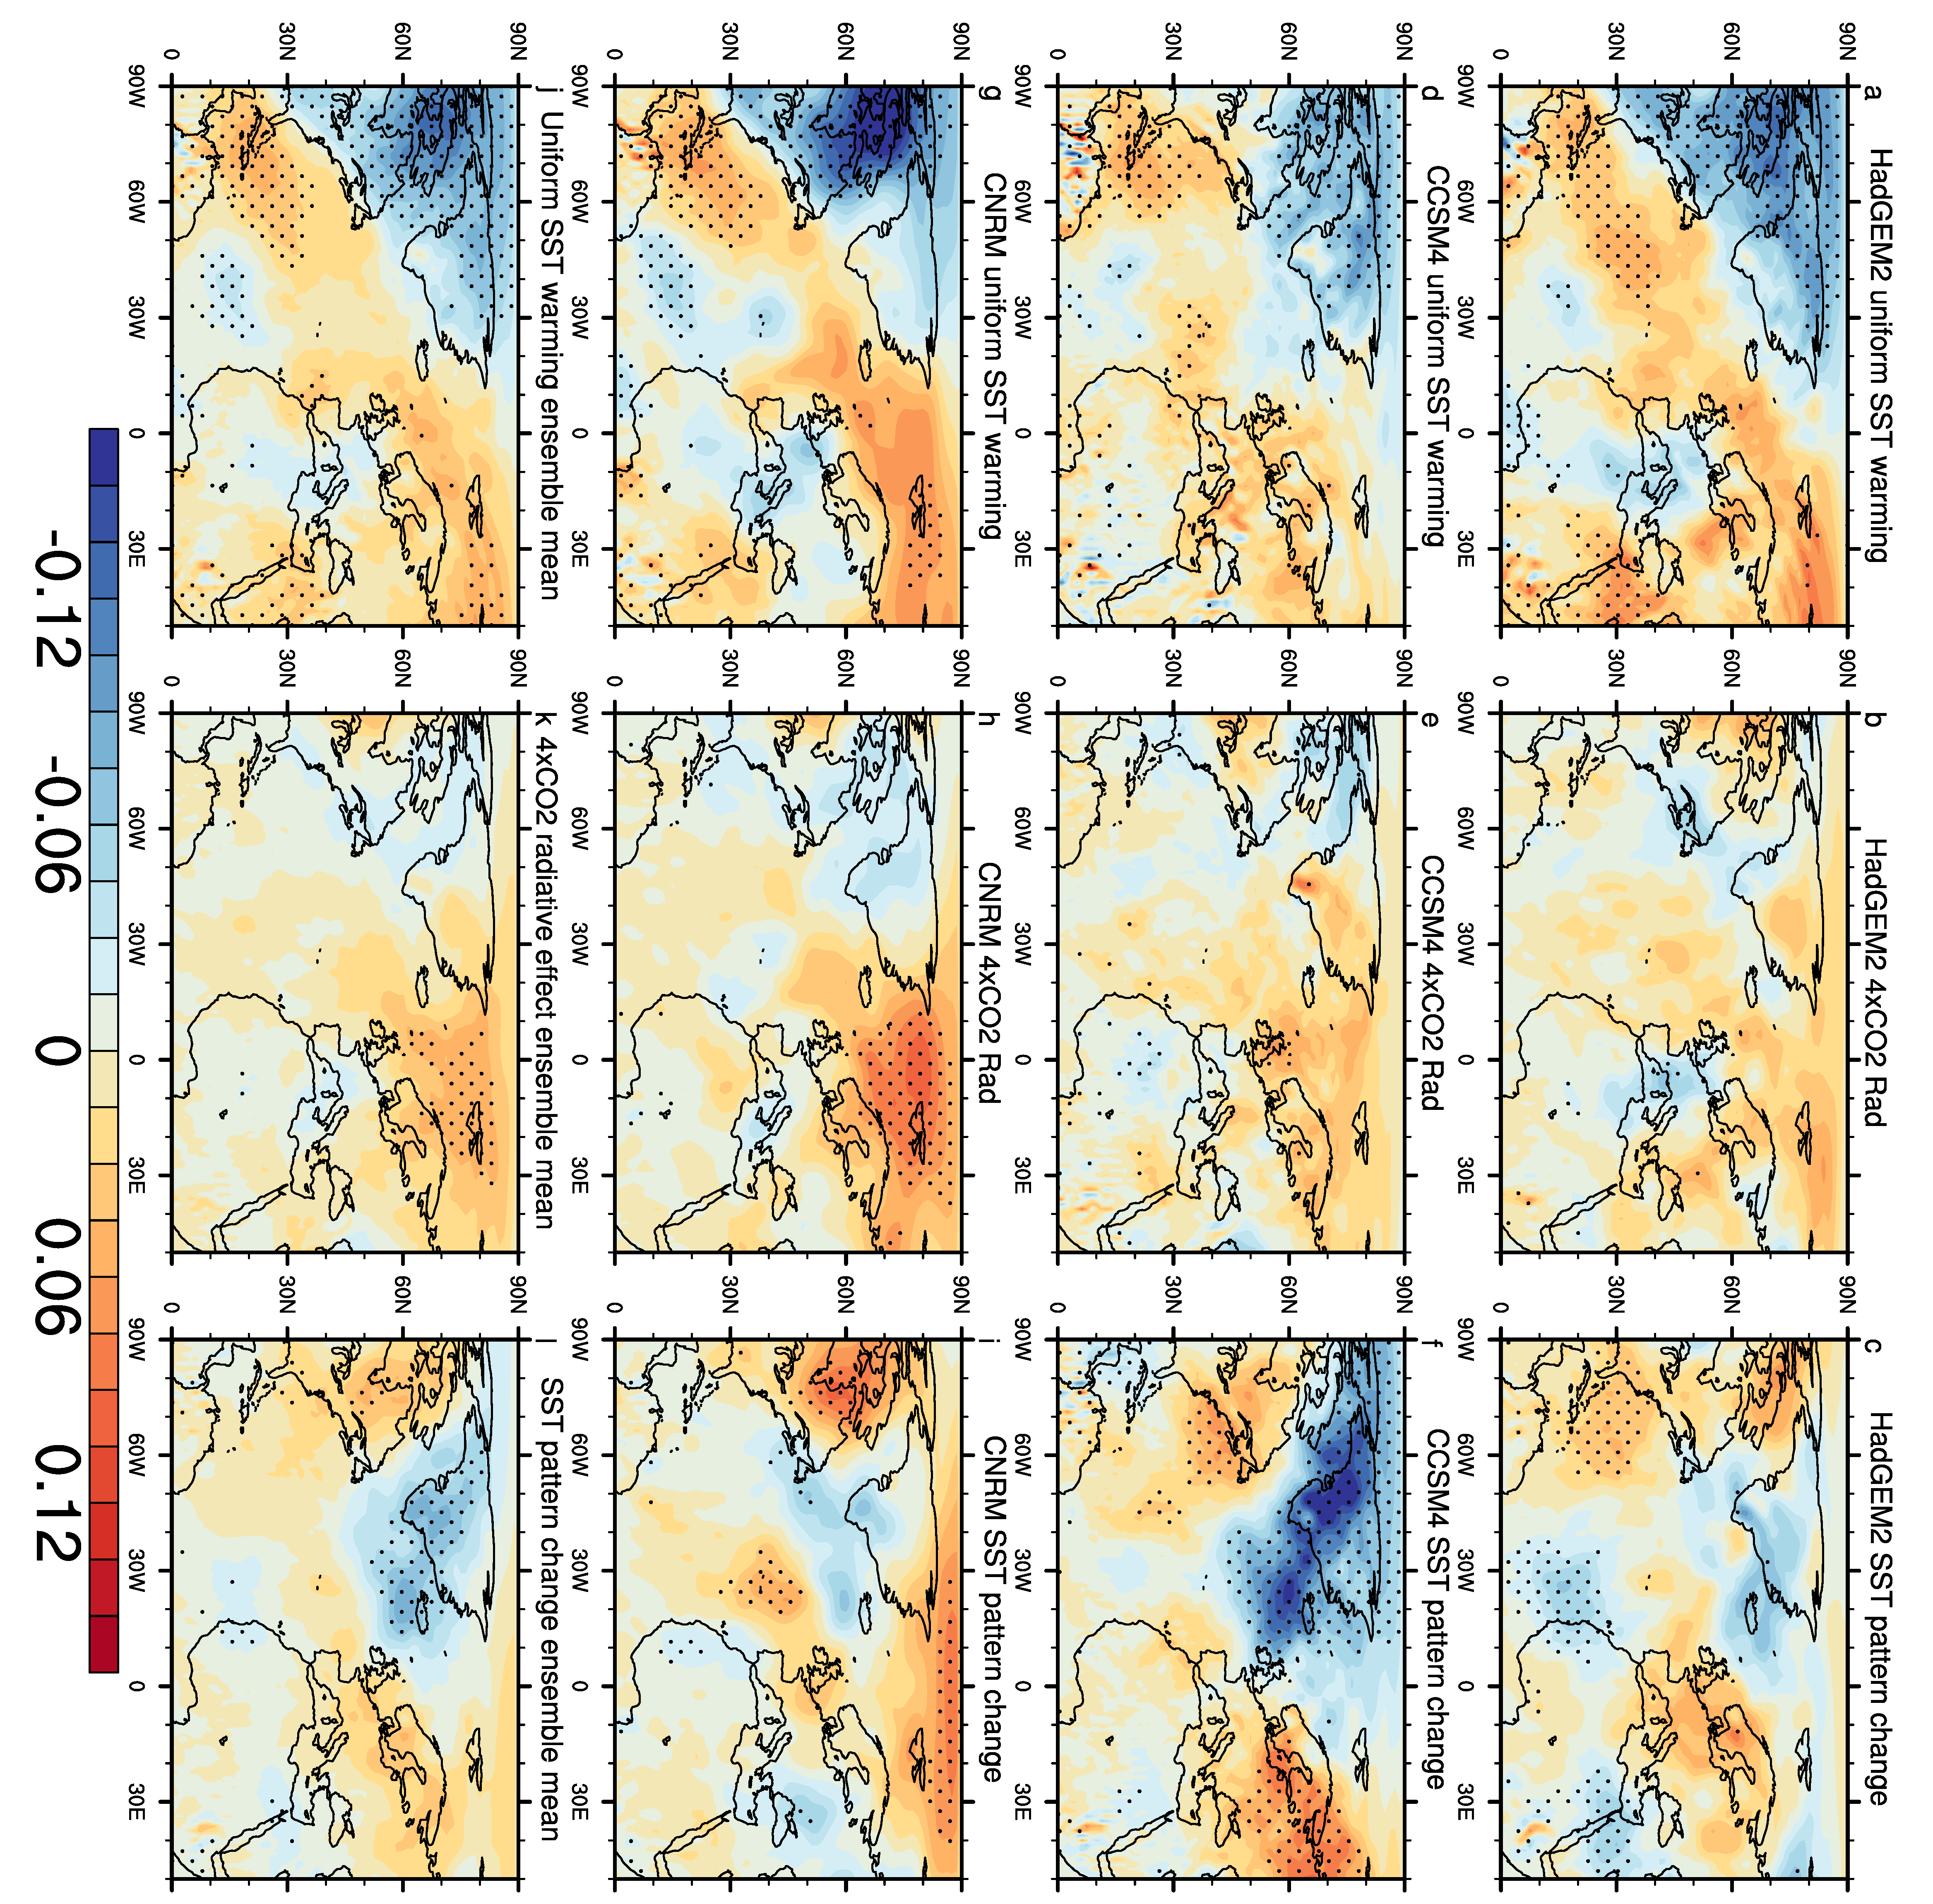
3. The Changes of Winter NAO Variability in Response to Different Forcings

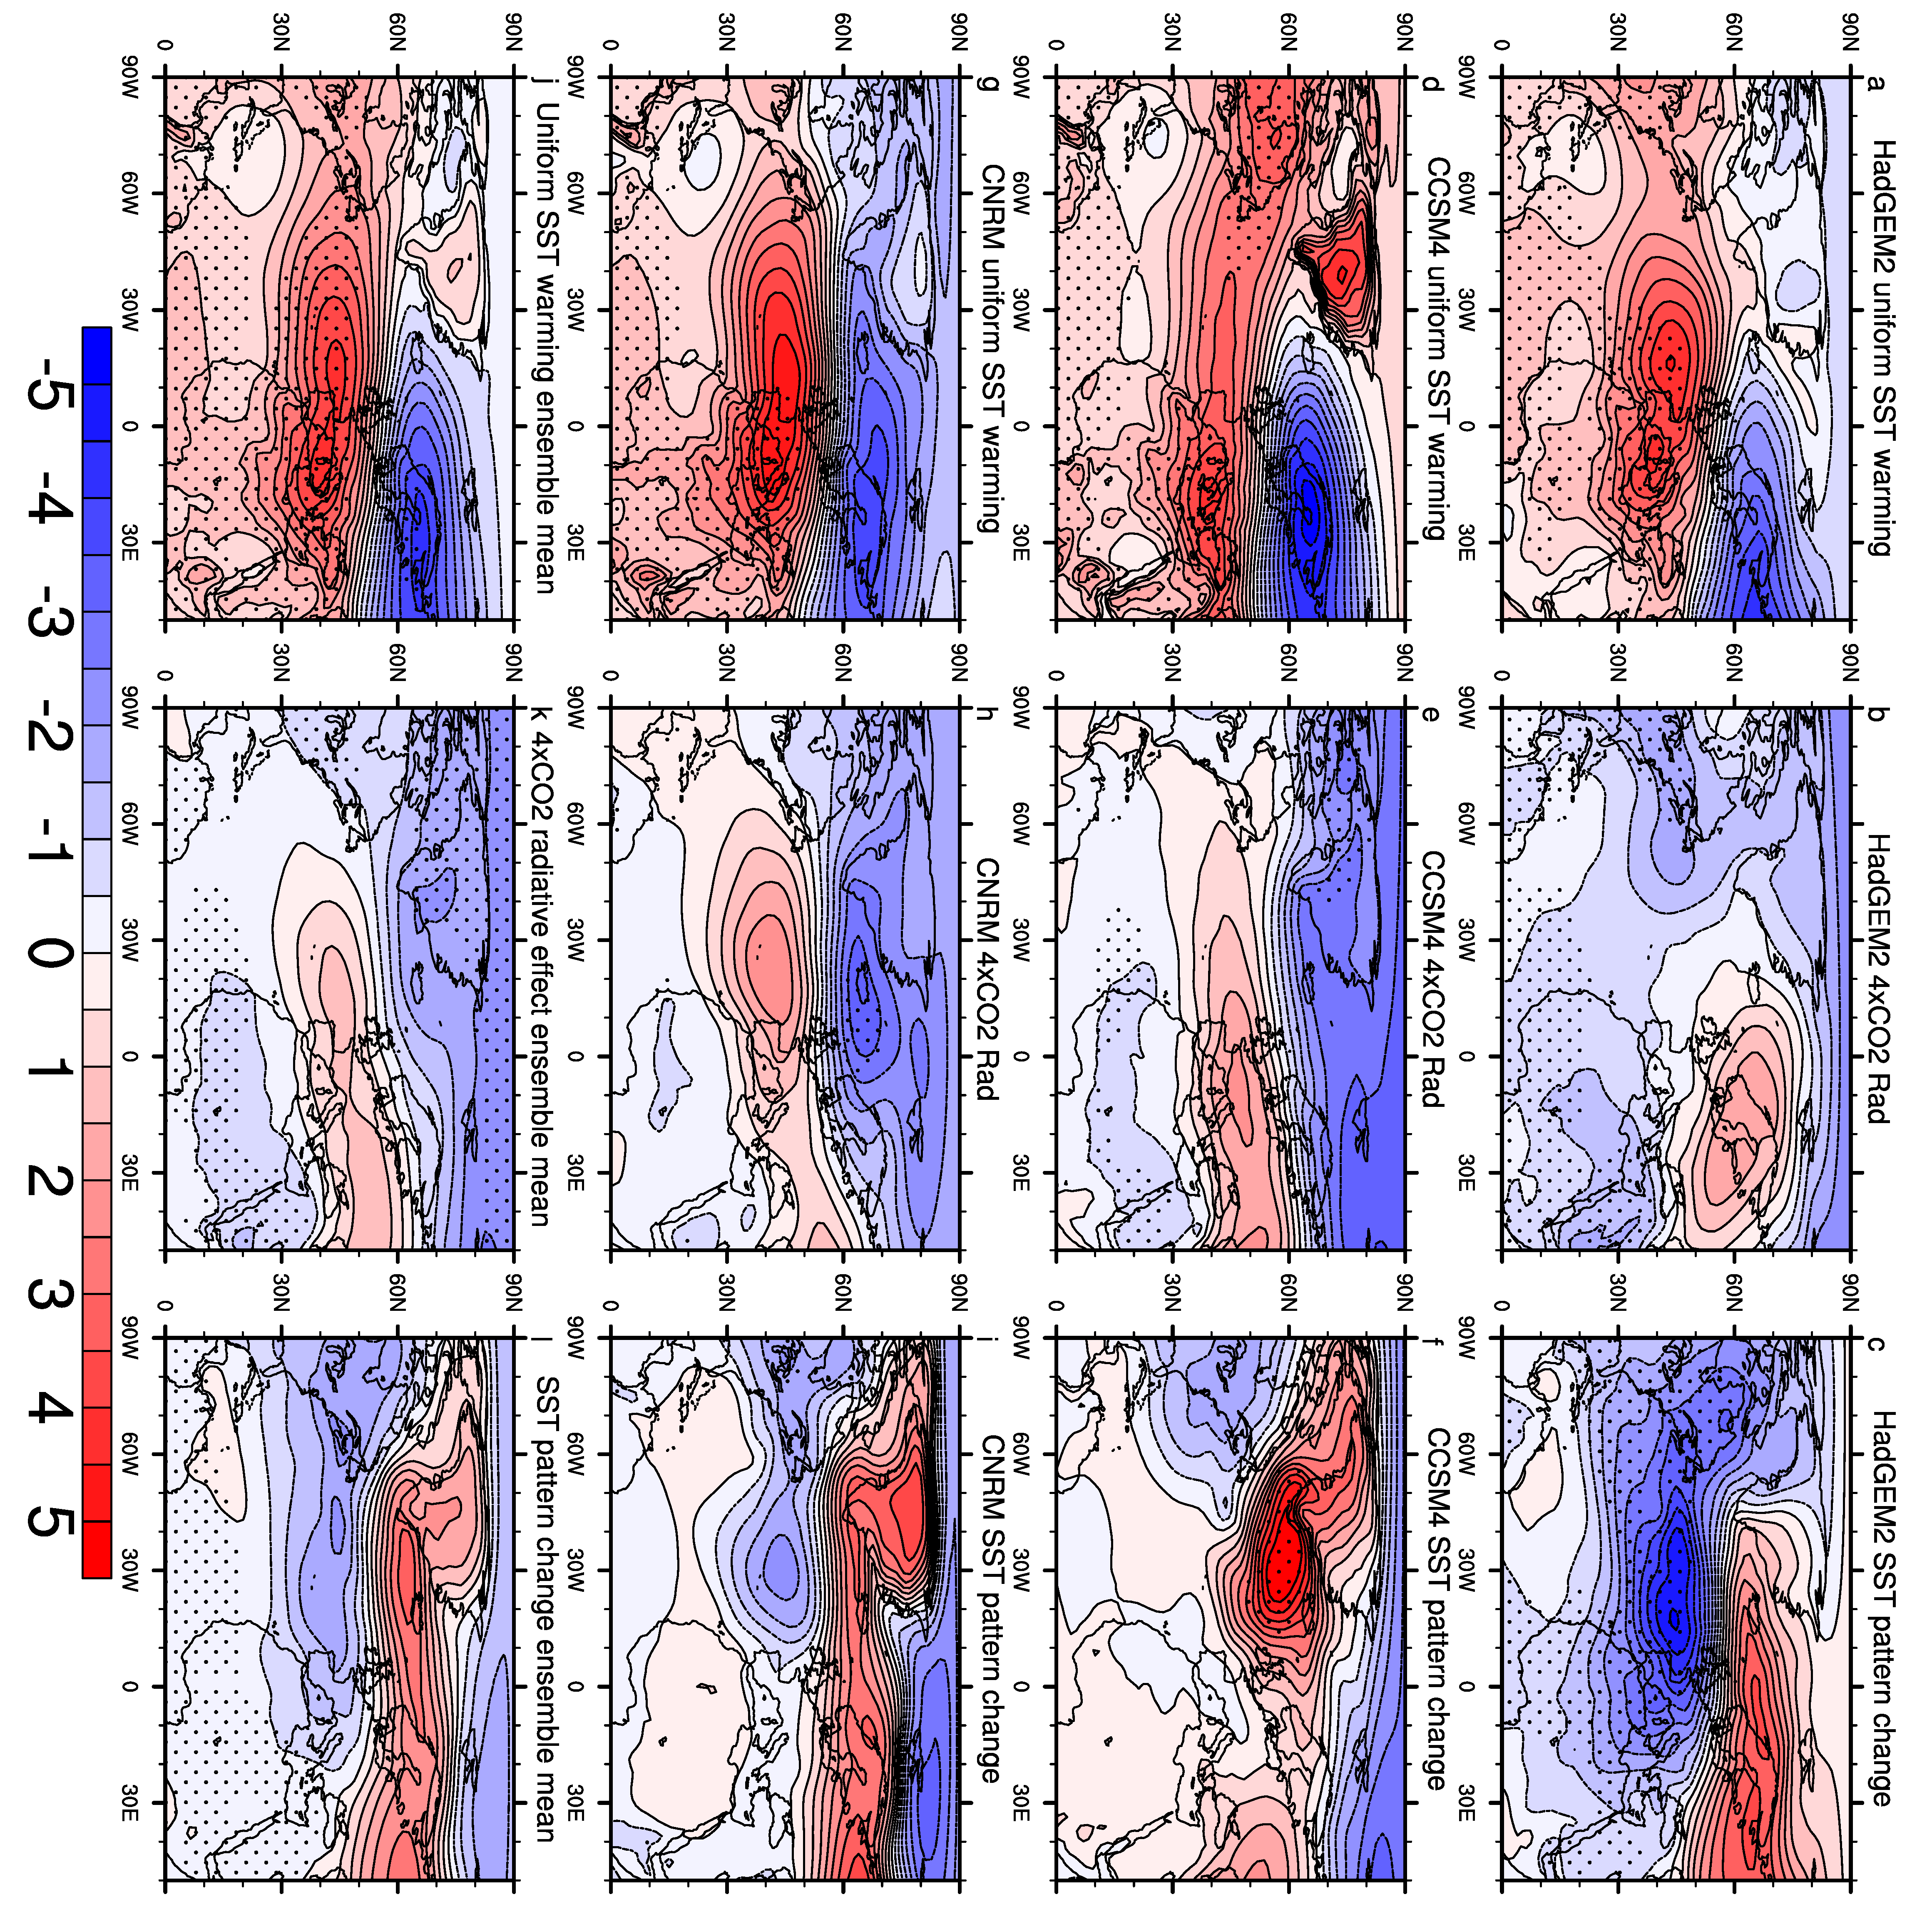
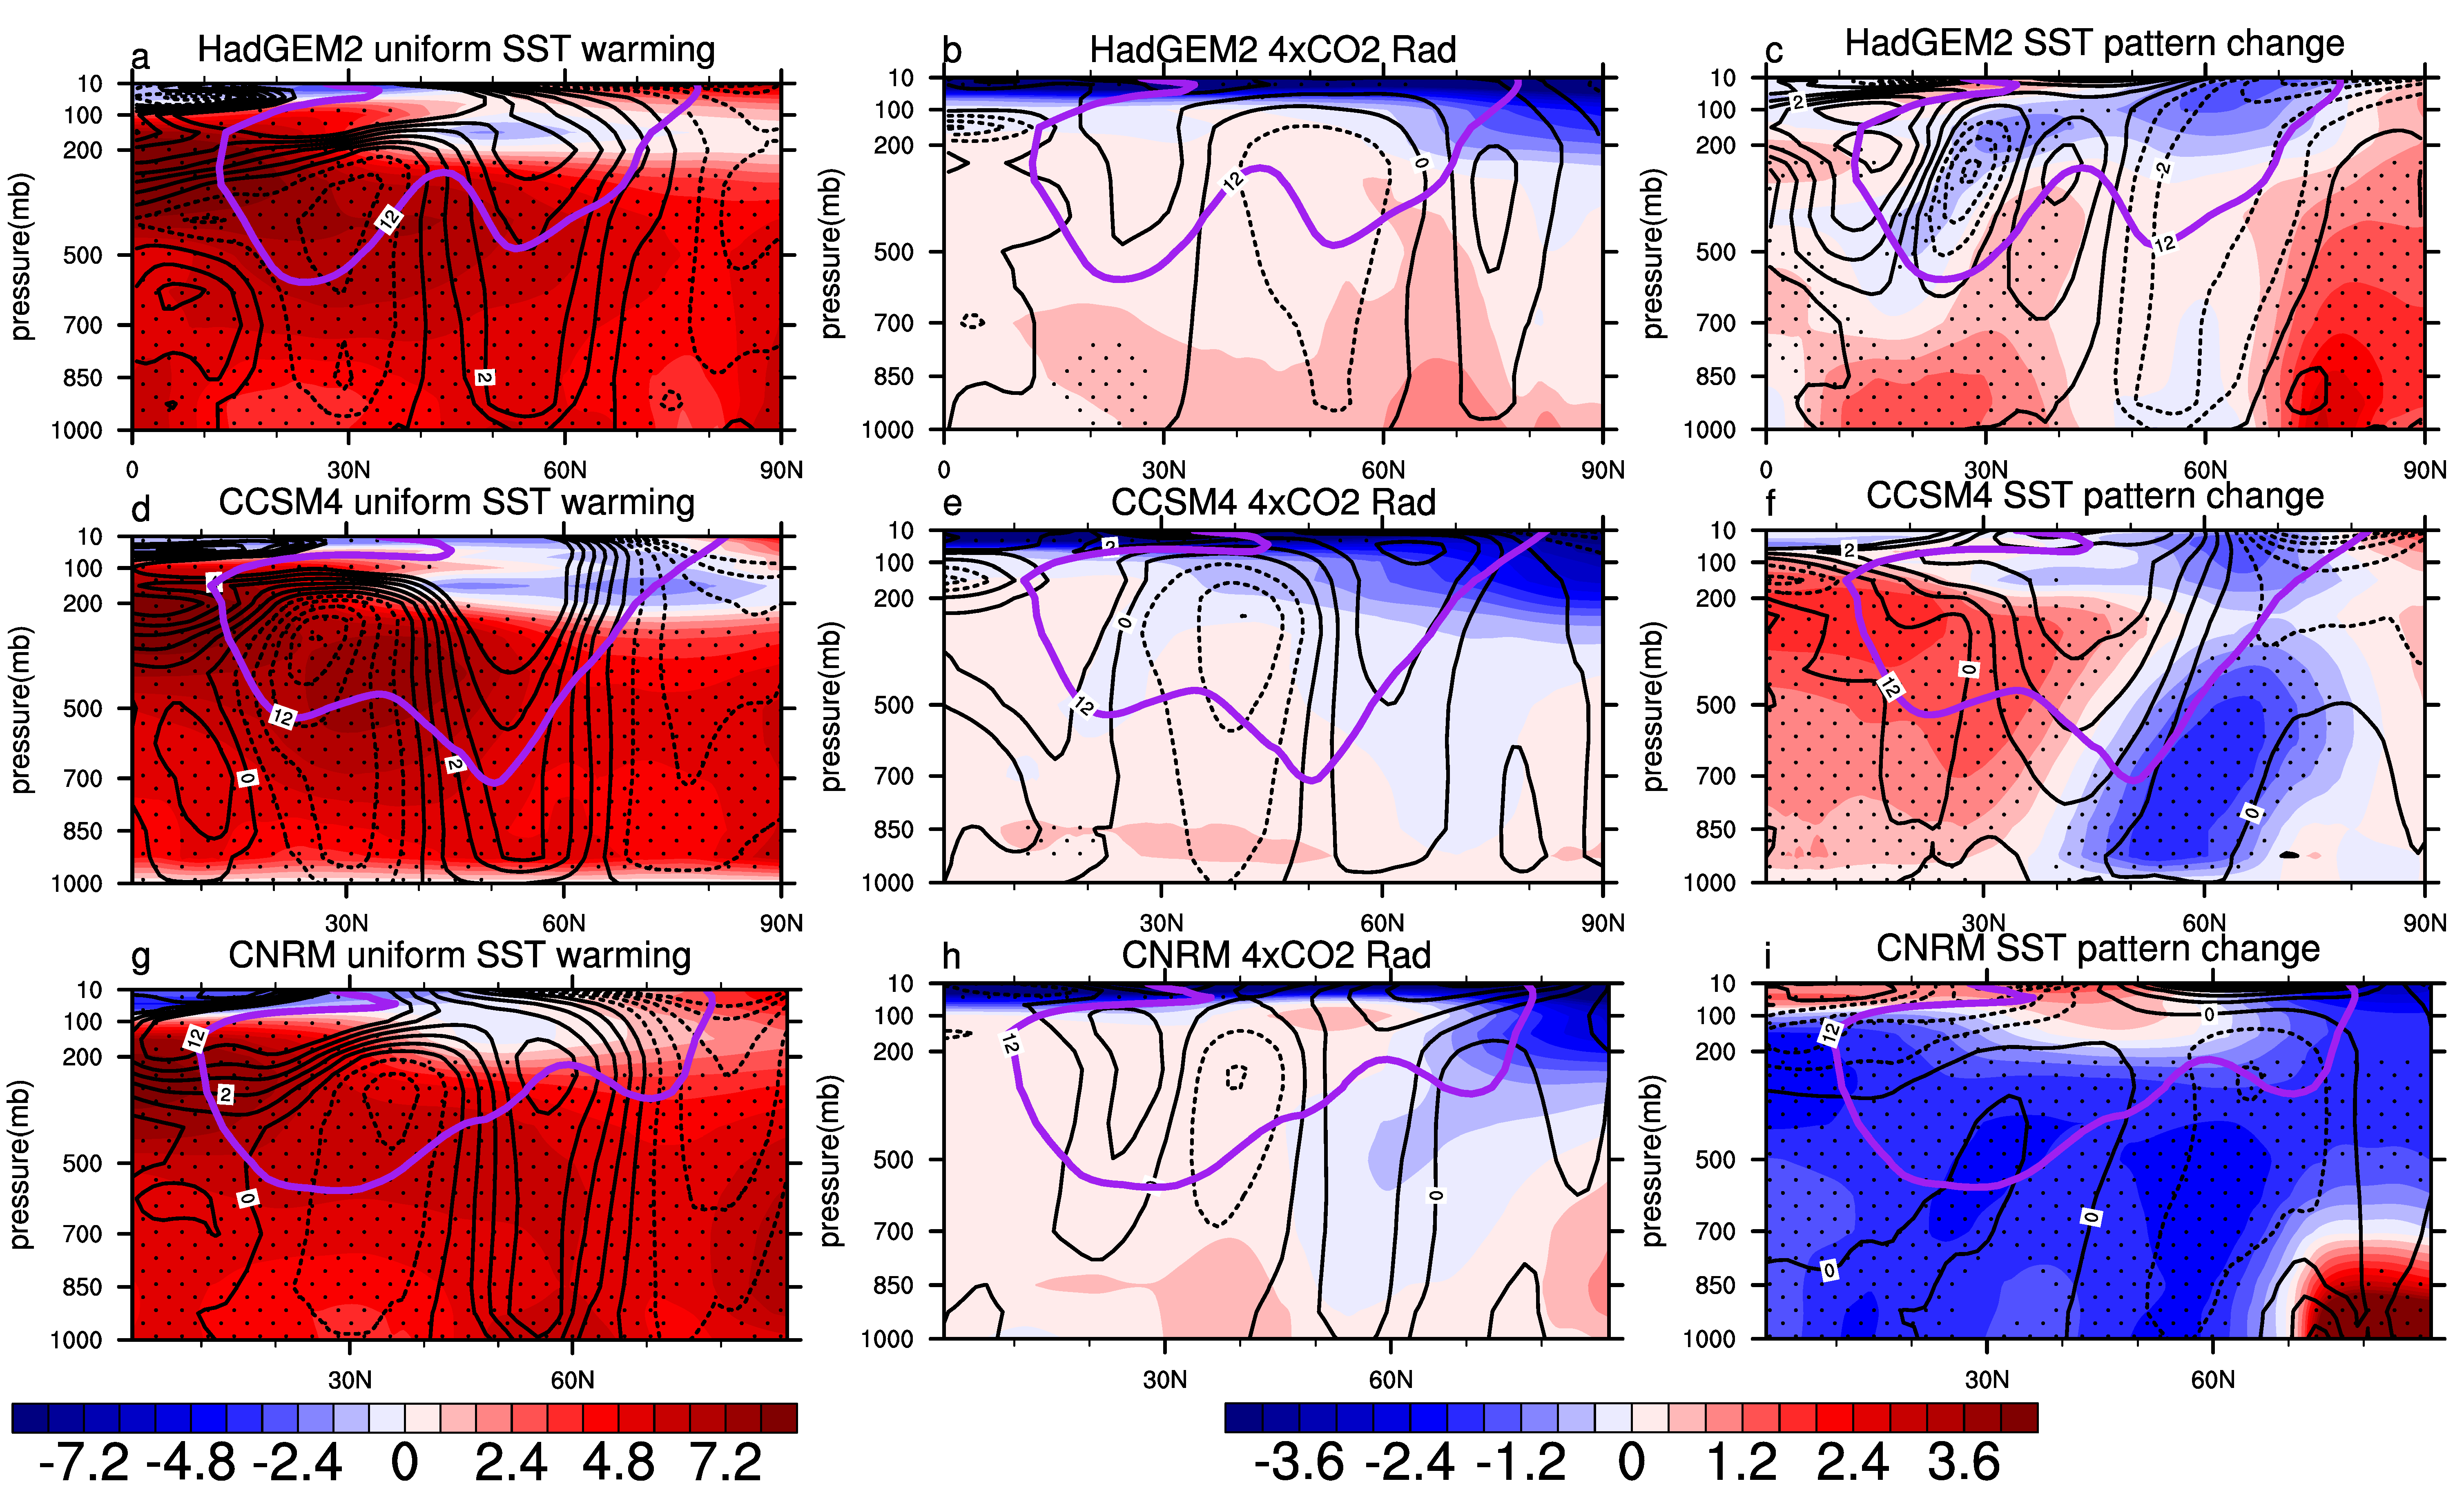
The Decomposed Changes of SLP Patterns of Winter NAO

The regression patterns of SLP upon NAOI in the different model experiments are shown in Figure 1 We can see that the three models generally capture the features of winter NAO pattern well in the piSST simulations, though the action centers are relatively shifted eastward in the models compared to the observations for the period 1948–2016 (Figure 2).Averaged across the 3-model ensemble, the standard deviation of the NAOI increases from 5.25 hPa in the piSST simulation to 6.11, 7.15, and 6.62 hPa in response to uniform SST warming (sstPi4K), the direct radiative effects of elevated CO2 (piSST4 × CO2), and the SST pattern changes (piSSTFuture-piSST4K), respectively. However, it is clear from Figure 1 that the NAO response to the different climate forcings varies across the three different models.
Figure 3 further depicts the differences of the winter SLP regression pattern between the piSST simulation and the three climate forcing simulations. In response to uniform SST warming, CCSM4 and CNRM show an intensified NAO action center, though the locations of the action centers vary between the models. The centre of the Azores High shifts eastward in CCSM4, while it shifts slightly westward in CNRM. In contrast, in HadGEM2, the NAO action center weakens in response to uniform SST warming. This inconsistency is probably related to the distinct simulation of NAO variability change in HadGEM2 in response to the uniform SST warming. It might be that under the uniform SST warming, the NAO-related pattern as a response in HadGEM2 is preferentially shifted significantly eastward with an enhanced center which appears to be locally weakened over North Atlantic Ocean (Figure 1b), leading to this inter-model difference. It indicates that the influence of uniform SST warming could be complicated and is strongly dependent on the chosen model. The 4 × CO2 radiative effect enhances the NAO variability in all three models and the result in CNRM also shows the westward shift, while there is a slightly eastward shift in CCSM4, which means the effects of both uniform SST warming and the direct CO2 radiative effect could cause the intensification of winter NAO variability.
Chadwick et al. [20] indicated that the SST pattern change is likely to be a major cause of inter-model uncertainty for mean-state circulation changes in the North Atlantic region. In our analysis, we also find that the individual model’s projected SST pattern changes drive very different responses in the SLP anomalies associated with the winter NAO. Generally, both uniform SST warming and direct CO2 radiative heating seem to cause the intensification of the winter NAO (with the exception of uniform warming in HadGEM2), whereas a large uncertainty exists in simulations for the SLP patterns of winter NAO among models in the SST pattern change experiment.

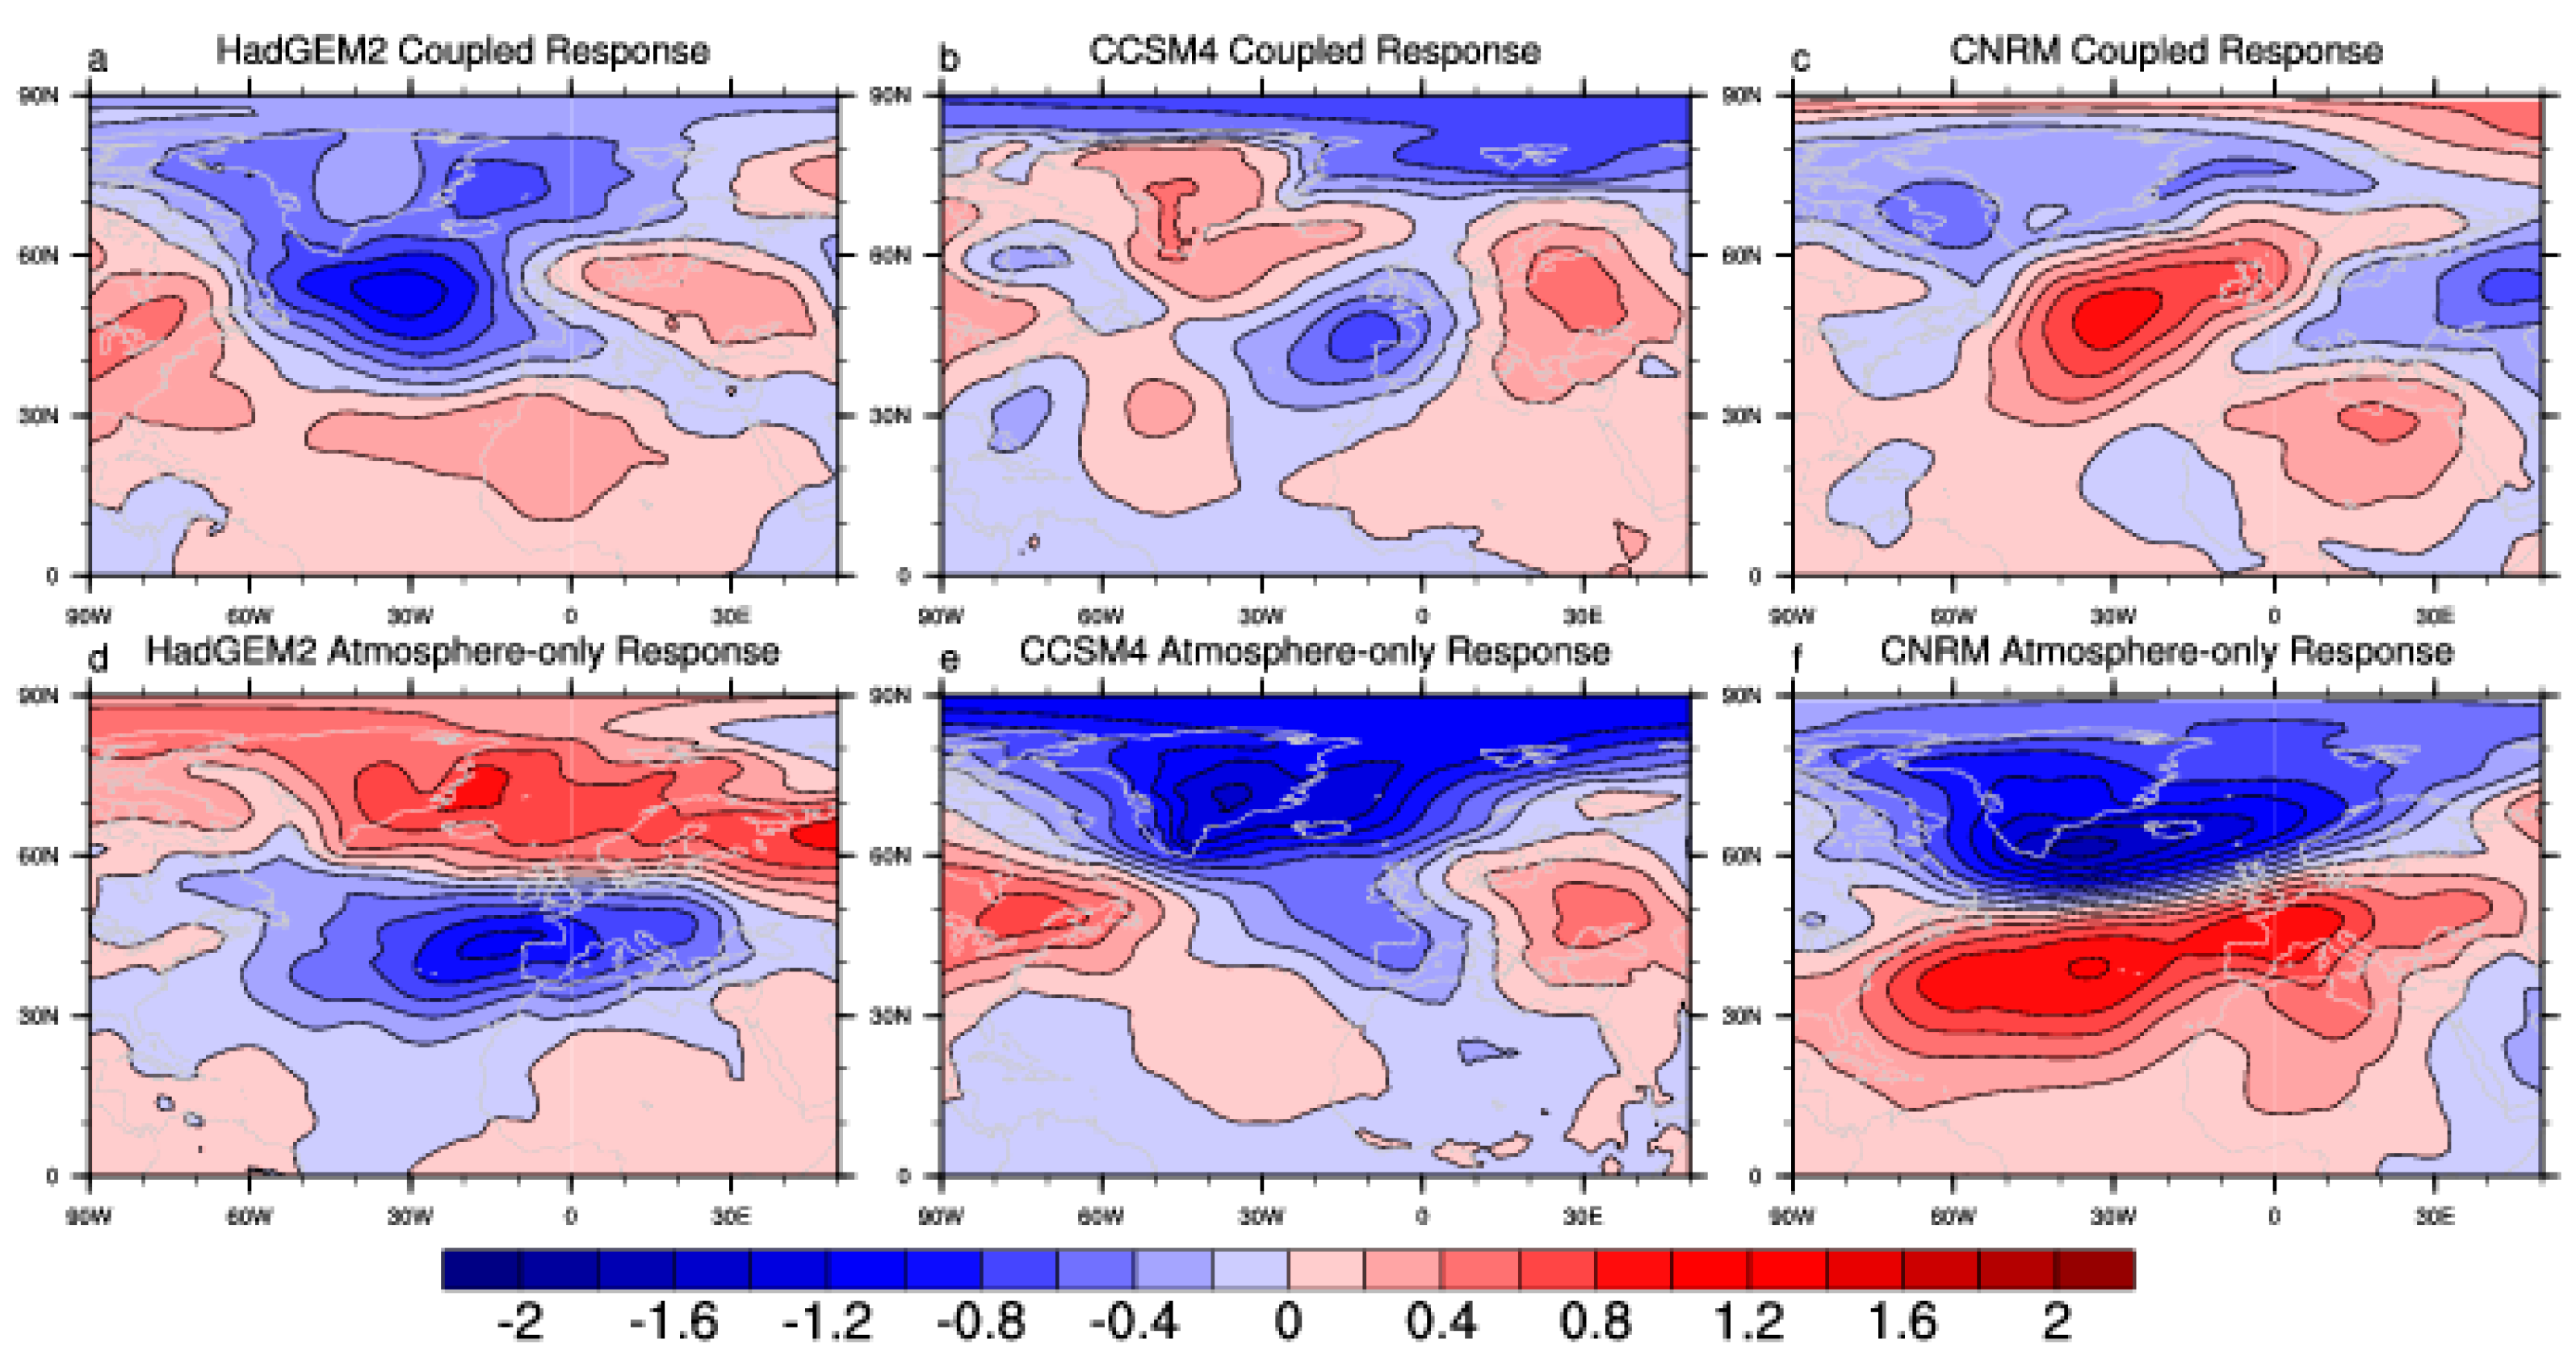
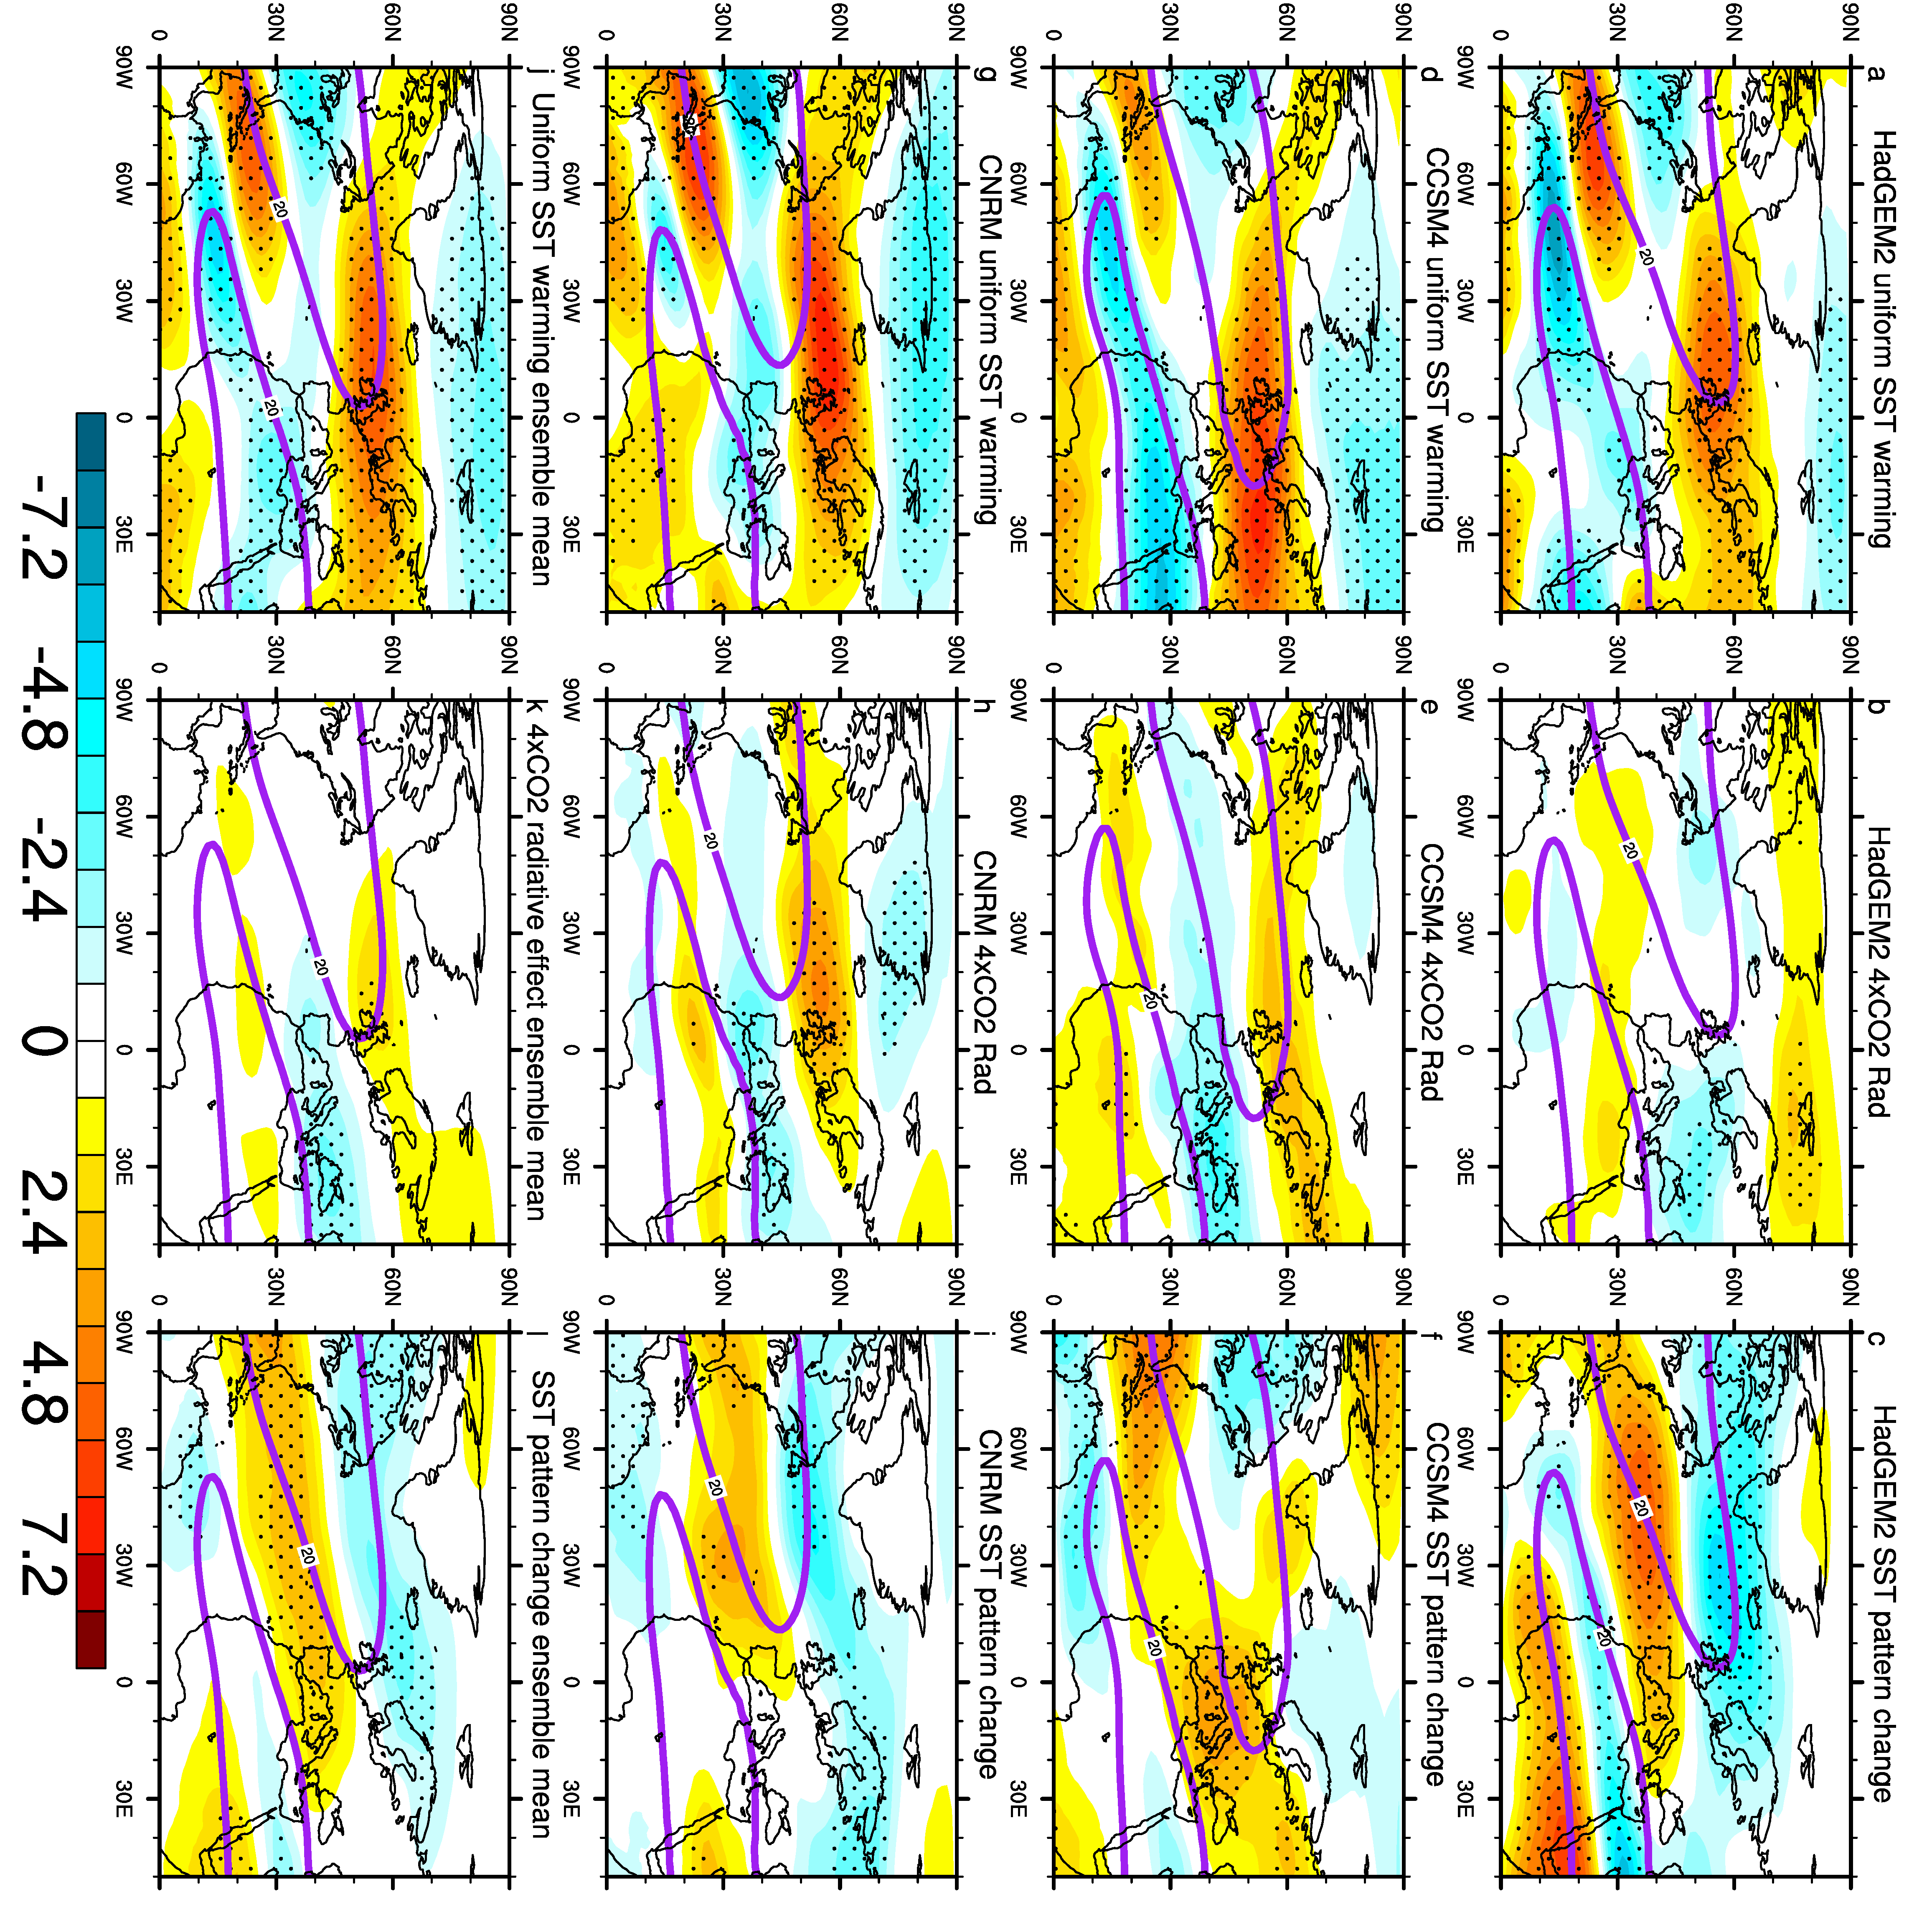
4. Possible Causes of the NAO Variability Changes in Response to Different Climate Forcings

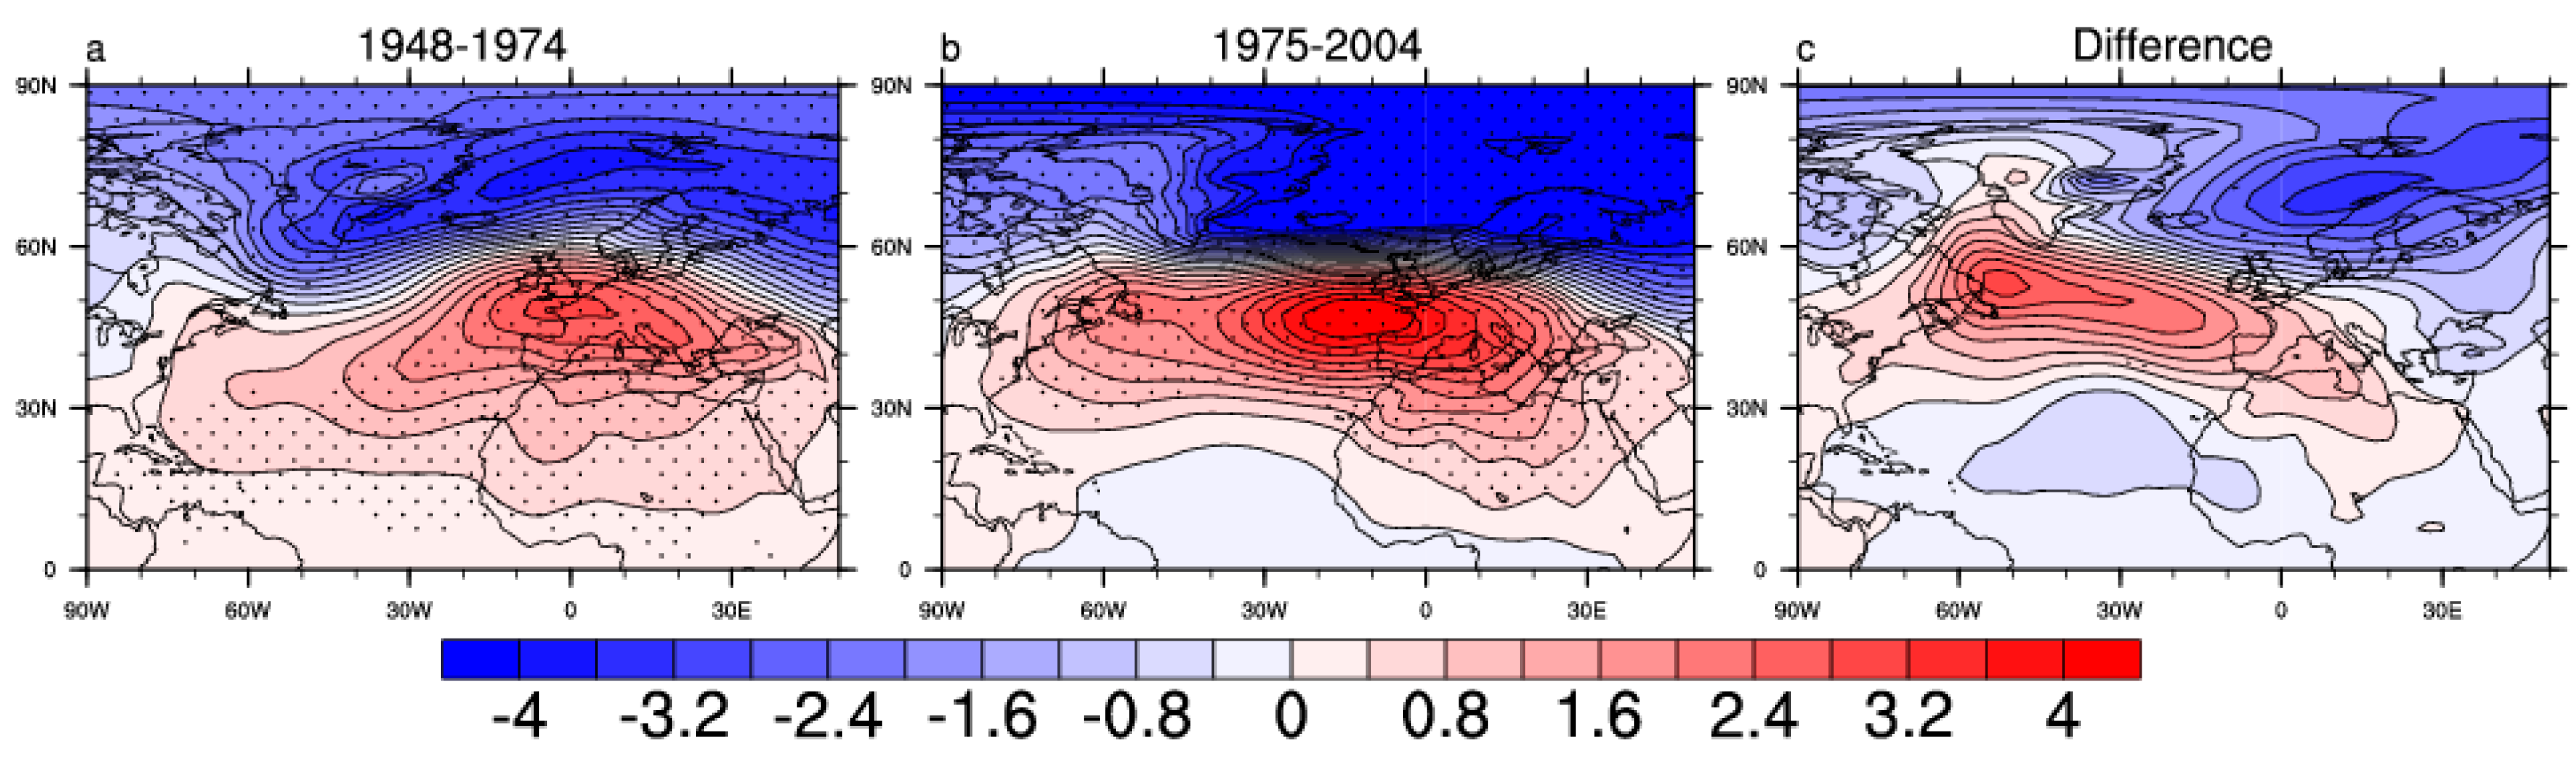
4.1. Observed Changes in NAO Variability and Mean Westerly Wind

Previous studies suggested that the positive NAO phase is associated with the enhanced zonal wind at mid-high latitudes [23,24], but the relationship between the changes of NAO variability and the mean state westerly wind is not quite clear. Dong et al. [8] have found that the interannual NAO variability center intensified and was shifted in 1975–2004, compared with 1948–1974. In order to further investigate such a relationship, we here examine the observations of the NAO variability pattern change and the zonal wind change for these two periods. Figure 4 compares the results of NAO variability for the periods 1948–1974 and 1975–2004, and the intensified NAO variability can be seen in the latter period from their difference. Meanwhile, the mean state change of zonal wind between the two periods (see Figure 5) also clearly shows the enhanced westerly wind appearing around 60° N. These observed results indicate that the intensified NAO variability is probably connected with the enhanced mean state westerly wind at mid-high latitudes. Dong et al. [8] and Lu and Greatbatch [25] pointed out the role of the mean state change on the NAO action center and indicated that the zonal wind changes could have an influence on the NAO variability change by shifting the axis of the North Atlantic storm track, which are probably associated with eddy feedback change. Therefore, the diagnosis of the mean-state zonal wind change in each experiment could be helpful to determine the causes responsible for the changes of NAO variability.

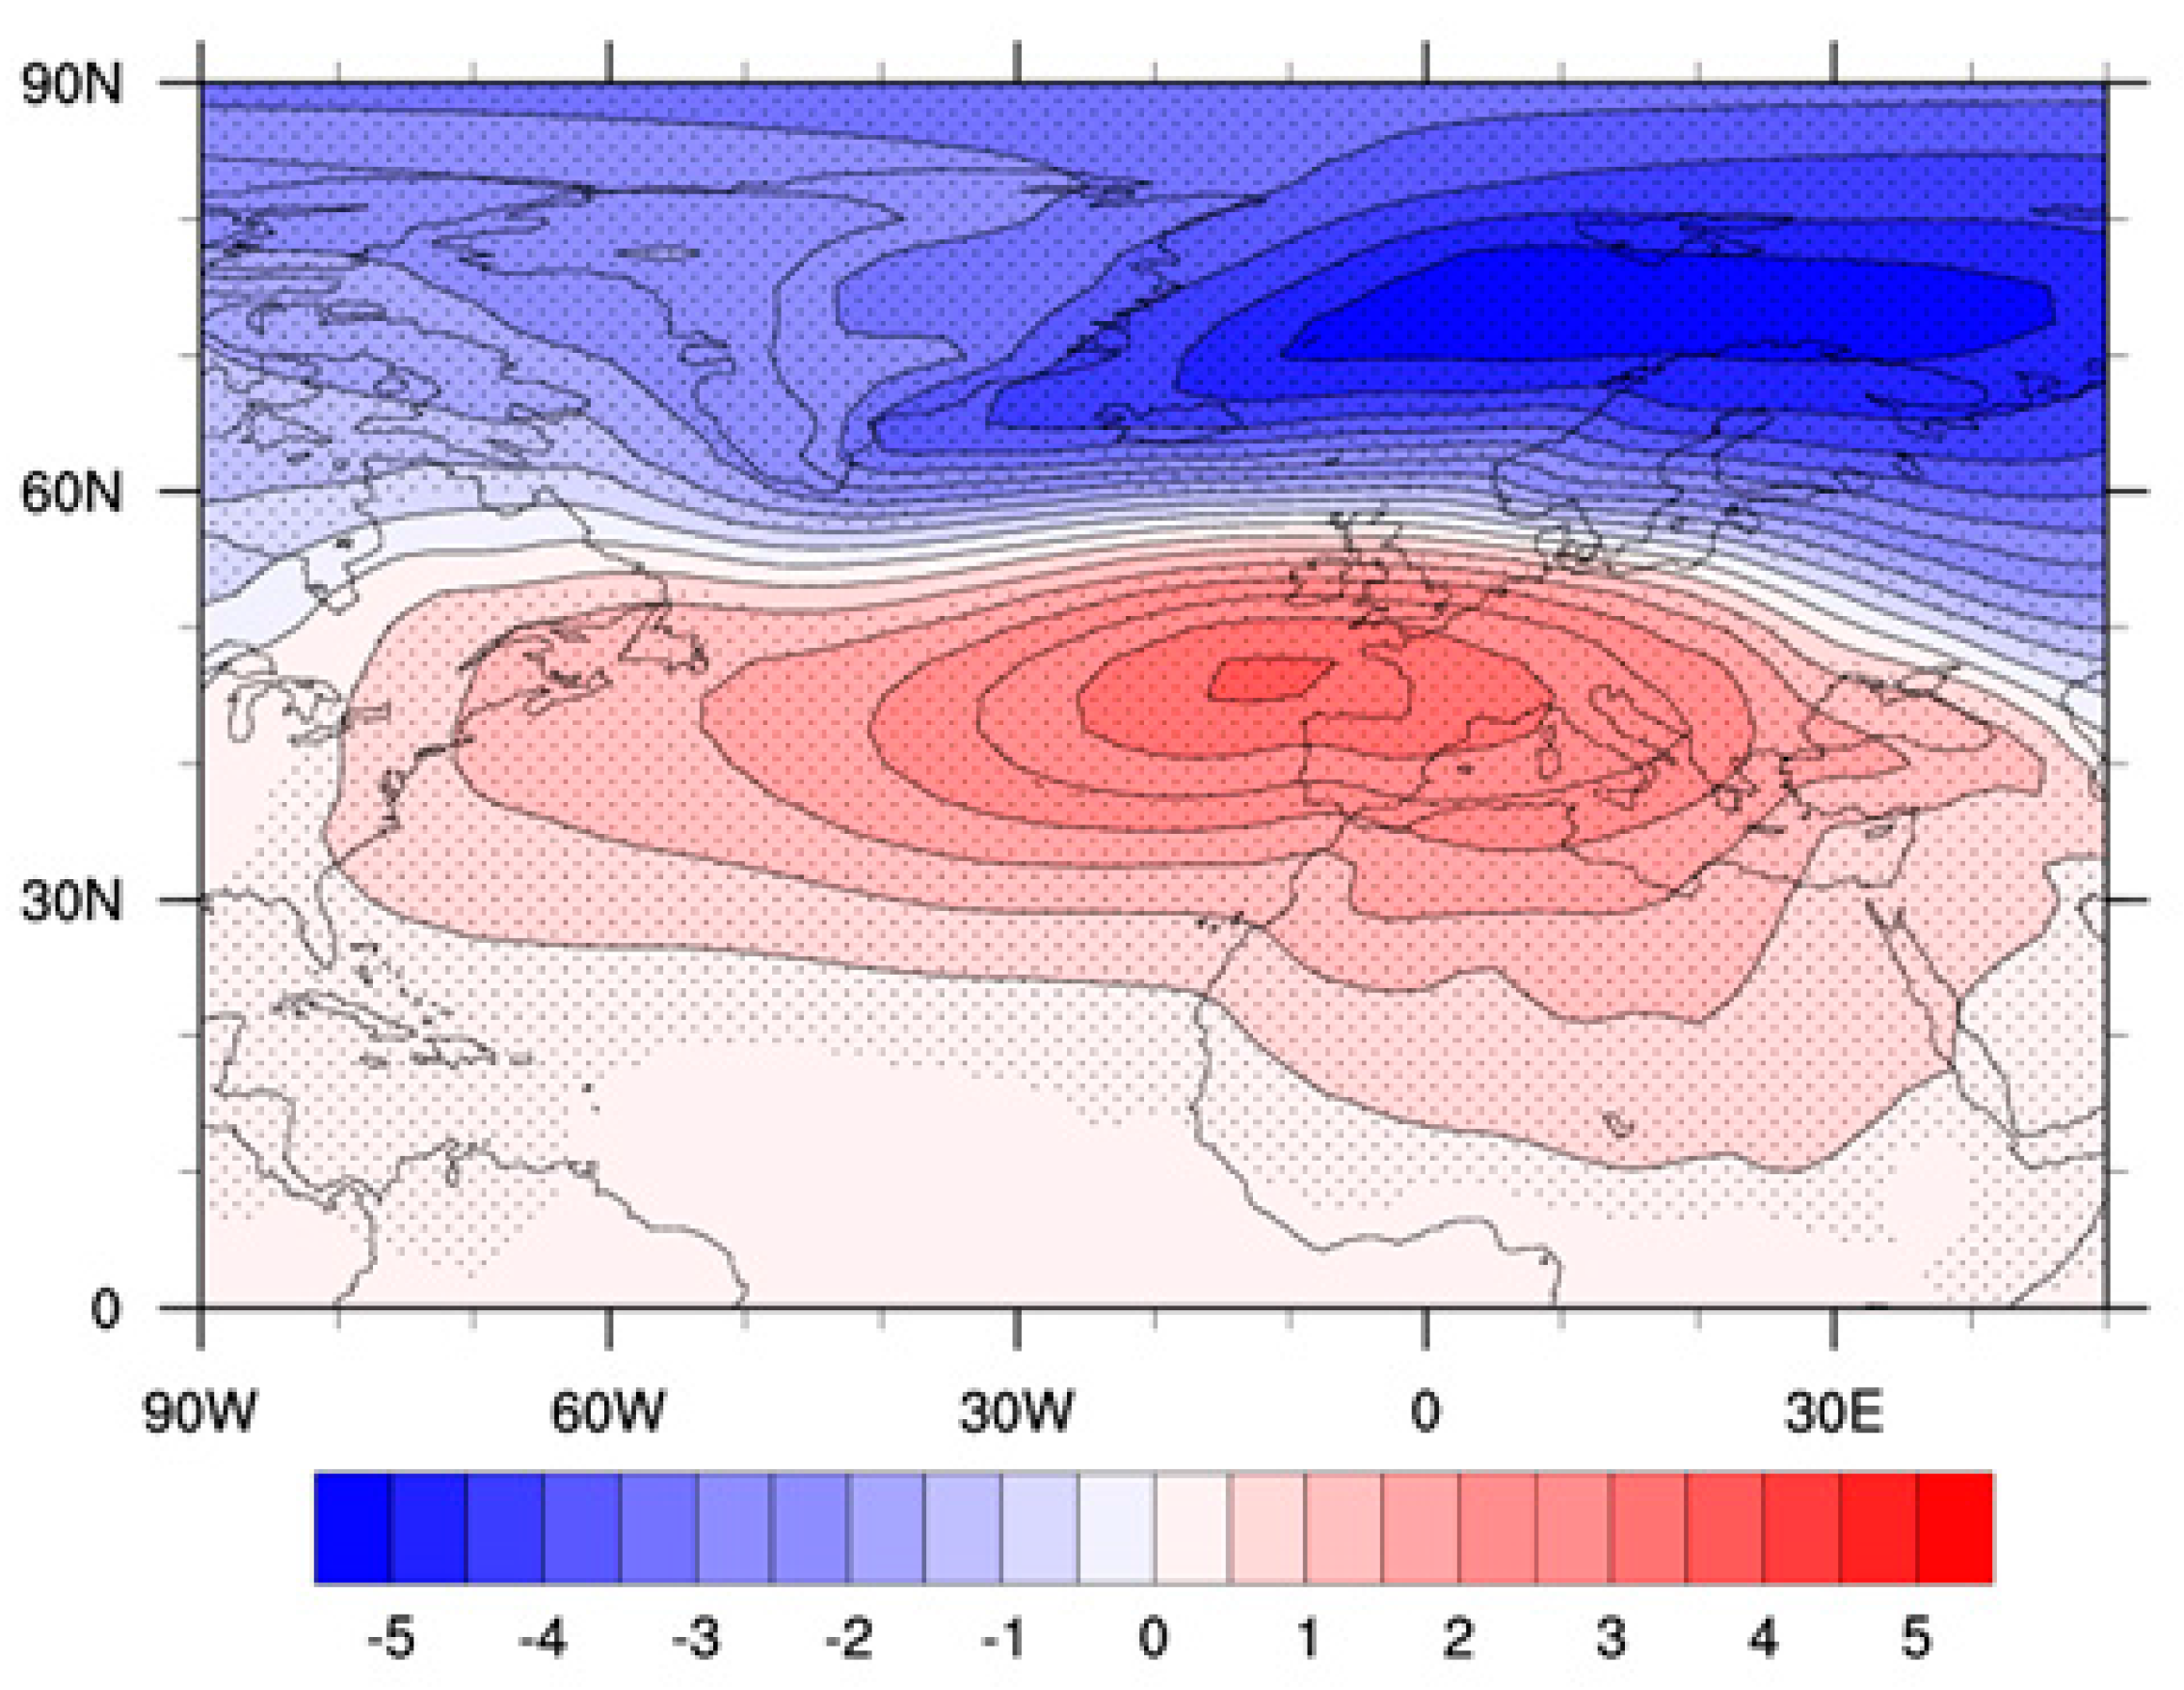
4.2. The Mid-Latitude Westerly Jet Changes in Response to Different Climate Forcings

Figure 6 shows the winter SLP changes in response to different forcings over the Atlantic region. Except for the relatively larger difference in response to the uniform SST warming shown in HadGEM2, the intensified Azores high and Icelandic low can be seen in both the uniform SST warming and 4 × CO2 direct radiative effect experiments, and thus it can be inferred that the westerly wind at mid-high latitudes are enhanced in these two experiments. In response to uniform SST warming, the enhanced westerly wind can be seen around 60° N compared to the piSST experiment, though the intensities are not consistent among models (Figure 7a,d,g), which should be conducive to the enhancement of NAO variability. In addition, we can see that the air temperature increases significantly in the whole layer, particularly at mid-low latitudes in the upper atmosphere. This upper atmospheric warming is likely driven by the enhanced tropical convection and the associated latent heat release in the upper tropical troposphere, and it could have an influence on the change of the meridional temperature gradient, which will be discussed later. Similar to the zonal wind response under uniform SST warming, the zonal wind intensifies at mid-high latitudes in the CO2 direct radiative effect experiments in each model. The CO2 radiative effect induces a slightly poleward shift of the zonal winds in three models, especially in HadGEM2 (Figure 7b,e,h). Though the rise in air temperature is not as remarkable as that in the uniform SST warming experiments, the increased air temperature also appears in almost the whole troposphere and the most significant increase appears at low latitudes according to the results in CCSM4 and CNRM. Combined with the cooling in mid latitudes, this probably causes meridional temperature gradient anomalies at mid-high latitudes. What’s more, the stratospheric cooling in polar regions may enhance the polar vortex and westerly wind at mid-high latitudes. In response to SST pattern change, there is no consistent zonal wind response across models. The air temperature changes show great differences among the three models, especially in CNRM, which could be generated by the slightly different experimental design in CNRM. We note that the data of the air temperature in CCSM4 are missing at low level (close to the surface) in parts of our chosen domain, which could cause the inconsistent results, and we removed these data from the analysis, thus leading to the slightly blank area near the surface in Figure 7d,e,f. The sea-ice was free to change in CNRM-CM5, but not in HadGEM2 or CCSM4, thus inducing the large inter-model spread in simulations for the air temperature change as well as the NAO variability change as a result. These results suggest that SST pattern change could also be the main source of inter-model uncertainty for NAO variability change in the wider set ofCMIP5 climate projections.

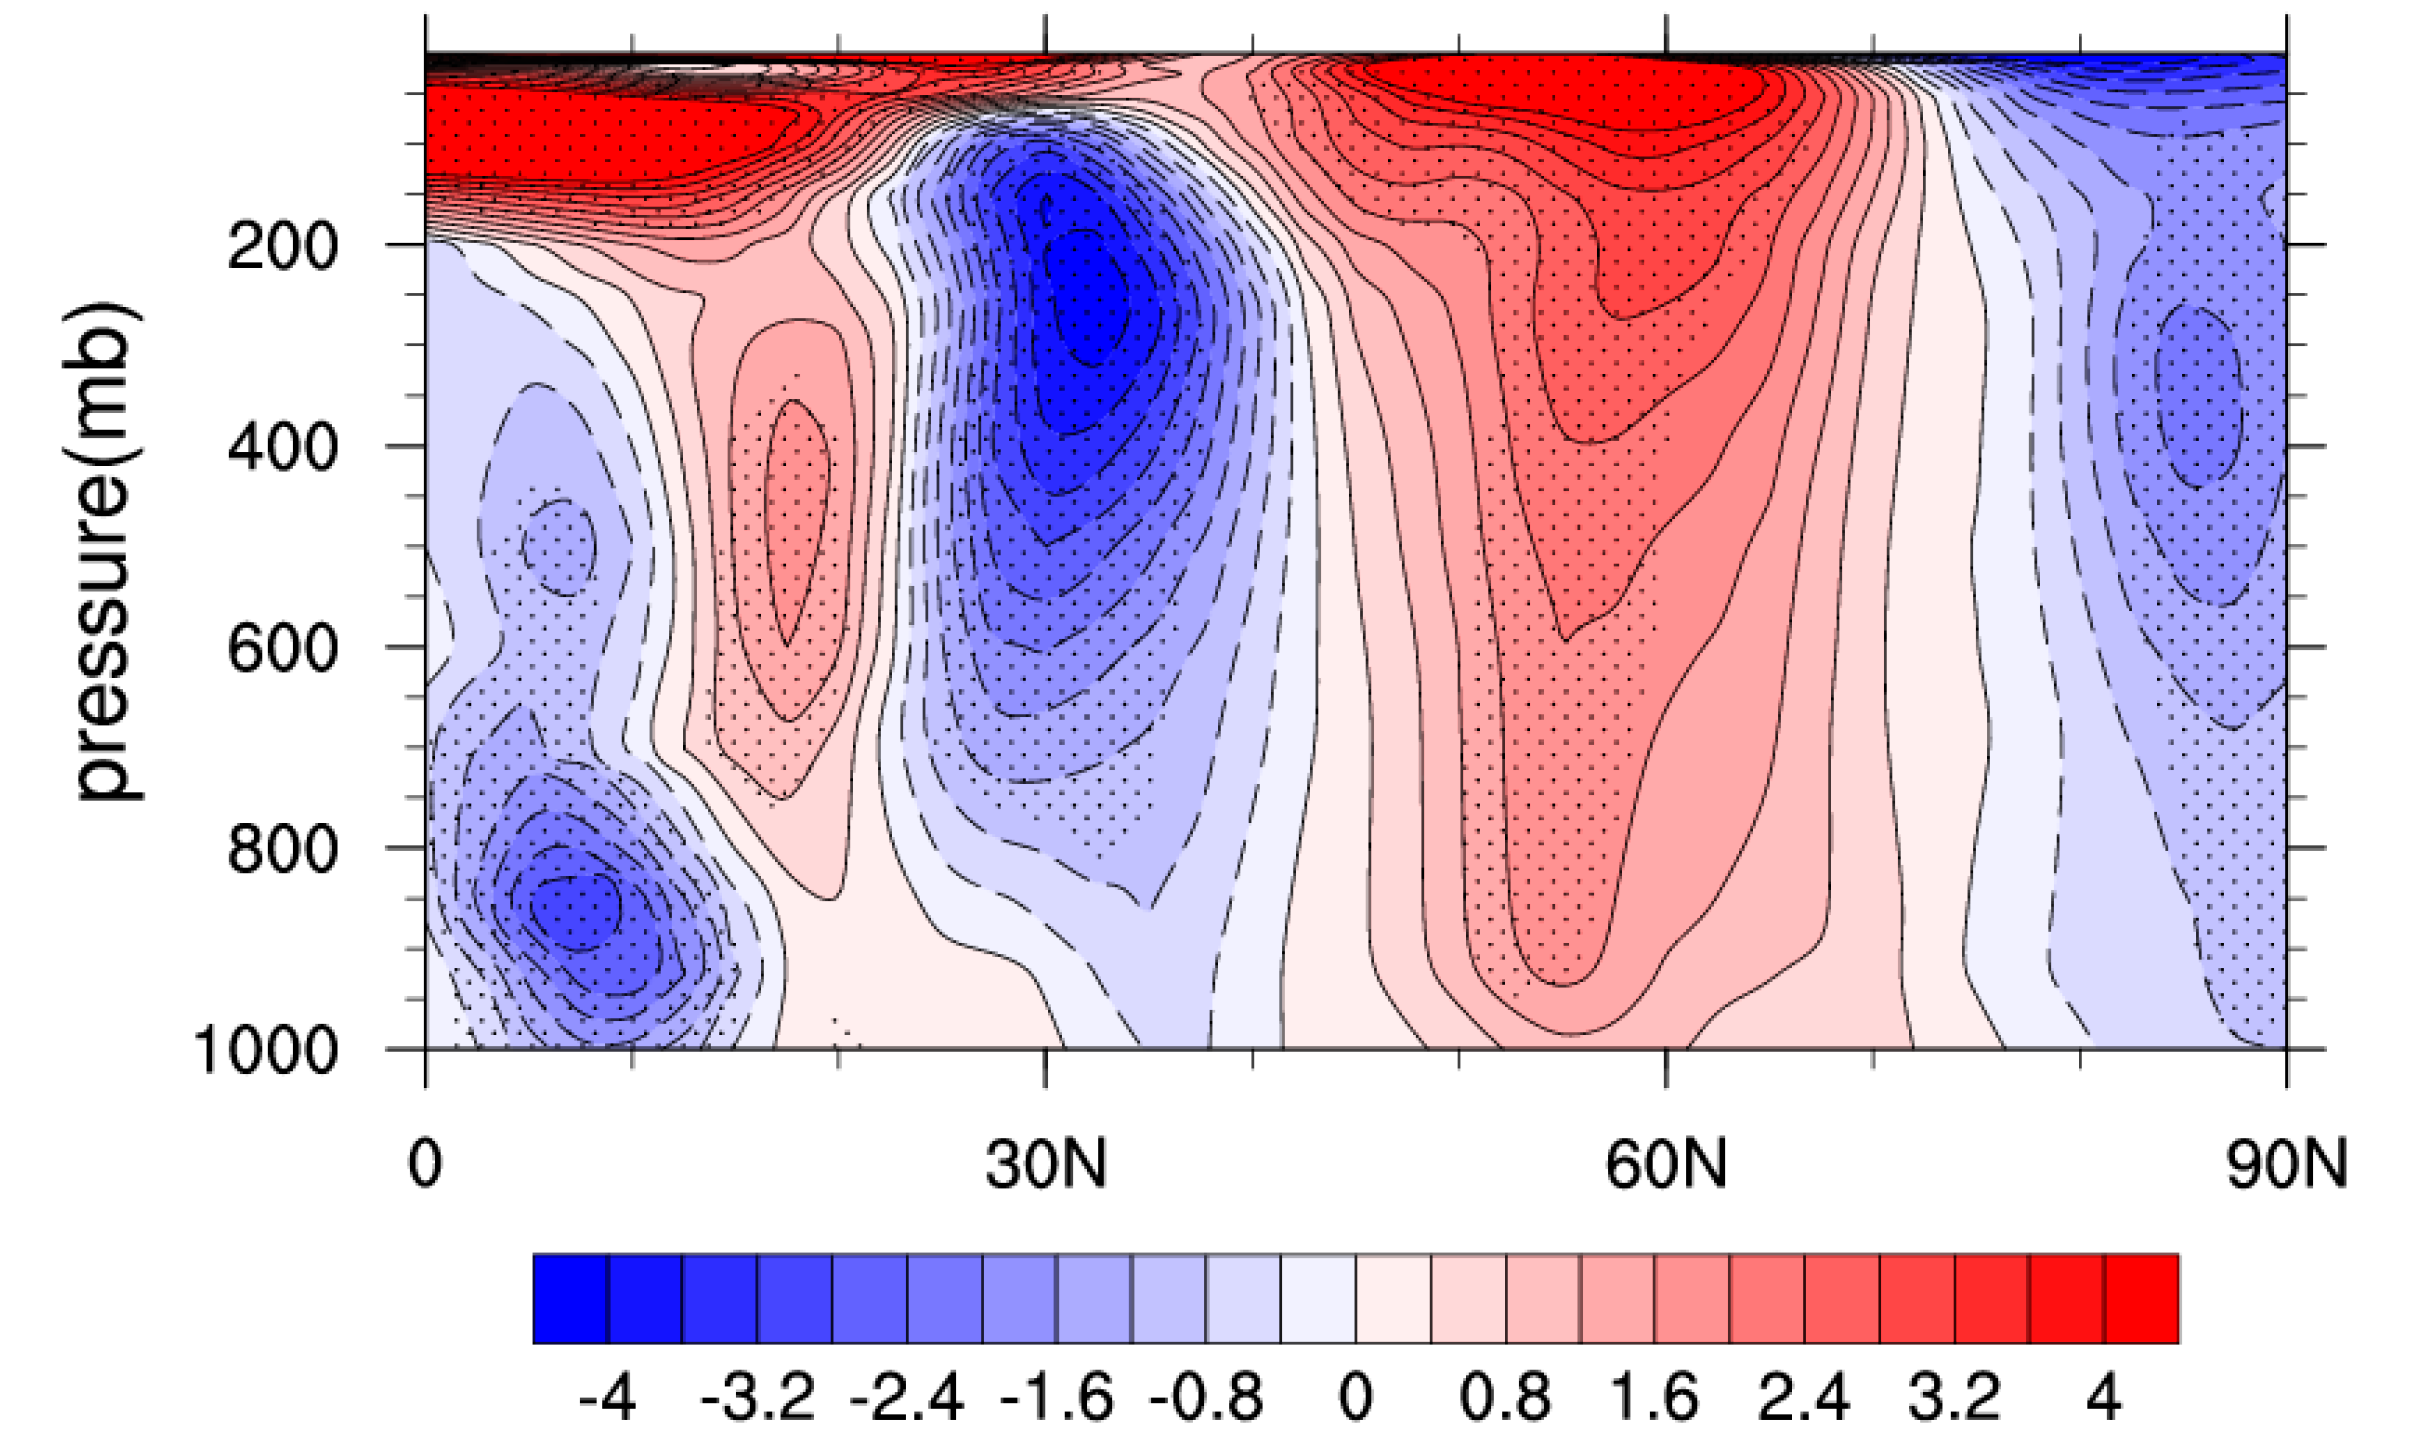
4.3. The Meridional Temperature Gradient Changes in Response to Different Forcings

It has been shown that the intensified meridional temperature gradient would enhance the mid-latitude zonal wind [8,26,27]. In order to investigate the condition of thermal wind change, we further analyze the meridional temperature gradient changes at 500 hPa as well as the 300 hPa zonal wind changes in different experiments. The results from the uniform SST warming experiment show that the meridional temperature gradient increases at mid-high latitudes to the east of 30° W (Figure 8a,d,g), and it could be driven by the large air temperature increases at mid latitudes, as shown in the previous section. The 300 hPa zonal wind at mid and high latitudes intensifies with a poleward and eastward shift compared to the piSST experiment (Figure 9a,d,g). The circulation change could be connected with the increased meridional temperature gradient according to the thermal wind theory. This westerly wind intensification may be a contributing factor to the strengthening of the NAO in response to uniform SST warming. Similarly, the meridional temperature gradient over mid-high latitudes increases in response to direct CO2 radiative forcing (Figure 8b,e,h), leading to enhanced westerly wind with the poleward and eastward shift around 60° N in CCSM4 and CNRM, and at higher latitudes for HadGEM2 (Figure 9b,e,h). As for the responses to the SST pattern change, the meridional temperature gradient again does not show a consistent signal across the three models. The inter-model differences in projections for the changes in zonal wind are also large among models. It seems that both the influences of uniform SST warming and CO2 radiation scheme could induce the enhanced westerly wind at mid-high latitudes, which could be the primary reasons for the intensification of NAO in those two experiments, whereas the meridional temperature gradient and westerly wind changes are not consistent among the models in response to SST pattern change. This indicates that the response of the NAO to SST pattern change is still an open issue, and needs further research.

5. Summary and Discussions

Based on a set of pilot experiments for CFMIP-3, changes in the NAO as well as the possible connected responses under various aspects of forcing and warming are investigated. The main results are summarized as follows.
The influences of uniform SST warming and the direct CO2 radiative effect are likely to enhance winter NAO variability, except for an inconsistent result in HadGEM2 for the uniform SST warming experiment. In contrast, projected future SST pattern changes in each model drive different responses in the regression pattern of SLP.
To determine the causes responsible for the changes of NAO, we diagnosed the mean changes of zonal wind and air temperature in the different experiments. The results show that in response to uniform SST warming and the direct CO2 radiative effect, the zonal wind intensifies at mid-high latitudes and shifts poleward and eastward. However, in response to SST pattern change, the zonal wind changes are not consistent among models, which could be connected with the great difference in simulations of the NAO variability change. The increased meridional temperature gradient over the North Atlantic could strengthen the westerly wind at mid-high latitudes, which leads to the change in baroclinicity and therefore the change in storm track activity that affects the eddy-driven jet and NAO [8]. However, the issue about the correlation between the changes of NAO variability and mean state, as well as the mechanisms behind them is complicated and needs further investigation based on more experiments. This could be investigated as our next step using daily data.
The most significant air temperature increase occurs at mid-low latitudes in uniform SST warming and CO2 radiation scheme experiments, both leading to the increased meridional temperature gradient at mid-high latitudes, which act to enhance the westerly wind at mid-high latitudes. In contrast, projected changes in SST patterns for each model drive very different responses in tropospheric temperature. These disparate temperature changes contribute to a large spread in zonal wind changes, leaving the understanding of the NAO variability change in response to SST pattern change to be an open issue.
The piSST experiments were designed to analyze regional changes in mean climate, and so caution should be taken when interpreting changes in variability in these experiments. Since these are a set of atmosphere-only experiments, a lack of ocean-atmosphere coupling process could lead to bias compared with coupled simulations. The piSST pilot experiments also do not represent any changes in SST variability that may occur in coupled models. The differences between NAO variability change in the coupled models and this set of atmosphere-only experiments are relatively large, particularly in HadGEM2 and CCSM4 (see Figure 10), which may indicate that the piSST experiments have not captured the coupled response of NAO variability change well. It is also possible that the NAO variability could be influenced by not only the external forcings, but also by the internal forcing (e.g., synoptic eddy forcing [28,29]), and we can see the relatively large inter-model difference in HadGEM2, which could probably be induced by the internal forcing. While the differences are not so remarkable in CCSM4 and CNRM, but with more consistent results compared with CGCM. However, the sea ice change may also play a role, since the sea ice was allowed to change in CNRM, which is different from HadGEM2 and CNRM, probably leading to the large discrepancy among models, and this discrepancy will be investigated in further research on the NAO variability change. The results shown in the current study can be interpreted as showing drivers of NAO variability change (and uncertainty in this change) in the absence of ocean-atmosphere coupling and SST variability change.

Acknowledgments

We acknowledge Christopher B. Skinnerfor producing and sharing the CCSM4 simulations, and Hervé Douville and Sophie Tyteca for producing and sharing the CNRM simulations. This work is jointly supported by National Key Research Program and Development of China (2017YFC1502302), China National Science Foundation Projects (41605116, 41705043, 41775066), National Basic Research (973) Program of China under Grant2010CB950404, and the UK-China Research & Innovation Partnership Fund through the Met Office Climate Science for Service Partnership (CSSP) China as part of the Newton Fund.

Author Contributions

Robin Chadwick conceived the experiments; Hong-Li Ren and Yu Huang analyzed the data and wrote this paper; Zhigang Cheng and Quanliang Chen provided the instructions to this article.

Conflicts of Interest

The authors declare no conflict of interest.

References

  1. Walker, G.T.; Bliss, E.W. World Weather V. Mem. R. Meteorol. Soc. 1932, 4, 53–84. [Google Scholar]
  2. Kwok, R. Recent changes in arctic ocean sea ice motion associated with the North Atlantic Oscillation. Geophys. Res. Lett. 2000, 27, 775–778. [Google Scholar] [CrossRef]
  3. Xu, T.; Shi, Z.; Wang, H.; An, Z. Nonstationary impact of the winter North Atlantic Oscillation and the response of mid-latitude Eurasian climate. Theor. Appl. Fract. Mec. 2016, 124, 1–14. [Google Scholar] [CrossRef]
  4. Kelley, C.; Ting, M.; Seager, R.; Kushnir, Y. The relative contributions of radiative forcing and internal climate variability to the late 20th century winter drying of the Mediterranean region. Clim. Dyn. 2012, 38, 2001–2015. [Google Scholar] [CrossRef]
  5. Wan, H.; Luo, D.H. The relationship between wintertime blocking in the north hemisphere and North Atlantic Oscillation. J. Trop. Meteorol. 2009, 25, 616–620. [Google Scholar]
  6. Beranová, R.; Kysely, J. Relationships between the North Atlantic Oscillation index and temperatures in Europe in global climate models. Stud. Geophys. Geod. 2013, 57, 138–153. [Google Scholar] [CrossRef]
  7. Zhou, B.T.; Cui, X. Interdecadal change of the linkage between the North Atlantic Oscillation and the tropical cyclone frequency over the western north pacific. Sci. China Ser. D Earth Sci. 2014, 57, 2148–2155. [Google Scholar] [CrossRef]
  8. Dong, B.; Sutton, R.T.; Woollings, T. Changes of interannual NAO variability in response to greenhouse gases forcing. Clim. Dyn. 2011, 37, 1621–1641. [Google Scholar] [CrossRef]
  9. Gong, D.; Zhou, T.; Wang, S. Advance in the studies on North Atlantic Oscillation (NAO). Adv. Earth Sci. 2001, 16, 413–420. [Google Scholar]
  10. Bo, Q.U.; Gabric, A.J.; Zhu, J.N.; Lin, D.R.; Qian, F.; Zhao, F.M. Correlation between sea surface temperature and wind speed in Greenland Sea and their relationships with NAO variability. Water Sci. Technol. 2012, 5, 304–315. [Google Scholar]
  11. Davini, P.; Cagnazzo, C. On the misinterpretation of the North Atlantic Oscillation in CMIP5 models. Clim. Dyn. 2014, 43, 1497–1511. [Google Scholar] [CrossRef]
  12. Wallace, J.M. North Atlantic Oscillation/Annular mode: Two paradigms one phenomenon. Q. J. R. Meteorol. Soc. 2000, 126, 791–805. [Google Scholar] [CrossRef]
  13. Cattiaux, J.; Cassou, C. Opposite CMIP3/CMIP5 trends in the wintertime Northern Annular Mode explained by combined local sea ice and remote tropical influences. Geophys. Res. Lett. 2013, 40, 3682–3687. [Google Scholar] [CrossRef]
  14. Cattiaux, J.; Douville, H.; Peings, Y. European temperatures in CMIP5: Origins of present-day biasesand future uncertainties. Clim. Dyn. 2013, 41, 2889–2907. [Google Scholar] [CrossRef]
  15. Jeong, J.H.; Lee, H.; Jin, H.Y.; Kwon, M.H.; Yeh, S.W.; Kug, J.S.; Lee, J.Y.; Lee, J.-Y.; Kim, B.-M.; Son, S.-W.; et al. The status and prospect of seasonal climate prediction of climate over Korea and East Asia: A review. Asia Pac. J. Atmos. Sci. 2017, 53, 149–173. [Google Scholar] [CrossRef]
  16. Webb, M.J.; Lock, A.P. Coupling between subtropical cloud feedback and the local hydrological cycle in a climate model. Clim. Dyn. 2013, 41, 1923–1939. [Google Scholar] [CrossRef]
  17. Martin, G.M.; Bellouin, N.; Collins, W.J.; Culverwell, I.D.; Halloran, P.R.; Hardiman, S.C.; Hinton, T.J.; Jones, C.D.; McLaren, A.J.; O’Connor, F.M.; et al. The HadGEM2 family of Met Office united model climate configurations. Geosci. Model Dev. 2011, 4, 723–757. [Google Scholar]
  18. Meehl, G.; Washington, W.; Arblaster, J.; Hu, A.; Teng, H.; Tebaldi, C.; Sanderson, B.N.; Lamarque, J.-F.; Conley, A.; Strand, W.G.; et al. Climate system response to external forcingsand climate change projections in CCSM4. J. Clim. 2012, 25, 3661–3683. [Google Scholar] [CrossRef]
  19. Voldoire, A.; Sanchez-Gomez, E.; Mlia, D.S.Y.; Decharme, B.; Cassou, C.; Sénési, S.; Valcke, S.; Beau, I.; Alias, A.; Chevallier, M.; et al. The CNRM-CM5.1 global climate model: Description and basic evaluation. Clim. Dyn. 2013, 40, 2091–2121. [Google Scholar] [CrossRef] [Green Version]
  20. Chadwick, R.; Douville, H.; Skinner, C.B. Timeslice experiments for understanding regional climate projections: Applications to the tropical hydrological cycle and European winter circulation. Clim. Dyn. 2017, 49, 3011–3029. [Google Scholar] [CrossRef]
  21. Webb, M.J.; Andrews, T.; Bodassalcedo, A.; Bony, S.; Bretherton, C.S.; Chadwick, R.; Chepfer, H.L.; Douville, H.; Good, P.; Kay, J.E.; et al. The cloud feedback model intercomparison project (CFMIP) contribution to CMIP6. Geosci. Model Dev. 2017, 10, 1–27. [Google Scholar] [CrossRef]
  22. Li, J.P.; Wang, J.X.L. A modified zonal index and its physical sense. Geophys. Res. Lett. 2003, 30, 34–35. [Google Scholar] [CrossRef]
  23. Woollings, T.; Franzke, C.; Hodson, D.L.R.; Dong, B.; Barnes, E.A.; Raible, C.C.; Pinto, J.G. Contrasting interannual and multidecadal NAO variability. Clim. Dyn. 2015, 45, 539–556. [Google Scholar] [CrossRef]
  24. Li, C.; Zhang, Q.Y.; Ji, L.; Peng, J.B. Interannual variations of the blocking high over the Ural Mountains and its association with the AO/NAO in boreal winter. Acta Meteorol. Sin. 2012, 26, 163–175. [Google Scholar] [CrossRef]
  25. Lu, J.; Greatbatch, R.J. The changing relationship between the NAO and northern hemisphere climate variability. Geophys. Res. Lett. 2002, 29, 52-1–52-4. [Google Scholar] [CrossRef]
  26. Caian, M.; Koenigk, T.; Döscher, R.; Devasthale, A. Erratum to: An interannual link between Arctic sea-ice cover and the North Atlantic Oscillation. Clim. Dyn. 2017. [Google Scholar] [CrossRef]
  27. Harvey, B.J.; Shaffrey, L.C.; Woollings, T.J. Equator-to-pole temperature differences and the extra-tropical storm track responses of the CMIP5 climate models. Clim. Dyn. 2014, 43, 1171–1182. [Google Scholar] [CrossRef]
  28. Ren, H.-L.; Jin, F.-F.; Kug, J.-S.; Zhao, J.-X.; Park, J. A kinematic mechanism for positive feedback between synoptic eddies and NAO. Geophy. Res. Lett. 2009, 36, L11709. [Google Scholar] [CrossRef]
  29. Ren, H.-L.; Jin, F.-F.; Gao, L. Anatomy of synoptic eddy–NAO interaction through eddy-structure decomposition. J. Atmos. Sci. 2012, 69, 2171–2191. [Google Scholar] [CrossRef]
Figure 1. Regression patterns of winter sea level pressure (SLP, hPa) onto the standardized NAO index (NAOI) for the piSST (a,e,i), uniform sea surface temperature (SST) Warming +4K (piSST4K) (b,f,j), 4 × CO2 (piSST4 × CO2) (c,g,k), and SST pattern change (piSSTFuture) (d,h,l) experiments. The regressed results at the 95% confidence level are stippled.
Atmosphere 09 00010 g001
Figure 2. Regression pattern of winter SLP (hPa) onto the standardized NAOI in 1948–2016 for NCEP/NCAR reanalysis. The regressed results at the 95% confidence level are stippled.
Atmosphere 09 00010 g002
Figure 3. Changes of winter SLP (hPa) patterns regressed onto the standardized NAOI for the uniform SST Warming +4K (a,d,g), 4 × CO2 (b,e,h), SST pattern change (c,f,i) experiments, and the ensemble mean for each experiment (j,k,l). The changes of regression at the 95% confidence level are stippled using F test.
Atmosphere 09 00010 g003
Figure 4. Regression patterns of winter SLP (hPa) onto the standardized NAOI for the periods 1948–1974 (a),1975–2004 (b), and the difference between b and a (c, b minus a). The regressed results at the 95% confidence level are stippled.
Atmosphere 09 00010 g004
Figure 5. Vertical structure of zonal wind change (m/s) over the North Atlantic region (40° W–30° E) between the periods 1975–2004 and 1948–1974. The zonal wind change at the 95% confidence level are stippled.
Atmosphere 09 00010 g005
Figure 6. The SLP changes (hPa) for the uniform SST Warming +4K (a,d,g), 4 × CO2 (b,e,h), SST pattern change (c,f,i) experiments, and the ensemble mean for each experiment (j,k,l). The SLP changes at the 95% confidence level are stippled.
Atmosphere 09 00010 g006
Figure 7. Vertical structure of air temperature changes (°C, shading) and westerly jet changes (m/s, contours), where the black solid lines are enhanced zonal wind and the black dashed lines are the weakened zonal wind for the forced experiments, and the purple solid lines are wind profiles for 12 m/s in the piSST experiment, over the Atlantic region (40° W–30° E) for the uniform SST Warming +4K (a,d,g), 4 × CO2 (b,e,h), and SST pattern change (c,f,i) experiments. The air temperature changes at the 95% confidence level are stippled.
Atmosphere 09 00010 g007
Figure 8. The 500 hPa meridional temperature gradient changes (°C/m, shading) for the uniform SST Warming +4K (a,d,g), 4 × CO2 (b,e,h), SST pattern change (c,f,i) experiments, and the ensemble mean for each experiment (j,k,l). The meridional temperature changes at the 95% confidence level are stippled.
Atmosphere 09 00010 g008
Figure 9. The 300 hPa zonal wind changes (m/s, shading), where the purple solid lines are westerly wind for 20 m/s in the piSST experiment, for the uniform SST Warming +4K (a,d,g), 4 × CO2 (b,e,h), SST pattern change (c,f,i) experiments, and the ensemble mean for each experiment (j,k,l). The zonal wind changes at the 95% confidence level are stippled.
Atmosphere 09 00010 g009
Figure 10. Changes of winter SLP (hPa) patterns regressed onto the standardized NAOI for the abrupt 4 × CO2 (ac) and atmosphere-only experiment (df) across three models.
Atmosphere 09 00010 g010
Table 1. Summary of models used in this study.
ModelInstituteResolution
HadGEM2-ES (Hadley Centre Global Environmental Model version 2 Earth System model)Met Office Hadley Centre1.25° × 1.875°
CCSM4 (Community Climate System Model version 4)National Center for Atmospheric Research1.875° × 1.25°
CNRM-CM5 (Centre National de Recherches Meteorologiques global Climate Model)Centre National de Recherches Meteorologiques/Centre Europeen de Recherche et Formation Avanceesen Calcul Scientifique1.4° × 1.4°
Table 2. Summary of experiments used in this study.
ExperimentSSTsCO2
piControlPre-industrialPre-industrial
piSSTForced with Years 101–130 of SSTs taken from piControlObservation from 1979–2008
piSST4KAs piSST, with uniform +4K anomalyAs piSST
piSST4 × CO2As piSSTThe CO2 is quadrupled compared with piSST, but only seen by the radiation scheme
piSSTFutureAs piSST, with patterned anomaly from abrupt4 × CO2-piControlAs piSST
piSSTTotAs piSSTFutureThe CO2 is quadrupled compared with piSST, and is seen by both the radiation scheme and the plant physiological effect

